Abstract
The significant motion response of semi-submersible floating offshore wind turbines in marine environments poses challenges for platform stability control and power generation efficiency. Traditional stabilization methods demonstrate limitations in response speed and control effectiveness under complex sea conditions. This paper develops a comprehensive 12-degree-of-freedom coupled dynamics model that integrates platform motion, tower flexibility, rotor dynamics, and gyroscopic stabilization systems. By incorporating the gyro-stabilization system, the stability control of the platform’s pitch and roll motions is significantly improved. The model employs the Kane method, which comprehensively considers the coupling effects between the wind turbine, platform, and gyro, providing a higher precision dynamic response simulation. Based on this model, an innovative PSO-optimized fuzzy control strategy is proposed, utilizing intelligent particle swarm optimization algorithms to adjust controller parameters for optimal performance under various environmental conditions. Simulation results demonstrate that the proposed active control strategy offers significant advantages, achieving up to 37.56% pitch angle RMS vibration suppression and 44.23% tower-top displacement RMS vibration suppression under still water conditions, with peak suppression rates of 21.45% and 27.77% respectively under normal sea conditions, while maintaining 39.04% and 24.58% peak suppression rates in extreme sea conditions. In random sea conditions, the peak suppression rates remain at 38.16% and 17.83% respectively. This study significantly improves platform stability and structural load characteristics through the modeling of the gyro-stabilization system and the use of PSO-optimized fuzzy control, providing a reliable technical solution for floating wind turbine applications in complex marine environments.
1 Introduction
In recent years, the offshore wind power industry has developed rapidly. According to the “2024 Global Offshore Wind Report” released by the Global Wind Energy Council (GWEC), the newly installed capacity of global offshore wind power reached 10.8 gigawatts in 2023, achieving an annual growth rate of 24% (Global Wind Energy Council (GWEC), 2024). As offshore wind power development advances from nearshore to deep-sea areas, floating offshore wind power provides a highly promising solution for developing and utilizing deep-sea wind energy resources. After years of development, by the end of 2022, the global total installed capacity of floating offshore wind power had reached 245.4 megawatts (Cao et al., 2023). As offshore wind power expands into deeper and more distant marine areas, floating wind power has become an important option for developing deep-sea wind energy resources due to its flexible deployment advantages. However, floating wind power systems face significant motion response issues in the marine environment, particularly as the swaying motion of the platform not only affects power generation efficiency but may also lead to structural fatigue damage, making research on motion reduction technology for floating wind turbine platforms particularly significant (Bai et al., 2025).
Currently, motion reduction control for floating wind turbines mainly employs technologies such as variable pitch control, tuned mass dampers (TMD), ballast water regulation systems, and mooring systems. Namik and colleagues designed independent blade pitch controllers and anti-disturbance control systems, effectively reducing the adverse effects of wind and waves on FOWT performance (Namik and Stol, 2011). Junbo Liu et al. regulated platform motion by controlling torque in a floating offshore wind turbine model with coupled dynamics (Liu et al., 2025). Regarding TMD applications, research by Lakner and Rotea indicates that unoptimized TMDs only achieve suppression rates of around 10% for vibration displacement and loads (Lackner and Rotea, 2011). Wang et al. significantly optimized the attitude control of the barge-type wind turbine using MTMD (Wang et al., 2022). Additionally, active ballast water regulation systems achieve stability control by adjusting the platform’s center of gravity in real-time, but these systems suffer from a 30–45 second lag in response, making it difficult to promptly address rapidly changing sea conditions (Yu et al., 2023). Passive mooring systems, while able to suppress low-frequency motion through nonlinear spring characteristics, have limited effectiveness when dealing with disturbances in the wave frequency range (0.1-1.25Hz) (Lee and Ong, 2025). Overall, these traditional motion reduction methods still face issues such as slow response times and limited control effectiveness when dealing with complex sea conditions.
Gyroscopic stabilizers, as mature roll reduction devices for ships, have achieved remarkable results in the field of ocean engineering. Research shows that vessels equipped with Halcyon twin-flywheel gyroscopic stabilizers can reduce rolling amplitude by 82% (Perez et al., 2009); similarly, the Anti-Rolling Gyro (ARG) applied by Mitsubishi on yachts has achieved a 70% reduction in rolling amplitude (Takeuchi et al., 2011). This significant roll reduction effect has inspired research on applying gyroscopic stabilization technology to floating wind turbines. Experimental research by Palraj and Rajamanickam on barge-type floating wind turbines has achieved breakthrough progress: under static turbine conditions, gyroscopic stabilizers can achieve up to 60% reduction in rolling amplitude, while maintaining a 54% roll reduction effect under irregular wave conditions (Palraj and Rajamanickam, 2020). Their follow-up research further verified the effectiveness of this technology under dynamic conditions, showing that even with the turbine in operation (rotor speeds ranging from 60rpm to 114rpm), gyroscopic stabilizers could still achieve 57%-67% reduction in rolling amplitude and 39%-54% reduction in pitching amplitude (Palraj, 2021). These experimental results strongly demonstrate the application potential of gyroscopic stabilization technology for floating wind turbines. However, advancing this technology toward engineering applications still faces significant challenges: due to the rotational effects of the wind turbine rotor, nonlinear characteristics of aerodynamic loads, and the coupling effects between the platform and gyroscope, the system exhibits highly complex dynamic behavior. This makes establishing an accurate coupled dynamic model of the turbine-platform-gyroscope system a key research challenge, as only by accurately describing the dynamic response characteristics of the system under wind and wave loads can a reliable theoretical foundation be provided for designing gyroscopic stabilization control strategies.
Research on gyroscopic stabilization control has evolved from traditional PID control strategies to more sophisticated control methods. Perez and Steinmann proposed a state feedback-based gyroscopic control method (Perez et al., 2009), but this approach has limitations when dealing with nonlinear and time-varying characteristics. Recently, Hu et al. proposed a real-time control strategy based on Model Predictive Control (MPC) that significantly improved ship roll reduction by considering wave memory effects and introducing dual gyroscopic stabilizers (Hu et al., 2023). They further developed the MPC control strategy, simultaneously optimizing ship motion, safety, and energy consumption, achieving better control performance under various sea conditions (Hu et al., 2024). Li et al. developed an adaptive controller based on variable gain control strategies for port rescue tugboats, verifying the effectiveness of this control strategy under irregular wave conditions by innovatively establishing a comprehensive hydrodynamic model of the gyroscope-ship-wave system (Li et al., 2022). However, when these control methods are applied to floating wind turbines, they face greater challenges: first, wind turbine systems exhibit stronger nonlinear characteristics than ships, especially when considering wind turbine rotor dynamics, aerodynamic loads, and gyroscopic coupling effects; second, traditional control strategies struggle to adapt to the changing dynamic characteristics of wind turbine systems under different operating conditions, and the tuning of control parameters lacks systematic methodology; finally, even advanced MPC control strategies may face issues with model accuracy and real-time performance when handling strongly nonlinear coupled systems. These limitations prompt us to consider more suitable intelligent control methods for handling nonlinear systems.
For the complex nonlinear characteristics of floating wind turbine-gyroscope coupled systems, fuzzy control has emerged as a potential solution due to its advantages of not relying on precise mathematical models and having strong robustness. Zhang et al. applied an adaptive fuzzy controller in dual-gyroscope balance control, effectively improving system performance by using adaptive control to enhance disturbance resistance while utilizing fuzzy control for decoupling (Zhang et al., 2022). However, traditional fuzzy control still faces several challenges in practical applications: first, the formulation of fuzzy rules often relies on expert experience, making it difficult to guarantee optimal control effects in complex and variable sea conditions; second, the membership function parameters of fuzzy control are usually determined by trial and error, lacking systematic optimization methods; finally, when dealing with strongly coupled nonlinear systems, it is difficult to adapt to dynamic changes in system parameters by relying solely on fixed fuzzy rule bases. These limitations make traditional fuzzy control less than ideal for roll reduction control of floating wind turbines in complex marine environments. Therefore, it is necessary to introduce intelligent optimization algorithms to optimize the parameters of the fuzzy controller and improve its control performance under complex working conditions.
Based on the above analysis, this paper proposes a novel modeling and control method based on gyroscope-wind turbine coupling. In terms of modeling, a 12-degree-of-freedom fully coupled dynamic model including platform six-degree-of-freedom motion, tower flexible deformation, and roll-reducing gyroscope was constructed using the Kane method, which also has excellent control performance compared to the traditional OpenFAST model. For control, a PSO-optimized fuzzy control strategy was designed, achieving precise system control in complex sea conditions through online condition recognition and parameter adaptive adjustment.
The main contributions of this paper include:
First establishment of a complete gyroscope-wind turbine coupled dynamic model, achieving dynamic transfer of control torque through generalized coordinate coupling, with model prediction accuracy verified by comparison with OpenFAST software;
Proposal of a novel PSO-fuzzy control framework that achieves platform roll reduction control by optimizing controller parameters, with up to 47.66% RMS vibration suppression rate under still water conditions;
Development of an online parameter optimization method based on condition recognition, which achieves dynamic adjustment of control parameters through real-time environmental parameter measurement and feature extraction, significantly enhancing system adaptability in complex sea conditions.
This paper consists of five chapters: Chapter One elaborates on the research background and significance, reviews the current status of roll reduction control for floating wind turbines, and points out the limitations of existing research. Chapter Two establishes a complete gyroscope-wind turbine coupled dynamic model, including system coordinate definition, kinematic analysis, load modeling, etc., and verifies the model accuracy through comparison with OpenFAST software. Chapter Three designs a PSO-optimized fuzzy control system, including controller structure design, PSO parameter optimization methods, and online condition recognition strategies. Chapter Four systematically evaluates the performance of the proposed control scheme through simulation experiments of four typical working conditions. Chapter Five summarizes the work of the entire paper and provides an outlook on future research directions.
2 Gyroscopic wind turbine full coupling dynamic model
2.1 Gyroscopic anti-rolling system
The gyroscopic anti-rolling system is a motion stabilizing device based on the principle of conservation of angular momentum, which has achieved remarkable results in the field of ships. In recent years, it has gradually been applied to floating offshore wind turbine platforms. This section introduces the basic structure, working principle and parameter design of the gyroscopic anti-rolling system.
The typical gyroscopic anti-shudder system mainly consists of the following components:
-
Flywheel assembly: Comprising a high-speed rotating gyro flywheel and its driving motor, it is the core component for generating angular momentum. The flywheel is usually made of high-strength steel or composite materials to achieve a balance between high rotational inertia and light weight.
-
Precession support: The intermediate mechanism connecting the flywheel and the platform, allowing the flywheel to rotate controllably around the precession axis perpendicular to its own rotation axis.
-
Braking and control mechanism: Including hydraulic or electric brakes for controlling the precession motion, precession angle sensors, and control systems. In active gyro systems, this part also includes servo motors for actively generating control torques.
-
Support base: The foundation structure fixed on the platform, providing a stable installation base and transmitting torques.
The gyroscope damping system can be classified into two types based on the control method: passive and active. The precession axis of the passive gyroscope damping system is only equipped with damping devices (such as hydraulic dampers), and no additional energy input is required. When the platform sways, the gyroscope spontaneously generates precession motion, and the swaying energy is consumed by the damping devices. The passive system has a simple structure and high reliability, but its control effect is limited and cannot be adjusted. The active gyroscope damping system is equipped with servo motors on the precession axis, and can actively generate control torques. Based on the motion state of the platform, the control system calculates and outputs the optimal control torque in real time, significantly improving the damping effect and adaptability.
This study adopts an active gyroscopic anti-roll system with a dual-axis linkage and gyroscopic anti-roll arrangement. It combines the reliability of passive anti-roll with the efficiency of active control. Through the PSO-optimized fuzzy control strategy, the optimal anti-roll effect is achieved, effectively controlling the longitudinal and lateral roll of the platform. At the same time, factors such as system energy consumption and lifespan are also considered.
This study adopts the common circular ring thin-disc type gyro design. The material uses the most commonly used high-strength steel alloy, with a density of 7850 . The outer diameter of the gyroscope is 4m, the inner diameter is 3m, and the thickness is 1.6m. Under these conditions, the weight of a single gyroscope is approximately 69t. Based on this, for the moment of inertia of the ring-shaped disc rotating around its active axis, the applicable formula is Equation 1:
Here, represents the mass of the circular disc, is the outer radius, and is the inner radius.
Substitute the known values and obtain . This is a very large value, which also explains why this large-scale gyroscope device can provide a significant stabilizing effect in the offshore wind turbine stability system. A gyroscope with such a large moment of inertia, once rotating at high speed, can provide extremely strong angular momentum, effectively resisting external disturbing torques.
For the rotational inertia of the flywheel’s oscillation axis, it is generally in a 1:2 ratio to the main axis. This is to set the rotational inertia of the oscillation axis .
After comprehensively considering the decoupling effect, energy consumption, structural strength and other factors, the rotational speed of the flywheel should be designed within a reasonable range. Here, the rotational speed of the flywheel is set at 1000 rpm. This can provide a relatively stable control effect while ensuring the safety and reliability of the system.
For this gyroscope system, its static radial load , Gyroscope torque . Here, represents the rotational speed of the gyroscope. is platform maximum angular velocity, which is 0.1 rad/s based on the 10-second wave cycle. The bearing spacing is approximately 2 meters, then dynamic axial load .
Regarding centrifugal force is Equation 2:
is maximum precession angular velocity, assume it to be 0.05 rad/s, represents the radius of rotation.
Radial total load formula is Equation 3:
Equivalent dynamic load is Equation 4:
Substituting the values, we can obtain that the equivalent dynamic load .
In actual engineering applications, the value can be selected as 1.5 times the equivalent load.
The power consumption of the control system mainly consists of the frictional torque of the bearings, air resistance, the precession control system, and the electrical system. The calculation process is omitted. It is concluded that the total power consumption of the dual-gyro anti-shudder system is approximately 304 kW, accounting for about 6% of the wind turbine’s power, which is a relatively reasonable figure.
For semi-submersible floating wind turbine platforms, multiple gyroscopic decoupling devices are usually installed at the corner points or the center of gravity of the platform to achieve comprehensive control of the platform’s roll and pitch motions.
When the floating platform is subjected to wave action and undergoes oscillation, the gyroscopic device will undergo precession motion within its internal frame. According to the law of conservation of angular momentum, the precession torque generated by the gyroscopic device is opposite to the oscillation direction of the platform, thereby applying an opposing torque to the platform and suppressing the oscillation motion. Through the cooperation of two counter-rotating gyroscopes, comprehensive control of the platform’s oscillation motion can be achieved.
The total angular velocity of the gyroscope rotor consists of two parts: the motion of the platform and the motion of the gyroscope itself, as shown in Equations 5, 6:
Here: , Here, represents the precession angular velocity, and represents the gyroscope’s rotational speed.
The Kane method is adopted to model the gyroscope. The generalized inertia force of the gyroscope is expressed as Equation 7:
Where is the angular velocity component of the gyroscope’s r-th degree of freedom, is the rotational inertia matrix of the gyroscope, α is the angular acceleration vector, and is the angular velocity vector of the platform coordinate system.
The passive constraint moments acting on the gyroscope include the spring moment (Equation 8):
Where is the spring moment coefficient, is the precession angular displacement of the gyroscope, and is the transformation matrix from the platform coordinate system to the inertial coordinate system.
The damping moment is expressed as Equation 9:
Where is the damping moment coefficient, and is the precession angular velocity of the gyroscope.
The active control moment of the gyroscope is expressed as Equation 10:
Where is the moment output by the controller.
The generalized active force of the gyroscope on the r-th degree of freedom expressed in the inertial system is Equation 11:
Where is the angular velocity component of the platform on the r-th degree of freedom.
Through the above modeling method, this invention established complete gyroscopic dynamic equations, including the gyroscope’s inertial characteristics, constraint properties, and control inputs, laying a theoretical foundation for subsequent control system design.
2.2 System modeling
Addressing the motion stability issues of semi-submersible floating wind turbines under wind-wave coupling effects, this paper proposes a full coupling dynamic modeling method that incorporates anti-rolling gyroscopes. By establishing a 12-degree-of-freedom model that includes the platform’s six-degree-of-freedom motion, tower flexible deformation, and anti-rolling gyroscopes, the simulation accuracy of pitch motion has been significantly improved. Compared to the traditional OpenFAST model, the gyroscopic subsystem modeling process has been added, and dynamic transfer of control torque has been achieved through generalized coordinate coupling.
During the modeling process, reference was made to the 5MW floating wind turbine model with OC4-DeepCwind semi-submersible platform developed by the National Renewable Energy Laboratory (NREL) of the United States. This model has been widely used to study the dynamic behavior of floating wind turbines, but it mainly focuses on the coupling between platform motion and wind turbine dynamics. This paper makes innovative improvements on this basis: by introducing an anti-rolling gyroscopic system, the model’s stability control capability for platform roll and pitch has been enhanced; meanwhile, the model structure has been optimized to accommodate efficient application of control algorithms. Table 1 shows the main parameters of the NREL 5MW floating wind turbine.
Table 1
| Parameter | Value |
|---|---|
| Power (MW) | 5 |
| Number of Blades | 3 |
| Rotor Diameter (m) | 126 |
| Hub Diameter (m) | 3 |
| Hub Height (m) | 90 |
| Total Nacelle Mass (kg) | 240000 |
| Tower Mass (kg) | 249718 |
| Platform Mass (kg) | 13473000 |
| Nacelle Dimensions (m) | 22×6×6 |
| Platform Dimensions (m) | 40×40×10 |
| Platform Submersion Depth (m) | 4 |
Main parameters of NREL 5MW floating wind turbine.
The semi-submersible wind turbine system consists of a platform, tower, nacelle, rotor, and anti-rolling gyroscope (Figure 1). The platform employs a six-degree-of-freedom rigid body model, with the gyroscopic system located at the platform’s center of gravity, generating anti-rolling moments through a dual-axis servo mechanism. To characterize the multi-body coupling effects, the following core coordinate systems are established: the inertial coordinate system F0(O0-X0Y0Z0), platform coordinate system F1(O1-X1Y1Z1), tower-top coordinate system F2(O2-X2Y2Z2), and rotor coordinate system F3(O3-X3Y3Z3). This coordinate system fully describes the relative motion relationships between various components of the wind turbine, laying the foundation for subsequent dynamic modeling. Vector rotational transformations between different coordinate systems are implemented through rotation matrices, using Euler angle descriptions.
Figure 1
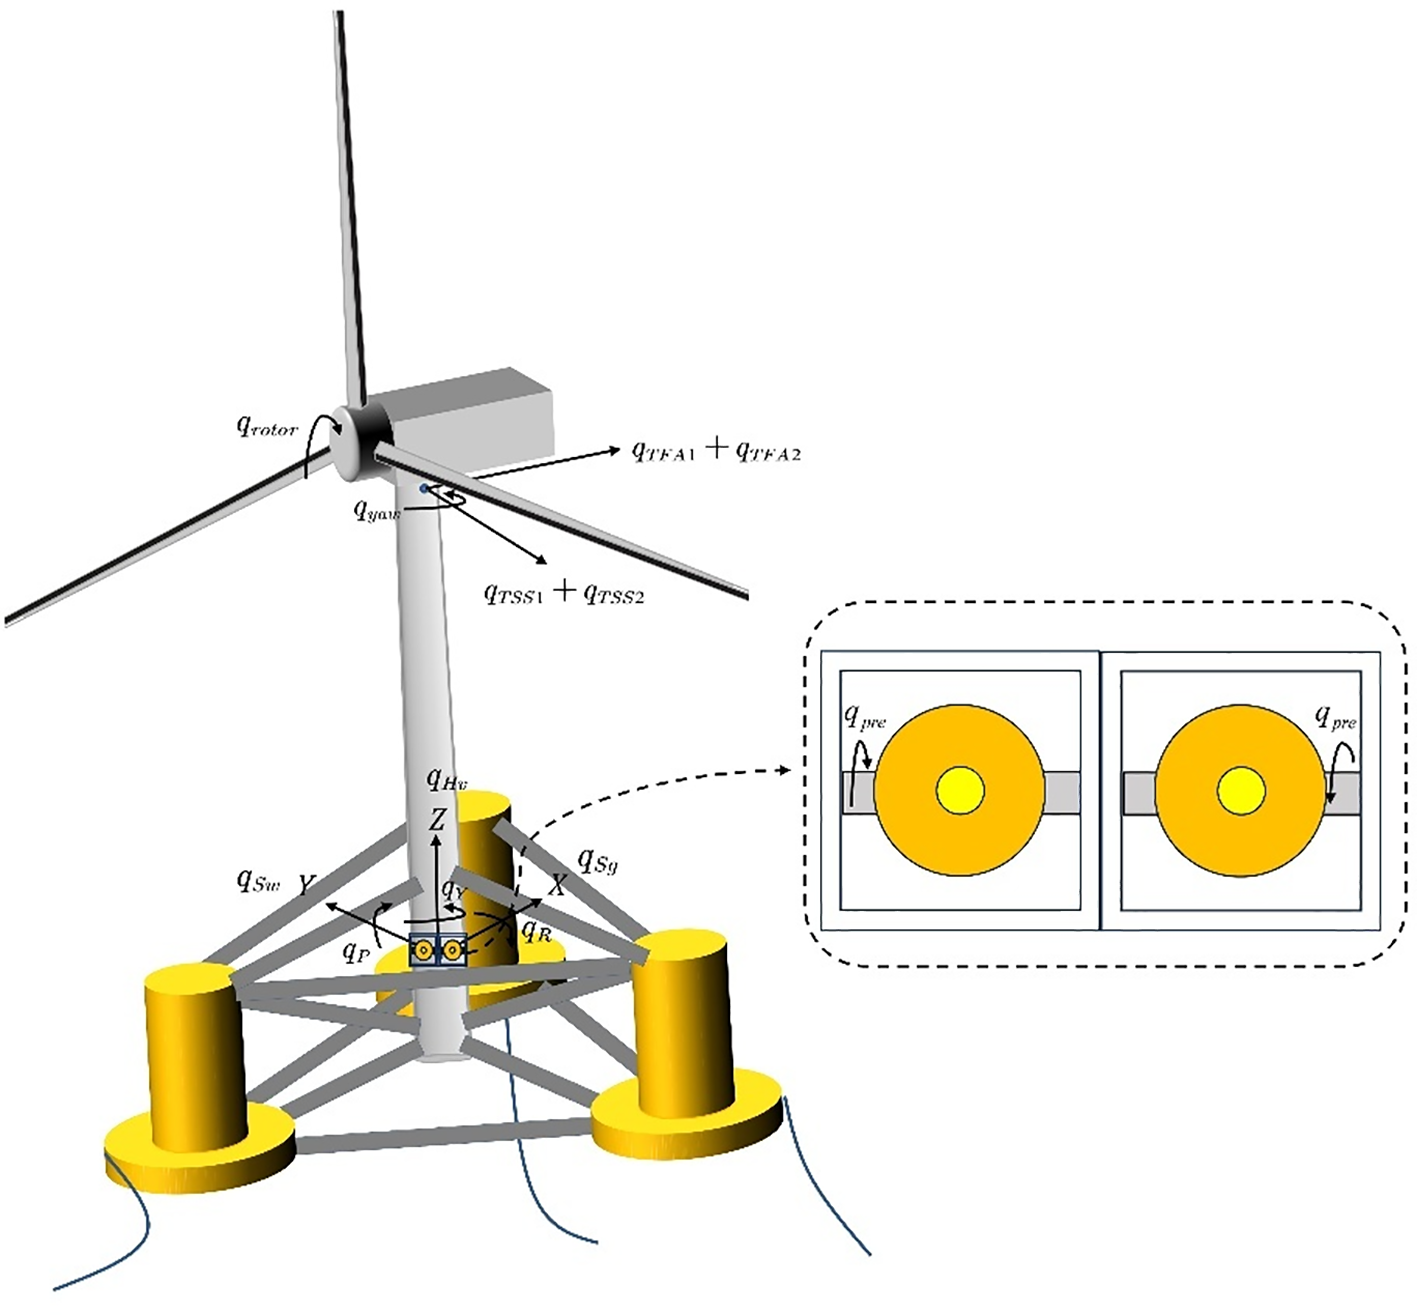
Schematic diagram of a 5MW floating wind turbine.
This study builds a fully coupled dynamic model of the floating wind turbine system based on Kane’s method, incorporating 12 degrees of freedom (as shown in Figure 1): three translational degrees of freedom for the platform (surge, sway, and heave) and three rotational degrees of freedom (roll, pitch, and yaw), four degrees of freedom for the first and second bending modes of the tower in the fore-aft and side-to-side directions, one rotational degree of freedom for the wind turbine rotor around the hub axis, and one precessional degree of freedom for the anti-rolling gyroscope relative to the platform.
This model achieves a comprehensive description of the fully coupled effects between platform motion, tower deformation, rotor rotation, and gyroscopic movement through the selection of generalized coordinates and the establishment of constraint equations.
The equations of motion for this model are derived using Kane dynamics. As a direct result of Newton’s laws of motion, the Kane equations for a simple complete system can be expressed as a Equation 12.
For this model, the generalized active force and the generalized inertia force can be expressed as Equation 13:
Where represents the active force, represents the active moment at point , represents the first-order derivative of the rigid body’s angular momentum at the center of mass, , , and represent angular velocity, acceleration, and linear velocity, respectively.
Based on the established equations of motion, the complete nonlinear equations of motion for the coupled wind turbine system can be introduced as shown in Equation 14.
is the mass matrix, which depends on the system’s degrees of freedom , control input , and time . is the second-order derivative of the corresponding degree of freedom, and is the function of the corresponding force.
This study considered three main types of external loads acting on the floating wind turbine system: wind loads, hydrostatic forces, and hydrodynamic forces. The wind loads mainly include the axial thrust and aerodynamic moments acting on the rotor, which are expressed as Equation 15:
Where the thrust coefficient and moment coefficient are obtained through fitting experimental data. The hydrostatic forces mainly consider the linear restoring forces and moments caused by platform motion, expressed as Equation 16:
The calculation of hydrodynamic forces is based on Airy wave theory, using the Morison method to estimate the viscous effects and added mass effects of waves on the platform, expressed as Equation 17:
Where represents the drag coefficient, represents seawater, represents the diameter of the platform column, represents the added mass coefficient, represents the relative velocity of waves to the column, and represents the norm of .
By superimposing the generalized active forces and generalized inertia forces of the platform, tower, nacelle, stabilizing gyroscope, and rotor, we obtain the generalized active forces and generalized inertia forces of the entire system, and solve the equations to determine the motion state of the wind turbine, as shown in Equation 18.
2.3 Model validation
To validate the consistency between the 11-degree-of-freedom catenary wind turbine model (without tuned mass dampers) and the simulation results from OpenFAST software, this study designed two typical conditions for comparison with OpenFAST software: free decay experiments under still water with no wind conditions (Condition 1) and dynamic response analysis under coupled wind-wave effects (Condition 2). The specific condition parameters are shown in Table 2.
Table 2
| Condition | Wave | Wind |
|---|---|---|
| Condition1 | Still Water | No Wind |
| Condition2 | Airy Wave, Wave Height 5m, Period 10s | Steady Wind 13m/s |
Wind and wave conditions in different operating conditions.
During the model validation process, AeroDyn v15 was used to calculate aerodynamic loads, and the map++ program was used to calculate mooring line tensions. To comprehensively evaluate model performance, initial disturbances were applied separately to surge, pitch, and tower-top fore-aft displacement in Condition 1 to observe the system’s free decay characteristics; in Condition 2, the wind direction was set consistent with the wave direction to examine the system’s dynamic response under coupled environmental loads.
Firstly, a free decay experiment was conducted under conditions of still water and no wind. The longitudinal sway, longitudinal heave and tower top front-back displacement of the wind turbine were assigned initial values, while the initial values of the other degrees of freedom were all zero. The free decay responses of the system were observed, and the results are shown in Figures 2–4 respectively.
Figure 2
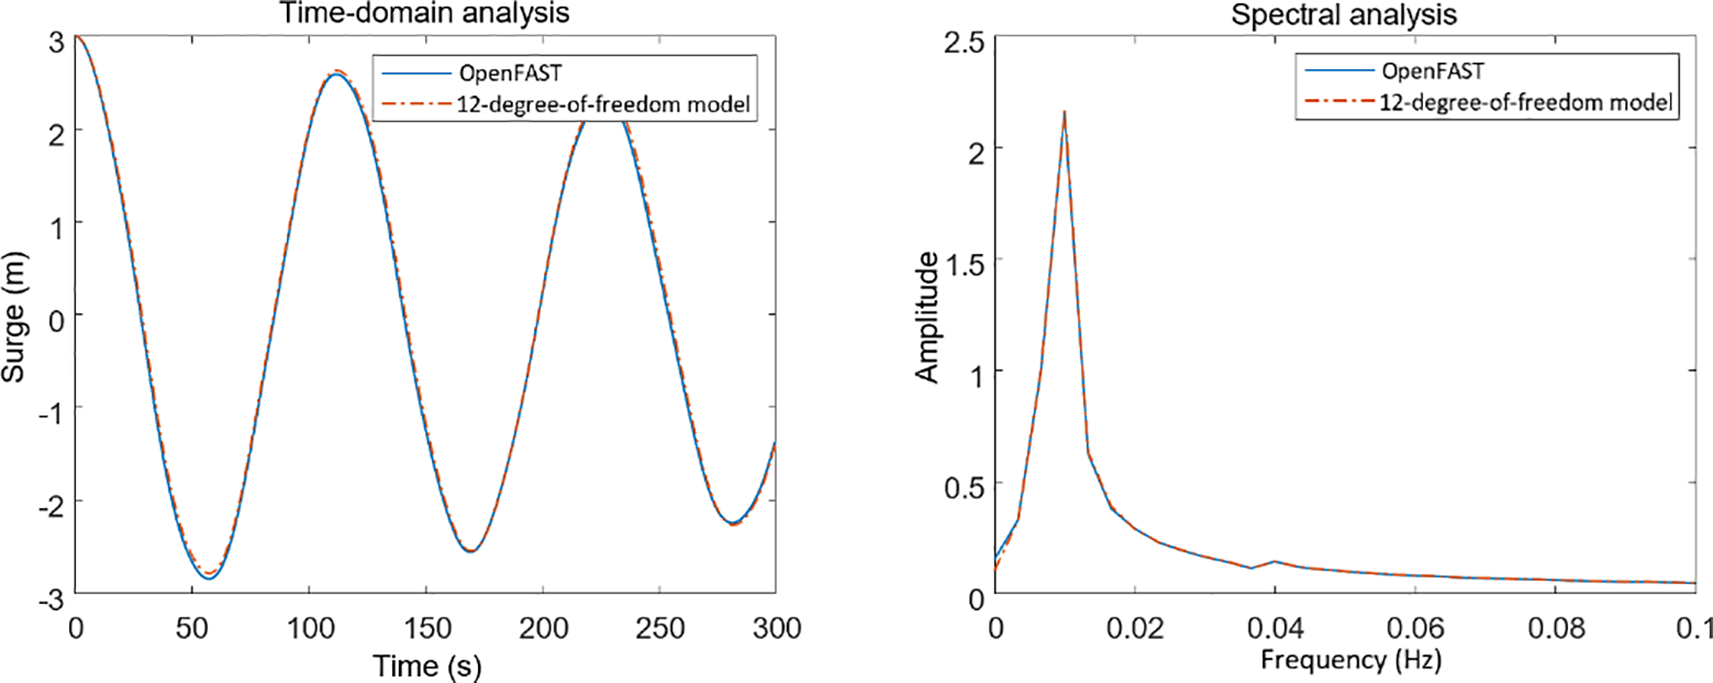
Comparison of surge free decay response of 12-degree-of-freedom model with OpenFAST.
Figure 3
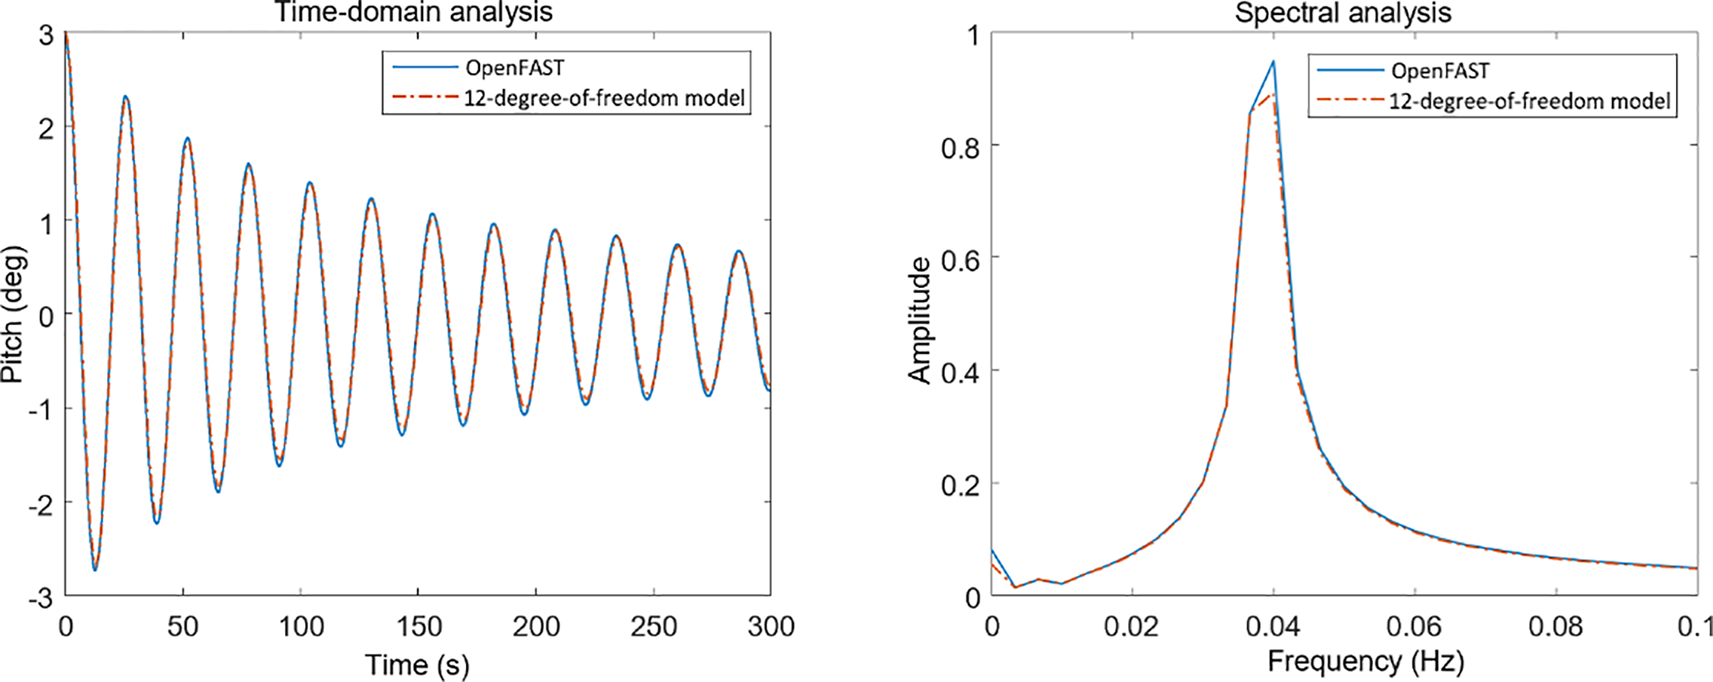
Comparison of pitch free decay response of 12-degree-of-freedom model with OpenFAST.
Figure 4
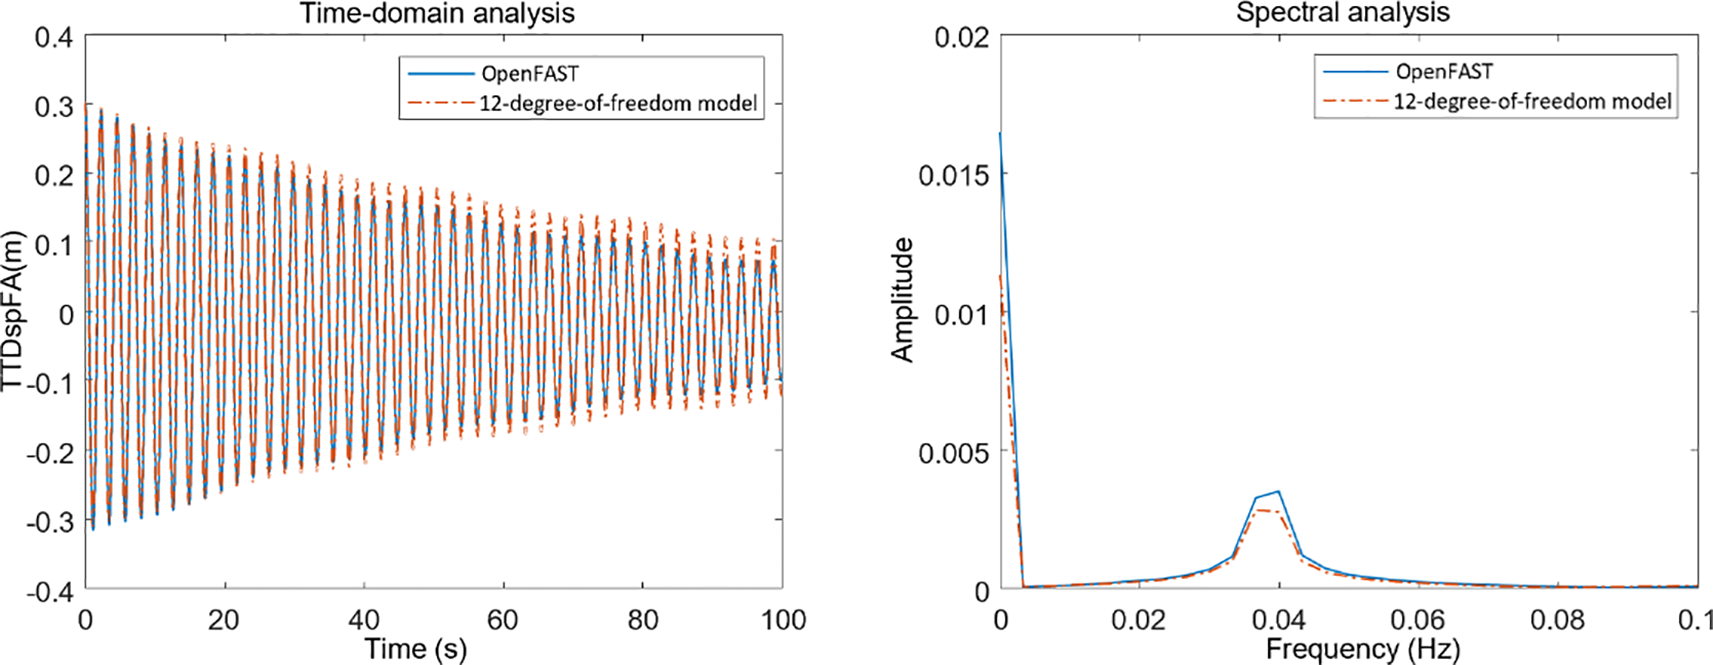
Comparison of TTDspFA free decay response of 12-degree-of-freedom model with OpenFAST.
As shown in the figure above, the model in this paper demonstrates good consistency with OpenFAST calculation results in surge and pitch directions. For tower-top fore-aft displacement, although there are slight differences in amplitude, the overall dynamic characteristics remain consistent. Specific data comparisons are shown in Table 3.
Table 3
| Degree of Freedom | FAST | Self-developed Model | Error |
|---|---|---|---|
| Surge | 1.8403 m | 1.8460 m | 0.31% |
| Pitch | 1.6969° | 1.6480° | 2.88% |
| Tower-top Fore-aft | 0.2159 m | 0.2310 m | 6.99% |
Root mean square values of system response for the established model and OpenFAST model under condition 1.
Second, comparative validation was conducted under combined wind and wave conditions. According to observations from Figures 5–7, under Condition 2 with a wave frequency of 0.1 Hz, the established wind turbine model shows high consistency with the OpenFAST model in natural frequency calculations, indicating high accuracy in frequency analysis. For time-domain analysis, the platform exhibits significant fluctuations in motion response for surge, heave, pitch, yaw, and tower-top fore-aft displacement degrees of freedom. These fluctuations mainly result from external excitation of wind and waves. However, as time progresses, the external loads on the wind turbine gradually approach dynamic equilibrium, causing the platform’s motion response and tower-top fore-aft displacement response to eventually stabilize in a periodic oscillation state. Specific data comparisons are shown in Table 4.
Figure 5
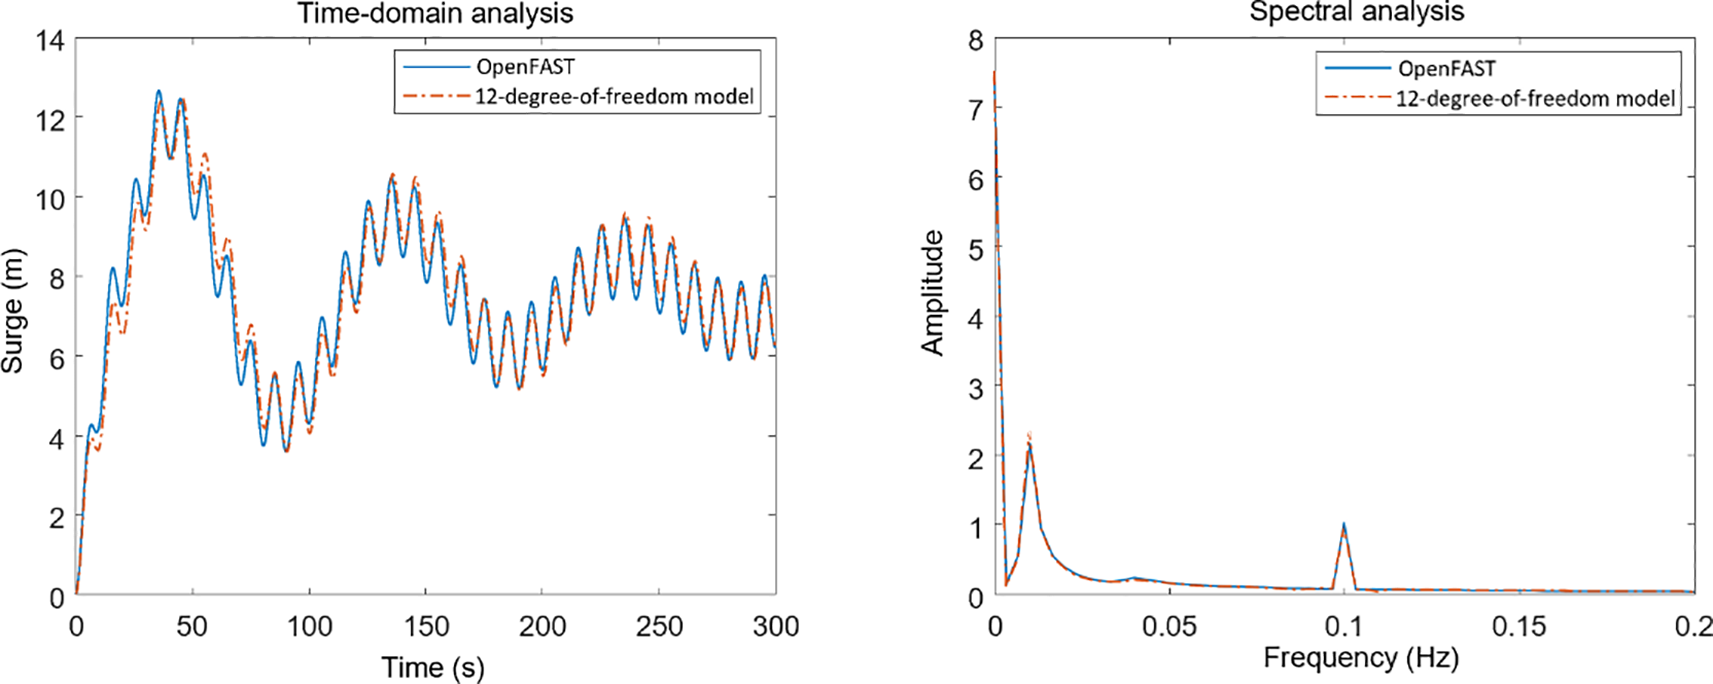
Comparison of surge response of OpenFAST and 12 degrees of freedom models under LC 2.
Figure 6
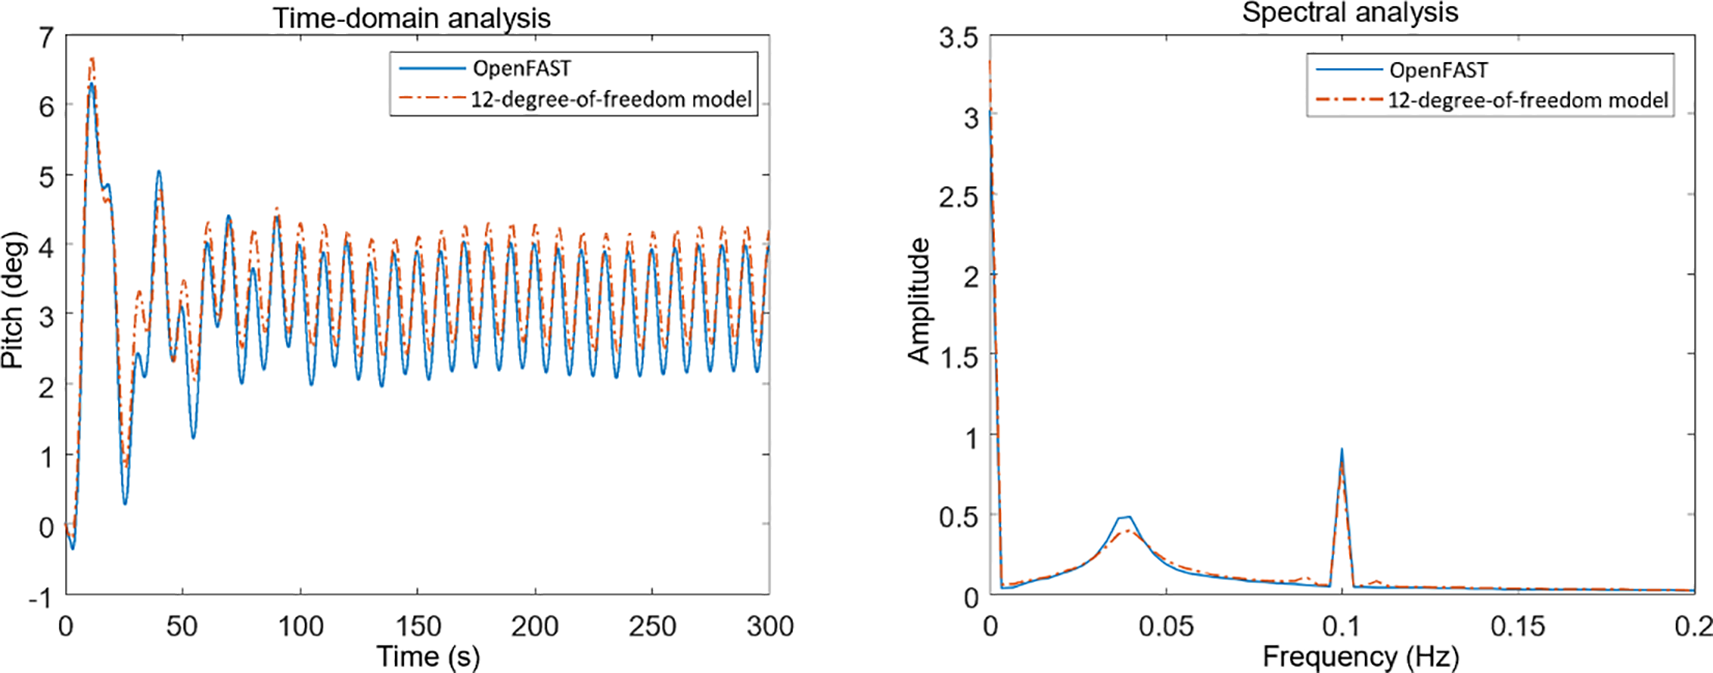
Comparison of pitch response of OpenFAST and 12 degrees of freedom models under LC 2.
Figure 7
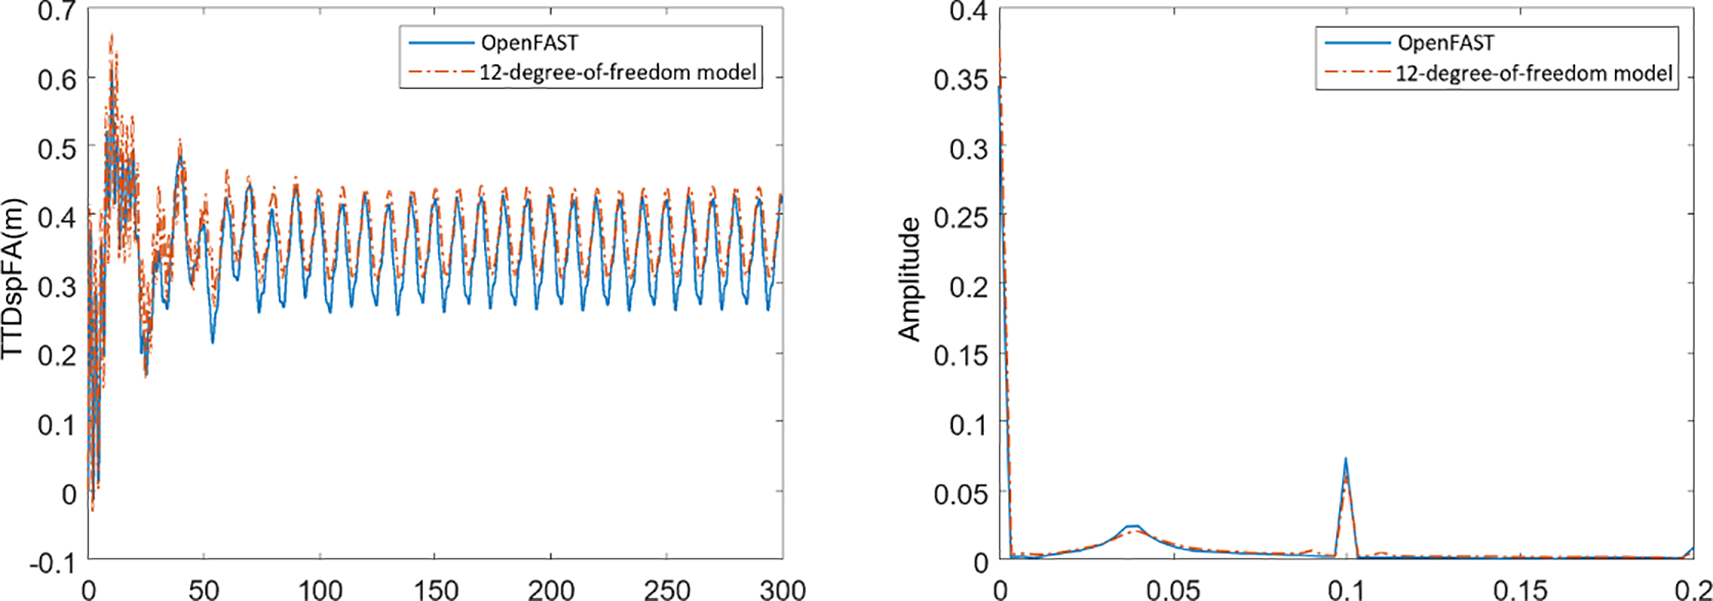
Comparison of TTDspFA response of OpenFAST and 12 degrees of freedom models under LC 2.
Table 4
| Degree of Freedom | FAST | Self-developed model | Error |
|---|---|---|---|
| Surge | 7.7404 m | 7.7810 m | 0.52% |
| Pitch | 3.1772° | 3.4550° | 8.74% |
| Tower-top Fore-aft | 0.3496 m | 0.3761 m | 7.58% |
Root mean square values of system response for the established model and OpenFAST model under condition 2 during 300s simulation time.
In summary, the simulation results of the established 12-degree-of-freedom wind turbine model under still water with no wind conditions and combined wind-wave conditions show high consistency with the calculation results of OpenFAST software, with all error indicators controlled within 10%. This demonstrates that the model established in this paper has good accuracy and can be used for subsequent control strategy research.
Through comparative validation of these two typical conditions, it is fully demonstrated that the wind turbine dynamics model established in this paper can accurately simulate the dynamic response characteristics of wind turbines under different environmental conditions, laying a reliable theoretical foundation for subsequent research.
3 Fuzzy controller with particle swarm optimization
During operation at sea, floating wind turbines are subjected to complex wind and wave loads, and the large-amplitude motions of the platform not only affect power generation efficiency but may also lead to structural fatigue damage. To effectively suppress platform oscillations, particularly pitch motion, this chapter proposes a fuzzy control strategy based on Particle Swarm Optimization (PSO), achieving precise control of platform motion by optimizing the control parameters of the anti-rolling gyroscope system.
Compared to traditional control methods, fuzzy control offers advantages such as independence from precise mathematical models, intuitive control rules, and strong robustness. However, the performance of traditional fuzzy controllers largely depends on expert experience and parameter tuning. To overcome this limitation, this chapter introduces the PSO algorithm to optimize the fuzzy controller, enhancing the platform oscillation suppression performance.
This system adopts a collaborative framework of fuzzy controller and Particle Swarm Optimization (PSO), with an overall architecture consisting of two phases: offline optimization and online control. The offline phase completes fuzzy controller design and PSO parameter optimization, while the online phase implements condition recognition, control execution, and dynamic adjustment. The overall framework of the system is shown in Figure 8.
Figure 8
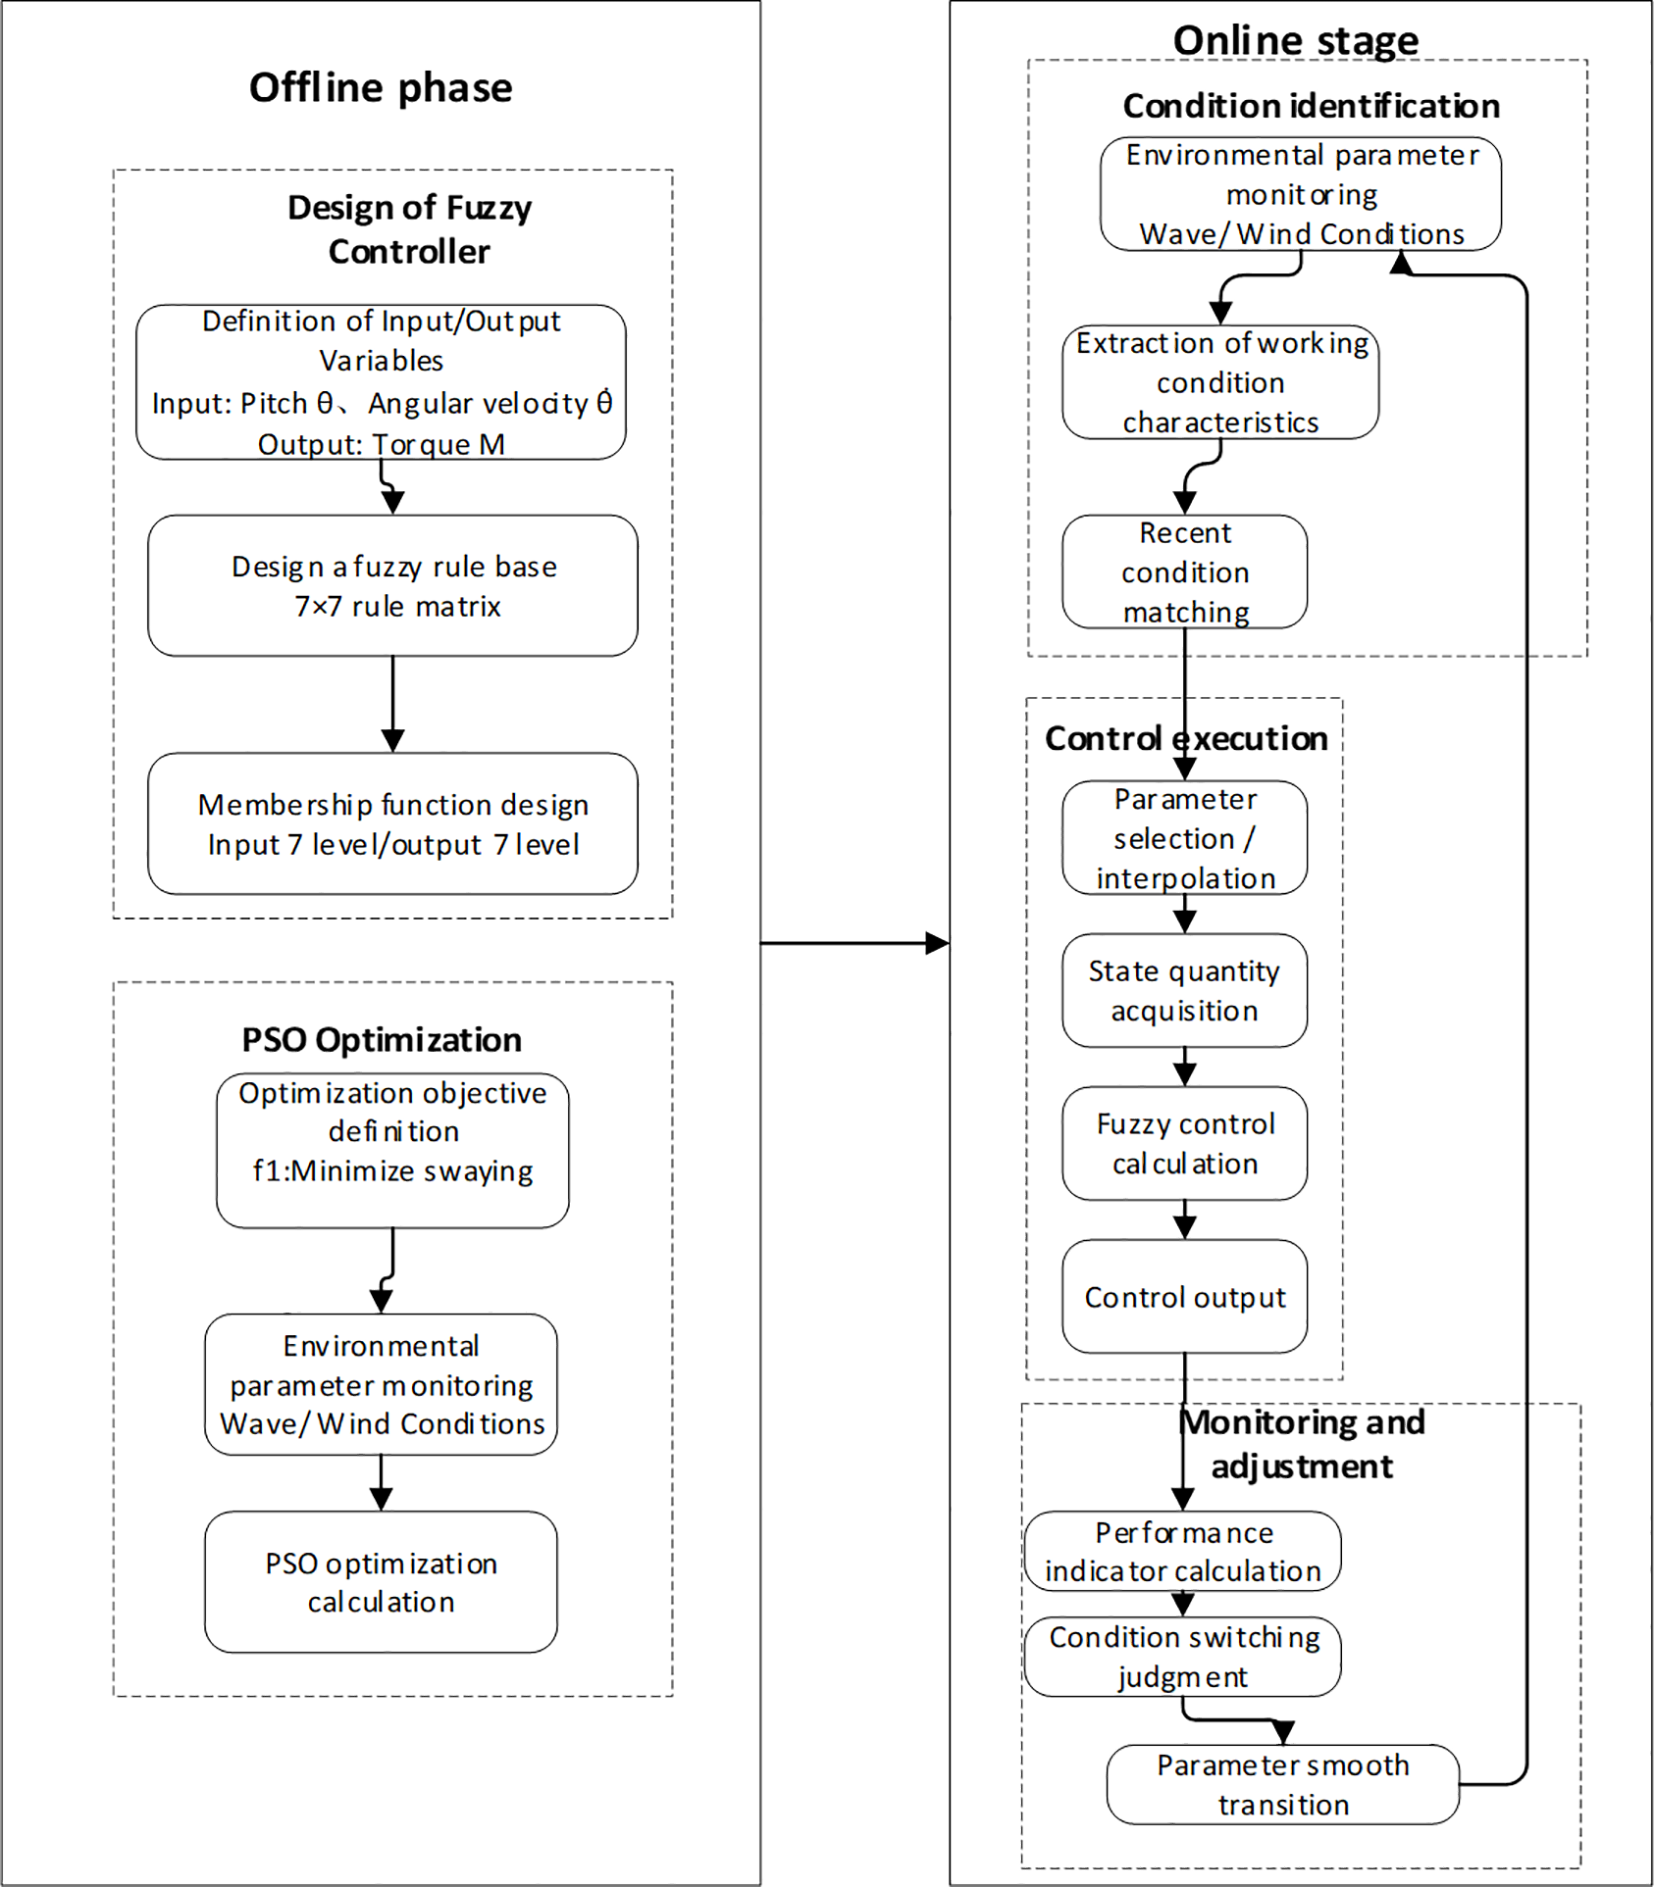
Overall framework diagram of the control system.
3.1 Offline optimization
To achieve mapping from system states to control quantities, input and output variables must first undergo fuzzification. This paper uses seven linguistic values to describe pitch angle, pitch angular velocity, and control moment M: {NB, NM, NS, ZO, PS, PM, PB}, representing negative big, negative medium, negative small, zero, positive small, positive medium, and positive big, respectively.
A complete fuzzy control rule base was designed based on expert experience and system dynamic characteristics.
To improve the performance and adaptability of the control system, this paper introduces a hierarchical control architecture, dividing the entire control system into two levels: the decision layer and the execution layer:
Decision layer (upper-level control): Responsible for environmental condition recognition, control objective determination, and control parameter optimization. This layer operates at a lower update frequency, handling global and long-term system tasks, including: condition analysis and recognition based on sensor data, selection or adjustment of control parameters according to identified conditions
Execution layer (lower-level control): Responsible for the generation and execution of real-time control signals, operating at a higher frequency to ensure system real-time responsiveness, including: Real-time reception and filtering of sensor data, execution of fuzzy inference calculations to generate control signals, transmission of control signals to actuators and monitoring of execution status
The advantage of the hierarchical architecture lies in effectively separating tasks of different time scales, allowing the decision layer to focus on global optimization without affecting the real-time performance of the execution layer, while providing enhanced system adaptability and robustness. Information exchange between the two layers is carried out through parameter interfaces and state feedback, ensuring coordinated system operation.
During the PSO optimization process, the optimization objective function is first designed to achieve the goal of reducing the pitch angle. The optimization variables are the parameters of the fuzzy controller, with each particle representing a complete set of fuzzy controller parameters, including 7 membership function position parameters for input variable , 7 membership function position parameters for input variable θ·, and 7 membership function position parameters for output variable .
The operating conditions are designed as: wave height , period , and wind speed The objective function is designed as Equation 19:
is the pitch angle of the system at time , and are the start and end points of time integration, is the predetermined maximum allowable pitch angle, and is the weight of the penalty factor, used to adjust the severity of the penalty for exceeding the maximum allowable pitch angle.
3.2 Online control
The condition recognition phase involves environmental parameter measurements through real-time monitoring of wave parameters (such as wave height and wave period ) and wind parameters (such as wind speed and wind direction). Characteristic quantities are calculated through short-term statistical feature extraction, as shown in Equation 20.
Based on the measurement results of environmental parameters, the condition distance metric uses Euclidean distance:
Where are the preset condition points. The similarity between the current condition and preset conditions is determined, and the closest condition is matched, as shown in Equation 22.
Based on the matched condition point, the optimal fuzzy controller parameters are selected. If the current condition completely matches a preset condition, the corresponding parameters are directly used; if it falls between different conditions, weighted interpolation is used to calculate the controller parameters, with the interpolation formula being Equation 23.
Where the weight is Equation 24.
Normalization is performed through distance to ensure that closer conditions have a greater influence on interpolation. The system monitors the roll reduction effect in real-time. The short-term roll reduction effect is calculated using the integral formula , reflecting the mean square value of the pitch angle within the time window.
When a change in operating conditions is detected, the criterion is used to determine whether control parameters need to be switched. Where represents the Euclidean distance between the condition characteristic quantities at the current time t and the nearest preset condition point. If the switching condition is met, a parameter smooth switching strategy is adopted, as shown in Equation 25.
Where is the smoothing factor, used to reduce system disturbances caused by switching.
4 Simulation experiments
This chapter evaluates the performance of a PSO algorithm-based gyroscopic stabilization control system for floating wind turbines through a series of simulated verification scenarios. The verification work examines free decay response and combined wind-wave effects, comparing three states: uncontrolled, passive control, and active control, comprehensively evaluating the proposed control scheme’s performance through dynamic response characteristics and vibration reduction effects. The main parameters of the dual roll-reduction gyroscopes in the semi-submersible wind turbine are shown in Table 5.
Table 5
| Parameter | Value/Unit |
|---|---|
| n | 2 |
| 107000() | |
| 215625 () | |
| 1000 () | |
| 140000() | |
| 160000() |
Main parameters of single gyro stabilizer.
To comprehensively evaluate the control system’s performance, this chapter designs four typical operating conditions for simulation verification, with specific design schemes shown in Table 6. Among them, LC1 condition verifies the system’s basic dynamic characteristics and control effects, LC2 condition represents control performance under normal operating conditions, and LC3 condition tests the system’s limit performance in adverse environments., LC4 condition represents the response performance of the system under random sea conditions.
Table 6
| Condition number | Wind condition | Wave condition | Control scheme |
|---|---|---|---|
| LC1 | No Wind | Still Water | No Control/Passive Control/Active Control |
| LC2 | 13m/s | H=5m, T=10s | No Control/Passive Control/Active Control |
| LC3 | 18m/s | H=8m, T=10s | No Control/Passive Control/Active Control |
| LC4 | 13m/s | P-M | No Control/Passive Control/Active Control |
Experimental conditions.
4.1 Analysis of experimental results
4.1.1 Analysis of free decay conditions
Figure 9 presents the time-domain response comparison of the system’s precession angle, tower displacement, and roll angle under the windless still-water condition (LC1). This condition can effectively evaluate the basic dynamic characteristics of the damping system.
Figure 9
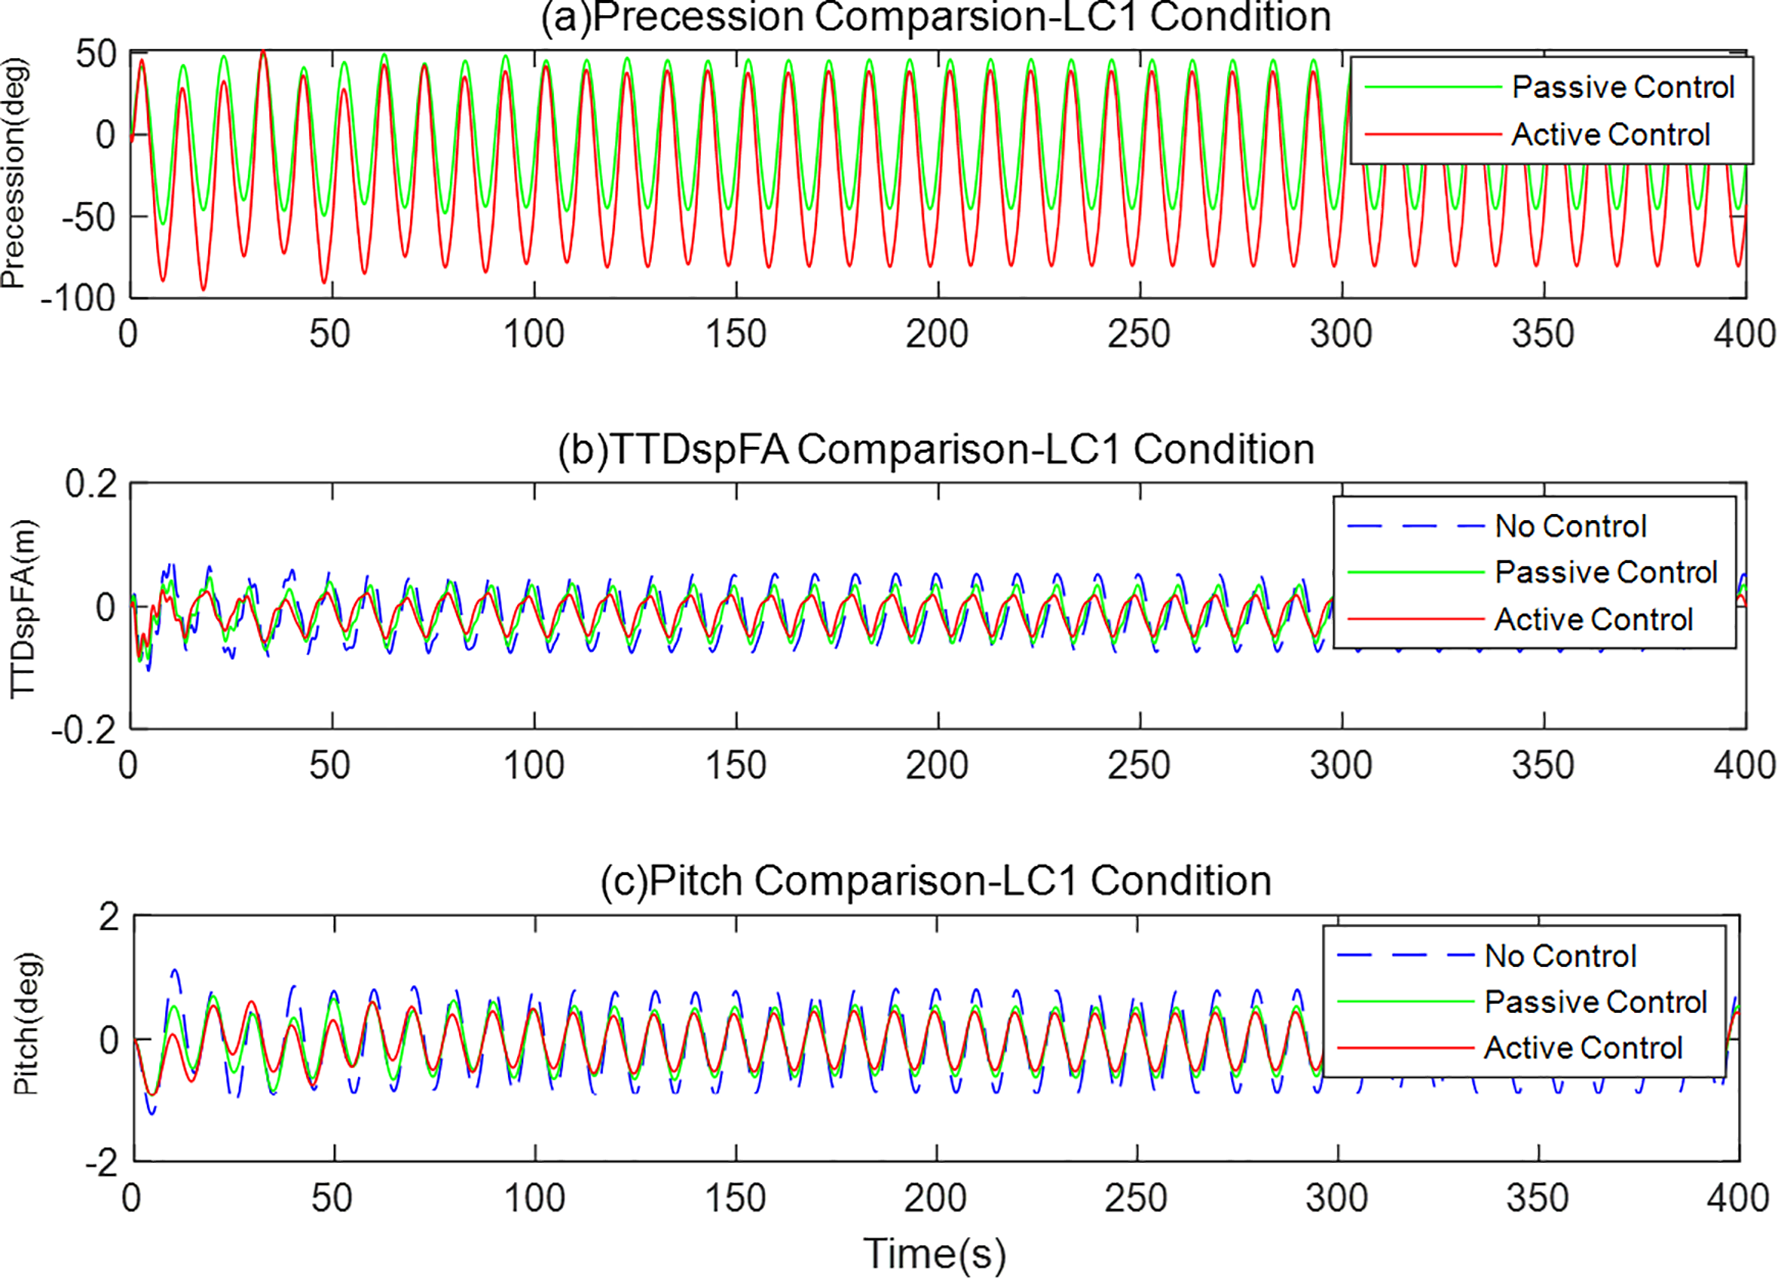
(a-c) Comparison of gyroscopic stabilizer control under calm water and windless condition.
From the pitch angle response in Figure 9c, it can be observed that under uncontrolled conditions, the platform exhibits obvious low-frequency damped oscillations with slow attenuation. In comparison, passive control produces a certain vibration reduction effect, with an RMS suppression rate of 14.36%. Active control shows the most significant effect, with an RMS suppression rate as high as 37.56%, demonstrating effective control capability over platform motion.
The tower-top displacement response in Figure 9b further confirms the effectiveness of the stabilization system. The active control scheme achieves an RMS suppression rate of 44.23% for tower-top displacement and a standard deviation suppression rate of 47.28%, significantly outperforming the passive control’s 31.66% and 35.51%. This indicates that active control not only reduces the force amplitude on the tower but also improves the overall stiffness of the system, contributing to extended fatigue life of the wind turbine structure.
Figure 9a shows the comparison of precession angles, which reflects the differences in dynamic characteristics of the gyroscope stabilizer under the two control strategies. Under passive control, the precession angle is generated spontaneously with the platform movement and has a smaller amplitude; while under active control, the precession angle is larger and shows a more regular changing trend. This is the result of the control system actively adjusting the gyroscopic torque, thereby achieving the optimal suppression of the platform movement.
4.1.2 Analysis of combined wind and wave conditions
Figure 10 shows the control performance of the system under regular operating conditions (LC2) with wind speed of 13m/s, wave height of 5m, and period of 10s. This condition represents the typical operational state of floating wind turbines under normal sea and wind conditions. To eliminate the transient response, the data analysis was conducted using data ranging from 50 seconds to 400 seconds.
Figure 10
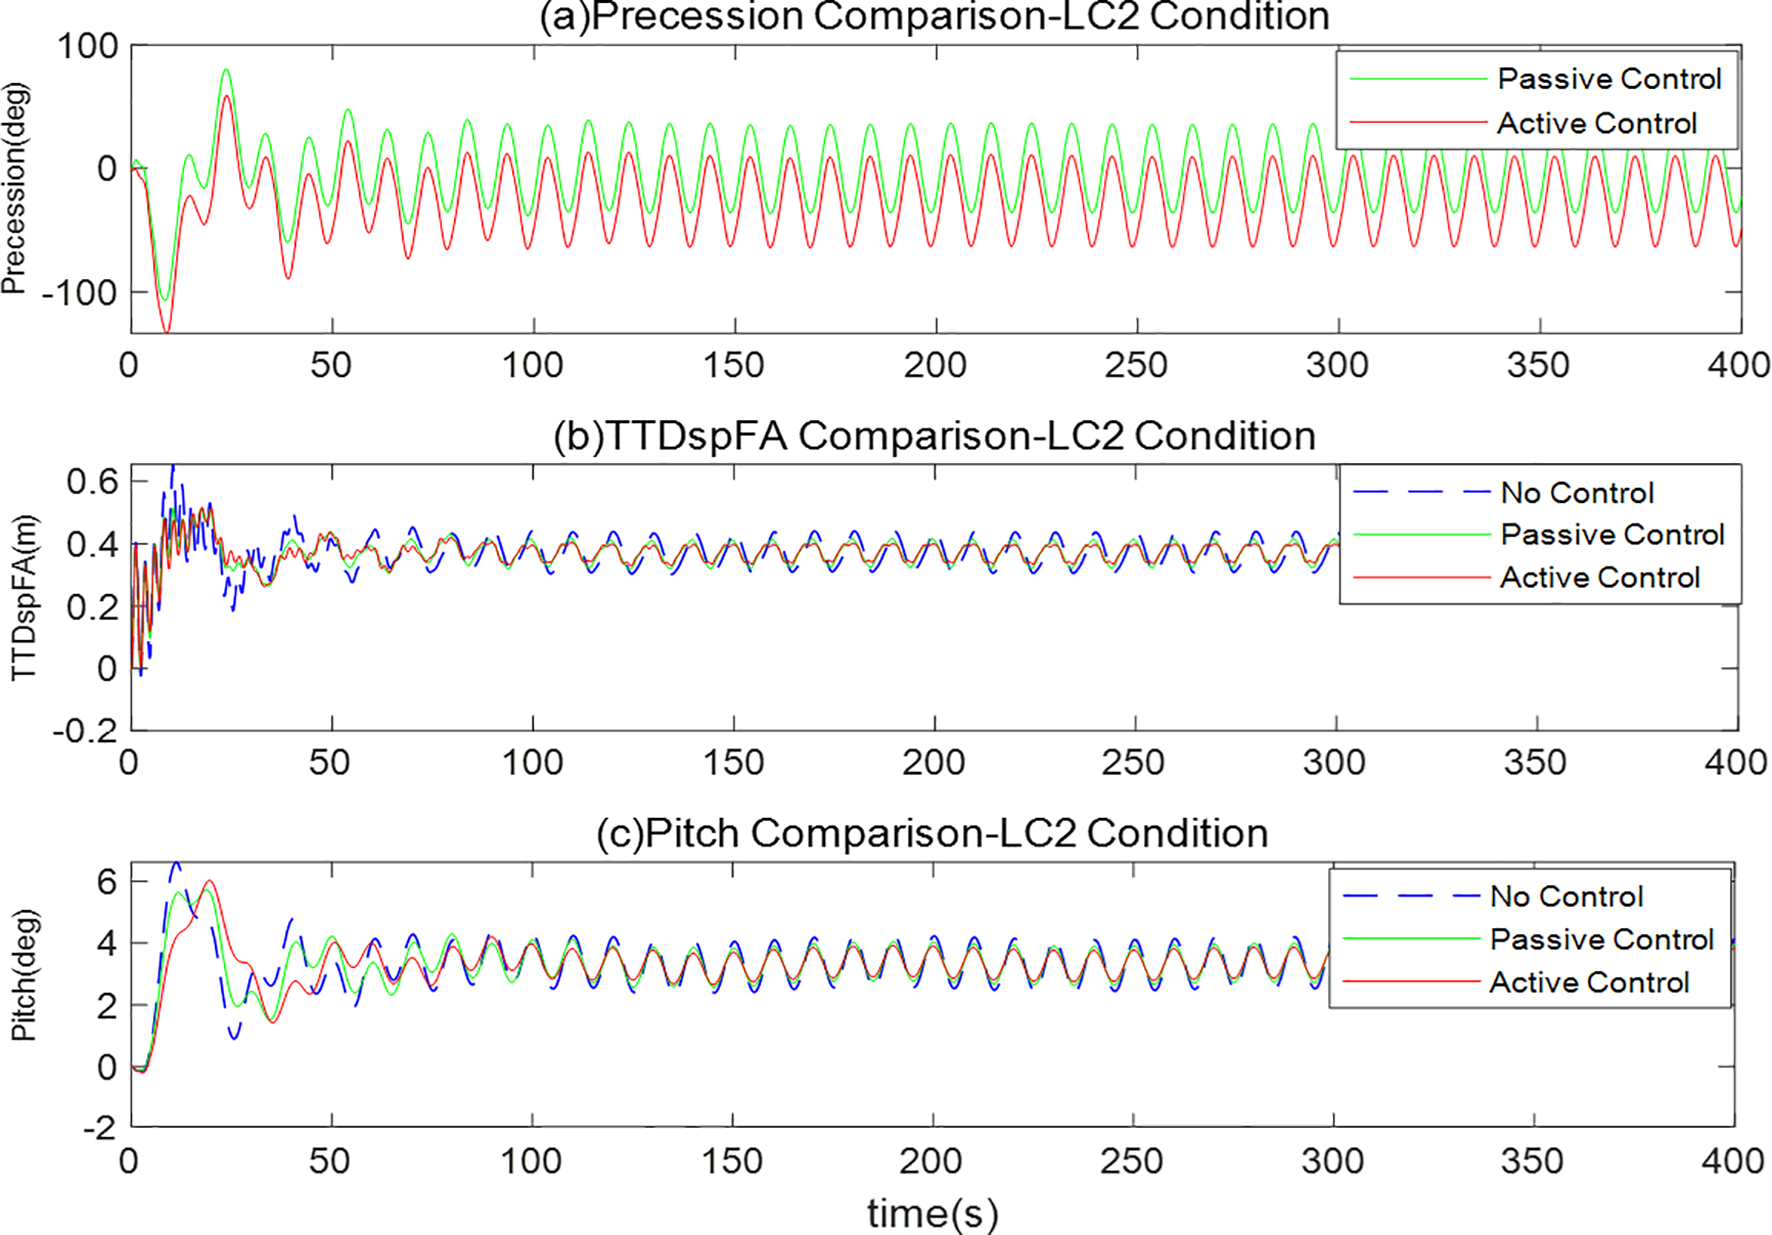
(a-c) Comparison of gyroscopic stabilizer control under combined wind and wave condition.
From the pitch angle response in Figure 10c, it is evident that the platform generates significant periodic oscillations under the combined effect of wind and waves in the uncontrolled state. The active control scheme performs excellently in terms of peak suppression rate, reaching 21.45%, considerably higher than the passive control’s 13.16%. Notably, the active control’s RMS suppression rate and standard deviation suppression rate are 2.66% and 31.56% respectively, both superior to the corresponding metrics of passive control.
Figure 10b indicates that active control has a significant effect on tower-top displacement peak suppression, reaching 22.61%, higher than the passive control’s 18.64%. In terms of RMS suppression rate, active and passive control are 0.61% and 0.49% respectively, with little difference. Regarding standard deviation suppression rate, the effects of the two control methods are similar, with active control at 10.38% and passive control at 10.72%. This phenomenon indicates that under regular wave conditions, both control methods have comparable effects on suppressing the overall vibration energy of the structure, but active control has advantages in suppressing peak responses, which is crucial for the safe operation of wind turbines.
The precession angle comparison in Figure 10a shows that the active control scheme maintains the gyroscope’s precession angle within a smaller range, avoiding the large-amplitude precession that may occur in passive control, reducing the risk of mechanical wear on gyroscope bearings, and contributing to extended system service life. Meanwhile, reasonable control of the precession angle also ensures that the gyroscope always operates in the high-efficiency zone, maximizing its stabilization effect.
4.1.3 Analysis of extreme sea conditions
Figure 11 shows the control performance of the system under extreme sea conditions (LC3). This condition sets wind speed at 18m/s, wave height at 8m, and period at 10s, representing the system’s limit operating state in severe marine environments. To eliminate the transient response, the data analysis was conducted using data ranging from 50 seconds to 400 seconds.
Figure 11
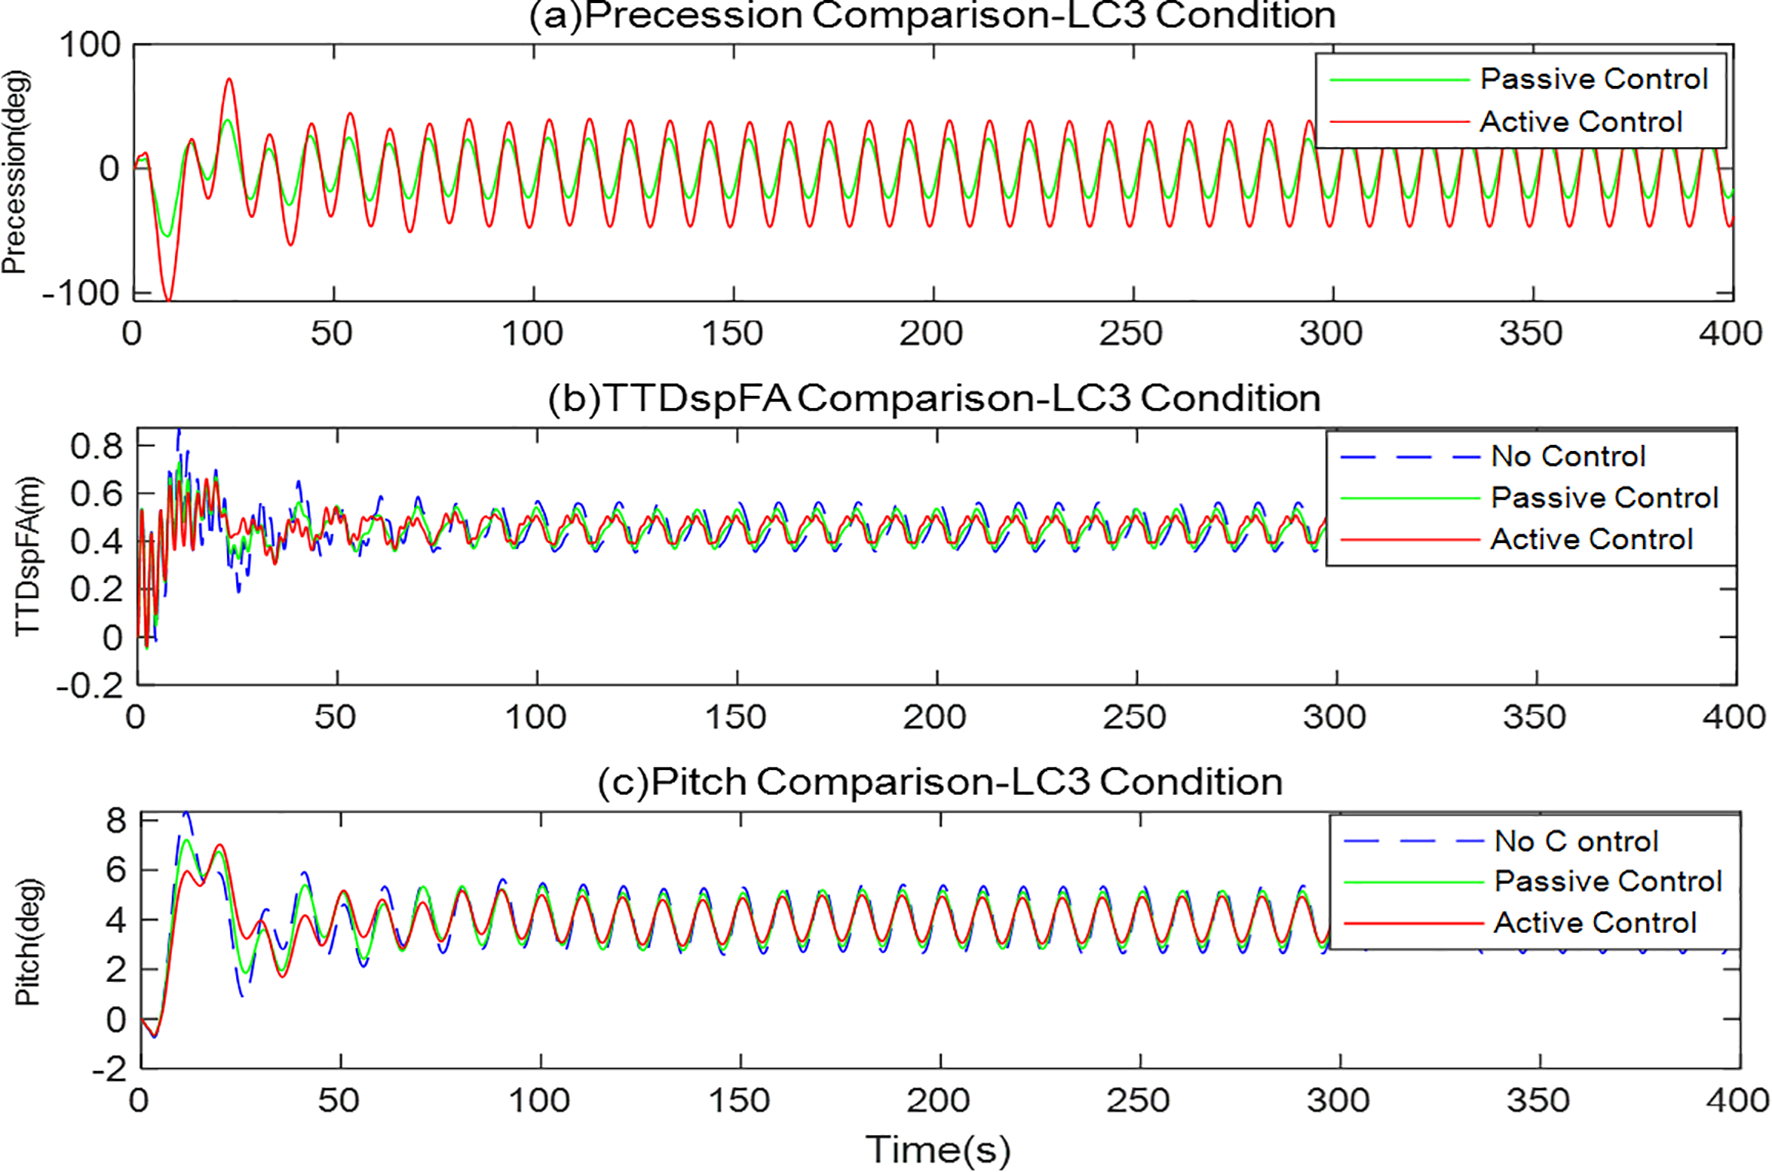
(a-c) Comparison of gyroscopic stabilizer control under extreme sea condition.
Figure 11c shows that under such severe conditions, active control has significant advantages in pitch angle control, with a peak suppression rate reaching 31.52%, far higher than the passive control’s 15.73%. In terms of standard deviation suppression rate, active control reaches 35.81%, also significantly better than passive control’s 23.14%. This indicates that active control strategies can more effectively control large-amplitude platform movements under extreme conditions, ensuring safe operation of wind turbines in harsh environments.
The tower-top displacement comparison in Figure 11b reveals an interesting phenomenon: active control performs excellently in peak suppression (24.58%), higher than passive control (19.26%); However, in terms of RMS suppression rate and standard deviation suppression rate, passive control slightly outperforms active control. This phenomenon may stem from the active control strategy prioritizing overall platform stability under extreme conditions, sacrificing suppression of certain high-frequency vibrations. Considering that peak loads are often the decisive factor for structural safety under extreme conditions, this “trade-off” of active control is actually a more reasonable control strategy.
The precession angle comparison in Figure 11a demonstrates the superiority of active control under extreme conditions. Under passive control, the precession angle approaches mechanical limits during certain periods, posing a risk of control saturation. In contrast, active control, through optimized control strategies, maintains the precession angle within a safe range and actively adjusts during peak wind and wave periods, achieving precise control of platform motion.
4.1.4 Random sea condition analysis
Figure 12 shows the control performance of the system under the condition of no wind and random waves of the JOWNSAP spectrum (LC4). The effective wave height is set at 8 meters, and this condition sets the wind speed at 13 meters per second, along with the working state under the random wave generation conditions. To eliminate the transient response, the data analysis was conducted using data ranging from 50 seconds to 400 seconds.
Figure 12
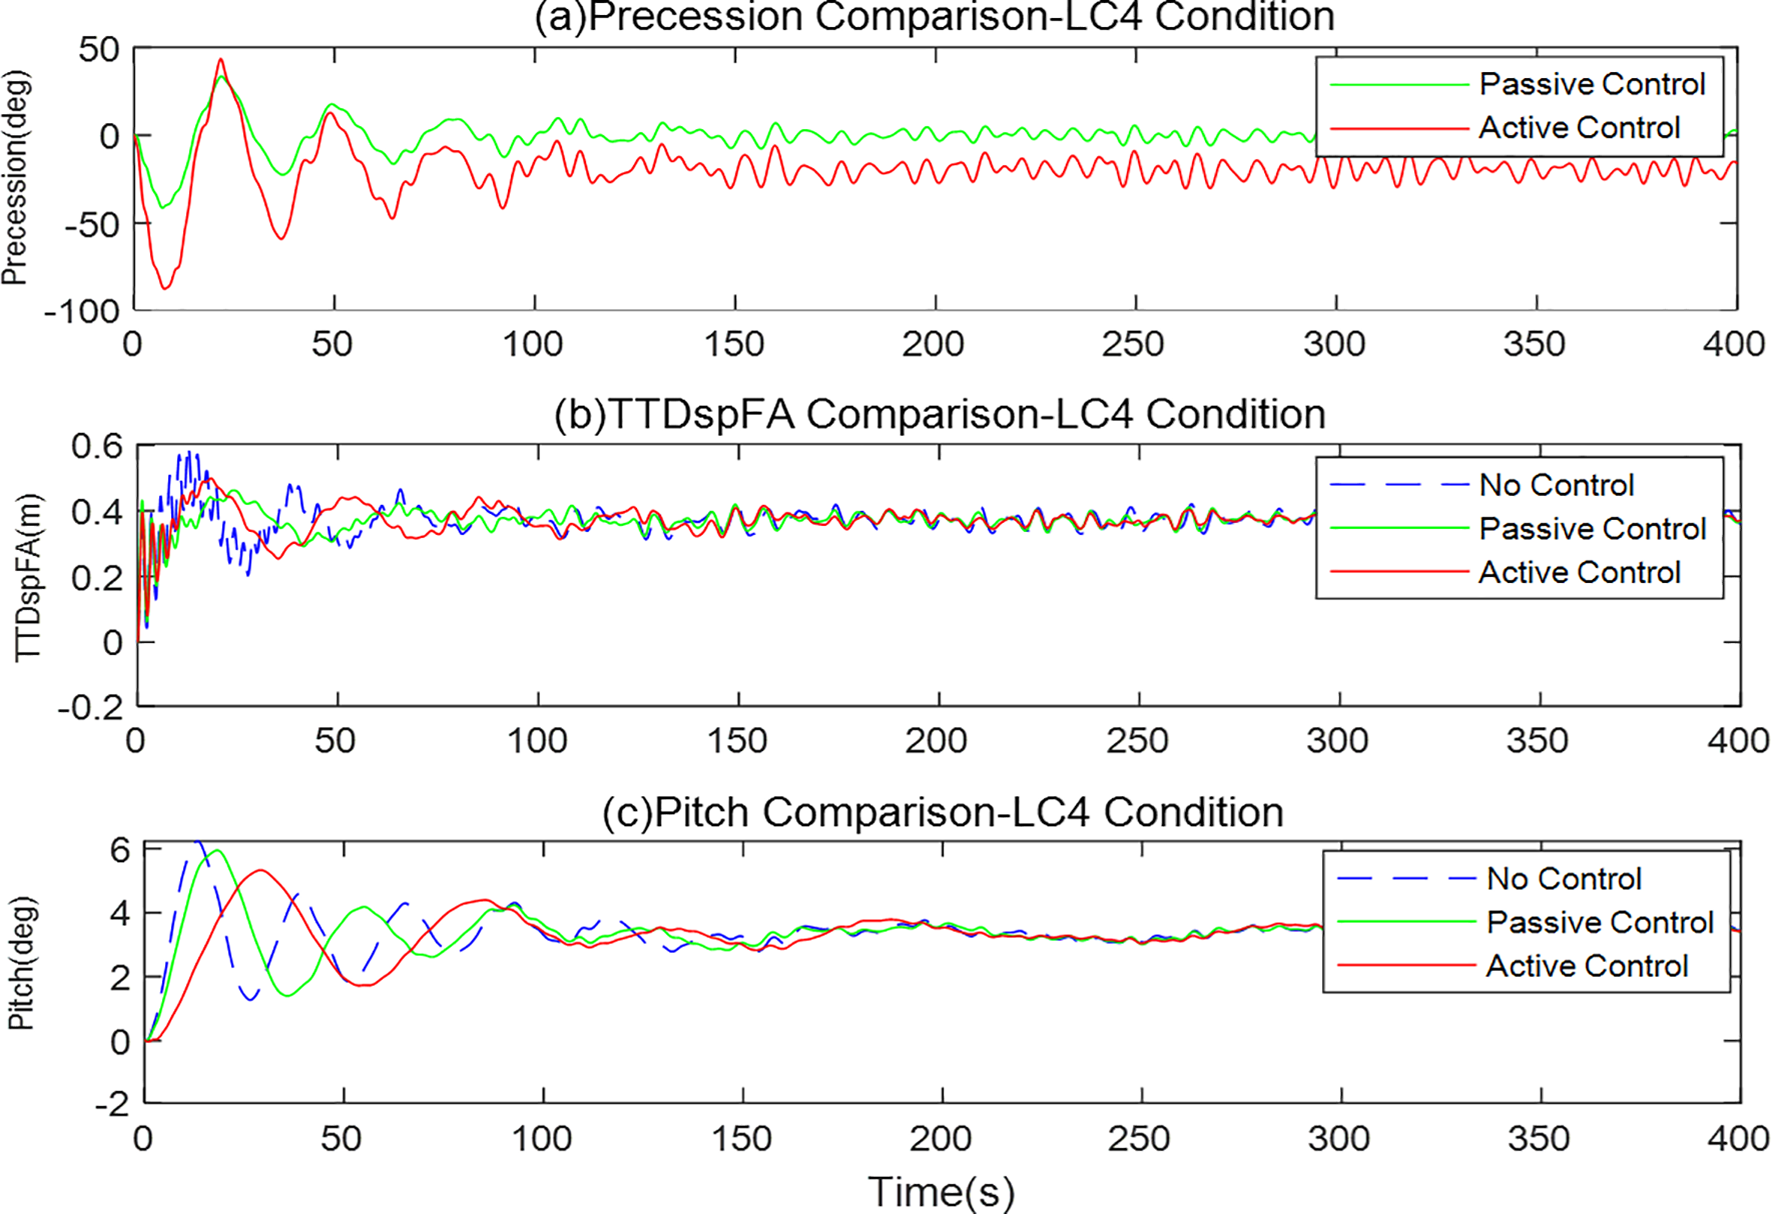
(a-c) Comparison of gyroscopic stabilizer control under random sea condition.
Figure 12c shows that under random operating conditions, the roll angle without control experiences significant oscillations. Active control and passive control exhibit relatively obvious control effects. Among them, the peak suppression rate of active control reaches 38.16%, and the standard deviation suppression rate reaches 31.25%. The peak suppression rate of passive control reaches 13.91%, and the standard deviation suppression rate is 17.05%. This indicates that active control can also maintain good control effects under random operating conditions.
Figure 12b shows that in terms of tower displacement, compared with the uncontrolled condition, the peak vibration suppression effects of active control and passive control are more significant. The standard deviation vibration suppression rate of active control reached 27.02%, while that of passive control was 22.31%. This might be due to the fact that under random waves, the gyroscope places more emphasis on the stability of the control system, resulting in less obvious peak control effects on the tower displacement.
Figure 12a shows that in terms of the precession angle, both active control and passive control remain within a relatively reasonable range.
4.2 Discussion of results
To comprehensively evaluate the performance of different control strategies, Tables 7, 8 summarize the key performance indicators of each control scheme under three operating conditions. This study employs three evaluation indicators for quantitative analysis of control effects:
Table 7
| Condition | Control method | RMS suppression rate | Standard deviation suppression rate | Peak suppression rate |
|---|---|---|---|---|
| LC1 | Active Control | 37.56 | 36.86 | |
| Passive Control | 14.36 | 15.51 | ||
| LC2 | Active Control | 2.66 | 31.56 | 21.45 |
| Passive Control | 1.24 | 10.21 | 13.16 | |
| LC3 | Active Control | 4.41 | 35.81 | 31.52 |
| Passive Control | 3.47 | 23.14 | 15.73 | |
| LC4 | Active Control | 2.62 | 31.25 | 38.16 |
| Passive Control | 1.94 | 17.05 | 13.91 |
Comparison of pitch angle suppression rates under different conditions (%).
Table 8
| Condition | Control method | RMS suppression rate | Standard deviation suppression rate | Peak suppression rate |
|---|---|---|---|---|
| LC1 | Active Control | 44.23 | 47.28 | |
| Passive Control | 31.66 | 35.51 | ||
| LC2 | Active Control | 0.61 | 10.85 | 22.61 |
| Passive Control | 0.49 | 10.61 | 18.64 | |
| LC3 | Active Control | 0.99 | 33.13 | 24.58 |
| Passive Control | 1.24 | 30.22 | 19.26 | |
| LC4 | Active Control | 0.54 | 27.02 | 17.83 |
| Passive Control | 1.02 | 22.31 | 5.01 |
Comparison of tower-top displacement suppression rates under different conditions (%).
1. RMS suppression rate calculation formula is expressed as Equation 26:
Where, is the root mean square value under controlled conditions, and is the root mean square value under uncontrolled conditions.
2. Standard deviation suppression rate calculation formula is expressed as Equation 27:
Where, is the standard deviation under controlled conditions, and is the standard deviation under uncontrolled conditions.
3. Peak suppression rate calculation formula is expressed as Equation 28:
Where, is the absolute peak value under controlled conditions, and is the absolute peak value under uncontrolled conditions.
These three indicators evaluate the control effects of the stabilization system from the perspectives of root mean square value, standard deviation, and peak value, comprehensively reflecting the performance of control strategies under different operating conditions.
4.2.1 Comprehensive analysis of control effects
Based on the analysis of experimental results across three conditions, the active control scheme demonstrates the following characteristics:
-
Advantages under free decay conditions (LC1): Active control shows significant effects in suppressing free decay vibrations, with suppression rates far higher than passive control for both pitch angle and tower-top displacement, indicating that active control can more effectively dissipate system vibration energy and accelerate the system’s return to equilibrium.
-
Performance under normal operating conditions (LC2): Active control has comprehensive advantages in pitch angle control, especially in peak suppression. For tower-top displacement, although the two control methods have similar performance in RMS and standard deviation suppression, active control still has advantages in peak suppression. This indicates that active control strategies can effectively handle conventional wind and wave conditions and ensure platform operational stability.
-
Performance under extreme conditions (LC3): Active control shows its most significant advantages in pitch angle control, with all indicators far superior to passive control. For tower-top displacement, active control prioritizes peak suppression, which is the most critical performance indicator in extreme environments. Although slightly inferior to passive control in RMS and standard deviation suppression, this minor difference (≤1%) has limited impact on overall system performance, while the significant advantage of active control in peak suppression (an improvement of 4.6%) has decisive significance for structural safety.
-
Performance under random conditions (LC4): The advantages of active control in terms of pitch oscillation are quite obvious. There are significant improvements in RMS, standard deviation, and peak vibration suppression rate. For the tower top displacement, the effect of active control is relatively weak, but it still has an advantage compared to passive control.
4.2.2 Comprehensive benefit assessment
Through comparative analysis, it can be concluded that the active control strategy of the gyroscopic stabilization system demonstrates comprehensive and significant advantages under all four typical conditions, particularly in the following key aspects:
-
Vibration suppression efficiency: Active control outperforms passive control in the vast majority of indicators, with an average improvement exceeding 15 percentage points.
-
Peak response control: Under all conditions, active control consistently leads in the ability to suppress peak responses, which has decisive significance for ensuring structural safety.
-
Adaptability: As environmental conditions deteriorate, the advantages of active control over passive control gradually expand, indicating its stronger adaptability in complex and changing environments.
The results demonstrate that the gyroscopic stabilization system based on precession angle active control can effectively improve the motion response of floating wind turbines, significantly enhancing their operational stability and safety under various sea conditions, providing reliable technical assurance for the practical application of offshore floating wind turbines.
5 Conclusions and future work
5.1 Main research achievements
This study addresses the motion stability problem of floating offshore wind turbines under complex sea conditions by proposing a particle swarm optimization fuzzy control method based on a gyroscope-wind turbine coupled dynamics model, and verifies its effectiveness through a series of simulation experiments. The main achievements of this research are as follows:
-
Gyroscope-wind turbine coupled dynamics modeling: Successfully established a 12-degree-of-freedom fully coupled dynamics model incorporating platform six-degree-of-freedom motion, tower flexible deformation, and stabilizing gyroscopes. This model, constructed using the Kane method, realizes the description of fully coupled effects among platform motion, tower deformation, rotor rotation, and gyroscopic precession, providing a theoretical foundation for floating wind turbine stabilization control. The model’s effectiveness is confirmed through validation against OpenFAST software, with all error metrics controlled within 10%.
-
PSO-optimized fuzzy control system design: Designed a fuzzy control framework based on particle swarm optimization, achieving precise control of the gyroscopic stabilization system by optimizing the membership function parameters of the fuzzy controller. A hierarchical control architecture is adopted, dividing the control system into decision and execution layers, effectively separating tasks of different time scales and improving system adaptability and robustness.
-
Online condition recognition and parameter optimization: Developed a condition recognition method based on real-time monitoring of environmental parameters, achieving matching between current and preset conditions through short-time statistical feature extraction and Euclidean distance measurement. Designed a parameter smooth switching strategy to reduce system disturbances caused by control parameter switching, enhancing the adaptability of the control system under complex and changing sea conditions.
-
Stabilization control performance verification: Comprehensively evaluated the performance of the proposed control scheme through simulation verification of four typical conditions. Results show that the active control scheme has significant advantages compared to passive control and no-control schemes:
Under free decay conditions (LC1), the pitch angle RMS suppression rate reaches 37.56%, far higher than passive control’s 14.36%; the tower-top displacement RMS suppression rate reaches 44.23%, significantly better than passive control’s 31.66%.
Under normal operating conditions (LC2), active control achieves 21.45% in pitch angle peak suppression, higher than passive control’s 13.16%; tower-top displacement peak suppression rate reaches 22.61%, better than passive control’s 18.64%.
Under extreme sea conditions (LC3), active control performs most prominently in pitch angle control, with peak suppression rate reaching 31.52%, far higher than passive control’s 15.73%; tower-top displacement peak suppression rate reaches 24.58%, better than passive control’s 19.26%.
Under the random sea condition (LC4), the peak vibration suppression rate of the active control for the roll angle reached 38.16%, which was much higher than the 13.91% of the passive control. The vibration suppression rate of the tower top displacement was 17.83%, also higher than the 5.01% of the passive control.
5.2 Future research directions
Despite a series of achievements in floating wind turbine stabilization control, there are still the following directions worthy of in-depth study:
-
Experimental verification of control strategies: Current research is mainly based on numerical simulation; future work should conduct water basin model tests or field experiments to verify the feasibility and effectiveness of the proposed control strategies in real environments. Experimental verification of control effects and system stability under extreme sea conditions is particularly important to provide more reliable evidence for engineering applications.
-
Control algorithm optimization: Based on the existing PSO-fuzzy control framework, introduce advanced control methods such as deep reinforcement learning and adaptive dynamic programming to develop control algorithms that simultaneously consider stabilization effects, energy consumption optimization, and equipment life, further enhancing system comprehensive performance.
-
Multi-gyroscope collaborative control research: Explore collaborative control strategies for multiple stabilizing gyroscopes, including optimal gyroscope arrangement schemes, power allocation strategies, and fault-tolerant control methods, improving system control effectiveness and reliability.
-
Robust control under random wave conditions: Extend research on the robustness of control strategies under more complex real sea conditions such as random waves and irregular waves. Establish control parameter adaptive adjustment mechanisms based on wave spectrum characteristics to improve system adaptability and disturbance rejection in random marine environments. Pay special attention to control reliability and stability under extreme random wave conditions.
-
Research on nonlinear dynamic behavior of coupled systems: Deeply explore the nonlinear dynamic characteristics of wind turbine-platform-gyroscope coupled systems under complex sea conditions, including system stability analysis, bifurcation phenomenon research, and chaos behavior identification. Develop more accurate nonlinear models to provide theoretical support for advanced control strategy development.
In conclusion, this research provides new technical approaches and solutions for stabilization control of floating offshore wind turbines. The established gyroscope-wind turbine coupled dynamics model and PSO-optimized fuzzy control system provide theoretical foundation and technical support for research in related fields. Future research will further expand the application scope and engineering implementation pathways of control strategies, making greater contributions to the development of the floating offshore wind power industry.
Statements
Data availability statement
The original contributions presented in the study are included in the article/Supplementary Material. Further inquiries can be directed to the corresponding author/s.
Author contributions
WW: Writing – review & editing, Writing – original draft. HL: Writing – review & editing, Writing – original draft. YY: Writing – original draft, Writing – review & editing. KS: Writing – review & editing, Writing – original draft. LC: Writing – original draft, Writing – review & editing.
Funding
The author(s) declare that financial support was received for the research and/or publication of this article. National Key Research and Development Program of China(2022YFB4201303).
Conflict of interest
The authors declare that the research was conducted in the absence of any commercial or financial relationships that could be construed as a potential conflict of interest.
Generative AI statement
The author(s) declare that no Generative AI was used in the creation of this manuscript.
Publisher’s note
All claims expressed in this article are solely those of the authors and do not necessarily represent those of their affiliated organizations, or those of the publisher, the editors and the reviewers. Any product that may be evaluated in this article, or claim that may be made by its manufacturer, is not guaranteed or endorsed by the publisher.
References
1
Bai D. Wang B. Li Y. Wang W. (2025). Study on load reduction and vibration control strategies for semi-submersible offshore wind turbines. Sci. Rep.15, 1148. doi: 10.1038/s41598-025-85476-3
2
Cao Q. Xiao L. Cheng Z. Liu M. Chen Y. Zhang K. (2023). Research on the conceptual design and performance analysis of a 10 MW SPIC concept floating wind turbine foundation in intermediate water depth. J. Renew. Sustain. Energy15, 063303. doi: 10.1063/5.0161913
3
Global Wind Energy Council (GWEC) (2024). Global Wind Report 2024 (GWEC).
4
Hu L. Zhang M. Li G. Yuan Z. Bi J. Guo Y. (2024). Multi-objective model predictive control for ship roll motion with gyrostabilizers. Ocean Eng.313, 119412. doi: 10.1016/j.oceaneng.2024.119412
5
Hu L. Zhang M. Yu X. Yuan Z.-M. Li W. (2023). Real-time control of ship’s roll motion with gyrostabilisers. Ocean Eng.285, 115348. doi: 10.1016/j.oceaneng.2023.115348
6
Lackner M. A. Rotea M. A. (2011). Passive structural control of offshore wind turbines. Wind Energy14, 373–388. doi: 10.1002/we.426
7
Lee C. F. Ong M. C. (2025). Numerical analysis of mooring systems for reducing peak mooring line tensions in a combined wind and wave energy system at an intermediate water depth. Ocean Eng.325, 120767. doi: 10.1016/j.oceaneng.2025.120767
8
Li B. Zhang X. Wang J. Chen N. (2022). Anti-roll characteristics of marine gyrostabilizer based on adaptive control and hydrodynamic simulation. J. Mar. Sci. Eng.10, 83. doi: 10.3390/jmse10010083
9
Liu J. Cai C. Song D. Zheng J. Guo X. Sun X. et al . (2025). Power output and platform motion regulation of floating offshore wind turbine using model predictive control based on coupled dynamics model. Ocean Eng.322, 120451. doi: 10.1016/j.oceaneng.2025.120451
10
Namik H. Stol K. (2011). Performance analysis of individual blade pitch control of offshore wind turbines on two floating platforms. Mechatronics21, 691–703. doi: 10.1016/j.mechatronics.2010.12.003
11
Palraj M. (2021). Motion control studies of a barge mounted offshore dynamic wind turbine using gyrostabilizer. Ocean Eng.209, 107500. doi: 10.1016/j.oceaneng.2021.109578
12
Palraj M. Rajamanickam P. (2020). Motion control of a barge for offshore wind turbine (OWT) using gyrostabilizer. Ocean Eng.209, 107500. doi: 10.1016/j.oceaneng.2020.107500
13
Perez T. Santos-Mujica M. Ruiz-Minguela J. P. (2009). “Performance analysis and control design of a gyro-based wave energy converter,” in 2009 European Control Conference (ECC) (IEEE, Budapest), 3743–3748. doi: 10.23919/ECC.2009.7074982
14
Takeuchi H. Umemura K. Maeda S. (2011). Development of the Anti Rolling Gyro 375T (Rolling Stabilizer for Yachts) Using Space Control Technology, Engineering. Vol. 48.
15
Wang B. Han D. Wang W. Li X. Shen K. Li Y. (2022). Modeling and optimization of multiple tuned mass dampers for a barge-type floating offshore wind turbine. Front. Mar. Sci.9. doi: 10.3389/fmars.2022.994848
16
Yu W. Lemmer F. Cheng P. W. (2023). Modeling and validation of a tuned liquid multi-column damper stabilized floating offshore wind turbine coupled system. Ocean Eng.280, 114442. doi: 10.1016/j.oceaneng.2023.114442
17
Zhang Y. Jin H. Wang B. Zhao J. (2022). Balancing control of a unicycle robot with double gyroscopes using adaptive fuzzy controller. Mechatronics88, 102908. doi: 10.1016/j.mechatronics.2022.102908
Summary
Keywords
floating offshore wind turbine, gyroscopic stabilization, coupled dynamics model, particle swarm optimization, fuzzy control, adaptive control
Citation
Wang W, Li H, Yang Y, Sheng K and Chen L (2025) Stability analysis of semi-submersible floating wind turbines based on gyro-turbine coupled dynamics model. Front. Mar. Sci. 12:1597408. doi: 10.3389/fmars.2025.1597408
Received
21 March 2025
Accepted
10 June 2025
Published
30 June 2025
Volume
12 - 2025
Edited by
Shuaishuai Wang, Norwegian University of Science and Technology, Norway
Reviewed by
Giovanni Bracco, Polytechnic University of Turin, Italy
Xiangheng Feng, Windey Energy Technology Group Co., Ltd, China
Updates
Copyright
© 2025 Wang, Li, Yang, Sheng and Chen.
This is an open-access article distributed under the terms of the Creative Commons Attribution License (CC BY). The use, distribution or reproduction in other forums is permitted, provided the original author(s) and the copyright owner(s) are credited and that the original publication in this journal is cited, in accordance with accepted academic practice. No use, distribution or reproduction is permitted which does not comply with these terms.
*Correspondence: Hao Li, lh_2303@163.com
Disclaimer
All claims expressed in this article are solely those of the authors and do not necessarily represent those of their affiliated organizations, or those of the publisher, the editors and the reviewers. Any product that may be evaluated in this article or claim that may be made by its manufacturer is not guaranteed or endorsed by the publisher.