Abstract
Flood events caused by high rainfall can have profound biogeochemical impacts on riverine systems but also on the receiving coastal waters. The winter flood in Germany in December 2023/January 2024 affected the Elbe and Weser River systems. We obtained unique data during the peak of the flood and compared these with the monthly means from previous years (2018-2023). Hydrographic parameters and nutrients were determined by standard methods. Low salinity values were observed in the Elbe estuary and the adjacent German Bight (part of North Sea). At Helgoland the lowest average salinity was observed in January 2024 with 31.3 ± 0.5 compared to an average salinity of 32.7 ± 0.7 for the years 2016 to 2023. Nutrient loads (nitrate, phosphate) in the rivers showed a six- to 11-fold increase in the Elbe and Weser rivers compared to years without flood events. Enhanced concentrations of nitrate and silicate were found in the German Bight in January. Nutrients were diluted with North Sea waters, indicating a conservative behavior of nutrients in winter. Atypical prevailing meteorological conditions in January 2024, with predominantly easterly winds, potentially affect the dispersal of the river plume and the nutrients in the North Sea. In March 2024 the chlorophyll-a concentration strongly increased to 2.9 ± 1.8 µmol/L and was twice as high compared to only 1.5 ± 0.7 µmol/L observed in previous years. The observed intensified spring bloom in March in the German Bight near the island of Helgoland indicates the impacts of the flood-derived nutrient inputs three months after the flood event, as the timing of light and nutrient availability was optimal. It is assumed that seasonality and magnitude of flooding in the Elbe estuary and adjacent coastal region will change in future due to climate warming. Thus, the timing of light and nutrient availability will also change, with unconstrained impacts on primary producers and higher trophic levels.
1 Introduction
River networks connect terrestrial and marine environments and transport considerable amounts of matter from land to ocean. For instance, they export 60 million tons N and 9 million tons P per year (Beusen et al., 2016) as well as 900 million tons organic C per year (Cole et al., 2007). However, we know today that a high proportion of the terrestrial load into the river networks may be processed within these waters already. The magnitude of the internal processing is dependent on discharge. For organic carbon, the pulse-shunt concept predicts that terrestrial material is largely processed along the river-estuary - ocean gradient during low discharge conditions (active pipe), whereas rapid transport processes dominate under high discharge conditions [passive pipe (Raymond et al., 2016)]. A similar pattern applies for nutrient cycling and retention: high turbidity and low retention time prevent phytoplankton growth and its nutrient uptake under flood conditions, while low water depth and high retention time promote photosynthesis and autotrophic nutrient assimilation at drought leading to a negative relationship between discharge and phytoplankton production (Pusch and Fischer, 2006). Thus, the export of nutrients and carbon from land to sea is enhanced during flood events potentially perturbing ecosystems and their functioning in coastal waters (Kennish et al., 2023).
Anthropogenic climate change is impacting weather and climate extremes in every region across the globe. This leads to widespread adverse impacts on food and water security, human health, economies, and society, leading to related losses and damages affecting nature and people (IPCC, 2023). Flood events in river systems are occurring regularly due to seasonal variability in precipitation and snow melt with possible negative impacts on infrastructure in urban areas (Serinaldi et al., 2018).
Massive flood events in Europe (such as in August 2002 and June 2013) have generated billions of euros in damage. As a consequence, discussions about strengthening of dikes and levees, and creating additional buffer areas, have intensified. Hydrological extremes in the densely populated Elbe catchment system have strong societal relevance, as they have the potential to create substantial infrastructural damage and threaten human life and livelihoods (Merz et al., 2014; Ionita et al., 2015). The rivers Ems, Weser and Elbe enter the German Bight at southeastern part of the North Sea. The mean annual long-term river runoff of Ems, Weser and Elbe is ~80, 330, and 710 m3/s, respectively. The seaward extension of the Elbe freshwater plume is much larger than that of the Weser and Ems. The plume extent and the location of the salinity front depend on seasonal and interannual discharge variability (Stanev et al., 2019; Kaiser et al., 2023).
Flood events in the Elbe River have historically been observed during all seasons. Our analysis of the events shows that there is a tendency for floods to occur more frequently in spring and summer, with the spring floods related to snowmelt. Table 1 lists historical peak runoff events for winter months (December, January, February) at the river gauge station Neu-Darchau at Elbe kilometer 536 (German kilometer count). The mean discharge at the Neu Darchau station is 689 m3/s and a flood event is defined with a discharge > 2500 m3/s. A maximum runoff of 2471 m3/s on January 04–2024 is in the range of typical winter flood events. The flood event in June 2013 with 4071 m3/s is also presented in the table, as an example.
Table 1
| Date | Max. Elbe runoff (m3/s) | Date | Max. Elbe runoff (m3/s) |
|---|---|---|---|
| 28.01.1907 | 2550 | 16.12.1974 | 2575 |
| 14.01.1917 | 2538 | 17.01.1982 | 2540 |
| 22.01.1920 | 2975 | 10.01.1987 | 2630 |
| 12.02.1923 | 2743 | 10.01.2003 | 2680 |
| 11.12.1939 | 2660 | 17.01.2011 | 2600 |
| 21.02.1941 | 3250 | 11.06.2013 | 4071 |
| 18.02.1946 | 2790 | 04.01.2024 | 2471 |
| 19.02.1948 | 2610 |
Flood events form the river Elbe with a winter discharge > 2500 m3/s; including the 2024 flood (in bold).
The average winter runoff from 1903–2024 is 815 m3/s. Elbe runoff data from Neu-Darchau (river kilometer 536) were supplied by the Federal Waterways Authority WSV in Magdeburg (personal communication).
A strong precipitation event, dubbed in the German press as the “Christmas Flood’’ occurred in winter 2023/24 in various Northern and Eastern German areas affecting the runoff volume in several watersheds, most notably the Elbe and Weser rivers. The German Weather Service (DWD) described the winter flood 2024 as follows: “In the northern part of Germany, heavy precipitation occurred in the period from 19.12.2023 to 5.1.2024, which brought double or more than the usual average monthly rainfall amounts for December and January (1991–2020). This led to widespread flooding in the Ems, Weser and Elbe rivers and their tributaries. A prevailing westerly current continuously brought low-pressure systems and humid air masses from the Atlantic to Central Europe. …… The event was characterized by the relatively large region affected and the long duration of 18 days in total with only a few interruptions in the rain. The event was favored by the high sea surface temperatures in the North Atlantic, which reached a new record level in 2023. An attribution study provides preliminary evidence that climate change has made the occurrence of comparable monthly averages more likely for the affected region” (Kaspar et al., 2024).
In the present study, we assessed whether the “Christmas Flood’’ event in winter 2023/24 agreed with the passive pipe, pulse-shunt concept of (Raymond et al., 2016), causing a distinct increase in the export of nutrients and carbon from land to sea during the severe flood events. For that, we performed a longitudinal sampling campaign following a Lagrangian approach along the freshwater River Elbe, the Elbe estuary around Hamburg, and the German Bight. We measured salinity and water temperature, nutrient and chlorophyll concentrations after a period of heavy rain and during the peak of the flood in winter 2023/2024.
2 Data and methods
At the beginning of the study the important question was with which data the current flood 2023/24 should be compared with. We looked for several data sources and data availabilities and finally decided to compare the monthly means of the flood months with the monthly means from previous years. We included data from research cruises as well as from fixed monitoring stations within the rivers, estuary and coastal area.
2.1 River Elbe
In the freshwater stretch of the River Elbe, sampling was performed in the middle of the river at eleven sites from bridges (Figure 1A). Sampling started at Bad Schandau (river km 12 according to German kilometer count) on December 28, 2023 and finished in Lauenburg (km 570) on January 4, 2024. Sampling was performed shortly before the highest water level at the respective sites (few cm or few hours) so that the sampling followed the flood peak on its way downstream.
Figure 1
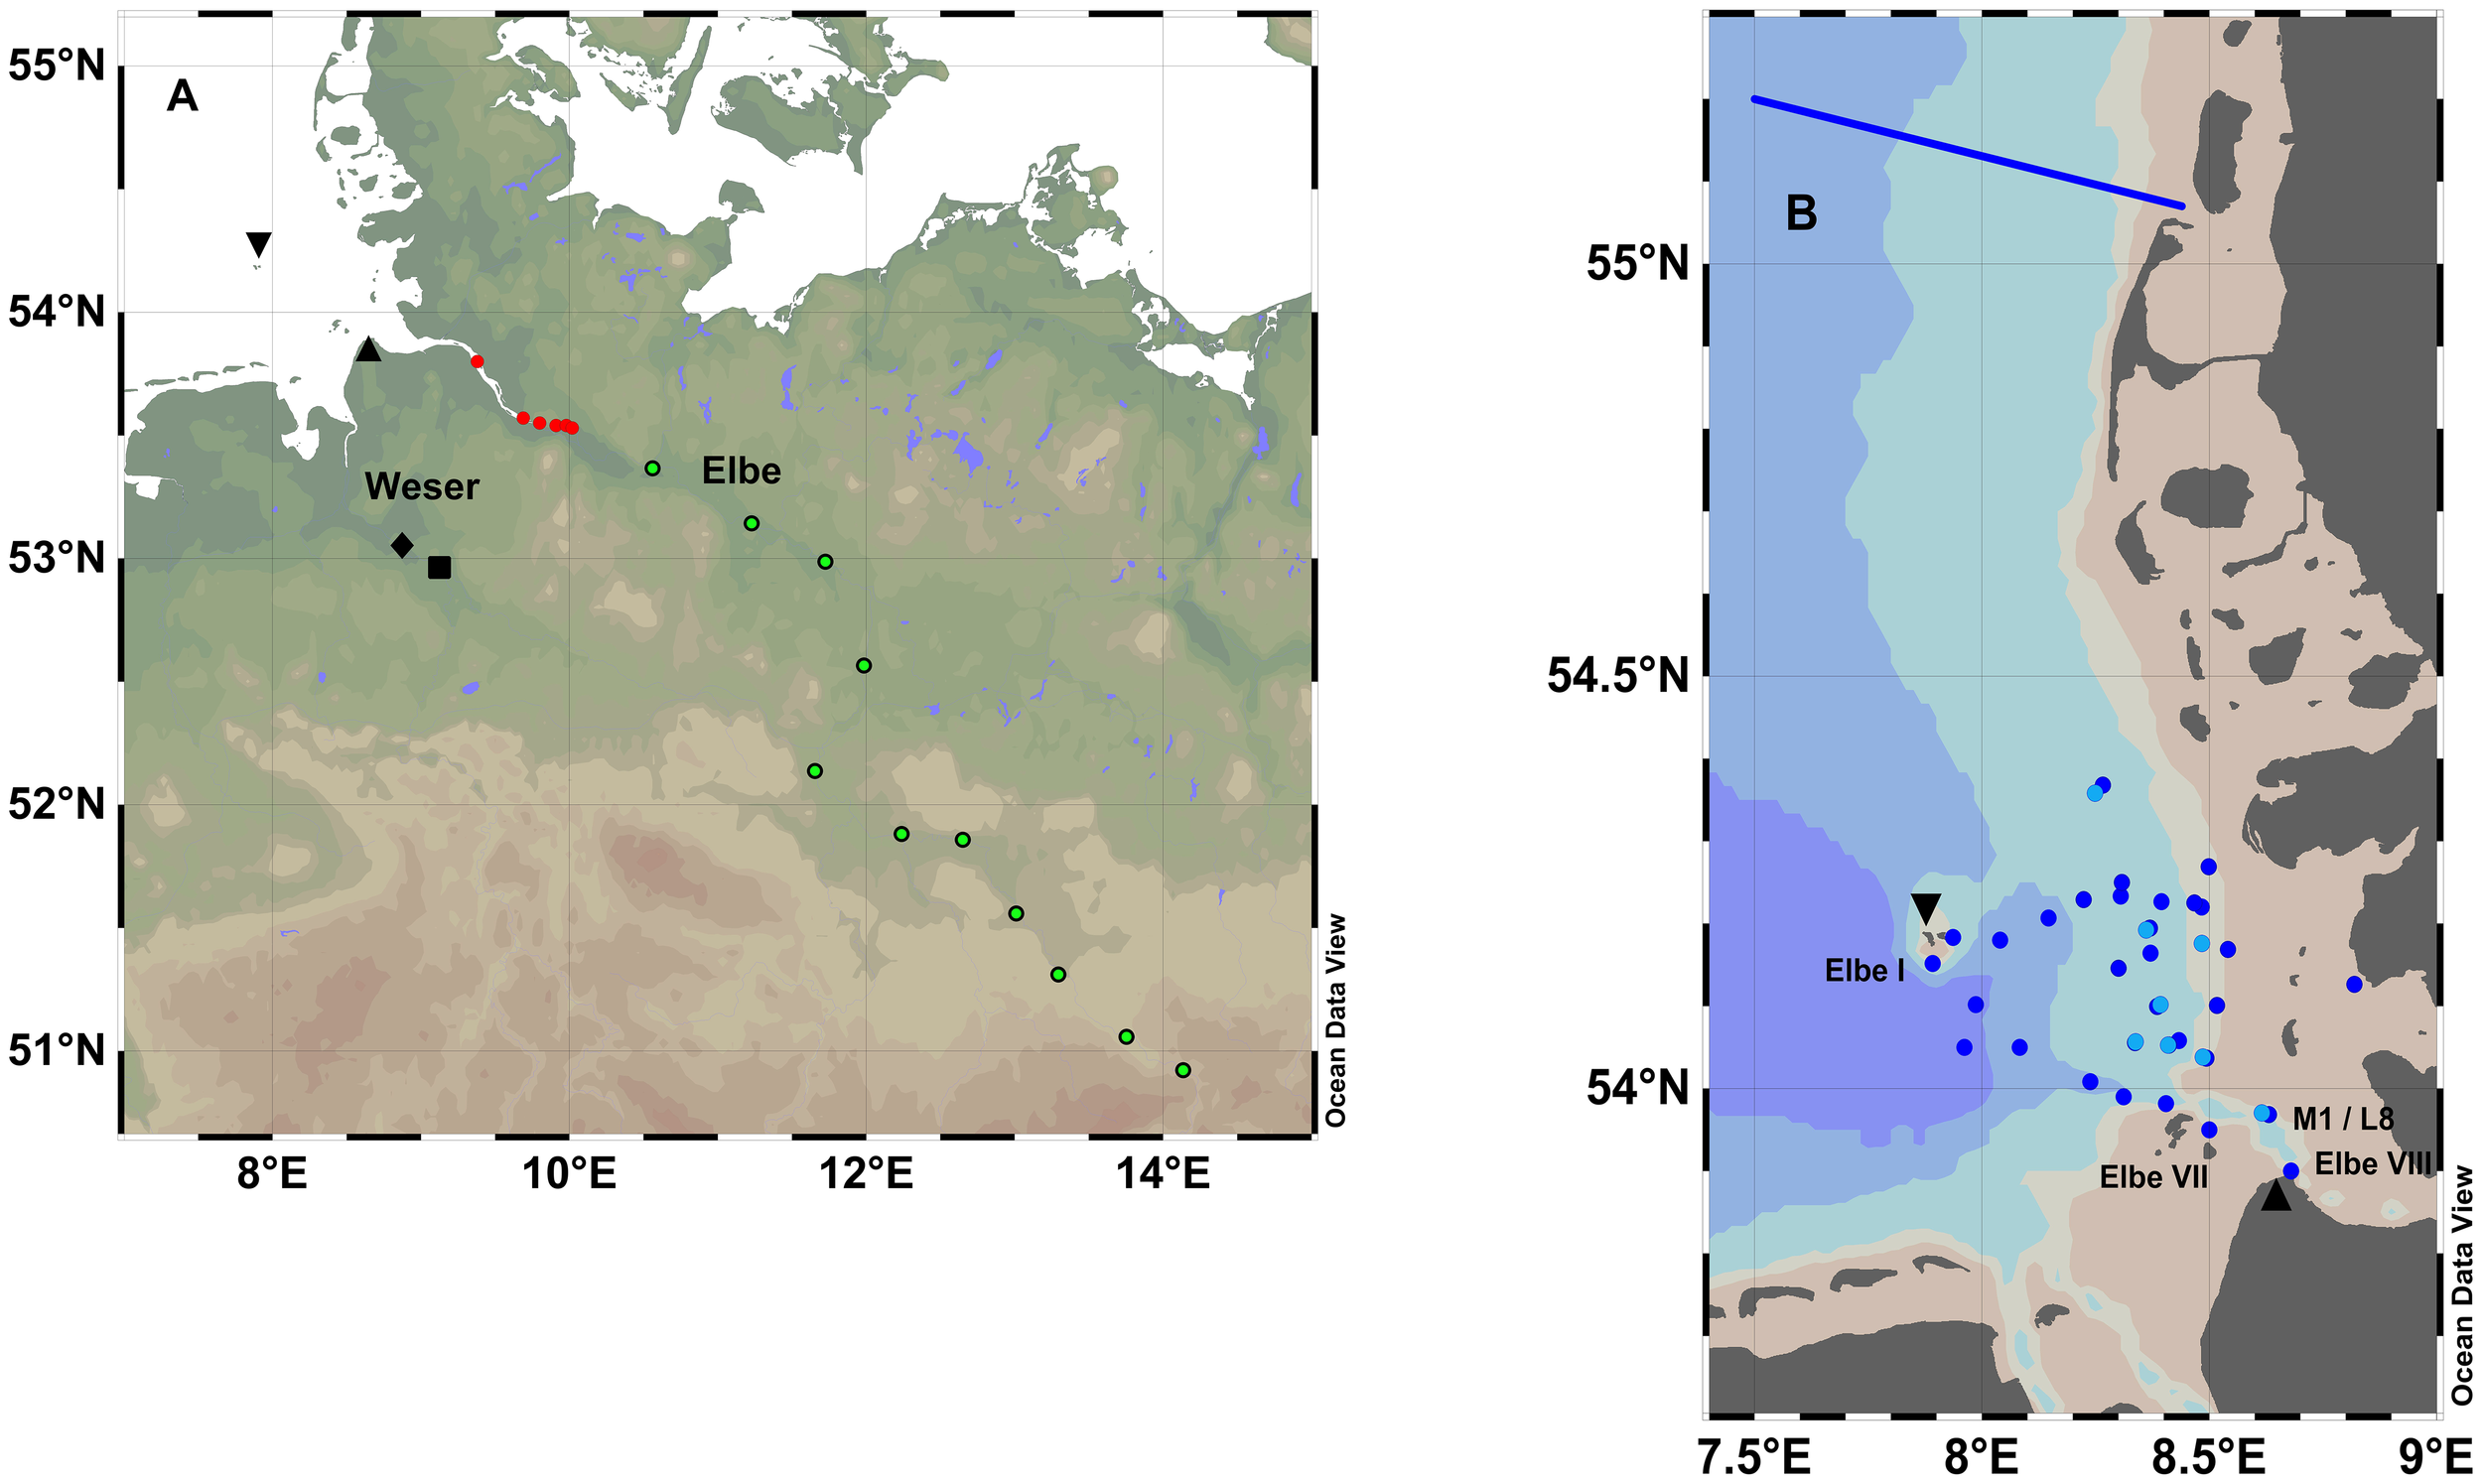
Study area with sampling locations at the rivers (A) green dots indicate sampling from bridges in the river Elbe from 28.12.2023 - 04.01.2024, red dots indicate sampling from ferry and HPA ships in the tidal Elbe from 10 and 11.01.2024. The Weser stations are depicted as diamond (Hemelingen) and square (Intchede). Black triangles show the long-term fixed stations at Cuxhaven and at Helgoland (inverted triangle). Close up for the marine study area (B) blue dots indicate sampling in January 2024, light blue for sampling with RV Littorina, dark blue for sampling with RV Mya. Indicated are also the stations covered by the monthly transects (Elbe I, Elbe VII and VIII). Black triangles show the long-term fixed stations at Cuxhaven and at Helgoland (inverted triangle); the blue line shows the monthly transects off Sylt.
Water temperature, oxygen saturation, pH, conductivity, and chlorophyll fluorescence were measured using a multiparameter probe (EXO2, YSI). Cooled water samples were transferred to the laboratory and analyzed the next day. Nitrite, nitrate, and silicate were photometrically determined using the segmented flow technique. Total and reactive phosphorous were measured using the ammonium molybdate spectrometric method. Inorganic, organic and total carbon concentrations in the filtered and unfiltered original water samples were analyzed based on high temperature oxidation using Non-Dispersive InfraRed -detection as described in (Kamjunke et al., 2013). Chlorophyll a concentration was measured by high performance liquid chromatography after calibration with commercial standards (Kamjunke et al., 2021). Data on river discharge were obtained from the German Federal Waterways and Shipping Administration (WSV; personal communication).
2.2 Elbe estuary
A boat provided by Hamburg Port Authority was used to take water samples on January 10 and 11, 2024. On January 10, the ship moved from the port of Wedel upstream towards the Elbe bridges in the city of Hamburg and took six nutrient samples at roughly equidistant locations. On the following day, we used the Elbe ferry from Wischhafen to Glückstadt where the crew allowed us to take samples in mid-stream. A multiparameter probe was used to monitor temperature and salinity, but due to a malfunction the data could not be saved and are thus unavailable. The nutrient samples were analyzed with a Seal autoanalyser.
2.3 River Weser
Discharge data from the Weser at Intschede were provided from Wasserstraßen- und Schifffahrtsamt Weser (Hannoversch Münden, personal communication). Nutrient data for the station in Hemelingen were provided by the federal state of Bremen (Die Senatorin für Umwelt, Klima und Wissenschaft der Freien Hansestadt Bremen, Bremen, personal communication). Nutrients were analyzed as described in (Akkreditierungsstelle, 2024). The station Intschede is located at km 331 and 52.9636°N 9.1254°E ; the station Hemelingen is located at km 361 and 53.0528°N 8.8745°E (Figure 1A).
2.4 Underwater station Helgoland (MarGate)
The underwater station Helgoland features a 270 x 80 m area at a depth of 5 to 10 m, located approximately 0.5 km north of the island of Helgoland (54.183°N 7.867°E, Figure 1B) (Dummermuth et al., 2023). This site includes a cabled underwater node system developed as part of the COSYNA project (Baschek et al., 2017), providing power and network access for long-term deployment of sensors and scientific equipment. Key hydrographic parameters - such as temperature, salinity, and chlorophyll-a fluorescence, - are measured at a frequency of 1 Hz (Fischer et al., 2020). All parameters undergo rigorous quality control procedure (Waldmann et al., 2022) and are available in the form of annual datasets on PANGAEA (https://www.pangaea.de/?q=helgoland+fischer+margate).
2.5 Station Cuxhaven
At the estuarine mouth of the Elbe in Cuxhaven (53.877°N 8.705°E, Figure 1B) a stationary FerryBox system is operated. The FerryBox system has a water inlet from which seawater is pumped into the analyzer containing multiple sensors for temperature, salinity, chlorophyll-a fluorescence (Petersen, 2014; Rewrie et al., 2025). The data are collected with high frequency (10 min per data set) and undergo rigorous quality control before being published at the Helmholtz Coastal Data Center (HCDC).
2.6 Butendiek transects
As an extension north of our main research area, we included also data obtained by the Butendiek Transects at the island of Sylt. Once per month the RV Mya II starts from List (Sylt) and heads towards the north-west at about 7.5°E. These cruises are conducted since 2020 (Bussmann et al., 2021). On board is a FerryBox which measures continuously hydrographic parameters (temperature, salinity, chlorophyll-a fluorescence). Data are available at https://dship.awi.de/.
2.7 Ship cruises in January 2024
In anticipation of the flood wave from the rivers, we organized two coastal surveys, with the RV Mya II (AWI) from 17 to 18.01.2024 followed by the RV Littorina (GEOMAR) from 25. to 29.01.24 (Figure 1B). On both ships, a laboratory container was installed with a FerryBox for temperature, salinity, chlorophyll-a fluorescence. In addition, surface water samples were taken for nutrients, as described previously (Bussmann et al., 2024). Nutrient samples were analyzed according to (Grasshoff et al., 1983) and chlorophyll a concentration was measured by HPLC (High pressure liquid chromatographie, Wiltshire et al., 1998).
2.8 Helgoland transect cruises
Monthly surveys have been conducted in the German Bight since the 1980s and are embedded in the long-term observatory Helgoland Roads. In this framework, physico-chemical oceanographic data are collected along a transect from Helgoland Island to the Elbe estuary. To evaluate the Elbe flood in winter 2023/24, the stations Elbe I, VII and VIII (Figure 1B) over the period 2015–2024 were included in this analysis. At all stations, surface water was collected at 1 m depth using a rosette sampler with 5 L Niskin bottles attached to a multiparameter probe (SST-CTD90, Sea & Sun Technology, Germany). For determination of nutrients, samples were analyzed according to (Grasshoff et al., 1983) and chlorophyll-a by HPLC (Wiltshire et al., 1998).
2.9 Backtracking of water masses
We applied backward trajectories to acquire insight into the origin of the marine water bodies and to check if they originated from the estuaries. Data were retrieved from the Hereon drift app (https://hcdc.hzg.de/drift-now/). The calculations in this application are based on simulations using the Lagrangian offline transport program PELETS-2D (Callies, 2021) and 2D marine currents extracted from the archived output of the 3D hydrodynamic Federal Maritime and Hydrographic Agency (Bundesamt für Seeschifffahrt und Hydrographie model, BSHcmod). The data input into the model was marine currents with 0.6% wind drag and travel time of 14 days in the top layer.
3 Results
In this study, sensor data and nutrient analyses from different laboratories were used. Freshwater samples were analyzed according well defined (German) regulations (DINs). The marine laboratories regularly participated in cross-laboratory comparisons. The sensors were calibrated by the manufacturers on a regular basis. In addition, the data analyses compared data sets from different years and not between different areas/laboratories.
3.1 Extension and duration of the flood (physical dynamics)
The winter flood 2023/24 started in the rivers Elbe and Weser. At the gauge in Neu-Darchau (Elbe) a maximum discharge of 2471 m3/s was measured on 04.01.2024. An average discharge for January 2024 of 1860 ± 424 m3/sec was determined, which is about three times higher than the average January discharge for the years 2019-2022. At the gauge in Intschede (Weser) a maximum discharge of 2640 m3/s was measured on 30.12.2023 and an average discharge of 1133 ± 525 m3/s for January 2024. This is about four times higher than the average January discharges for the years 2019-2022 (Figures 2a, b). Data on the hydrography along the Elbe in winter 23/24 are shown in Supplementary Figure S1.
Figure 2
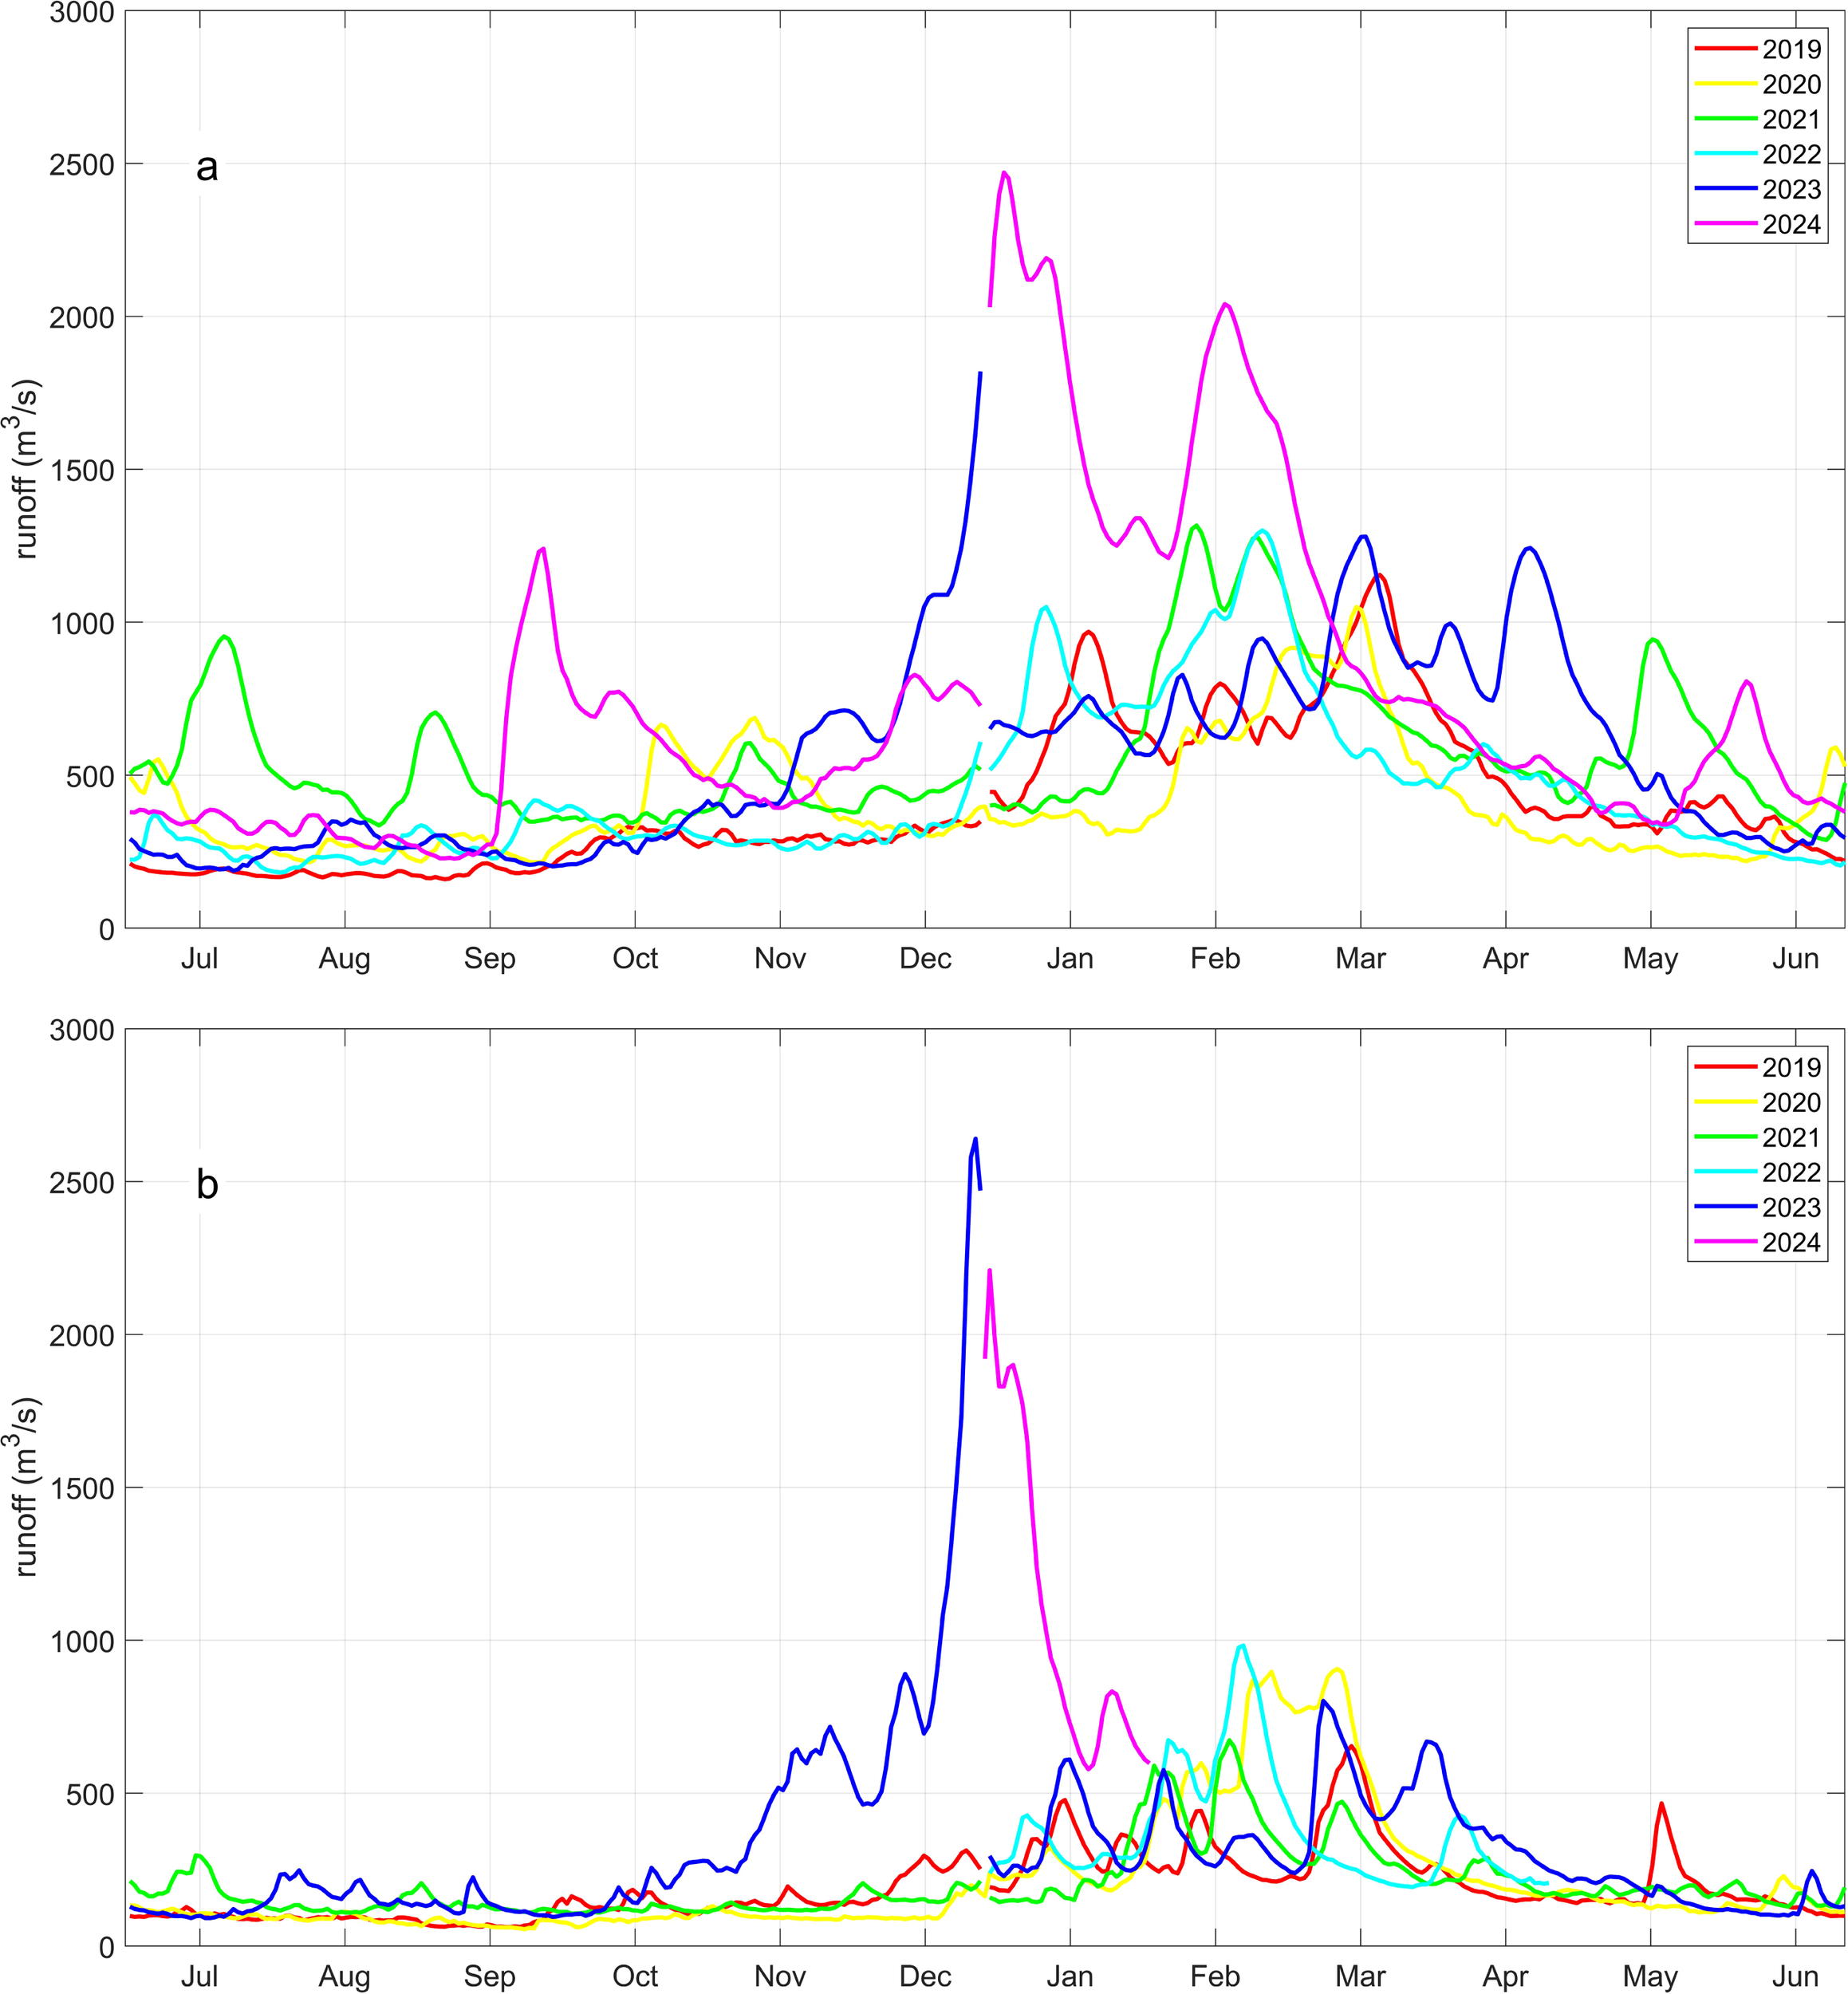
Discharge of the River Weser at Intschede (a) and for the River Elbe (b) for the period 2019-2024. The flood is indicated by the blue line (end of 2023) and the pink line (beginning of 2024).
This high freshwater input from the Elbe and Weser resulted in a decrease in salinity at the estuarine station Cuxhaven. The salinity minima in Cuxhaven as represented in the dark blue boxes in Figure 3, coincide with the high discharge events (Table 1) for the river station of Neu-Darchau. The minimum in salinity at Cuxhaven occurred on January 05 2024. The lowest salinity was observed in January 2024 (11.2 ± 5.4) compared to an average salinity of 19.1 ± 4.7 from January 2016 – 2023. However, strong easterly winds in January pushed the Elbe plume offshore influencing salinity values at the stations of Cuxhaven and Helgoland. During March, the salinity values were again in agreement with longer term conditions.
Figure 3
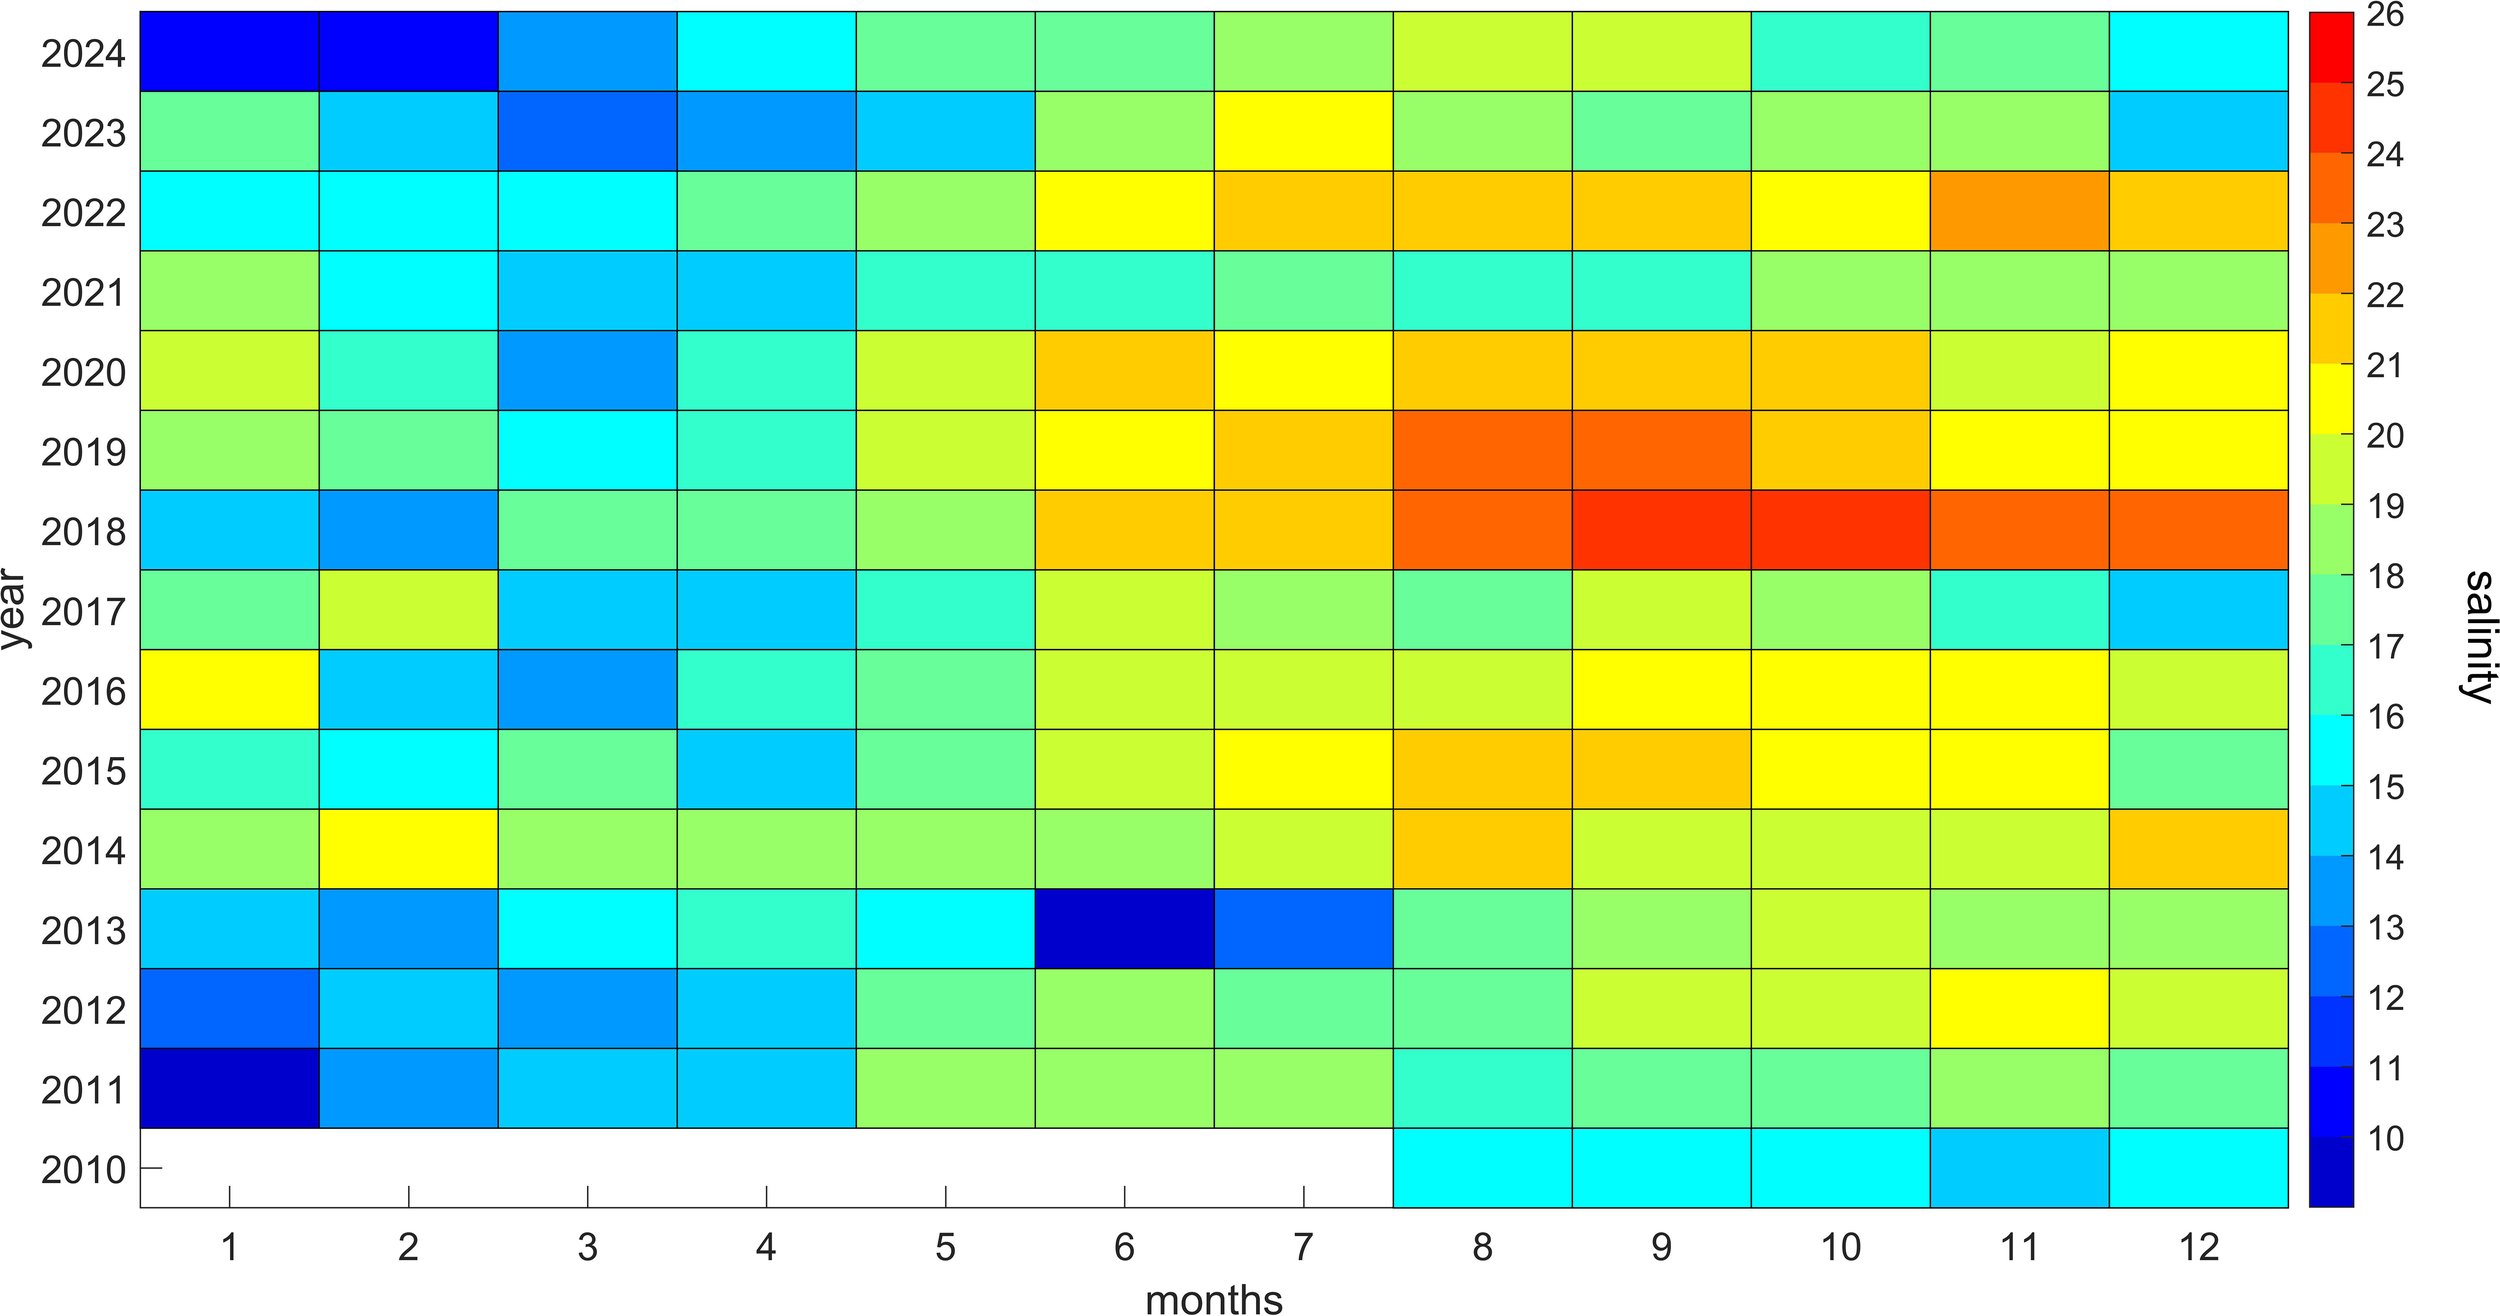
Monthly mean salinity at Cuxhaven for the period 2010 to 2024. The data are also shown as box plots in Supplementary Figure S2.
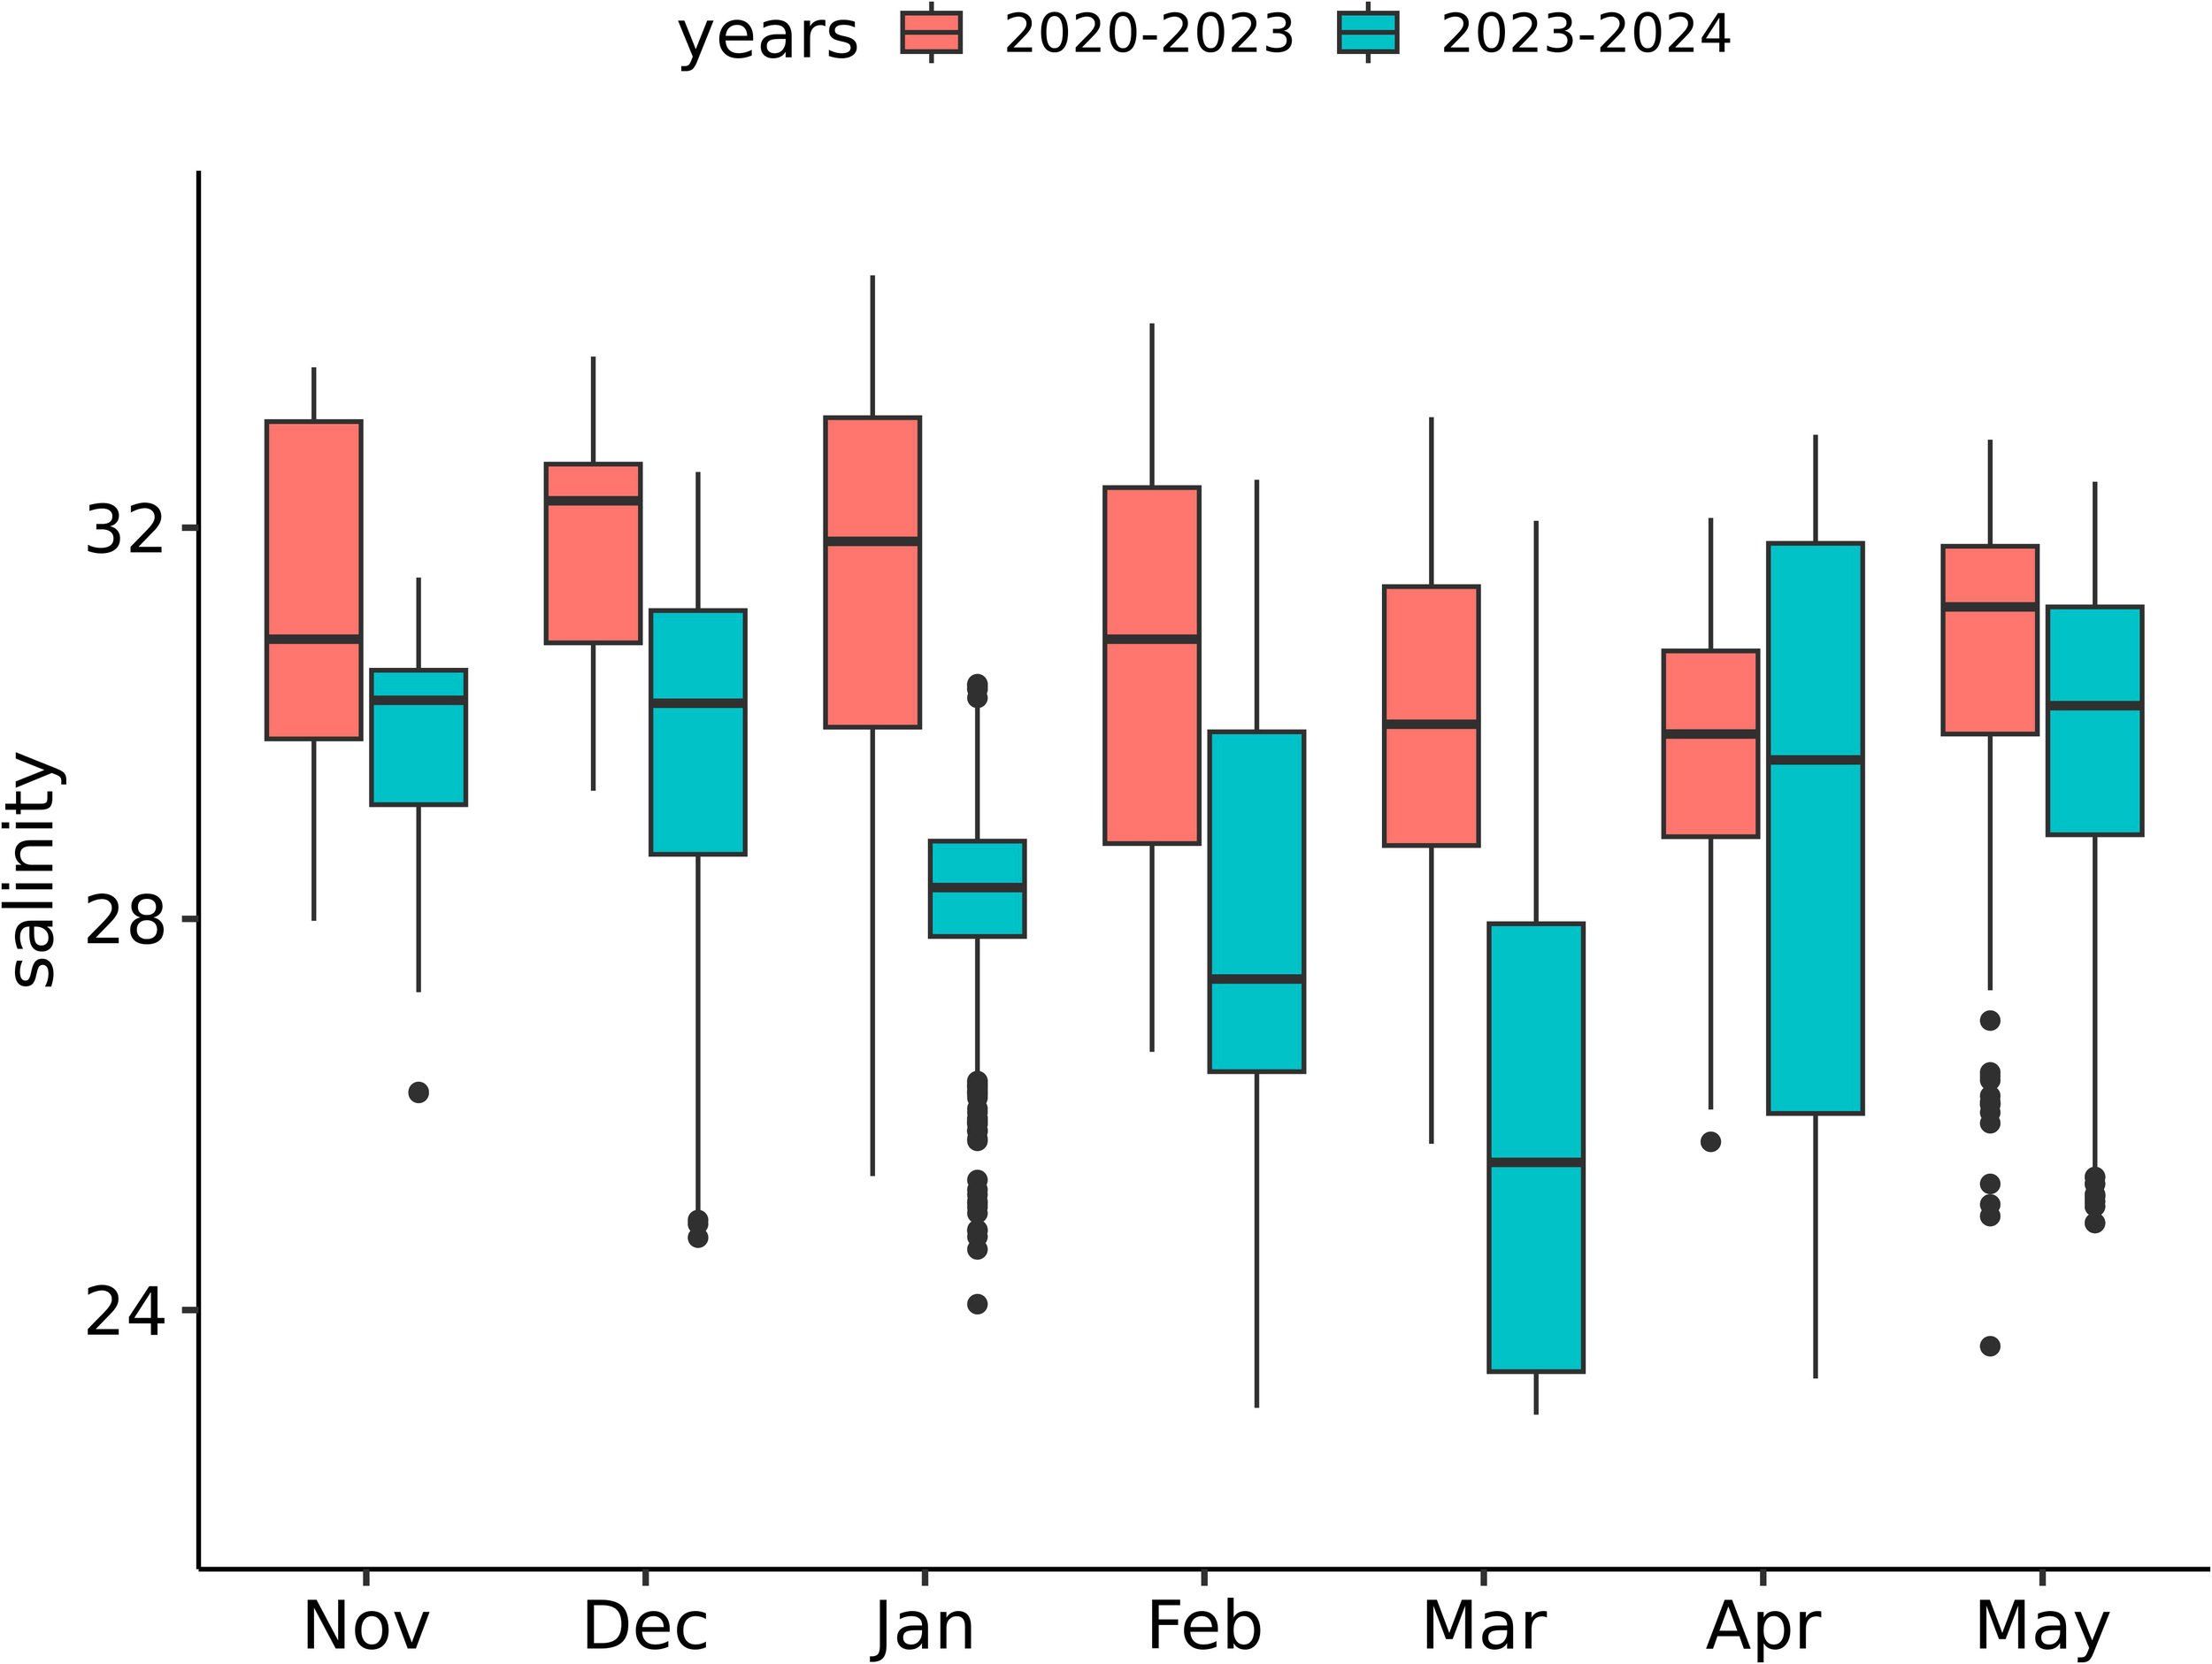
The marine station Helgoland is located at about 60 km distance northwest from Cuxhaven (Figure 1B). In the period December 2023 to May 2024, the water showed a lower salinity (about 2 units) compared to previous years (2016 - 2023) (ANOVA df=1, F=202, p<0.001). Over this time period, the lowest average salinity was observed in January 2024 with 31.3 ± 0.5 compared to an average salinity of 32.7 ± 0.7 for the years 2016 to 2023 (Figure 4). In contrast to salinity, the average water temperatures for the season 2023–2024 were significantly higher compared to the average of 2016 to 2023 but only for the period February to May (p < 0.01) and not in December and January (Supplementary Figure S3).
Figure 4
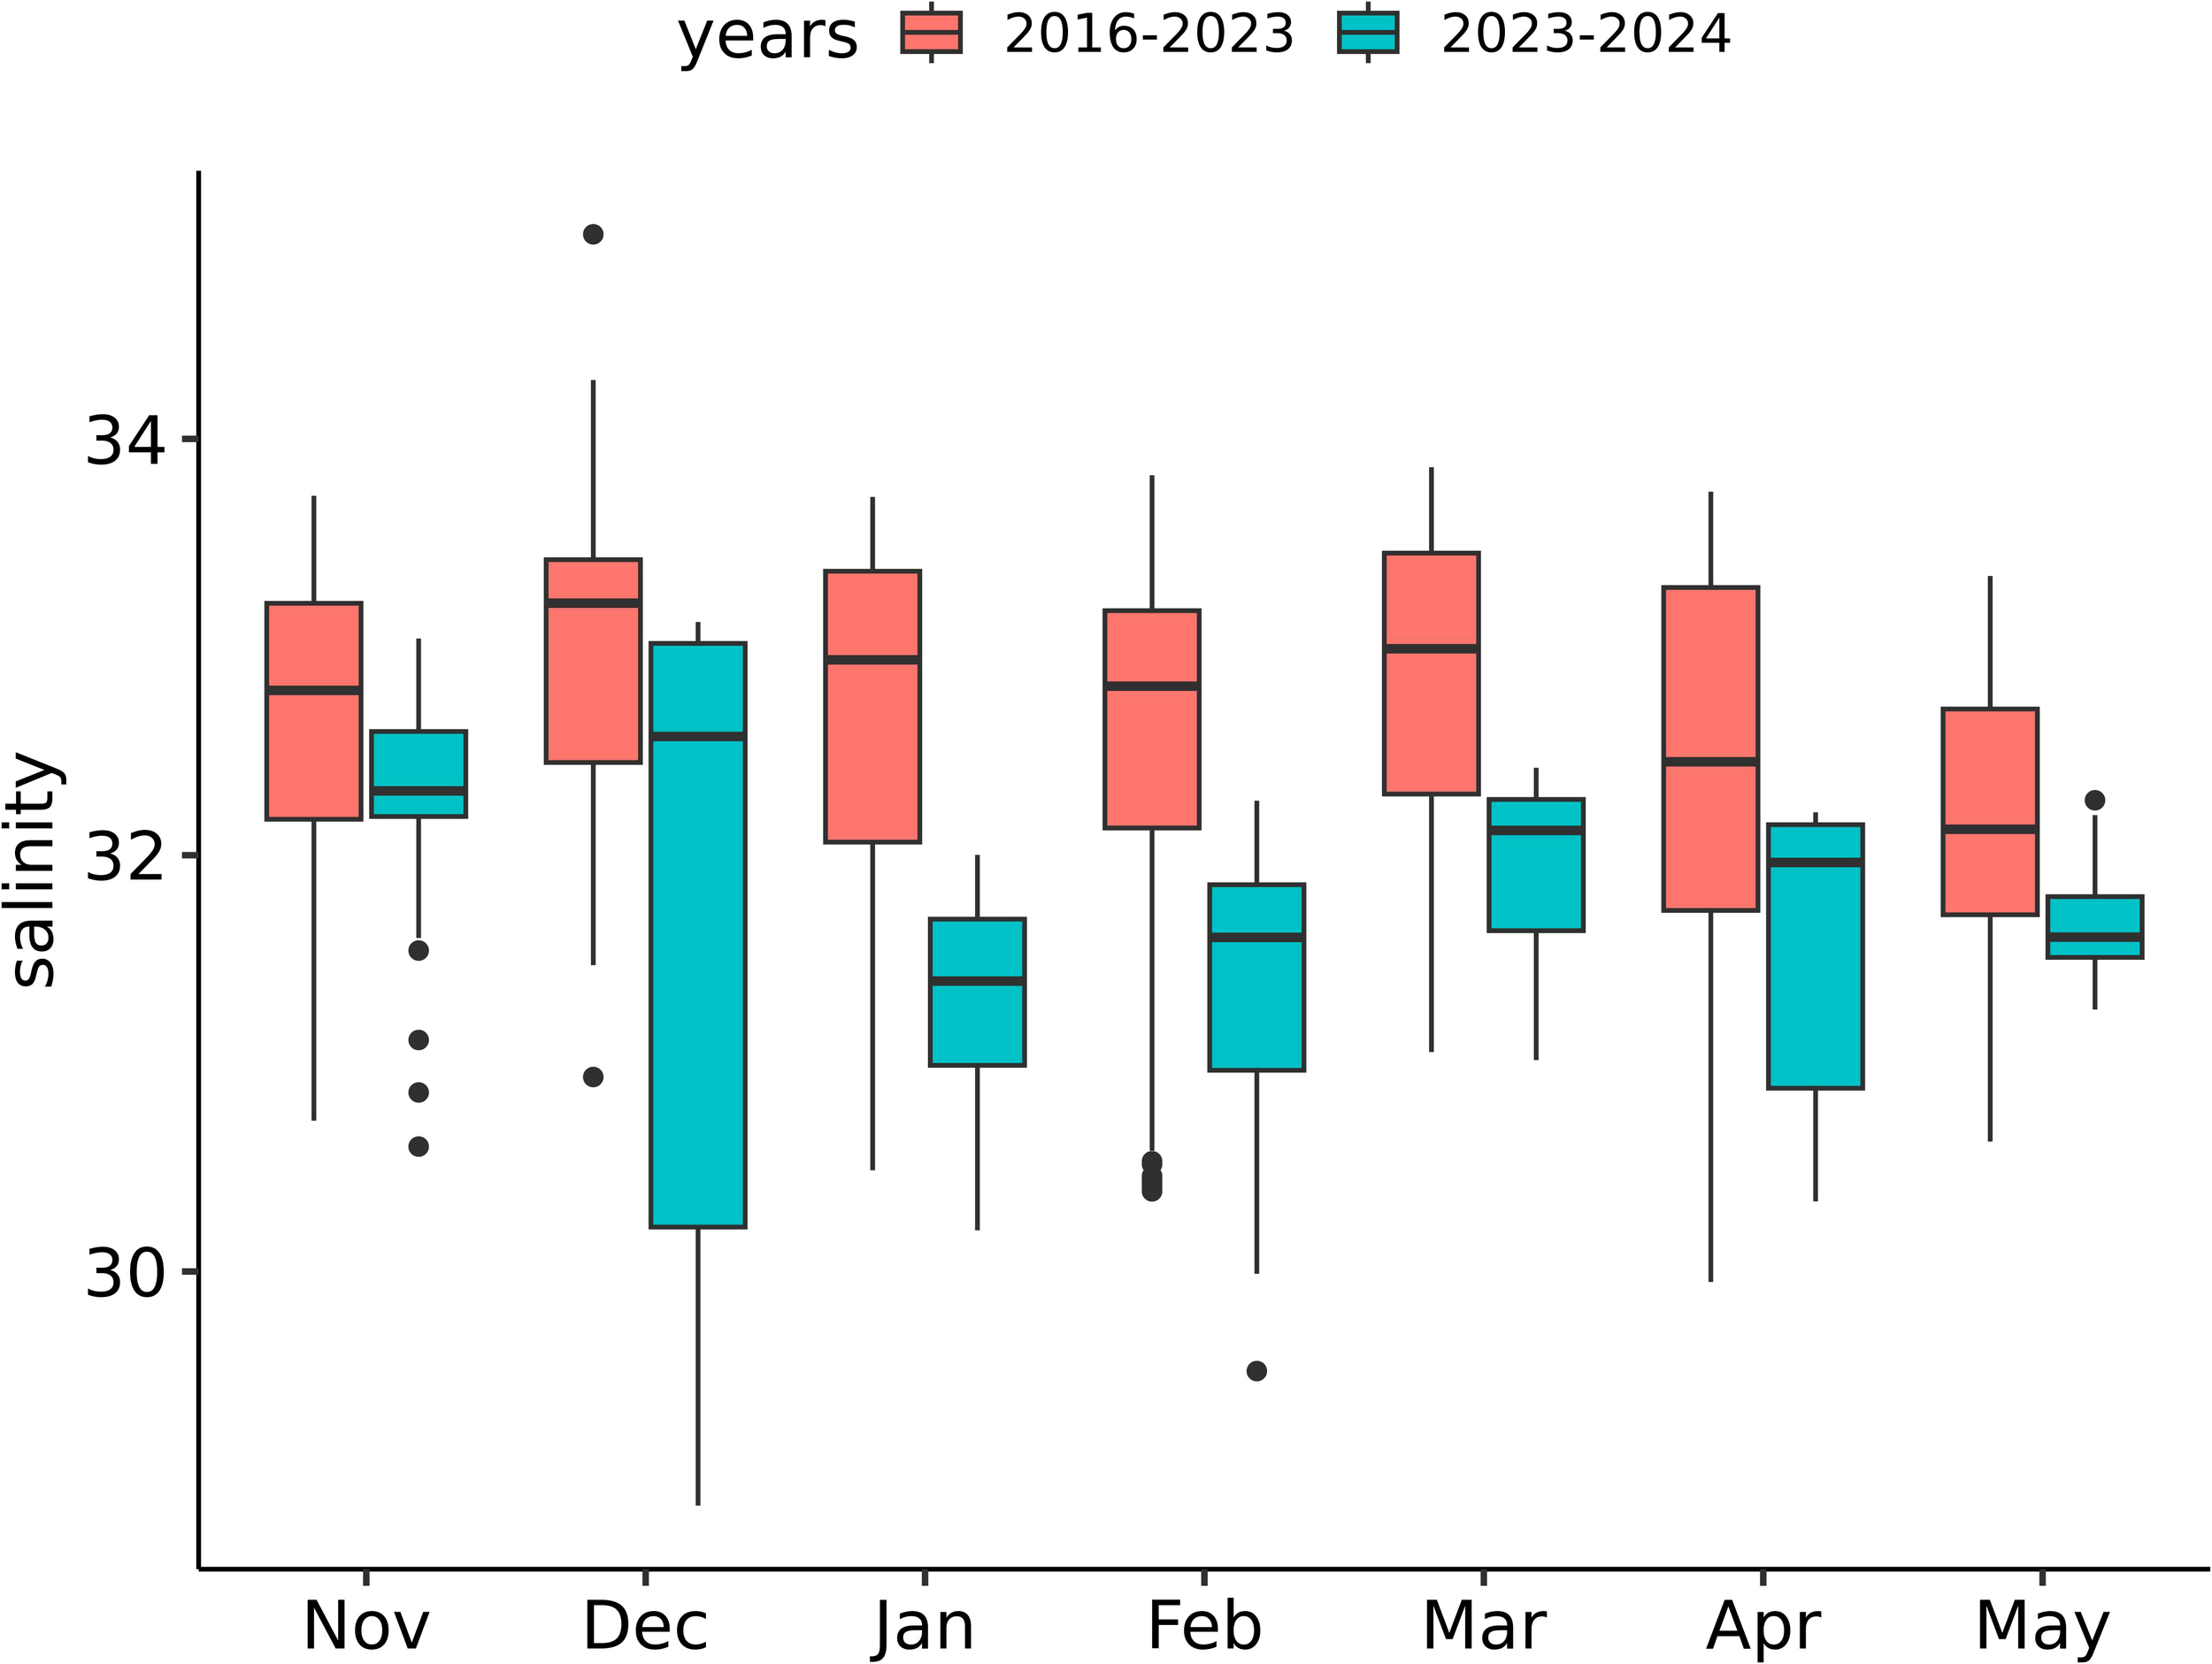
Box plots for salinity at Helgoland station from November to May 2023/2024 (green) compared to the long-term average from November to May from 2018/2019 to 2022/2023 (red). The box plots show the median (line), the 25 and 75 percentiles with lower and upper limits of the box and outliers (dots).
The Butendiek Transects at the island of Sylt are located at the northern boundary of our study area, at a distance of ca. 130 km from Cuxhaven. From December 2023 to May 2024 the salinity was significantly lower than in previous years (2020-2023) (ANOVA df=1, F=5807, p<0.001, Figure 5). The lowest salinity was recorded in March 2024 with 26.0 ± 2.9 compared to 30.0 ± 1.8 in previous years (Welch df=790 t=33.6, p<0.001=). In April and May salinity was still lower, but the difference was only 1 unit. Average monthly temperatures revealed no clear differences between winter 2023/24 and previous years.
Figure 5
Box plots for salinity for the Butendiek Transects off Sylt from November to May 2023/2024 (green) compared to November to May 2020-2023 (orange). The box plots show the median (line), the 25 and 75 percentiles with lower and upper limits of the box and outliers (dots).
3.2 Inputs of nutrients
To determine the influence of the river floods on the ecosystems through increased nutrient availability we focused on the three main nutrients, nitrate, silicate, and phosphate.
In the Weser we observed a slightly lower concentration of nitrate in January 2024 compared to the average January values for 2010-2023, (271 ± 14 µmol/L versus 321 ± 29 µmol/L nitrate). The concentrations of phosphate however were similar (1.29 ± 0.65 µmol/L phosphate versus 1.61 ± 0.97 µmol/L phosphate). No silicate data is available for the Weser. As the maximum discharge in January 2024 was much higher (2210 m3/sec) than in previous years (262 m3/sec), the loads for nitrate and phosphate from the river into the coastal waters increased by a factor of 10.
For the Elbe, we investigated the longitudinal dynamics (Figure 6). While concentrations of particulate organic carbon, total phosphorus and also chlorophyll a decreased from upstream to downstream regions (Supplementary Figure S1) due to decreasing flow velocity, concentrations of nitrate and dissolved silicate did not change and that of phosphate increased only slightly. We compared the data set from the fixed station at Magdeburg for the flood period with the average values. In December 2023, nitrate concentrations were higher (331 µmol/L nitrate) compared to previous years (269 ± 41 µmol/L in 2018/19-2022/23). The concentrations of phosphate however were lower (1.58 µmol/L phosphate) compared to 2.20 ± 0.32 µmol/L phosphate in previous years. For silicate, concentrations in 2024 were slightly higher than in previous years. As the maximum discharge at Neu Darchau in January 2024 was much higher (2471 m3/sec) than in previous years (549 m3/sec, 2019 - 2223), the loads for nitrate and phosphate increased 6–3 times.
Figure 6
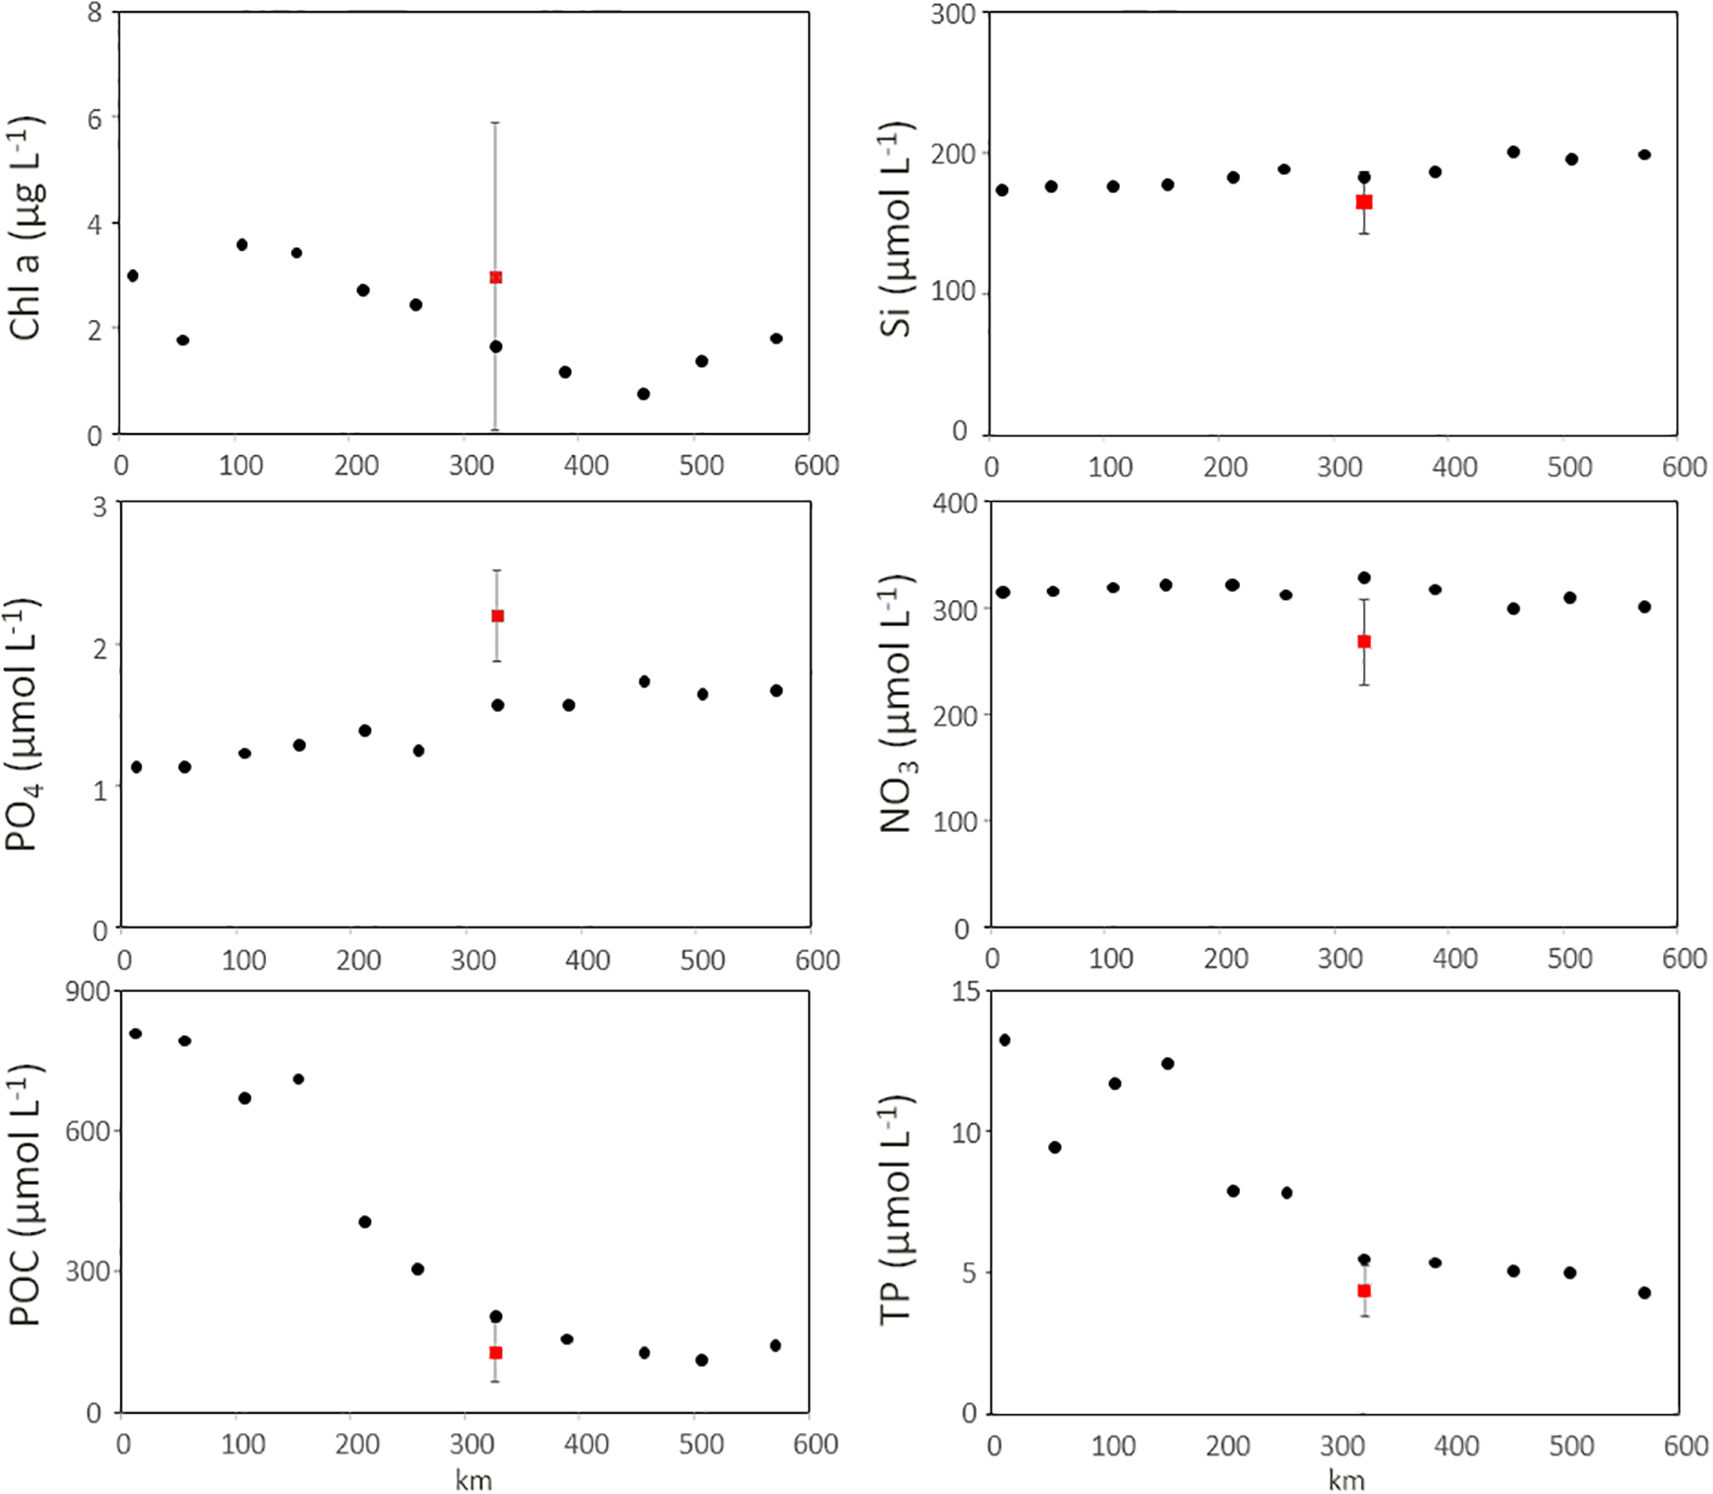
Chlorophyll a (Chl-a), dissolved silicate, phosphate, nitrate, particulate organic carbon (POC), and total phosphorus (TP) along the freshwater Elbe between Bad Schandau and Lauenburg in 2023/2024 (black dots). The red squares are showing the average and SD values of the winter values (Dec-Feb) at Magdeburg from 2018/19 - 2022/23.
In the estuary, we compared stations we visited on January 19 and January 29–2024 with the nearby stations Elbe VII and Elbe VIII which are sampled by the Helgoland Transect cruises (Figure 1B). In January 2024 the concentrations of nitrate were higher (210.2 and 126.1 µmol/L) compared to previous years (59.6 ± 22.3 µmol/L). The same pattern was obvious for silicate, with high concentrations in January 2024 (130.7 and 61.0 µmol/l) compared to previous years (54.2 ± 18.6). In contrast, similar concentrations of phosphate were observed in January 2024 (1.7 and 1.3 µmol/L) and in previous years (1.6 ± 0.6 µmol/L). When relating the data from the estuary with salinity, we observed a dilution of the nutrient rich(er) river water with nutrient-poor North Sea water (for phosphate, nitrate and silicate) and the observed differences for nitrate and silicate diminished within ten days (Supplementary Figure S4).
In the marine area (at Helgoland) we compared the data from station Elbe I from previous years (2015 - 2023, n = 7) with the survey in February 2024 (only one data point). In February 2024, nitrate concentrations were much higher (25.9 µmol/L) than in previous years (6.0 ± 2.5 µmol/L). By contrast, phosphate concentrations in February 2024 (0.7 µmol/L) were similar to those in previous years (0.6 ± 0.3 µmol/L). In February 2024, silicate concentrations were much higher (15.5 µmol/L) than in previous years (9.5 ± 2.7 µmol/L; Figure 7).
Figure 7
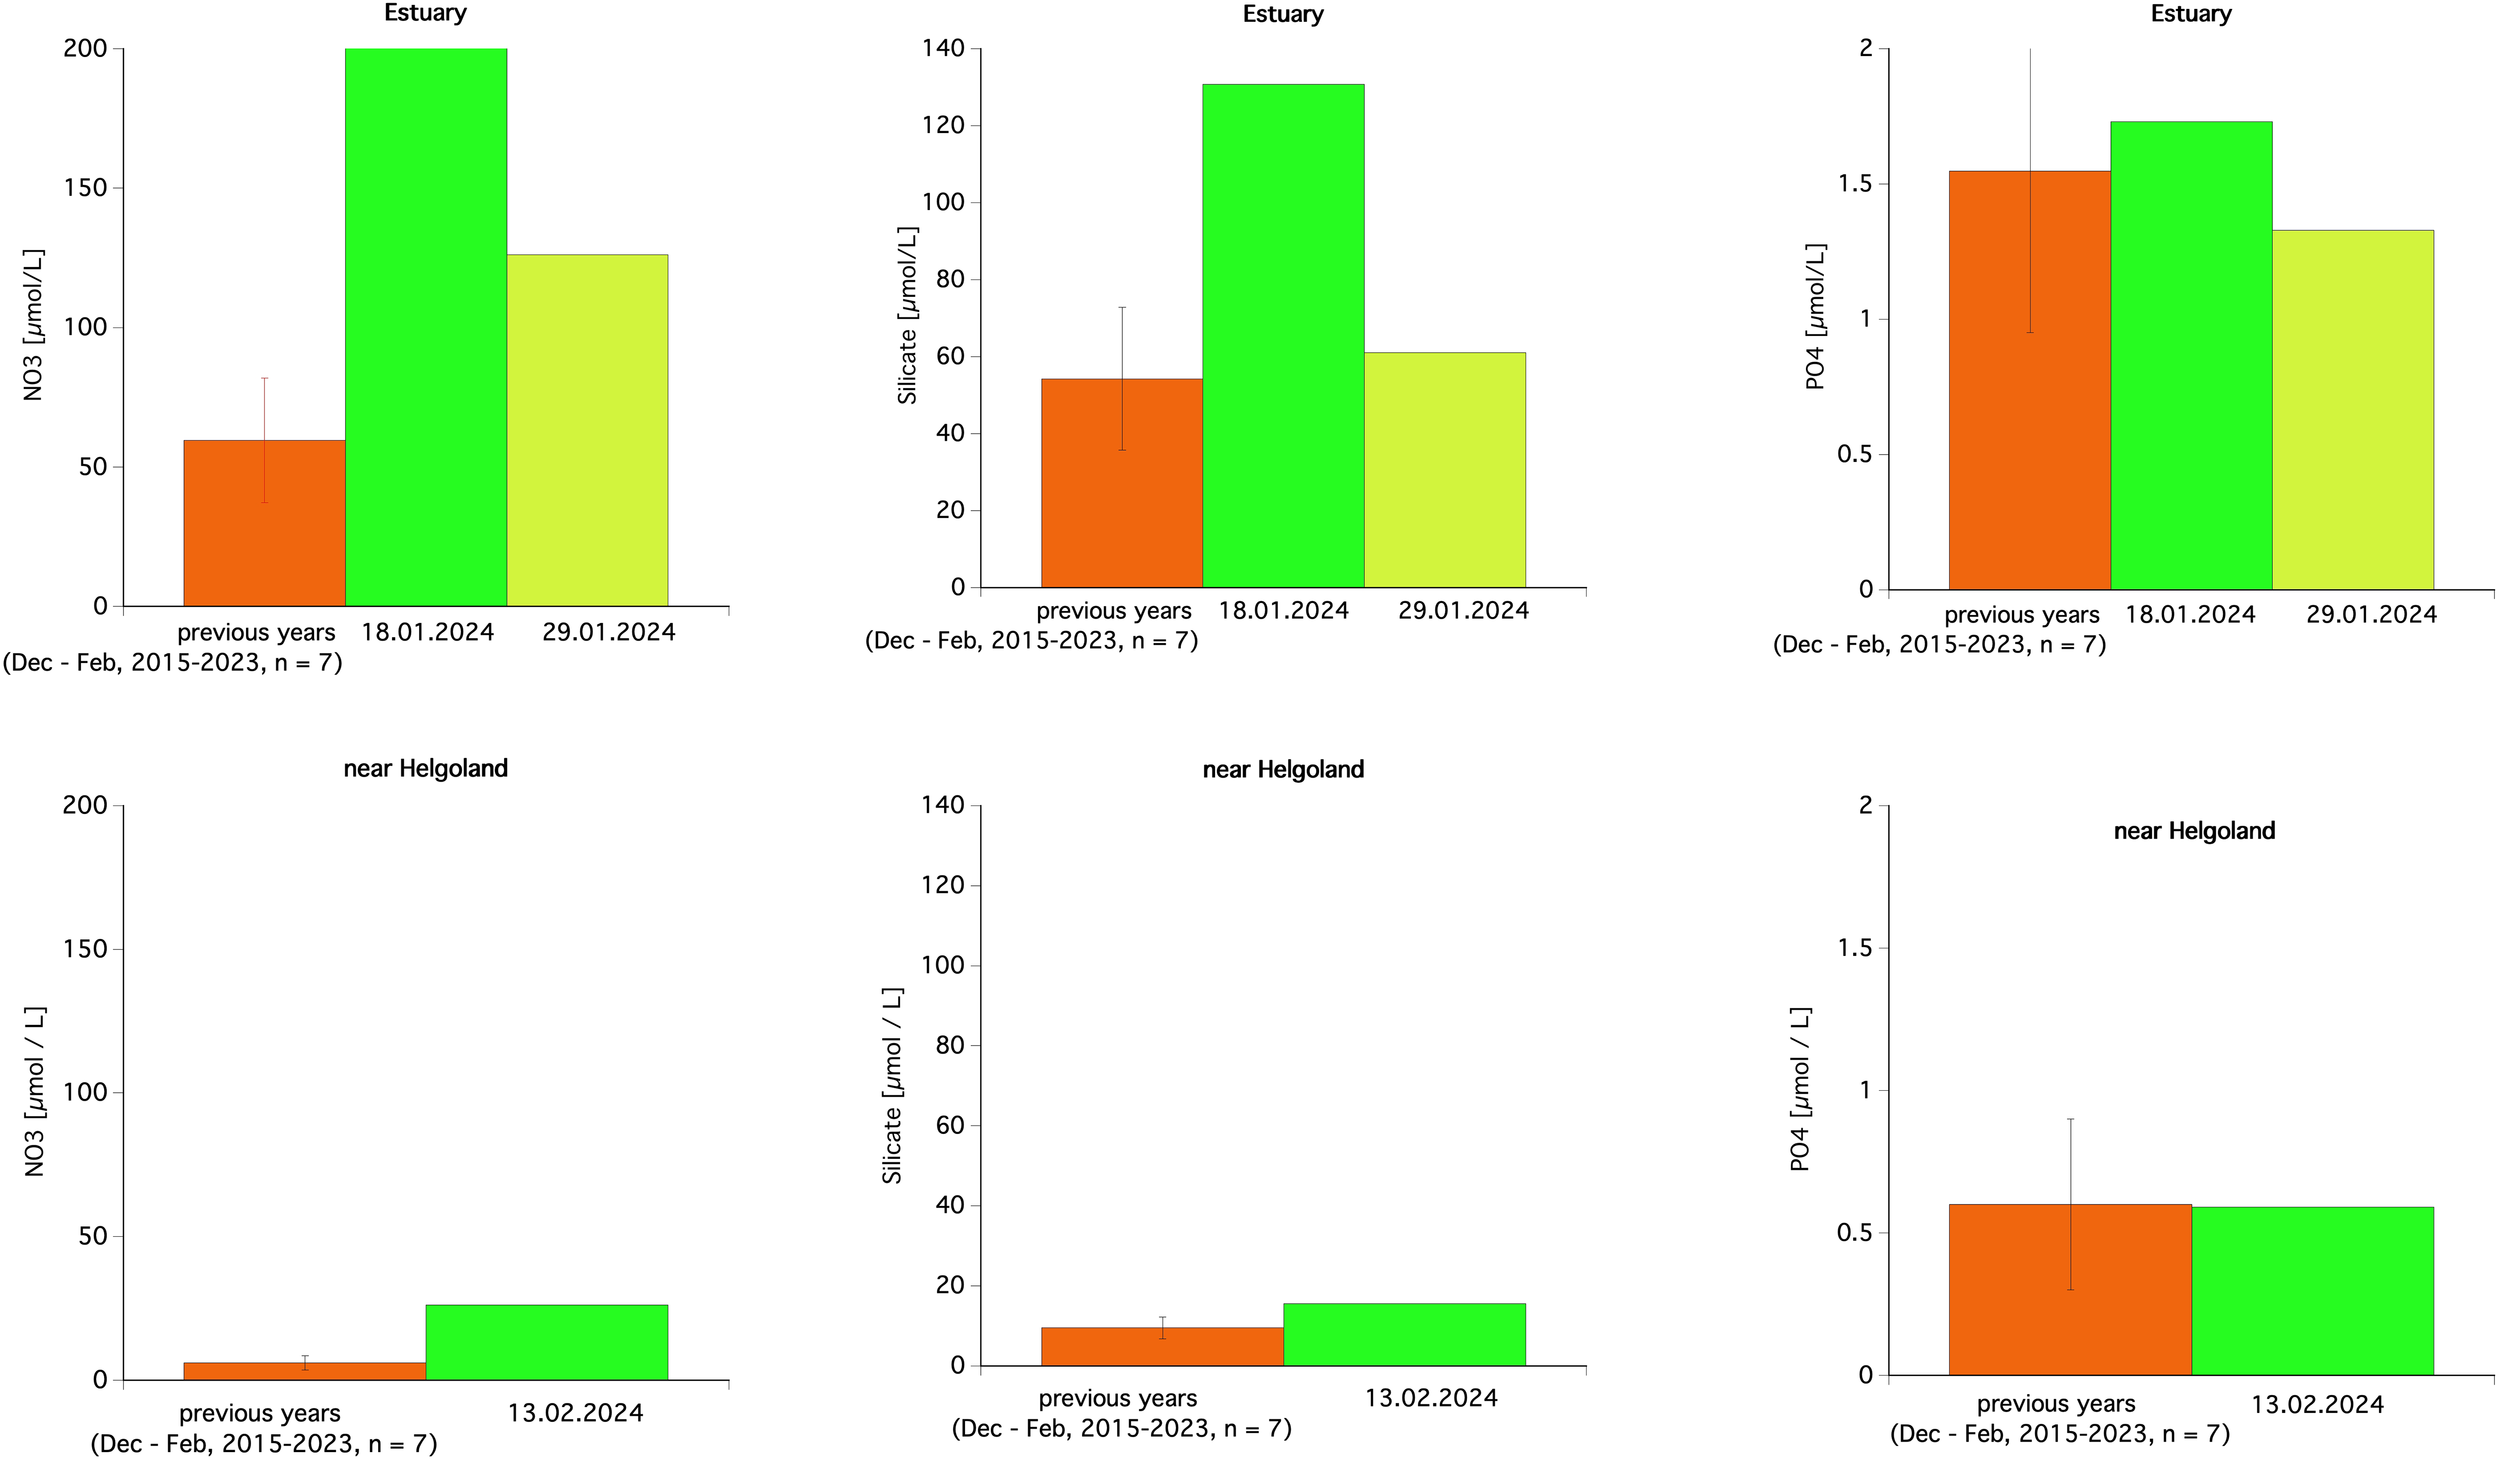
Comparison of the nutrient concentration in winter 2024 (green) with data from previous years (orange), for the estuary (upper panels, station Elbe VII, VIII versus stations M1, L8 from Supplementary Figure S1) and at Helgoland (lower panels, station Elbe I from Figure 1B); for nitrate (left panels), silicate (middle panels) and phosphate (right panels).
Therefore, in winter 2024 we observed a strong supply of nutrients from the rivers into the coastal waters, due to the increased freshwater discharge and enhanced river concentrations of nitrate and silicate. Within the estuary and coastal waters, the nutrients were quickly diluted as shown in Supplementary Figure S4, indicating that without significant modifications by biogeochemical processes the nutrients were spread in the study area. However, the elevated concentrations were still detectable in the marine area.
3.3 Effects on chlorophyll/biomass
In a next step we checked if the increased nutrient load was detectable at the first trophic level, i.e., chlorophyll-a concentration as a proxy for phytoplankton abundance. Unfortunately, there is much less data available for chlorophyll compared to nutrient and hydrographic data. Reliable data were available only from the UW Station Helgoland node off Helgoland.
For the winter and spring period (November to May) significant differences between the chlorophyll-a fluorescence in the year 2023–2024 and in previous years (2016 - 2023) were observed at Helgoland station (Figure 8, ANOVA, df=1, F06.65, p = 0.05). In the winter months from November to February the average chlorophyll-a fluorescence in 2023–2024 were significantly lower (0.77 ± 0.15) compared to the 2016–2023 period (1.03 ± 0.49). In contrast, in March 2024 the chlorophyll-a fluorescence strongly increased to 2.9 ± 1.8 µmol/L and therefore almost twice as high compared to only 1.5 +/- 0.7 µmol/L observed in previous years. However, due to a high variability especially in March to May 2024, no significant differences could be detected (p > 0.05).
Figure 8
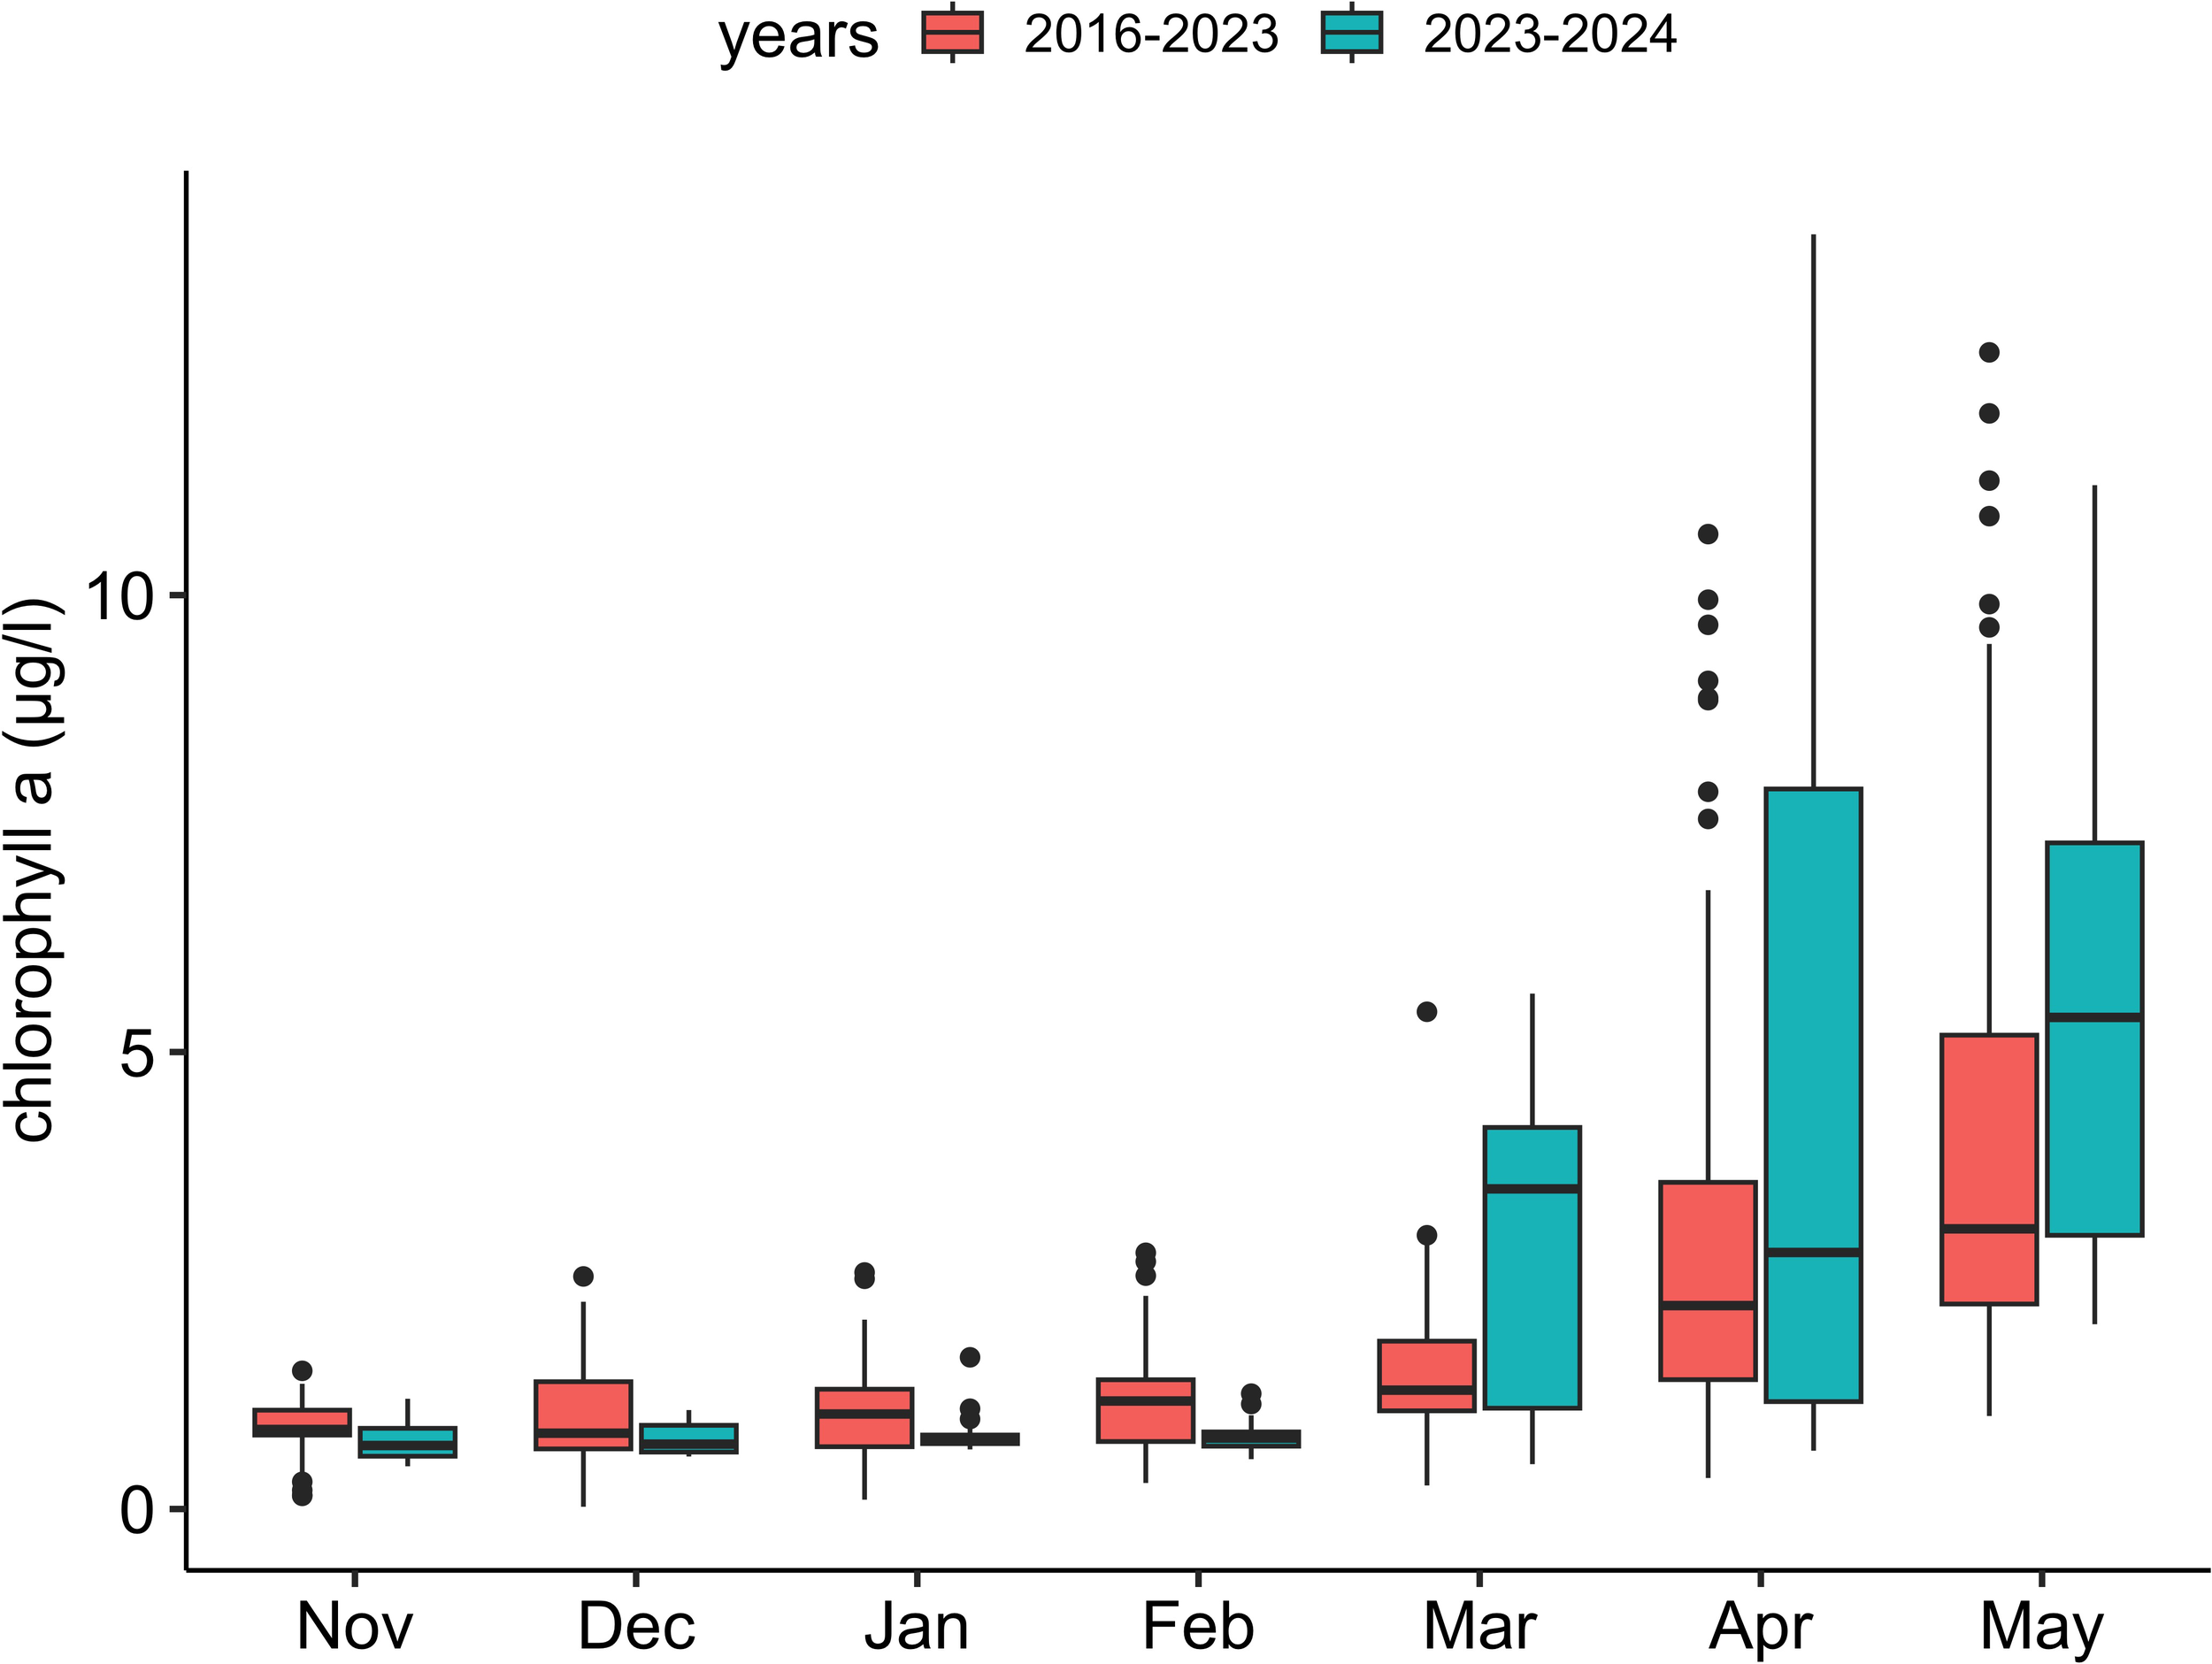
Average (+/- SD) of chlorophyll-a at Helgoland station from November to May 2023/2024 (green) compared to the long term average from November to May from 2018/2019 to 2022/2023 (red).
4 Discussion
In this study we show that the winter flood in the rivers Elbe and Weser in Northern Germany in winter 2023/24 had a significant impact on the coastal system of the German Bight (southern North Sea) in spring 2024. To assess these effects, we compared recent data with historical data provided by fixed monitoring stations and by regular research cruises. Therefore, we used the monthly means of the previous winter months as a sound baseline to compare the data obtained during the flood months.
4.1 Effects on the hydrography of the North Sea
The lowest salinity values were recorded during winter months of 2023/24, indicating the strongest influence of freshwater inputs from floodwaters. The strongest salinity reduction was observed in Cuxhaven (8 PSU), near Sylt the difference was 4 PSU and at Helgoland it was 1.5 PSU difference. This pattern mirrors the flow of the Elbe (and Weser) river plume. At Cuxhaven the Elbe enters the North Sea and then mainly flows along the coast in a northerly direction passing the island of Sylt (Stanev et al., 2019). In contrast, the water masses around Helgoland mostly originate from the English Channel (Stanev et al., 2019). With the app (https://hcdc.hzg.de/drift-now/), it is possible to simulate the water mass origins for specific times and locations within the German Bight. For the island of Helgoland for the period from January to March 2024, the application showed that in several cases the water mass did originate from the Elbe or Weser Estuary (Supplementary Figure S5). At Helgoland, the salinity reached its lowest values in January 2024 (31.4), while for Sylt this occurred 2 months later (26.0), in March 2024. However, by April, salinity levels had returned to typical values (32 and 29) at both locations, suggesting the flood’s impact on water composition lasted for about 3 months from January to March. In contrast to salinity, no significant differences were detected between water temperatures in previous years and water temperature in winter 2023/24.
Winter floods have been observed in our study area also in earlier times (Table 1) on a more or less regular decadal frequency. Nevertheless, not much is known about the biogeochemical impacts of such winter floods on the estuary and coastal waters. Flood seasonality has changed over recent decades i.e. maximum discharge occurs one month earlier and is seen as a decrease in spring maximum discharge and increase in winter flood peaks (i.e., 1987/88 versus 2021/22, for Latvian rivers flowing into the Baltic Sea; Apsīte et al., 2024). These alterations in annual flood occurrence point towards a shift in flow regime from snowmelt dominated to mixed snow–rainfall dominated run-off (Apsīte et al., 2024). Most river floods in northern Germany are controlled by a mixture of recent (7 d) and previous precipitation events (up to 180 d, i.e excessive soil moisture). For this mixture, floods occur mainly from January to April, with additional floods during the rest of the year. However, an increase in floods controlled by recent heavy precipitation has been observed for the last 70 years (Jiang et al., 2022). A change in flood mechanisms may affect the seasonality and magnitude of floods, which might ultimately impair the current flood risk management measures (Jiang et al., 2022). Climate warming is the primary driver of hydrological change, causing shifts in runoff seasonality in the Krkonoše Mountains (source of the Elbe river; Langhammer and Bernsteinová, 2025). Thus, seasonality and magnitude of floods in the Elbe estuary will also change in the future.
4.2 Increased nutrient load
In Winter 2023/24 we observed an increased input of nutrients into the German Bight, mainly due to the increased load of the nutrients from the rivers. Along the Elbe River dissolved nutrient concentrations were at a high level but stable. In contrast to other seasons, we did not observe a longitudinal growth of phytoplankton within the Elbe River during winter. Thus, no uptake of dissolved nutrients by phytoplankton was detected, and the nutrient concentrations remained high. This suggests that nutrient transport, rather than transformation or uptake, was the dominant biogeochemical process during this time. This is consistent with the pulse-shunt concept, which predicts the dominance of transport processes over matter transformation along the river under high discharge conditions (Raymond et al., 2016). However, due to the increased discharge from both the Elbe and Weser rivers, the nutrient load—specifically nitrate—increased dramatically, with loads increasing by 6 to 10 times their usual values. For the whole of January 2024, a total of 57,280 tons of nitrate and 620 tons of phosphate were discharged into the North Sea from the two rivers. Within the estuarine regions, the nutrients were diluted as they mixed with seawater. Despite this dilution, nutrient concentrations remained elevated further offshore, particularly around Helgoland, where enhanced nitrate and silicate concentrations were still detectable in February 2024. It is possible that this is in part due to the meteorological situation (predominantly easterly winds in January) as well as the limited growth of phytoplankton at low irradiation in winter. A similar situation is reported for the winter flood 1995 in the Elbe Estuary, and based on the distribution of boron, it was concluded that riverine water underwent simple mixing with North Sea water (Barth, 1998). For a French macrotidal estuary in the Bay of Brest, a high nutrient export is reported during winter floods (93%), while the estuary normally acts as efficient filter for nutrients (4 – 38%; (Raimonet et al., 2023).
4.3 Effects on phytoplankton growth of the North Sea
Limited chlorophyll data are available in the coastal study area to fully assess the impact of the flood on phytoplankton growth. The data that do exist show that chlorophyll concentrations were low during the winter months. However, in spring (March 2024), chlorophyll concentrations at Helgoland increased to 2.9 ± 1.8 µmol/L, which were higher than in previous years (1.5 ± 0.7 µmol/), suggesting an intensification of the spring bloom in 2024.
Flood events may affect phytoplankton biomass by supplying nutrients during periods when growth is not limited by light. When they occur in late winter, nutrient concentrations are maximal and do not limit growth (Poppeschi et al., 2022). However, winter floods may intensify light limitation due to increased turbidity and turbulence (Poppeschi et al., 2022). Covering the last 50 years of phytoplankton dynamics at Helgoland, reveals that phytoplankton in spring is mainly light limited and this limitation usually ends in the weeks 12 -16 (mid-March). Also, silicate is the main limiting nutrient for diatom growth near Helgoland (Wiltshire et al., 2015). In an experimental set-up with North Sea water, pulses of nutrient-rich freshwater increased the growth rate of the phytoplankton communities dependent on the initial community structure (Groß et al., 2022). This supports the postulation that the timing of the flood is essential. Therefore, we assume that the effects of the flood were still evident in early March, when there was enough light for a phytoplankton bloom to develop in the area around Helgoland.
In the vicinity of the island Sylt, about 130 km north from the river mouth, the lowest salinity was detected in March (26.0 ± 2.9). Even though no chlorophyll data are available for that region, we assume that the supplied nutrients together with the elevated light levels would have resulted in an enhanced phytoplankton growth. When nutrients are not utilized by phytoplankton in coastal waters, e.g. due to light limitation of primary production in winter, the fertilization effect may potentially propagate further offshore (Kessouri et al., 2024). Thus, we assume that for the German Bight the influence of the nutrient inputs is coupled to the advection of the riverine plume, and light conditions will determine the development of phytoplankton blooms.
The impact of summer floods differs from that of winter floods, as evidenced by the Elbe flood in June 2013. This resulted in strong stratification within the German Bight (Nguyen et al., 2024) and subsequently enhanced primary production (Voynova et al., 2017).
Beside the impacts of the 2023/2024 flood on the hydrochemistry and phytoplankton dynamics, it is likely that carbon chemistry and pollution in the German Bight were also affected. In the Elbe River, hydrological extremes have been reported to affect water quality (Barth et al., 2006; Baborowski et al., 2011; Wolschke et al., 2015; Baborowski and Einax, 2016). These aspects, however, will be explored in further studies.
5 Conclusion and outlook
In this study we described and evaluated the effects of a winter flood on the hydrography, nutrient load and phytoplankton biomass of the Elbe-German Bight system.
-
- The data availability and quality of our hydrographic parameters (temperature, salinity) was good, data availability of nutrients was sufficient to compare our recent data with previous data. In contrast, data availability on biological data should be improved to detect biogeochemical effects of winter floods. This may be achieved by better, automated sensors for longer-term monitoring of nutrients, carbon compounds, greenhouse gases, phytoplankton and higher trophic levels, as e.g. shown by Fischer et al., 2025 in an integrated underwater monitoring approach in the Arctic Ocean. Another option, at least for chlorophyll-a fluorescence could be remote sensing. However, winters in Northern Germany generally have only few days without cloud coverage and thus few data would be gained.
-
- As the timing between nutrient concentration increase and light limitation during a winter flood is crucial, the effects of a flood may be seen in even more distant areas; depending on advection of the flood plume and increasing light availability.
-
- When the seasonality of river floods is changing due to climate change this crucial timing may also change, and effects on primary producers and further trophic levels are as yet unconstrained.
Statements
Data availability statement
The original contributions presented in the study are included in the article/Supplementary Material. Further inquiries can be directed to the corresponding author. Data from the UW laboratory Helgoland are available on Pangaea, (https://www.pangaea.de/?q=helgoland+fischer+margate). Data from the Station Cuxhaven are available at https://noosportal.bsh.de/, http://codm.hzg.de/codm. Water sample analyses from January 2024 (nutrients, DOC, POC, TA and chlorophyll) are published in Pangaea (https://doi.pangaea.de/10.1594/PANGAEA.982247).
Author contributions
IB: Conceptualization, Formal analysis, Funding acquisition, Investigation, Writing – original draft, Writing – review & editing. HB: Conceptualization, Funding acquisition, Writing – original draft, Writing – review & editing. GF: Conceptualization, Formal analysis, Investigation, Writing – original draft, Writing – review & editing. PF: Conceptualization, Formal analysis, Funding acquisition, Investigation, Writing – original draft, Writing – review & editing. SJ: Conceptualization, Investigation, Writing – original draft, Writing – review & editing. EA: Conceptualization, Funding acquisition, Writing – review & editing. KC: Investigation, Writing – review & editing. IK: Investigation, Writing – review & editing. TS: Investigation, Writing – review & editing. BR: Investigation, Writing – review & editing. YV: Investigation, Writing – review & editing. NK: Conceptualization, Formal analysis, Funding acquisition, Investigation, Writing – original draft, Writing – review & editing
Funding
The author(s) declare that financial support was received for the research and/or publication of this article. We acknowledge funding from the Helmholtz Association in the framework of the Helmholtz-funded observation system Modular Observation Solutions for Earth Systems (MOSES). This study was supported by grant no. 03F0954B and 03F0954A of the Federal Ministry of Education and Research (BMBF) as part of the DAM mission “mareXtreme”, project ‘ElbeXtreme’.
Acknowledgments
We thank the crew and colleagues from WSA (Elbe runoff), the HPA (Hamburg Port Authority), the Hygiene Institute of Hamburg and NLWKN (Lower Saxony Water Management, Coastal Defence and Nature Conservation Agency) for providing the necessary data and ships. We are also grateful to the FRS ferry company who runs the ferries from Glückstadt to Wischhafen for the possibility to take water samples during a ferry transect. Special thanks are extended to Iris Krippstapel from the Flussgebietsgemeinschaft Weser (Weser River Basin Community) for her expertise. We also wish to thank the ship coordinators and ship crews from AWI and Geomar to allow for our short-hand cruises and for their work at the cold and stormy North Sea. Discharge data were kindly provided by the German Federal Waterways and Shipping Administration (WSV) and communicated by the German Federal Institute of Hydrology (BfG).This study is part of the Helmholtz program Changing Earth, subtopic 4.1: Fluxes and transformation of energy and matter in and across compartments.
Conflict of interest
Author BR was employed by SeaTerra GmbH.
The remaining authors declare that the research was conducted in the absence of any commercial or financial relationships that could be construed as a potential conflict of interest.
The author(s) declared that they were an editorial board member of Frontiers, at the time of submission. This had no impact on the peer review process and the final decision.
Generative AI statement
The author(s) declare that no Generative AI was used in the creation of this manuscript.
Publisher’s note
All claims expressed in this article are solely those of the authors and do not necessarily represent those of their affiliated organizations, or those of the publisher, the editors and the reviewers. Any product that may be evaluated in this article, or claim that may be made by its manufacturer, is not guaranteed or endorsed by the publisher.
Supplementary material
The Supplementary Material for this article can be found online at: https://www.frontiersin.org/articles/10.3389/fmars.2025.1599007/full#supplementary-material
References
1
Akkreditierungsstelle D. (2024). Anlage zur Akkreditierungsurkunde D-PL-14356-01–00 nach DIN EN ISO/IEC 17025:2018. Berlin, Germany: Deutsche Akkreditierungsstelle
2
Apsīte E. Elferts D. Lapinskis J. Briede A. Klints L. (2024). Changes in magnitude and shifts in timing of the Latvian river annual flood peaks. Atmosphere15 (9), 1139. doi: 10.3390/atmos15091139
3
Baborowski M. Büttner O. Einax J. W. (2011). Assessment of water quality in the Elbe River at low water conditions based on factor analysis. Clean Soil Air Water39, 437–443. doi: 10.1002/clen.201000373
4
Baborowski M. Einax J. W. (2016). Flood-event based metal distribution patterns in water as approach for source apportionment of pollution on catchment scale: Examples from the River Elbe. J. Hydrol.535, 429–437. doi: 10.1016/j.jhydrol.2016.01.077
5
Barth S. (1998). 11B/10B variations of dissolved boron in a freshwater-seawater mixing plume (Elbe Estuary, North Sea). Mar. Chem.62, 1–14. doi: 10.1016/S0304-4203(98)00023-1
6
Barth J. A. Stichler W. Bergemann M. Reincke H. (2006). Can conductivity and stable isotope tracers determine water sources during flooding? An example from the Elbe River in 2002. Int. J. River Basin Manage.4, 77–83. doi: 10.1080/15715124.2006.9635278
7
Baschek B. Schroeder F. Brix H. Riethmüller R. Badewien T. H. Breitbach G. et al . (2017). The coastal observing system for Northern and Arctic Seas (COSYNA). Ocean Sci.13, 379–410. doi: 10.5194/os-13-379-2017
8
Beusen A. H. W. Bouwman A. F. Van Beek L. P. H. Mogollón J. M. Middelburg J. J. (2016). Global riverine N and P transport to ocean increased during the 20th century despite increased retention along the aquatic continuum. Biogeosciences13, 2441–2451. doi: 10.5194/bg-13-2441-2016
9
Bussmann I. Anselm N. Brix H. Fischer P. Flöser G. Geissler F. et al . (2021). “The MOSES Sternfahrt expeditions of the research vessels ALBIS, LITTORINA, LUDWIG PRANDTL, MYA II and UTHÖRN to the Elbe River, Elbe Estuary and German Bight in 2020,” in Berichte zur Polar- und Meeresforschung = Reports on polar and marine research (Alfred Wegener Institute for Polar and Marine Research, Bremerhaven).
10
Bussmann I. K. Brix H. Fischer P. Kamjunke N. Krauss M. Raupers B. et al . (2024). The MOSES Sternfahrt Expeditions of the Research Vessels ALBIS, LITTORINA, LUDWIG PRANDTL and MYA II to the Elbe River, Elbe Estuary and German Bight in 2023. Eds. BornemannH.Amir SawadkuhiS. (Bremerhaven: Alfred-Wegener-Institut Helmholtz-Zentrum für Polar- und Meeresforschung).
11
Callies U. (2021). Sensitive dependence of trajectories on tracer seeding positions – coherent structures in German Bight backward drift simulations. Ocean Sci.17, 527–541. doi: 10.5194/os-17-527-2021
12
Cole J. J. Prairie Y. T. Caraco N. F. McDowell W. H. Tranvik L. J. Striegl R. G. (2007). Plumbing the global carbon cycle: Integrating inland waters into the terrestrial carbon budget. Ecosystems10, 172–185. doi: 10.1007/s10021-006-9013-8
13
Dummermuth A. Wiltshire K. Kirstein I. Brodte E. V. Wichels A. Shama L. et al (2023). Marine Stations Helgoland and Sylt operated by the Alfred Wegener Institute Helmholtz Centre for Polar and Marine Research Journal of large-scale research facilities. 8 (1), 1–15.
14
Fischer P. Brix H. Baschek B. Kraberg A. Brand M. Cisewski B. et al . (2020). Operating cabled underwater observatories in rough shelf-sea environments: A technological challenge. Front. Mar. Sci.7. doi: 10.3389/fmars.2020.00551
15
Grasshoff K. Ehrhardt M. Kremling K. (1983). Methods of seawater analysis (Weinheim: Verlag Chemie).
16
Groß E. Di Pane J. Boersma M. Meunier C. L. (2022). River discharge-related nutrient effects on North Sea coastal and offshore phytoplankton communities. J. Plankton Res.44, 947–960. doi: 10.1093/plankt/fbac049
17
Ionita M. Dima M. Lohmann G. Scholz P. Rimbu N. (2015). Predicting the June 2013 European flooding based on precipitation, soil moisture, and sea level pressure. J. Hydrometeorol.16, 598–614. doi: 10.1175/JHM-D-14-0156.1
18
IPCC (2023). Climate Change 2023: Synthesis Report. Contribution of Working Groups I, II and III to the Sixth Assessment Report. Eds. LeeH.RomeroJ. (Geneva, Switzerland: ntergovernmental Panel on Climate Change).
19
Jiang S. Bevacqua E. Zscheischler J. (2022). River flooding mechanisms and their changes in Europe revealed by explainable machine learning. Hydrol. Earth Syst. Sci.26, 6339–6359. doi: 10.5194/hess-26-6339-2022
20
Kaiser D. Voynova Y. G. Brix H. (2023). Effects of the 2018 European heatwave and drought on coastal biogeochemistry in the German Bight. Sci. Total Environ.892, 164316. doi: 10.1016/j.scitotenv.2023.164316
21
Kamjunke N. Büttner O. Jäger C. G. Marcus H. von Tümpling W. Halbedel S. et al . (2013). Biogeochemical patterns in a river network along a land use gradient. Environ. Monit. Assess.185, 9221–9236. doi: 10.1007/s10661-013-3247-7
22
Kamjunke N. Rode M. Baborowski M. Kunz J. V. Zehner J. Borchardt D. et al . (2021). High irradiation and low discharge promote the dominant role of phytoplankton in riverine nutrient dynamics. Limnol. Oceanogr.66, 2648–2660. doi: 10.1002/lno.11778
23
Kaspar F. Rauthe M. Brendel C. Junghänel T. Rauthe-Schöch A. Ostermöller J. et al . (2024). Hydro-klimatologische Einordnung der Stark- und Dauerniederschläge in Teilen Deutschlands vom 19. Dezember 2023 bis 5. Januar 2024. Available online at: https://www.dwd.de/DE/leistungen/besondereereignisse/niederschlag/20240116_dauerniederschlaege_2023-2024.pdf (Accessed November 18, 2024).
24
Kennish M. J. Paerl H. W. Crosswell J. R. (2023). Climate Change and Estuaries (Roca Baton, USA: CRC Press).
25
Kessouri F. Sutula M. A. Bianchi D. Ho M. Damien P. McWilliams J. C. et al . (2024). Cross-shore transport and eddies promote large scale response to urban eutrophication. Sci. Rep.14 (1), 7240. doi: 10.1038/s41598-024-57626-6
26
Langhammer J. Bernsteinová J. (2025). Attributing the effects of climate change and forest disturbance on runoff using distributed modeling and indicators of hydrological alteration in Central European montane basins. J. Hydrol.: Regional Stud.57, 102101. doi: 10.1016/j.ejrh.2024.102101
27
Merz B. Elmer F. Kunz M. Mühr B. Schröter K. Uhlemann-Elmer S. (2014). The extreme flood in June 2013 in Germany. La Houille Blanche100, 5–10. doi: 10.1051/lhb/2014001
28
Nguyen T. T. Staneva J. Grayek S. Bonaduce A. Hagemann S. Pham N. T. et al . (2024). Impacts of extreme river discharge on coastal dynamics and environment: Insights from high-resolution modeling in the German Bight. Regional Stud. Mar. Sci.73, 103476. doi: 10.1016/j.rsma.2024.103476
29
Petersen W. (2014). FerryBox systems: State-of-the-art in Europe and future development. J. Mar. Syst.140, 4–12. doi: 10.1016/j.jmarsys.2014.07.003
30
Poppeschi C. Charria G. Daniel A. Verney R. Rimmelin-Maury P. Retho M. et al . (2022). Interannual variability of the initiation of the phytoplankton growing period in two French coastal ecosystems. Biogeosciences19, 5667–5687. doi: 10.5194/bg-19-5667-2022
31
Pusch M. Fischer H. (2006). Stoffdynamik und Habitatstruktur in der Elbe. Stuttgart, Germany: Schweizerbart Science Publishers. 385 pp., 2006.
32
Raimonet M. Ragueneau O. Soetaert K. Khalil K. Leynaert A. Michaud E. et al . (2023). Benthic contribution to seasonal silica budgets in two macrotidal estuaries in North-Western France. Front. Mar. Sci.10. doi: 10.3389/fmars.2023.1269142
33
Raymond P. A. Saiers J. E. Sobczak W. V. (2016). Hydrological and biogeochemical controls on watershed dissolved organic matter transport: Pulse- shunt concept. Ecology97, 5–16. doi: 10.1890/14-1684.1
34
Rewrie L. C. V. Baschek B. van Beusekom J. E. E. Körtzinger A. Petersen W. Röttgers R. et al (2025). Impact of primary production and net ecosystem metabolism on carbon and nutrient cycling at the land-sea interface. Frontiers in Marine Science12, 2025. doi: 10.3389/fmars.2025.1548463
35
Serinaldi F. Loecker F. Kilsby C. G. Bast H. (2018). Flood propagation and duration in large river basins: a data-driven analysis for reinsurance purposes. Natural Hazards94, 71–92. doi: 10.1007/s11069-018-3374-0
36
Stanev E. V. Jacob B. Pein J. (2019). German Bight estuaries: An inter-comparison on the basis of numerical modeling. Continental Shelf Res.174, 48–65. doi: 10.1016/j.csr.2019.01.001
37
Voynova Y. G. Brix H. Petersen W. Weigelt-Krenz S. Scharfe M. (2017). Extreme flood impact on estuarine and coastal biogeochemistry: The 2013 Elbe flood. Biogeosciences14, 541–557. doi: 10.5194/bg-14-541-2017
38
Waldmann C. Fischer P. Seitz S. Köllner M. Fischer J. G. Bergenthal M. et al . (2022). A methodology to uncertainty quantification of essential ocean variables. Front. Mar. Sci.9. doi: 10.3389/fmars.2022.1002153
39
Wiltshire K. H. Boersma M. Carstens K. Kraberg A. C. Peters S. Scharfe M. (2015). Control of phytoplankton in a shelf sea: Determination of the main drivers based on the Helgoland Roads Time Series. J. Sea Res.105, 42–52. doi: 10.1016/j.seares.2015.06.022
40
Wiltshire K. H. Harsdorf S. Smidt B. Blöcker G. Reuter R. Schroeder F. (1998). The determination of algal biomass (as chlorophyll) in suspended matter from the Elbe estuary and the German Bight: A comparison of high-performance liquid chromatography, delayed fluorescence and prompt fluorescence methods. J. Exp. Mar. Biol. Ecol.222, 113–131. doi: 10.1016/S0022-0981(97)00141-X
41
Wolschke H. Sühring R. Xie Z. Ebinghaus R. (2015). Organophosphorus flame retardants and plasticizers in the aquatic environment: a case study of the Elbe River, Germany. Environ. pollut.206, 488–493. doi: 10.1016/j.envpol.2015.08.002
Summary
Keywords
river-estuary-ocean continuum, Elbe river, Weser river, flood event, nutrients, North Sea, German Bight, timing
Citation
Bussmann I, Brix H, Flöser G, Fischer PF, Jayachandran S, Achterberg EP, Carstens K, Kirstein IV, Sanders T, Raupers B, Voynova Y and Kamjunke N (2025) Winter flood significantly changes salinity and nutrient export from land to sea. Front. Mar. Sci. 12:1599007. doi: 10.3389/fmars.2025.1599007
Received
24 March 2025
Accepted
25 June 2025
Published
29 July 2025
Volume
12 - 2025
Edited by
Manuel Dall´Osto, Spanish National Research Council (CSIC), Spain
Reviewed by
Yair Suari, Ruppin Academic Center, Israel
Olga Vigiak, Joint Research Centre (JRC), Italy
Ling Meng, Chinese Academy of Sciences (CAS), China
Updates
Copyright
© 2025 Bussmann, Brix, Flöser, Fischer, Jayachandran, Achterberg, Carstens, Kirstein, Sanders, Raupers, Voynova and Kamjunke.
This is an open-access article distributed under the terms of the Creative Commons Attribution License (CC BY). The use, distribution or reproduction in other forums is permitted, provided the original author(s) and the copyright owner(s) are credited and that the original publication in this journal is cited, in accordance with accepted academic practice. No use, distribution or reproduction is permitted which does not comply with these terms.
*Correspondence: Ingeborg Bussmann, ingeborg.bussmann@awi.de
Disclaimer
All claims expressed in this article are solely those of the authors and do not necessarily represent those of their affiliated organizations, or those of the publisher, the editors and the reviewers. Any product that may be evaluated in this article or claim that may be made by its manufacturer is not guaranteed or endorsed by the publisher.