 Cong Cheng1,2
 Tao Jiang1,2*
 Zenggui Kuang3*Jinfeng Ren3Zigui Chen2Xu Zhao2
 Maqsood Ur Rahman1,2Fulong Ning1,4
- 1Institute for Advanced Marine Research, China University of Geosciences, Guangzhou, China
- 2Hubei Key Laboratory of Marine Geological Resources, China University of Geosciences, Wuhan, China
- 3National Engineering Research Center of Gas Hydrate Exploration and Development, Guangzhou Marine Geological Survey, China Geological Survey, Ministry of Natural Resources, Guangzhou, China
- 4National Center for International Research on Deep Earth Drilling and Resource Development, Faculty of Engineering, China University of Geosciences, Wuhan, China
Mass transport deposits are a fundamental component of deep-water sedimentary systems and play a crucial role in the transportation of sediments from continental slopes to deep-sea basins. However, there exists a significant gap in our understanding of their internal vertical structure, core facies characteristics, and associated sedimentary processes. This study employs comprehensive and continuous core data, logging-while-drilling data, and high-resolution 3D seismic data obtained from the Qiongdongnan Basin in the northern South China Sea to meticulously delineate the core facies of deep-water sedimentary systems within the investigated area. Among these findings, eleven core facies types have been summarized and categorized across all identified sedimentary systems. These include mass transport deposits, turbidity currents, bottom currents, as well as hemipelagic and pelagic deposits. Mass transport deposits display a range of deformation characteristics within their cores, including slumps and debris flows. Their internal structure encompasses various sedimentation processes that involve not only turbidity currents but also hemipelagic and pelagic deposits. This study further explores the issue of phase division in mass transport deposits across various dataset scales, including core, log, and seismic data. It proposes new insights into sedimentary processes and patterns for mass transport deposits in deep-water environments while examining their dynamic interactions with gas hydrates. Additionally, this study summarizes the overall framework of deep-water sedimentary systems present in the Qiongdongnan Basin. The aim is to provide geological insights that will inform future studies on mass transport deposits.
Introduction
Mass Transport Deposits (MTDs) are large-scale composite sedimentary bodies formed by the instability of sediments along the continental slope, including three types of gravity flow deposits: slides, slumps, and debris flows (Alves, 2015; Shanmugam, 2022). They are an integral part of the deep-water sedimentary system, widely distributed along the global continental margins. MTDs can not only have the potential to trigger marine geological disasters (Ruano et al., 2014; Talling et al., 2014; Sun et al., 2022), but they can also serve as reservoirs and seals for oil, gas, and gas hydrates in marine environments (Wang et al., 2013).
Identifying MTDs in deep-water areas has always been a focal point of discussion among scientists. Standard methodologies encompass the analysis of onshore outcrops, offshore seafloor geomorphology, core samples, well logs, and seismic data. Onshore outcrops can be identified as MTDs by examining characteristics such as sedimentary deformation, slump folding, and the occurrence of thrust faults (Shanmugam, 2012). The formation of MTDs typically induces submarine landslides along the continental slope, resulting in a substantial volume of sediment collapsing and subsequently being transported to the deep-sea basin. Therefore, multibeam bathymetric surveys are capable of clearly delineating these features on the seafloor topography. Such observations can be made in various regions, including offshore Norway (Posamentier and Martinsen, 2011), the Nile Delta (Lamarche et al., 2016), and the northern South China Sea (SCS) (Wang et al., 2017). As for core-log-seismic data, in core samples, MTDs exhibit a variety of soft-sediment deformation structures (Jenner et al., 2007; Tripsanas et al., 2008). Logs are primarily characterized by higher density, lower porosity, and lower permeability (Crutchley et al., 2022). Moreover, by analyzing seismic data, Bull et al. (2009) have concluded that MTDs can be primarily categorized into three domains: the headwall domain, the translational domain, and the toe domain, based on their developmental components. Furthermore, the characteristics of these different domains exhibit significant variations. MTDs typically exhibit chaotic and low-amplitude seismic reflection characteristics on seismic profiles, which are markedly distinct from the seismic reflection structures of both the overlying and underlying strata (Cheng et al., 2021). Therefore, seismic data are frequently employed to identify deep-sea MTDs. However, owing to their lower vertical resolution, the accuracy of identification is significantly inferior to that achieved through core analysis.
The sedimentary processes on the northern passive continental margin of the SCS are complex, with the development of various sedimentary systems (Figure 1). MTDs are widely developed in this region, spanning from the Neogene to the Quaternary, including the Qiongdongnan Basin (QDNB) and the Pearl River Mouth Basin. To date, a considerable body of literature has documented these phenomena, predominantly relying on seismic data (Sun et al., 2017; Wang et al., 2018; Li et al., 2020; Du et al., 2024). Although seismic data can quickly identify the top and bottom surfaces of MTDs, the characteristics from the bottom to the top of each set of MTDs, as well as their internal vertical structures and sedimentary processes, remain poorly understood due to limitations in vertical resolution. More support is needed from complete and continuous core and well logging data. Moreover, for the deep-water sedimentary system in the northern part of the SCS, current research still lacks robust core samples to demonstrate the existence and characteristics of sediment gravity flows, bottom currents, etc. Core analysis can further enhance the sedimentary model of the deep-water region in the SCS.
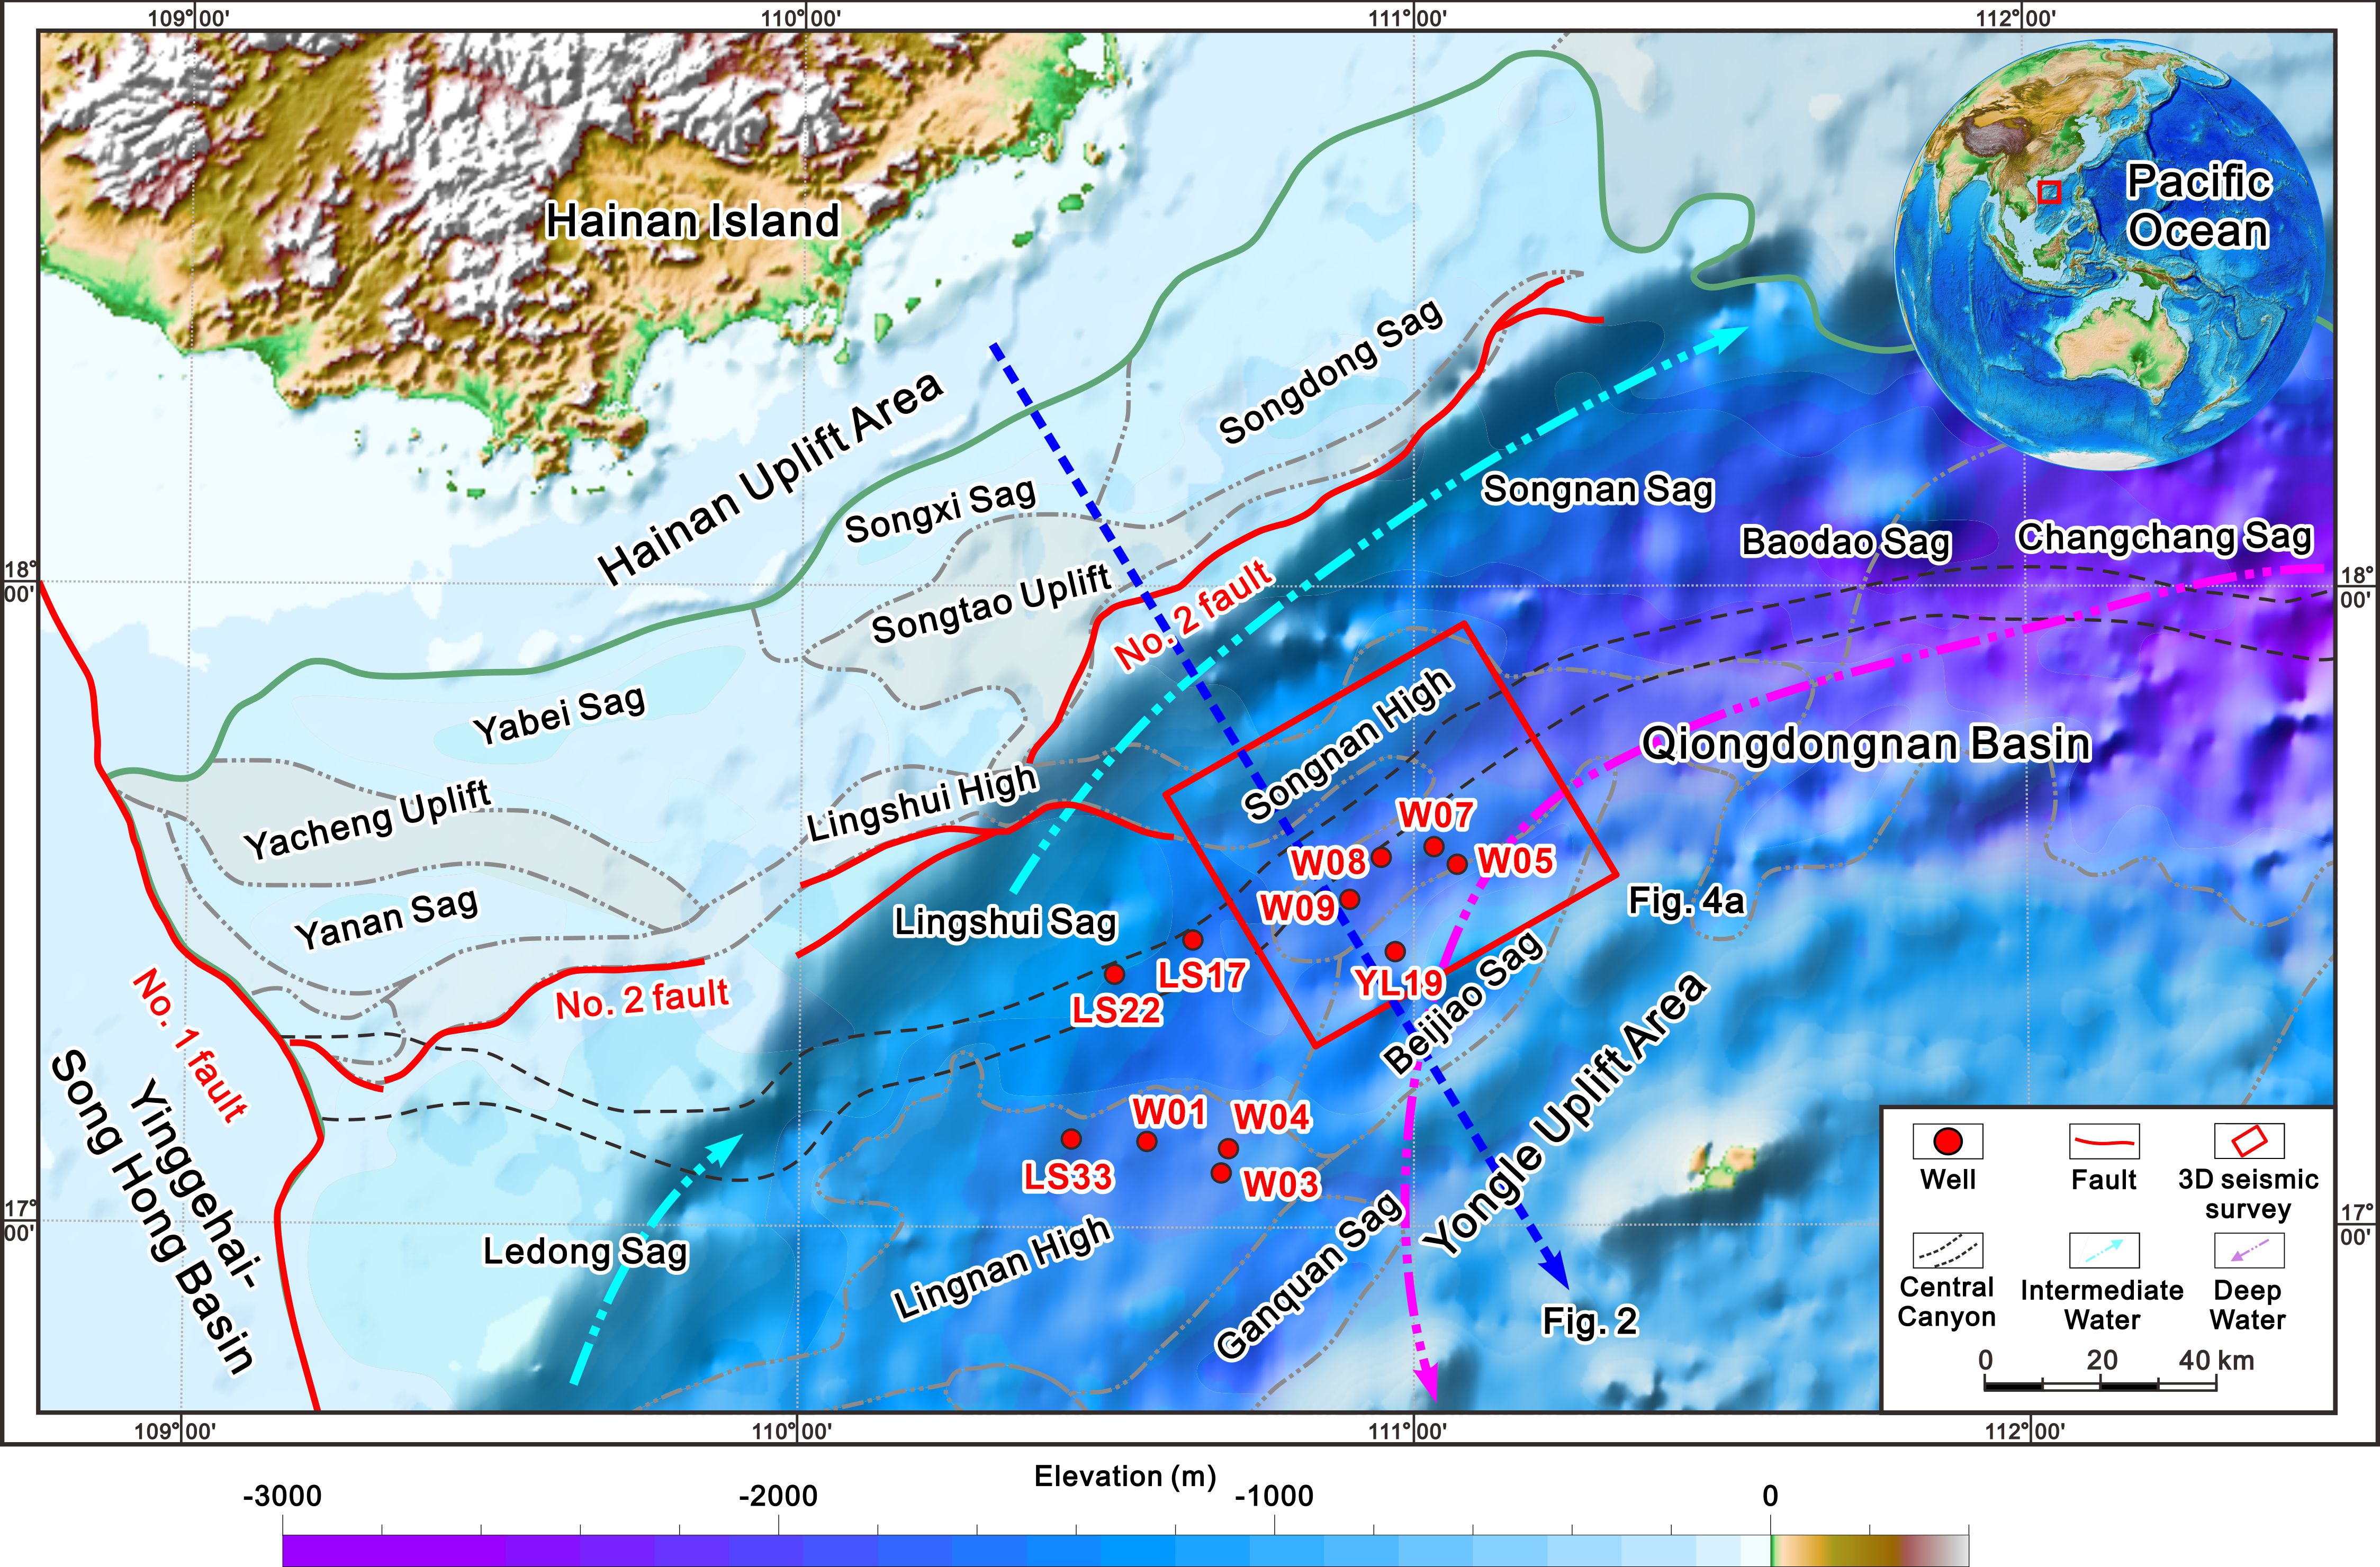
Figure 1. Geographical map of the study area. Faults are modified from Cheng et al. (2022); drilling wells are modified from Kuang et al. (2023); Intermediate Water and Deep Water are modified from Liu et al. (2021).
Therefore, this study primarily investigates the continuous core samples collected from a drilling site situated in the deep-water region of the QDNB in the northern SCS. Utilizing log and seismic data, this research delineates the core facies characteristics of various deep-water sedimentary systems, including MTDs, turbidity currents, bottom currents, as well as hemipelagic and pelagic sediments. Then, this work meticulously analyzes the complete and continuous internal vertical structures of MTDs from the bottom to the top. It addresses the challenge of phase division in MTDs across various dataset scales, including core, log, and seismic data. Furthermore, this work proposes sedimentary processes and patterns associated with MTDs in deep-water environments. The dynamic interactions between MTDs and gas hydrates is also discussed, culminating in a summary of the sedimentary model applicable to deep-water areas.
Geological setting
The QDNB is situated in the northwestern SCS, which is the largest marginal sea on the Western Pacific Ocean (Figure 1). It is adjacent to Hainan Island, the Yinggehai-Song Hong Basin, and the Pearl River Mouth Basin, and it possesses abundant resources of oil, gas, and gas hydrates (Zhu et al., 2021; Kuang et al., 2023). The QDNB can mainly be divided into the Northern Depression Belt, the Northern Uplift Belt, the Central Depression Belt, and the Southern Uplift Belt (Ren et al., 2014; Zhao, 2021). Among them, the Central Depression Belt has developed several hydrocarbon-rich sags, including the Ledong Sag, the Lingshui Sag, the Songnan Sag, and the Baodao Sag. The study area is located in the Songnan High, which is relatively close to the Lingshui Sag and the Beijiao Sag (Figure 1). The basin mainly went through three stages of tectonic evolution, including the pre-rifting stage, the syn-rifting stage (Paleogene), and the post-rifting stage (Neogene and Quaternary). The Horizon T100 represents the boundary between the basement and the Paleogene, whereas the Horizon T60 is the boundary between the Paleogene and the Neogene (Figure 2).
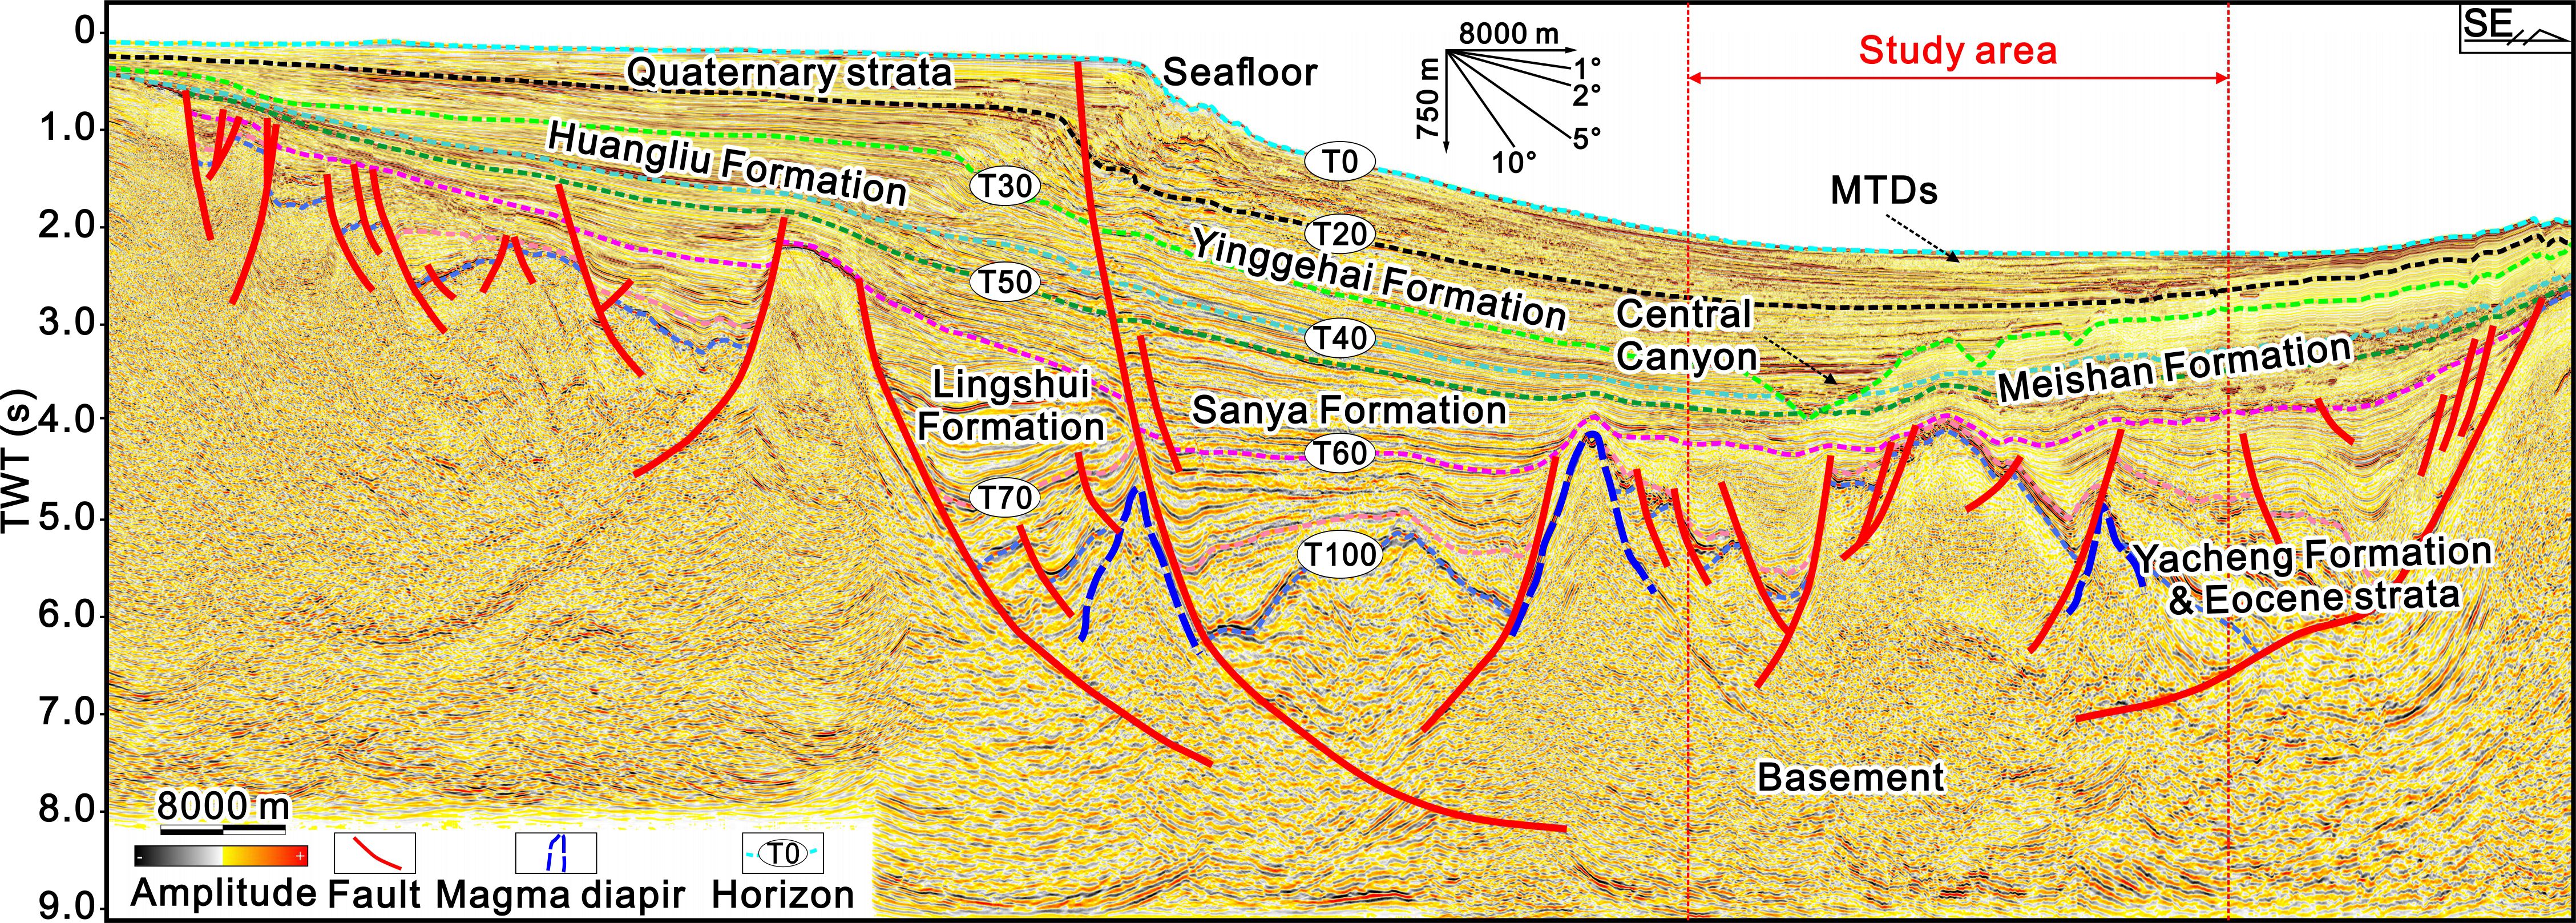
Figure 2. A typical 2D seismic profile across the study area illustrates the gradient of the continental slope and the approximate location of the study area.
Since the Cenozoic, the QDNB has accumulated a substantial sediments, with the maximum thickness reaching approximately 16 km (Cheng et al., 2021). The highest sedimentation rate can reach about 630 m/Myr, with an average Quaternary sedimentation rate of about 370 m/Myr (Zhao et al., 2015). Overall, the sedimentation rate is fast, indicating a sufficient supply of sediments. The study area is located in the deep-water region of the southeastern QDNB, with water depths exceeding 1500 m (Figure 1). The northern continental slope has a gradient that can exceed 5°. The transportation of sediments is mainly sourced from sediment gravity flows, with potential source areas including the Truong Son Belt, the Red River, and Hainan Island, among others (Cao et al., 2015; Wang et al., 2019a). In addition, the influence of along-slope bottom currents cannot be underestimated. In the northern South China Sea, water masses can be primarily divided into Surface Water, Intermediate Water, and Deep Water (Chen et al., 2016). Based on the water depth, the study area is most likely predominantly influenced by the Deep Water, circulating from east to west, which adds complexity to the study of the source-to-sink system and the deep-water sedimentary processes.
Data and methods
The core photographs and samples utilized in this study were obtained from the deep-water region of the QDNB, specifically from Site W05. Samples are primarily situated within the strata located beneath the seafloor at a depth of approximately 150 m (Figure 3). The Guangzhou Marine Geological Survey conducted gas hydrate drilling at a water depth of approximately 1769 m, with a total drilling depth of 199.5 m, obtaining continuous long cylindrical core samples from Site W05 (Figures 1, 3). Subsequently, the cores were transported to the core repository for low-temperature preservation, and each core section was cut to facilitate scanning and photography.
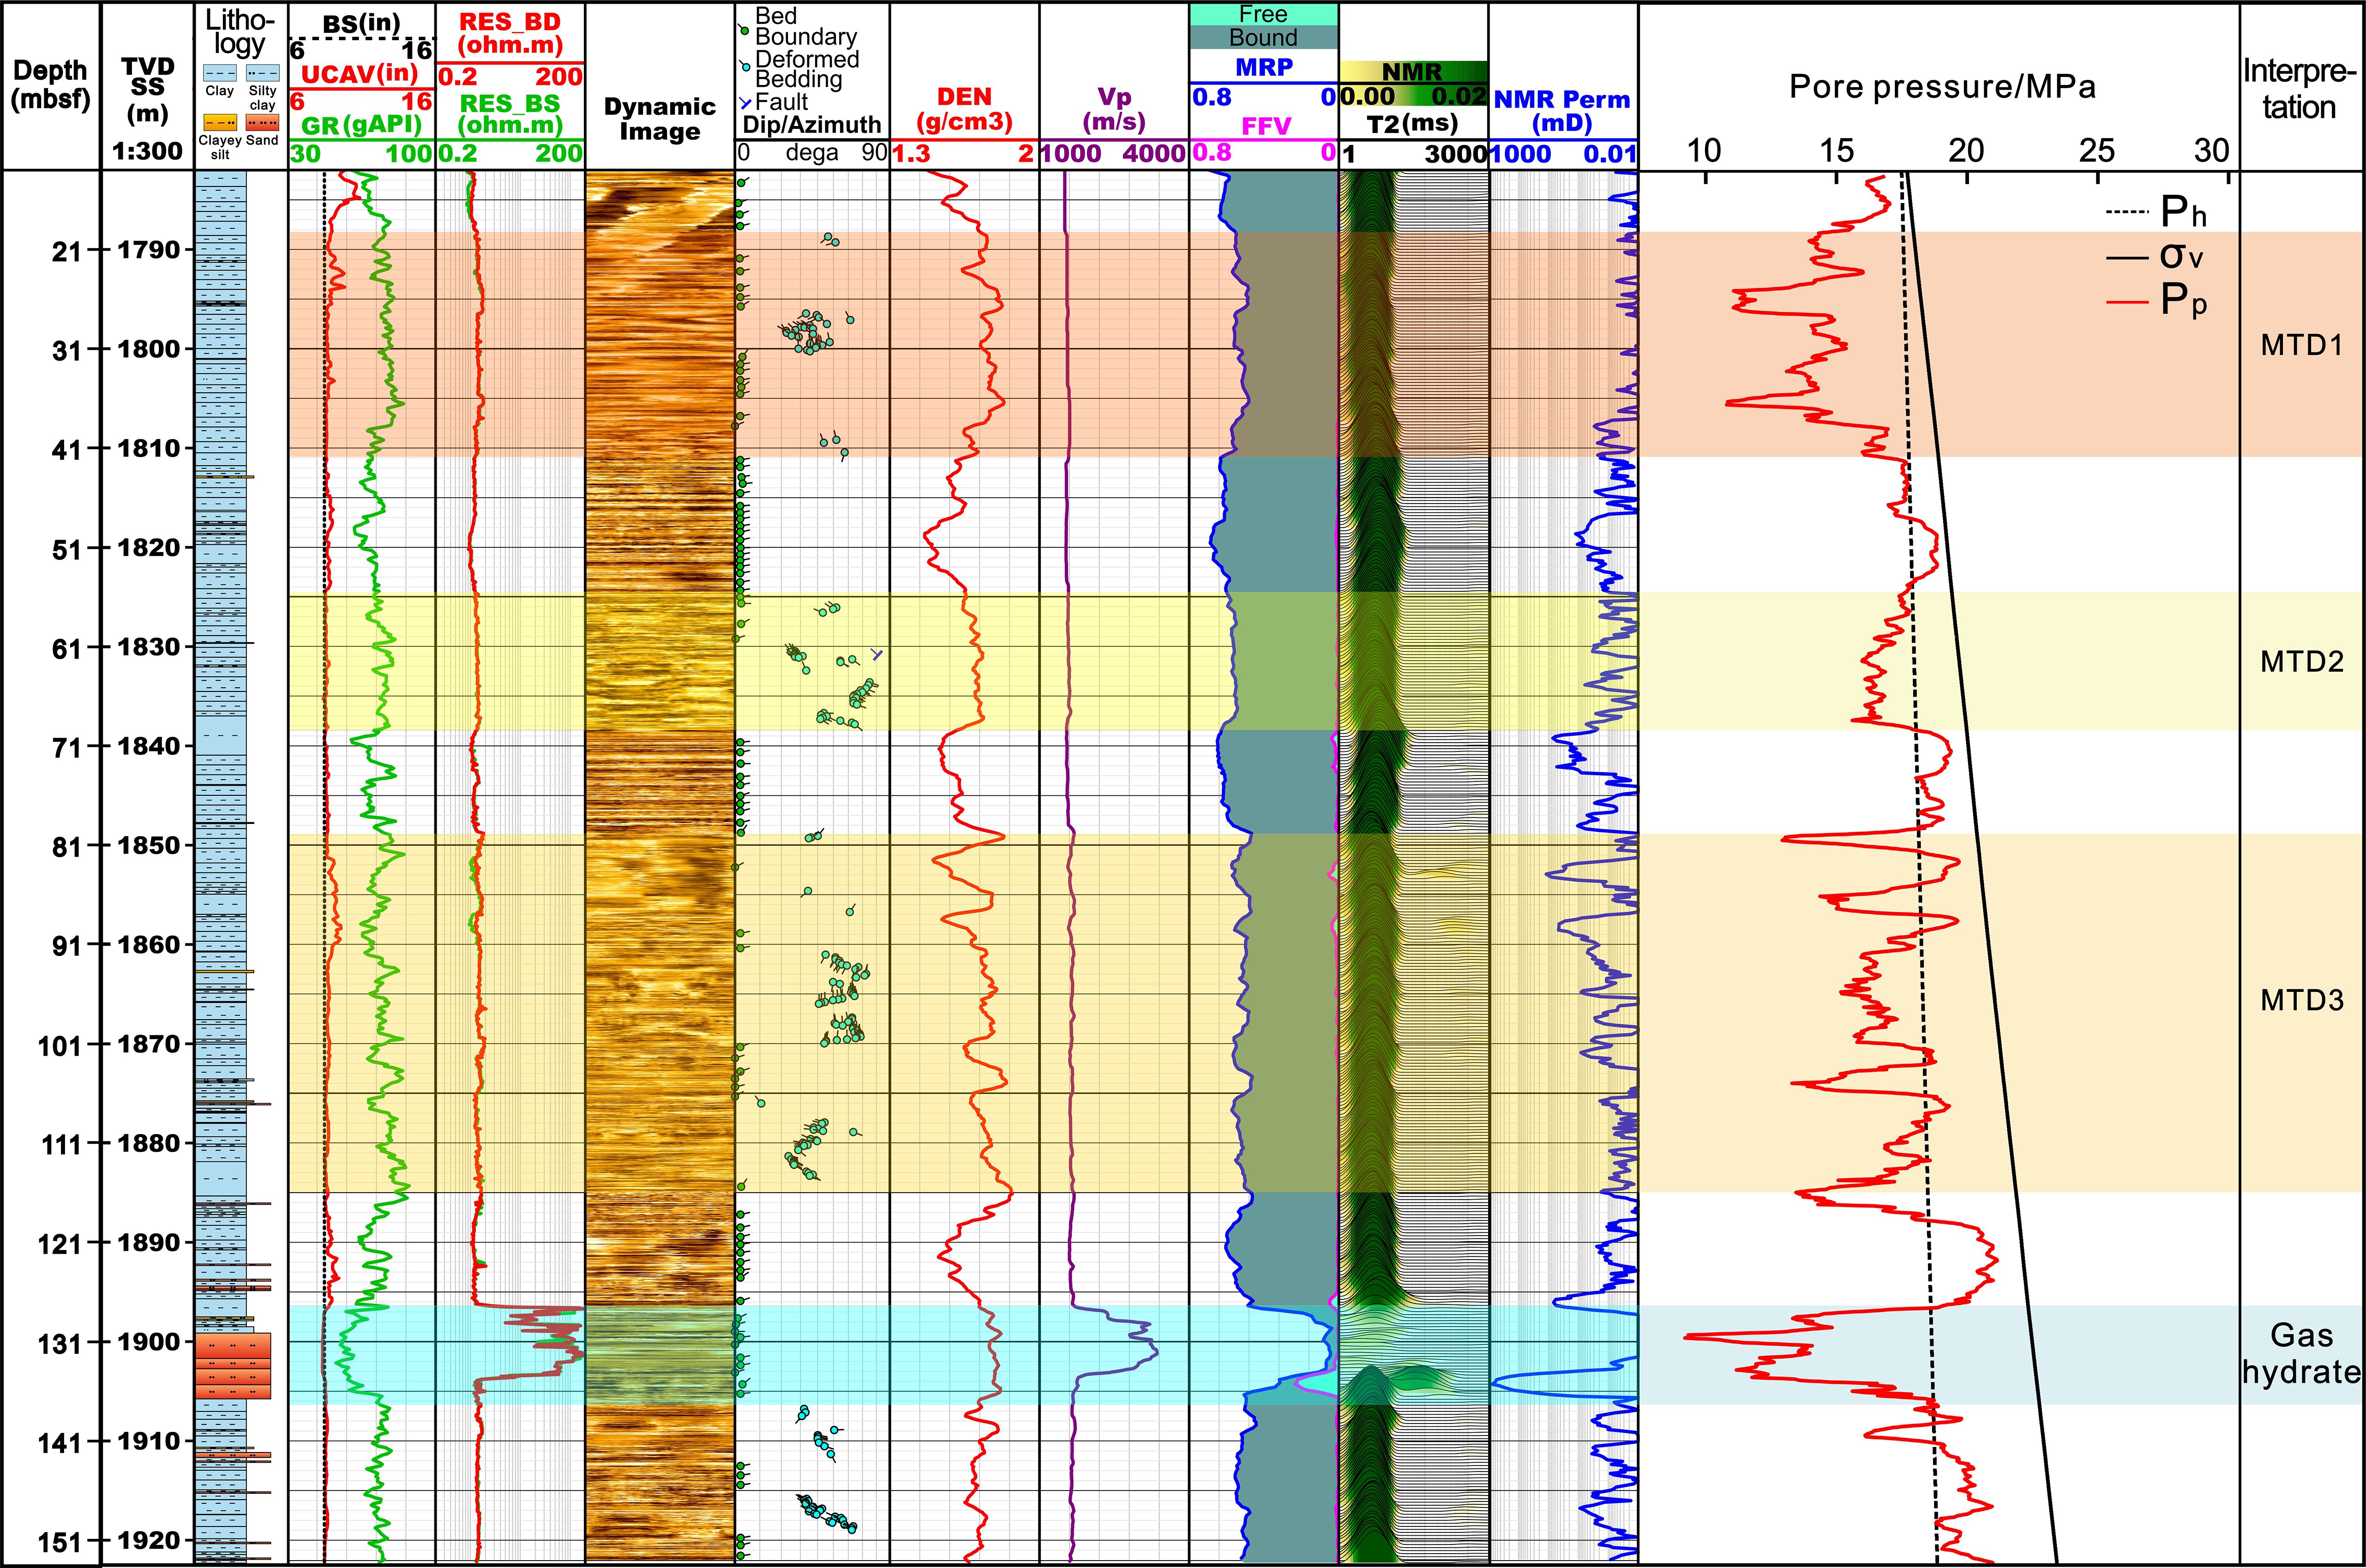
Figure 3. Integrated interpretation diagram of lithology and well logging of Site W05 (modified from Kuang et al., 2023).
The logging-while-drilling data has been processed by Schlumberger, including natural gamma logging (GR), resistivity logging (RES), dynamic image logging, dip logging, density logging (DEN), P-wave velocity logging (Vp), nuclear magnetic resonance (NMR) permeability logging, and so on (Figure 3). Among these, the gas hydrate layer is primarily identified through the abnormal increases observed in the RES and Vp curves. Furthermore, this study acquired formation pore pressure data, which, when combined with the rising DEN curve, facilitates the identification and analysis of MTDs.
Seismic data mainly includes 2D seismic profiles and 3D seismic data (Figures 2, 4). Acquisition, processing, and interpretation of the seismic data were all carried out at the Guangzhou Marine Geological Survey. For detailed information, please refer to Kuang et al. (2023). The seismic profile and the planar amplitude attribute map were produced using the interpretation software Geoframe® (Figure 4).
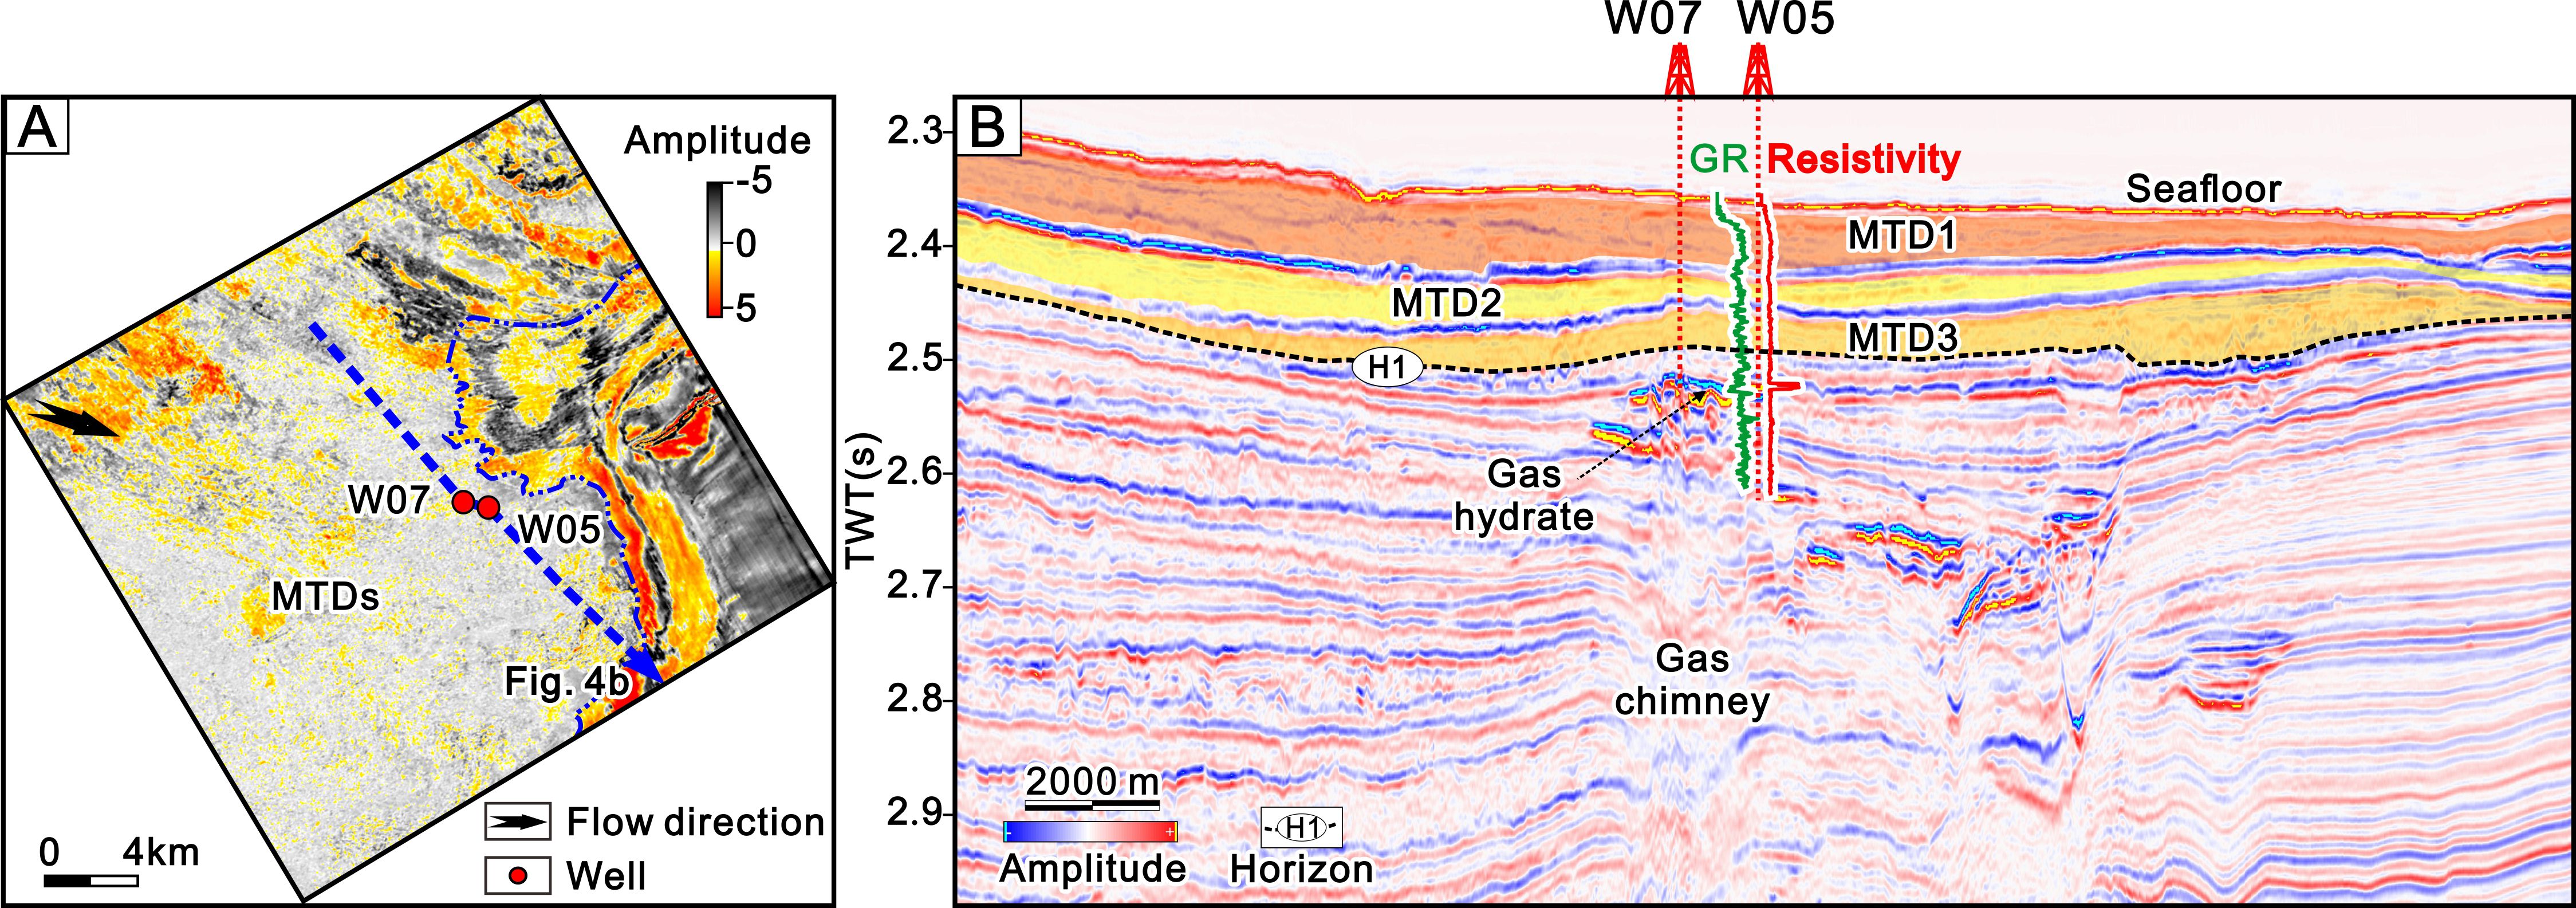
Figure 4. Seismic interpretations of MTDs in the study area (modified from Kuang et al., 2023). (A) Planar distribution map of amplitude attribute of Horizon H1. (B) 3D seismic profile across typical wells in the study area.
Results
Core facies of deep-water sedimentary system
Sediment gravity flows
Sediment gravity flows develop perpendicular to the continental slope and are the most critical components of deep-water sedimentary systems, mainly consisting of MTDs and turbidity currents.
MTDs
Identification of MTDs primarily relies on core-log-seismic data. On logs, MTDs exhibit significant dip anomalies and higher densities (Figure 3). Permeability and formation pore pressure are also diminished, primarily due to the increased internal density of MTDs, which typically function as effective seals for oil and gas. On seismic profiles (Figures 2, 4B), MTDs are mainly characterized by low-amplitude chaotic reflections and clear evidence of basal shear surfaces. On the planar amplitude attribute map, MTDs also have distinct erosional boundaries (Figure 4A).
In cores, MTDs exhibit a variety of soft-sediment deformation characteristics, which can primarily be categorized into the following types of core facies (Supplementary Table S1):
Core Facies A: Slump-folded sandy sediment in clay. Analysis of the core photographs and sketches reveals that in the layer extending from 83.50 meters below seafloor (mbsf) to 83.64 mbsf, the core has experienced significant soft-sediment deformation. This deformation is characterized by sediment slumping, which has resulted in the formation of folds and a laterally compressed appearance (Figure 5A). The lithology of this layer is predominantly clay. However, several sandy layers, each measuring 1 cm in thickness, are interspersed within the folded sediments and arranged alternately with the clay layers. Furthermore, the color of the sediments exhibits a variation ranging from green-grey to dark grey.
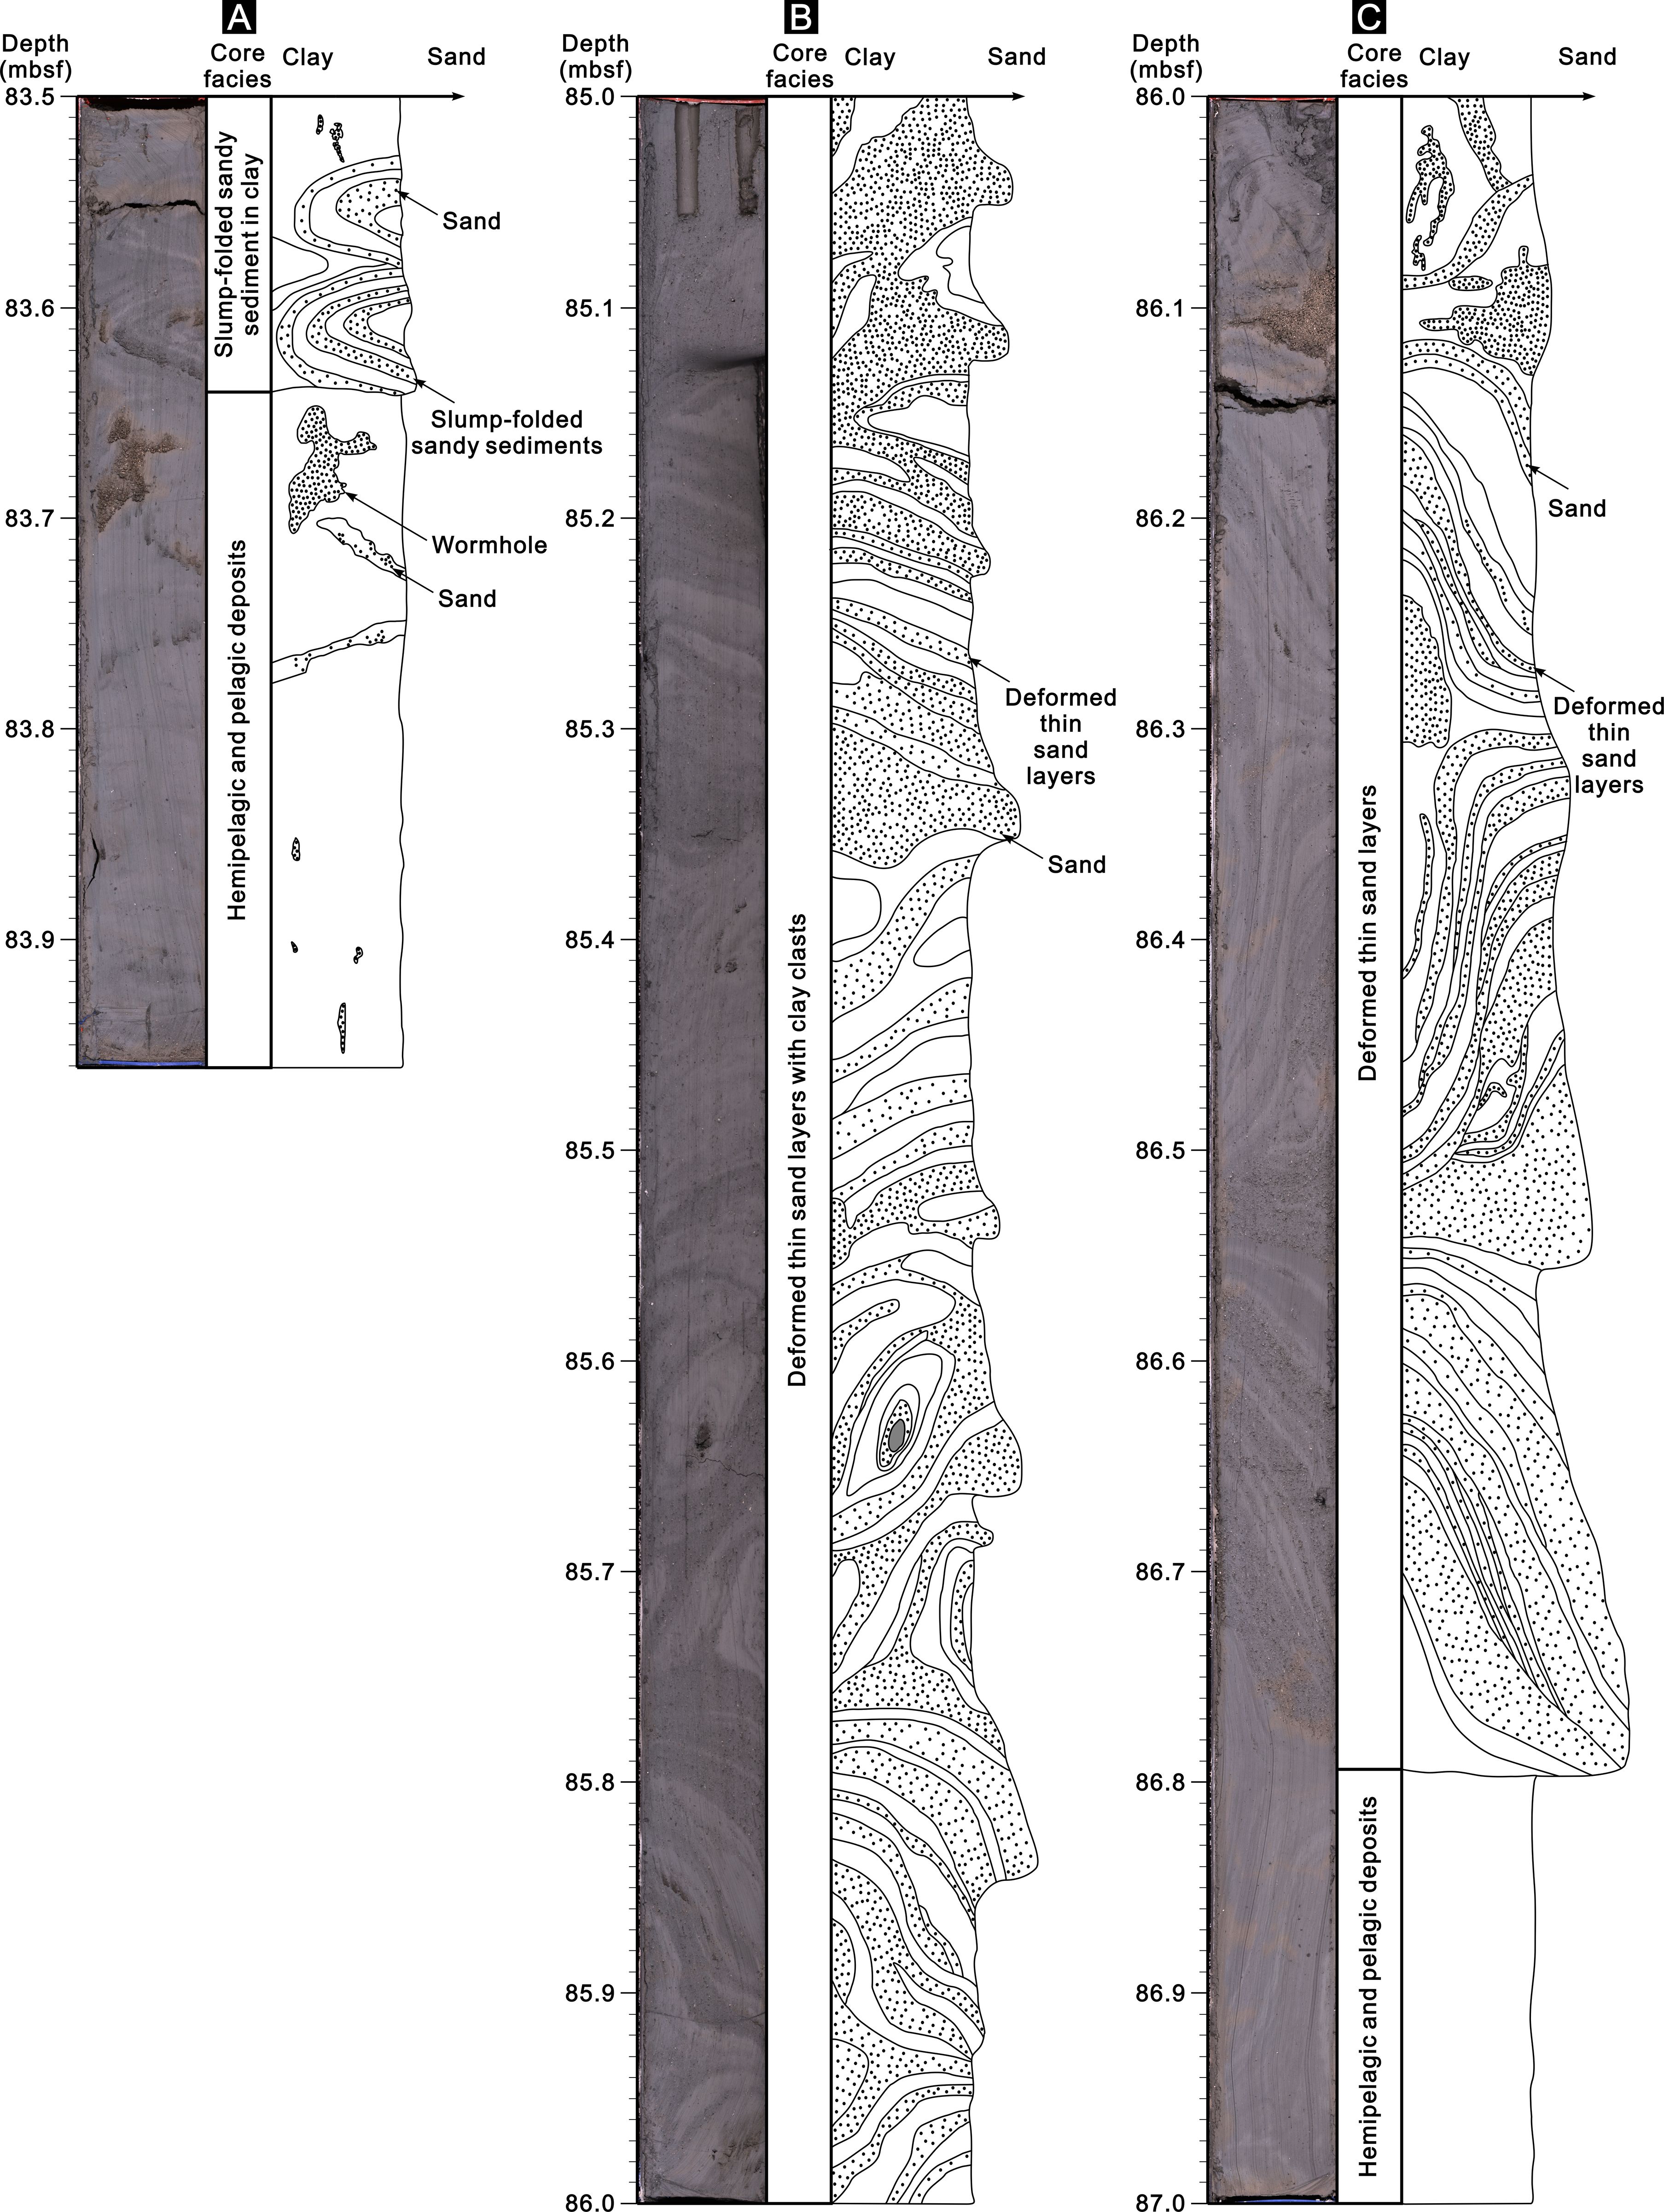
Figure 5. Typical core sketches of Site W05. (A) Green-grey clay mainly exhibits Core Facies A: Slump-folded sandy sediment in clay and Core Facies K: Hemipelagic and pelagic deposits, with visible wormholes. (B) Green-grey clay mainly exhibits Core Facies B, deformed thin sand layers with clay clasts. (C) Green-grey clay, with many sand layers visible, exhibits Core Facies C: Deformed thin sand layers and Core Facies K: Hemipelagic and pelagic deposits.
Core Facies B: Deformed thin sand layers with clay clasts. The sediments exhibit distinct deformation characteristics in the core photographs, and the stratigraphic dip has also changed (Figures 3 and 5B). Furthermore, through core sketches, it can be observed that dark grey sandy sediments intrude into the original green-grey clay, subsequently mixing with them. The injective layer is characterized by coarser sediment particles, typically exceeding 1 cm in thickness. Additionally, clay clasts are observable within the layer at approximately 85.64 mbsf.
Core Facies C: Deformed thin sand layers. This Core Facies C is quite similar to the aforementioned Core Facies B. In the layer from 86.00 mbsf to 86.80 mbsf, there are noticeable injections of sandy sediments (Figure 5C). The thickness of these injective layers is relatively thin, mostly less than 1 cm. There exists a multitude of injective layers, characterized by their notably steep angles. These injective layers may be oriented perpendicularly to the strata, with heights reaching up to 20 cm.
Core Facies D: Distorted stratified sediments. Based on the core and sketches from the layer between 93.98 mbsf and 94.50 mbsf, it can be observed that the lithology of this interval primarily exhibits variations in color and dip (Figure 6A). The in situ sediments consist of green-grey clay. In contrast, the distorted layers are composed of dark grey clay, which is characterized by a stratified appearance. The two types of sediment alternate, with each layer being approximately 1 cm in thickness. A few deformed layers also contain coarse-grained sediments.
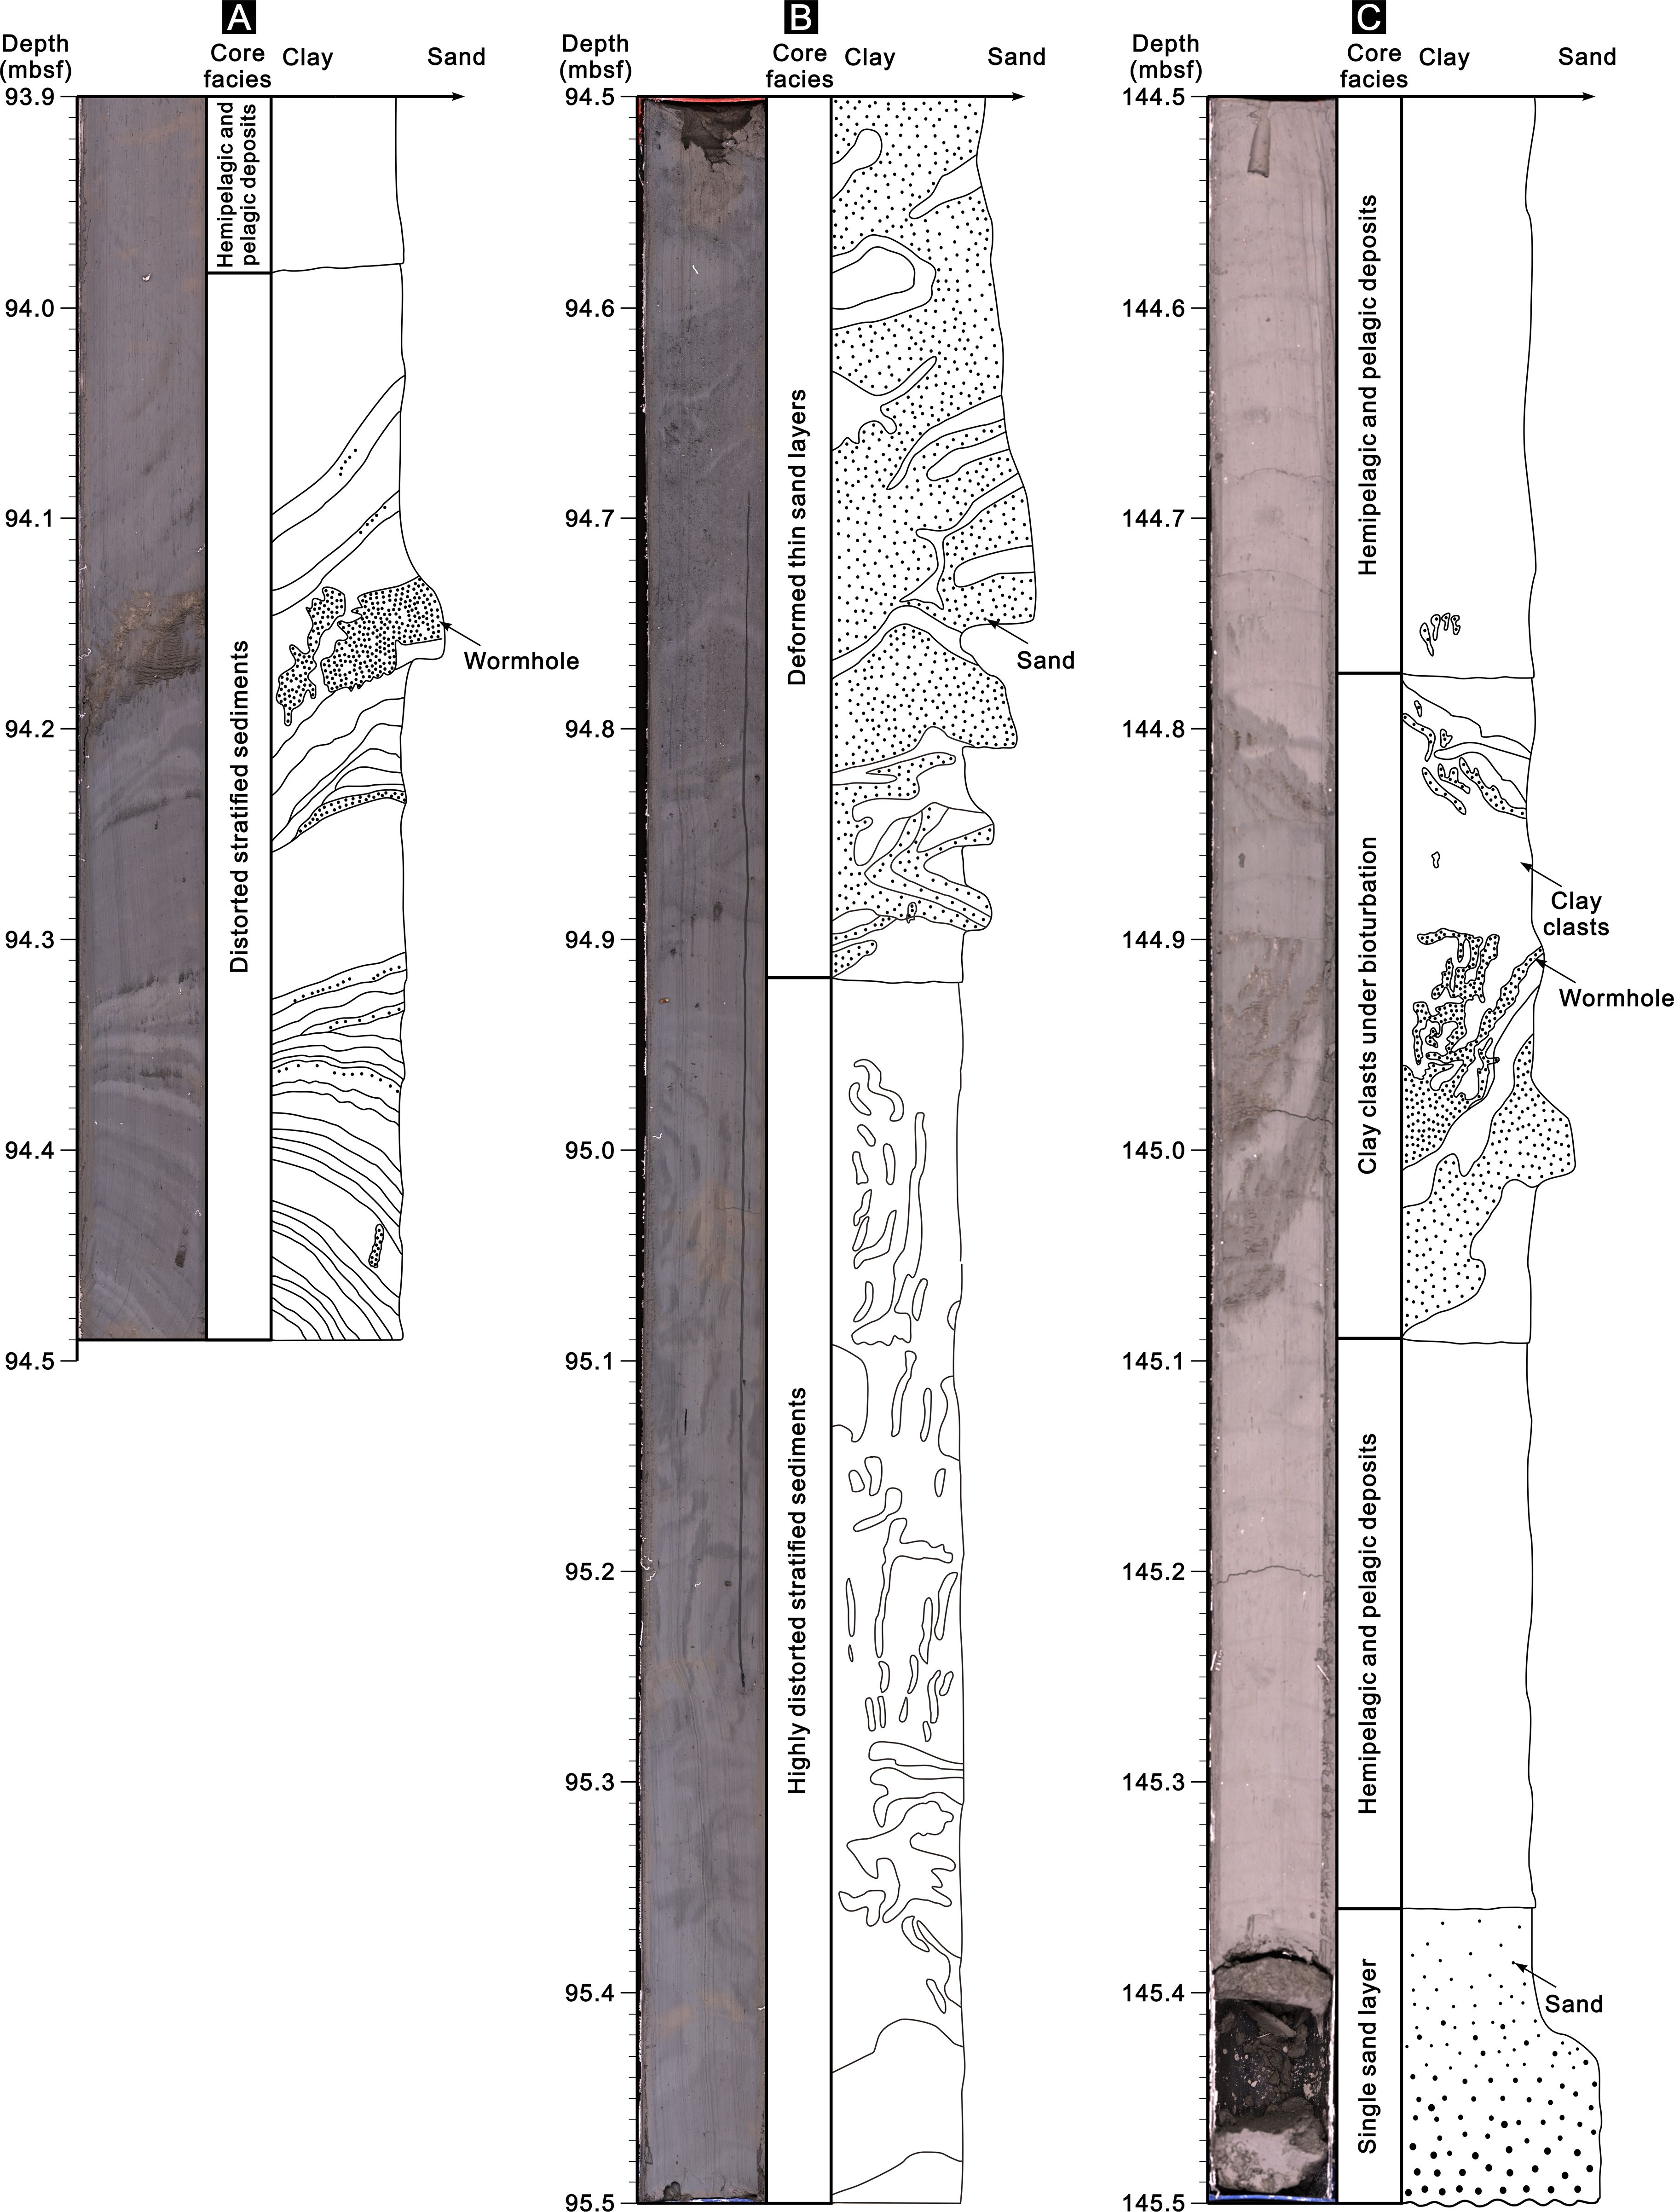
Figure 6. Typical core sketches of Site W05. (A) Green-grey clay, primarily developed in Core Facies D: Distorted stratified sediments and Core Facies K: Hemipelagic and pelagic deposits, with visible wormholes. (B) Green-grey to dark grey clay, with significant sand layers, mainly developed in Core Facies C: Deformed thin sand layers and Core Facies E: Highly distorted stratified sediments. (C) Light grey to dark grey clay, primarily developed in Core Facies F: Clay clasts under bioturbation, Core Facies H: Single sand layer, and Core Facies K: Hemipelagic and pelagic deposits, with turbidite deposits visible at the bottom.
Core Facies E: Highly distorted stratified sediments. Core Facies E is quite similar to Core Facies D, with the main difference being that Core Facies E is primarily composed of short segments (Figure 6B). From the 94.92 mbsf to the 95.40 mbsf layer, deformed sediments can be seen spread out in irregular shapes. They are primarily dark grey clay, which is very different from the green-grey clay already there. The deformed sediments vary in length, ranging from 1 cm to 10 cm, with distinctive characteristics.
Core Facies F: Clay clasts under bioturbation. In the layer from 144.78 mbsf to 145.09 mbsf, there is a clear distinction between the dark grey deformed layer and the light grey in situ sediments (Figure 6C). The deformed layer is primarily composed of clay, with a small amount of coarse-grained sand, distributed almost vertically. Additionally, the deformed layer exhibits bioturbation, with obvious wormholes visible. The interiors of these wormholes are filled with sands of irregular shapes and sizes.
Core Facies G: Highly distorted stratified sediments under bioturbation. Like Core Facies E, Core Facies G is mainly made up of highly distorted stratified sediments that are dark grey. These sediments typically measure less than 10 cm in length and exhibit a diverse range of shapes (Figure 7A). Moreover, due to the influence of bioturbation, numerous wormholes have been formed, which are filled with sand inside.
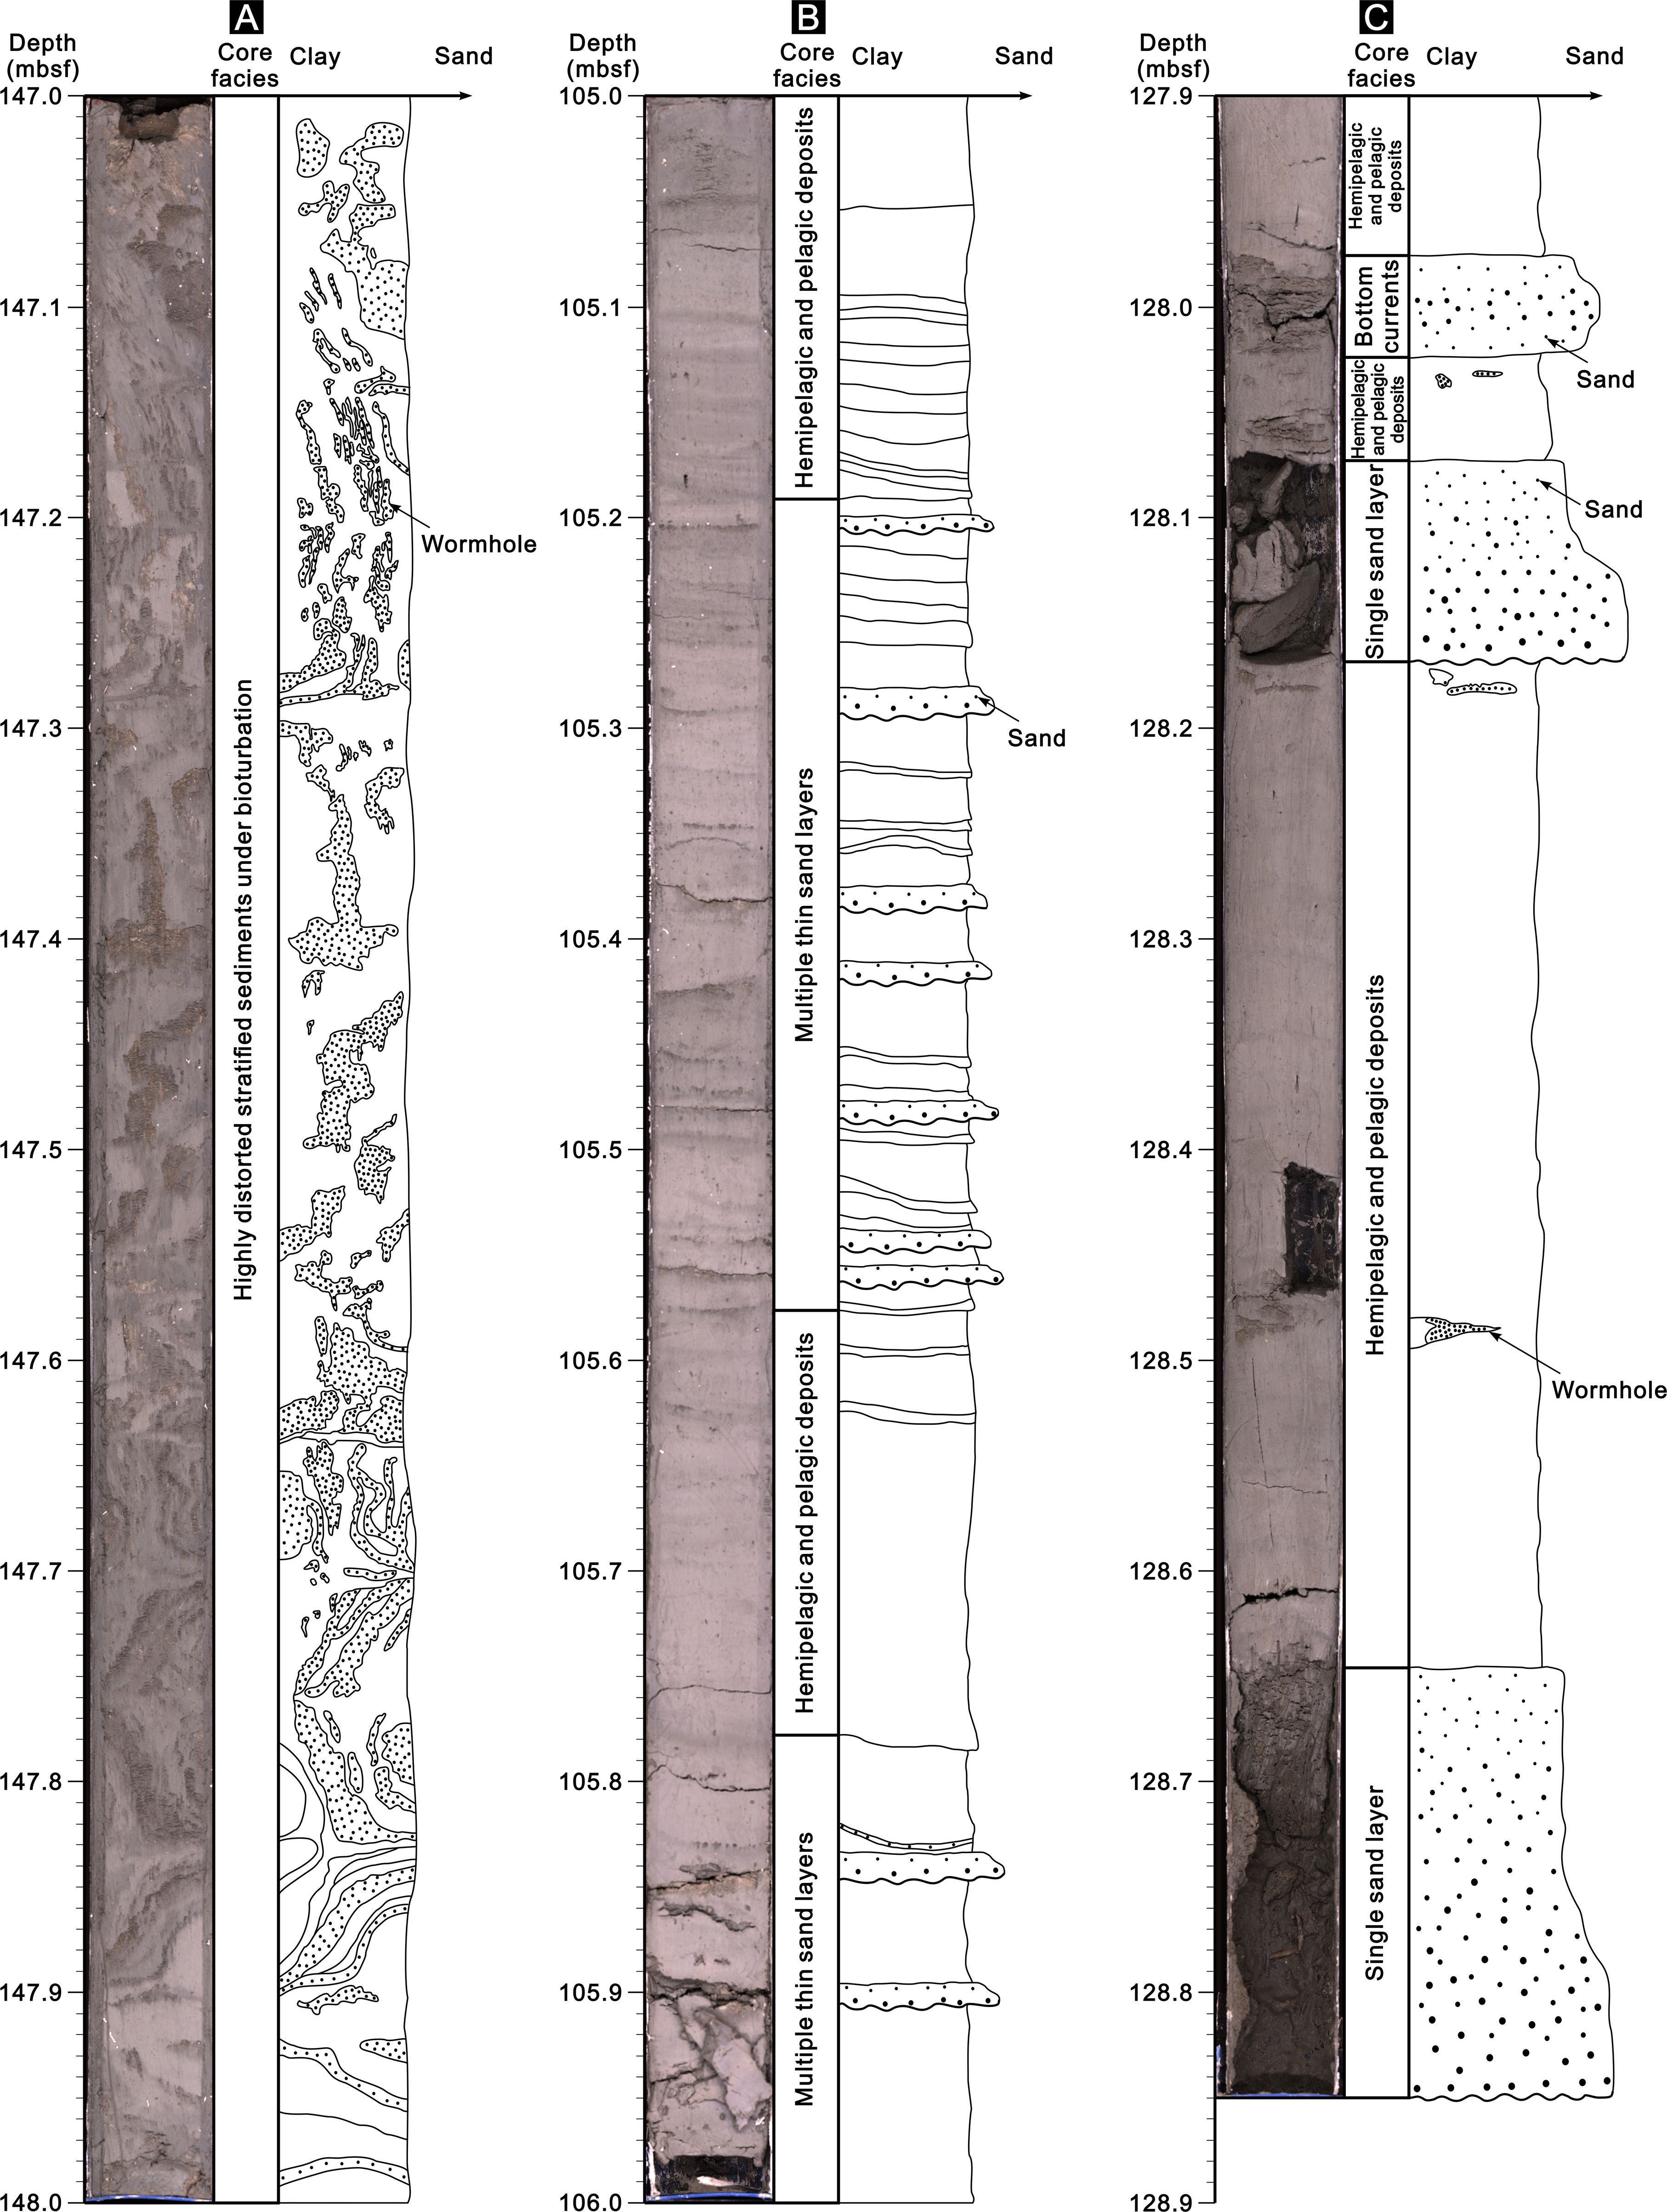
Figure 7. Typical core sketches of Site W05. (A) Dark grey clay, with numerous wormholes and sand layers visible, primarily exhibiting Core Facies G: Highly distorted stratified sediments under bioturbation. (B) Light grey clay, with a significant presence of thin sand layers and turbidite deposits, is mainly characterized by Core Facies I: Multiple thin sand layers and Core Facies K: Hemipelagic and pelagic deposits. (C) Green-grey clay, characterized by bottom current deposits at the uppermost layer, hemipelagic and pelagic deposits in the middle, and turbidite deposits at the bottom.
Turbidity currents
Turbidity currents are also a type of sediment gravity flow that develops perpendicular to the continental slope. The sediments formed by turbidity currents are typically sands, which mainly exhibit low GR values in well logging (Figure 3). In this work, the core facies of turbidity currents are primarily divided into two categories (Supplementary Table S1).
Core Facies H: Single sand layer. Based on the core photographs and sketches, it can be observed that in the layer from 145.38 mbsf to 145.50 mbsf, the sediment is predominantly sand, with a dark grey color (Figure 6C). The sediment grain size exhibits a fine gradation from the bottom to the top, demonstrating normal graded bedding. The thickness of the sand layer is approximately 10 cm.
Core Facies I: Multiple thin sand layers. The multiple sand layers are corresponding to the single sand layer, where the number of sand layers increases. Their thickness decreases, typically less than 1 cm (Figure 7B). Erosional surfaces are observable at the base of the sand layers. As one ascends through these layers, there is a noticeable decrease in sediment grain size, which is characteristic of typical turbidity currents and manifests as features indicative of event sedimentology.
Bottom currents
Contrary to sediment gravity flows, bottom currents develop along the continental slope, and the grain size of the sediments formed by bottom currents can vary depending on their velocity. In this study, a typical bottom current Core Facies J was identified, which is primarily composed of clayey silt and can be observed in the layer from 127.97 mbsf to 128.02 mbsf (Figure 7C). Unlike turbidity currents, the deposits formed by bottom currents exhibit a bidirectional grading sequence. In this sequence, the grain size of sediments initially coarsens and subsequently fines from the bottom to the top. Both the upper and lower surfaces are in gradational contact with in situ sediments, which primarily consist of hemipelagic and pelagic deposits, without any evident erosional surfaces (Supplementary Table S1).
Hemipelagic and pelagic deposits
Hemipelagic and pelagic deposits are typically found between the continental slope and the deep-sea basin. They are unusually well-developed in the study area and comprise green-grey clays without clear stratification (Figure 7C). The sediment particles are very fine and generally rich in foraminifera. In some regions, bioturbation structures, such as wormholes, have been identified. These structures are observable in the core section ranging from 128.20 mbsf to 128.60 mbsf and are designated as Core Facies K (Supplementary Table S1).
Based on core photographs and sketches of Site W05 (Figures 5–7), this work has summarized the core facies types of the deep-water sedimentary system (Figure 8), which mainly include sediment gravity flows composed of MTDs (Figures 8A–G), turbidity currents (Figures 8H, I), bottom currents (Figure 8J), as well as hemipelagic and pelagic deposits (Figure 8K).
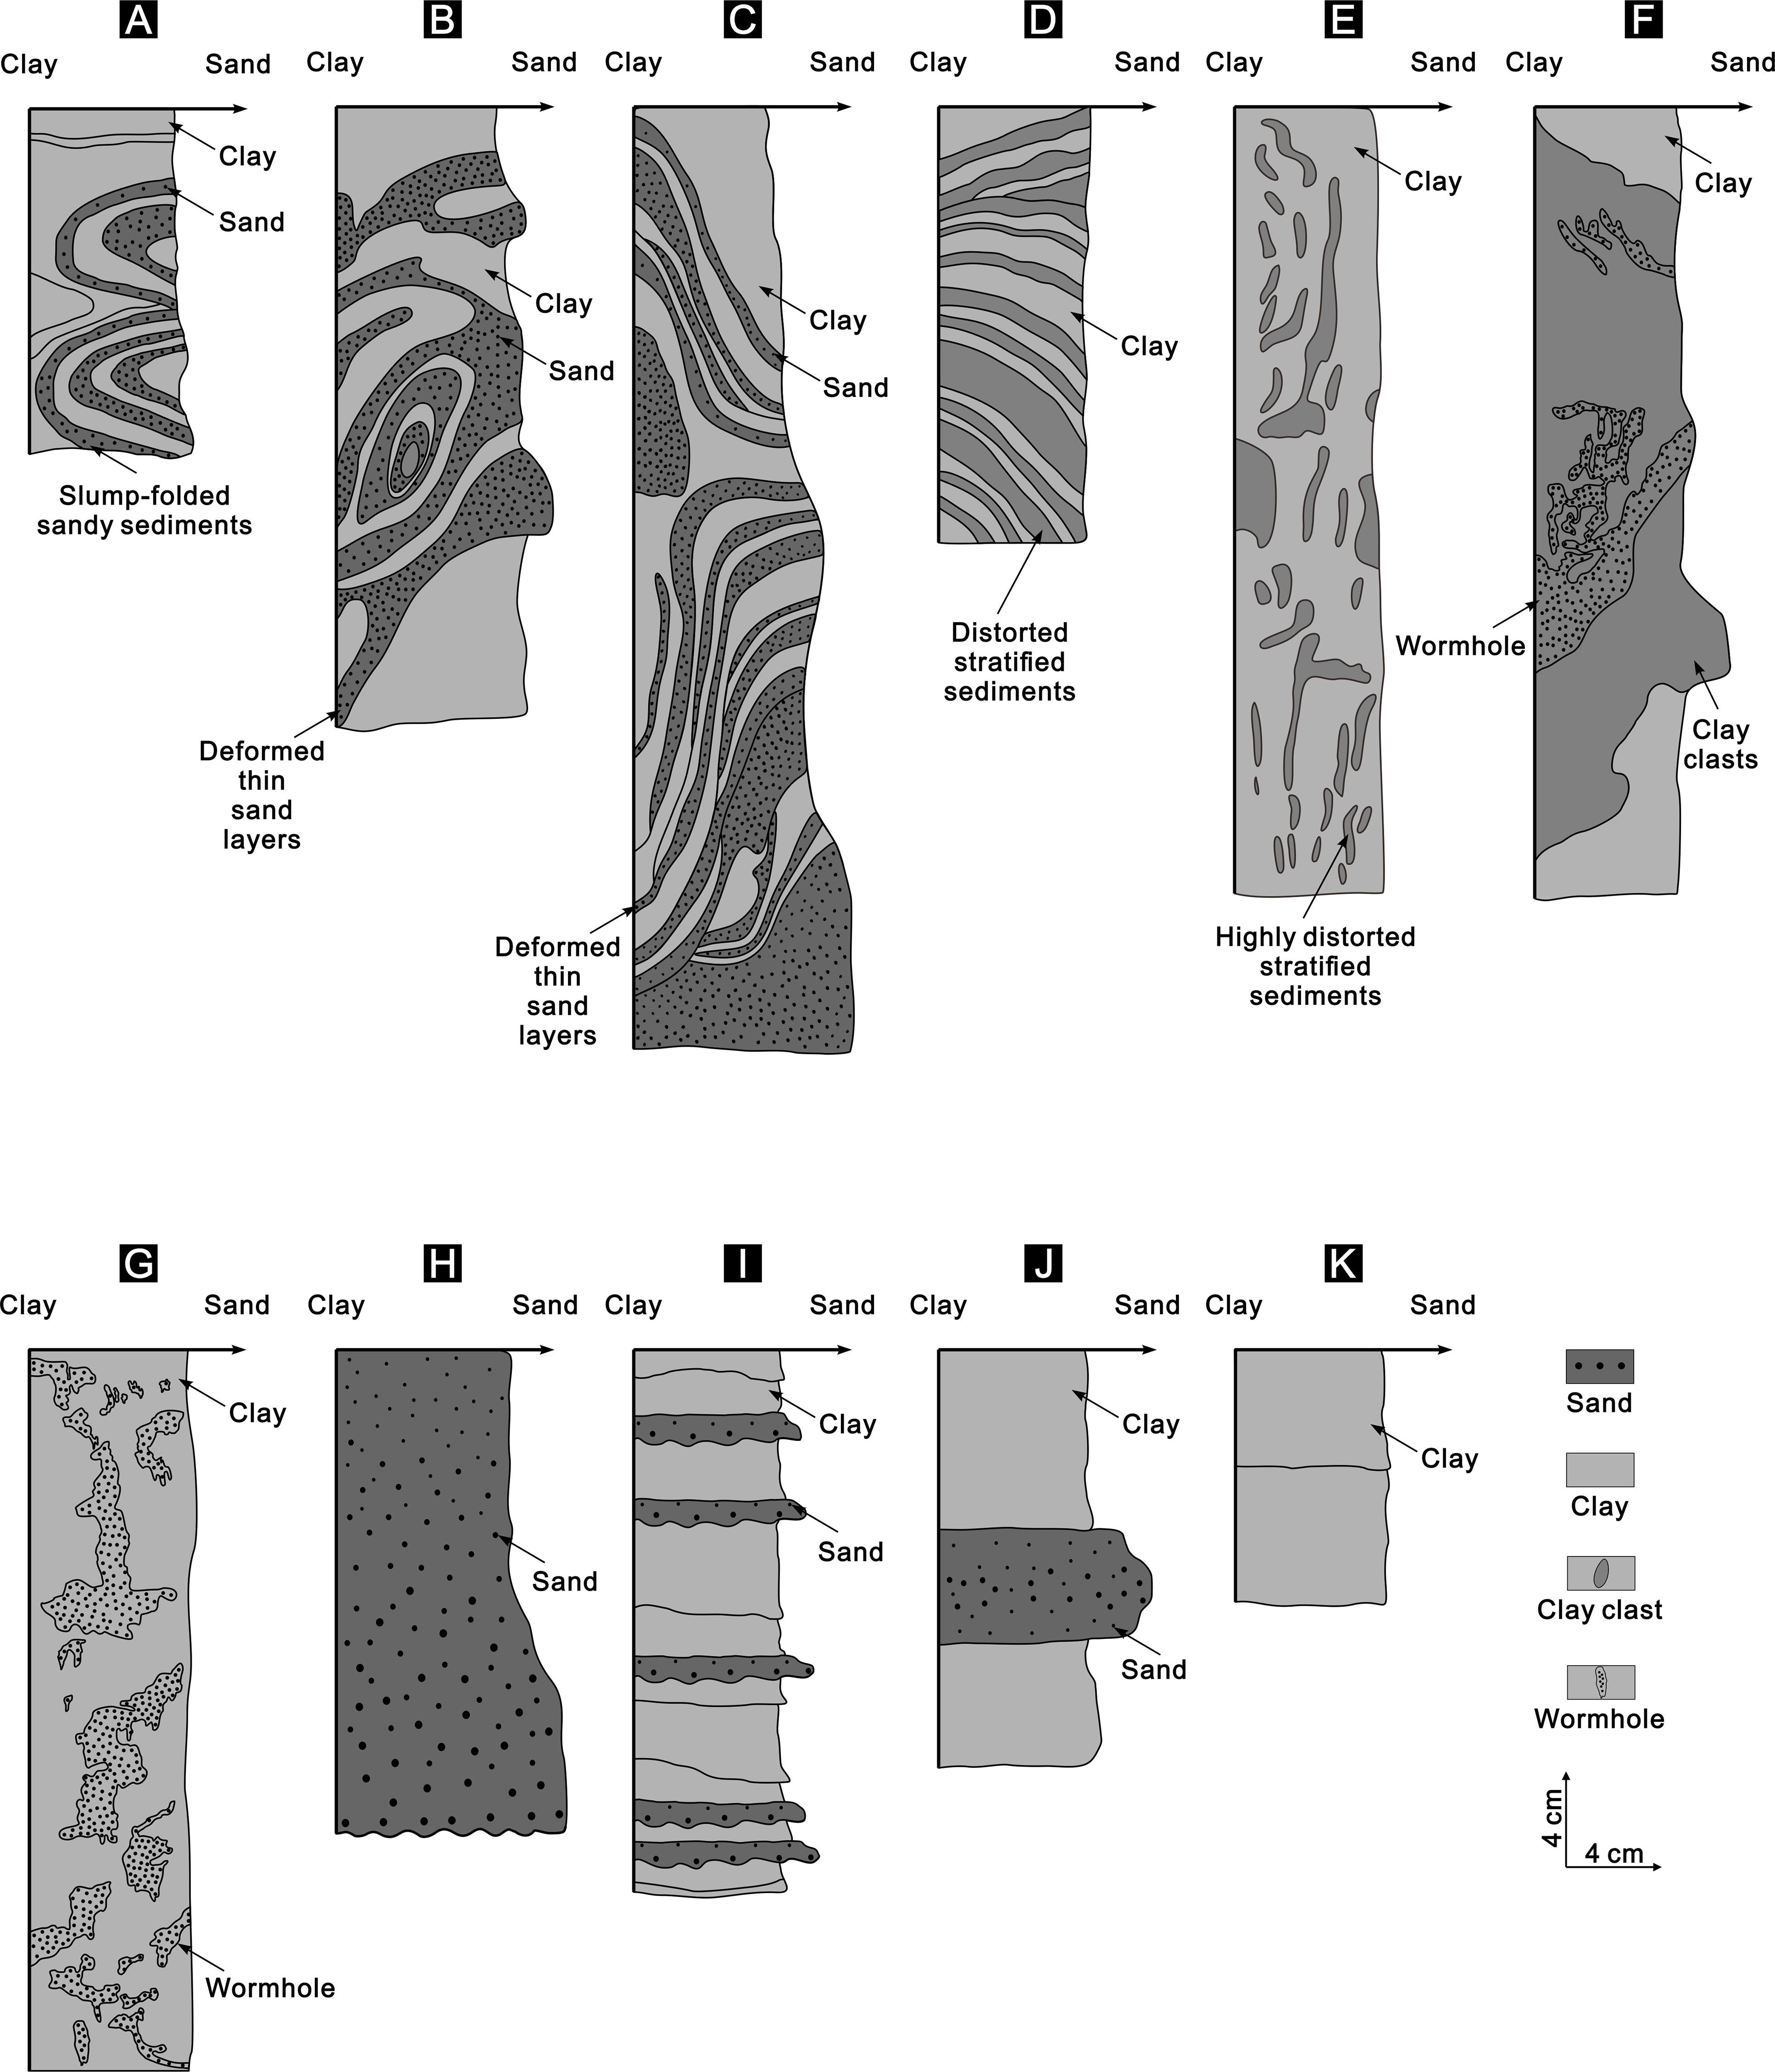
Figure 8. Typical core facies pattern diagram of Site W05. (A) Core Facies A: Slump-folded sandy sediment in clay. (B) Core Facies B: Deformed thin sand layers with clay clasts. (C) Core Facies C: Deformed thin sand layers. (D) Core Facies D: Distorted stratified sediments. (E) Core Facies E: Highly distorted stratified sediments. (F) Core Facies F: Clay clasts under bioturbation. (G) Core Facies G: Highly distorted stratified sediments under bioturbation. (H) Core Facies H: Single sand layer. (I) Core Facies I: Multiple thin sand layers. (J) Core Facies J: Bottom currents. (K) Core Facies K: Hemipelagic and pelagic deposits.
Internal characteristics of MTDs
Based on seismic and well logging data, three sets of MTDs, namely MTD1, MTD2, and MTD3, can be identified in the study area (Figures 3, 4). To enhance the understanding of the internal structural characteristics of MTDs from the bottom to the top, this work selected MTD1 for analysis due to its continuous core sampling. First, the core photographs of MTD1 and its upper and lower surface parts were analyzed (Supplementary Figures S1 and S2). Then, they were drawn so that different core features could be seen, such as sediment gravity flows, bottom currents, as well as hemipelagic and pelagic deposits (Figure 9).
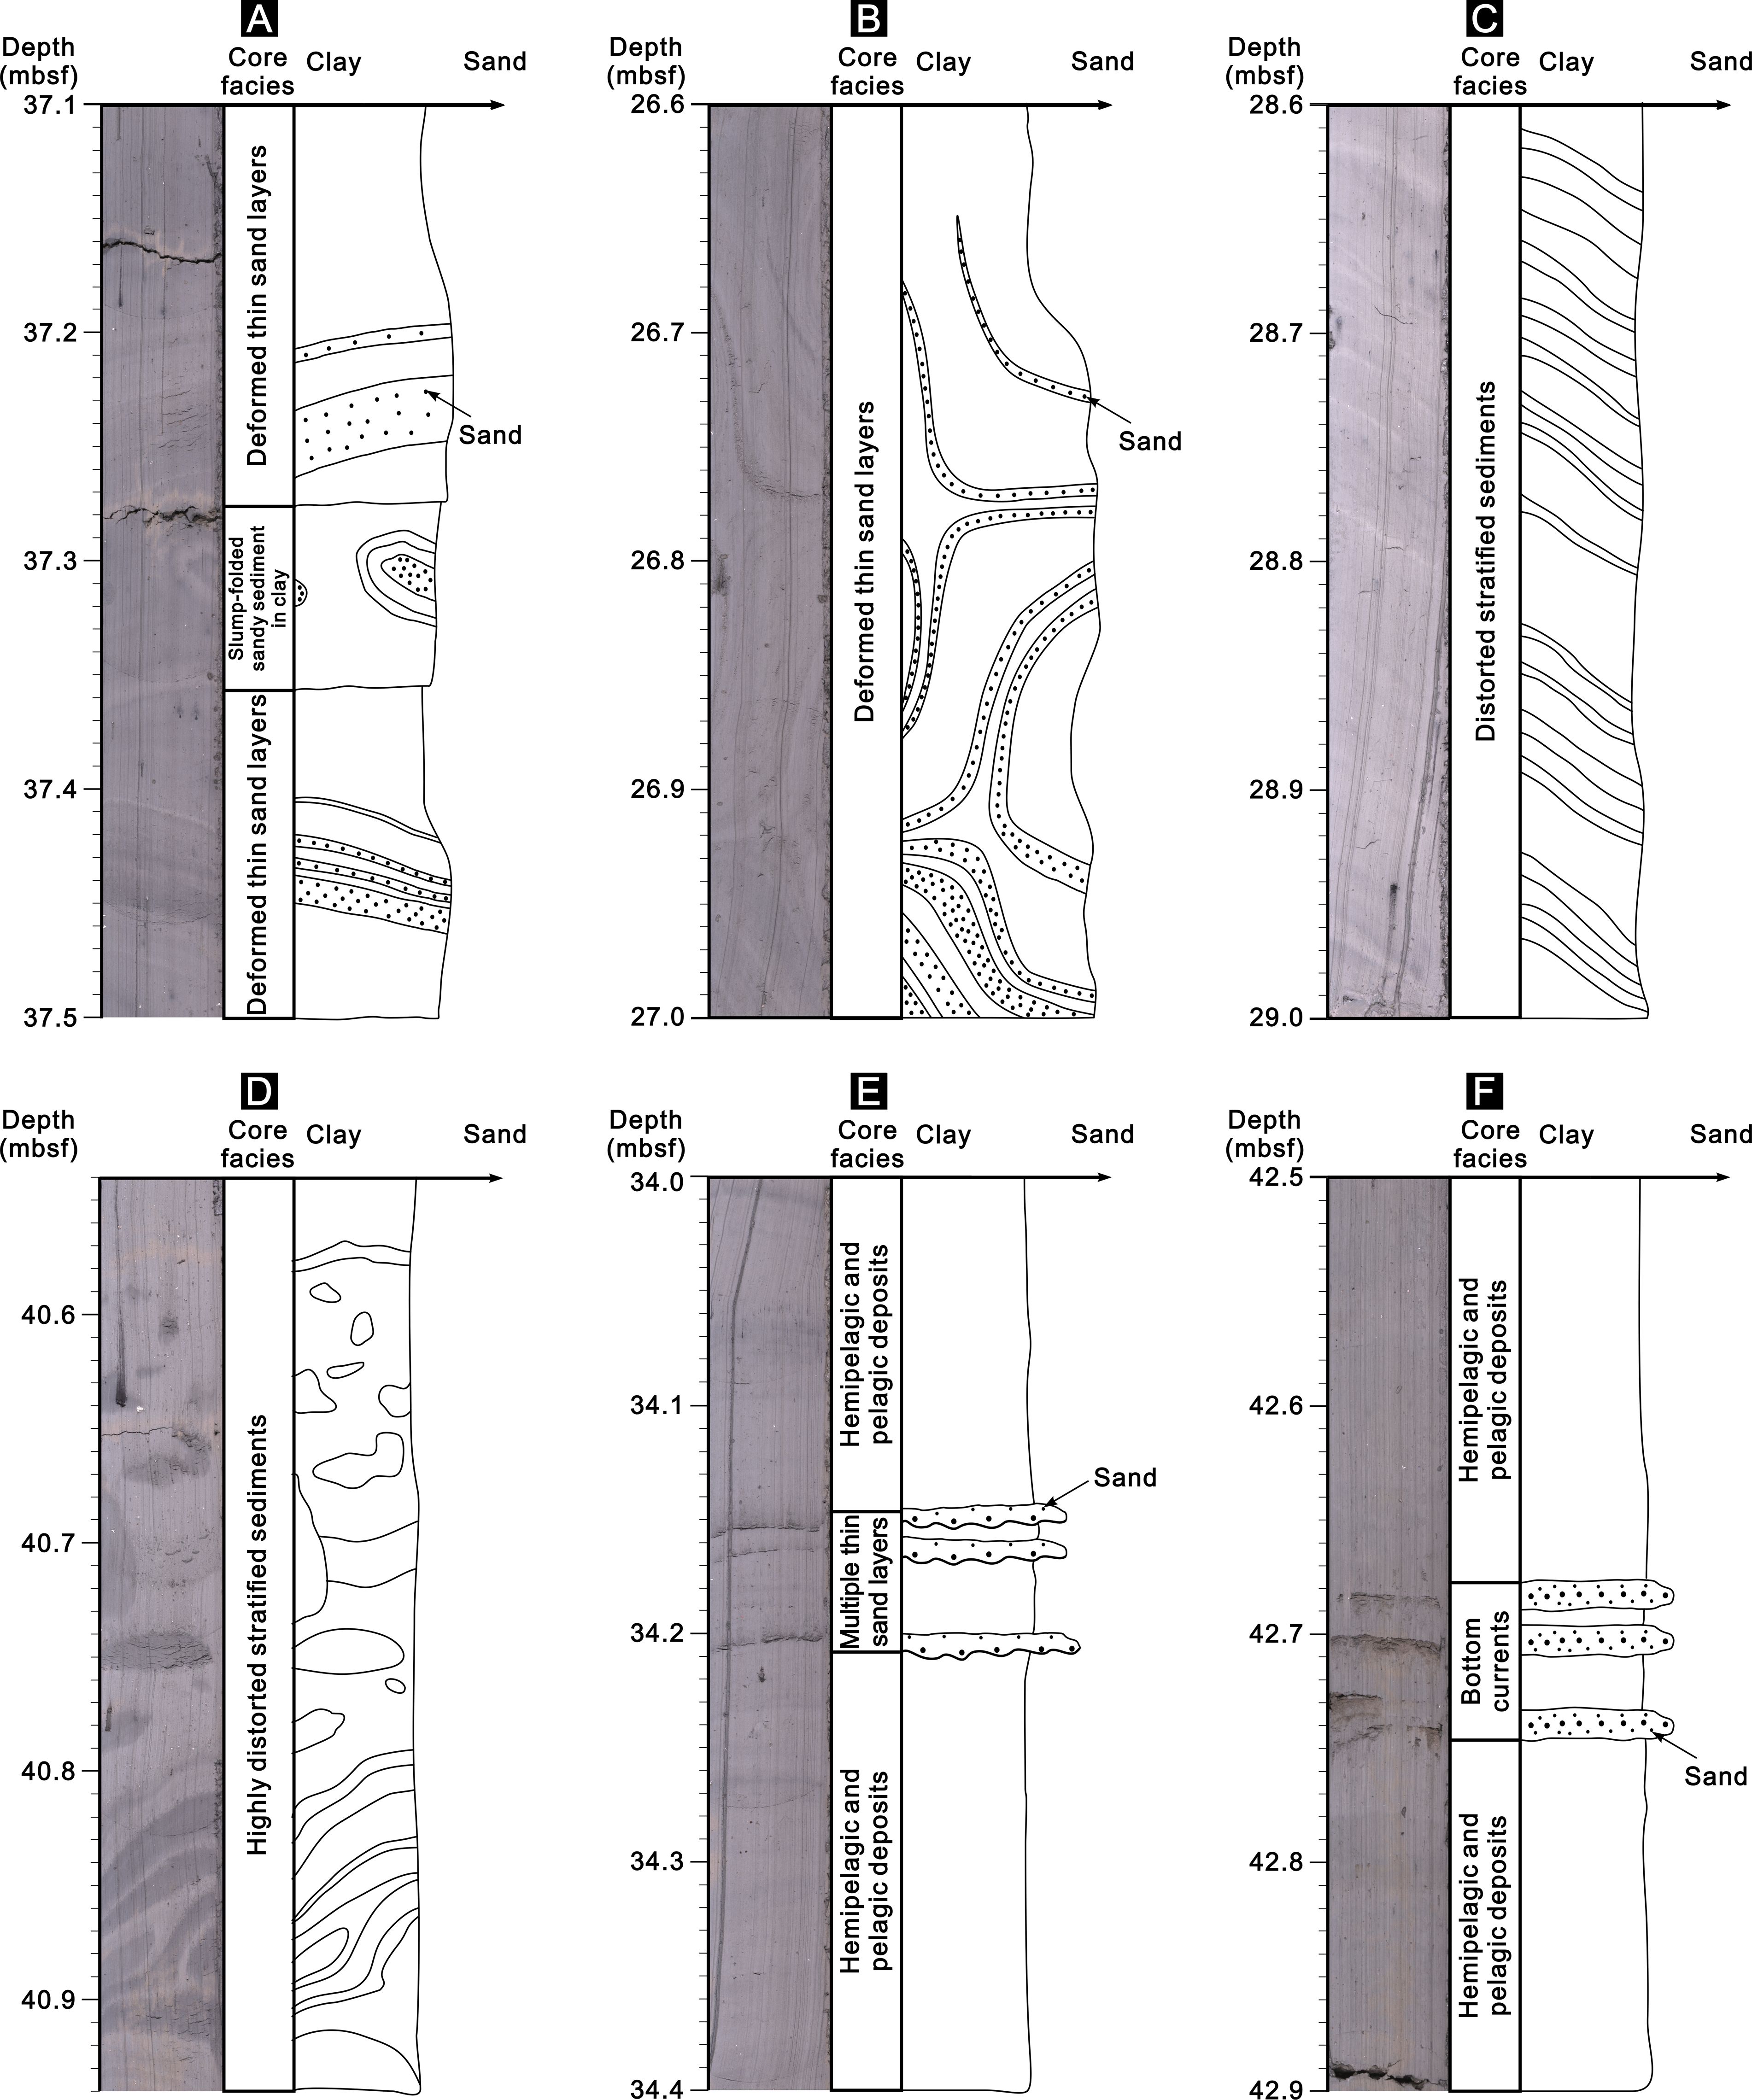
Figure 9. Typical core sketches of MTD1. (A) Green-grey clay mainly exhibits Core Facies A: Slump-folded sandy sediment in clay and Core Facies C: Deformed thin sand layers. (B) Green-grey clay, with a large number of sand layers visible, exhibits Core Facies C: Deformed thin sand layers. (C) Light grey clay exhibits Core Facies D: Distorted stratified sediments. (D) Green-grey clay exhibits Core Facies E: Highly distorted stratified sediments. (E) Green-grey clay with turbidite deposits, mainly characterized by Core Facies I: Multiple thin sand layers and Core Facies K: Hemipelagic and pelagic deposits. (F) Green-grey clay with bottom current deposits, mainly characterized by Core Facies J: Bottom currents and Core Facies K: Hemipelagic and pelagic deposits.
MTD1 is located approximately between 19 mbsf to 42 mbsf (Figure 3). This study, through the analysis of complete and continuous core samples between 18 mbsf to 43 mbsf, has identified a variety of core facies types. Core facies A exhibits the development of slump-folded deformed sediments within the layer extending from 37.28 mbsf to 37.36 mbsf (Figure 9A). The scale is not large, with several centimeters in size, and filled with sandy sediments internally. Core Facies C primarily consists of a large number of deformed thin sand layers, with the thickness generally being about 1 cm (Figure 9B). The shapes are mainly in the form of elongated strips with irregular extension directions. Core Facies D is primarily distinguished by variations in the orientation of the strata (Figure 9C). This core facies exhibits relatively weak internal deformation of the sediments, along with a notably large dip angle of the sedimentary layers, which is also evident in the well logging data (Figure 3). Core Facies E exhibits the most intense deformation, characterized by a significant presence of irregular sedimentary masses (Figure 9D). These masses are predominantly composed of dark grey clay, which is distinctly separated from the in-situ sediments and situated at the base of MTD1 (Figure 3).
The above are core facies of different types of MTDs (Figures 9A–D). According to core data, MTD1 is characterized by the presence of turbidity currents (Figure 9E) and hemipelagic and pelagic deposits (Figure 9E). Additionally, bottom currents have been identified in the underlying strata of MTD1 (Figure 9F), indicating the complexity of the sedimentary processes. Turbidite deposits are mainly composed of multiple thin sand layers with a thickness of about 0.5 cm, and the thickness of the bottom current deposits is also relatively small, approximately 1 cm (Figures 9E, F).
Discussion
Identification of MTDs in different datasets with various resolutions
Based on the results obtained from the text above, it can be observed that different data sources have varying resolutions. Seismic data has the lowest vertical resolution, often showing a set of MTDs as a whole with chaotic, low-amplitude reflections, like MTD1 (Figures 2, 4B) (Cardona et al., 2022). Well logging data exhibits a higher resolution, allowing for the differentiation of multiple small-scale MTDs, such as MTD1a, within a given set. This distinction is based on parameters including P-wave velocity, density, and dip logging (Figures 3, 10) (Sun and Alves, 2020; Crutchley et al., 2022). When combined with core samples, studying the core facies can show how each small-scale MTDs is structured inside (Supplementary Figures S1, S2; Figures 9, 11) (Tripsanas et al., 2008; Lu et al., 2020). For instance, the MTD1 described in this study is composed of MTD1a, MTD1b, and MTD1c on log-scale data (Figure 10). It is evident that within large sets of MTDs, there are hemipelagic and pelagic deposits, and even turbidite deposits, which are different from what is observed on seismic-scale profiles (Figure 4B). According to the core-scale vertical high-resolution core facies, each small-scale MTDs, such as MTD1a, MTD1b, and MTD1c, is composed of various sedimentary systems. Additionally, these deposits exhibit the development of both hemipelagic and pelagic sediments internally. (Figure 11). From this, it can be seen that differences in data resolution can lead to variations in the identification of MTDs, a phenomenon also observed in other study areas (Crutchley et al., 2022; Lu et al., 2025).
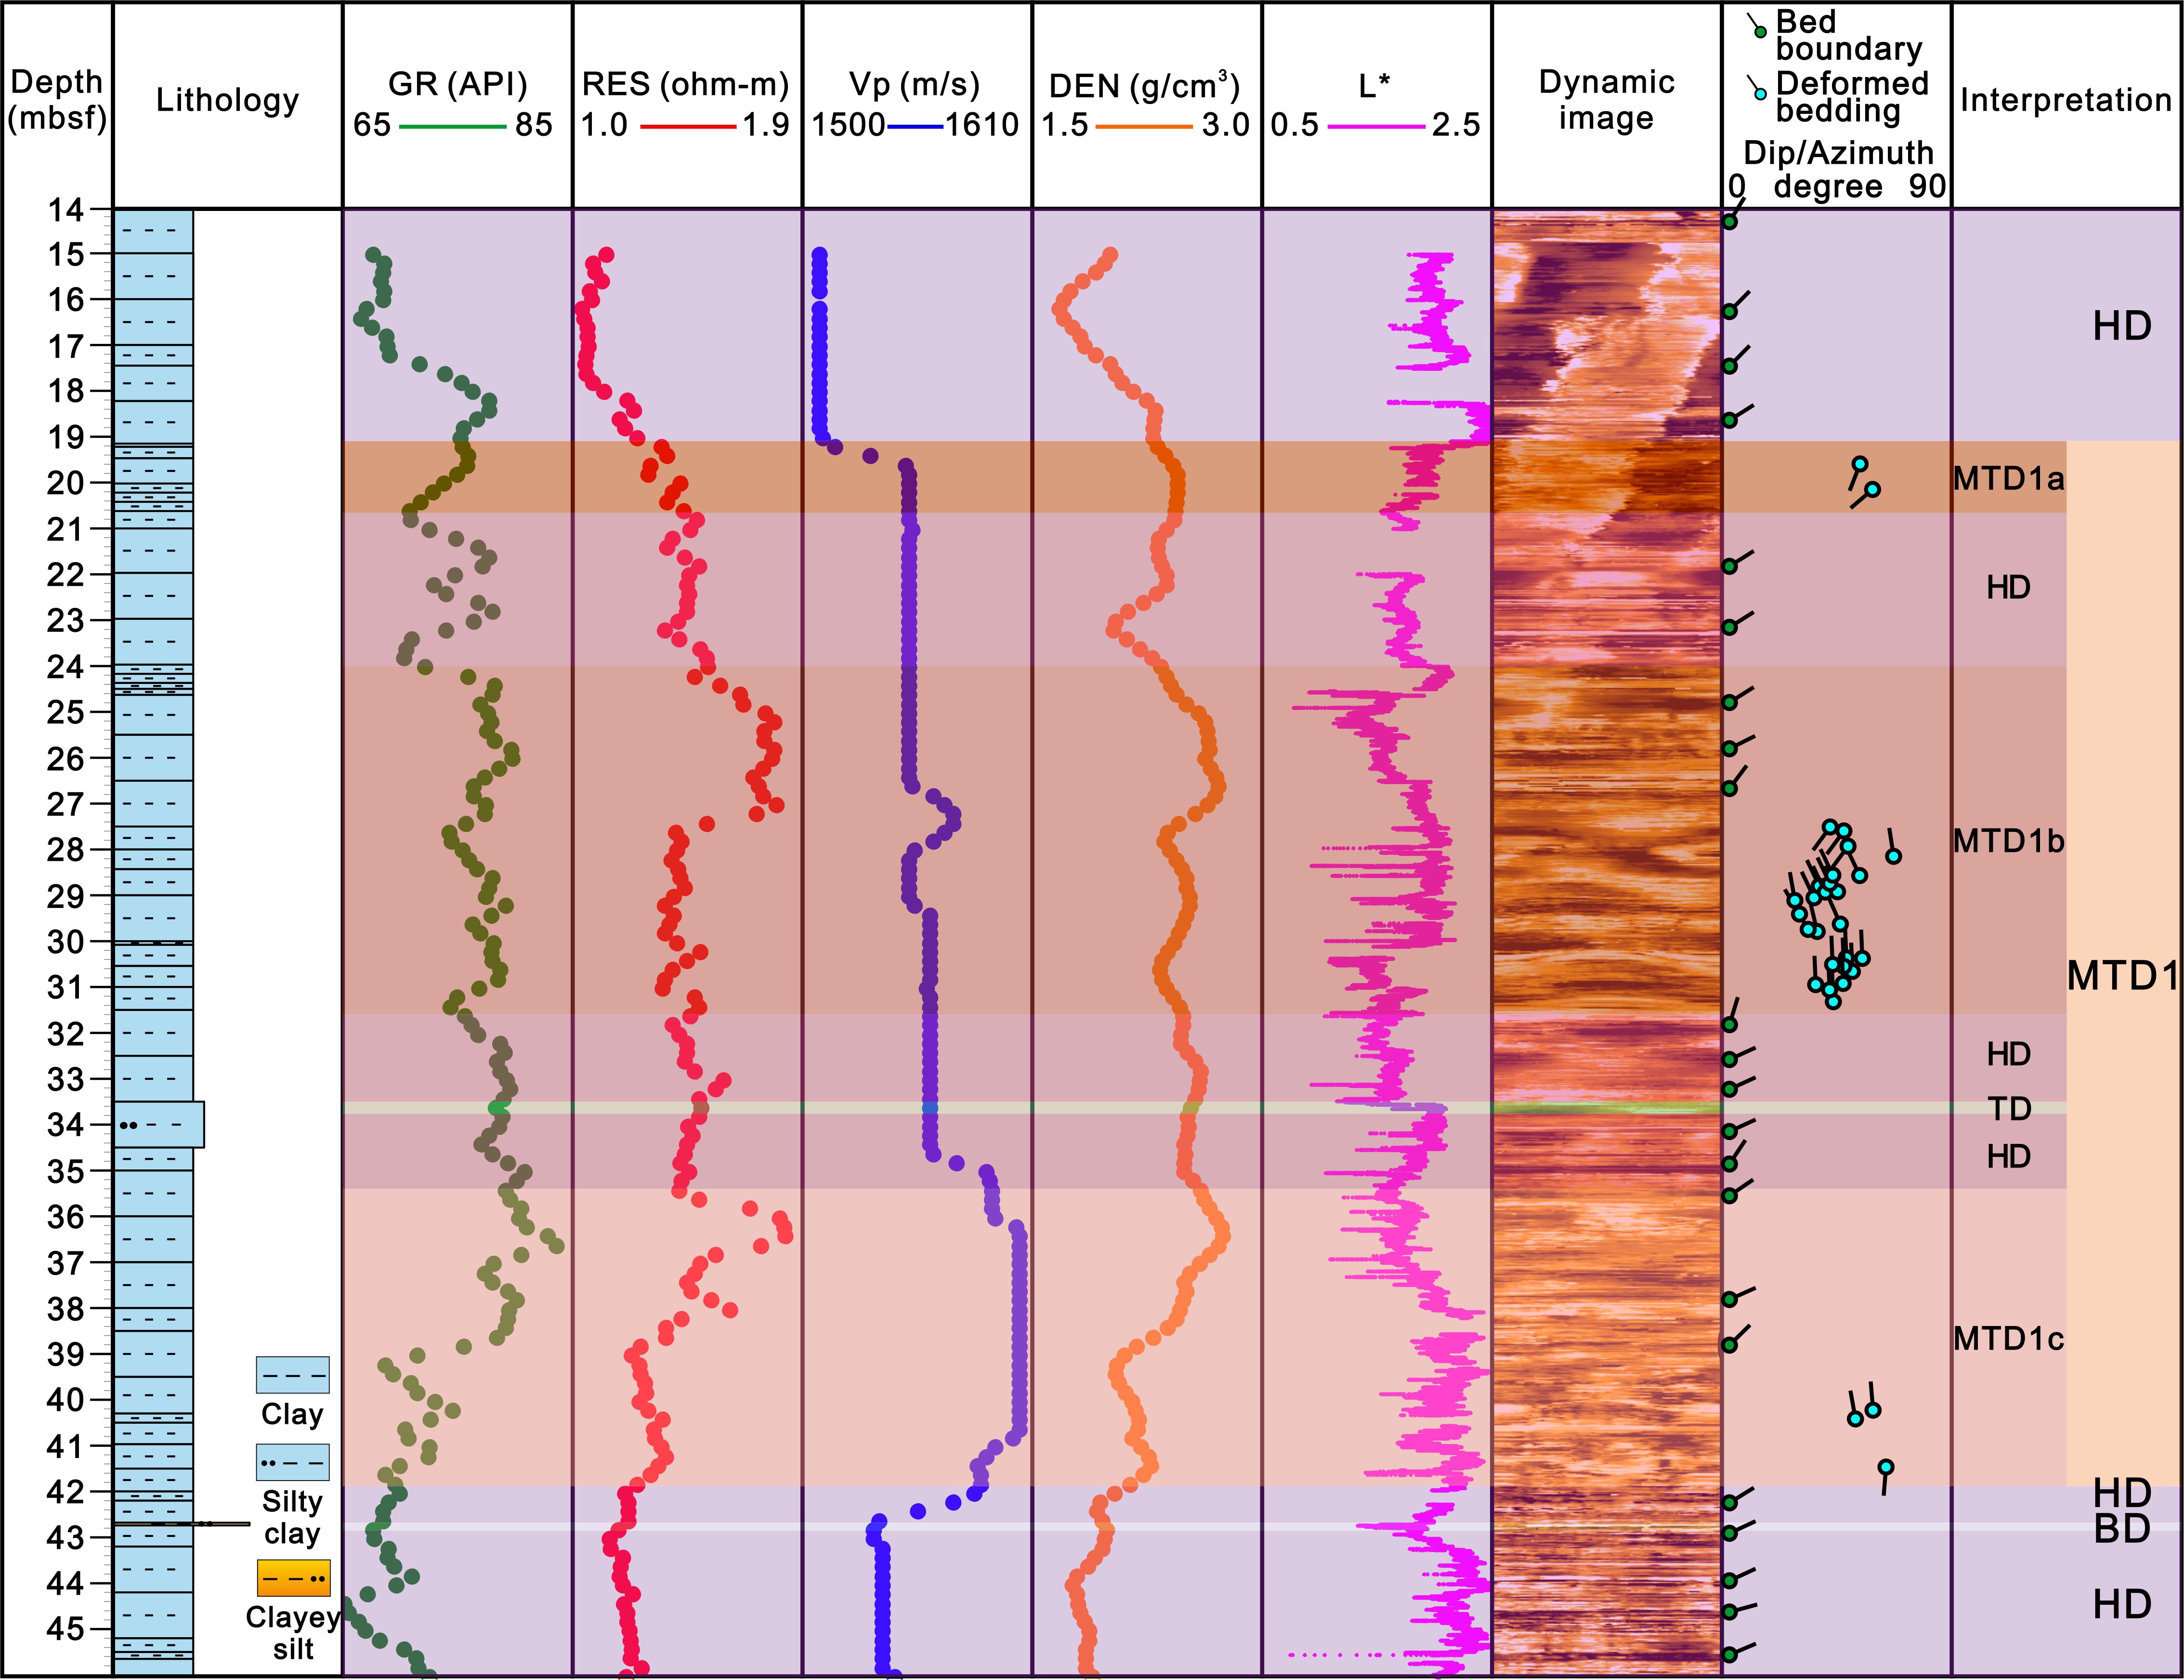
Figure 10. Lithology-logging integrated interpretation diagram of MTD1. HD: Hemipelagic and pelagic deposits; TD: Turbidite deposits; BD: Bottom current deposits.
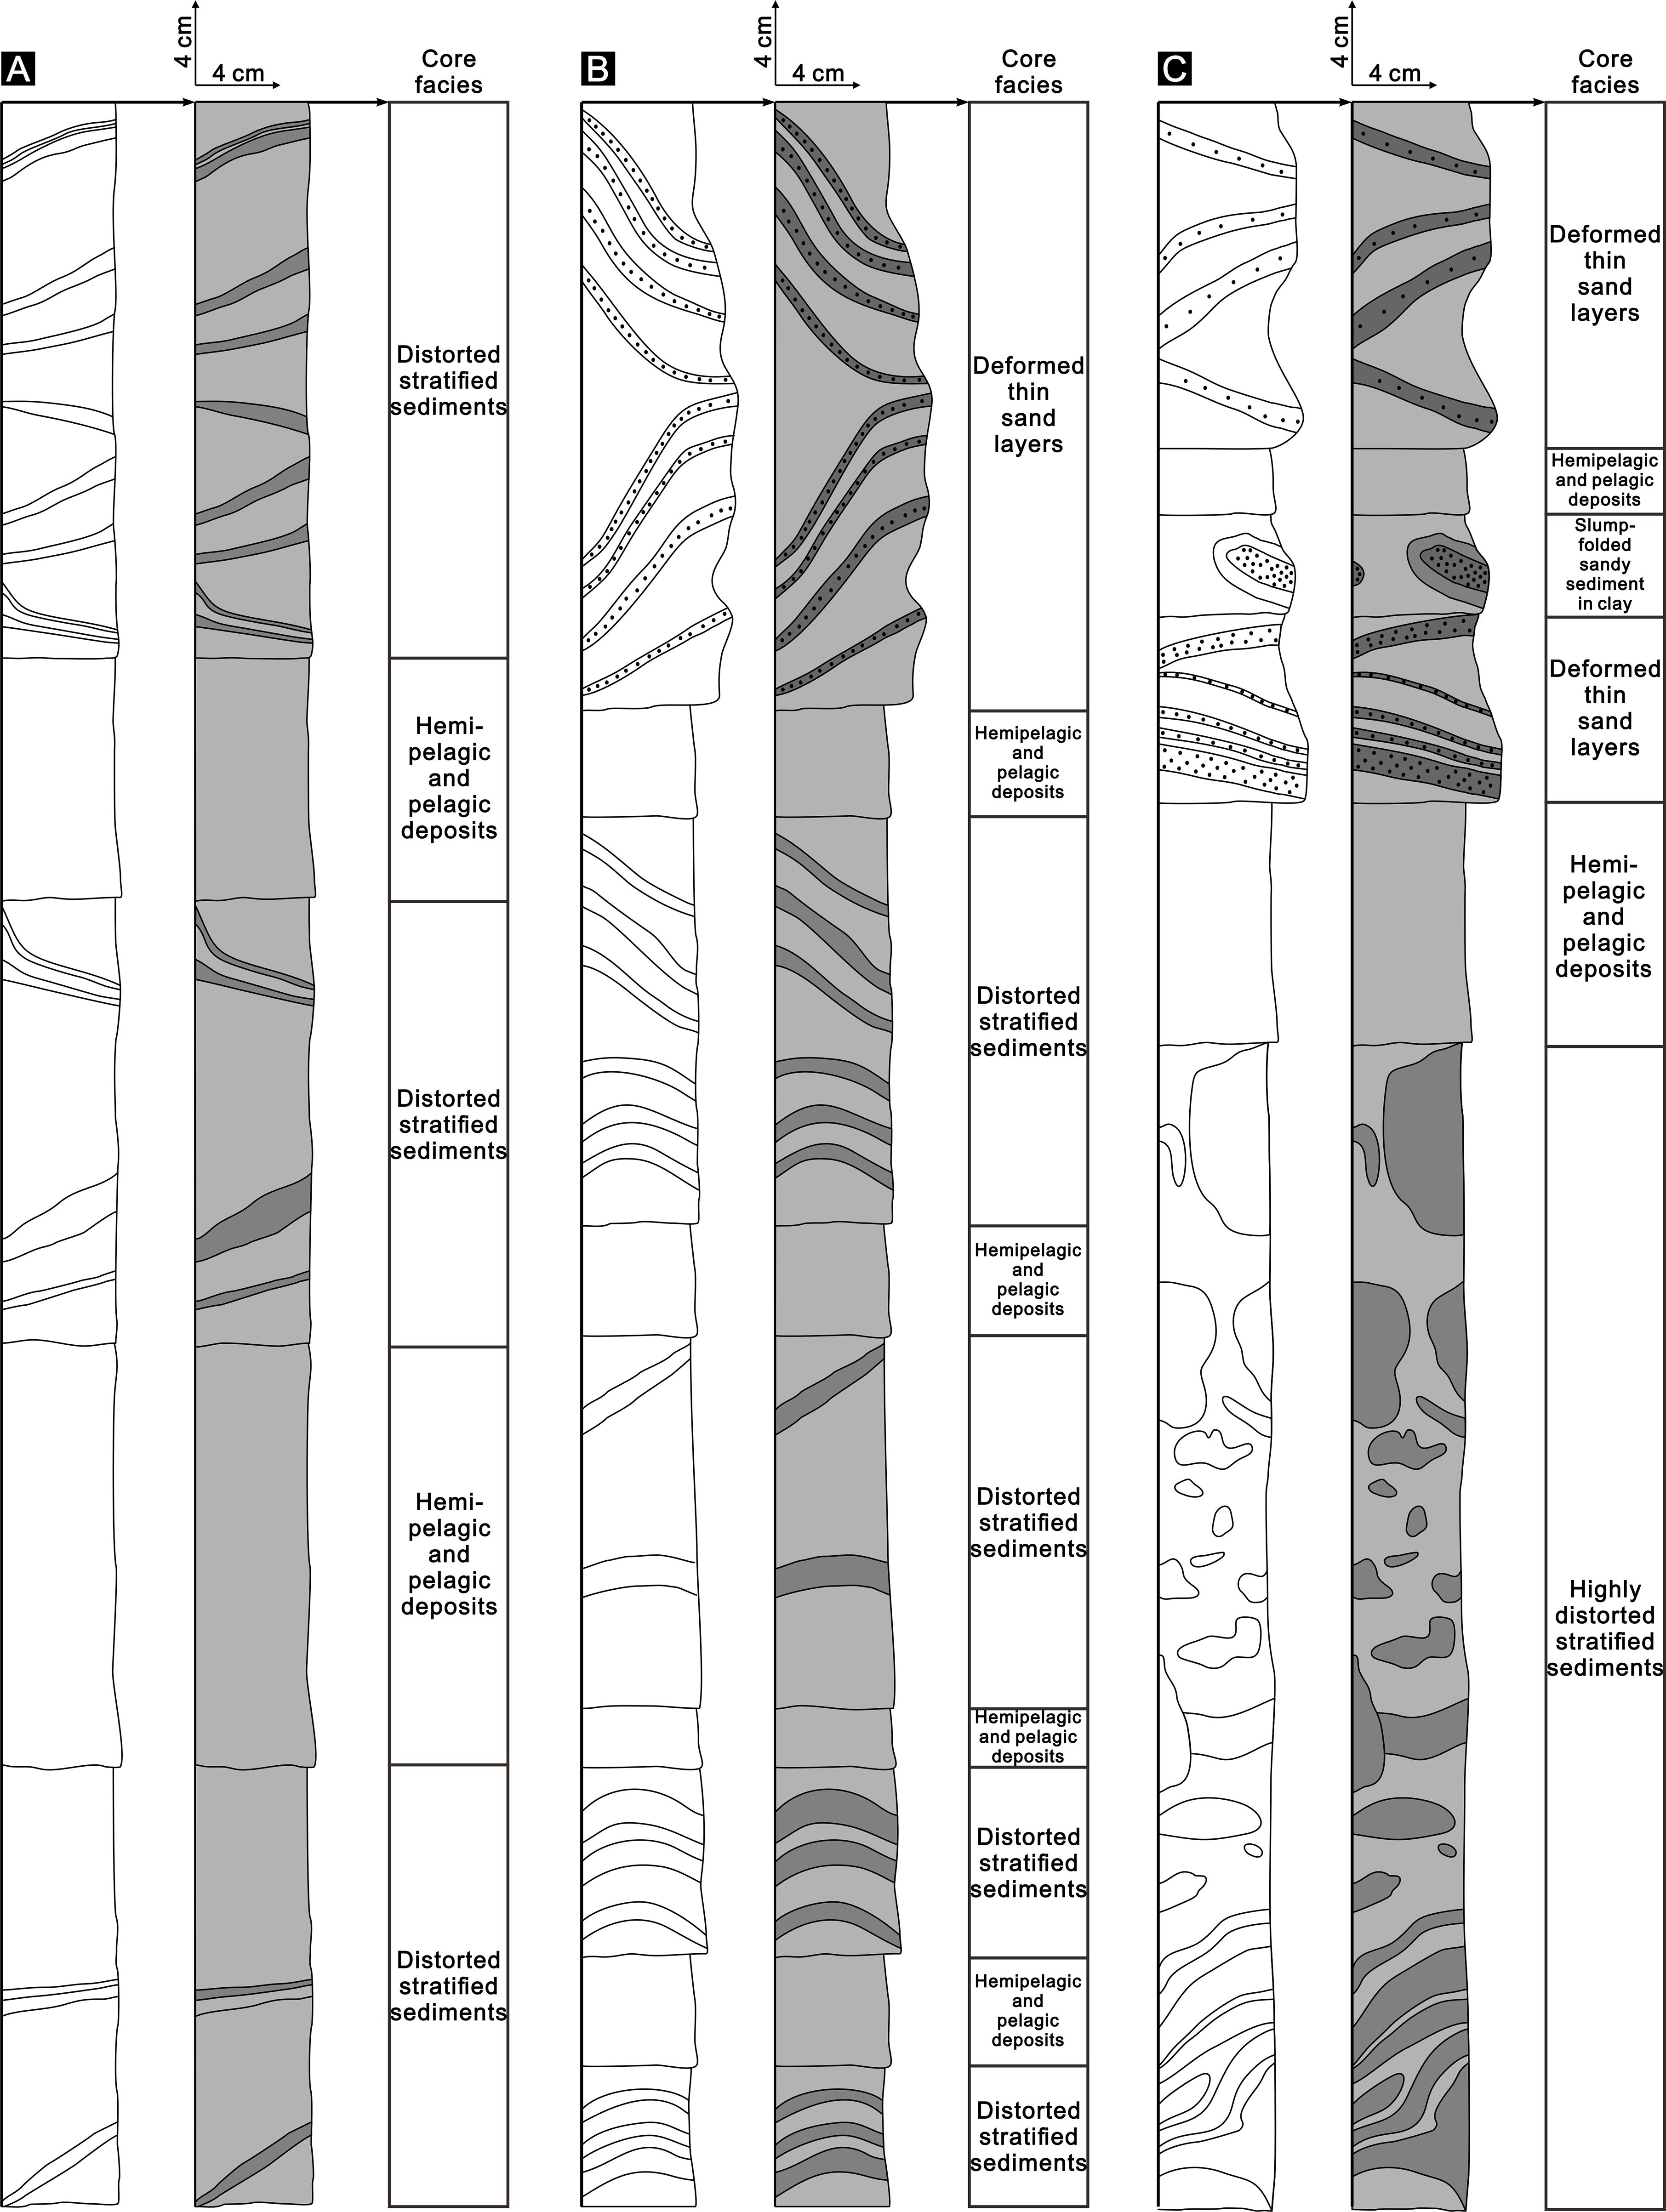
Figure 11. Core facies pattern diagram of MTD1. (A) MTD1a core facies pattern diagram. (B) MTD1b core facies pattern diagram. (C) MTD1c core facies pattern diagram.
Based on the well logging data and core facies, this work has delineated the MTD1a interval, which is approximately located between 19.15 and 20.65 mbsf (Figure 10). On the logs, the P-wave velocity of this layer exhibits a marked increase from approximately 1500 m/s to around 1550 m/s. Concurrently, there is an observed rise in density, accompanied by a sudden alteration in dip (Sun and Alves, 2020; Crutchley et al., 2022). In the cores (Supplementary Figures S1, S2; Figures 9, 11), MTD1a primarily develops two types of core facies, including Core Facies D and Core Facies K. It is evident that hemipelagic and pelagic deposits develop within MTD1a.
MTD1b is roughly between 24.00 and 31.60 mbsf (Figure 10), where the P-wave velocity remains relatively constant. The density is slightly higher than in the MTD1a, and the dip changes are also very clear. In the cores (Supplementary Figures S1, S2; Figures 9, 11), MTD1b develops three types of core facies, which are Core Facies C, Core Facies D, and Core Facies K. Particularly, the development of deformed thin sand layers is compelling evidence of the existence of MTDs, which have also been discovered in the Pearl River Mouth Basin in the northern South China Sea and are likely mainly debris flows (Moscardelli and Wood, 2008; Sobiesiak et al., 2018; Lu et al., 2025).
MTD1c is located approximately between 35.40 and 41.90 mbsf, with an overall thickness of about 6.50 m, which is slightly reduced compared to MTD1b (Figure 10). Logs show that MTD1c is characterized by an increase in P-wave velocity and density, which is corresponding with the IODP sites all over the world (Sun and Alves, 2020). The core exhibits a more complex pattern with various deformation features (Supplementary Figures S1 and S2, Figures 9 and 11). The core deformation is severe, which develops four distinct core facies, including Core Facies A, Core Facies C, Core Facies E, and Core Facies K. Based on the core facies, MTD1c may mainly consist of slumps and debris flows, which is very similar to the Storegga slide (Moscardelli and Wood, 2008; Sobiesiak et al., 2018; Karstens et al., 2023). Furthermore, the phenomenon of sediment deformation can also be observed at outcrops (Shanmugam, 2012).
There is a significant difference in the identification of MTDs based on different resolutions, such as core-log-seismic data. MTDs are not entirely composed of deformed sediments; they also include a large number of hemipelagic and pelagic deposits and even turbidite deposits, providing strong evidence for understanding the sedimentary processes of MTDs.
Sedimentary processes and patterns of MTDs
For a long time, the sedimentary processes and patterns of MTDs have been inconclusive. Due to the lack of complete and continuous core samples, little literature clearly and distinctly points out their sedimentary processes (Bull et al., 2009; Shanmugam, 2022). It is known that MTDs are complex sedimentary bodies resulting from the collapse and seaward transportation of slope sediments, but how are the sets of MTDs observed on seismic profiles formed?
Based on high-resolution core data, patterns for the sedimentary process of MTDs have been proposed. The first pattern, referred to as Pattern 1, is characterized by a slope leading to the deep-sea basin that comprises undisturbed in situ sediments. These sediments are generally classified as hemipelagic and pelagic deposits (Figure 12A). Subsequently, the slope becomes unstable and experiences a collapse, resulting in the transport of a significant volume of sediments to the deep-sea basin. These sediments subsequently cover the existing in situ hemipelagic and pelagic deposits, leading to the formation of MTDs, which bear some resemblance to free-slip flows (Figure 12B) (Sobiesiak et al., 2018). In this case, if drilling is conducted here, like Site W05, when core samples are collected, hemipelagic and pelagic deposits or turbidite deposits within the MTDs cannot be found. Consequently, this observed pattern does not correspond with the actual geological conditions.

Figure 12. Sedimentary processes and patterns of MTDs (not to scale). (A) In situ undisturbed sediments are mostly hemipelagic and pelagic deposits in the deep-water area. (B) Pattern 1: Slope sediments collapse and directly overlay the in situ hemipelagic and pelagic deposits, which do not correspond to the actual geological situation. (C) Pattern 2: After the collapse of slope sediments, they are transported seaward. Sediments that are in close proximity to the slope directly overlay the in situ hemipelagic and pelagic deposits, while those located near the deep-sea basin intermingle with these in situ deposits, resulting in a complex sedimentary body. (D) Pattern 3, after MTDs deposition, hemipelagic and pelagic deposits are laid above the complex sedimentary body, followed by a repetition of the sedimentary process shown in Pattern 2.
Next is Pattern 2, similar to Pattern 1, where slope sediments become unstable and are transported seaward. Sediments close to the slope cover the in situ hemipelagic and pelagic deposits. In contrast, sediments that are located further from the slope interact with the underlying sediments during transportation, resulting in the formation of a complex sedimentary body. This process is analogous to no-slip flows (Figure 12C) (Sobiesiak et al., 2018). This pattern can explain the presence of hemipelagic and pelagic deposits in MTD1 (Figure 10). Moreover, unlike Pattern 2, Pattern 3 spans a longer time frame, encompassing multiple episodes of slumping and sedimentation processes (Figure 12D). After the first instability event ends, hemipelagic and pelagic deposits are deposited in the study area, covering the complex sediments. Subsequently, the newly formed slope becomes unstable and collapses once more. This process results in the transportation of new slope sediments seaward, thereby repeating the previously described processes and leading to the formation of another set of small-scale MTDs. This cycle continues, ultimately culminating in the development of large-scale MTDs. This pattern can explain the development of hemipelagic and pelagic deposits and even turbidite deposits within MTD1, and it can also explain why hemipelagic and pelagic deposits are developed within MTD1a, which more closely aligns with real-world scenarios (Figure 11).
Dynamic interaction between MTDs and gas hydrates
Gas hydrates are ice-like solid compounds with a cage-like structure formed by the combination of relatively low molecular weight gases such as methane and water under low temperature, high pressure conditions (Sloan, 2003), and about 95% of them are found in continental margins (Beaudoin et al., 2014). According to well logging data and seismic interpretation, it is evident that Site W05 drilled into tens of meters of turbidite sands beneath the MTDs, which also serves as a reservoir for gas hydrates (Figure 3). The sharp increase in the RES logging and Vp logging curves can be used to identify the gas hydrate layer. Specifically, RES values reach up to 200 ohm·m, while Vp exceeds 3000 m/s, occurring approximately between 127 mbsf and 137 mbsf. Drilling results from multiple wells indicated that a large-scale flat-lying transitional sandy gas hydrate system is developed in the study area. The reservoir mainly composed of coarse-grained channel-levee and lobe bodies, covering an area of several square kilometers (Kuang et al., 2023). The relationship between MTDs and the accumulation of gas hydrates has been widely researched globally (Jung and Vogt, 2004; Boswell et al., 2012). This work has also discovered the phenomenon of multiple large-scale MTDs coexisting with gas hydrates in the deep-water area of the QDNB in the northern SCS (Figures 2, 3).
The dissociation of gas hydrates in the continental slope can trigger MTDs, and the formation of MTDs in the deep-sea plain can also influence the accumulation and dissociation of gas hydrates (Maslin et al., 2004; Wang et al., 2024). Specifically, suppose gas hydrate accumulation first and is subsequently covered by MTDs, which is Cycle ① (Figures 13A, B). In that case, MTDs can alter the temperature and pressure conditions of the environment where gas hydrates are located. This alteration disrupts the stability zone of gas hydrates, resulting in an upward shift of its base. Consequently, this process may lead to the dissociation of the hydrates (Figure 13B) (Wang et al., 2024). As exploration progresses, a large number of active cold seeps and seepage-type gas hydrate systems have been discovered in the QDNB (Feng et al., 2018; Ye et al., 2019). Based on the U/Th and AMS 14C dating of cold seep carbonates, the dissociation of gas hydrates occurred in three episodes: approximately from 136.3 ka to 114.6 ka, from 48.5 ka to 42.7 ka, and from 11.6 ka to 9.5 ka. These events may be related to three phases of the widespread MTDs development (Wei et al., 2022; Zhang et al., 2023). This also indicates that the accumulation and dissociation of gas hydrates in the study area are dynamic. Therefore, Cycle ① proceeds to the next phase, where deep thermogenic gas and shallow biogenic gas migrate to the gas hydrate stability zone to accumulate and re-form large-scale gas hydrates (Figure 13C). Subsequently, another phase of large-scale MTDs deposition leads to the dissociation of gas hydrates (Figure 13D), which then repeats the process of free gas and gas hydrate accumulation stage (Figure 13C).

Figure 13. Dynamic interaction between MTDs and gas hydrates (not to scale). (A) Gas hydrate accumulation stage, with hemipelagic and pelagic deposits covering them. (B) After the development of thick MTDs, the base of the gas hydrate stability zone is raised, leading to the dissociation of gas hydrates. (C) Due to their internal density and low porosity and permeability, MTDs serve as a seal that traps free gas. This process facilitates the accumulation of gas hydrates within the sand layer. (D) Another MTDs deposition leads to the dissociation of gas hydrates, entering a dynamic accumulation process.
Conversely, suppose MTDs form first, which is Cycle ② (Figure 13B). In that case, the fine-grained MTDs are denser internally, with lower porosity and permeability, making them an excellent seal for gas hydrates and shallow gas (Wang et al., 2011; Cheng et al., 2021; Crutchley et al., 2021; Wu et al., 2021). When free gas migrates to shallower regions and accumulates, MTDs can act as seals, inhibiting the vertical migration of gas. This process consequently facilitates the formation of extensive lateral gas hydrates (Figure 13C) (Kuang et al., 2023). Subsequently, it becomes caught in a dynamic cycle of multi-phase MTDs deposition and gas hydrate dissociation, and then free gas and gas hydrate accumulation (Figures 13C, D). Additionally, Cycle ③ directly transitions from gas hydrate accumulation to the deposition of multi-phase MTDs, leading to gas hydrate dissociation (Figures 13A, B). However, it ultimately enters the free gas and gas hydrate accumulation stage, remaining in a dynamic process (Figures 13C, D). Overall, the formation of gas hydrates is intricately linked to MTDs, exhibiting a dynamic coupling relationship between the two. Nevertheless, the spatio-temporal coupling mechanism between the two still requires in-depth research.
Sedimentary model in the deep-water area of the QDNB
The QDNB, located in the northwestern SCS, has a complex sedimentary process and a variety of sedimentary systems (Gong et al., 2020; Su et al., 2020; Zhong and Peng, 2021; Chen et al., 2022; Li et al., 2024). This study, utilizing comprehensive and continuous core data, a substantial volume of logging-while-drilling data, and high-resolution 3D seismic data, has successfully identified and characterized sediment gravity flows. This includes MTDs, turbidity currents, as well as bottom currents. Additionally, it has examined hemipelagic and pelagic deposits, thereby establishing a sedimentary model for the deep-water area (Figure 14A). The formation of MTDs is mainly due to the instability of slope sediments, which are transported to the deep-sea. From a profile, MTDs can include slides, slumps and debris flows (Moscardelli and Wood, 2008; Sobiesiak et al., 2018). The bottom of the MTDs will erode the underlying strata, causing deformation and then mixing with in situ hemipelagic and pelagic deposits (Figure 14B). Turbidity currents also mainly originate from the slope, transporting sediments through turbidite channels and deposits. The evidence of bottom current development in the core proves the existence of bottom water in the northern SCS, providing a basis for the study of the deep-water circulation in this area (Yuan, 2002; Liu et al., 2010, 2017; Chen et al., 2019; Wang et al., 2019b). In addition, hemipelagic and pelagic deposits are also developed, mainly located in the slope and deep-sea areas.
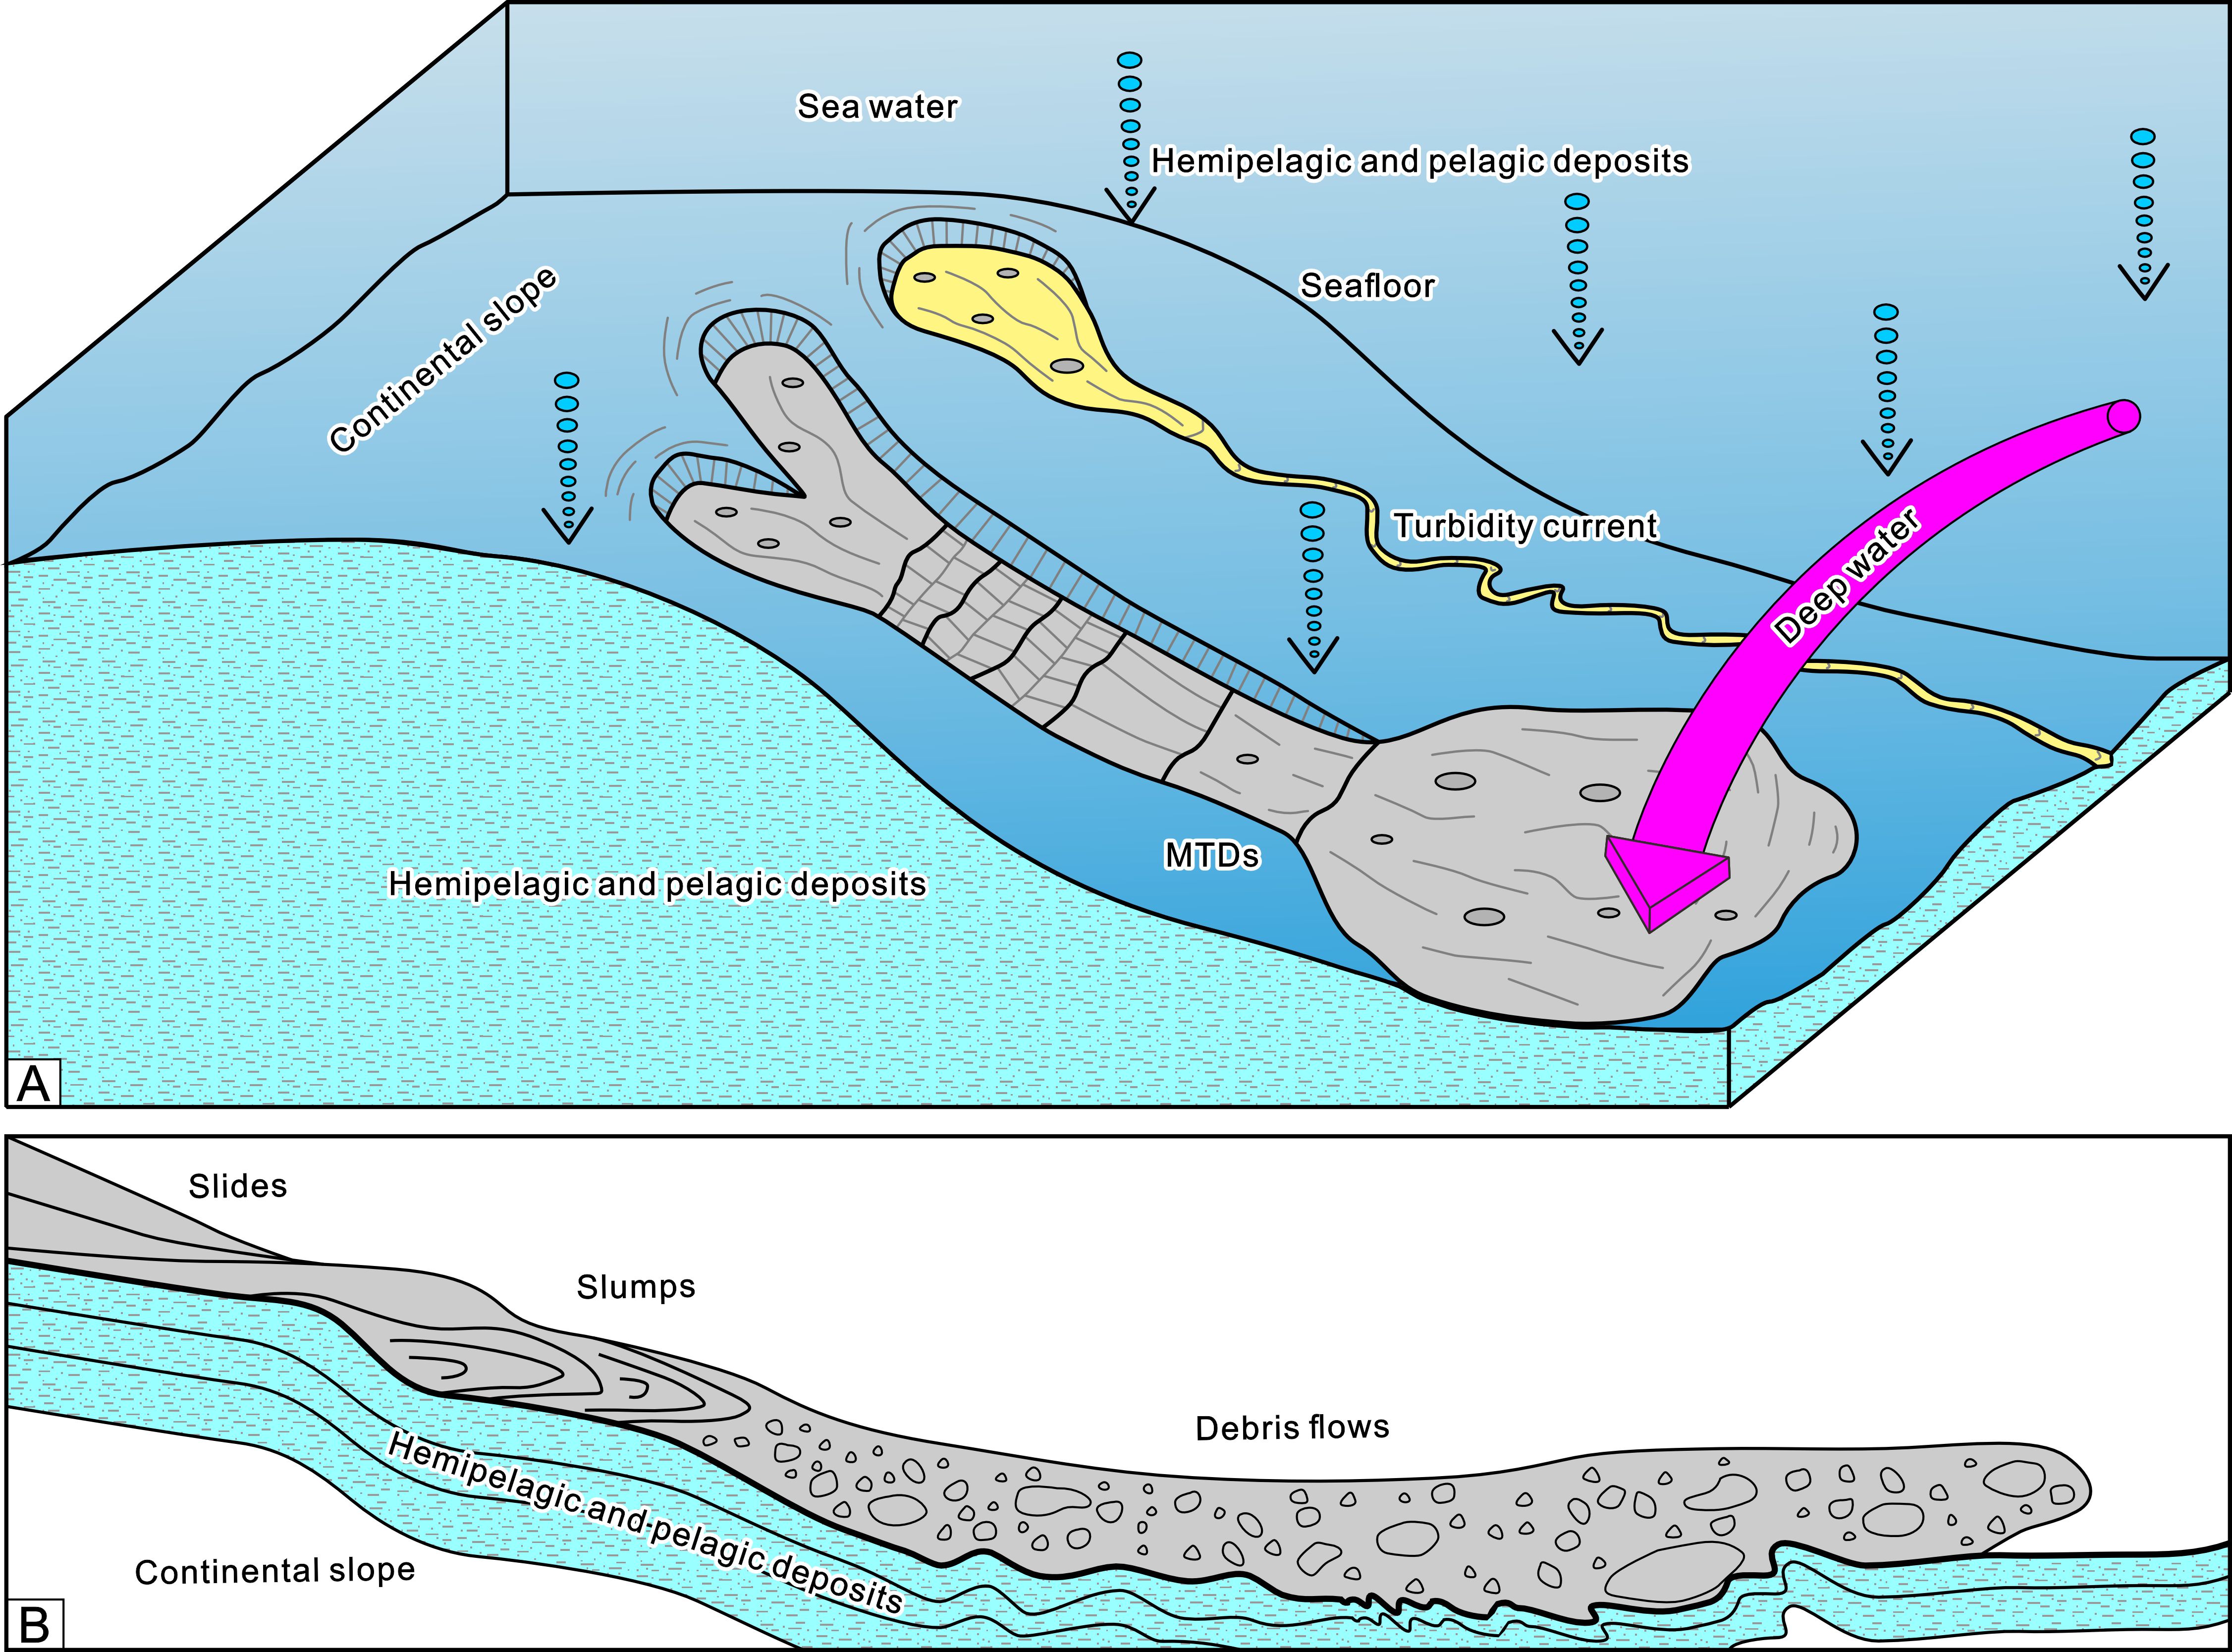
Figure 14. A rough sketch of a sedimentary model (not to scale) in the deep-water area of the Qiongdongnan Basin. (A) It shows MTDs, turbidity currents, bottom currents, and hemipelagic and pelagic deposits. (B) Sedimentary pattern profile of MTDs.
Conclusions
This work primarily utilized newly acquired core, well logging, and seismic data from the QDNB in the northern SCS to meticulously delineate the core facies of deep-water sedimentary systems. A total of eleven core facies types associated with these sedimentary systems have been summarized and categorized, including MTDs, turbidity currents, bottom currents, as well as hemipelagic and pelagic deposits. The various core facies of MTDs were analyzed in detail, revealing that their internal structures exhibit a range of sediment deformation features such as slumps and debris flows.
This study addressed the challenge of delineating the phases of MTDs across various scales of core-log-seismic datasets. It elucidated how MTDs comprise different sedimentation types, including turbidity currents as well as hemipelagic and pelagic deposits. Furthermore, this research proposed sedimentary processes and patterns associated with MTDs in deep-water environments, primarily focusing on the destabilization and collapse of slope sediments that are subsequently transported to deep-sea basins. The movement of MTDs could erode underlying strata, particularly where terminal debris flow components intermingle with in situ hemipelagic and pelagic deposits. Subsequently, a comprehensive summary of the deep-water sedimentary system within the QDNB has been presented. Additionally, this work discussed the dynamic integration between MTDs and gas hydrates. The effects can be categorized into two main groups: first, MTDs alter the gas hydrate stability zone, leading to dissociation; second, due to their high density, they function as seals which facilitate hydrate accumulation. This provides new insights and establishes a foundation for further investigation into MTDs in deep-water settings.
Data availability statement
The original data used in this article are available at: https://data.mendeley.com/datasets/y3zxhtzd94/1.
Author contributions
CC: Conceptualization, Investigation, Methodology, Formal analysis, Funding acquisition, Writing – original draft. TJ: Project administration, Formal analysis, Writing – review & editing, Supervision, Investigation, Funding acquisition. ZK: Supervision, Resources, Funding acquisition, Writing – review & editing, Investigation. JR: Formal analysis, Writing – review & editing, Investigation, Resources. ZC: Writing – review & editing, Investigation, Formal analysis. XZ: Investigation, Writing – review & editing, Formal analysis. MR: Funding acquisition, Writing – review & editing, Formal analysis, Investigation. FN: Resources, Investigation, Writing – review & editing, Formal analysis.
Funding
The author(s) declare that financial support was received for the research and/or publication of this article. This research was funded by the National Key Research and Development Program of China [No. 2024YFC2814702], the Guangdong Basic and Applied Basic Research Foundation [No. 2023A1515110405 and No. 2025A1515011949], the National Natural Science Foundation of China [No. 41976073, No. 42276073, and No. 42276083], the Open Funds for Hubei Key Laboratory of Marine Geological Resources, China University of Geosciences [No. MGR202409], the China Geological Survey Project [No. DD20230064], the China Postdoctoral Science Foundation Project [No. 2024M750632], and the Guangdong Major Project of Basic and Applied Basic Research [No. 2020B0301030003].
Acknowledgments
We sincerely thank the Guangzhou Marine Geological Survey for allowing us to disseminate our findings through this publication. Additionally, we extend our appreciation to the esteemed editorial team and the reviewers for their invaluable insights, suggestions, and constructive feedback.
Conflict of interest
The authors declare that the research was conducted in the absence of any commercial or financial relationships that could be construed as a potential conflict of interest.
Generative AI statement
The author(s) declare that no Generative AI was used in the creation of this manuscript.
Publisher’s note
All claims expressed in this article are solely those of the authors and do not necessarily represent those of their affiliated organizations, or those of the publisher, the editors and the reviewers. Any product that may be evaluated in this article, or claim that may be made by its manufacturer, is not guaranteed or endorsed by the publisher.
Supplementary material
The Supplementary Material for this article can be found online at: https://www.frontiersin.org/articles/10.3389/fmars.2025.1599494/full#supplementary-material
References
Alves T. M. (2015). Submarine slide blocks and associated soft-sediment deformation in deep-water basins: A review. Mar. Pet. Geol. 67, 262–285. doi: 10.1016/j.marpetgeo.2015.05.010
Beaudoin Y., Waite W., Boswell R., and Dallimore S. (2014). Frozen heat: A UNEP global outlook on methane gas hydrates Vol. Volume 1 (Kirkland Trykkery A/S, Norway: United Nations Environment Programme).
Boswell R., Frye M., Shelander D., Shedd W., McConnell D. R., and Cook A. (2012). Architecture of gas-hydrate-bearing sands from Walker Ridge 313, Green Canyon 955, and Alaminos Canyon 21: Northern deepwater Gulf of Mexico. Mar. Pet. Geol. 34, 134–149. doi: 10.1016/j.marpetgeo.2011.08.010
Bull S., Cartwright J., and Huuse M. (2009). A review of kinematic indicators from mass-transport complexes using 3D seismic data. Mar. Pet. Geol. 26, 1132–1151. doi: 10.1016/j.marpetgeo.2008.09.011
Cao L., Jiang T., Wang Z., Zhang Y., and Sun H. (2015). Provenance of Upper Miocene sediments in the Yinggehai and Qiongdongnan basins, northwestern South China Sea: Evidence from REE, heavy minerals and zircon U–Pb ages. Mar. Geol. 361, 136–146. doi: 10.1016/j.margeo.2015.01.007
Cardona S., Kobayashi H., Wood L., Dugan B., and Milkov A. V. (2022). Assessing the sealing quality of submarine mass transport complexes and deposits. Mar. Pet. Geol. 143, 105748. doi: 10.1016/j.marpetgeo.2022.105748
Chen H., Xie X., Zhang W., Shu Y., Wang D., Vandorpe T., et al. (2016). Deep-water sedimentary systems and their relationship with bottom currents at the intersection of Xisha Trough and Northwest Sub-Basin, South China Sea. Mar. Geol. 378, 101–113. doi: 10.1016/j.margeo.2015.11.002
Chen H., Zhang W., Xie X., Gao Y., Liu S., Ren J., et al. (2022). Linking oceanographic processes to contourite features: Numerical modelling of currents influencing a contourite depositional system on the northern South China Sea margin. Mar. Geol. 444, 106714. doi: 10.1016/j.margeo.2021.106714
Chen H., Zhang W., Xie X., and Ren J. (2019). Sediment dynamics driven by contour currents and mesoscale eddies along continental slope: A case study of the northern South China Sea. Mar. Geol. 409, 48–66. doi: 10.1016/j.margeo.2018.12.012
Cheng C., Jiang T., Kuang Z., Ren J., Liang J., Lai H., et al. (2021). Seismic characteristics and distributions of Quaternary mass transport deposits in the Qiongdongnan Basin, northern South China Sea. Mar. Pet. Geol. 129, 105118. doi: 10.1016/j.marpetgeo.2021.105118
Cheng C., Kuang Z., Jiang T., Cao L., Ren J., Liang J., et al. (2022). Source of the sand-rich gas hydrate reservoir in the northern South China Sea: Insights from detrital zircon U–Pb geochronology and seismic geomorphology. Mar. Pet. Geol. 145, 105904. doi: 10.1016/j.marpetgeo.2022.105904
Crutchley G. J., Elger J., Kuhlmann J., Mountjoy J. J., Orpin A., Georgiopoulou A., et al. (2022). Investigating the basal shear zone of the submarine Tuaheni landslide complex, New Zealand: A core-log-seismic integration study. J. Geophys. Res.: Solid Earth 127, e2021JB021997. doi: 10.1029/2021JB021997
Crutchley G. J., Mountjoy J. J., Hillman J. I. T., Turco F., Watson S., Flemings P. B., et al. (2021). Upward-doming zones of gas hydrate and free gas at the bases of gas chimneys, New Zealand’s Hikurangi Margin. J. Geophys. Res.: Solid Earth 126, e2020JB021489. doi: 10.1029/2020JB021489
Du H., Shi W., Wang R., Maselli V., Liang J., Ren J., et al. (2024). Dynamic evolution of gas hydrate systems affected by magmatism and Quaternary mass-transport deposits in the Qiongdongnan Basin, South China Sea, and implications for the global carbon cycle. Mar. Geol. 468, 107209. doi: 10.1016/j.margeo.2023.107209
Feng D., Qiu J.-W., Hu Y., Peckmann J., Guan H., Tong H., et al. (2018). Cold seep systems in the South China Sea: An overview. J. Asian Earth Sci. 168, 3–16. doi: 10.1016/j.jseaes.2018.09.021
Gong C., Steel R. J., Qi K., and Wang Y. (2020). Deep-water channel morphologies, architectures, and population densities in relation to stacking trajectories and climate states. Geol. Soc Am. Bull. 133, 287–306. doi: 10.1130/B35431.1
Jenner K. A., Piper D. J. W., Campbell D. C., and Mosher D. C. (2007). Lithofacies and origin of late Quaternary mass transport deposits in submarine canyons, central Scotian Slope, Canada. Sedimentology 54, 19–38. doi: 10.1111/j.1365-3091.2006.00819.x
Jung W.-Y. and Vogt P. R. (2004). Effects of bottom water warming and sea level rise on Holocene hydrate dissociation and mass wasting along the Norwegian-Barents Continental Margin. J. Geophys. Res.: Solid Earth 109, B06104. doi: 10.1029/2003JB002738
Karstens J., Haflidason H., Berndt C., and Crutchley G. J. (2023). Revised Storegga Slide reconstruction reveals two major submarine landslides 12,000 years apart. Commun. Earth Environ. 4, 55. doi: 10.1038/s43247-023-00710-y
Kuang Z., Cook A., Ren J., Deng W., Cao Y., and Cai H. (2023). A flat-lying transitional free gas to gas hydrate system in a sand layer in the Qiongdongnan basin of the South China Sea. Geophys. Res. Lett. 50, e2023GL105744. doi: 10.1029/2023GL105744
Lamarche G., Mountjoy J., Bull S., Hubble T., Krastel S., Lane E., et al. (2016). “Submarine mass movements and their consequences: progress and challenges,” in Submarine Mass Movements and their Consequences: 7th International Symposium. Eds. Lamarche G., Mountjoy J., Bull S., Hubble T., Krastel S., Lane E., et al (Springer International Publishing, Cham), 1–12.
Li W., Alves T. M., Rebesco M., Sun J., Li J., Li S., et al. (2020). The Baiyun Slide Complex, South China Sea: A modern example of slope instability controlling submarine-channel incision on continental slopes. Mar. Pet. Geol. 114, 104231. doi: 10.1016/j.marpetgeo.2020.104231
Li X., Ge J., Zhao X., Qi K., Jones B. G., and Fang X. (2024). Geochemistry of Quaternary sediments in the northwestern South China Sea: Sediment provenance and mid-Pleistocene transition. Mar. Geol. 477, 107371. doi: 10.1016/j.margeo.2024.107371
Liu Z., Colin C., Li X., Zhao Y., Tuo S., Chen Z., et al. (2010). Clay mineral distribution in surface sediments of the northeastern South China Sea and surrounding fluvial drainage basins: Source and transport. Mar. Geol. 277, 48–60. doi: 10.1016/j.margeo.2010.08.010
Liu S., Hernández-Molina F. J., Lei Z., Duarte D., Chen H., Wang C., et al. (2021). Fault-controlled contourite drifts in the southern South China Sea: Tectonic, oceanographic, and conceptual implications. Mar. Geol. 433, 106420. doi: 10.1016/j.margeo.2021.106420
Liu J., Steinke S., Vogt C., Mohtadi M., De Pol-Holz R., and Hebbeln D. (2017). Temporal and spatial patterns of sediment deposition in the northern South China Sea over the last 50,000years. Paleogeogr. Paleoclimatol. Paleoecol. 465, 212–224. doi: 10.1016/j.palaeo.2016.10.033
Lu Y., Pope E. L., Sun Q., and Strasser M. (2025). Clustered slumping in the northern South China Sea: Implications for chronology and geohazards. Global Planet. Change 244, 104623. doi: 10.1016/j.gloplacha.2024.104623
Lu Y., Wetzler N., Waldmann N., Agnon A., Biasi G. P., and Marco S. (2020). A 220,000-year-long continuous large earthquake record on a slow-slipping plate boundary. Sci. Adv. 6, eaba4170. doi: 10.1126/sciadv.aba4170
Maslin M., Owen M., Day S., and Long D. (2004). Linking continental-slope failures and climate change: Testing the clathrate gun hypothesis. Geology 32, 53–56. doi: 10.1130/G20114.1
Moscardelli L. and Wood L. (2008). New classification system for mass transport complexes in offshore Trinidad. Basin Res. 20, 73–98. doi: 10.1111/j.1365-2117.2007.00340.x
Posamentier H. W. and Martinsen O. J. (2011). “The character and genesis of submarine mass-transport deposits: insights from outcrop and 3D seismic data,” in Mass-Transport Deposits in Deepwater Settings. Eds. Shipp R. C., Weimer P., and Posamentier H. W. (SEPM Special Publication: SEPM Society for Sedimentary Geology), 7–38. https://doi.org/10.2110/sepmsp.096.007.
Ren J., Zhang D., Tong D., Huang A., Wang Y., Lei C., et al. (2014). Characterising the nature, evolution and origin of detachment fault in central depression belt, Qiongdongnan Basin of South China Sea: evidence from seismic reflection data. Acta Oceanol. Sin. 33, 118–126. doi: 10.1007/s13131-014-0581-8
Ruano P., Bohoyo F., Galindo-Zaldívar J., Pérez L. F., Hernández-Molina F. J., Maldonado A., et al. (2014). Mass transport processes in the southern Scotia Sea: Evidence of paleoearthquakes. Global Planet. Change 123, 374–391. doi: 10.1016/j.gloplacha.2014.06.009
Shanmugam G. (2012). “Chapter 3 - recognition of sandy mass-transport deposits,” in Handbook of Petroleum Exploration and Production. Ed. Shanmugam G. (Elsevier), 67–127. https://doi.org/10.2110/sepmsp.096.007
Shanmugam G. (2022). 150 years, (1872–2022) of research on deep–water processes, deposits, settings, triggers, and deformation: A difficult domain of progress, dichotomy, diversion, omission, and groupthink. J. Palaeogeogr. 11, 469–564. doi: 10.1016/j.jop.2022.08.004
Sloan E. D. (2003). Fundamental principles and applications of natural gas hydrates. Nature 426, 353–359. doi: 10.1038/nature02135
Sobiesiak M. S., Kneller B., Alsop G. I., and Milana J. P. (2018). Styles of basal interaction beneath mass transport deposits. Mar. Pet. Geol. 98, 629–639. doi: 10.1016/j.marpetgeo.2018.08.028
Su M., Lin Z., Wang C., Kuang Z., Liang J., Chen H., et al. (2020). Geomorphologic and infilling characteristics of the slope-confined submarine canyons in the Pearl River Mouth Basin, northern South China Sea. Mar. Geol. 424, 106166. doi: 10.1016/j.margeo.2020.106166
Sun Q. and Alves T. (2020). Petrophysics of fine-grained mass-transport deposits: A critical review. J. Asian Earth Sci. 192, 104291. doi: 10.1016/j.jseaes.2020.104291
Sun Q., Wang Q., Shi F., Alves T., Gao S., Xie X., et al. (2022). Runup of landslide-generated tsunamis controlled by paleogeography and sea-level change. Commun. Earth Environ. 3, 244. doi: 10.1038/s43247-022-00572-w
Sun Q., Xie X., Piper D. J., Wu J., and Wu S. (2017). Three dimensional seismic anatomy of multi-stage mass transport deposits in the Pearl River Mouth Basin, northern South China Sea: Their ages and kinematics. Mar. Geol. 393, 93–108. doi: 10.1016/j.margeo.2017.05.005
Talling P. J., Clare M. L., Urlaub M., Pope E., Hunt J. E., and Watt S. F. (2014). Large submarine landslides on continental slopes: geohazards, methane release, and climate change. Oceanography 27, 32–45. doi: 10.5670/oceanog.2014.38
Tripsanas E. K., Piper D. J. W., Jenner K. A., and Bryant W. R. (2008). Submarine mass-transport facies: new perspectives on flow processes from cores on the eastern North American margin. Sedimentology 55, 97–136. doi: 10.1111/j.1365-3091.2007.00894.x
Wang J., Li A., Wang L. H., Wu S., and Li Q. (2024). Submarine fluid flow system feeding methane emission in the northern South China Sea. Basin Res. 36, e12839. doi: 10.1111/bre.12839
Wang C., Liang X., Foster D. A., Liang X., Zhang L., and Su M. (2019a). Provenance and drainage evolution of the red river revealed by Pb isotopic analysis of detrital K-feldspar. Geophys. Res. Lett. 46, 6415–6424. doi: 10.1029/2019GL083000
Wang D., Wang Q., Cai S., Shang X., Peng S., Shu Y., et al. (2019b). Advances in research of the mid-deep South China Sea circulation. Sci. China Earth Sci. 62, 1992–2004. doi: 10.1007/s11430-019-9546-3
Wang X., Wang Y., He M., Chen W., Zhuo H., Gao S., et al. (2017). Genesis and evolution of the mass transport deposits in the middle segment of the Pearl River canyon, South China Sea: Insights from 3D seismic data. Mar. Pet. Geol. 88, 555–574. doi: 10.1016/j.marpetgeo.2017.08.036
Wang W., Wang D., Wu S., Völker D., Zeng H., Cai G., et al. (2018). Submarine landslides on the north continental slope of the South China Sea. J. Ocean Univ. 17, 83–100. doi: 10.1007/s11802-018-3491-0
Wang X., Wu S., Dong D., Guo Y., and Deborah H. (2011). Control of mass transport deposits over the occurrence of gas hydrate in Qiongdongnan Basin. Mar. Geol. Quat. Geol. 31, 109–118. doi: 10.3724/SP.J.1140.2011.01109
Wang D., Wu S., Qin Z., Spence G., and Lü F. (2013). Seismic characteristics of the Huaguang mass transport deposits in the Qiongdongnan Basin, South China Sea: Implications for regional tectonic activity. Mar. Geol. 346, 165–182. doi: 10.1016/j.margeo.2013.09.003
Wei J., Wu T., Miao X., and Su P. (2022). Massive natural gas hydrate dissociation during the penultimate deglaciation (~130 ka) in the South China Sea. Front. Mar. Sci. 9, 875374. doi: 10.3389/fmars.2022.875374
Wu N., Jackson C. A. L., Johnson H. D., and Hodgson D. M. (2021). Lithological, petrophysical, and seal properties of mass-transport complexes, northern Gulf of Mexico. AAPG Bull. 105, 1461–1489. doi: 10.1306/06242019056
Ye J., Wei J., Liang J., Lu J., Lu H., and Zhang W. (2019). Complex gas hydrate system in a gas chimney, South China Sea. Mar. Pet. Geol. 104, 29–39. doi: 10.1016/j.marpetgeo.2019.03.023
Yuan D. (2002). A numerical study of the South China Sea deep circulation and its relation to the Luzon Strait transport. Acta Oceanol. Sin. 21, 187–202. Available online at: http://www.aosocean.com/en/article/id/20020204.
Zhang G., Cao J., Deng Y., Lai H., Jiang X., Fang Y., et al. (2023). A 209,000-year-old history of methane seepage activity controlled by multiple factors in the South China Sea. Mar. Pet. Geol. 151, 106200. doi: 10.1016/j.marpetgeo.2023.106200
Zhao Z.-X. (2021). The deep mantle upwelling beneath the northwestern South China Sea: Insights from the time-varying residual subsidence in the Qiongdongnan Basin. Geosci. Front. 12, 101246. doi: 10.1016/j.gsf.2021.101246
Zhao Z., Sun Z., Wang Z., Sun Z., Liu J., and Zhang C. (2015). The high resolution sedimentary filling in Qiongdongnan Basin, Northern South China Sea. Mar. Geol. 361, 11–24. doi: 10.1016/j.margeo.2015.01.002
Zhong G. and Peng X. (2021). Transport and accumulation of plastic litter in submarine canyons—The role of gravity flows. Geology 49, 581–586. doi: 10.1130/G48536.1
Keywords: deep-water sedimentation, mass transport deposits, core facies, gas hydrates, sedimentary process, bottom currents, South China Sea
Citation: Cheng C, Jiang T, Kuang Z, Ren J, Chen Z, Zhao X, Rahman MU and Ning F (2025) A complete and continuous core record of deep-water mass transport deposits. Front. Mar. Sci. 12:1599494. doi: 10.3389/fmars.2025.1599494
Received: 25 March 2025; Accepted: 23 May 2025;
Published: 18 June 2025.
Edited by:
Ce Wang, Sun Yat-sen University, ChinaReviewed by:
Shaoru Yin, Ministry of Natural Resources, ChinaJiawang Ge, Southwest Petroleum University, China
Copyright © 2025 Cheng, Jiang, Kuang, Ren, Chen, Zhao, Rahman and Ning. This is an open-access article distributed under the terms of the Creative Commons Attribution License (CC BY). The use, distribution or reproduction in other forums is permitted, provided the original author(s) and the copyright owner(s) are credited and that the original publication in this journal is cited, in accordance with accepted academic practice. No use, distribution or reproduction is permitted which does not comply with these terms.
*Correspondence: Tao Jiang, dGFvamlhbmdAY3VnLmVkdS5jbg==; Zenggui Kuang, a3pnMjEwMDFAMTYzLmNvbQ==