 Nicolas De Almeida E Silva
 Jacquomo Monk
 Paco Bustamante
 John P. Y. Arnould
- 1Deakin Marine Research and Innovation Centre, School of Life and Environmental Sciences, Deakin University, Melbourne, VIC, Australia
- 2Littoral, Environnement et Sociétés (LIENSs), Université de La Rochelle, La Rochelle, France
- 3Institute for Marine and Antarctic Studies (IMAS), University of Tasmania, Hobart, TAS, Australia
Population size estimates are important for conservation management. Conducting ground surveys is the most common approach used to provide population estimates but financial and logistical constraints often make this untenable for seabird species breeding on remote islands. The present study used previously collected count data of short-tailed shearwater burrows in conjunction with remote sensed environmental data to develop nesting habitat suitability models using Generalised Additive Models (GAMs). A global Generalised Additive Mixed Model (GAMM) including data from 14 islands around Wilsons Promontory (Bass Strait, Australia) revealed a preference of in short-tailed shearwaters for coastal grassland on a south-east terrain aspect with moderate incline to establish their breeding areas. The highest density areas were also away from the shoreline and with lower elevation. This global model, projected on 258 colonies representing the currently known breeding range of the species, predicted 11.26 (11.17–11.35) million burrows which, accounting for incomplete burrow occupancy, provided a total breeding population estimate of 12.84 (11.51–14.17) million individuals. While an increased spatial balance in training dataset could greatly improve the accuracy of global models, the estimate results of the present study are consistent with previous findings. This demonstrates the advantages of combining limited ground surveys data collection with such modelling approaches in comparison to more traditional ground survey extrapolations to produce species population estimates for burrowing seabirds.
Introduction
Population size estimates are crucial for understanding the importance of species within their ecosystem. They represent a key component for biodiversity management and conservation, especially in a context where the impacts of human activities on wildlife keep increasing (Walsh et al., 2010). Population size is the main information considered to assess whether a species is at risk of extinction, consequently establishing its conservation status (Baillie et al., 2004). Therefore, it provides critical information to assess conservation needs, guide management practices, and to ensure the sustainability of biodiversity (White and Shenk, 2001). It is looked at in many conservation decisions to support the development and establishment of wildlife protection laws and policy (Callaghan et al., 2024), and to adapt conservation effort and funding (White and Shenk, 2001). Implemented into a time component, population censuses provide important information to understand population dynamics and evolutionary processes that shape species over time (White and Shenk, 2001). This is particularly relevant to managing human and climate change impacts, as population size estimates provide a basis for establishing species vulnerability and predicting their future in response to environmental change (White and Shenk, 2001).
Field survey techniques for estimating population size are diverse, including, but not limited to, direct counts of individuals, capture-mark-recapture approaches, passive acoustic monitoring, distance sampling, or even the number of predated individuals (Williams et al., 2002; Rayner et al., 2007a). Conducting such surveys across the entire population area is often not feasible, with usually only a portion of the population being assessed (Williams et al., 2002). Once survey data has been collected, there are two main approaches to estimating population size from them: a design-based method and a model-based method (Camp et al., 2020). Design-based census techniques consist of extrapolating density data of randomised count surveys across the total area available. This approach quickly meets some limitations, the main inconvenience being that it cannot be projected onto new areas (Rayner et al., 2007a). The alternative approach of predictive habitat modelling associates surrounding ecological factors, such as vegetation type or topographic descriptors, to the presence or abundance of a target species (Guisan and Zimmermann, 2000; Austin, 2002; Boyce et al., 2002). Habitat parameters essential to ecological relationships between species and their environment act as proxies to understand and predict the spatial abundance and distribution of breeding individuals (Rayner et al., 2007a). With technological advances enabling environmental variables to be remotely sampled at increasingly finer resolutions, model-based estimates may provide less uncertainty than traditional design-based survey approaches (Camp et al., 2020).
Seabirds currently represent the most threatened avian taxa (Baillie et al., 2004; Croxall et al., 2012). For example, out of 124 petrels and shearwaters species (consisting of 3 families: Procellariidae, Oceanitidae, and Hydrobatidae), more than half of them (65) are suffering population declines (Rodríguez et al., 2019). Seabirds have developed different strategies to survive through the exploitation of two essential environments: foraging habitat at sea and breeding habitat on land (Schreiber and Burger, 2002; Brooke, 2004). Their survival relies on their ability to adapt to unpredictable modification of the different features defining these ecosystems, which may explain why their decline is strongly related to climate change and severe weather in both the marine and terrestrial environments (Dias et al., 2019).
Amongst seabirds, many species forage during the day and are mainly visiting their breeding grounds at night, with almost a quarter (23%) nesting in burrows (Schreiber and Burger, 2002; Brooke, 2004). In addition, seabirds are usually located in remote areas making traditional on-ground surveys, which are necessary for design-based approaches to produce population estimates, particularly challenging and expensive (Troy et al., 2014).
The short-tailed shearwater (Ardenna tenuirostris) is a medium-sized (average mass 580 g) burrow-nesting Procellariiform with a breeding distribution limited to southern Australia (Marshall and Serventy, 1956). This distribution includes one of the fastest warming oceanic regions in the world (Hobday and Lough, 2011), with predicted oceanographic changes likely to greatly impact prey diversity, abundance and distribution (Poloczanska et al., 2007). Knowledge of the population size and factors influencing the breeding distribution of the species is crucial for predicting how it, and the prey populations it depends upon, may respond to these impending changes. The short-tailed shearwater breeds on offshore islands and occasionally on mainland headlands and promontories, favouring grasslands habitat. A single breeding pair occupies a burrow dug in soft soil stabilised with vegetation (Marchant and Higgins, 1990; Brooke, 2004). The species exhibits important levels of site fidelity and philopatry (Bradley et al., 1999) and individuals practice intermittent breeding resulting in a mix of occupied and unoccupied burrows each year during breeding season (Bradley et al., 2000). A previous assessment of the species estimated a breeding population size of 23 million individuals across its entire breeding range (Skira et al., 1996), making this Australian endemic the most numerous avian species on the continent and one of its most important marine biomass consumers (Skira et al., 1985). However, this decades-old study focussed primarily on the Tasmanian region and the breeding density of the species throughout much of its range remains inadequately surveyed. This is complicated by colonies being located on several hundred offshore islands making direct surveys of all the breeding areas prohibitively time consuming, logistically difficult and very expensive (Parker and Rexer-Huber, 2016). Consequently, the current total breeding population size of the species is poorly documented.
The aims of the present study, therefore, were to: 1) develop a nesting habitat suitability model for the short-tailed shearwater; 2) project this model onto the known breeding range of the species throughout southern Australia; and 3) estimate the breeding population size for the species.
Materials and methods
Data collection and model construction
Ground surveys of short-tailed shearwater burrows were conducted as part of a previous study in 2008-11 (Schumann et al., 2013). Data were obtained from 14 islands (Figure 1) located around Wilsons Promontory, northern Bass Strait, south-eastern Australia. These islands are comprised of granitic bedrock locally exposed but otherwise covered with soil mainly occupied by tussock grassland communities (Schumann et al., 2013). Briefly, burrows were counted during the first half of December; this corresponds to the early incubation period; within 4 m x 5 m (20 m2) quadrats placed every 10 m or 25 m (depending on year) along transects spaced at regular intervals of 50 m to 300 m (depending on island size and topography) across the longest axis of the island. On some of the smaller islands, quadrats were placed randomly. Burrows were only counted when they were deemed suitable for breeding i.e. not collapsed or overtaken by vegetation.
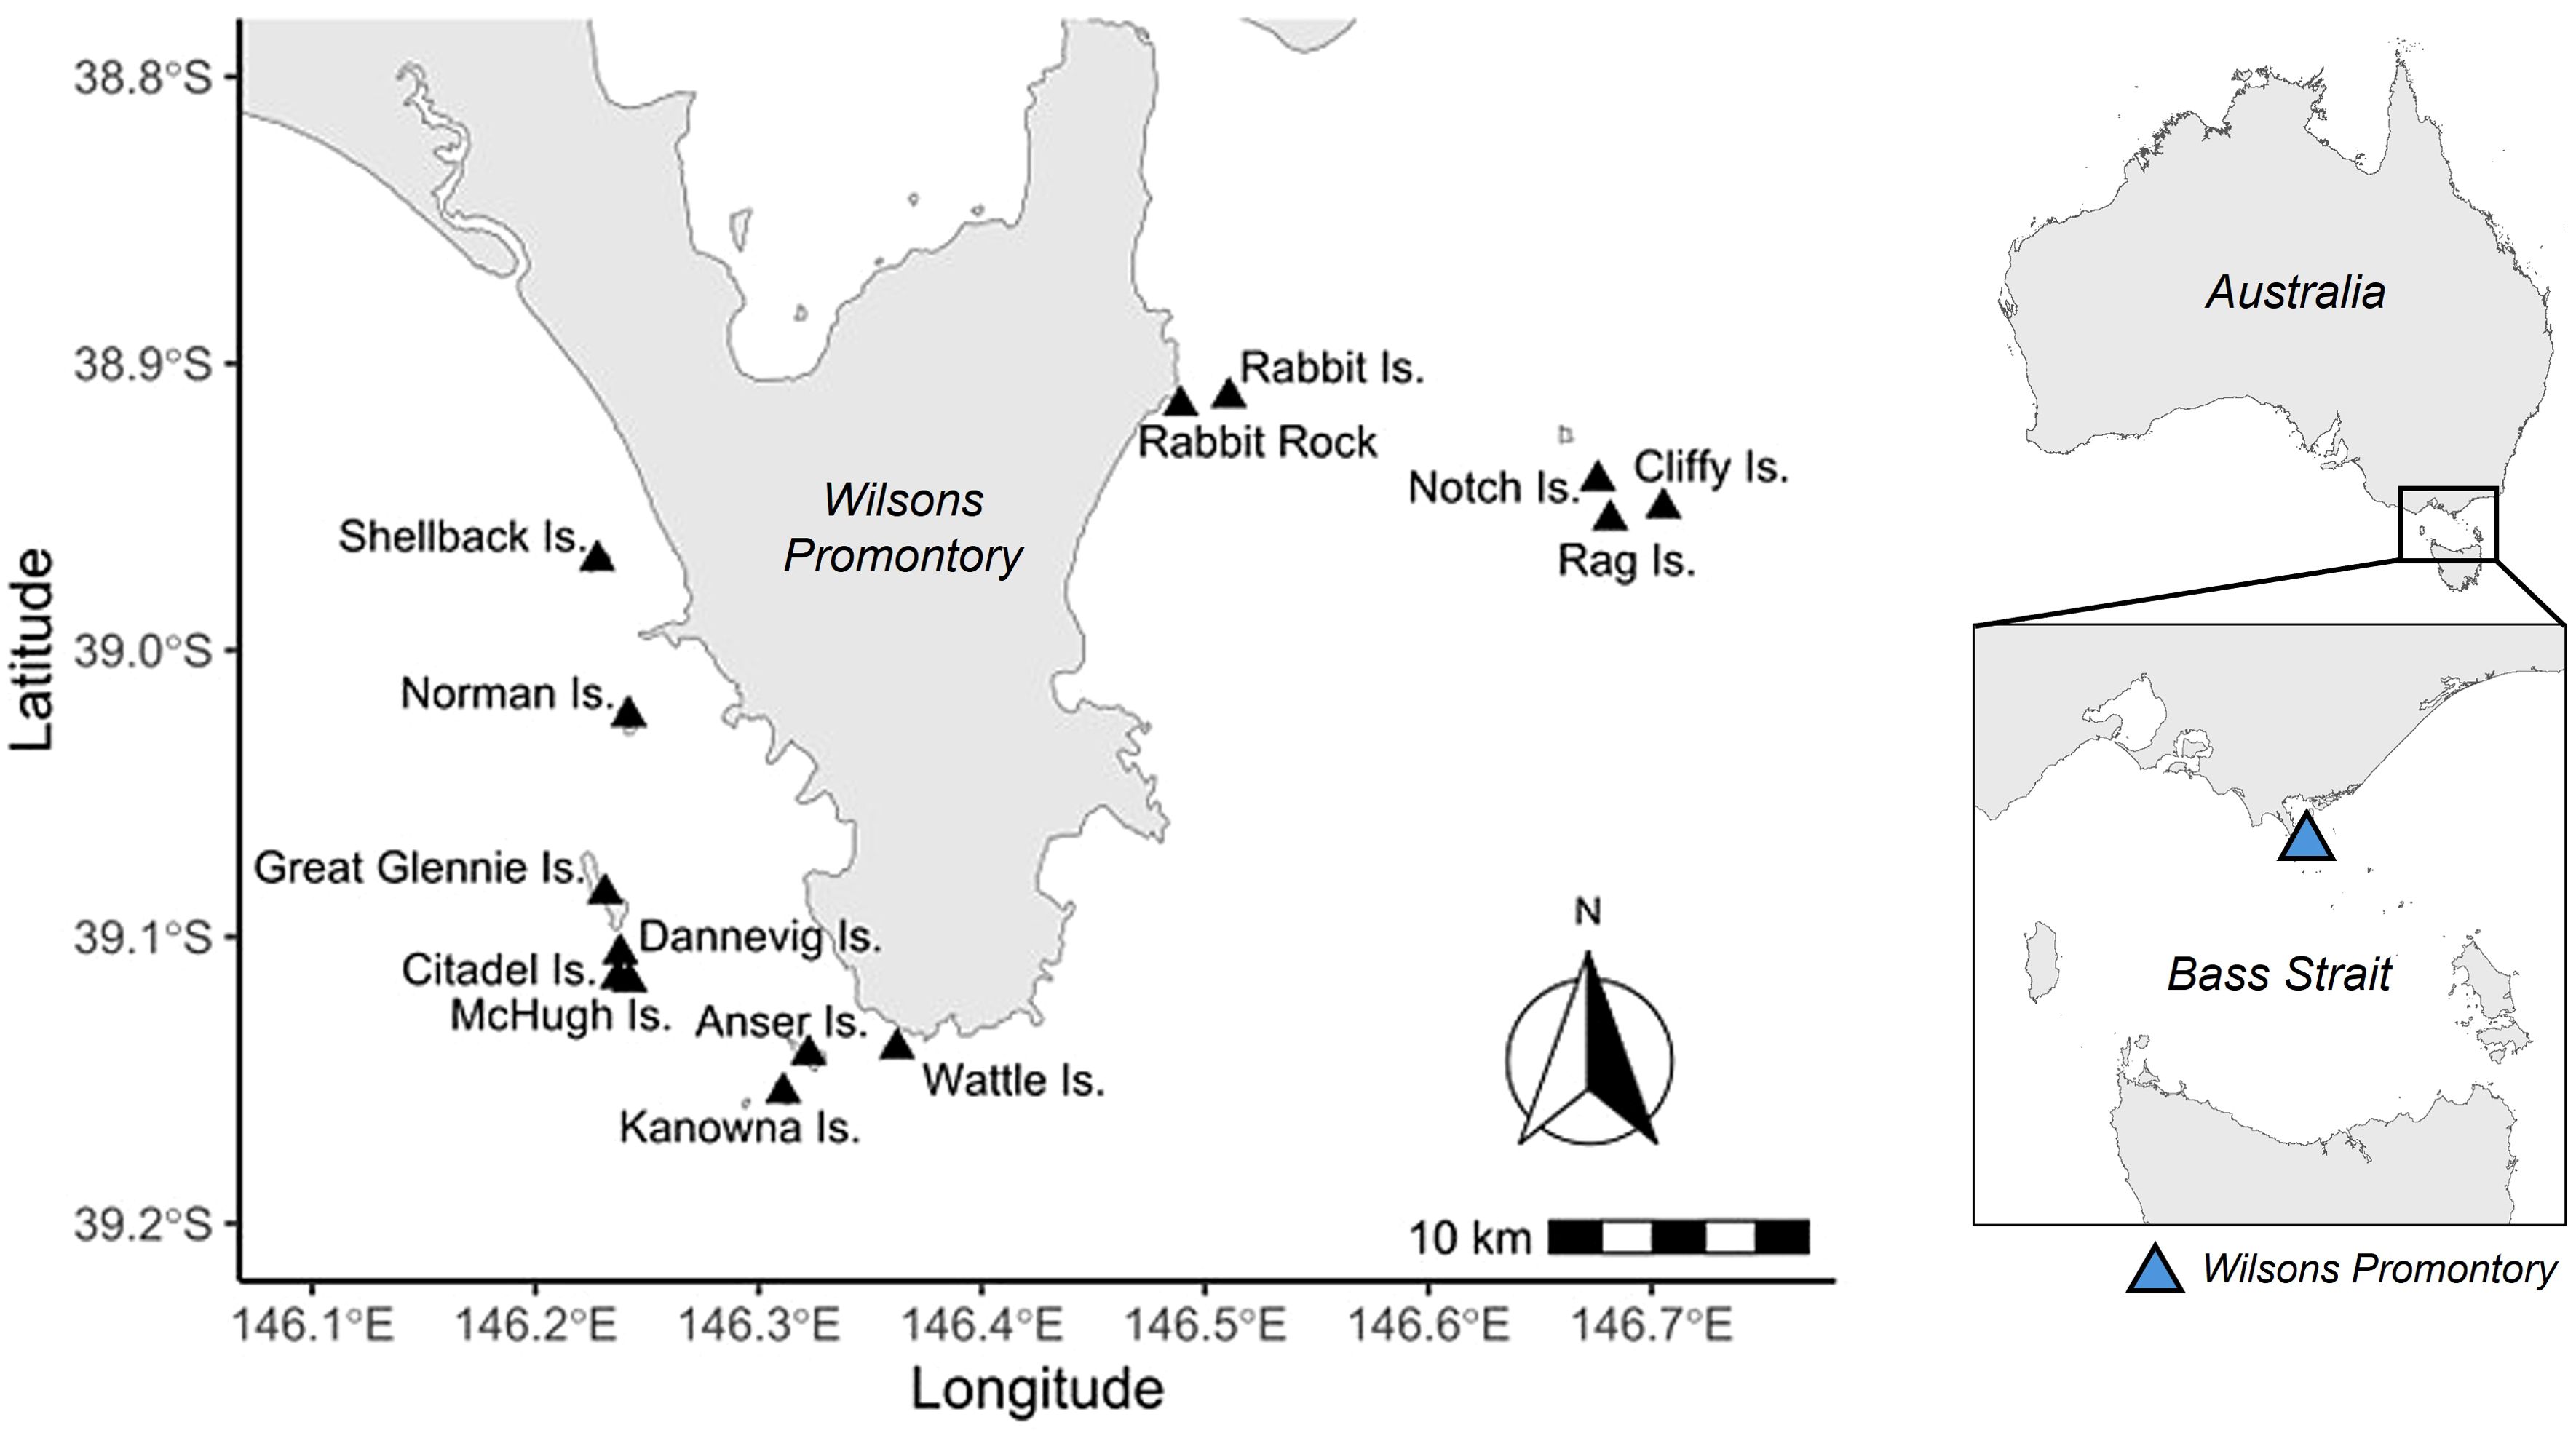
Figure 1. Locations of the 14 islands around Wilsons Promontory, northern Bass Strait, south-eastern Australia, where ground surveys of short-tailed shearwater burrows were conducted.
The ground surveys count data were analysed with respect to environmental variables to develop predictive habitat suitability models of burrow density: the terrain elevation, the terrain aspect, the distance to water, the slope angle, and the Normalized Difference Vegetation Index (NDVI). Those descriptors have been previously identified to influence nesting distribution in the species (Schumann et al., 2013). Their values were obtained from remote-sensed data for each surveyed quadrat. Elevation data were sourced from AW3D Digital Elevation Models at 2.5 m pixel resolution. Aspect and Slope were calculated from the Digital Elevation Model using the ‘terrain’ function, with a setting of 8 neighbouring cells, in the terra package (Hijmans, 2025) in R statistical environment (R Core Team, 2023). The NDVI was calculated from WorldView-2 8-bit orthoimages (2016-2022), with a resolution of 2.5 m, following the equation:
Because burrows count data were collected in 20 m2 areas of 4 meters by 5 meters but no information was provided regarding the orientation of those quadrats (Schumann et al., 2013), a circular buffer of 20 m2 centred on each quadrat’s coordinates was created using QGIS (QGIS Development Team, 2023) to represent the quadrat’s extent and extract the environmental variable information from every pixel in its boundaries. The median value of each variable for this area was then selected and assigned to the corresponding quadrat count data.
Island-specific Generalised Additive Models (GAMs), using only the quadrats data for each respective island (Table 1), were developed to predict nesting habitat suitability using the mgcv package (Wood, 2017) in the R statistical environment (R Core Team, 2023). These models were constructed to test their transferability across different sites. To this end, island-specific models were developed for Great Glennie Island, Kanowna Island, Notch Island, and Rabbit Island and applied to each of those same islands. The limited number of quadrats collected on the other islands did not allow satisfactory strength in the GAMs combining all five environmental variables with an acceptable number of knots. The smoothing terms were built using cubic regression splines smoothers, including the Aspect variable for which the cyclic version was applied. Family distribution and link function (Table 2) were selected in each model through visual and statistical inspections of the model residuals using ‘gam.check’ and ‘simulateResiduals’ in the DHARMa package (Hartig, 2024). Models were also tested for zero inflation and dispersion using corresponding functions in the same package. Where those selection steps left several candidate models, the most parsimonious model (lowest Akaike Information Criterion, AIC value) was selected. Models were inspected for influential points using ‘influence.gam’ from the mgcv package (Wood, 2017). Highly influential quadrats (i.e. graphically isolated with outlier influence value) were discarded from the dataset.
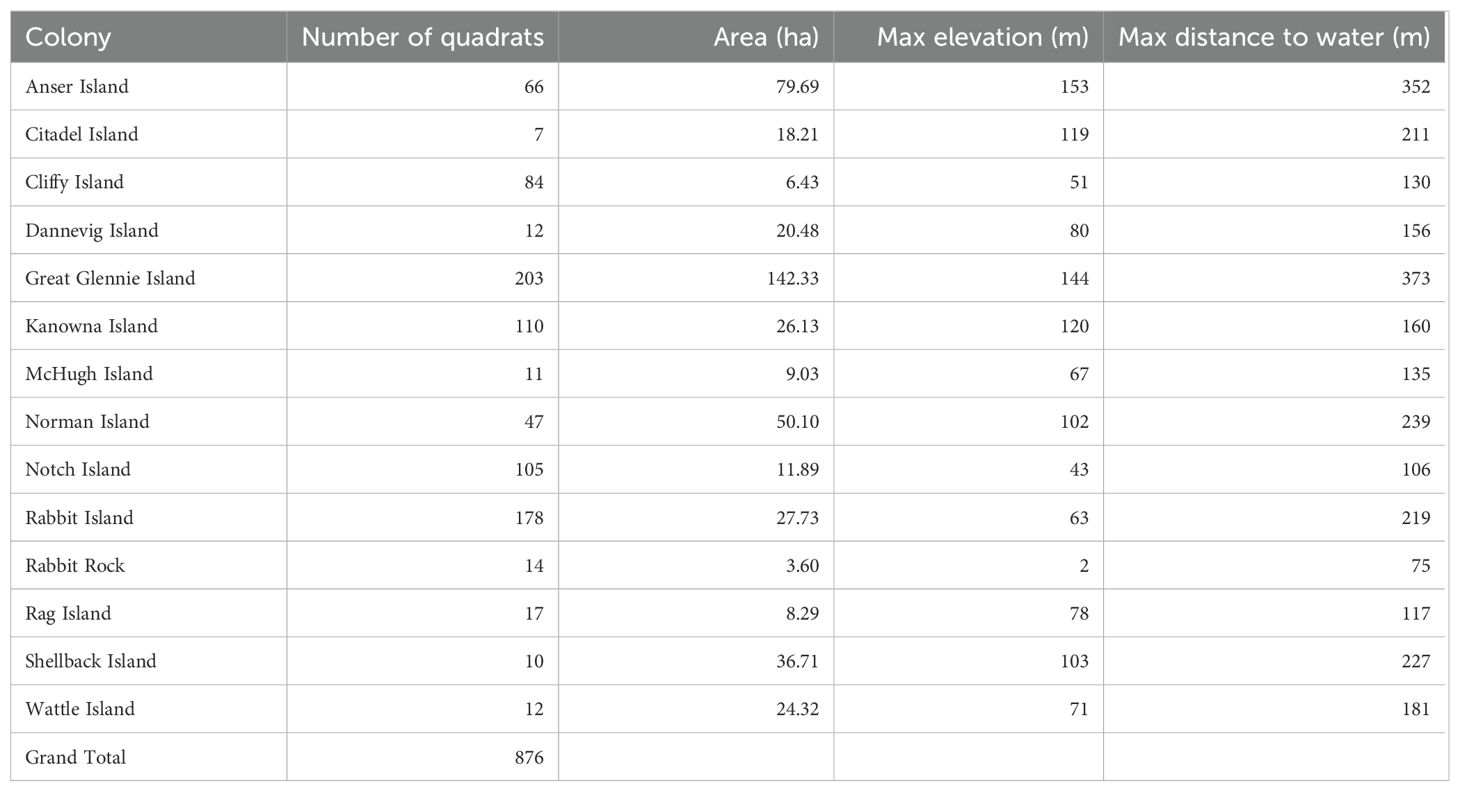
Table 1. Location of the quadrat survey data collected by Schumann et al. (2013) on islands around Wilsons Promontory (Bass Strait, south-eastern Australia) and involved in the construction of the island-specific GAMS and global GAMMs.
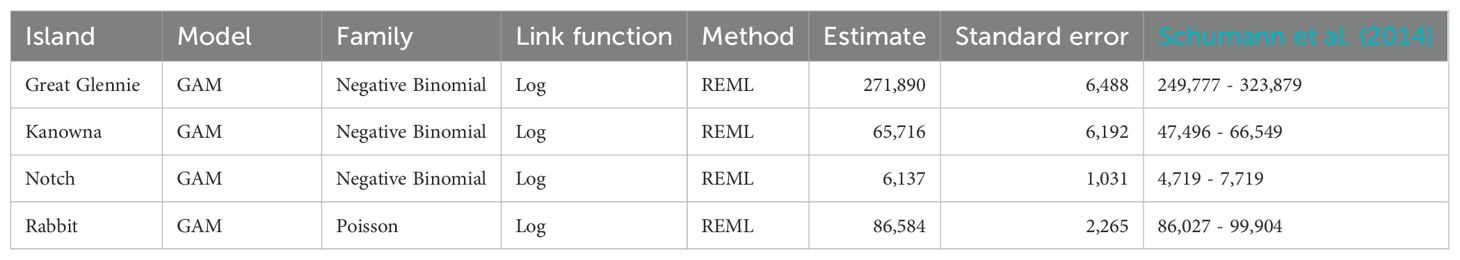
Table 2. Estimates of predicted number of short-tailed shearwater burrows on islands around Wilson’s Promontory, south-eastern Australia, obtained from GAMs built on island-specific datasets. Estimates obtained by Schumann et al. (2014) are provided for comparison.
A global Generalised Additive Mixed Model (GAMM) was then developed including the same environmental variables over the full dataset (874 quadrats, 14 islands), with the island of quadrat’s origin added as a random factor. Collinearity between variables was assessed calculating variance inflation factors (VIF) using Pearson correlation method in the ‘vif’ function from usdm package (Naimi et al., 2014). While Distance and Elevation were found to be correlated in the overall training dataset (correlation coefficient = 0.79), both were kept in the model as this is due to common characteristics of the ground surveyed islands, 11 islands out of the 14 displayed a correlation between the elevation and the distance to water, but not a universal correlation across the species colonies.
Transferability of the models was investigated using cross-validation and looking at the mean absolute error between the predicted number of burrows and the observed count. The specific approach for the global model was excluding one island from the training dataset before predicting on it. This process was repeated for Great Glennie Island, Kanowna Island, Notch Island and Rabbit Island.
Spatial autocorrelation was assessed and quantified within and between colonies using a continuous Moran’s I test with a distance-based neighbourhood weighting, applied on the global GAMM residuals. The test was performed using ‘moran.test’ function from spded package (Pebesma and Bivand, 2023). No spatial autocorrelation was observed between colonies. A spatial autocorrelation was observed within colonies up to 95 m.
Global model predictions and breeding population abundance estimate
To obtain an estimate of the total number of burrows for the species across its known breeding range, remote-sensed data (Elevation, Aspect, Distance to water, and NDVI) were obtained as previously described and used as inputs to the global GAMM described above. The areas covered 272 colonies (Figure 2), defined here as an island or a spatial extent of continuous presence of short-tailed shearwater burrows, located across southern Australia (Latitude: -32.37 to -43.66, Longitude: 121.61 to 152.32). This incorporated five Australian states boundaries: Western Australia; South Australia; Victoria; New South Wales; and Tasmania. Due to cloud cover on the orthoimages or a lack of precision from the digital elevation model, environmental data were not obtained from 14 colonies (Cone Islet, Curtis Island, Devil’s Tower, Dugay Islet, Edwards Islet, Entrance Island, Erith Island, Fisher Island, Granite Island, Low Islets, Marriot reef, Picnic Island, Schouten Island, and Trial harbour). Where available, breeding colony boundaries (n = 128) were obtained from the Natural Values Atlas1 (State Government of Tasmania). Information for an additional 13 breeding colonies were obtained from Brothers et al. (2001). Lastly, for short-tailed shearwater breeding areas where previous information on colony spatial extents was not available (n = 117), boundaries around habitats deemed suitable (grass-vegetated) in visual inspected remote-sensed images were created using QGIS Desktop v.3.32.1 (QGIS Development Team, 2023) or Google Earth Pro v. 7.3.6.9796 (Google Earth, 2024).
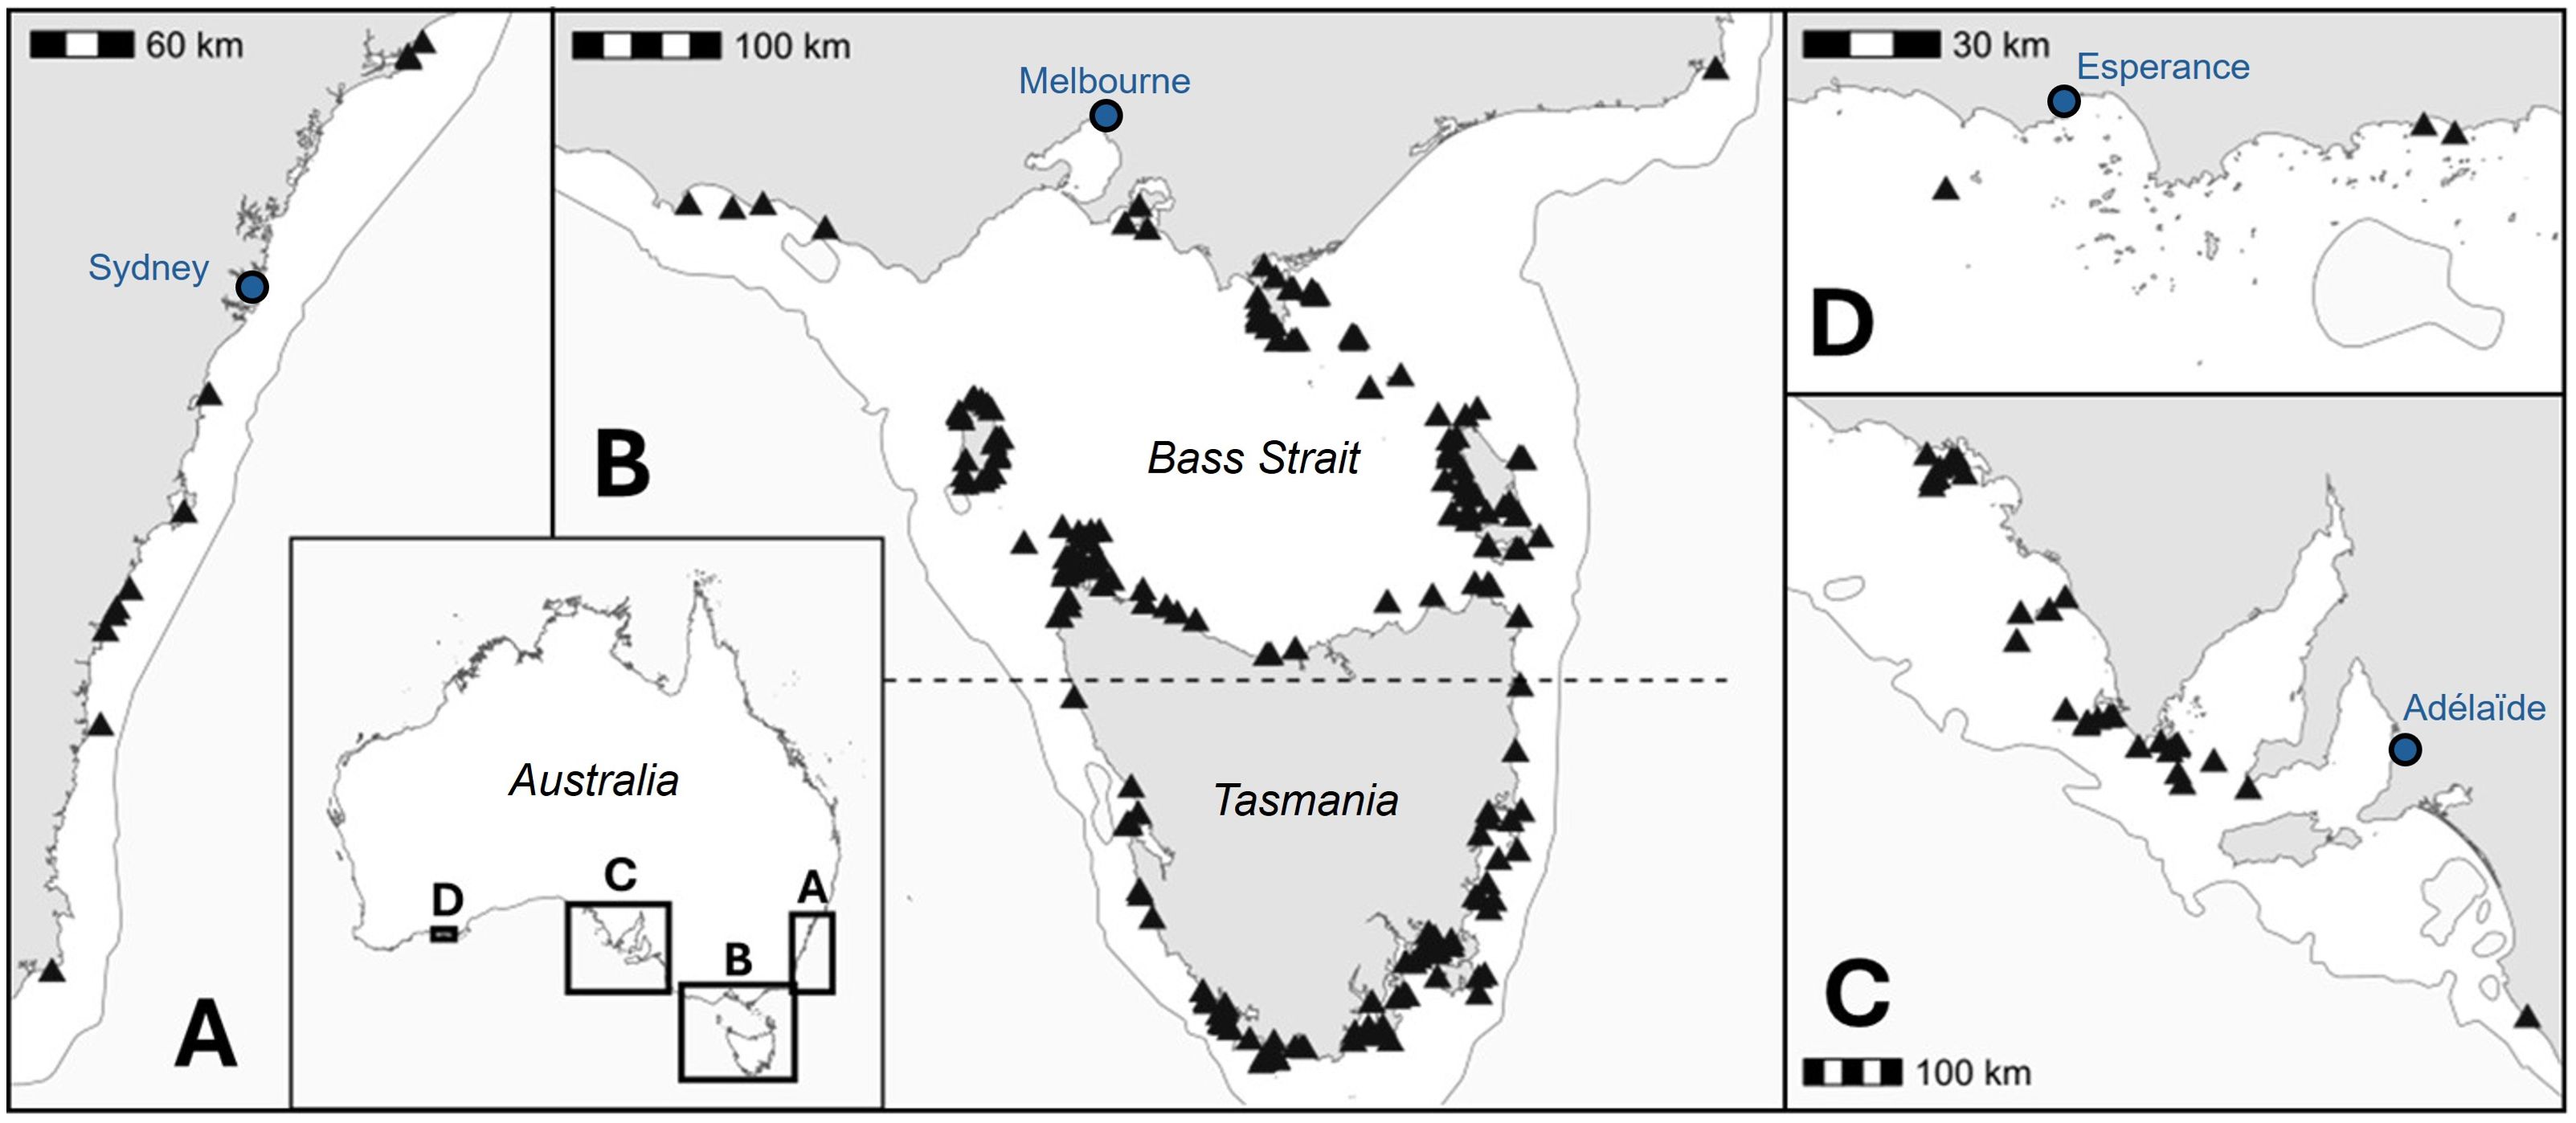
Figure 2. Location of the 258 colonies of short-tailed shearwater for which a number of burrows estimate was predicted from the global GAMM. The breeding range was split in five regions. (A) south-eastern Australia, (B) Bass Strait and southern Tasmania, (C) south-central Australia, (D) south-western Australia.
The number of short-tailed shearwater burrows were predicted for each colony on a 2.5 m x 2.5 m resolution using ‘predict’ function in terra package, using the global GAMM (Figure 3). A mask was used to prevent extrapolation out of range of the input quadrat dataset values for Distance to water (<350 m), Elevation (<144 m) and Slope (<47°). Pixels where the standard error was higher than the predicted estimate were filtered to prevent unreliable results. This resulted in 15% of the breeding colonies spatial extent that could not be predicted on, but 11% were from 15 colonies (Saint Francis, Maatsuyker, Goat, Phillip, Babel, Saint Peter, Great Dog, Rodondo, Waldegrave, Three Hummock – Mermaid, Ranger, and South Paddock, Franklin Island, Greenly Island, De Witt Island) and only 4% were from the remaining 243 colonies.
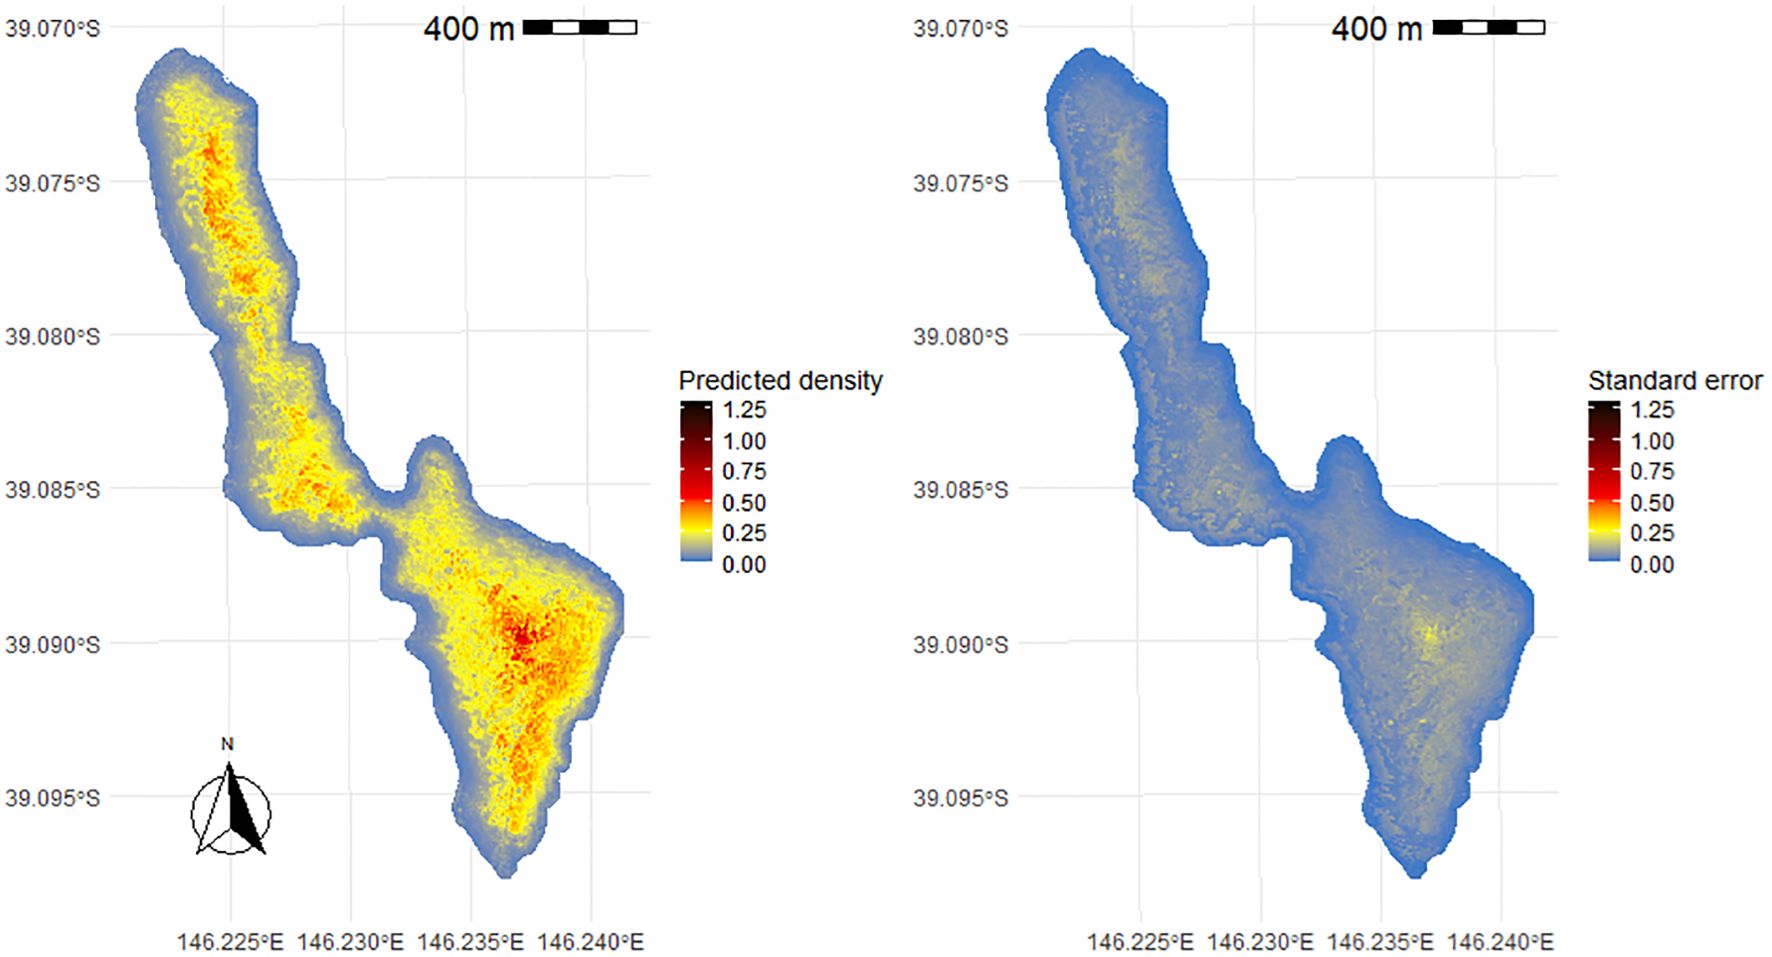
Figure 3. Density of short-tailed shearwater burrows and standard error associated on Great Glennie Island, (Bass Strait, south-eastern Australia) calculated from the prediction of the number of burrows obtained from a global GAMM. Great Glennie Island total burrows estimate range: 241,012 –271,670.
The predictions for every remaining pixel inside a colony boundary were summed to estimate the total number of burrows in the colony. The standard error associated was calculated as the partial standard error from the model prediction corrected for a spatial autocorrelation weighted using an exponential decay with a spatial range and cutoff at 95 m.
The distribution of burrow abundance varied throughout the species range. The breeding range of the species was split in 5 areas (Figure 4) of different environment significance: south-western Australia at western end of the species range; south-central Australia which is exposed to a Mediterranean climate (Klausmeyer and Shaw, 2009); Bass Strait where water depth is relatively shallow (mean depth ~60 m) (Wijeratne et al., 2012); southern Tasmania representing the southern extent of the species range; and south-eastern Australia which is strongly impacted by the Eastern Australia Current (Suthers et al., 2011).
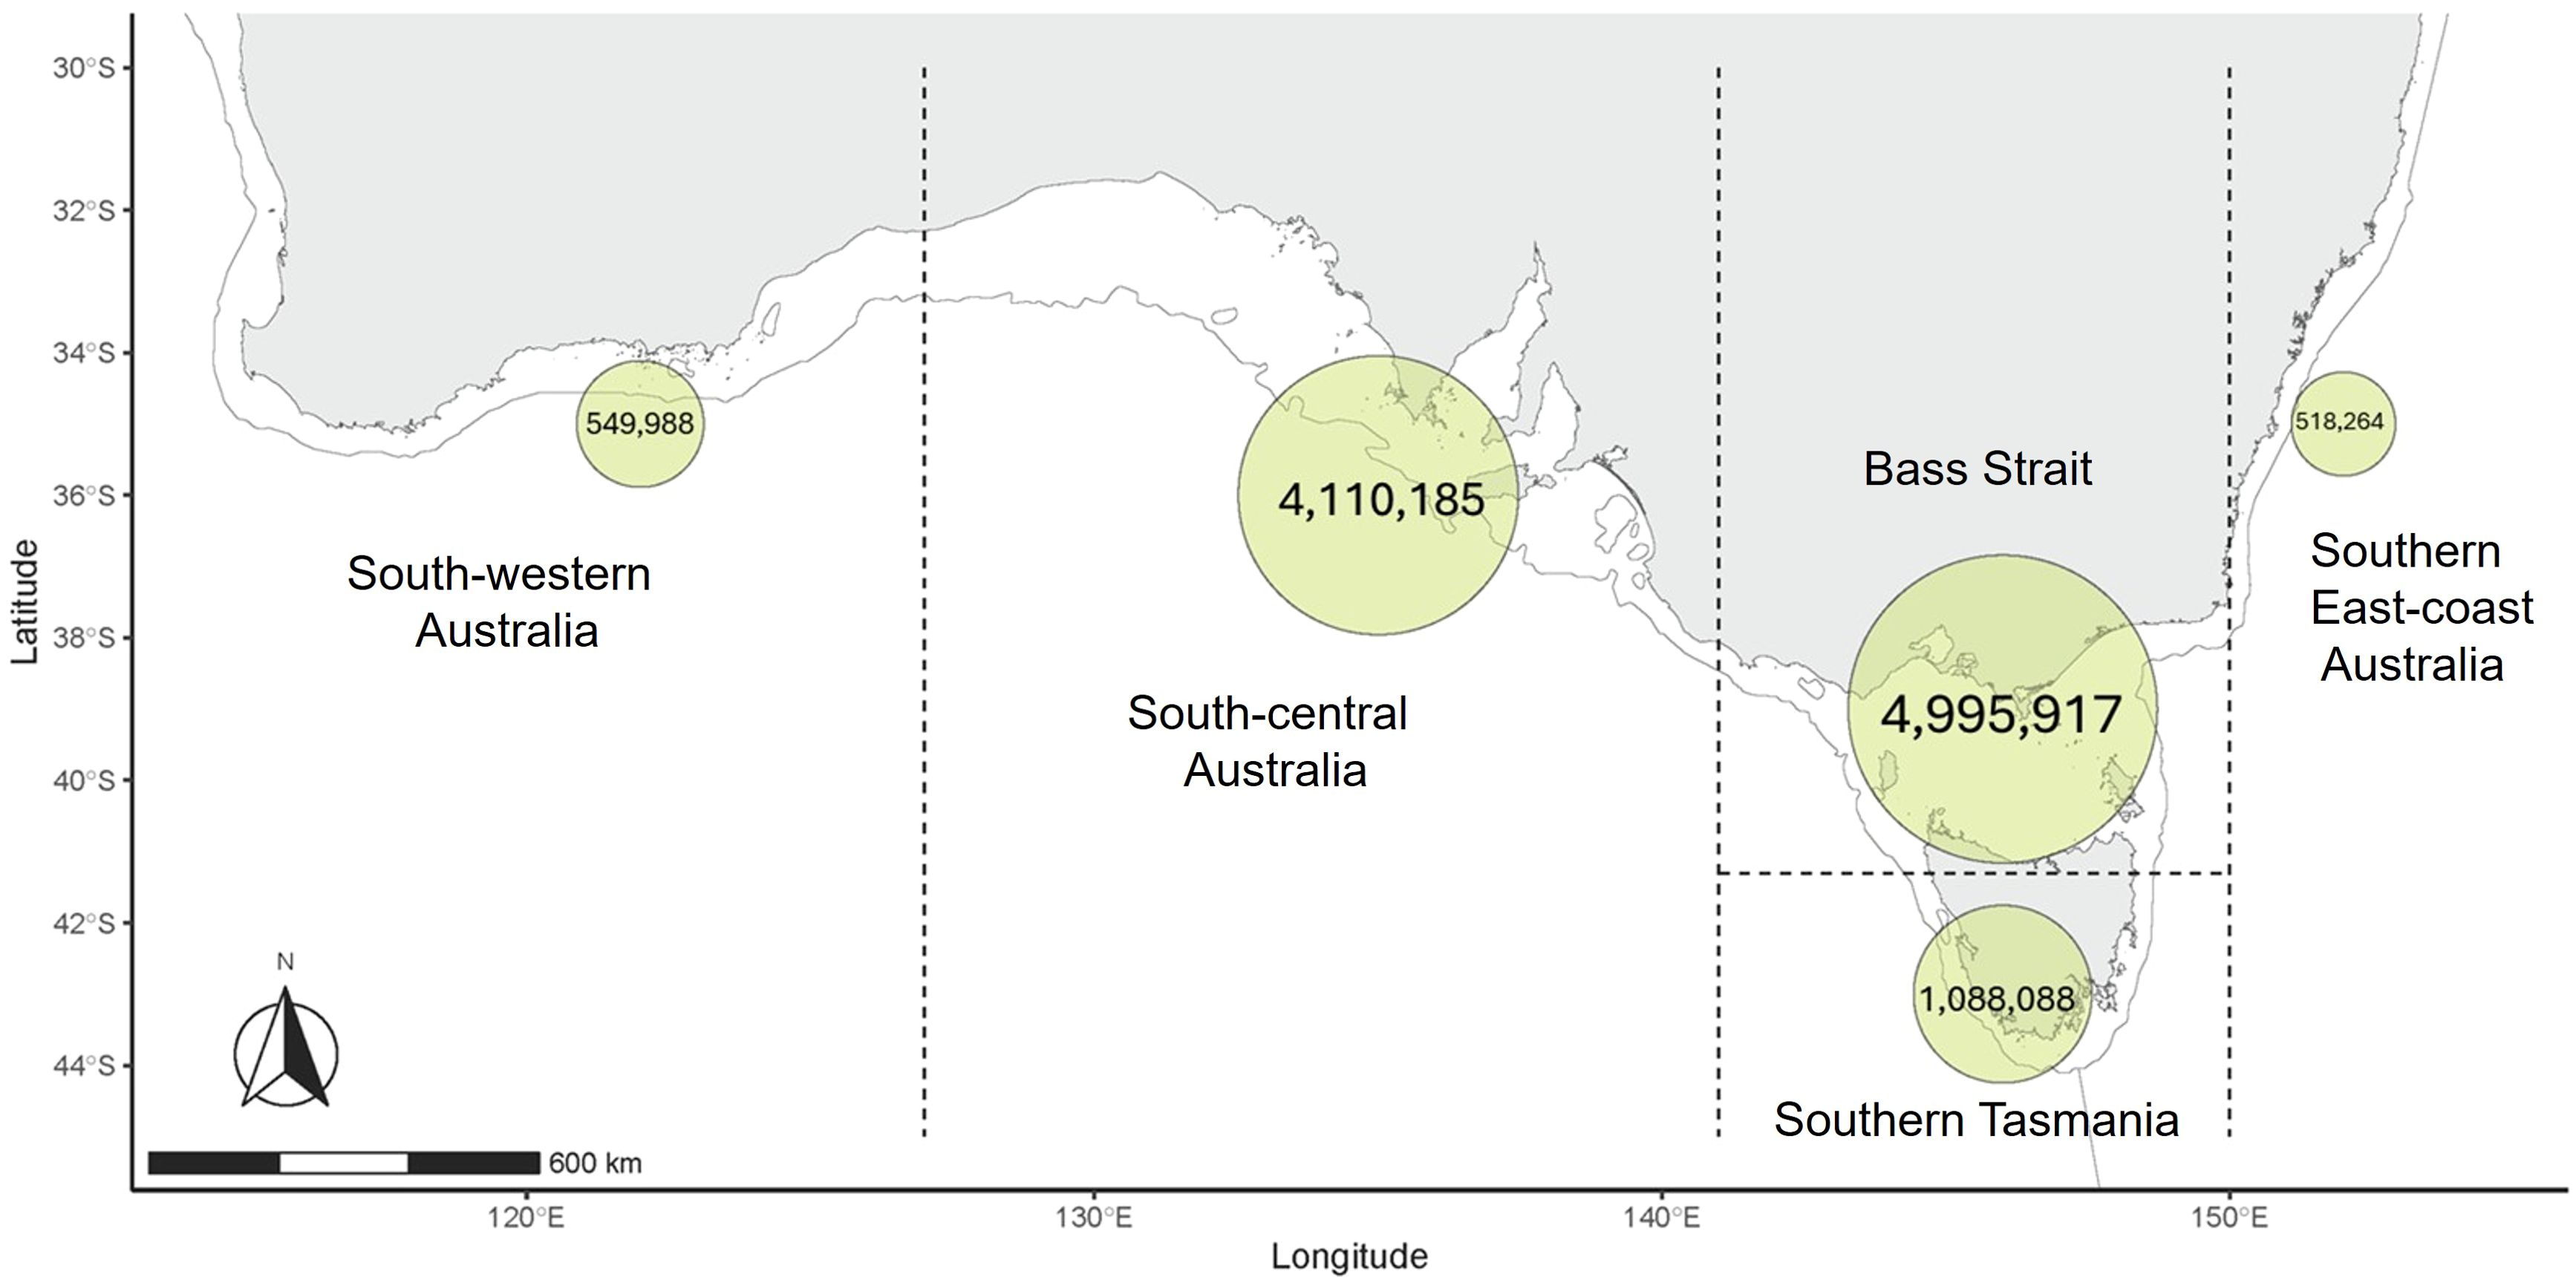
Figure 4. Distribution of short-tailed shearwater burrow abundance estimated across the breeding range of the species. Dashed lines delineate from west to east: south-western Australia (4 colonies), south-central Australia (32 colonies), Bass Strait (136 colonies), southern Tasmania (76 colonies) and south-eastern Australia (10 colonies).
The addition of all colony estimates represented the number of burrows across the known breeding range of the species (excluding the 14 sites listed above for which no environmental data were available).
A burrow occupancy rate was then applied to estimate the total breeding population size of the species (Bird et al., 2022). No occupancy rate was collected on Schumann et al. (2013) ground-surveys quadrat, we used 57 ± 16% reported by Price et al. (2021) as the average breeding participation data collected each year from 2010 to 2018 on four islands (Little Green, Little Dog, Big Green, and East Kangaroo) in the Furneaux Island Group, Bass Strait.
All estimates reported in this study are presented with 95% confidence intervals, either in a range format or in a plus-minus format.
Results
Island-specific models
Each of the five environmental predictor variables (Aspect, Elevation, Distance to water, NDVI, and Slope) were significant in one or more island-specific models, but none of them were significant for all the models (Table 3). For example, Aspect was a significant variable in the Great Glennie Island, Kanowna Island and Notch Island models, but not in the Rabbit Island model. Similarly, Elevation was significant in all island-specific models except for Kanowna Island model whereas Distance to water was significant in all but the Great Glennie Island model. Likewise, the NDVI was a significant variable only in the Kanowna Island and Notch Island models while Slope was significant only in the Kanowna Island and Rabbit Island models. The deviance explained by the island-specific models ranged from 23.6% to 45.9% with the Great Glennie Island and Rabbit Island models, respectively. Out of the 4 short-tailed shearwater colonies for which an island-specific model was developed (Table 2), Great Glennie Island was the most populated one with a prediction of 271,890 ± 12,716 burrows on the whole island. Notch Island was both the least populated and the lowest density colony, with 6,137 ± 2,021 burrows spread across its 11.89 ha.
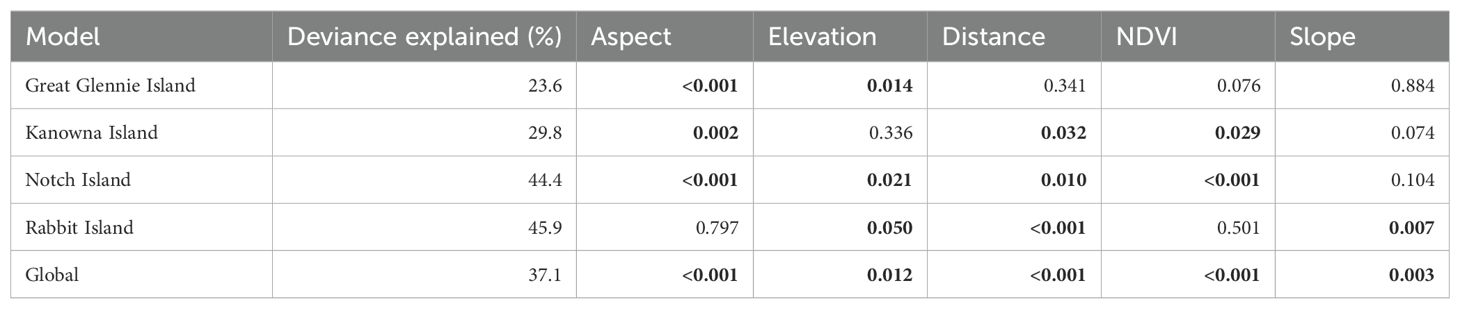
Table 3. Significance of environmental variables and deviance explained (proportion of the variability in the response variable that is accounted for by the model) by the four island-specific and the global GAMM, significant p-values are in bold (p<0.05).
Transferability
The mean absolute errors (Table 4) revealed important inaccuracies in the predictions from the Notch Island-specific model with an average error of 56 burrows compared to observations on Great Glennie Island. Amongst all the models, the predictions from the global GAMM leaving one island out were consistently more accurate than the predictions from island-specific models on the islands they were not trained on. The mean absolute error from its predictions were between 4.5 burrows on Rabbit Island and 2.34 burrows on Notch Island. The lowest mean absolute error for each island was observed for the predictions from the models that included this island observed counts in their training dataset: the matching island-specific model closely followed by the global GAMM trained on the complete dataset.
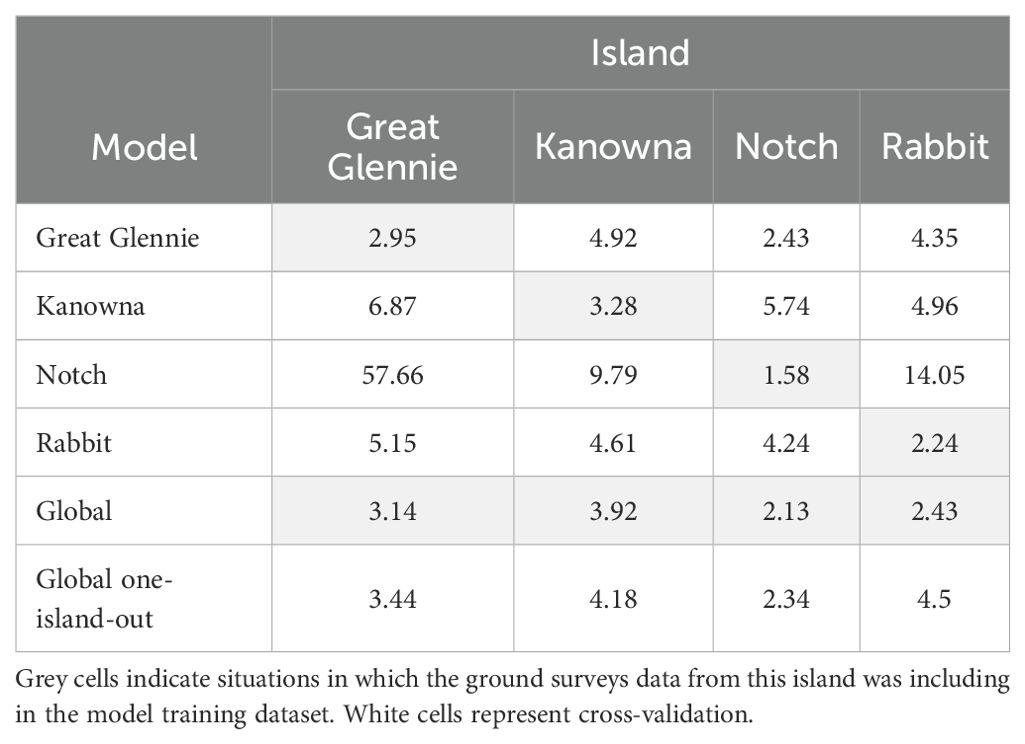
Table 4. Mean absolute error between model predicted estimates and observed counts for each quadrat, measured to assess predictive accuracy.
Therefore, when the island-specific models were used to predict the total burrow abundance on the other islands to investigate transferability, their estimate was compared to the island matching model estimate considered as the reference (Table 5). The Kanowna Island model applied to Great Glennie Island predicted 494,937 burrows compared to 271,890 using the Great Glennie Island model. Similarly, the Rabbit Island model overestimated the number of burrows for the three other colonies, while the other three island-specific models sometimes overestimated and sometimes underestimated the number of burrows depending on the colony they were projected on. The comparison between the observed count of burrows and the predicted estimates from each model for each quadrat highlights a higher accuracy on average from the island-specific models on the quadrats they were generated from. However, the accuracy lowered when the models were predicting onto a different island and, hence, the global model is more accurate overall.
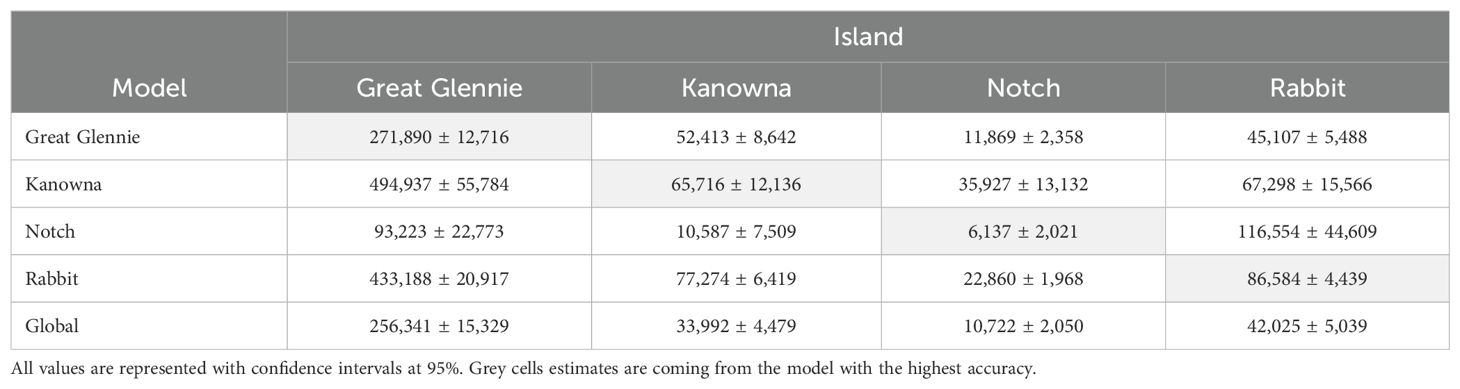
Table 5. Comparison between estimates of predicted number of short-tailed shearwater burrows obtained from GAMs built on island-specific datasets for cross validation.
Global model
The global GAMM, using all five environmental predictor variables and quadrat data for all 14 islands, explained 37.1% of the deviance (Table 3). The output estimate for Great Glennie Island was close to its island-specific model output (Table 5), with a difference of 15,549 burrows, 5.7% less burrows than the island-specific estimate. However, the global model produced estimates of approximately half that obtained from the island-specific models for Kanowna Island and Rabbit Island, with a reduction of 48.2% and 51.5%, respectively, in the number of burrows. In contrast, the global model predicted nearly double the number of burrows for Notch Island compared to the island-specific model.
The global GAMM fitting revealed the influence of the environmental variables on the density of short-tailed shearwater burrows (Figure 5). The terrain aspect had a positive effect from 64° to 209° with the strongest effect at 115°. The partial effect from the elevation was positive above 41 m and the strongest at 96 m. The distance to water was positively associated with a higher density of burrows when further than 79 m, then the effect reached a plateau from 100 m to 190 m before strengthening as the distance kept rising. The NDVI and the slope angle showed their strongest partial effect for 0.02 and 14° respectively, with a positive association for values range from -0.13 to 0.18 for the NDVI and from 9° to 22° for the slope angle.
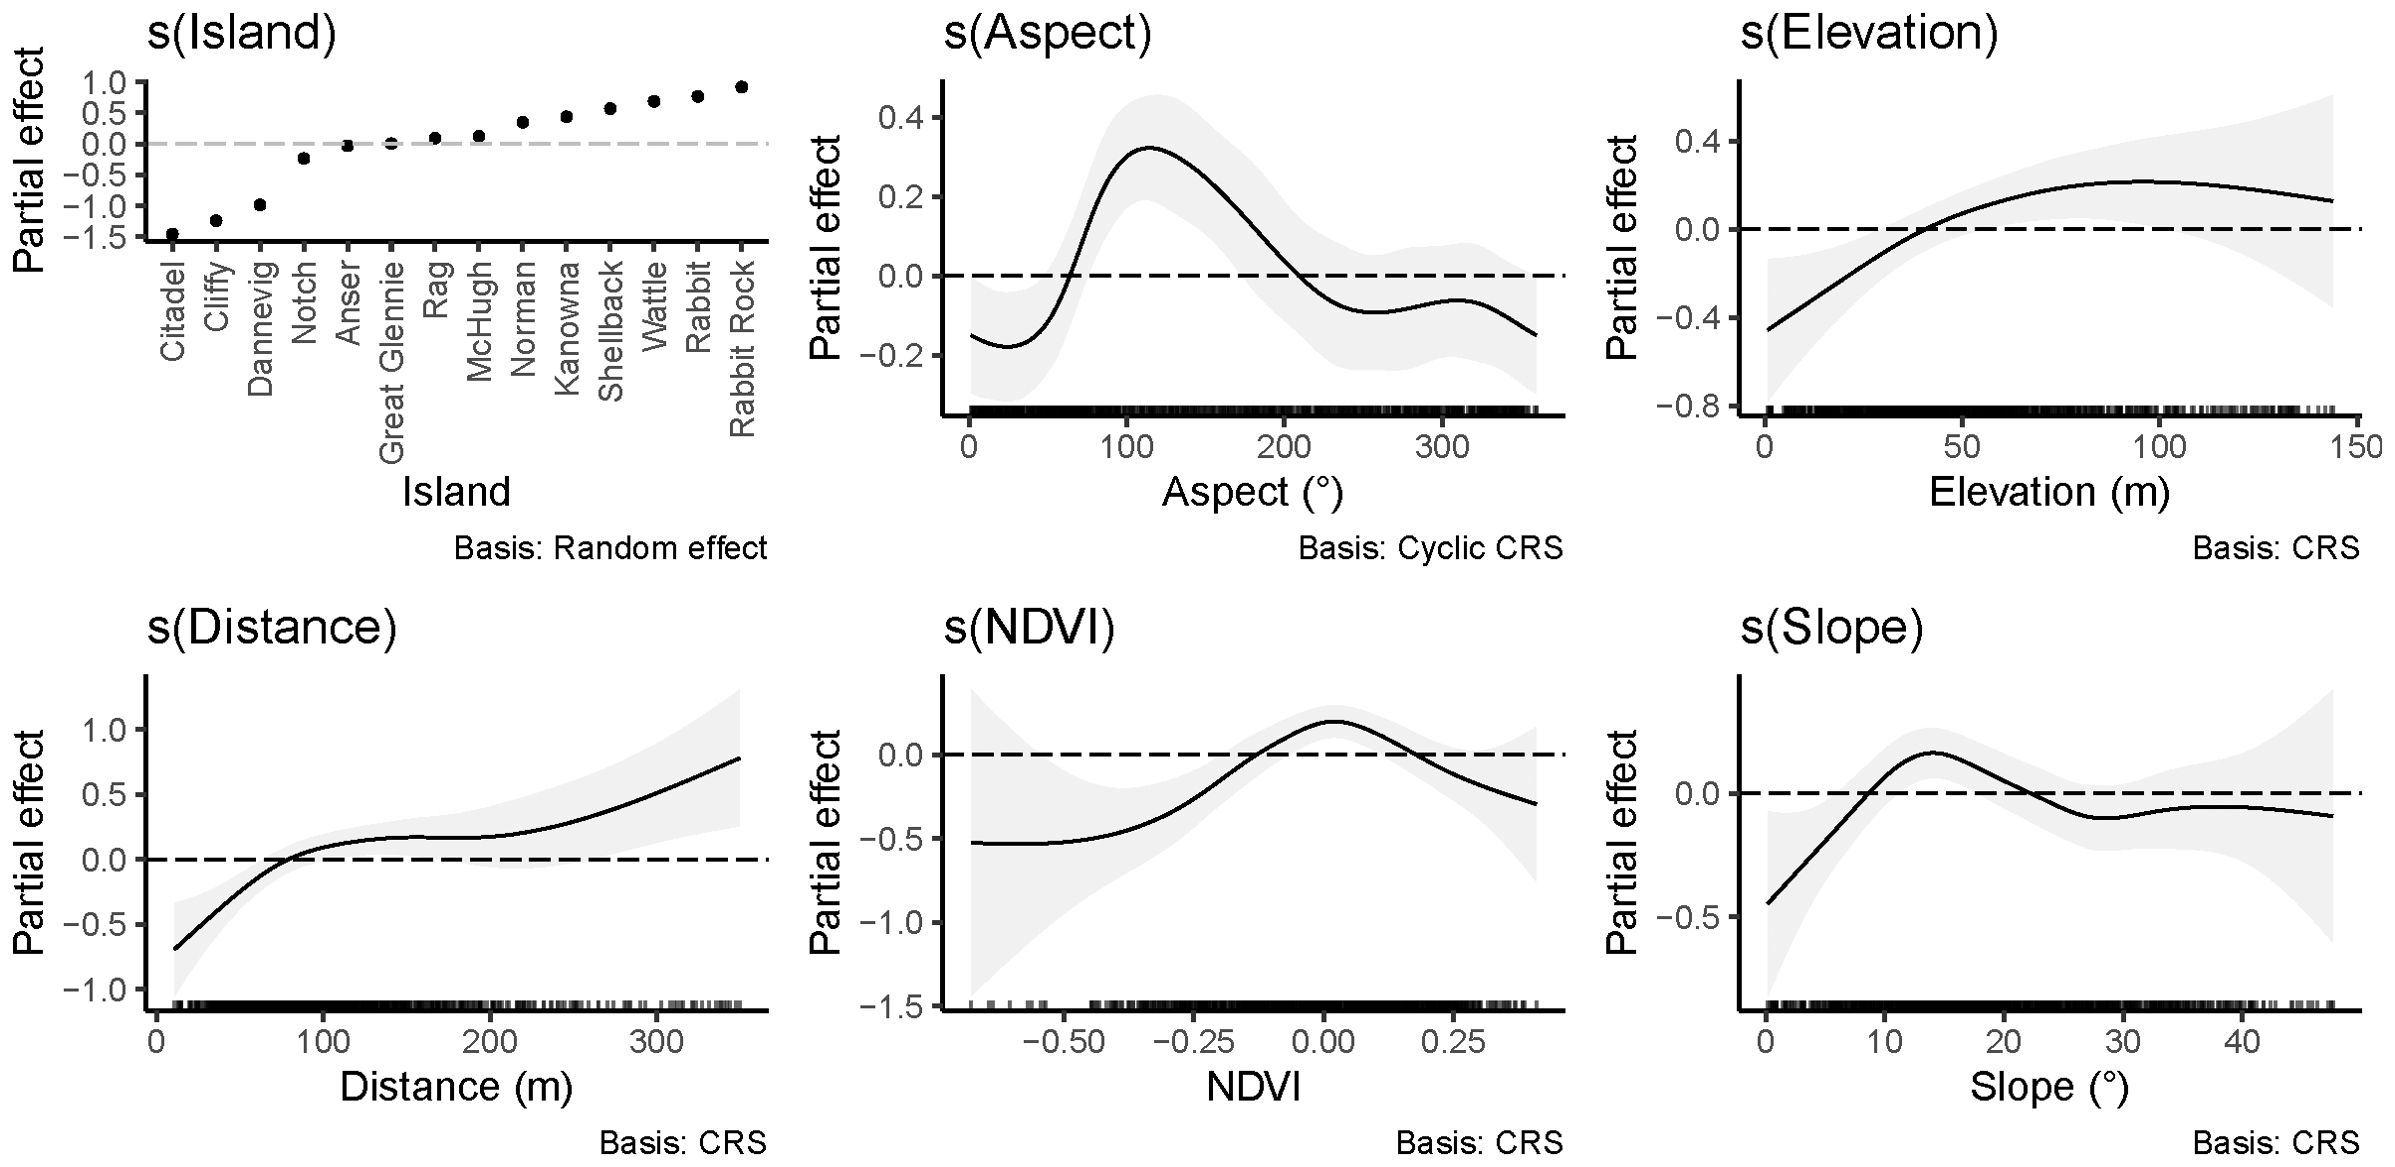
Figure 5. Partial effects of the environmental variables on the density of short-tailed shearwater burrows in the global GAMM.
Predictions
The global habitat suitability model was projected on all 258 short-tailed shearwaters colonies for which environmental data were available (Supplementary Table S1). Colony burrow abundance varied substantially from 27 ± 14 on Sisters Island to 854,597 ± 12,048 on Phillip Island, located in Bass Strait. Average burrow density at each colony also varied greatly, from 0.04 burrows·m-2 on Needle Rocks to 0.3 burrows·m-2 at Fort Direction, despite these colonies being located only 115 km apart in southern Tasmania.
The results of the model predictions revealed Bass Strait comprises the greatest proportion of burrow abundance, with an estimated 5 million burrows across 136 colonies, followed by south-central Australia with 4.1 million burrows across 32 colonies. In contrast, southern Tasmania hosts an estimated 1.1 million burrows across 76 colonies, while south-western Australia and south-eastern Australia regions account for half a million burrows each across 4 and 10 colonies, respectively.
The total burrow abundance across all sites was estimated at 11.26 million burrows (11,171,877–11,353,007). Correspondingly, using a mean occupancy rate of 57 ± 16%, the total breeding population of short-tailed shearwaters in the modelled areas was estimated at 11.51-14.17 million individuals.
Discussion
Ground-survey approaches are widely used to estimate species populations, but they represent a prohibitive time and financial cost for species like the short-tailed shearwater, a seabird breading on remote islands for which the only total breeding population estimate was published nearly 30 years ago (Skira et al., 1996). The present study used easily accessible remote-sensed data and a modelling approach to develop a global GAMM. This model identified the environmental variables affecting the density of burrows and was projected onto islands across the breeding range of short-tailed shearwater to predict the number of burrows on each known colony to, ultimately, estimate the total breeding population size of the species.
Nesting habitat suitability models and influence of environmental variables
The present study used previously collected ground-survey data of burrow density (Schumann et al., 2013) with remote-sensed environmental variables in a model-based approach to estimate burrow abundance. Using the same density dataset, Schumann et al. (2014) employed a design-based approach to estimate burrow abundance on the respective islands. The two approaches provided relatively similar estimates (Table 2). The biggest difference of 8,693 burrows appeared with the Kanowna Island estimate. The present study estimated 65,716 burrows whereas Schumann et al. (2014) estimated 15.2% fewer (57,023 burrows). The closest predictions (2.9% difference) were for Notch Island, with the current study estimating 6,137 burrows compared to 6,318 estimated by Schumann et al. (2014). These findings, therefore, suggest that nesting habitat suitability modelling is a cost- and labour-efficient alternative to area-based extrapolation of ground surveys for estimating short-tailed shearwater burrow abundance.
The influence of the environmental variables was not consistent across the four island-specific models. This suggests that short-tailed shearwaters may vary in their choice of burrow-nesting habitat. Alternatively, this lack of conformity across island-specific models could reflect a lack of sufficient variability in environmental parameters within the sampled colonies. Therefore, while the island-specific models were more similar to ground-survey collected data, the global GAMM included more habitat diversity and, hence, is more relevant for robustly predicting burrow density across non-surveyed colonies.
The present study confirmed the importance of terrain Aspect, Elevation, Distance to water, NDVI and Slope angle in influencing short-tailed shearwater breeding habitat. Similar findings have been reported for other burrowing petrel species. For example, Elevation and Vegetation are important parameters associated with Cook’s petrel (Pterodroma cookii) nesting habitat (Rayner et al., 2007b). Similarly, Aspect, Distance to water and Elevation influence the grey petrel (Procellaria cinerea) nesting areas (Schulz et al., 2005), while Slope and Vegetation are important parameters influencing nesting burrow location in the Newell’s shearwater (Puffinus newelli) (Troy et al., 2014).
In the present study, a higher density of burrows was associated with Aspect from East-North-East to South-South-West. This orientation range is opposite to the predominant wind directions encountered in the region (Figure 6). This suggests that short-tailed shearwaters may prefer nesting locations with wind directions that facilitate take-off and landing to access their burrow (Pennycuick, 1982). Similar observations were made for grey petrels by Schulz et al. (2005).
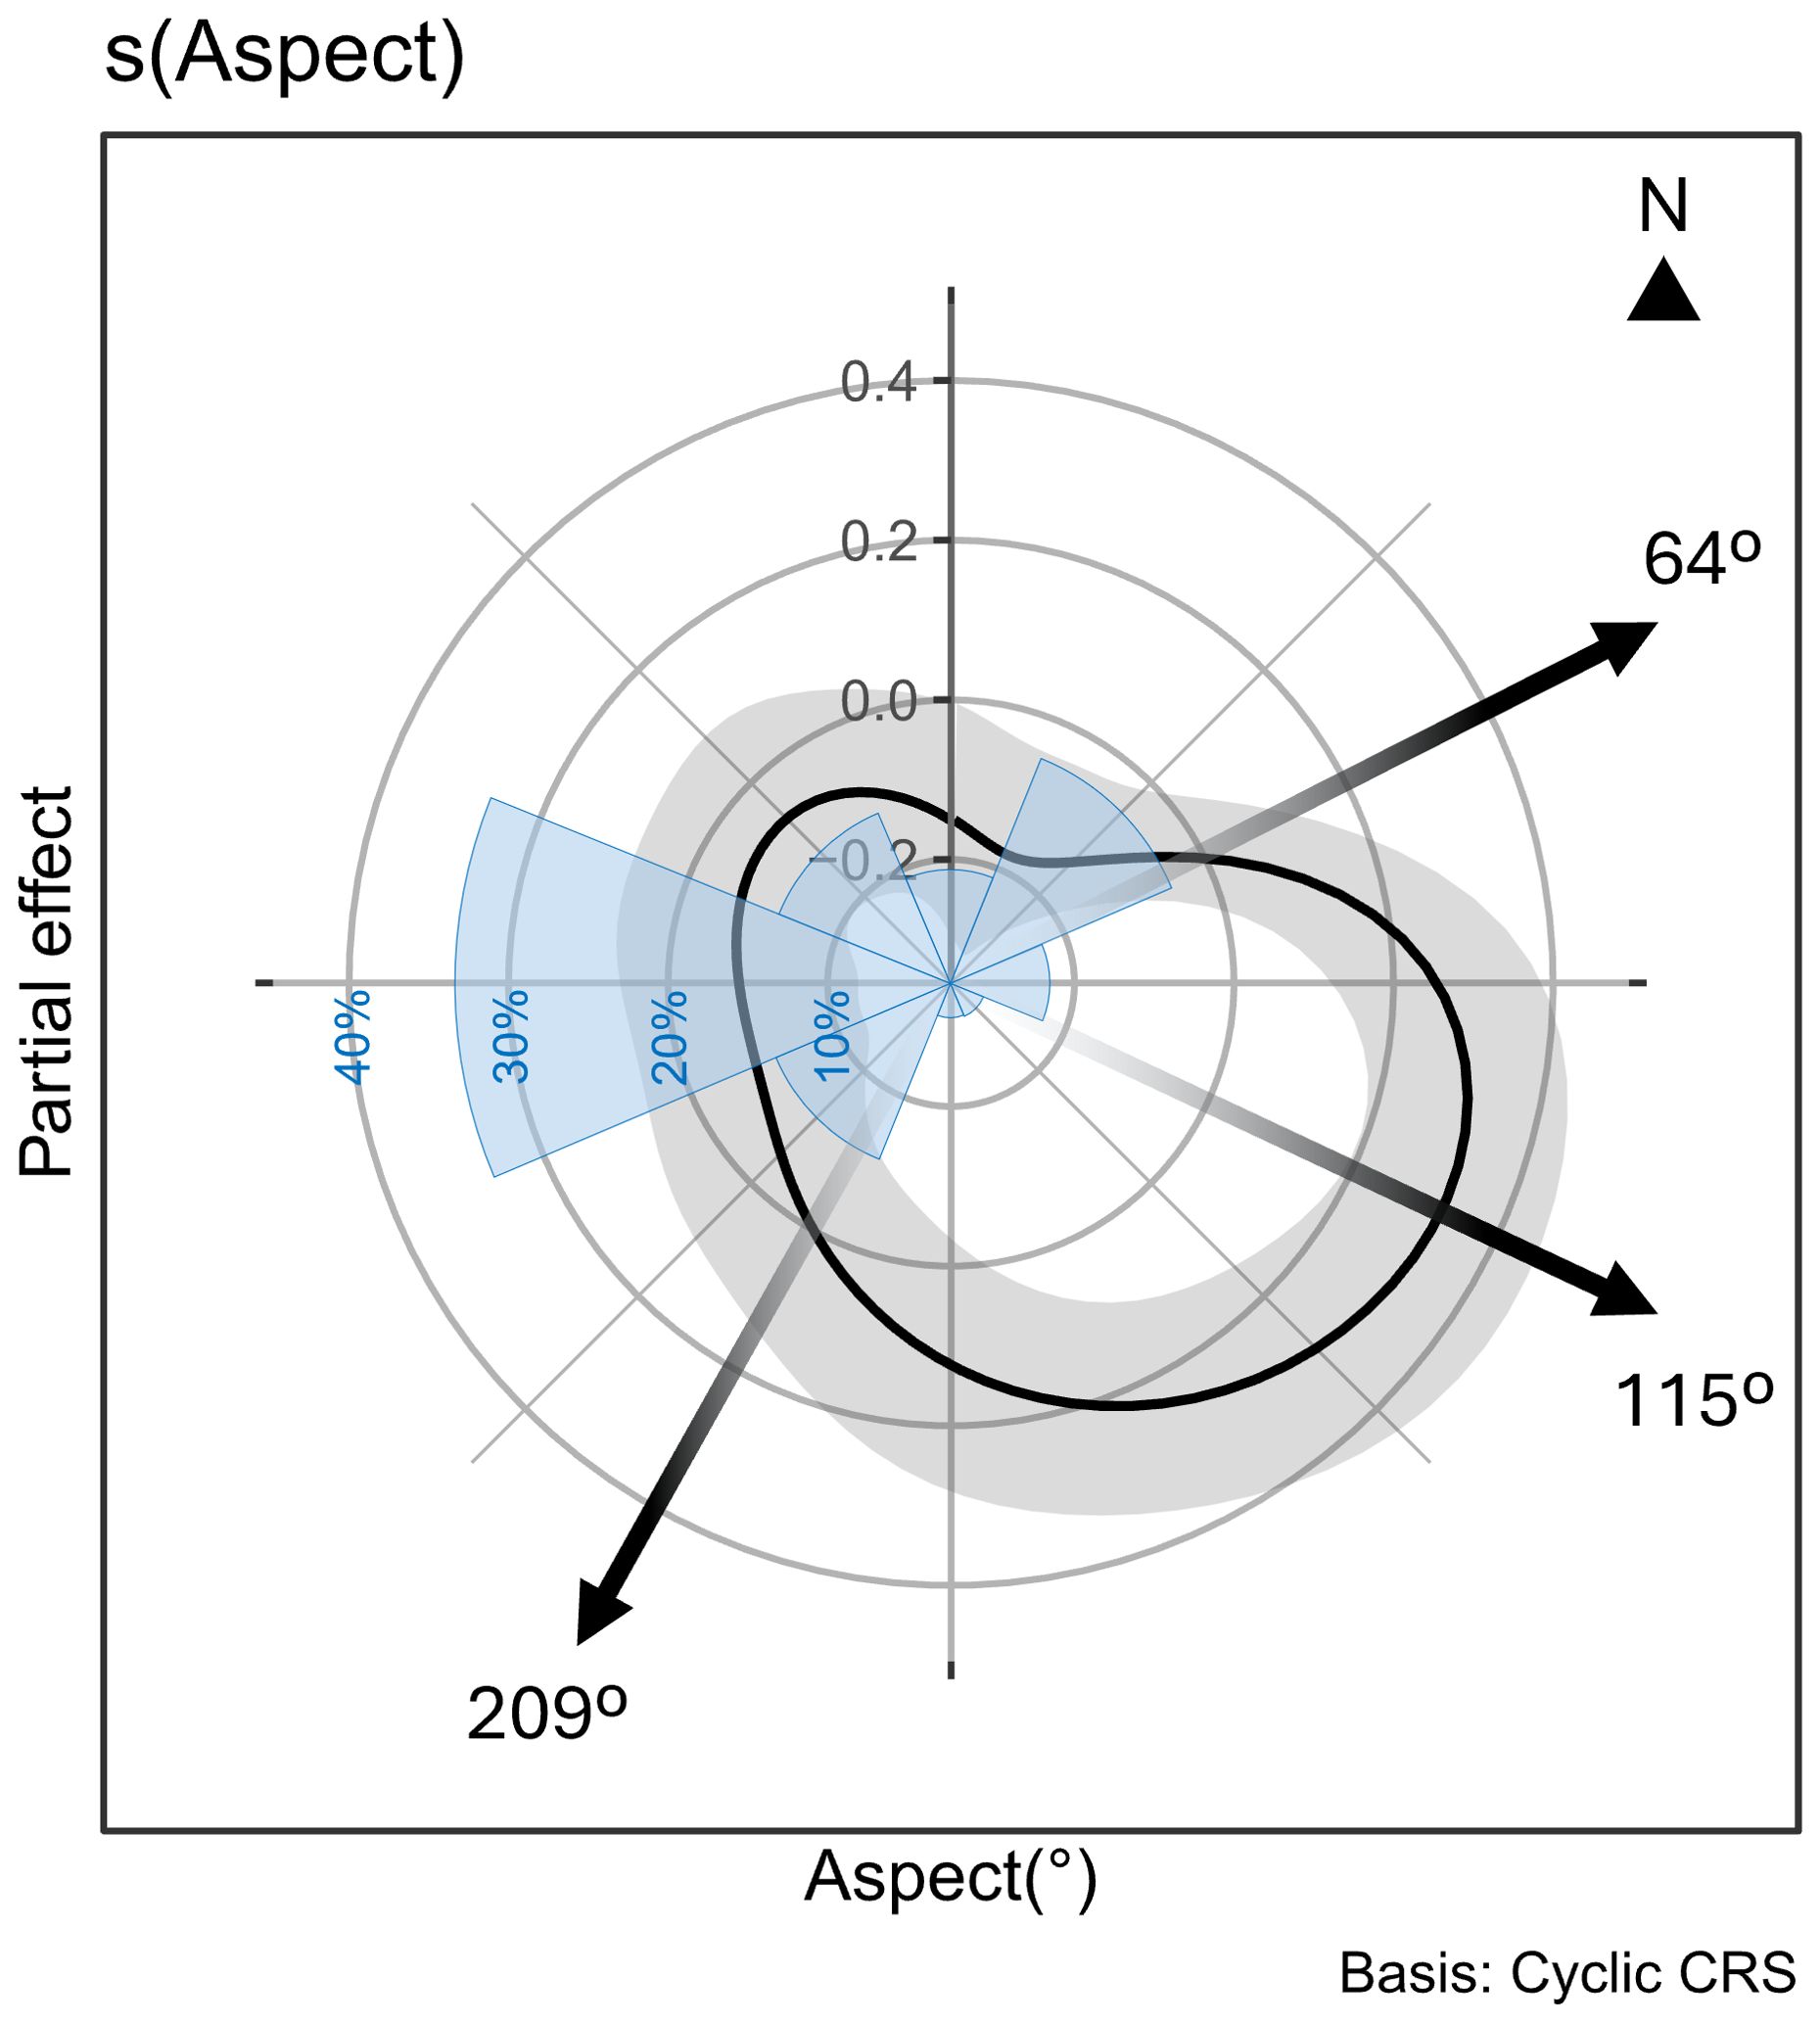
Figure 6. Partial effect of the terrain aspect on the density of short-tailed shearwater burrows from the global GAMM displayed on a circular axis. In blue: Rose of wind direction expressed in percentage collected at 9am from 01 Jan 1957 to 10 Aug 2024, Wilsons Promontory Lighthouse, Latitude: -39.1297° • Longitude: 146.4246° (n = 23650 observations) (Bureau of Meteorology website, Australian Government). The black arrows at 64° and 209° indicates the orientation from which the partial effect becomes positive, and the arrow at 115° represents the orientation for which the partial effect is maximal.
The NDVI is an index reflecting vegetation type (Eastman et al., 2013). The range of NDVI values associated with high burrow densities may reflect the influence of vegetation on soil structure impacting burrow stability and the ability of short-tailed shearwaters to excavate (Bancroft et al., 2005). Negative NDVI values are representative of bare ground or a dead plant cover, values of 0.2 are usually associated with grass and shrubs, higher values discriminate more dense and complex vegetation covers (Defries and Townshend, 1994; Zhang et al., 2017). This study reported a positive partial effect on the density of burrows when NDVI is between -0.13 and 0.18 (Figure 5). This implies that short-tailed shearwaters breed in higher density when their surroundings are represented by an assortment of bare ground and low vegetation which is in accordance with what is found in the literature (Marchant and Higgins, 1990). However, it must be noted that the dataset used to generate the global GAMM in the present study was obtained only from islands around Wilsons Promontory, northern Bass Strait, that are mostly tussock covered. This could impact the predictive ability of the model in relation to NDVI. Indeed, Skira et al. (1996) reported short-tailed shearwaters breeding in open forest on islands off Tasmania. Correspondingly, additional variability in NDVI input data would be beneficial for improving the predictive potential of the global model. While there was a temporal difference in the ground surveys and the NDVI information used in the global model generation, anecdotal evidence suggests vegetation characteristics did not greatly alter. Consequently, this is unlikely to have impacted the model accuracy.
The higher predicted burrow densities with increasing distance to water, higher elevation and steeper slope angle in the present study could reflect individuals choosing these areas to benefit from facilitation of landing and take-off. It could also reflect selection for areas with adequate drainage to prevent burrow flooding from severe storm waves or heavy rains. Similar nesting habitat considerations have been suggested for other burrow nesting seabirds (Schramm, 1986; Catry et al., 2003; Schulz et al., 2005; Rayner et al., 2007b). However, the effect of Distance to water observed in the present study should be interpreted with caution as the size of the islands from which the data were used to generate the global model were limited in size in comparison to some of the islands throughout the rest of the species range. Extensive ground surveys to count burrows on a few large sized islands could be beneficial to better identify the effect of Distance to water.
Five environmental variables that have been shown to be ecologically relevant to the short-tailed shearwaters (Schumann et al., 2013) were used for the global GAMM in the present study. However, other locally important parameters may influence nesting burrow density. For example, the presence of a line of trees or high vegetation between a grassland area and the ocean could potentially deprive individuals from an efficient escape response to predators, thereby limiting the suitability of the area for nesting. In addition, human disturbance and anthropogenic pressures such as light pollution, walking trails, constructions, and habitat modification for pasture could influence nesting burrow density (Marchant and Higgins, 1990; Rayner et al., 2007a). Similarly, harvesting of individuals currently managed under quota in Tasmania (Skira, 1990; Department of Natural Resources and Environment Tasmania, 2024), as well as introduced predators like cats, foxes, and rats (Harris and Norman, 1981; Marchant and Higgins, 1990; Rayner et al., 2007a) could impact locally nesting burrow density. The recreational and commercial harvesting extent is not negligible, it concerned 36 colonies for the 2025 recreational harvesting season (Department of Natural Resources and Environment Tasmania, 2024). Despite being well documented, the impact of the activity on the population stays difficult to assess due to limited knowledge of the species movements between and among colonies (Price, 2022). There is no study reporting the number of colonies impacted by introduced predators, but it is believed to be limited to colonies regularly accessed by humans. Furthermore, competition with other seabirds exploiting the same nesting environment could also influence burrow density, especially as some seabirds may breed in multi-species communities (Schreiber and Burger, 2002). Indeed, short-tailed shearwaters have been found to nest sympatrically with several other species including, but not limited to, little penguins (Eudyptula minor), fairy prions (Pachyptila turtur), common diving petrels (Pelecanoides urinatrix), and sooty shearwaters (Ardenna grisea) (Brothers et al., 2001). A greater understanding of the factors influencing the nesting distribution of these other species, and their overlap with short-tailed shearwaters, is needed to refine the modelling approach used in the present study. In addition, the short-tailed shearwater social behaviour can express micro-habitat selection (Rayner et al., 2007a), clustering, and an effect of colony size on burrows density (Yearsley et al., 2003). Breeding and foraging habitats intricately influence the selection of each other by seabirds (Schreiber and Burger, 2002). This study focused on predicting population abundance according to breeding grounds parameters, but survival requires fulfilment of metabolic needs. Thus, our model results only reflect areas breeding population in a context where the impact of foraging habitat is similar on the predicted colonies than on the colonies around Wilson’s Promontory. Actual observed breeding population abundance can differ positively or negatively according to foraging habitat benefits or limitations. In the case of short-tailed shearwaters, the East Australian Current significantly influences the marine thermal regime of south-eastern Australia (Poloczanska et al., 2007; Hobday and Lough, 2011; Suthers et al., 2011) which can impact the distribution, abundance and availability of prey (Baillie et al., 1993; Edwards and Richardson, 2004). This could lead to lower possible density of individuals and ultimately regression of the breeding range of the species in its north-eastern part.
Burrow abundance across the species range
The only previous range-wide estimate of the short-tailed shearwater breeding population recorded approximately 13.6 million burrows (Skira et al., 1996). These were combined across 11.5 million burrows in Tasmania, 1.45 million burrows in Victoria, slightly more than half a million in South Australia and a few thousands shared between New South Wales and Western Australia. The present study estimated a similar total number with 11.3 million burrows. However, the spatial distribution of burrows was noticeably different between the estimates. For example, the present study predicted 4.2 million burrows in Tasmania, less than half the previous estimate (Skira et al., 1996). Conversely, the present study prediction was more than 6 times the burrows previously estimated in South Australia (Robinson et al., 1996).
Comparison of the nest burrow abundance estimates obtained in the present study with previously published surveys revealed some similarities and some substantial differences across the species range (Supplementary Table S1). For example, the largest difference between estimates was for Babel Island (Bass Strait) where the present study predicted 363,448 burrows compared to the previous estimate of 2.8 million burrows (Skira et al., 1996). Such disparities could be due to multiple factors with variable impacts across different colonies.
While there are limitations to the modelling approach used in the present study, a potential major source for these differences could also be the methods employed in the previous estimates. Unfortunately, there is a lack of consistency in the ground survey methods used, and in some cases a lack of their description, across the sites reported in the previous estimates (Lane, 1979; Harris and Norman, 1981; Robinson et al., 1996; Skira et al., 1996). In particular, not all previous estimates specified whether only occupied burrows or total burrow numbers were recorded. Skipping of breeding seasons, or abandoning breeding attempts, due to poor body condition and foraging conditions is a common life history trait in Procellariiforms (Marchant and Higgins, 1990; Schreiber and Burger, 2002). Hence, substantial inter-annual variation in breeding population sizes could result from recording of only occupied burrows.
In addition, the time difference between the previous breeding population estimates and the present study predictions could be a source of the disparities between them due to variations in breeding success, recruitment, and inter-colony dispersal influencing local population growth or decline (Harris and Norman, 1981). For example, Serventy and Curry (1984) reported a 71% decline in the number of occupied short-tailed shearwater burrows on Fisher Island (eastern Bass Strait) over a 25-year period (1947-1972). Similarly, Vertigan (2010) reported a 36.6% decline in breeding pairs between 2003 and 2010 on Wedge Island (southern Tasmania) and Dorothee Island (South Australia) was recorded to have 948 short-tailed shearwater burrows in 1996 (Robinson et al., 1996) but none in 2010 (Goldsworthy and Page, 2010). Another factor could be the dynamic nature of island ecosystems, with heat waves, fire, flooding, invasive species, wind and rain erosion events potentially impacting vegetation communities and burrow nesting habitats in a short period of time (Benavides Rios et al., 2024). In addition, Harris and Norman (1981) cautioned that variability between researchers’ observational subjectivity and methods could affect result, highlighting an estimate of 1,000 pairs nesting on Gabo Island in 1971 by Reid et al. (1971) compared to 20,000 – 50,000 pairs estimated six years later at the same location (Reilly, 1977).
In summary, the nesting habitat suitability modelling approach of the present study provided a range-wide total burrow abundance of 11.3 million, suggesting a total breeding population of ca 13.5 million individuals. The addition of recent data from other Australian regions along with latitude and longitude variables could significantly improve the accuracy of the results. Therefore, our global habitat suitability model is a strong base and correct approach to estimate short-tailed shearwaters, and possibly other burrowing petrel species under financial and logistics constraints. The habitat suitability modelling approach allows prediction on non-surveyed areas. However, we highlighted that the accuracy of our results can be improved by including small burrows area surveys in different parts of the short-tailed shearwater breeding range, as well as a few of the largest colonies for which this study predictors were out of range, in the model input dataset. Ultimately, additional ground surveys in different habitat types across the species range matched with current NDVI values would be invaluable to confirm the modelled outputs and refine the model.
Data availability statement
The original contributions presented in the study are included in the article/supplementary material, further inquiries can be directed to John Arnould, am9obi5hcm5vdWxkQGRlYWtpbi5lZHUuYXU=.
Author contributions
NS: Writing – review & editing, Formal Analysis, Writing – original draft, Conceptualization, Methodology, Investigation. JM: Writing – original draft, Methodology, Validation, Writing – review & editing, Conceptualization. PB: Supervision, Validation, Writing – review & editing, Writing – original draft. JA: Writing – original draft, Funding acquisition, Conceptualization, Resources, Project administration, Methodology, Writing – review & editing, Supervision, Validation.
Funding
The author(s) declare that financial support was received for the research and/or publication of this article. This work was supported by Deakin University internal funds.
Acknowledgments
We acknowledge the important contribution of all the people that worked on the data collection and particularly Nicole Schumann, as well as the logistical support provided by Parks Victoria. PB is an honorary member of the IUF (Institut Universitaire de France).
Conflict of interest
The authors declare that the research was conducted in the absence of any commercial or financial relationships that could be construed as a potential conflict of interest.
Generative AI statement
The author(s) declare that no Generative AI was used in the creation of this manuscript.
Publisher’s note
All claims expressed in this article are solely those of the authors and do not necessarily represent those of their affiliated organizations, or those of the publisher, the editors and the reviewers. Any product that may be evaluated in this article, or claim that may be made by its manufacturer, is not guaranteed or endorsed by the publisher.
Supplementary material
The Supplementary Material for this article can be found online at: https://www.frontiersin.org/articles/10.3389/fmars.2025.1599553/full#supplementary-material
Footnotes
- ^ https://www.naturalvaluesatlas.tas.gov.au
References
Austin M. P. (2002). Spatial prediction of species distribution: an interface between ecological theory and statistical modelling. Ecol. Modell 157, 101–118. doi: 10.1016/S0304-3800(02)00205-3
Baillie J. E., Hilton-Taylor C., and Stuart S. N. (2004). Birds as Monitors of Environmental Change. 2004 IUCN Red List of Threatened Species: A Global Species Assessment. Chapman & Hall, London, UK: Birds as Monitors of Environmental Change.
Baillie S. R., Brisbin I. L. Jr., Crick H. P. Q., Furnee R. W., Greenwood J. J. D., Jarvis P. J., et al. (1993). Birds as Monitors of Environmental Change Furness R. W. and Greenwood J. J. D. (Springer Netherlands). doi: 10.1007/978-94-015-1322-7
Bancroft W. J., Roberts J. D., and Garkaklis M. J. (2005). Burrow entrance attrition rate in Wedge-tailed shearwater Puffinus Pacificus colonies on Rottnest Island, Western Australia. Mar. Ornithol, 23–26. doi: 10.5038/2074-1235.33.1.637
Benavides Rios E., Sadler J., Graham L., and Matthews T. J. (2024). Species distribution models and island biogeography: Challenges and prospects. Glob Ecol. Conserv. 51. doi: 10.1016/j.gecco.2024.e02943
Bird J. P., Terauds A., Fuller R. A., Pascoe P. P., Travers T. D., McInnes J. C., et al. (2022). Generating unbiased estimates of burrowing seabird populations. Ecography. 2022, (7). doi: 10.1111/ecog.06204
Boyce M. S., Vernier P. R., Nielsen S. E., and Schmiegelow F. K. A. (2002). Evaluating resource selection functions. Ecol. Modell 157, 281–300. doi: 10.1016/S0304-3800(02)00200-4
Bradley J. S., Gunn B. M., Skira I. J., Meathrel C. E., and Wooller R. D. (1999). Age-dependent prospecting and recruitment to a breeding colony of Short-tailed Shearwaters Puffinus tenuirostris. Parks Wildlife. 141, 277–285. doi: 10.1111/j.1474-919X.1999.tb07550.x
Bradley J. S., Wooller R. D., and Skira I. J. (2000). Intermittent Breeding in the Short-Tailed Shearwater Puffinus tenuirostris. London, UK: British Ecological Society.
Brothers N., Pemberton D., Pryor H., and Lucieer V. (2001). Tasmania’s offshore islands: seabirds and other natural features. Tasmanian Museum Art Gallery.
Callaghan C. T., Santini L., Spake R., and Bowler D. E. (2024). Population abundance estimates in conservation and biodiversity research. Trends Ecol. Evol. 39, 515–523. doi: 10.1016/j.tree.2024.01.012
Camp R. J., Miller D. L., Thomas L., Buckland S. T., and Kendall S. J. (2020). Using density surface models to estimate spatio-temporal changes in population densities and trend. Ecography 43, 1079–1089. doi: 10.1111/ecog.04859
Catry P., Campos A., Segurado P., Silva M., and Strange I. (2003). Population census and nesting habitat selection of thin-billed prion Pachyptila belcheri on New Island, Falkland Islands. Polar Biol. 26, 202–207. doi: 10.1007/s00300-002-0465-9
Croxall J. P., Butchart S. H. M., Lascelles B., Stattersfield A. J., Sullivan B., Symes A., et al. (2012). Seabird conservation status, threats and priority actions: A global assessment. Bird Conserv. Int. 22, 1–34. doi: 10.1017/S0959270912000020
Defries R. S. and Townshend J. R. (1994). NDVI-derived land cover classifications at a global scale. Int. J. Remote Sens 15, 3567–3586. doi: 10.1080/01431169408954345
Department of Natural Resources and Environment Tasmania (2024). Non-Commercial Short-tailed Shearwater (Muttonbird) Season 2025. Hobart, Tasmania, Australia: Department of Natural Resources and Environment Tasmania.
Dias M. P., Martin R., Pearmain E. J., Burfield I. J., Small C., Phillips R. A., et al. (2019). Threats to seabirds: A global assessment. Biol. Conserv. 237, 525–537. doi: 10.1016/j.biocon.2019.06.033
Eastman J. R., Sangermano F., MaChado E. A., Rogan J., and Anyamba A. (2013). Global trends in seasonality of Normalized Difference Vegetation Index (NDVI), 1982-2011. Remote Sens (Basel) 5, 4799–4818. doi: 10.3390/rs5104799
Edwards M. and Richardson A. J. (2004). Impact of climate change on marine pelagic phenology and trophic mismatch. Nature 430, 881–884. doi: 10.1038/nature02808
Goldsworthy S. D. and Page B. (2010). Review of the distribution of crested terns, little penguins, short-tailed shearwaters and flesh-footed shearwaters in the South-west Marine Region off South Australia. Adelaide. 451.12p.
Google Earth (2024). Google Earth Pro. Available online at: https://earth.google.com/ (Accessed January 15, 2025).
Guisan A. and Zimmermann N. E. (2000). Predictive habitat distribution models in ecology. Ecological Modelling, Elsevier.
Harris M. P. and Norman F. I. (1981). Distribution and status of coastal colonies of seabirds in Victoria. Memoirs Natl. Museum Victoria 42, 89–106. doi: 10.24199/j.mmv.1981.42.05
Hartig F. (2024). DHARMa: Residual Diagnostics for Hierarchical (Multi-Level/Mixed) Regression Models. R package version 0.4.7. Available online at: https://CRAN.R-project.org/package=DHARMa (Accessed June 5, 2025).
Hijmans R. (2025). terra: Spatial Data Analysis. R package version 1.8-10. Available online at: https://CRAN.R-project.org/package=terra (Accessed June 5, 2025).
Hobday A. J. and Lough J. M. (2011). Projected climate change in Australian marine and freshwater environments. Mar. Freshw. Res. 62, 1000–1014. doi: 10.1071/MF10302
Klausmeyer K. R. and Shaw M. R. (2009). Climate change, habitat loss, protected areas and the climate adaptation potential of species in mediterranean ecosystems worldwide. PloS One 4. doi: 10.1371/journal.pone.0006392
Marchant S. and Higgins P. J. (1990). Handbook of Australian, New Zealand & Antarctic Birds in Ratites to ducks; Part A, Ratites to petrels, vol. 1. (UK: Oxford University Press), 263–4.
Marshall A. J. and Serventy D. L. (1956). The breeding cycle of the short-tailed shearwater, Puffinus tenuirostris (temminck), in relation to trans-equatorial migration and its environment. Proc. zoological Soc. London 127, 489–510. doi: 10.1111/j.1096-3642.1956.tb00484.x
Naimi B., Hamm N. A. S., Groen T. A., Skidmore A. K., and Toxopeus A. G. (2014). Where is positional uncertainty a problem for species distribution modelling? Ecography 37, 191–203. doi: 10.1111/j.1600-0587.2013.00205.x
Parker G. C. and Rexer-Huber K. (2016). Guidelines for designing burrowing petrel surveys to improve population estimate precision. Hobart, Tasmania, Australia: Agreement on the Conservation of Albatrosses and Petrels.
Pebesma E. and Bivand R. (2023). Spatial Data Science With Applications in R. (London, UK: Chapman and Hall).
Pennycuick C. J. (1982). The flight of petrels and albatrosses (Procellariiformes), observed in South Georgia and its vicinity. Philos. Trans. R. Soc. London. B Biol. Sci. 300, 75–106. doi: 10.1098/rstb.1982.0158
Poloczanska E. S., Babcock R. C., Butler A., Hobday A. J., Hoegh-Guldberg O., Kunz T. J., et al. (2007). Climate change and Australian marine life. Oceanography Mar. Biol. 45, 407–478. doi: 10.1201/9781420050943.ch8
Price C. A. (2022). The role of climate variability and harvest impacts on the short-tailed shearwater (Ardenna tenuirostris). University Of Tasmania. doi: 10.25959/23250506.v1
Price C. A., Emery T. J., Hartmann K., Woehler E. J., Monash R., and Hindell M. A. (2021). Inter-annual and inter-colony variability in breeding performance of four colonies of short-tailed shearwaters. J. Exp. Mar. Biol. Ecol. 537. doi: 10.1016/j.jembe.2020.151498
QGIS Development Team (2023). QGIS Geographic Information System. Available online at: https://www.qgis.org/ (Accessed January 15, 2025).
Rayner M. J., Clout M. N., Stamp R. K., Imber M. J., Brunton D. H., and Hauber M. E. (2007a). Predictive habitat modelling for the population census of a burrowing seabird: A study of the endangered Cook’s petrel. Biol. Conserv. 138, 235–247. doi: 10.1016/j.biocon.2007.04.021
Rayner M. J., Hauber M. E., and Clout M. N. (2007b). Breeding habitat of the Cook’s Petrel (Pterodroma cookii) on Little Barrier Island (Hauturu): Implications for the conservation of a New Zealalnd endemic. Emu 107, 59–68. doi: 10.1071/MU06038
R Core Team (2023). R: A Language and Environment for Statistical Computing. Available online at: https://www.r-project.org/ (Accessed June 5, 2025).
Reid A. J., Shaw N. J., Wheeler W. R., and Kroyer-Pedersen M. (1971). “Birds of Victoria 3 Oceans, bays, beaches,” in McLaren Troedel & Cooper (The Gould League of Victoria, Melbourne).
Robinson T., Canty P., Mooney T., and Rudduck P. (1996). South Australia’s Offshore Islands. Canberra, Australia: Australian Government Publishing Service.
Rodríguez A., Arcos J. M., Bretagnolle V., Dias M. P., Holmes N. D., Louzao M., et al. (2019). Future directions in conservation research on petrels and shearwaters. Front. Mar. Sci. 6. doi: 10.3389/fmars.2019.00094
Schramm M. (1986). Burrow Densities and Nest Site Preferences of Petrels (Procellariidae) at the Prince Edward Islands. Polar Biology, Springer.
Schulz M., Robinson S., and Gales R. (2005). Breeding of the Grey Petrel (Procellaria cinerea) on Macquarie Island: Population size and nesting habitat. Emu 105, 323–329. doi: 10.1071/MU04058
Schumann N., Dann P., and Arnould J. P. Y. (2013). Use of terrestrial habitats by burrow-nesting seabirds in south-eastern Australia. Emu 113, 135–144. doi: 10.1071/MU12088
Schumann N., Dann P., and Arnould J. P. Y. (2014). The significance of northern-central Bass Strait in south-eastern Australia as habitat for burrowing seabirds. Emu 114, 234–240. doi: 10.1071/MU13048
Serventy D. L. and Curry P. J. (1984). Observations on Colony Size, Breeding Success, Recruitment and Inter-Colony Dispersal in a Tasmanian Colony of Short-Tailed Shearwaters Puffinus tenuirostris Over a 30-Year Period. Emu 84, 71–79. doi: 10.1071/MU9840071
Skira I. J. (1990). Human exploitation of the short-tailed shearwater (Puffinus tenuirostris). Papers Proc. R. Soc. Tasmania 124, 77–90. doi: 10.26749/rstpp.124.1.77
Skira I. J., Brothers N. P., and Pemberton D. (1996). Distribution, abundance and conservation status of short-tailed shearwaters Puffinus tenuirostris in Tasmania, Australia. Mar. Ornithol 24. doi: 10.5038/2074-1235.24.1.353
Skira I. J., Wapstra G. N., Towney G. N., and Naarding J. A. (1985). Conservation of the Short-tailed Shearwater Puffinus tenuirostris in Tasmania, Australia. Biol. Conserv. 37, 226–236. doi: 10.1016/0006-3207(86)90083-2
Suthers I. M., Young J. W., Baird M. E., Roughan M., Everett J. D., Brassington G. B., et al. (2011). The strengthening East Australian Current, its eddies and biological effects - an introduction and overview. Deep Sea Res. 2 Top. Stud. Oceanogr 58, 538–546. doi: 10.1016/j.dsr2.2010.09.029
Troy J. R., Holmes N. D., Veech J. A., Raine A. F., and Green M. C. (2014). Habitat suitability modeling for the Newell’s shearwater on Kauai. J. Fish Wildl Manag 5, 315–329. doi: 10.3996/112013-JFWM
Vertigan C. (2010). The life-history of short-tailed shearwaters (Puffinus tenuirostris) in response to spatio-temporal environmental variation (Australia: University of Tasmania).
Walsh D. P., Stiver J. R., White G. C., Remington T. E., and Apa A. D. (2010). Population Estimation Techniques for Lekking Species. J. Wildlife Manage. 74, 1607–1613. doi: 10.2193/2009-353
White G. C. and Shenk T. M. (2001). Population Estimation with Radio-Marked Animals. (USA: Academic Press), 329–350.
Wijeratne E. M. S., Pattiaratchi C. B., Eliot M., and Haigh I. D. (2012). Tidal characteristics in Bass Strait, south-east Australia. Estuar. Coast. Shelf Sci. 114, 156–165. doi: 10.1016/j.ecss.2012.08.027
Williams B. K., Nichols J. D., and Conroy M. J. (2002). Analysis and Management of Animal Populations: Modeling, Estimation, and Decision Making. (Cambridge, UK: Academic press).
Wood S. N. (2017). Generalized Additive Models: An Introduction with R. 2nd (London, UK: Chapman and Hall, CRC).
Yearsley J. M., Fletcher D., and Hunter C. (2003). Sensitivity analysis of equilibrium population size in a density-dependent model for Short-tailed Shearwaters. Ecol. Modell 163, 119–129. doi: 10.1016/S0304-3800(02)00416-7
Keywords: burrowing seabird colonies, burrow density ground surveys, remote sensed environmental data, generalised additive model prediction, occupancy rate, Southern Australia
Citation: De Almeida E Silva N, Monk J, Bustamante P and Arnould JPY (2025) Estimating the breeding population size of the short-tailed shearwater using a nesting habitat suitability model. Front. Mar. Sci. 12:1599553. doi: 10.3389/fmars.2025.1599553
Received: 25 March 2025; Accepted: 11 June 2025;
Published: 27 June 2025.
Edited by:
Vitor H. Paiva, University of Coimbra, PortugalReviewed by:
Holly Crystal Raudino, Department of Biodiversity, Conservation and Attractions (DBCA), AustraliaTeresa Militão, University of Coimbra, Portugal
Copyright © 2025 De Almeida E Silva, Monk, Bustamante and Arnould. This is an open-access article distributed under the terms of the Creative Commons Attribution License (CC BY). The use, distribution or reproduction in other forums is permitted, provided the original author(s) and the copyright owner(s) are credited and that the original publication in this journal is cited, in accordance with accepted academic practice. No use, distribution or reproduction is permitted which does not comply with these terms.
*Correspondence: Nicolas De Almeida E Silva, bmljb2xhcy5kZWFsbWVpZGFAaG90bWFpbC5mcg==