Abstract
The nitrogen isotopic composition of shell-bound organic matter in planktonic foraminifera (FB-δ15N) is widely used as a proxy for past ocean deoxygenation because water-column denitrification in oxygen-deficient zones (ODZs; [O2] < 5 µmol/kg) preferentially removes 14N, enriching the remaining nitrate in 15N. Typically, increases in FB-δ15N records from ODZ-influenced regions are interpreted as evidence of ODZ expansion or intensification. However, planktonic foraminifera predominantly feed on organic nitrogen derived from the subsurface nitrate immediately below the euphotic zone, often above ODZ core depths. It remains unclear if the δ15N maxima observed within ODZ cores, reflecting denitrification intensity at a given location, directly correlates with the FB-δ15N values recorded above. Here, we combine new and published data from the eastern tropical Pacific ODZs to examine relationships among subsurface nitrate δ15N, ODZ δ15N maxima, and ODZ upper-boundary depths. Our analysis reveals a strong correlation between subsurface nitrate δ15N and ODZ δ15N maxima (R2 = 0.56-0.79), supporting the use of FB-δ15N as an indicator of denitrification intensity within ODZ regions. However, subsurface nitrate δ15N also correlates strongly with the ODZ upper-boundary depth (R2 = 0.57-0.59), with lower δ15N values observed where ODZs are deeper. For example, at our new study sites in the Eastern Tropical North Pacific (5 – 8°N), where the ODZ upper-boundary depth is ~300 m, the δ15N maxima (>10‰) at the ODZ core decrease upward to subsurface nitrate δ15N values of ~6.5‰ — only slightly higher than the global pycnocline nitrate δ15N. These results suggest that variations in ODZ depth should be accounted for when interpreting FB-δ15N records (and other δ15N archives) from ODZ regions. Under warmer conditions, organic matter remineralization may become shallower due to the temperature dependence of respiration, shifting ODZs upward and elevating FB-δ15N even without changes in denitrification rates. To more robustly reconstruct ODZ history using FB-δ15N, we recommend using multiple sites from the ODZ interior to regions beyond their modern boundaries. Cores situated outside modern ODZs, where thermocline nitrate δ¹5N still carries the ODZ signature, are ideal for tracing ODZ expansions and contractions, while cores from within the modern ODZs provide complementary constraints on ODZ intensity and vertical structure.
1 Introduction
The nitrogen isotopic composition of shell-bound organic matter in planktonic foraminifera (foraminifera-bound δ15N, or FB-δ15N, where δ15N = {[(15N/14N) sample/(15N/14N) N2 in air] - 1} x 1000‰) has emerged as a powerful proxy for reconstructing past changes in the marine nitrogen cycle and its interaction with climate (e.g., Ren et al., 2009; Kast et al., 2019; Studer et al., 2021; Auderset et al., 2022; Wang et al., 2022). In regions with complete surface nitrate consumption such as oligotrophic gyres, FB-δ15N are correlated with the δ15N of the subsurface nitrate (i.e., immediately below the euphotic zone) (Ren et al., 2009, 2012; Schiebel et al., 2018; Smart et al., 2018; Robinson et al., 2023). In regions with incomplete nitrate consumption such as the Southern Ocean, FB-δ15N is also indicative of the degree of nitrate consumption in the past (Martínez-García et al., 2014). Compared with other δ15N archives, FB-δ15N offers several advantages. First, relative to bulk sedimentary δ15N records, FB-δ15N is less affected by diagenesis because the shell-bound organic matter is protected by the calcite shells (Ren et al., 2009). Second, foraminifera are more widely distributed throughout the ocean than other fossil-bound δ15N archives such as diatoms and corals. Third, foraminifera can be readily separated from ocean sediments via sieving and picking, enabling species-specific δ15N analyses that mitigate complications arising from shifts in species composition. Fourth, each FB-δ15N measurement integrates 500-1,000 individuals, providing a statistically robust average δ15N value over hundreds of years. Collectively, these characteristics make FB-δ15N an ideal proxy for systematically reconstructing historical changes in the marine nitrogen cycle.
One notable application of the FB-δ15N proxy is in reconstructing ocean deoxygenation in the eastern tropical Pacific, which hosts the world’s largest oxygen-deficient zones (ODZs; typically defined as < 5 µmol/kg O2). In this region, upwelling brings nutrient-rich waters to the surface and boosts productivity (Chavez and Barber, 1987; Fiedler et al., 1991), while sluggish thermocline circulation leads to poor ventilation and limited oxygen replenishment (Luyten et al., 1983). This combination leads to the development of the largest ODZs in the ocean (Fiedler and Talley, 2006; Paulmier and Ruiz-Pino, 2009). These ODZs affect human societies by reducing marine biodiversity, disrupting food webs, and adversely affecting fish stocks (Breitburg et al., 2018). Moreover, the low oxygen environment promotes water column denitrification, thereby increasing the losses of fixed nitrogen from the ocean (Gruber, 2008; DeVries et al., 2012). During denitrification, the lighter isotope 14N is preferentially removed, leading to higher δ15N in the residual nitrate in the thermocline water (Cline and Kaplan, 1975; Liu and Kaplan, 1989). This high-δ15N thermocline nitrate is subsequently transported to the euphotic zone above or adjacent to the ODZs, thereby elevating the δ15N in both the upper ocean ecosystem and in FB-δ15N. Consequently, an increase in FB-δ15N in regions influenced by ODZs is interpreted as indicative of ODZ expansion or intensification.
To predict how ODZs might respond to anthropogenic climate change, studies have used FB-δ15N to reconstruct past variations in the extent and intensity of ODZs, spanning timescales from the early Cenozoic to the Holocene (Kast et al., 2019; Studer et al., 2021; Auderset et al., 2022; Wang et al., 2022; Hess et al., 2023; Moretti et al., 2024; Yao et al., 2024). For example, lower δ15N values observed during the warm mid-Miocene were used to suggest that the eastern Pacific ODZs were smaller than they are today, contrary to some climate model predictions (Auderset et al., 2022; Hess et al., 2023). Despite these valuable applications, important questions remain regarding the calibration of FB-δ15N proxy in modern eastern tropical Pacific ODZs. Although it is generally assumed that FB-δ15N records from regions influenced by ODZs reflect the intensity and extent of ODZs, the depth of the δ15N maxima at the core of ODZs, which reflects relative denitrification intensity at a given station, is often deeper than the depth of subsurface nitrate δ15N recorded by planktonic foraminifera. Thus, the upward transfer of the ODZ δ15N signal to the subsurface may be further complicated by factors such as the depth of ODZs.
In this study, we aim to further validate FB-δ15N as an ocean deoxygenation proxy in the eastern tropical Pacific. We report new sediment core-top FB-δ15N measurements from three to five foraminifera species with corresponding water-column nitrate δ15N from samples collected at three stations during the R/V Sally Ride cruise SR2113 in November to December 2021 in the Eastern Tropical North Pacific (ETNP) region (4.8°N-6.0°N, 86.6°W-88.0°W). Combining these data with published δ15N data from the eastern tropical Pacific ODZs, we examine the relationship among subsurface nitrate δ15N (thus FB-δ15N), ODZ δ15N maxima, and the depth of the ODZ upper boundary. In addition, we investigate differences in δ15N between symbiont-bearing, surface-dwelling species and symbiont-barren, deep-dwelling species, and examine how hypoxic conditions above ODZs influence foraminiferal assemblages and abundance, as well as inter-species δ15N differences.
2 Materials and methods
2.1 Compilation and analysis of published nitrate δ15N from eastern tropical Pacific ODZs
We have compiled and analyzed published nitrate δ15N and concentration data from the eastern tropical Pacific ODZs (Figures 1c, d; 2, Supplementary Figures S1, S2; Supplementary Data) (Brandes et al., 1998; Voss et al., 2001; Sigman et al., 2005; Rafter et al., 2012; Casciotti et al., 2013; Rafter and Sigman, 2016; Peters et al., 2018a, 2018b; Fripiat et al., 2021; Lee et al., 2025). Detailed information on station locations, water depths, nitrate δ15N values, and nitrate concentrations is provided in the Supplementary Data. Oxygen concentration values (Supplementary Figure S1) were directly obtained from the respective studies. Specifically; all oxygen concentration data for the Eastern Tropical South Pacific (ETSP) are available in these original sources, whereas only 18 out of 26 stations in the ETNP include oxygen concentration data (Voss et al., 2001; Sigman et al., 2005; Lee et al., 2025).
Figure 1

Compilation of new and published nitrate δ15N data from the eastern tropical Pacific ODZs. Maps on the left display the upper boundary of the ODZs is as (a) depth (dbar) and (b) potential density (kg m-3) (Data obtained from (Kwiecinski and Babbin, 2021)). Circles indicate nitrate δ15N sampling locations in the Eastern Tropical North Pacific (ETNP, red circle, n=26) and the Eastern Tropical South Pacific (ETSP, blue circle, n=18). Empty circles represent stations from previous studies, while solid circles indicate the stations from this study. Nitrate δ15N depth profiles are shown for each station in (c) the ETNP (including data from this study) and (d) the ETSP. Red circles outlined in black in (c) correspond to stations [maps (a, b)] from this study. Thick red and dark blue lines in (c) and (d) represent averaged δ15N profiles for the ETNP and ETSP, respectively, calculated from both previous and current study stations. Maps were generated using Ocean Data View.
Figure 2
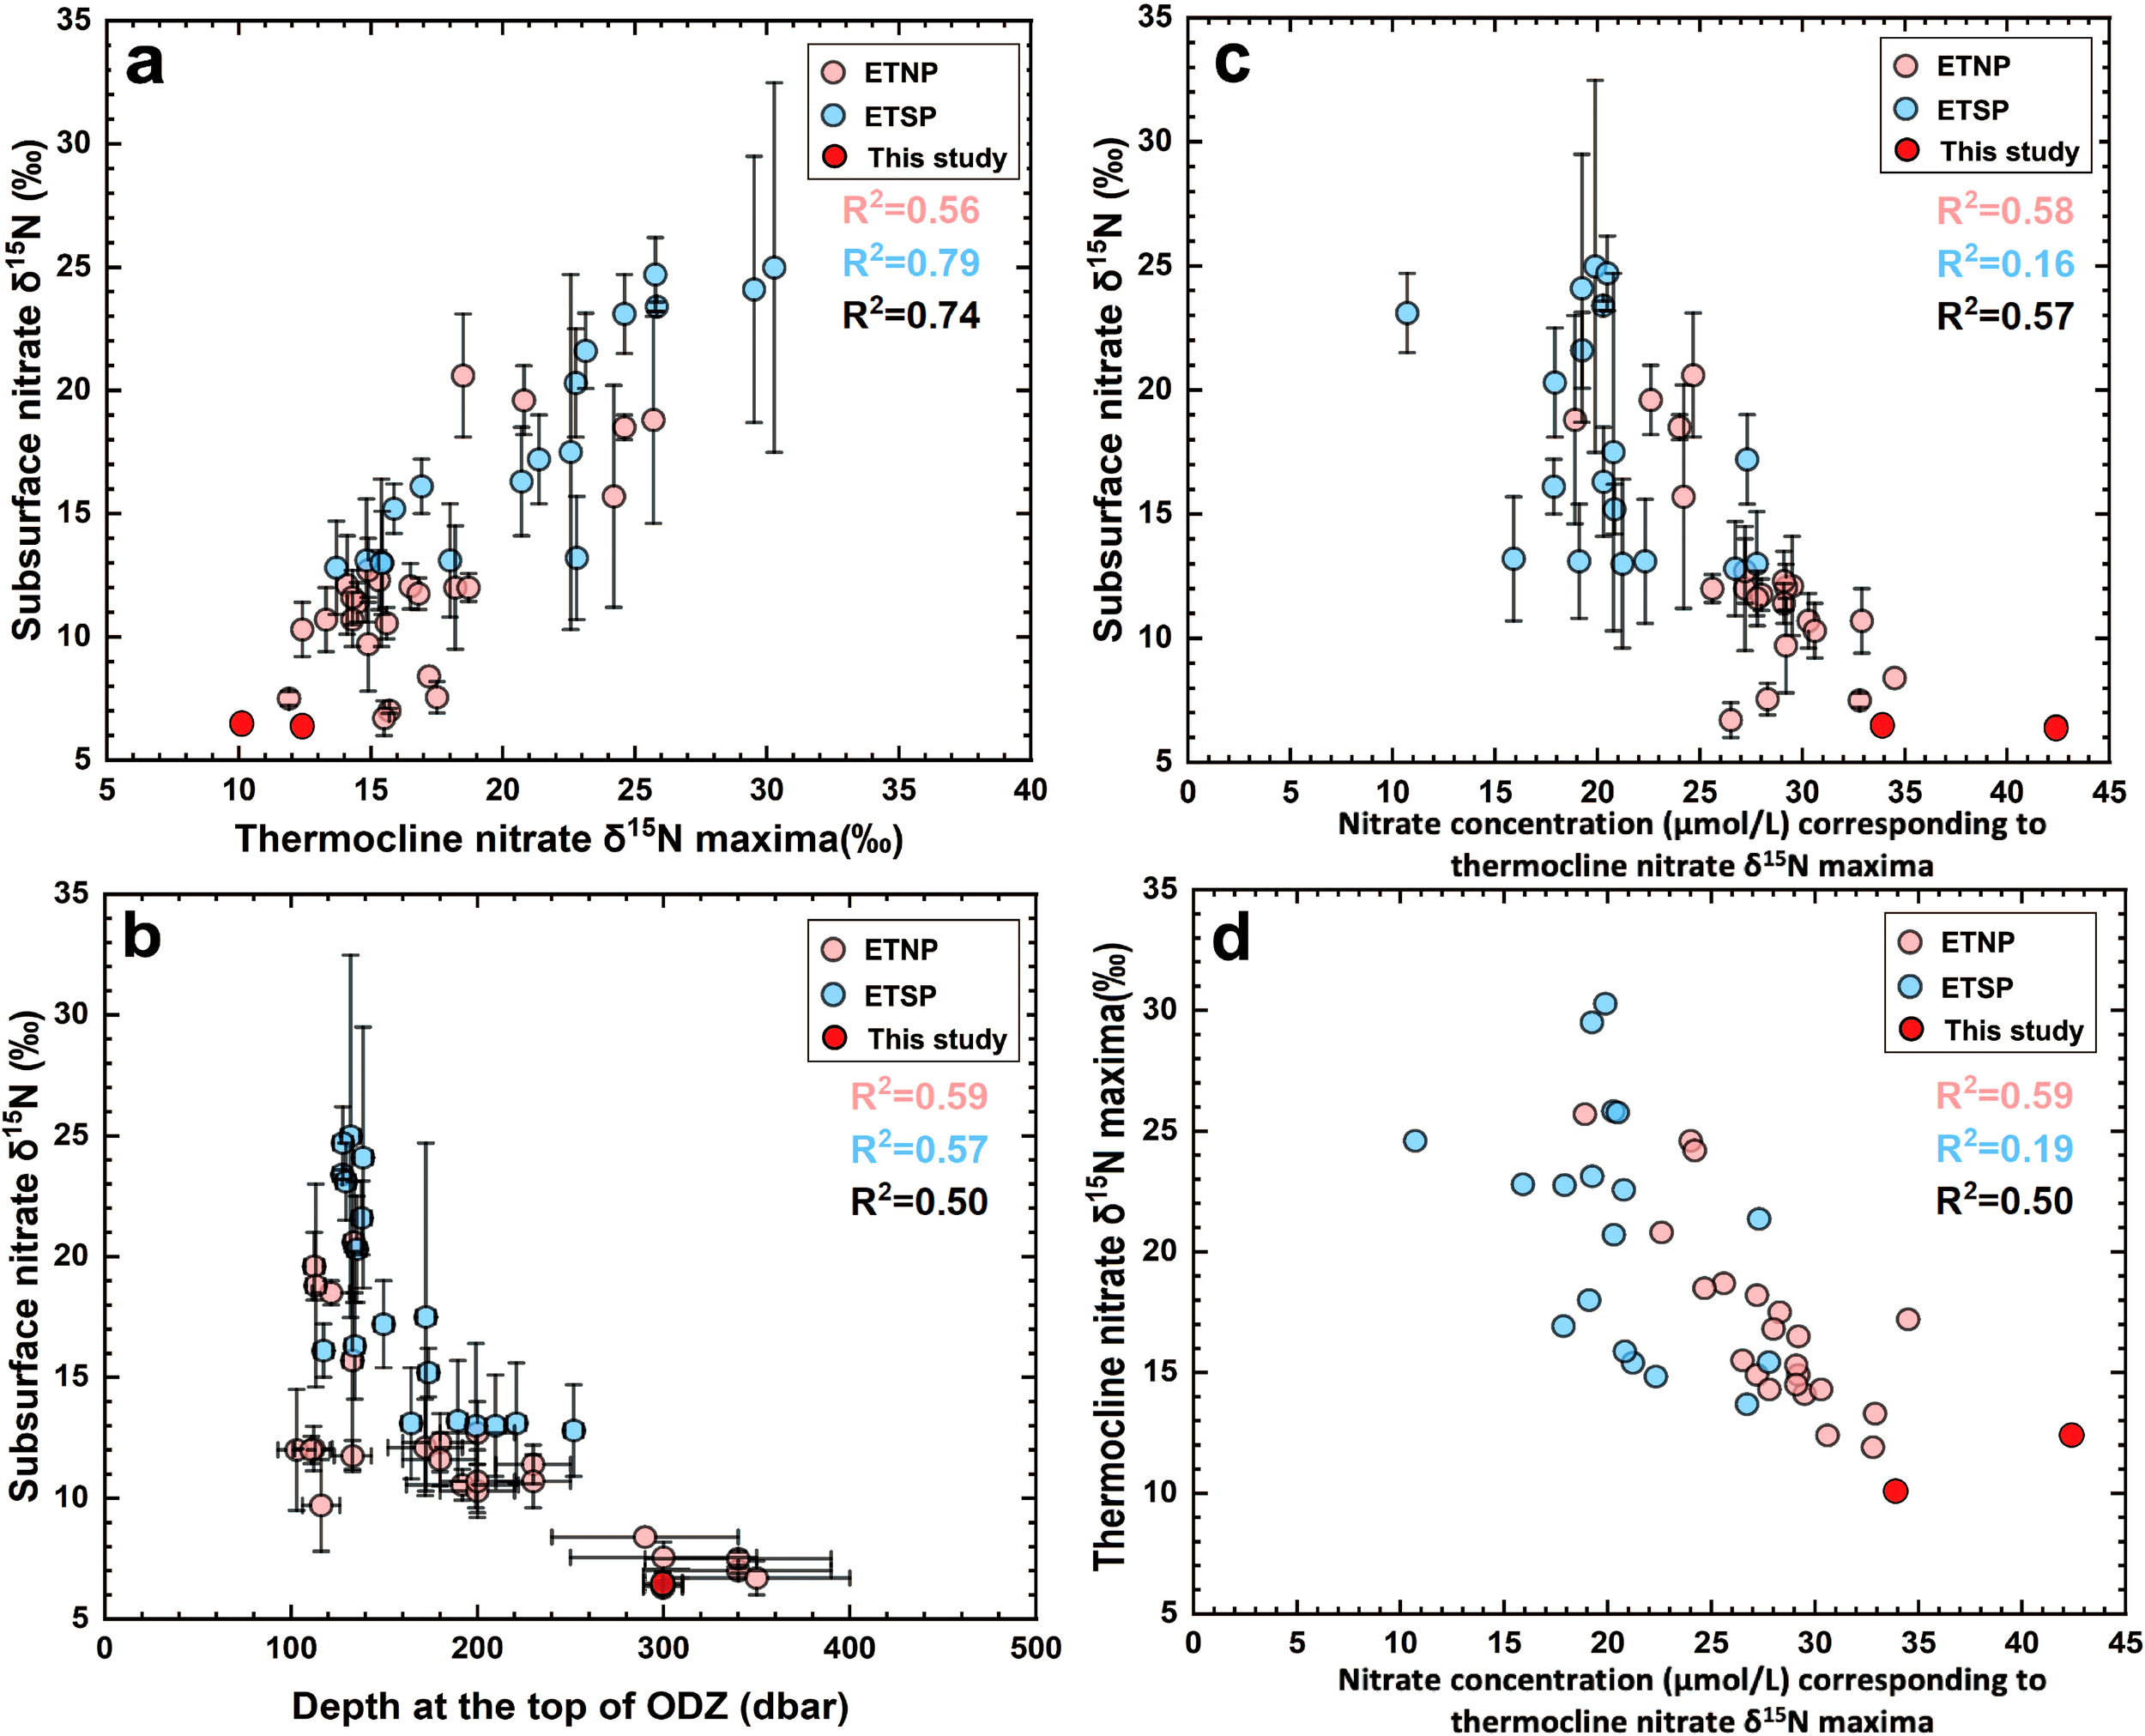
Relationship among subsurface δ15N, thermocline δ15N maxima, and ODZ depths in the eastern tropical Pacific ODZs. (a) Comparison of subsurface δ15N with thermocline δ15N maxima at the same stations. (b) Comparison of subsurface δ15N with depth at the ODZ upper boundary. (c) Comparison of subsurface δ15N with thermocline nitrate concentration at the depth of ODZ δ15N maxima. (d) Comparison of thermocline δ15N maxima with thermocline nitrate concentration at corresponding depths. Dark red dots represent data from this study; light red dots represent data from previous ETNP studies; and blue dots indicate previous ETSP studies. R2 values are annotated in each plot: red corresponds to ETNP (previous and current data), blue to ETSP, and black to the combined dataset of both ETNP and ETSP. Most p-values across our regression analyses are statistically significant (p < 0.05), except for the ETSP cases in (c) (p = 0.1) and (d) (p = 0.07).
In our analysis, subsurface nitrate δ15N is defined as the average δ15N between 150 m and 200 m at each station. If a station lacks data within this depth range, we linearly interpolate the nitrate δ15N values at 150 m and 200 m based on the nearest available depth measurements and compute their average. The ODZ nitrate δ15N maxima is defined as the highest nitrate δ15N observed within the ODZs (O2 < 5 μmol/kg). To determine the ODZ upper-boundary depth, we applied linear interpolation to detailed oxygen concentration profiles (Supplementary Data) and calculate the depth where the oxygen concentration falls below 5 µmol/kg. When these profiles were unavailable, we estimated the ODZ upper-boundary depth using data from the Kwiecinski and Babbin (Figure 1a; Kwiecinski and Babbin, 2021) in combination with the nitrate δ15N depth profiles (Figures 1c, d; Supplementary Data). Error bars (1sd) were calculated based on the standard deviation of the two datasets. We excluded stations in which the ODZ upper-boundary depth is shallower than 100 m, because in such cases the contributions of denitrification and nitrate assimilation to subsurface nitrate δ15N cannot be reliably separated.
To illustrate the differences between the ETNP and ETSP, averaged depth profile of nitrate δ15N in both ODZ regions, were generated using Python by sampling y-values at 100 evenly spaced points along the full x-range, stacking the values into arrays, and computing the mean at each position.
2.2 Statistical methods for assessing controls on subsurface nitrate δ15N
To evaluate the independent and combined influences of thermocline nitrate δ15N maxima and the ODZ upper-boundary depth on subsurface nitrate δ15N, we employed multiple statistical approaches, including multiple linear regression, Pearson correlation analysis, and multicollinearity diagnostics using Variance Inflation Factors (VIFs).
We developed multiple linear regression models separately for the ETNP, ETSP, and the combined dataset. These models allowed us to quantify the individual and joint contributions of thermocline δ¹5N maxima and ODZ upper-boundary to variations in subsurface nitrate δ¹5N. The general form of the regression model is (Jobson, 1991):
Pearson correlation coefficients (r) were calculated to quantify linear relationships among the variables: subsurface nitrate δ15N, thermocline nitrate δ15N maxima, and ODZ upper-boundary depth. The Pearson correlation coefficient is defined as follows (Kutner, 2005):
where xi and yi represent paired observations, and denote their respective means.
To assess multicollinearity between predictor variables, we computed the Variance Inflation Factor (VIF). The VIF quantifies the extent to which collinearity among predictors inflates the variance of estimated regression coefficient and is calculated as follows (Kutner, 2005),
where r is the Pearson correlation between the predictor variables. A high VIF value indicates significant multicollinearity, suggesting caution when interpreting regression results.
2.3 Sample collection
Sediment core-top and water column samples were collected from three stations (Figures 1a, b) during the R/V Sally Ride SR2113 expedition spanning in November-December 2021 in the ETNP. These stations included CR02 (longitude: 88.0° W, latitude: 6.0° N, depth:2640.0m), CR03 (longitude: 86.6° W, latitude: 5.4° N, depth:1774.4m), and CR02-6 (longitude: 86.6° W, latitude: 4.8° N, depth: 1268.1m).
Sediment samples were collected via Multi Cores at the stations, using an Ocean Instruments MC-800 multi-corer with polycarbonate liners (i.d. = 9.6 cm). Cores were immediately extruded and sectioned upon recovery, and discrete sediment samples were stored in a 0°C walk-in freezer on board the ship before transport back to shore. Once in the lab, bulk sediment samples were dried in an oven at 50°C for 72 hours. The core lengths for CR02, CR03, and CR02–6 were 36 cm, 22 cm, and 28 cm, respectively. The sediment core-tops (0–10 cm) were sectioned into 1 cm intervals. After drying, portions of the sediment were left unground for various analyses, while the remainder was preserved for further lab analyses.
For foraminifera separation, the core-top sediment samples were transferred into 500 ml conical flasks, soaked in Milli-Q water, and then placed on an orbital shaker overnight. Following this step, the mixture was wet sieved through a 250 µm mesh. Gentle manual agitation was used to remove adherent sediment from the foraminifera. The separated foraminifera samples were collected from the sieve, transferred into 15 ml polypropylene centrifuge tubes (BD Falcon), and dried at 55°C for 7 days.
2.4 Foraminifera identification, counts, and picking
Five species of planktonic foraminifera (section 3.2) were identified in sufficient quantities, allowing for the collection of at least 3 mg per species. The morphology of these species was determined following the classifications of d’Orbigny (1839) and Brady (1877). The equation for determining relative abundance of each species is from Achacoso et al. (2016):
The sorted foraminifera were carefully transferred from the centrifuge tubes to a sectioned tray for examination under a VWR laboratory led zoom stereo binocular microscope. Using brushes of varying sizes, individual foraminifera specimens were picked and placed onto 4-hole hard paper slides. A cover glass slide and a removable metal brace were then applied to securely protect each slide. To ensure an exhaustive collection, each sample was reviewed multiple times, guaranteeing the selection of at least 3 mg of the specified foraminifera species and thorough examination of the entire sample before proceeding to the next set.
2.5 FB-δ15N analyses
The picked foraminifera samples were gently crushed to open their chambers using a glass rod and transferred to 15ml centrifuge tubes. Impurities were removed by treating each sample with 10 ml of 2% sodium polyphosphate and sonicating for 2–5 minutes. The solution was then decanted, and the foraminifera were rinsed three times with Milli-Q water. Next, 10 ml of the dithionite-citric acid mixture (pH ~8) was added to each vial (Mehra and Jackson, 1958). The vials were placed in an 80°C water bath for an hour and were shaken once during the period. After that, the dithionite-citric acid solution was decanted and the foraminifera were rinsed three times with Milli-Q water again.
After the reductive cleaning step, ~10 ml of sodium hypochlorite (10-15% available chlorine) was added to each sample, which is then placed on an orbital-shaker overnight (>12 hours). After that, the sodium hypochlorite solution was decanted and rinsed three times with Milli-Q water. The samples were then carefully transferred into 4 ml pre-combusted glass vials, and all remaining Milli-Q water was removed with a vacuum pump. The samples were then dried in an oven at 55°C overnight. In each batch of analyses, three replicates of a coral standard (CBS-II) were included following the same cleaning procedures, serving as quality control of the cleaning protocol.
After drying, the cleaned foraminifera samples were weighed and transferred into another 4 ml pre-combusted glass vial. Then, 3–7 mg of foraminifera were dissolved in 50 μl 4 N HCl to release the shell-bound organic N into solution. The released organic nitrogen was then oxidized into nitrate by adding 1 ml of the persulfate oxidizing reagent (POR), prepared by dissolving 1g of low-N recrystallized persulfate and 2 g NaOH in 100 ml of distilled, low-N Milli-Q water. In this step, amino acid standards (USGS 64 and 4 USGS 65) and POR blanks were included to account for the contribution of blanks during the oxidation processes. The samples were autoclaved for 1 hour to ensure complete oxidation, then centrifuged at 4000 rpm for 10 minutes. After transferring the supernatant to a new vial, the pH of each sample was adjusted to neutral with 4 N HCl and 2 N NaOH.
After the oxidation step, the resulting nitrate was converted to nitrous oxide using the ‘denitrifier method’ using Pseudomonas chlororaphis that lacks nitrous oxide reductase (Sigman et al., 2001; Weigand et al., 2016). The δ15N of the resulting N2O in the headspace of the vials was then measured on a customized Gas Bench coupled to a Thermo-Fischer Scientific Delta V isotope ratio mass spectrometer. Nitrate isotope standards IAEA-N3 and USGS-34 were analyzed along with the samples, which are used for calibrating the reported δ15N values (‰ vs. air). The final FB-δ15N precision, based on replicate analyses, is 0.2‰.
2.6 Water column nitrate δ15N
Water nitrate δ15N samples were collected through Conductivity, Temperature, Depth (CTD) casts using the 10-L Niskin Rosette at 4 stations. Samples were collected from approximately 24 depths ranging from 7–2900 m. The shallowest samples were collected first to avoid nitrate contamination from higher nitrate waters deeper in the water column. Samples were filtered through a 0.2 μm PVDF luerlock filter attached to a syringe. Once filtered, samples were stores in 30 ml pre-acid-washed HDPE bottles and immediately frozen until analysis. Nitrate δ15N (Landry and Wang, 2024) in these samples were then measured using the “denitrifier method” described in section 2.3 with Pseudomonas aureofaciens (Weigand et al., 2016).
3 Results
3.1 Relationship among subsurface nitrate δ15N, ODZ nitrate δ15N maxima, and ODZ depths in the eastern tropical Pacific ODZs
The ETNP and ETSP host two of the largest ODZs in the global ocean. The ETNP ODZ is deeper and more expansive, with the average ODZ upper-boundary depth around 279 dbar (or meters), extending beyond 800 dbar in core regions (Kwiecinski and Babbin, 2021). In comparison, the ETSP ODZ starts at a shallower average depth of approximately 246 dbar and has an average thickness of 108 dbar (Kwiecinski and Babbin, 2021). In terms of scale, the ETNP ODZ ([O2] < 5 μmol/kg) encompasses a significantly larger volume, estimated at 0.6-2.4 × 10⁶ km3 (Bianchi et al., 2012) and covers a horizontal area of up to 4.27 × 10⁶ km2 (Kwiecinski and Babbin, 2021). The ETSP ODZ is smaller, with a volume of about 0.4-6.1 × 10⁵ km3 (Bianchi et al., 2012) and a surface extent of 2.3 × 10⁶ km2 (Kwiecinski and Babbin, 2021). Both the ETNP and ETSP ODZs are associated with similar potential densities, averaging approximately 26.5 kg/m3 (Kwiecinski and Babbin, 2021). The larger size and stability of the ETNP ODZ results from weaker ventilation, which leads to persistently low oxygen concentrations (Supplementary Figure S1) with less variability throughout the upper 1000 m of the water column (Supplementary Figure S2). In contrast, the ETSP ODZ is influenced by the Peru–Chile Undercurrent (PCUC) and stronger eddy-driven mixing, which periodically introduce oxygenated water, making it thinner and less stable than the ETNP ODZ (Czeschel et al., 2015; Margolskee et al., 2019).
Mean subsurface nitrate δ15N values in the compiled dataset are higher in the ETSP (mean = 17.9‰) than in the ETNP (mean = 11.7‰). Similarly, thermocline nitrate δ15N maxima are higher in the ETSP (mean = 21.1‰) than in the ETNP (mean = 16.5‰). A significant positive correlation between subsurface nitrate δ15N and thermocline nitrate δ15N maxima is observed (Figure 2a, ETNP: R2 = 0.56, p < 0.05; ETSP: R2 = 0.79, p < 0.05). In addition, a significant relationship between subsurface nitrate δ15N and ODZ upper-boundary depth is observed (Figure 2b; ETNP: R2 = 0.59, p < 0.05; ETSP: R2 = 0.57, p < 0.05). Furthermore, the ETNP exhibits robust inverse correlation between subsurface nitrate δ15N and thermocline nitrate concentrations at the depth of thermocline nitrate δ15N maxima (Figure 2c, R2 = 0.58, p < 0.05), as well as between thermocline nitrate δ15N maxima and corresponding nitrate concentrations (Figure 2d, R2 = 0.59, p < 0.05). In contrast, the ETSP shows weaker inverse relationships (Figure 2c, R2 = 0.16, p = 0.1; and Figure 2d, R2 = 0.19, p = 0.07). However, combining data from both regions yields consistently strong correlations.
Our statistical analyses indicate that both thermocline nitrate δ15N maxima and ODZ upper-boundary depth independently and significantly influence subsurface nitrate δ15N across the ETNP, ETSP, and combined datasets. In the ETNP, the best-fit linear model explains 73% of the variance in subsurface δ15N (Table 1, R2 = 0.73, p < 0.001). In the ETSP, the best-fit linear model explains 83% of the variance (Table 1, R2 = 0.83, p < 0.001). Combining ETNP and ETSP data, the best-fit linear model explains 80% of the variance (Table 1, R2 = 0.80, p < 0.001).
Table 1
| ETNP | ETSP | Combined | |
|---|---|---|---|
| β0 (Intercept) | 8.75 | 9.27 | 5.28 |
| β1 (Thermocline nitrate δ15N maxima) | 0.48*** | 0.65*** | 0.72*** |
| β2 (ODZ depth) | -0.025*** | -0.031*** | -0.024*** |
| R2 | 0.73 | 0.83 | 0.80 |
| F-statistic | 31.54 | 35.62 | 82.57 |
| Sample size | 26 | 18 | 44 |
Multiple linear regression coefficients (β0, β1, and β2) and model performance (R2 and F-statistic) are compared across the ETNP, ETSP, and the combined dataset.
All coefficients showed statistically significant correlations (p < 0.001***) in both ETNP and ETSP regions. The regression model is: Subsurface nitrate δ15N = β0 + β1(thermocline nitrate δ15N maxima) + β2(ODZ upper-boundary depth)
Pearson correlations confirm strong positive relationships between subsurface nitrate δ15N and thermocline nitrate δ15N maxima (r = 0.74 to 0.89), and strongly negative correlations with ODZ depth (r = –0.71 to –0.77) (Table 2). The negative correlation between thermocline nitrate δ15N maxima and ODZ depth is moderate (r = –0.56 to –0.70) (Table 2) suggesting that these two predictors are related but not strongly coupled. Consistent with these findings, all VIF values remained low (range: 1.46-1.97; Table 3), confirming minimal multicollinearity.
Table 2
| Relationship | ETNP | ETSP | Combined |
|---|---|---|---|
| Subsurface δ15N and Thermocline nitrate δ15N maxima | 0.74 | 0.89 | 0.86 |
| Subsurface δ15N and ODZ depth | -0.77 | -0.76 | -0.71 |
| Thermocline nitrate δ15N maxima and ODZ depth | -0.56 | -0.70 | -0.59 |
Pairwise pearson correlation coefficients (r) among subsurface δ15N, thermocline δ15N maxima, and ODZ depth across the ETNP, ETSP, and combined dataset.
Pearson correlation coefficients are interpreted as strong when |r| ≥ 0.7, moderate when |r| is between 0.4 and 0.7, and weak when |r| < 0.4 (Hinkle et al., 2003). All variable pairs show statistically significant correlations (p < 0.001) in both ETNP and ETSP regions.
Table 3
| Dataset | Pearson correlation (r) | r2 | VIF |
|---|---|---|---|
| ETNP | -0.56 | 0.31 | 1.46 |
| ETSP | -0.70 | 0.49 | 1.97 |
| Combined | -0.59 | 0.34 | 1.52 |
Variance Inflation Factors (VIFs) assessing multicollinearity between two predictors, thermocline δ15N maxima and ODZ depth, across the ETNP, ETSP, and combined dataset.
VIF values below 5 indicate low multicollinearity and suggest no concerns regarding multicollinearity (O’brien, 2007).
3.2 Foraminifera abundance
Three different foraminiferal groups were analyzed in this study: deeper-dwelling, non-symbiont bearing, non-spinose species (G. tumida); deeper-dwelling, symbiont bearing, non-spinose species (N. dutertrei and G. menardii); and surface dwelling, symbiont-bearing, spinose species (G. sacculifer, and O. universa). Their relative abundance varied across the stations (Supplementary Figure S3, Table 4). At stations CR02 and CR03, N. dutertrei and G. menardii dominated, each constituting approximately 45% of the total foraminiferal assemblage. G. tumida is the third most abundant species, accounting for 5-8%, with all other species collected accounted for less than 5%. At station CR02-6, N. dutertrei and G. menardii remained the most abundant (each ~30%). Of the other species present, G. tumida and G. sacculifer each contributed about 15-18%, while O. universa comprised roughly 5-8%.
Table 4
| Station ID | Planktonic Foraminifera Species | FB-δ15N (‰ vs. Air) | 1SD based on sample replicates (‰ vs. Air) | Relative abundance (%) |
|---|---|---|---|---|
| CR02-6 | Globigerinoides sacculifer | 5.2 | 0.3 | ~15-18 |
| Orbulina universa | 6.4 | 0.2 | ~5-8 | |
| Globorotalia menardii | 8.9 | 0.3 | ~30 | |
| Neogloboquadrina dutertrei | 8.8 | 0.03 | ~30 | |
| Globorotalia tumida | 9.2 | 0.2 | ~15-18 | |
| CR02 | Globorotalia menardii | 8.6 | 0.1 | ~45 |
| Neogloboquadrina dutertrei | 8.6 | 0.2 | ~45 | |
| Globorotalia tumida | 8.7 | 0.2 | ~5-8 | |
| CR03 | Globorotalia menardii | 9.2 | 0.1 | ~45 |
| Neogloboquadrina dutertrei | 9.2 | 0.1 | ~45 | |
| Globorotalia tumida | 9.2 | 0.2 | ~5-8 |
Planktonic foraminifera species, FB-δ15N values, FB-δ15N standard deviation, and relative foraminifera abundance in this study.
3.3 Foraminifera-bound N isotopes
FB-δ15N of individual species ranges from 5.2‰ to 9.2‰ (Figure 3b; Table 4). At station CR02, the FB-δ15N values for three deep-dwelling species, N. dutertrei, G. menardii, and G. tumida, are 8.6‰, 8.6‰, and 8.7‰, respectively. At station CR03, these three species show an increase of approximately 0.5‰ compared to their counterparts at CR02, with values of 9.2‰, 9.2‰, and 9.2‰ respectively. At station CR02-6, these three deep-dwelling species exhibit values that are about 0.3‰ lower than those at CR03, recorded at 8.8‰, 8.9‰, and 9.0‰. Furthermore, the other two surface-dwelling species, G. sacculifer and O. universa, present values significantly lower than those of the deep-dwelling species, specifically, their values are 5.2‰ and 6.4‰.
Figure 3

(a) Map of the eastern tropical Pacific oxygen deficient zone (ODZ, purple shading), showing locations of stations in this study (pink circles outlined in black, labeled b) and three nitrate δ15N transects (white circles outlined in black, labeled c, d, and e). (b) Depth profile from the surface to 1000 m, displaying subsurface nitrate δ15N (circles: green for station CR02, yellow for CR03) and dissolved oxygen concentration (shaded boxes: lighter grey indicating the hypoxic zone with [O2] < 63 μmol/kg, dark grey indicating the ODZ with [O2] < 5 μmol/kg). The potential density is shown on the right axis. Plotted alongside are FB-δ15N from individual species at three stations (symbols). Global averaged habitat depth for each species, adapted from previous studies (Ravelo and Fairbanks, 1992; Farmer et al., 2007; Ren et al., 2009; Rebotim et al., 2017), are also shown: estimated habitat depths are Globigerinoides sacculifer (35 ± 30 m), Orbulina universa (75 ± 30 m), for Globorotalia menardii (110 ± 40 m), for Neogloboquadrina dutertrei(130 ± 40 m), and Globorotalia tumida (200 ± 50 m). (c–e) Published transects of nitrate δ15N (depth:100m -1000m) in the eastern tropical Pacific to data from Rafter and Sigman (2016) and Peters (2018a). Maps (panels a, c-e) were generated using Ocean Data View.
3.4 Water column profiles of nitrate δ15N and dissolved oxygen concentration
In Figure 3b, the profiles for stations CR02 (green circles) and CR03 (yellow circles) exhibit similar trends, with nitrate δ15N peaking at 12.4‰ and 10.1‰, respectively, around a depth of 400 m. Nitrate δ15N values are 2–3‰ lower than the FB-δ15N values of deep-dwelling species at corresponding depths (120–250 m, Farmer et al., 2007), which range from 6.2‰ to 6.8‰. The oxygen-deficient zone (dark grey box, with concentrations remaining below 5 µmol/kg) spans depths from 300 to 600 m. Additionally, oxygen concentrations drop below 63 µmol/kg between 70 and 1000 m, indicating the presence of a hypoxic zone (grey box).
4 Discussion
4.1 Influence of water-column denitrification and ODZ depths on FB-δ15N as an ocean deoxygenation proxy
FB-δ15N records are widely used to reconstruct past ocean deoxygenation (Kast et al., 2019; Auderset et al., 2022; Wang et al., 2022; Hess et al., 2023; Moretti et al., 2024) because of their sensitivity to water-column denitrification in ODZs. Typically, higher FB-δ15N values are interpreted as reflecting an expansion of ODZs or intensification of denitrification. However, FB-δ15N directly reflects the nitrate δ15N in the subsurface, which is typically shallower than the core depths of the ODZs. The δ15N maxima at the ODZ cores record the degree of water-column denitrification following Rayleigh fractionation (Sigman et al., 2005; Casciotti, 2016). Nitrate δ15N decreases upward from the ODZ core to the subsurface due to mixing and other processes. It is unclear whether FB-δ15N faithfully record the water-column denitrification occurring below. In our analysis of new and published nitrate δ15N data from the eastern tropical Pacific ODZs, we demonstrate that subsurface nitrate δ15N is well correlated with the ODZ δ15N maxima (with an R2 value of 0.56 to 0.79, p < 0.05). This high degree of correlation indicates that the water-column denitrification signal is effectively propagated to the subsurface nitrate δ15N (thus FB-δ15N) above the ODZs, supporting the use of FB-δ15N as a proxy for local water-column denitrification and ODZ intensity.
However, our analysis also reveals a complication of the FB-δ15N deoxygenation proxy related to variations in ODZ depth. We find that subsurface nitrate δ15N is correlated with the depth of the upper boundary of ODZs (with an R2 value of 0.57 to 0.59, p < 0.05), with lower δ15N values observed above deeper ODZs. In contrast, the Pearson Correlation Coefficients between thermocline δ15N maxima and ODZ depth was moderate (r = –0.56 to –0.70; p < 0.001), and the VIF values for these two predictors remained low (1.46–1.97), indicating minimal multicollinearity. At our study stations (Figure 3a), where the ODZ upper boundary lies below ~300 m, the δ15N maxima at the core of the ODZs is higher than 10‰, while the subsurface nitrate δ15N is only 6.3‰ (Figure 3b), which is only slightly higher than the mean global average pycnocline nitrate δ15N (Fripiat et al., 2021) and comparable to thermocline nitrate δ15N outside modern ODZs in the eastern Pacific (Figures 3c–e). At these stations, based on FB-δ15N values alone, one might not have inferred the presence of the underlying ODZs, suggesting that FB-δ15N might be decoupled from the local, in situ water-column denitrification rates occurring immediately below. This decoupling between the thermocline ODZ δ15N maxima and the subsurface δ15N may be explained by the greater depth of ODZs, which impedes the diffusion of the high δ15N signal from the thermocline into the subsurface, thereby reducing its influence on FB-δ15N value. In addition, N2 fixation in the surface waters, followed by subsequent remineralization in the subsurface, may further lower subsurface nitrate δ15N (Wang et al., 2018). However, N2 fixation rates appear to be limited in the eastern tropical Pacific (Knapp et al., 2016; Shao et al., 2023). Even if N2 fixation were significant, its impact would be insufficient to override the elevated nitrate δ15N produced by water-column denitrification, given the large isotope effect of water-column denitrification. Regardless of the mechanism, our compilation indicates that FB-δ15N is less sensitive to local, in situ water column denitrification when the upper boundary of the ODZs is deeper than ~250 m, as observed at our new sites. Instead, FB-δ15N at these stations appears to reflect broader regional denitrification. These findings suggest that variations in ODZ depths must be considered when interpreting FB-δ15N records, as discussed below in Section 4.4.
4.2 Influence of ODZs on planktonic foraminifera habitat depths
Another impact of ODZs on FB-δ15N arise from shifts in the habitat depths and species composition of foraminifera under low-oxygen conditions. While global variability in foraminifera habitat depths has been well-documented (e.g., Ravelo and Fairbanks, 1992; Rebotim et al., 2017), few studies have specifically examined habitats under hypoxic (i.e., < 63 μmol/kg O2) to suboxic conditions. The species analyzed in this study have been shown or hypothesized to tolerate hypoxic conditions (Kuroyanagi et al., 2013, 2019; Rippert et al., 2016). Davis et al. (2021) reported that suboxic-hypoxic conditions in an ETNP ODZ significantly affect the distribution and abundance of foraminifera. While some smaller specific species (size < 250 µm) exhibit adaptations that allow them to tolerate hypoxic conditions, the overall density and diversity of foraminifera decrease in the ODZs (Davis et al., 2021).
Globally, deep-dwelling species like N. dutertrei, G. menardii, and G. tumida typically inhabit depths below 100m (Ravelo and Fairbanks, 1992; Farmer et al., 2007). However, the eastern tropical Pacific ODZs exhibit hypoxic to suboxic conditions at such depths (Figure 3b). Notably, our data reveal that N. dutertrei and G. menardii are the most abundant species in these regions (Supplementary Figure S3). It is likely that these deep-dwelling species are forced to migrate upward, occupying shallower depths above the ODZs, where oxygen concentrations are more favorable for survival.
4.3 Inter-species variation in FB-δ15N in ODZ regions
FB-δ15N is also influenced by both the diet and symbiotic status of foraminifera (Bé and Hemleben, 1970; Anderson and Be, 1976; Bé et al., 1977; Caron and Bé, 1984; Spindler et al., 1984; Hemleben et al., 1989; Ren et al., 2012). The dietary habits of foraminifera vary among species and with depth in the water column. Surface-dwelling species prey on zooplankton and large phytoplankton using specialized spines for effective capture (Bé et al., 1977; Spindler et al., 1984) and are often symbiotic photosynthetic algae such as dinoflagellates. This symbiosis leads to lower δ15N values because the symbionts efficiently recycle ammonium produced by their host, typically resulting in FB-δ15N that are 0-1‰ lower than the subsurface nitrate δ15N (Uhle et al., 1997; Ren et al., 2012; Smart et al., 2018). In contrast, deep-dwelling, symbiont-barren species exhibit higher δ15N values (Ren et al., 2012; Smart et al., 2018), primarily due to the lack of symbiont-mediated nutrient recycling and the consumption of partially degraded organic matter with higher δ15N (Ren et al., 2012).
Groundtruthing studies (Ren et al., 2012; Smart et al., 2018; Auderset et al., 2024) have documented inter-species differences in FB-δ15N across the global ocean, driven by variations in diet and symbiotic associations as described in the previous paragraph. In oligotrophic waters with complete surface nitrate consumption, surface-dwelling, symbiont-bearing species show δ15N similar to subsurface nitrate δ15N, whereas deep-dwelling, symbiont-barren species exhibit values 3-4‰ higher. For example, species such as G. sacculifer and O. universa, which host symbiotic dinoflagellates (Bé et al., 1977; Schiebel and Hemleben, 2017), show δ15N values 0–1‰ lower than subsurface nitrate δ15N. Conversely, deep-dwelling, non-symbiotic species like G. tumida are 3-4‰ higher than subsurface nitrate δ15N. N. dutertrei and G. menardii, which host non-photosynthetic chrysophytes (Gastrich, 1987; Faber et al., 1988), show similar δ15N as G. tumida (Ren et al., 2012). Our new results from an ODZ region are consistent with previous findings (Figure 4), with G. tumida, N. dutertrei, and G. menardii exhibiting δ15N values that are 3-4‰ higher δ15N than those of G. sacculifer and O. universa, which are similar to subsurface nitrate δ15N. This suggests that the presence of hypoxic conditions do not alter the inter-species differences in FB-δ15N.
Figure 4
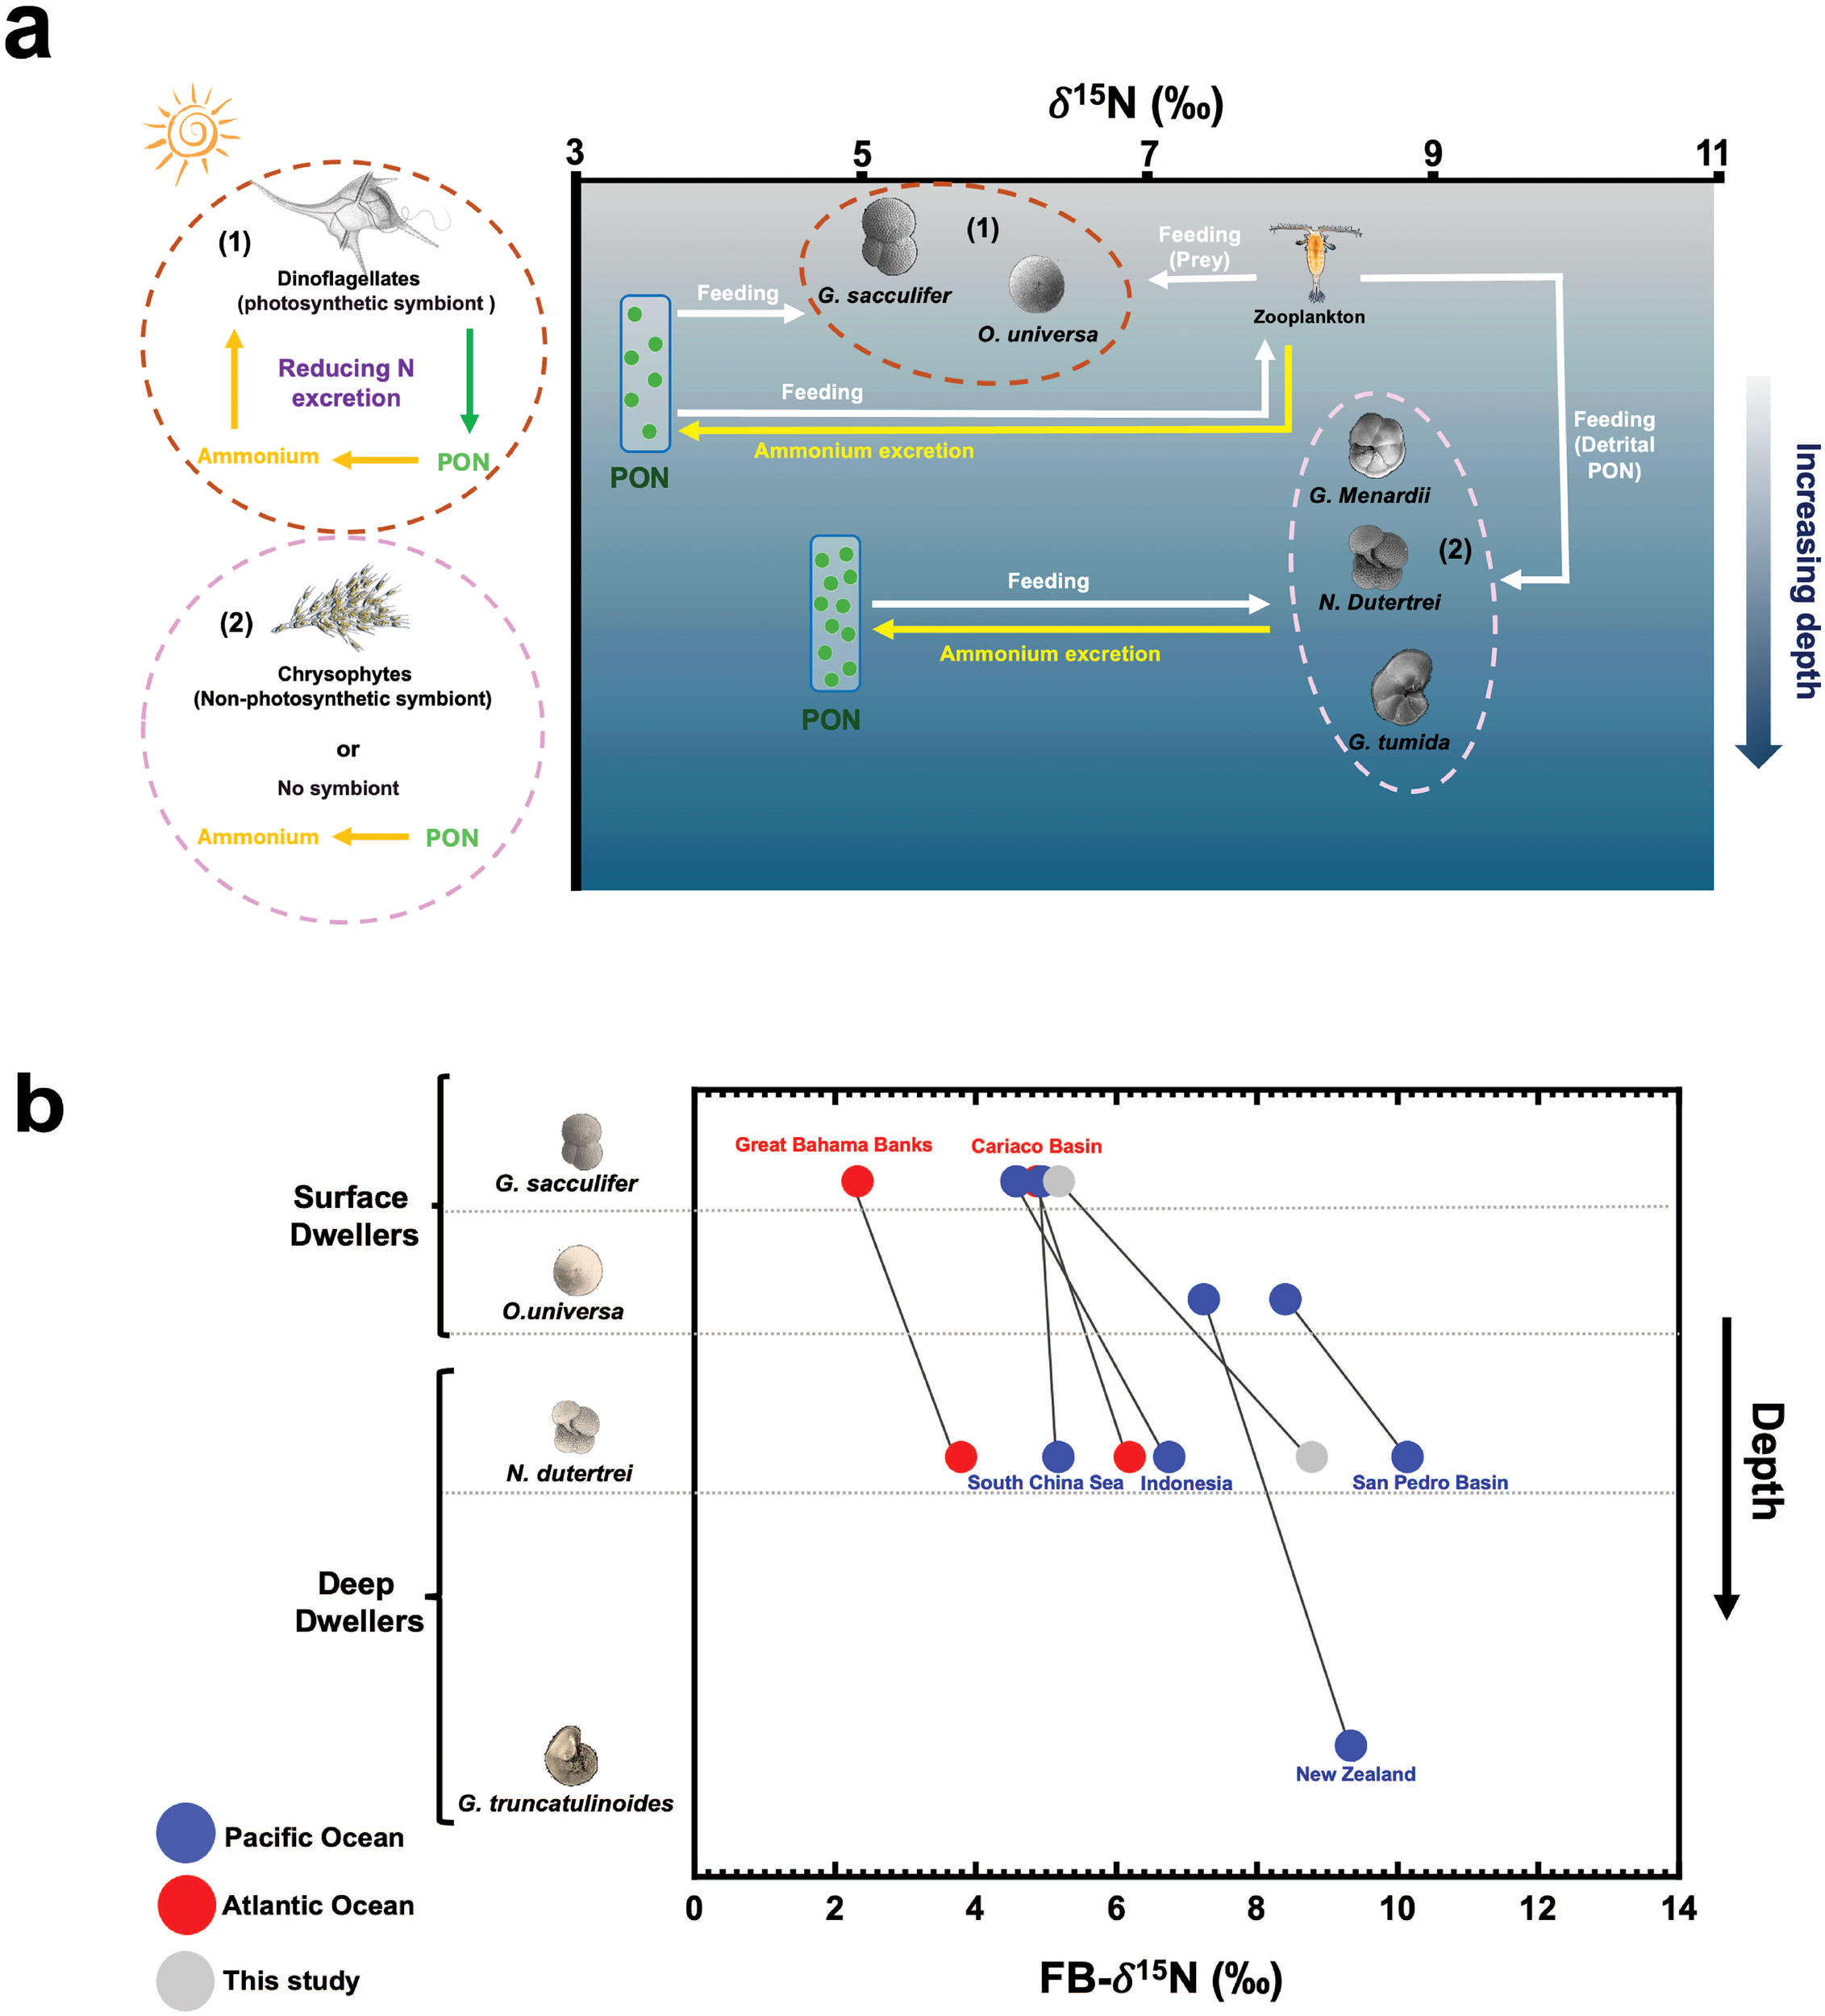
(a) Diagram illustrating difference in FB-δ15N among planktonic foraminifera species within the ETNP ODZ, comparing surface-dwelling symbiont-bearing spinose species (dark red dashed circle, (1)) to deeper-dwelling symbiont-bearing non-spinose and non-symbiont-bearing non-spinose species (pink dashed circle, (2)). The x-axis represents the δ15N values for all organisms in the diagram. Deeper in the water column, the particulate organic nitrogen (PON) consumed by foraminifera is higher in δ15N, with the δ15N of suspended PON increasing down the water column (Altabet, 1988). The overall concept of this diagram is adapted from Ren et al., 2012 and Smart et al., 2018. (b) Depth profile of FB-δ15N for surface dwellers (i.e. G. sacculifer and O. universa) and deep dwellers (i.e. N. dutertei, and G. truncatulinoides) from previous studies (Ren et al., 2012; blue circles: Atlantic Ocean, red circles: Pacific Ocean) and from this study (grey circles).
4.4 Implications for reconstructing the history of ODZs
The findings from this study have important implications for using FB-δ15N (and other δ15N archives) as a proxy to reconstruct historical variations in ODZs. While previous studies have primarily used FB-δ15N to indicate ODZ expansion or contraction (Kast et al., 2019; Studer et al., 2021; Auderset et al., 2022; Wang et al., 2022; Hess et al., 2023; Moretti et al., 2024; Yao et al., 2024), our analyses reveal that ODZ depth also influences FB-δ15N. Below, we propose two potential scenarios for this influence (Figures 5a–c).
In the first scenario, under a warmer climate, organic matter remineralization may occur at shallower depths due to the temperature dependence of respiration (Boscolo-Galazzo et al., 2021; Gerace et al., 2023; Kim et al., 2023). This shift could result in an upward displacement of the thermocline δ15N maxima without increasing their absolute values (Figure 5b). Consequently, FB-δ15N might increase even if water-column denitrification rates remain unchanged, although further research is needed to determine whether such shifts occurred during past warm periods.
Figure 5
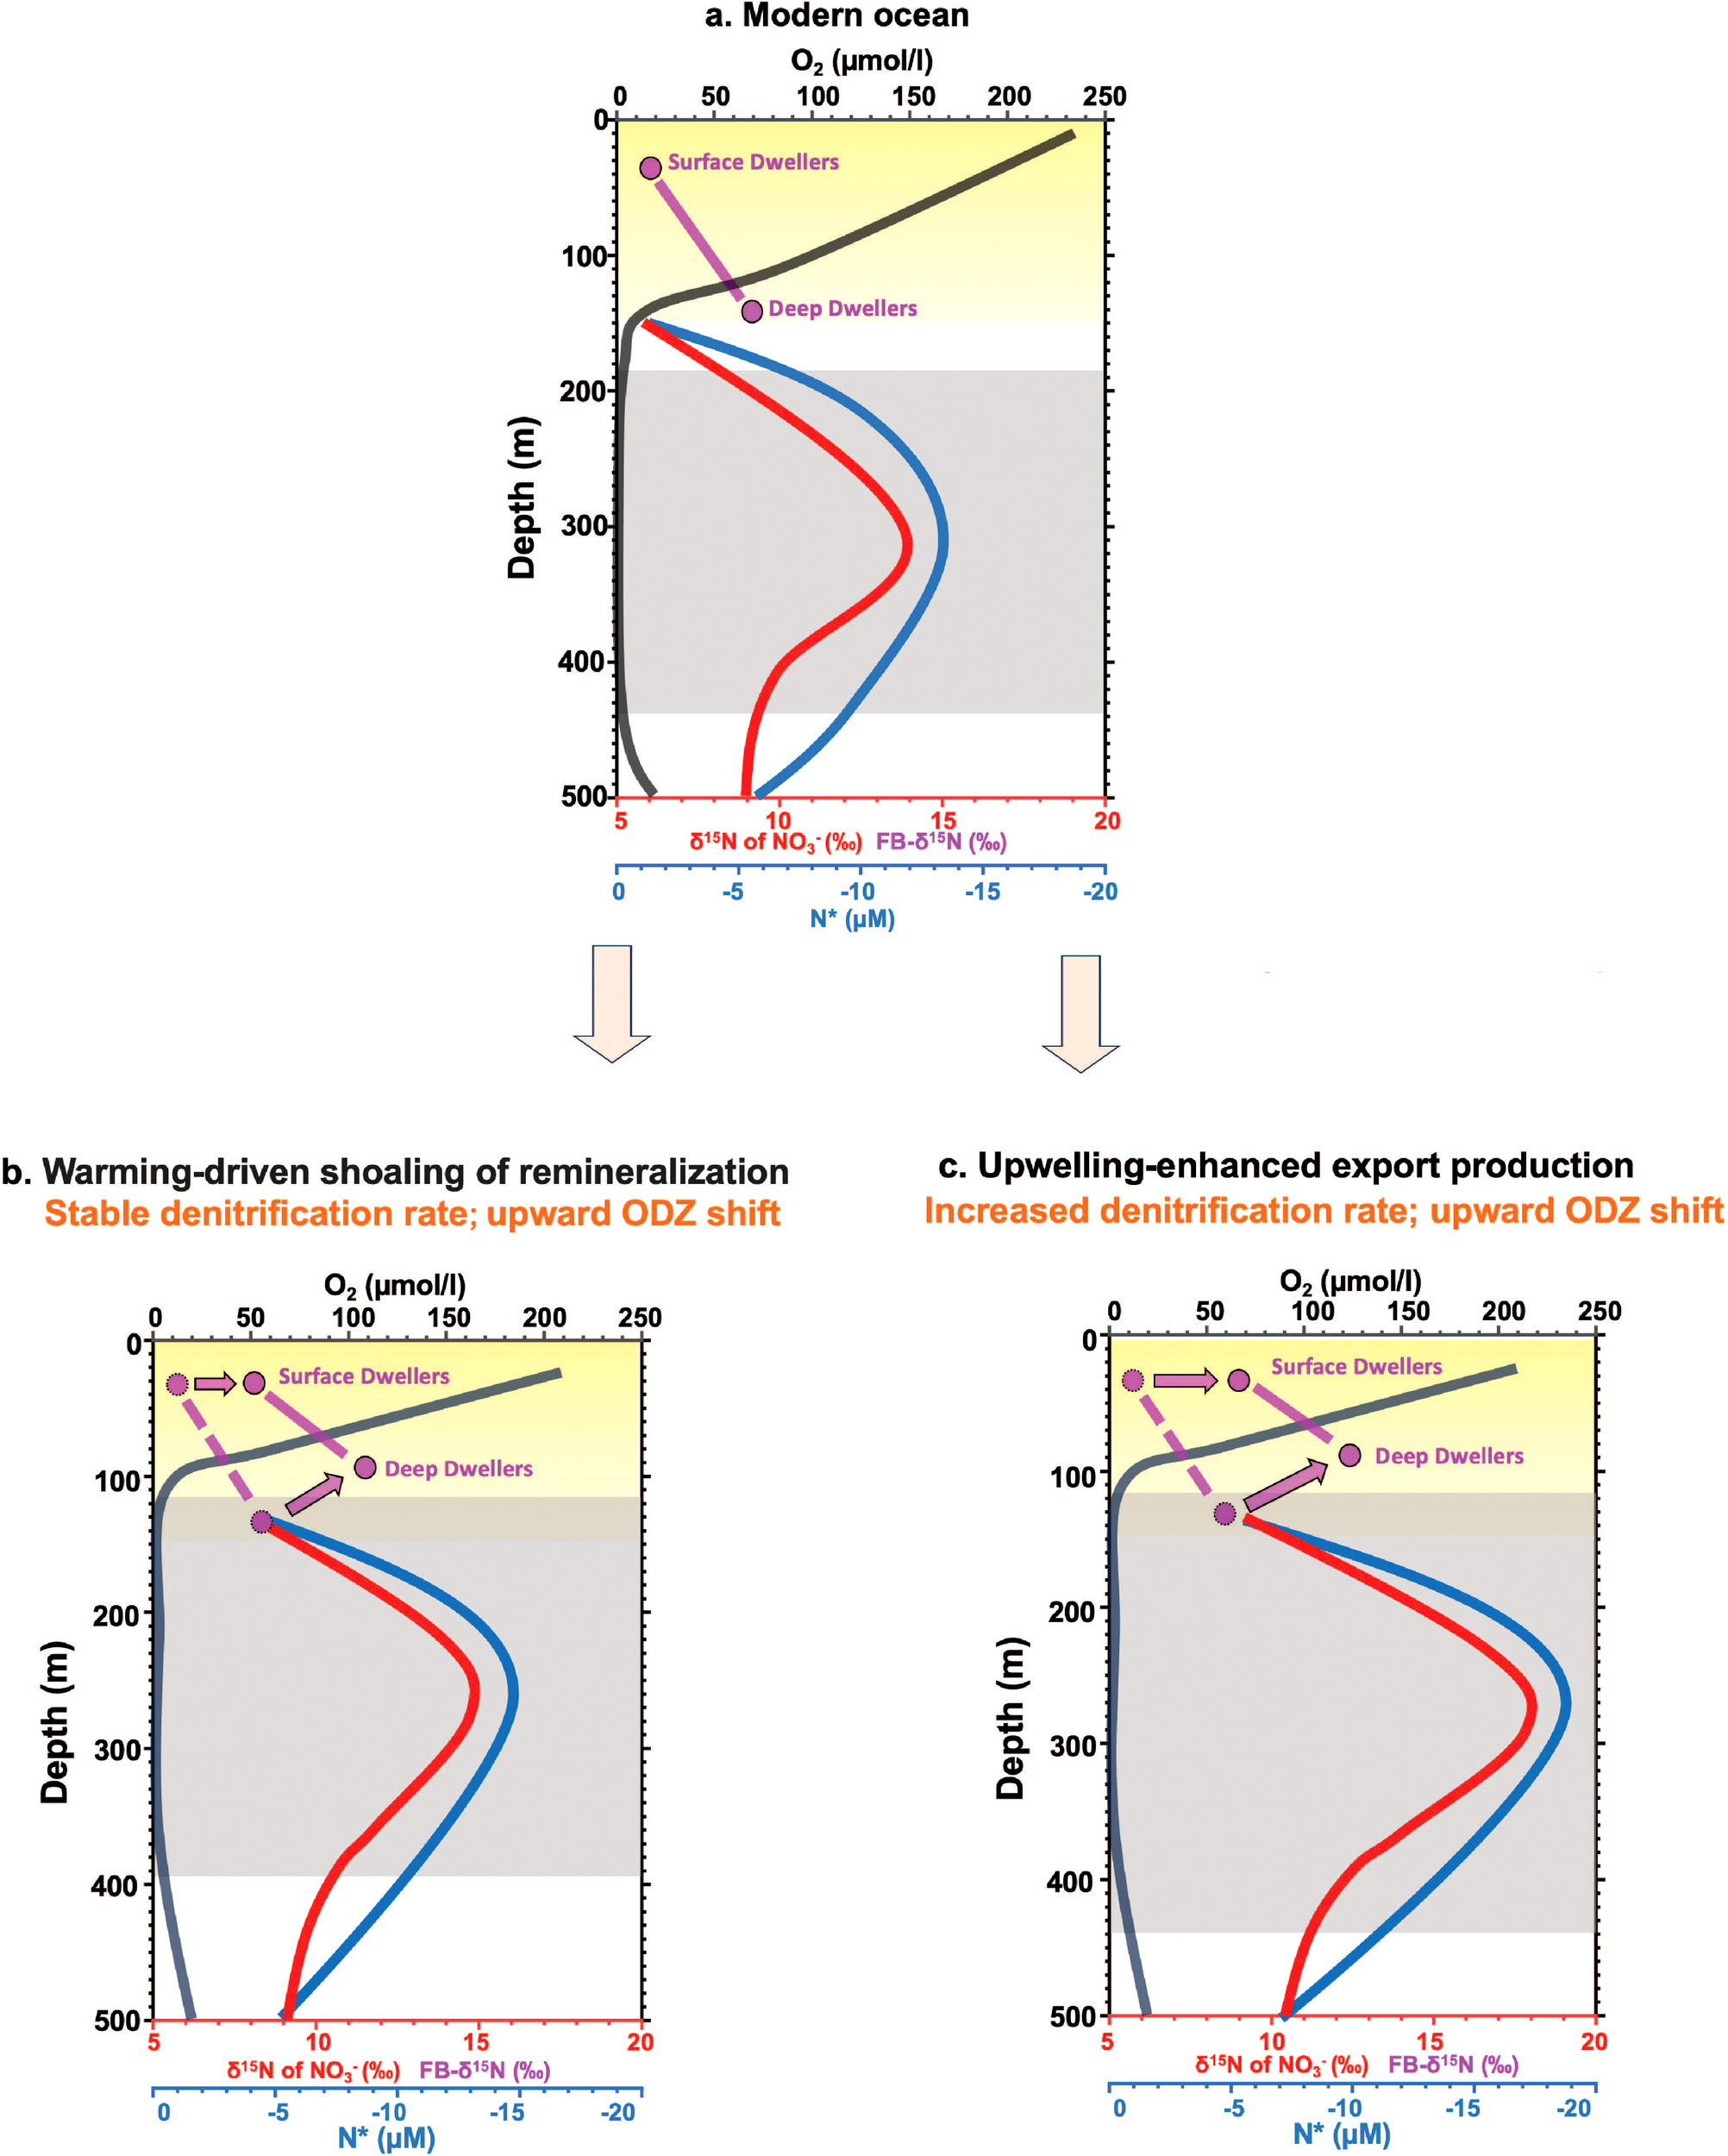
Schematic diagrams illustrating how ODZ depth changes may influence FB-δ15N in both subsurface- and deep-dwelling foraminifera under two scenarios. (a) The top panel shows profiles representing the modern ocean, adapted after Casciotti et al. (2018), including depth profiles of nitrate and FB-δ15N (‰), N*=[NO3-]-16[PO43-] (µM), and oxygen concentration (µmol/L). Depth ranges of the ODZs (grey shaded area) and the euphotic zone (yellow shaded area) are indicated. The bottom two panels (b, c) show the hypothetical changes in these profiles and the corresponding shifts in ODZ depth under two scenarios: (b) warming-driven shoaling of remineralization and (c) upwelling-enhanced export production. In panels (b, c), the FB-δ15N offsets between subsurface and deep dwellers, shown in the modern ocean profiles, are indicated with dashed lines and arrows, highlighting the expected FB-δ15N response under each scenario.
In the second scenario, increased organic matter export driven by stronger upwelling (Gutiérrez-Cárdenas et al., 2024) or elevated thermocline nutrient content is expected to both intensify the ODZs and shift them upward (Figure 5c). In this case, enhanced denitrification would raise both the thermocline δ15N maximum and increased nitrate loss (lower N*, Figure 5), and the upward shift would facilitate the transfer of the elevated δ¹5N signal to the subsurface, thereby increasing subsurface nitrate δ15N (and FB-δ15N). Here, the FB-δ15N increase would be consistent with higher water-column denitrification rates, albeit in a non-linear manner as the ODZ depth change also contributed to the increase of FB-δ15N.
Considering these factors, variations in ODZ depth should be considered when using FB-δ15N to reconstruct ODZ history. Given the spatial complexity of ODZs, integrating multiple cores spanning from the ODZ interiors to regions beyond their modern boundaries is critical for more robust reconstructions. As the elevated thermocline nitrate δ¹5N signals within ODZs are laterally transported into adjacent regions outside modern ODZ boundaries, FB-δ15N records from these peripheral areas primarily reflect ODZ expansions and contractions through time and broader regional changes in denitrification rates. In contrast, FB-δ15N records from cores within modern ODZs provide complementary constraints on the intensity and vertical structure of the ODZs. Together, multiple FB-δ15N records can provide a more comprehensive reconstruction of ODZ evolution.
5 Conclusion
In this study, we combined new and previously published δ15N data from the eastern tropical Pacific ODZs to demonstrate that FB-δ15N (and other δ15N archives) from modern ODZ regions is a robust proxy for tracking past ocean deoxygenation, provided that changes in ODZ depths are considered in addition to water-column denitrification intensity. New δ15N data from the eastern tropical North Pacific (5–8°N) suggest that, when ODZs are deep, subsurface nitrate δ15N may not bear the signal of local denitrification underneath. In these regions, FB-δ15N may instead reflect broader regional denitrification rates, similar to locations outside today’s ODZs. Consequently, interpreting FB-δ15N records from ODZ regions requires careful consideration of potential shifts in ODZ depths. For instance, shallower organic matter remineralization under warmer climates—or deeper remineralization under colder conditions—could drive changes in FB-δ15N without changes in water-column denitrification rates. In addition, low-oxygen conditions in ODZs may force deep-dwelling foraminiferal species to migrate upward, although current data do not indicate significant impacts on interspecies variations in FB-δ15N. For a more robust reconstruction of ODZ history using FB-δ15N, we recommend analyzing multiple sites along transects that span from within modern ODZs to adjacent regions beyond their current extent. Cores located outside present-day ODZs, yet still containing thermocline nitrate δ15N signatures influenced by ODZs, are well suited for recording expansions and contractions of ODZs. In contrast, cores from within modern ODZs provide complementary insights into the ODZ’s intensity and vertical structure. Combining these FB-δ15N records allows for a more comprehensive understanding of ODZ evolution over time.
Statements
Data availability statement
The datasets presented in this study can be found in online repositories. The names of the repository/repositories and accession number(s) can be found in the article/Supplementary Material.
Author contributions
TK: Methodology, Data curation, Investigation, Writing – review & editing, Formal analysis, Writing – original draft, Visualization. TL: Writing – review & editing, Formal analysis, Writing – original draft, Methodology. KL: Methodology, Formal analysis, Writing – review & editing. RZ: Investigation, Methodology, Writing – review & editing. SD: Writing – review & editing, Methodology. XW: Project administration, Investigation, Writing – review & editing, Formal analysis, Methodology, Conceptualization, Writing – original draft, Funding acquisition.
Funding
The author(s) declare financial support was received for the research and/or publication of this article. This study was supported by the startup grant to XTW from Boston College. Publication fee was supported by the Boston College Open Access Publishing Fund.
Acknowledgments
We would like to thank the crew members and scientists for R/V Sally Ride SR2113.
In memoriam
Prof. Sijia Dong, a coauthor of this study, passed away while this manuscript was under review. An early-career scientist, her dedication, creativity, and collaborative spirit leave a lasting legacy in the field of the marine carbon cycle. She will be deeply missed by colleagues and the scientific community.
Conflict of interest
The authors declare that the research was conducted in the absence of any commercial or financial relationships that could be construed as a potential conflict of interest.
Generative AI statement
The author(s) declare that no Generative AI was used in the creation of this manuscript.
Publisher’s note
All claims expressed in this article are solely those of the authors and do not necessarily represent those of their affiliated organizations, or those of the publisher, the editors and the reviewers. Any product that may be evaluated in this article, or claim that may be made by its manufacturer, is not guaranteed or endorsed by the publisher.
Supplementary material
The Supplementary Material for this article can be found online at: https://www.frontiersin.org/articles/10.3389/fmars.2025.1600122/full#supplementary-material
References
1
Achacoso S. C. Walag A. M. P. Saab L. L. (2016). A rapid assessment of foliage spider fauna diversity in Sinaloc, El Salvador City, Philippines: a comparison between habitats receiving different degrees of disturbance. Biodiversity17, 156–161. doi: 10.1080/14888386.2016.1258331
2
Altabet M. A. (1988). Variations in nitrogen isotopic composition between sinking and suspended particles: implications for nitrogen cycling and particle transformation in the open ocean. Deep Sea Res. Part A. Oceanographic Res. Papers35, 535–554. doi: 10.1016/0198-0149(88)90130-6
3
Anderson O. R. Be A. W. H. (1976). The ultrastructure of a planktonic foraminifer, Globigerinoides sacculifer (Brady), and its symbiotic dinoflagellates. J. Foraminiferal Res.6, 1–21. doi: 10.2113/gsjfr.6.1.1
4
Auderset A. Moretti S. Taphorn B. Ebner P.-R. Kast E. Wang X. T. et al . (2022). Enhanced ocean oxygenation during Cenozoic warm periods. Nature609, 77–82. doi: 10.1038/s41586-022-05017-0
5
Auderset A. Smart S. M. Ryu Y. Marconi D. Ren H. A. Heins L. et al . (2024). Effects of photosymbiosis and related processes on planktic foraminifera-bound nitrogen isotopes in South Atlantic sediments. EGUsphere22, 1–28. doi: 10.5194/egusphere-2024-2291
6
Bé A. W. Hemleben C. (1970). Calcification in a living planktonic foraminifer, Globigerinoides sacculifer (BRADY). Available online at: https://www.researchgate.net/publication/230889356_Calcification_in_a_living_planktonic_foraminifer_Globigerinoides_sacculifer_BRADY (Accessed December 3, 2024).
7
Bé A. W. H. Hemleben C. Anderson O. R. Spindler M. Hacunda J. Tuntivate-Choy S. (1977). Laboratory and field observations of living planktonic foraminifera. Micropaleontology23, 155–179. doi: 10.2307/1485330
8
Bianchi D. Dunne J. P. Sarmiento J. L. Galbraith E. D. (2012). Data-based estimates of suboxia, denitrification, and N2O production in the ocean and their sensitivities to dissolved O2. Global Biogeochemical Cycles26. doi: 10.1029/2011GB004209
9
Boscolo-Galazzo F. Crichton K. A. Ridgwell A. Mawbey E. M. Wade B. S. Pearson P. N. (2021). Temperature controls carbon cycling and biological evolution in the ocean twilight zone. Science371, 1148–1152. doi: 10.1126/science.abb6643
10
Brady H. B. (1877). II.—Supplementary note on the foraminifera of the chalk ()? of the new britain group. Geological Magazine4, 534–536. doi: 10.1017/S0016756800150137
11
Brandes J. A. Devol A. H. Yoshinari T. Jayakumar D. A. Naqvi S. W. A. (1998). Isotopic composition of nitrate in the central Arabian Sea and eastern tropical North Pacific: A tracer for mixing and nitrogen cycles. Limnology Oceanography43, 1680–1689. doi: 10.4319/lo.1998.43.7.1680
12
Breitburg D. Levin L. A. Oschlies A. Grégoire M. Chavez F. P. Conley D. J. et al . (2018). Declining oxygen in the global ocean and coastal waters. Science359, eaam7240. doi: 10.1126/science.aam7240
13
Caron D. A. Bé A. W. H. (1984). Predicted and observed feeding rates of the spinose planktonic foraminifer globigerinoides sacculifer. Bull. Mar. Sci.35, 1–10.
14
Casciotti K. L. (2016). Nitrogen and oxygen isotopic studies of the marine nitrogen cycle. Annu. Rev. Mar. Sci.8, 379–407. doi: 10.1146/annurev-marine-010213-135052
15
Casciotti K. L. Buchwald C. McIlvin M. (2013). Implications of nitrate and nitrite isotopic measurements for the mechanisms of nitrogen cycling in the Peru oxygen deficient zone. Deep Sea Res. Part I80, 78–93. doi: 10.1016/j.dsr.2013.05.017
16
Casciotti K. L. Forbes M. Vedamati J. Peters B. D. Martin T. S. Mordy C. W. (2018). Nitrous oxide cycling in the Eastern Tropical South Pacific as inferred from isotopic and isotopomeric data. Deep Sea Res. Part II156, 155–167. doi: 10.1016/j.dsr2.2018.07.014
17
Chavez F. P. Barber R. T. (1987). An estimate of new production in the equatorial Pacific. Deep Sea Res. Part A. Oceanographic Res. Papers34, 1229–1243. doi: 10.1016/0198-0149(87)90073-2
18
Cline J. D. Kaplan I. R. (1975). Isotopic fractionation of dissolved nitrate during denitrification in the eastern tropical north pacific ocean. Mar. Chem.3, 271–299. doi: 10.1016/0304-4203(75)90009-2
19
Czeschel R. Stramma L. Weller R. A. Fischer T. (2015). Circulation, eddies, oxygen, and nutrient changes in the eastern tropical South Pacific Ocean. Ocean Sci.11, 455–470. doi: 10.5194/os-11-455-2015
20
d’Orbigny A. D. (1839). Foraminifères [of Cuba] (Bertrand).
21
Davis C. V. Wishner K. Renema W. Hull P. M. (2021). Vertical distribution of planktic foraminifera through an oxygen minimum zone: how assemblages and test morphology reflect oxygen concentrations. Biogeosciences18, 977–992. doi: 10.5194/bg-18-977-2021
22
DeVries T. Deutsch C. Primeau F. Chang B. Devol A. (2012). Global rates of water-column denitrification derived from nitrogen gas measurements. Nat. Geosci5, 547–550. doi: 10.1038/ngeo1515
23
Faber W. W. Anderson O. R. Lindsey J. L. Caron D. A. (1988). Algal-foraminiferal symbiosis in the planktonic foraminifer Globigerinella aequilateralia; I, Occurrence and stability of two mutually exclusive chrysophyte endosymbionts and their ultrastructure. J. Foraminiferal Res.18, 334–343. doi: 10.2113/gsjfr.18.4.334
24
Farmer E. C. Kaplan A. de Menocal P. B. Lynch-Stieglitz J. (2007). Corroborating ecological depth preferences of planktonic foraminifera in the tropical Atlantic with the stable oxygen isotope ratios of core top specimens. Paleoceanography22. doi: 10.1029/2006PA001361
25
Fiedler P. C. Philbrick V. Chavez F. P. (1991). Oceanic upwelling and productivity in the eastern tropical Pacific. Limnology Oceanography36, 1834–1850. doi: 10.4319/lo.1991.36.8.1834
26
Fiedler P. C. Talley L. D. (2006). Hydrography of the eastern tropical Pacific: A review. Prog. Oceanography69, 143–180. doi: 10.1016/j.pocean.2006.03.008
27
Fripiat F. Martínez-García A. Marconi D. Fawcett S. E. Kopf S. H. Luu V. H. et al . (2021). Nitrogen isotopic constraints on nutrient transport to the upper ocean. Nat. Geosci.14, 855–861. doi: 10.1038/s41561-021-00836-8
28
Gastrich M. D. (1987). Ultrastructure of a new intracellular symbiotic alga found within Planktonic Foraminifera. J. Phycology23, 623–632. doi: 10.1111/j.1529-8817.1987.tb04215.x
29
Gerace S. D. Fagan A. J. Primeau F. W. Moreno A. R. Lethaby P. Johnson R. J. et al . (2023). Depth variance of organic matter respiration stoichiometry in the subtropical North Atlantic and the implications for the global oxygen cycle. Global Biogeochemical Cycles37, e2023GB007814. doi: 10.1029/2023GB007814
30
Gruber N. (2008). The marine nitrogen cycle: overview and challenges. Carpenter (San Diego: Academic Press), 1–50. doi: 10.1016/B978-0-12-372522-6.00001-3
31
Gutiérrez-Cárdenas G. S. Morales-Acuña E. Tenorio-Fernández L. Gómez-Gutiérrez J. Cervantes-Duarte R. Aguíñiga-García S. (2024). El niño–Southern Oscillation diversity: effect on upwelling center intensity and its biological response. J. Mar. Sci. Eng.12, 1061. doi: 10.3390/jmse12071061
32
Hemleben C. Spindler M. Anderson O. R. (1989). Modern Planktonic Foraminifera. (Springer Science & Business Media).
33
Hess A. V. Auderset A. Rosenthal Y. Miller K. G. Zhou X. Sigman D. M. et al . (2023). A well-oxygenated eastern tropical Pacific during the warm Miocene. Nature619, 521–525. doi: 10.1038/s41586-023-06104-6
34
Hinkle D. E. Wiersma W. Jurs S. G. (2003). Applied Statistics for the Behavioral Sciences. (Houghton Mifflin).
35
Jobson J. D. (1991). “Multiple linear regression,” in Applied Multivariate Data Analysis: Regression and Experimental Design. Ed. JobsonJ. D. (Springer, New York, NY), 219–398. doi: 10.1007/978-1-4612-0955-3_4
36
Kast E. R. Stolper D. A. Auderset A. Higgins J. A. Ren H. Wang X. T. et al . (2019). Nitrogen isotope evidence for expanded ocean suboxia in the early Cenozoic. Science364, 386–389. doi: 10.1126/science.aau5784
37
Kim H. H. Laufkötter C. Lovato T. Doney S. C. Ducklow H. W. (2023). Projected 21st-century changes in marine heterotrophic bacteria under climate change. Front. Microbiol.14. doi: 10.3389/fmicb.2023.1049579
38
Knapp A. N. Casciotti K. L. Berelson W. M. Prokopenko M. G. Capone D. G. (2016). Low rates of nitrogen fixation in eastern tropical South Pacific surface waters. Proc. Natl. Acad. Sci.113, 4398–4403. doi: 10.1073/pnas.1515641113
39
Kuroyanagi A. da Rocha R. E. Bijma J. Spero H. J. Russell A. D. Eggins S. M. et al . (2013). Effect of dissolved oxygen concentration on planktonic foraminifera through laboratory culture experiments and implications for oceanic anoxic events. Mar. Micropaleontology101, 28–32. doi: 10.1016/j.marmicro.2013.04.005
40
Kuroyanagi A. Toyofuku T. Nagai Y. Kimoto K. Nishi H. Takashima R. et al . (2019). Effect of euxinic conditions on planktic foraminifers: culture experiments and implications for past and future environments. Paleoceanography Paleoclimatology34, 54–62. doi: 10.1029/2018PA003539
41
Kutner M. H. (2005). Applied Linear Statistical Models (McGraw-Hill Irwin).
42
Kwiecinski J. V. Babbin A. R. (2021). A high-resolution atlas of the Eastern tropical pacific oxygen deficient zones. Global Biogeochemical Cycles35, e2021GB007001. doi: 10.1029/2021GB007001
43
Landry K. Wang X. (2024). Average nitrate d15N values from the upper 1000 meters of the water column at four stations sampled in the Eastern Tropical North Pacific on R/V Sally Ride cruise SR2113 in December 2021. doi: 10.26008/1912/BCO-DMO.933292.1
44
Lee C. W. M. Altabet M. Mnich A. Zhang L. (2025). Using δ15N of amino acids and nitrate to investigate particle production and transformation in the ocean: A case study from the Eastern Tropical North Pacific oxygen deficient zone. Global Biogeochemical Cycles39, e2024GB008280. doi: 10.1029/2024GB008280
45
Liu K.-K. Kaplan I. R. (1989). The eastern tropical Pacific as a source of 15N-enriched nitrate in seawater off southern California. Limnology Oceanography34, 820–830. doi: 10.4319/lo.1989.34.5.0820
46
Luyten J. R. Pedlosky J. Stommel H. (1983). The Ventilated Thermocline. Available online at: https://journals.ametsoc.org/view/journals/phoc/13/2/1520-0485_1983_013_0292_tvt_2_0_co_2.xml (Accessed February 11, 2025).
47
Margolskee A. Frenzel H. Emerson S. Deutsch C. (2019). Ventilation pathways for the north pacific oxygen deficient zone. Global Biogeochemical Cycles33, 875–890. doi: 10.1029/2018GB006149
48
Martínez-García A. Sigman D. M. Ren H. Anderson R. F. Straub M. Hodell D. A. et al . (2014). Iron fertilization of the Subantarctic ocean during the last ice age. Science343, 1347–1350. doi: 10.1126/science.1246848
49
Mehra O. P. Jackson M. L. (1958). Iron oxide removal from soils and clays by a dithionite-citrate system buffered with sodium bicarbonate. Clays Clay Miner.7, 317–327. doi: 10.1346/CCMN.1958.0070122
50
Moretti S. Auderset A. Deutsch C. Schmitz R. Gerber L. Thomas E. et al . (2024). Oxygen rise in the tropical upper ocean during the Paleocene-Eocene Thermal Maximum. Science383, 727–731. doi: 10.1126/science.adh4893
51
O’brien R. M. (2007). A caution regarding rules of thumb for variance inflation factors. Qual Quant41, 673–690. doi: 10.1007/s11135-006-9018-6
52
Paulmier A. Ruiz-Pino D. (2009). Oxygen minimum zones (OMZs) in the modern ocean. Prog. Oceanography80, 113–128. doi: 10.1016/j.pocean.2008.08.001
53
Peters B. Horak R. Devol A. Fuchsman C. Forbes M. Mordy C. W. et al . (2018b). Estimating fixed nitrogen loss and associated isotope effects using concentration and isotope measurements of NO3–, NO2–, and N2 from the Eastern Tropical South Pacific oxygen deficient zone. Deep Sea Res. Part II: Topical Stud. Oceanography156, 121–136. doi: 10.1016/j.dsr2.2018.02.011
54
Peters B. D. Lam P. J. Casciotti K. L. (2018a). Nitrogen and oxygen isotope measurements of nitrate along the US GEOTRACES Eastern Pacific Zonal Transect (GP16) yield insights into nitrate supply, remineralization, and water mass transport. Mar. Chem.201, 137–150. doi: 10.1016/j.marchem.2017.09.009
55
Rafter P. A. Sigman D. M. (2016). Spatial distribution and temporal variation of nitrate nitrogen and oxygen isotopes in the upper equatorial Pacific Ocean. Limnology Oceanography61, 14–31. doi: 10.1002/lno.10152
56
Rafter P. A. Sigman D. M. Charles C. D. Kaiser J. Haug G. H. (2012). Subsurface tropical Pacific nitrogen isotopic composition of nitrate: Biogeochemical signals and their transport. Global Biogeochemical Cycles26. doi: 10.1029/2010GB003979
57
Ravelo A. C. Fairbanks R. G. (1992). Oxygen isotopic composition of multiple species of planktonic foraminifera: recorders of the modern photic zone temperature gradient. Paleoceanography7, 815–831. doi: 10.1029/92PA02092
58
Rebotim A. Voelker A. H. L. Jonkers L. Waniek J. J. Meggers H. Schiebel R. et al . (2017). Factors controlling the depth habitat of planktonic foraminifera in the subtropical eastern North Atlantic. Biogeosciences14, 827–859. doi: 10.5194/bg-14-827-2017
59
Ren H. Sigman D. M. Meckler A. N. Plessen B. Robinson R. S. Rosenthal Y. et al . (2009). Foraminiferal isotope evidence of reduced nitrogen fixation in the ice age Atlantic Ocean. Science323, 244–248. doi: 10.1126/science.1165787
60
Ren H. Sigman D. M. Thunell R. C. Prokopenko M. G. (2012). Nitrogen isotopic composition of planktonic foraminifera from the modern ocean and recent sediments. Limnology Oceanography57, 1011–1024. doi: 10.4319/lo.2012.57.4.1011
61
Rippert N. Nürnberg D. Raddatz J. Maier E. Hathorne E. Bijma J. et al . (2016). Constraining foraminiferal calcification depths in the western Pacific warm pool. Mar. Micropaleontology128, 14–27. doi: 10.1016/j.marmicro.2016.08.004
62
Robinson R. S. Smart S. M. Cybulski J. D. McMahon K. W. Marcks B. Nowakowski C. (2023). Insights from fossil-bound nitrogen isotopes in diatoms, foraminifera, and corals. Annu. Rev. Mar. Sci.15, 407–430. doi: 10.1146/annurev-marine-032122-104001
63
Schiebel R. Hemleben C. (2017). Planktic Foraminifers in the Modern Ocean. (Berlin, Heidelberg: Springer). doi: 10.1007/978-3-662-50297-6
64
Schiebel R. Smart S. M. Jentzen A. Jonkers L. Morard R. Meilland J. et al . (2018). Advances in planktonic foraminifer research: New perspectives for paleoceanography. Rev. Micropaléontologie61, 113–138. doi: 10.1016/j.revmic.2018.10.001
65
Shao Z. Xu Y. Wang H. Luo W. Wang L. Huang Y. et al . (2023). Global oceanic diazotroph database version 2 and elevated estimate of global oceanic N2 fixation. Earth System Sci. Data15, 3673–3709. doi: 10.5194/essd-15-3673-2023
66
Sigman D. M. Casciotti K. L. Andreani M. Barford C. Galanter M. Böhlke J. K. (2001). A bacterial method for the nitrogen isotopic analysis of nitrate in seawater and freshwater. Anal. Chem.73, 4145–4153. doi: 10.1021/ac010088e
67
Sigman D. M. Granger J. DiFiore P. J. Lehmann M. M. Ho R. Cane G. et al . (2005). Coupled nitrogen and oxygen isotope measurements of nitrate along the eastern North Pacific margin. Global Biogeochemical Cycles19, 2005GB002458. doi: 10.1029/2005GB002458
68
Smart S. M. Ren H. Fawcett S. E. Schiebel R. Conte M. Rafter P. A. et al . (2018). Ground-truthing the planktic foraminifer-bound nitrogen isotope paleo-proxy in the Sargasso Sea. Geochimica Cosmochimica Acta235, 463–482. doi: 10.1016/j.gca.2018.05.023
69
Spindler M. Hemleben C. Salomons J. B. Smit L. P. (1984). Feeding behavior of some planktonic foraminifers in laboratory cultures. J. Foraminiferal Res.14, 237–249. doi: 10.2113/gsjfr.14.4.237
70
Studer A. S. Mekik F. Ren H. Hain M. P. Oleynik S. Martínez-García A. et al . (2021). Ice age-holocene similarity of foraminifera-bound nitrogen isotope ratios in the eastern equatorial pacific. Paleoceanog Paleoclimatol36, e2020PA004063. doi: 10.1029/2020PA004063
71
Uhle M. E. Macko S. A. Spero H. J. Engel M. H. Lea D. W. (1997). Sources of carbon and nitrogen in modern planktonic foraminifera: the role of algal symbionts as determined by bulk and compound specific stable isotopic analyses. Organic Geochemistry27, 103–113. doi: 10.1016/S0146-6380(97)00075-2
72
Voss M. Dippner J. W. Montoya J. P. (2001). Nitrogen isotope patterns in the oxygen-deficient waters of the Eastern Tropical North Pacific Ocean. Deep Sea Res. Part I: Oceanographic Res. Papers48, 1905–1921. doi: 10.1016/S0967-0637(00)00110-2
73
Wang X. T. Cohen A. L. Luu V. Ren H. Su Z. Haug G. H. et al . (2018). Natural forcing of the North Atlantic nitrogen cycle in the Anthropocene. Proc. Natl. Acad. Sci.115, 10606–10611. doi: 10.1073/pnas.1801049115
74
Wang X. T. Wang Y. Auderset A. Sigman D. M. Ren H. Martínez-García A. et al . (2022). Oceanic nutrient rise and the late Miocene inception of Pacific oxygen-deficient zones. Proc. Natl. Acad. Sci.119, e2204986119. doi: 10.1073/pnas.2204986119
75
Weigand M. A. Foriel J. Barnett B. Oleynik S. Sigman D. M. (2016). Updates to instrumentation and protocols for isotopic analysis of nitrate by the denitrifier method. Rapid Commun. Mass Spectrometry30, 1365–1383. doi: 10.1002/rcm.7570
76
Yao W. Kong T. Wang X. T. Zhai R. Zhang R. Liu Y. (2024). Expanded subsurface ocean anoxia in the Atlantic during the Paleocene-Eocene Thermal Maximum. Nat. Commun.15, 9053. doi: 10.1038/s41467-024-53423-x
Summary
Keywords
planktonic foraminifera, nitrogen isotopes, ocean deoxygenation, marine nitrogen cycle, paleoceanography
Citation
Kong T, Lee T, Landry K, Zhai R, Dong S and Wang XT (2025) Evaluating foraminifera-bound δ15N as an ocean deoxygenation proxy: the influence of oxygen-deficient zone depths. Front. Mar. Sci. 12:1600122. doi: 10.3389/fmars.2025.1600122
Received
25 March 2025
Accepted
17 July 2025
Published
01 September 2025
Volume
12 - 2025
Edited by
Martin F. Soto-Jimenez, National Autonomous University of Mexico, Mexico
Reviewed by
Yoshihisa Mino, Nagoya University, Japan
Sergio Aguíñiga-García, National Polytechnic Institute (IPN), Mexico
Updates
Copyright
© 2025 Kong, Lee, Landry, Zhai, Dong and Wang.
This is an open-access article distributed under the terms of the Creative Commons Attribution License (CC BY). The use, distribution or reproduction in other forums is permitted, provided the original author(s) and the copyright owner(s) are credited and that the original publication in this journal is cited, in accordance with accepted academic practice. No use, distribution or reproduction is permitted which does not comply with these terms.
*Correspondence: Xingchen Tony Wang, xingchen.wang@bc.edu
†These authors have contributed equally to this work and share first authorship
‡Deceased
Disclaimer
All claims expressed in this article are solely those of the authors and do not necessarily represent those of their affiliated organizations, or those of the publisher, the editors and the reviewers. Any product that may be evaluated in this article or claim that may be made by its manufacturer is not guaranteed or endorsed by the publisher.