Abstract
Deoxygenation in coastal seas has significant implications to the marine ecosystems. In this study, the processes influencing the seasonal variation of dissolved oxygen (DO) in the Bohai and Yellow Seas (BS and YS) are investigated using a coupled physical-biogeochemical model. The seasonal variation of the DO concentration ([DO]) in the surface water is lower in summer and autumn and higher in winter and spring, which is mainly controlled by temperature. Moreover, in this layer, photosynthesis, to some extent, regulates the [DO] and leads to the supersaturation in summer, whereas downward diffusion in autumn is mainly responsible for the gradually decreased saturation degree. The seasonal distribution of the [DO] in the bottom water is similar with that in the surface water, with much lower [DO] and significant undersaturation in summer in the BS and in summer and autumn in the YS. Vertical diffusion is overall the predominant source of DO in the bottom layer, whereas biological oxygen consumption (BOC) is the main sink, especially during stratification. Relative to the BS, the YS experiences a moderate but longer deoxygenation duration, due to the thicker bottom water and persistent stratification. In addition, it reveals that apparent oxygen utilization (AOU) prevalently underestimates BOC in coastal waters, and true oxygen utilization (TOU) is proposed as a more accurate proxy. Notably, the TOU-AOU discrepancy is strongly correlated with temperature variation during this period, suggesting continuous temperature monitoring as a useful pathway in investigating BOC in shallow estuarine and coastal waters.
1 Introduction
Dissolved oxygen (DO) is a critical determinant of marine ecosystem, playing a vital role in sustaining marine biodiversity and supporting the survival and growth of marine organisms (Diaz, 2001; Díaz and Rosenberg, 2011; Fennel and Testa, 2019). Hypoxia, which is defined as the DO concentration ([DO]) below 2 mg L−1 (Diaz and Rosenberg, 1995), poses severe threats to marine ecosystems, including suffocation of marine organisms, decreasing biodiversity, and enhancing denitrification in aquatic ecosystems (Seitzinger et al., 2006; Vaquer-Sunyer and Duarte, 2008; Deutsch et al., 2024). Over recent decades, hypoxic episode in estuarine and coastal waters has been aggravating and expanding worldwide (Diaz and Rosenberg, 2008; Breitburg et al., 2018). Current estimates indicates the presence of hypoxia in more than 500 estuarine and coastal systems worldwide (Breitburg et al., 2018), such as the northern Gulf of Mexico (Rabalais et al., 2002), Baltic Sea (Meier et al., 2011), Chesapeake Bay (Hagy et al., 2004), Yangtze River estuary (Li et al., 2002), and Pearl River estuary (Yin et al., 2004).
The [DO] in seawater is governed by complex physical and biogeochemical processes. Photosynthetic production serves as the dominant oxygen source in the euphotic zone, whereas microbial-mediated decomposition of organic matter is the primary oxygen sink throughout the water column. The physical processes, including vertical diffusion, advection, and air–sea exchange, further modulate the DO distribution (Rabalais et al., 2007; Testa and Kemp, 2011). Climate change is recognized as a key driver of oceanic deoxygenation by simultaneously regulating these physical and biogeochemical processes (Breitburg et al., 2009; Keeling et al., 2010). On multidecadal timescales, ocean warming contributes to oxygen depletion through multiple pathways, including reducing oxygen solubility (Stramma et al., 2008; Deutsch et al., 2024), strengthening vertical stratification and consequently limiting oxygen replenishment to deeper layers and enhancing microbial respiratory demand (Keeling et al., 2010; Helm et al., 2011). Furthermore, eutrophication, through sequentially enhancing net primary production, organic matter export, and benthic oxygen consumption, has been identified as predominant factor exacerbating coastal hypoxia (Diaz and Rosenberg, 2008; Breitburg et al., 2018).
The apparent oxygen utilization (AOU), defined as the difference between the DO solubility at in situ temperature and salinity and the measured concentration, has been extensively employed in investigating oxygen dynamics and biogeochemical processes. In open oceans, robust correlations between colored dissolved organic matter (CDOM), humic-like fluorescent dissolved organic matter (FDOM), and AOU have been demonstrated to reflect microbial production of these compounds in deep waters (Yamashita and Tanoue, 2008; Nelson and Siegel, 2013; Xiao et al., 2023). In combination with the water mass age, AOU can also estimate both the oxygen utilization rates (Feely et al., 2004; Karstensen et al., 2008; Engel et al., 2022) and the turnover times of CDOM and FDOM (Catalá et al., 2015a, b). In estuarine and coastal hypoxic waters, the relationships between AOU and the concentration of carbon dioxide (CO2) and Brunt-Väisälä frequency (N) are frequently used to quantify the relative contributions of organic matter remineralization and water mass mixing to regional oxygen depletion (Bianchi et al., 2010; Caballero-Alfonso et al., 2015; Su et al., 2017; Zhai et al., 2019; Chen et al., 2022a). However, AOU-based estimates of microbial oxygen consumption contain inherent uncertainties, primarily due to air–sea disequilibrium during water mass formation and the non-linear variation of oxygen solubility during mixing processes (Ito et al., 2004; Holzer, 2022). To address these limitations in open ocean, the concept of true oxygen consumption (TOU) was introduced, defined as the difference between the pre-subduction [DO] of a water mass and its measured in situ [DO] (Ito et al., 2004). This approach minimizes errors associated with changes in the hydrological characteristics of water masses, thereby providing more accurate estimates of oxygen utilization rates (Ito et al., 2004; Sulpis et al., 2023). In contrast, the estimation of biological oxygen consumption (BOC) using AOU in shallow estuaries and shelf seas, where bottom water temperature exhibits significant seasonal variability, particularly during spring and summer stratification, may introduce substantial systematic errors. This important issue remains insufficiently investigated in coastal ecosystems.
The Bohai and Yellow Seas (BS and YS), semi-enclosed marginal seas of the northwest Pacific Ocean, are hydrologically connected through the Bohai Strait. The YS is further subdivided into northern and southern regions along the Chengshan Cape (Shandong Peninsula, China) and Jangyeon-gun (Korea Peninsula) demarcation line (Figure 1). The water column in this area is vertically well mixed in winter and early spring, while it is stratified in summer in the BS and in both summer and autumn in the YS (Wei et al., 2020). A prominent hydrological feature of the YS is the Yellow Sea Cold Water Mass (YSCWM), which maintains thermal stratification during warm season. Long-term monitoring reveals concerning oxygen decline trends, with bottom water DO decreasing steadily in the BS and both surface and bottom waters showing reductions in the YS, which are principally driven by synergistic effects of ocean warming and intensified eutrophication (Wei et al., 2019; Zhai et al., 2019). DO dynamics in surface water demonstrate strong seasonal coupling with sea surface temperature (SST), exhibiting winter/spring maxima followed by pronounced summer/autumn minima (Zhao et al., 2017; Xiong et al., 2020; Zhang et al., 2022). Phytoplankton photosynthesis further regulates the saturation state of DO in surface water. Oxygen depletion preferentially develops in stratified deep zones during summer, where water column stability inhibits vertical oxygen replenishment (Zhai et al., 2019; Xiong et al., 2020). The miniaturization of phytoplankton community has amplified water column oxygen demand, exacerbating bottom hypoxia in the BS (Song et al., 2020; Wei et al., 2021). Meteorological forcing (wind intensity) and lateral transport further modulate the duration and intensity of oxygen depletion (Zhang et al., 2022). The YS experiences analogous oxygen depletion mechanisms, where the persistent YSCWM creates prolonged low-DO conditions in summer-autumn periods (Guo et al., 2020; Xiong et al., 2020).
Figure 1
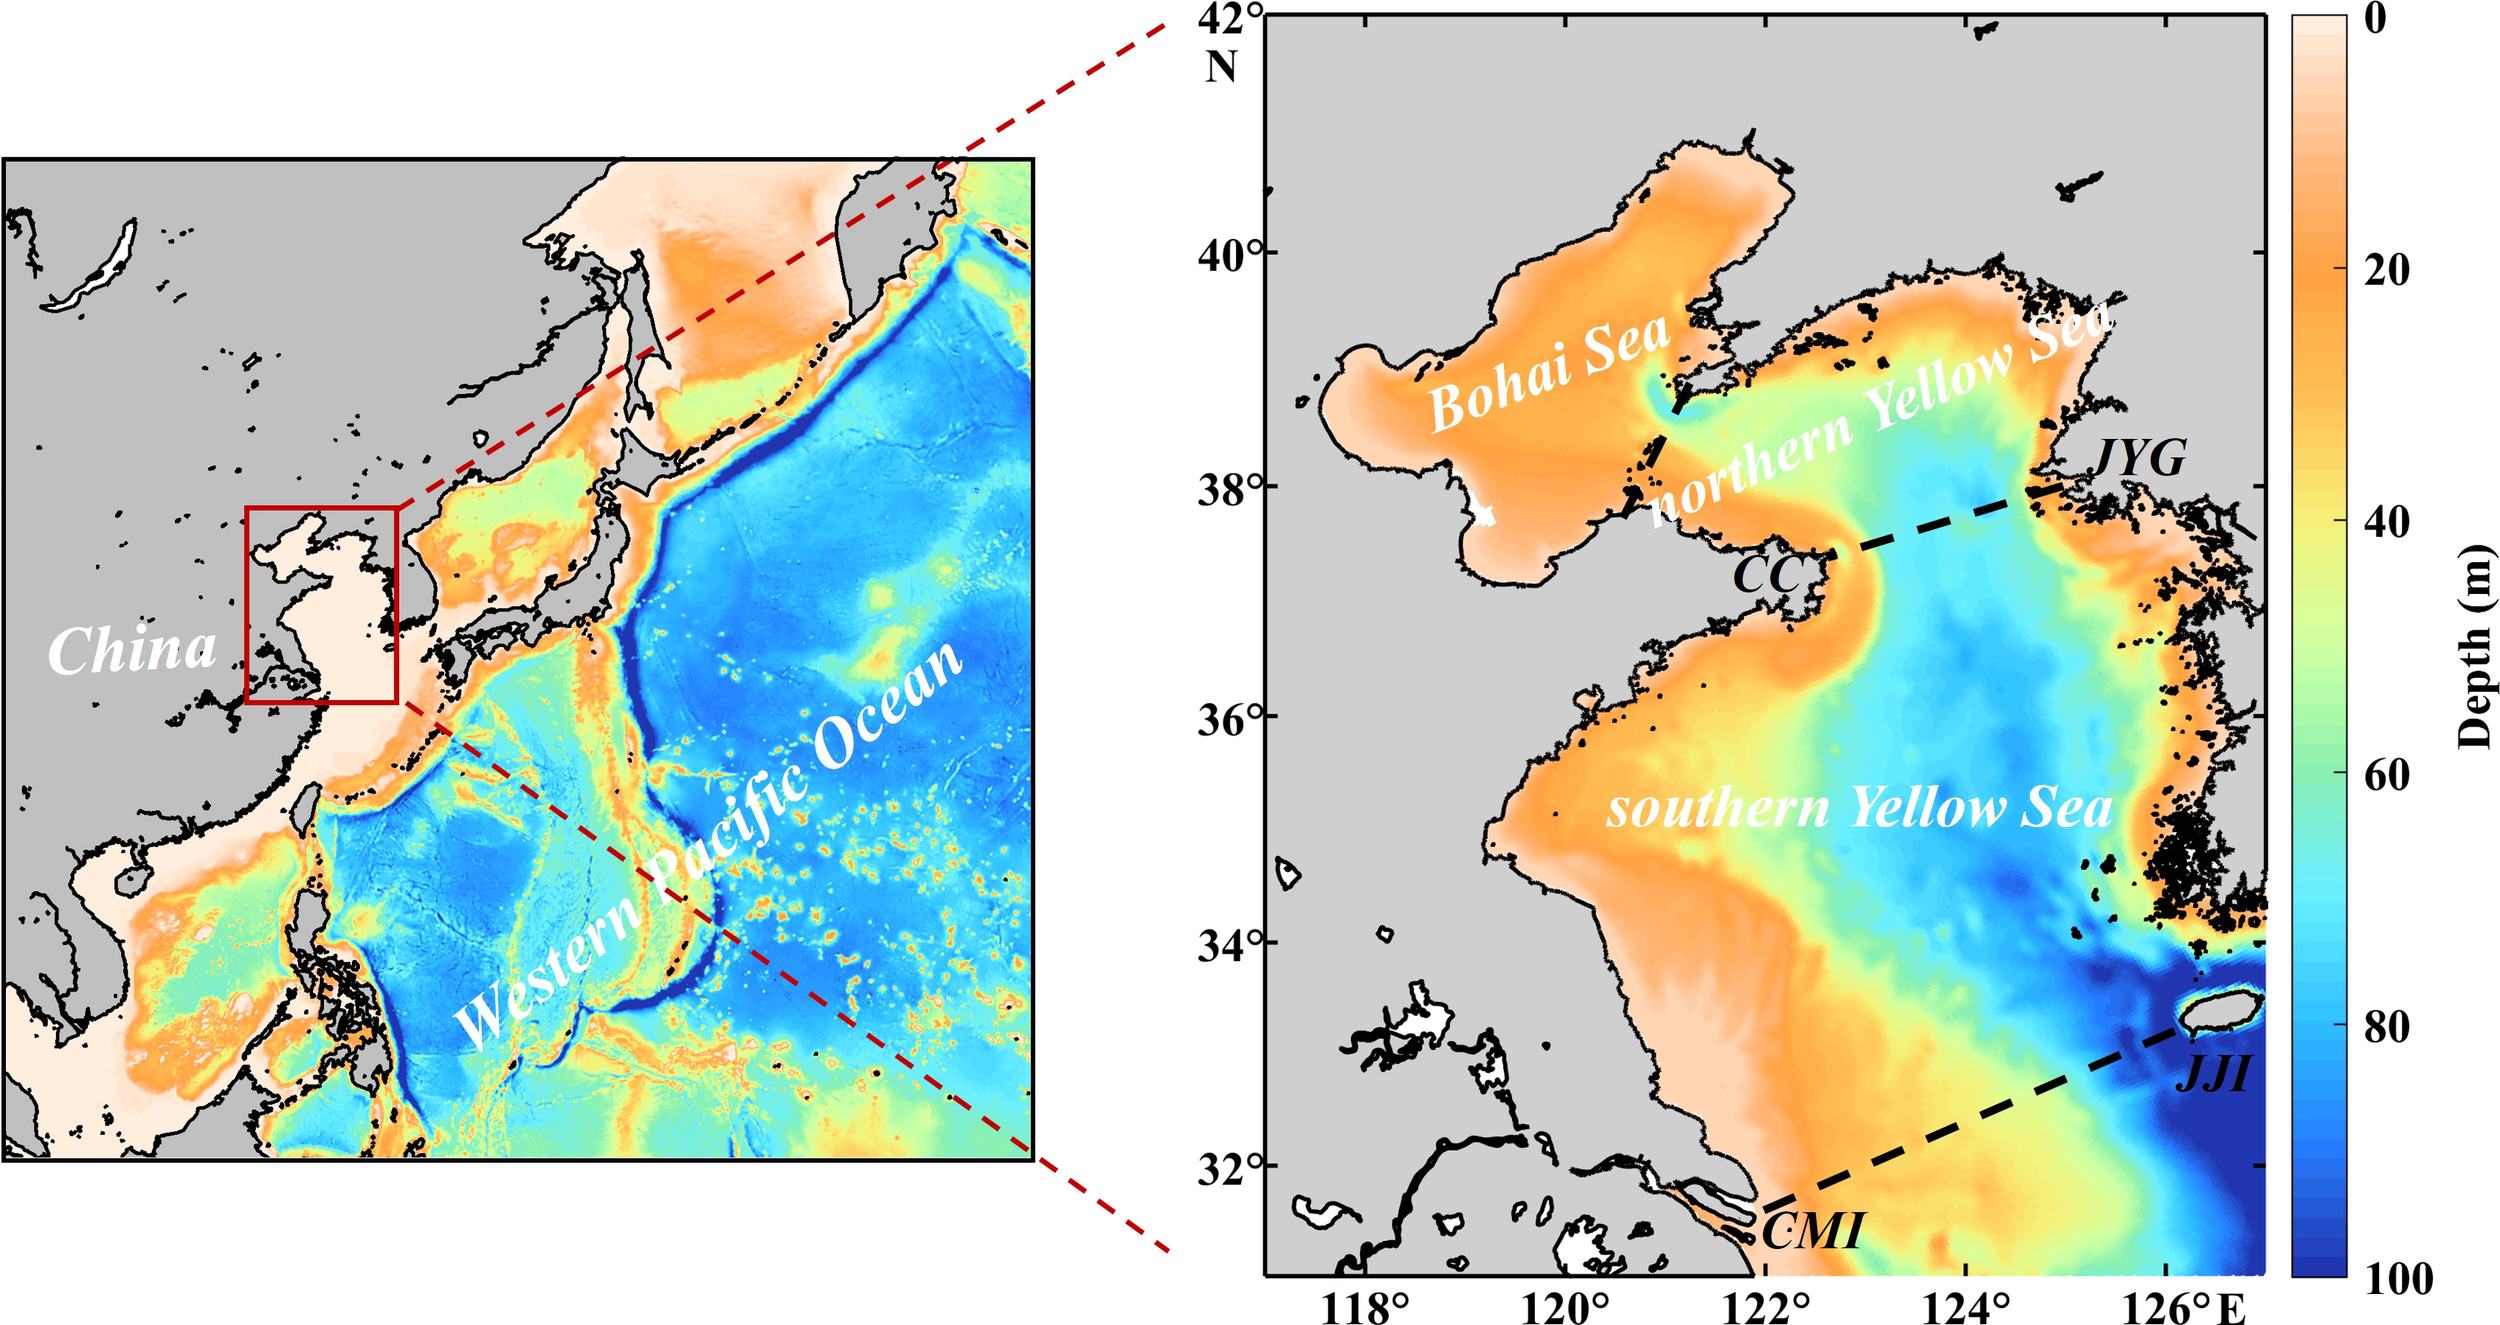
Bathymetry of the Bohai Sea (BS), northern Yellow Sea (nYS), and southern Yellow Sea (sYS). The black lines are the boundaries of the BS, nYS, and sYS. CC, JYG, CMI, and JJI denote Chengshan Cape, Jangyeon-gun, Chongming Island, and Jeju Island, respectively.
Owing to the constraints of in situ observational capabilities and the complexity of interacting among marine processes, previous studies have not comprehensively addressed the spatiotemporal dynamics of DO in both surface and bottom waters in the BS and YS. Consequently, fundamental aspects including seasonal DO variability and the quantitative contributions of competing physical versus biogeochemical processes remain poorly understood. Building on the efficacy of numerical modeling in oxygen dynamics research (Fennel et al., 2022), this study employs a coupled physical-biogeochemical model approach to (1) characterize the seasonal DO variations in the surface and bottom waters in the BS and YS, (2) quantify the relative contributions of the physical and biological processes to DO variabilities, and (3) critically evaluate the systematic biases in using AOU as a proxy for BOC in shallow shelf environments. Through this multidimensional analysis, we aim to establish a more robust framework for estimating BOC, and advance our mechanistic understanding of oxygen dynamics in temperate shelf ecosystems.
2 Materials and methods
2.1 Observation
Multi-year in situ observations of temperature, salinity, dissolved inorganic nitrogen (DIN), and DO concentrations were conducted in the BS and YS through successive cruises between 2009 and 2017 (Supplementary Table S1). Temperature and salinity were observed by a Seabird CTD (SBE19+/SBE911+). The [DO]s in the surface and bottom waters were determined using the Winkler titration method, with the uncertainty below 0.5%. Nutrients analyses (nitrate, nitrite, and ammonium) were performed using a QuAAtro auto analyzer (Seal Analytical, Germany), with DIN being calculated as the sum of nitrate, nitrite, and ammonium. The detailed description was published by Zhai et al. (2019).
2.2 Model description
This study employs a coupled physical-biogeochemical model, previously developed and validated for the BS and YS (Li et al., 2021; Zhang et al., 2022; Wang et al., 2023). The physical component of the model uses the Regional Ocean Modeling System (ROMS; Shchepetkin and McWilliams, 2005), configured with a horizontal resolution of 2.2−4.0 km to encompass the BS, YS and northern East China Sea. The model incorporates 30 vertical layers, with enhanced resolution near the surface and bottom to resolve boundary layer dynamics. The model is forced by wind stress along with heat and freshwater fluxes, derived from the ECMWF ERA-Interim dataset. Open boundary conditions for temperature, salinity, current and sea surface height are derived from the Hybrid Coordinate Ocean Model dataset, while the initial temperature and salinity fields are derived from the World Ocean Atlas 2013 (WOA13) dataset. The biogeochemical module, Carbon Silicate and Nitrogen Ecosystem (CoSiNE; Chai et al., 2002; Xiu and Chai, 2011), contains DIN (nitrate plus ammonium), phosphate, silicate, oxygen, two classes of phytoplankton (picophytoplankton, diatoms), zooplankton (microzooplankton, mesozooplankton) and detritus (nitrogen-containing detritus, silicon-containing detritus). Key oxygen-related biogeochemical processes explicitly resolved include phytoplankton primary production, zooplankton respiration, remineralization of organic detritus, nitrification and denitrification, are considered in the model. The controlling equation for DO (Equation 1) is expressed below:
where t is time, x and y denote the two horizontal directions, and z denotes the vertical direction. Velocities in the x, y, and z directions are represented by u, v and w, respectively. The horizontal and vertical diffusion coefficients are represented by Kl and Kv, respectively. PP is the oxygen production by net phytoplankton photosynthesis. BOC includes zooplankton respiration, detritus remineralization and nitrification. FDO represents the air–sea oxygen exchange flux. The first and second terms on the right-hand side of the equation represent oxygen advection and diffusion, respectively. The initial conditions and open boundaries of biological variables are derived from the Copernicus Marine Environment Monitoring Service dataset (https://marine.copernicus.eu/), except for initial nutrients and DO that are obtained from the WOA13 dataset. The model is integrated from 2006 to 2017, with the first two years (2006−2007) allocated for spin-up to minimize initialization shocks. To characterize the seasonal variability, climatological mean states of temperature, salinity and DO are derived from the 10-year averaged results (2008−2017).
2.3 Calculation of DO saturation, AOU, and stratification
DO saturation (DO%) is calculated as the ratio of the in situ [DO] to oxygen solubility, where solubility represents the theoretical equilibrium [DO] with the atmosphere and is computed from potential temperature and salinity (Garcia and Gordon, 1992). AOU is derived as the difference between the DO solubility and in situ [DO]. Water column stratification intensity is quantified using the squared Brunt-Väisälä frequency (N2) (Equation 2), calculated as
where g (9.8 m s−2) is the gravitational acceleration, ρ is the seawater density, and z is the water depth. Strong water column stratification, marked by a well-developed pycnocline, is identified when N2 exceeds 10−3 s−2 (Jackett and Mcdougall, 1995). During stratified season, the pycnocline is served as the boundary delineating the upper and lower mixed layers for oxygen budget calculations. In regions lacking pronounced stratification, the depth of N2 maximum is employed as the interface between these layers.
3 Results
3.1 Model validation
The simulated spatiotemporal patterns of temperature, salinity, DIN, and DO demonstrate strong agreement with in situ observations, as evidenced by comprehensive validation metrics and comparative analysis (Figures 2; Supplementary Figures S1–S6). Statistical evaluation using correlation coefficients (r), cost function (CF), and root mean square error (RMSE) confirms the model’s robust performance in capturing key biogeochemical dynamics. The simulation achieves accuracy spatiotemporal distribution of temperature with r, CF, and RMSE being 0.96, 0.21, and 0.28°C, respectively, and effectively reproducing the south-north decline in winter, and the distinct inshore-offshore temperature gradient in summer. The model successfully resolves the formation and distribution of the deep cold water mass in the mid BS and YS. The model also reproduces low salinity in summer and near the estuary due to freshwater input, with r, CF, and RMSE of 0.82, 0.62 and 0.87, respectively.
Figure 2
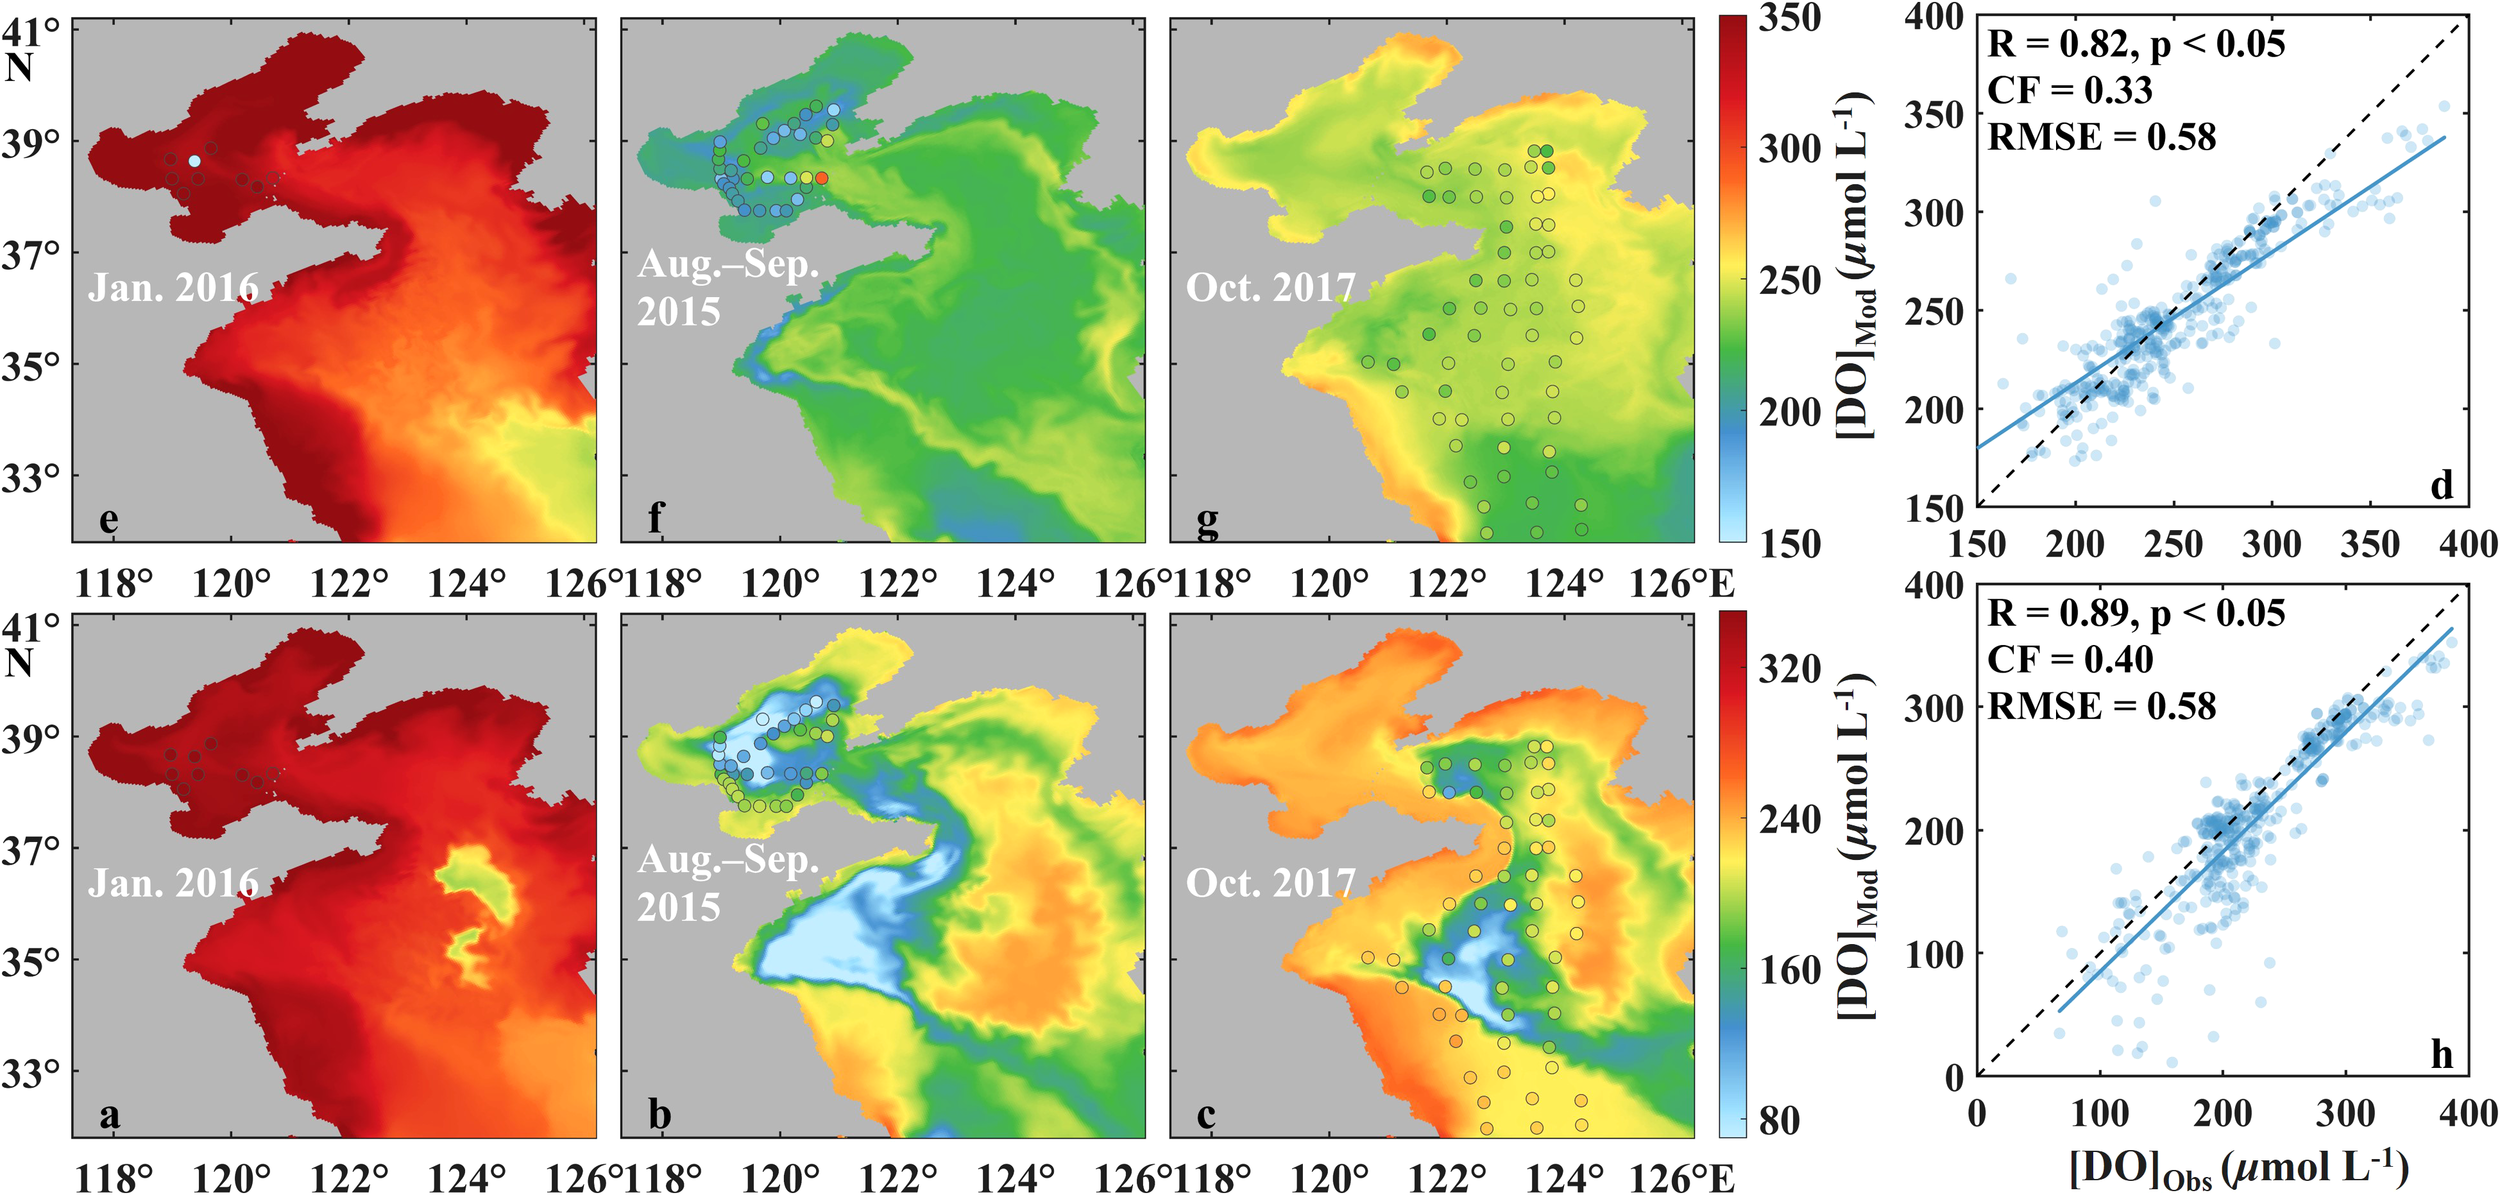
Comparison of modeled [DO]s (colored map) with their corresponding in situ observed [DO]s (discrete points) in January 2016 (a, e), August to September 2015 (b, f), and October 2017 (c, g) in the surface and bottom waters of the BS and YS, and scatter plots of the modeled versus all in situ observations as shown in Supplementary Table S1(d, h). In panel (d, h), the black dashed lines are the 1:1 lines, and the blue lines are the linear regressed lines.
The model effectively characterizes the biogeochemical dynamics of DIN and DO, demonstrating strong consistency with observational patterns (Figure 2). The simulation (r = 0.71, CF = 0.80, and RMSE = 1.06 μmol L−1) successfully resolves two critical features for DIN distributions: the estuarine enrichment with progressive offshore decline, reflecting riverine nutrient input; and the distinct seasonal variation showing surface layer minima in spring-summer and maxima in autumn-winter. This dual-scale pattern aligns with observed nutrient dynamics driven by seasonal variations in riverine discharge, phytoplankton uptake, and vertical mixing processes. The model (r = 0.89, CF = 0.40, RMSE = 0.58 μmol L-¹) also accurately reproduces both spatial heterogeneity and seasonal variability of DO. The simulation captures high DO in surface and bottom waters during winter, contrasting with summer-autumn depletion patterns of the bottom waters. Notably, the model reproduces the oxygen-deficient zones in the central BS and western YS.
3.2 Seasonal variations of temperature and salinity
The results reveal that SST and sea bottom temperature (SBT) follow synchronized monthly variation pattern. The minima of SST and SBT are equivalent in the BS, northern YS (nYS), and southern YS (sYS), which occurs in February, with the values of 1.4°C, 3.0°C, and 6.6°C, respectively (Figures 3a–c), demonstrating completely vertical mixing under winter monsoon forcing. SST overall peaks in August and exceeds 25°C, whereas SBT maxima lag until September, being 22.7°C in the BS, followed by 16.9°C in the nYS and 16.2°C in the sYS. Obvious difference between SST and SBT occurs from May to September in the BS, whereas it is from March to November in the YS, consistent with previous studies (Zou et al., 2000; Wei et al., 2020). Meanwhile, significant cold water masses exist in the middle BS in summer and the YS in summer and autumn, with stratified regions almost coinciding with them (Supplementary Figures S7, S8).
Figure 3
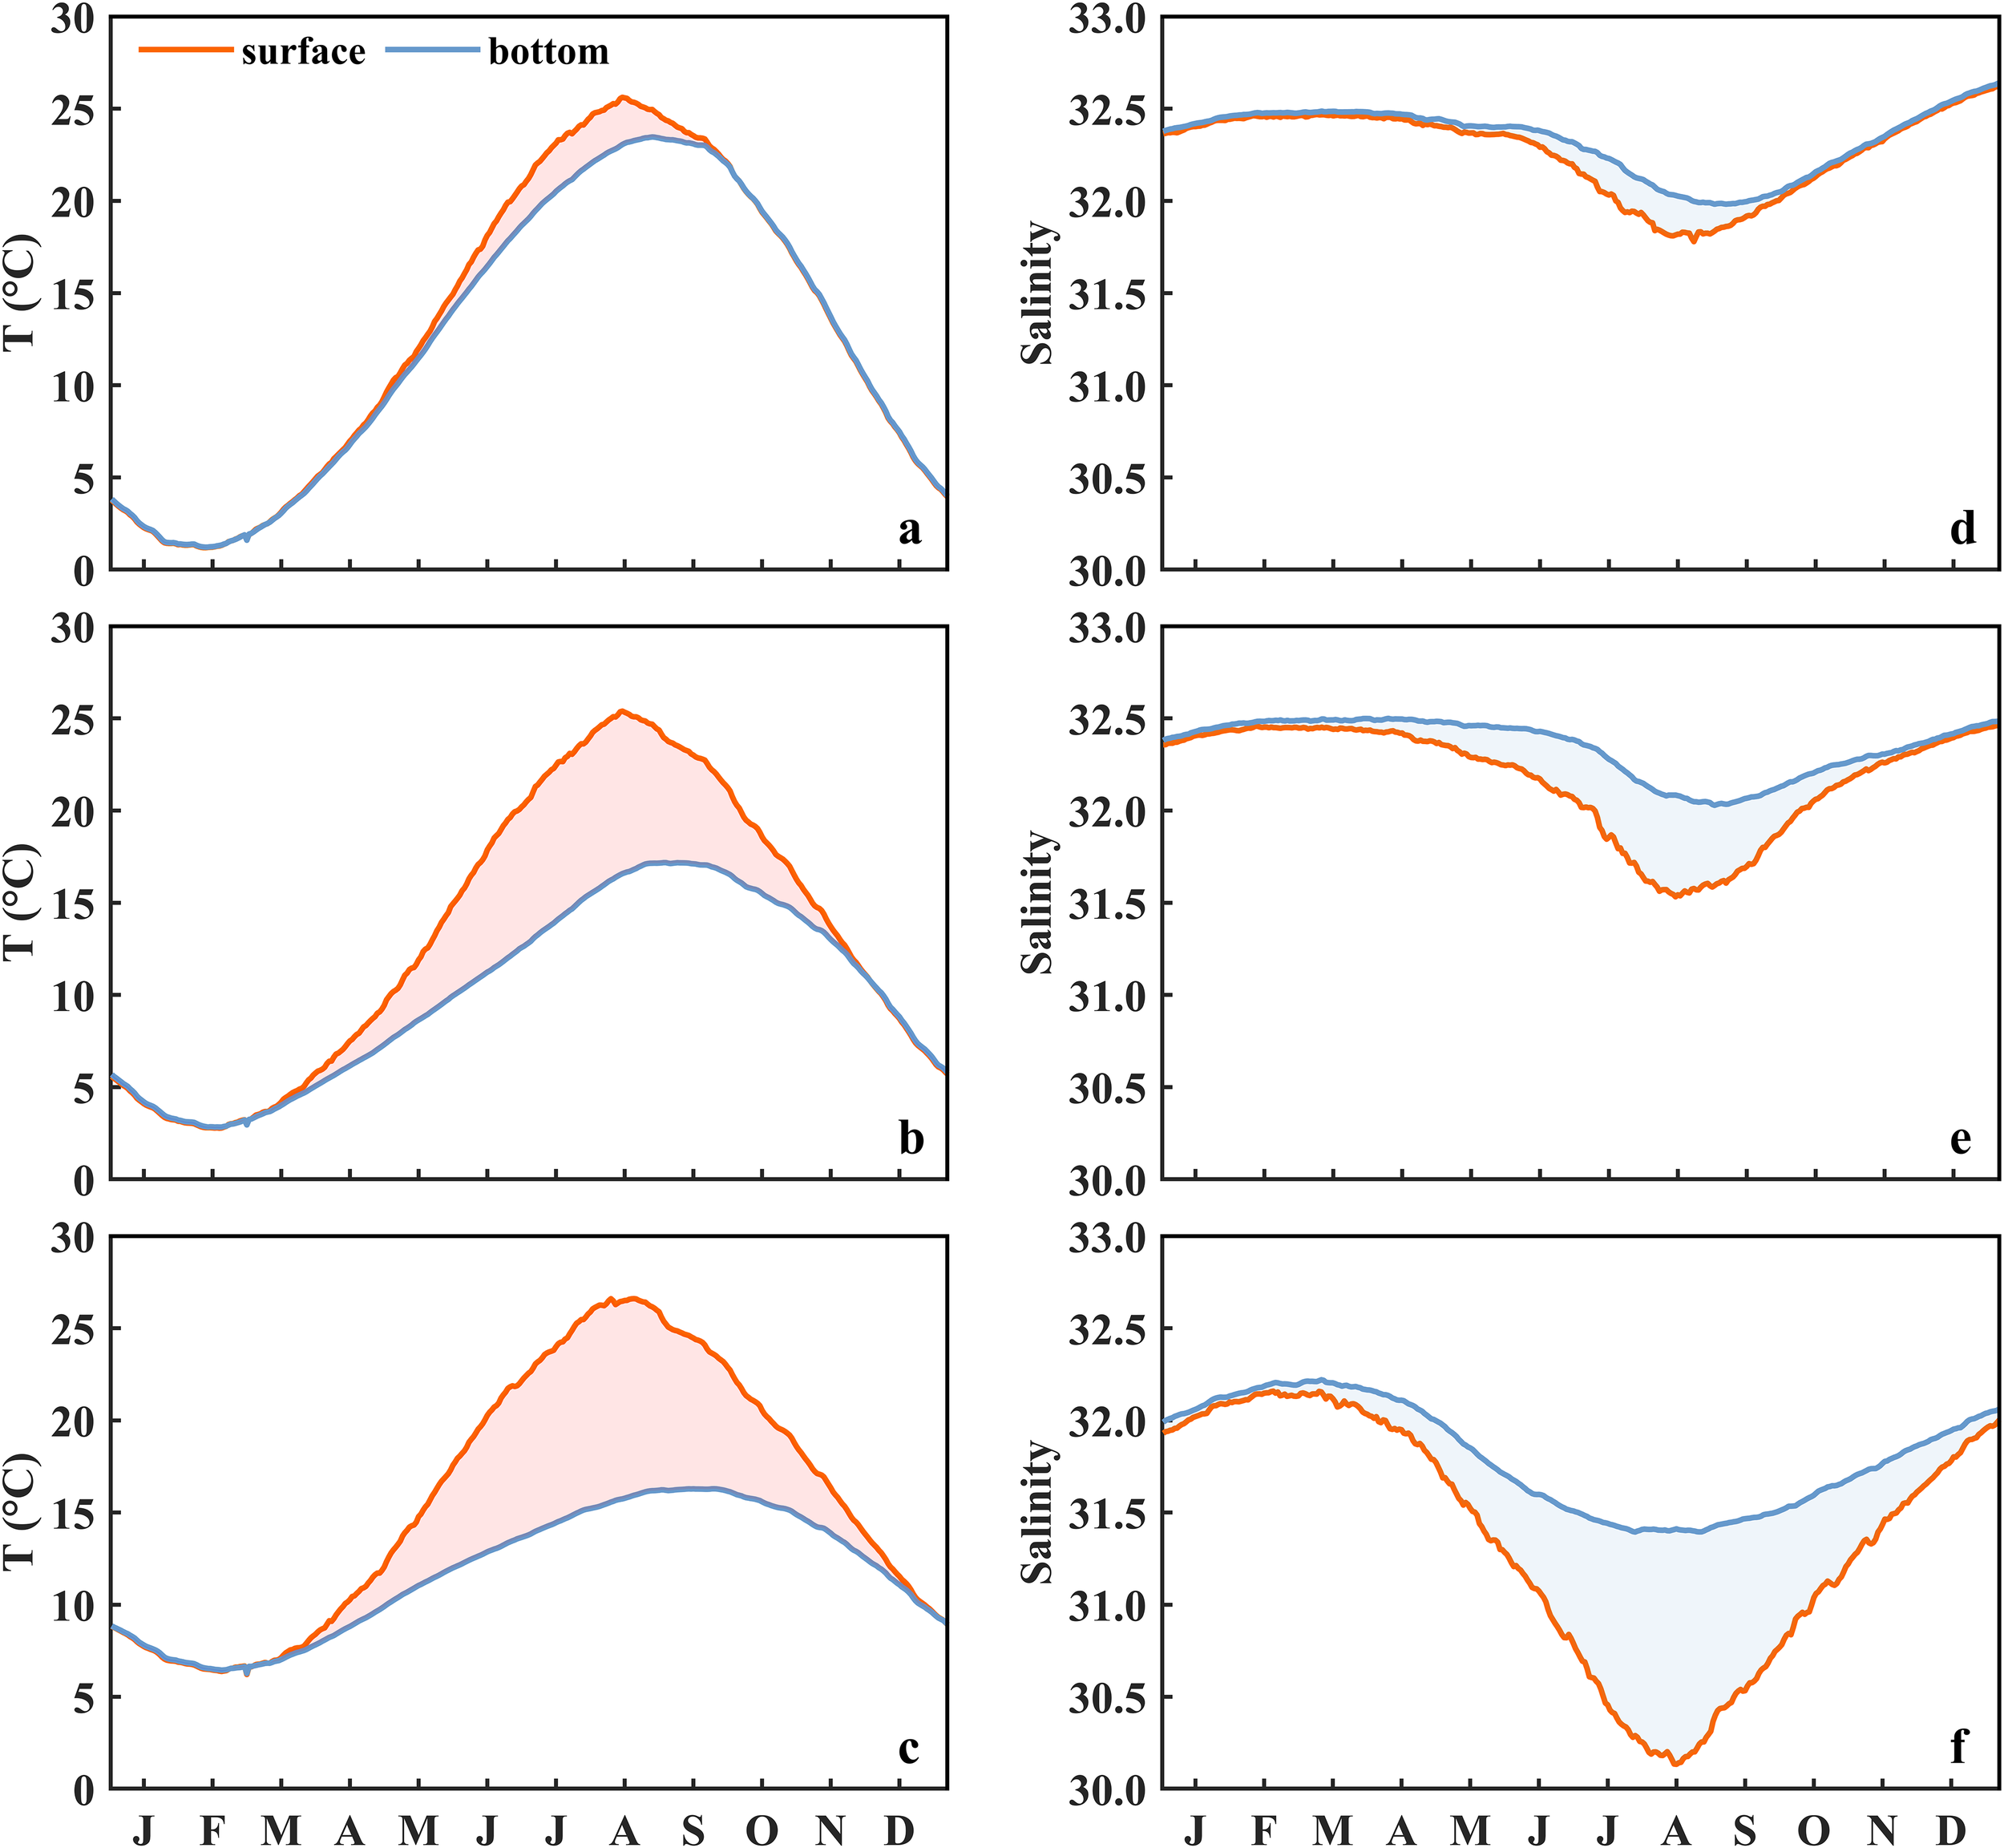
Temporal variations of daily average temperature and salinity in the surface and bottom waters in the BS (a, d), nYS (b, e), and sYS (c, f). The shadings represent the temperature and salinity discrepancies between surface and bottom waters.
Sea surface and bottom salinity (SSS and SBS) in the BS and YS show inverse temporal variations relative to SST and SBT, with the mean values higher in winter and lower in summer (Figures 3d–f). Associated with relatively higher precipitation and river discharge during summer, the minima of salinity occur in August in the surface layer, with the mean values of 31.8 in the BS, 31.6 in the nYS, and 30.2 in the sYS, respectively. Spatially, the salinity indicates low values near the estuaries both at the bottom and the surface, whereas the diluted water spreads further at the surface (Supplementary Figures S9, S10).
The water column is vertically well mixed in winter and spring in both the BS and YS. Strong stratification (N2 > 10−3 s−2) is established from early June to late August in the BS. The duration of stratification status in the YS is much longer than that in the BS, which begins in late April and disappears in November (Supplementary Figure S11). The cold water masses are consistent with the stratified region indicating that the substantial vertical difference of temperature is the primary factor leading to stratification (Tu, 1992).
3.3 Seasonal variation of DO
Surface and bottom [DO]s in the BS and YS possess pronounced seasonal variations (Figures 4a–c), which exhibit an inverse relationship with water temperature (Figures 3a–c). During the period of October to April in the BS and December to March in the YS, low temperature combined with vigorous vertical mixing maintain relatively high and uniform [DO] throughout the water column. The maximum [DO]s in the water column occur in March, reaching 352.6 μmol L−1 in the BS, 332.7 μmol L−1 in the nYS, and 303.2 μmol L−1 in the sYS, respectively. The establishment of vertical stratification commencing in late spring initiates a progressive oxygen decline in both surface and bottom waters until reaching the minima in August, with the values of 210.7 μmol L−1, 222.1 μmol L−1, and 216.2 μmol L−1 in the surface waters in the BS, nYS, and sYS, and 173.9 μmol L−1, 206.9 μmol L−1, and 183.0 μmol L−1 in the corresponding bottom waters, respectively. During this period, the [DO] in the surface water is consistently higher than that in the bottom water, with the maximum difference of 36.8 μmol L−1 in August in the BS, followed by 33.2 μmol L−1 in the sYS and 14.2 μmol L−1 in the nYS in September. The lowest [DO] in the surface water locates in the central YS, whereas, in the bottom water, it occurs in the central BS and western YS (Figures 5, 6), being considered as the oxygen depleted zones.
Figure 4
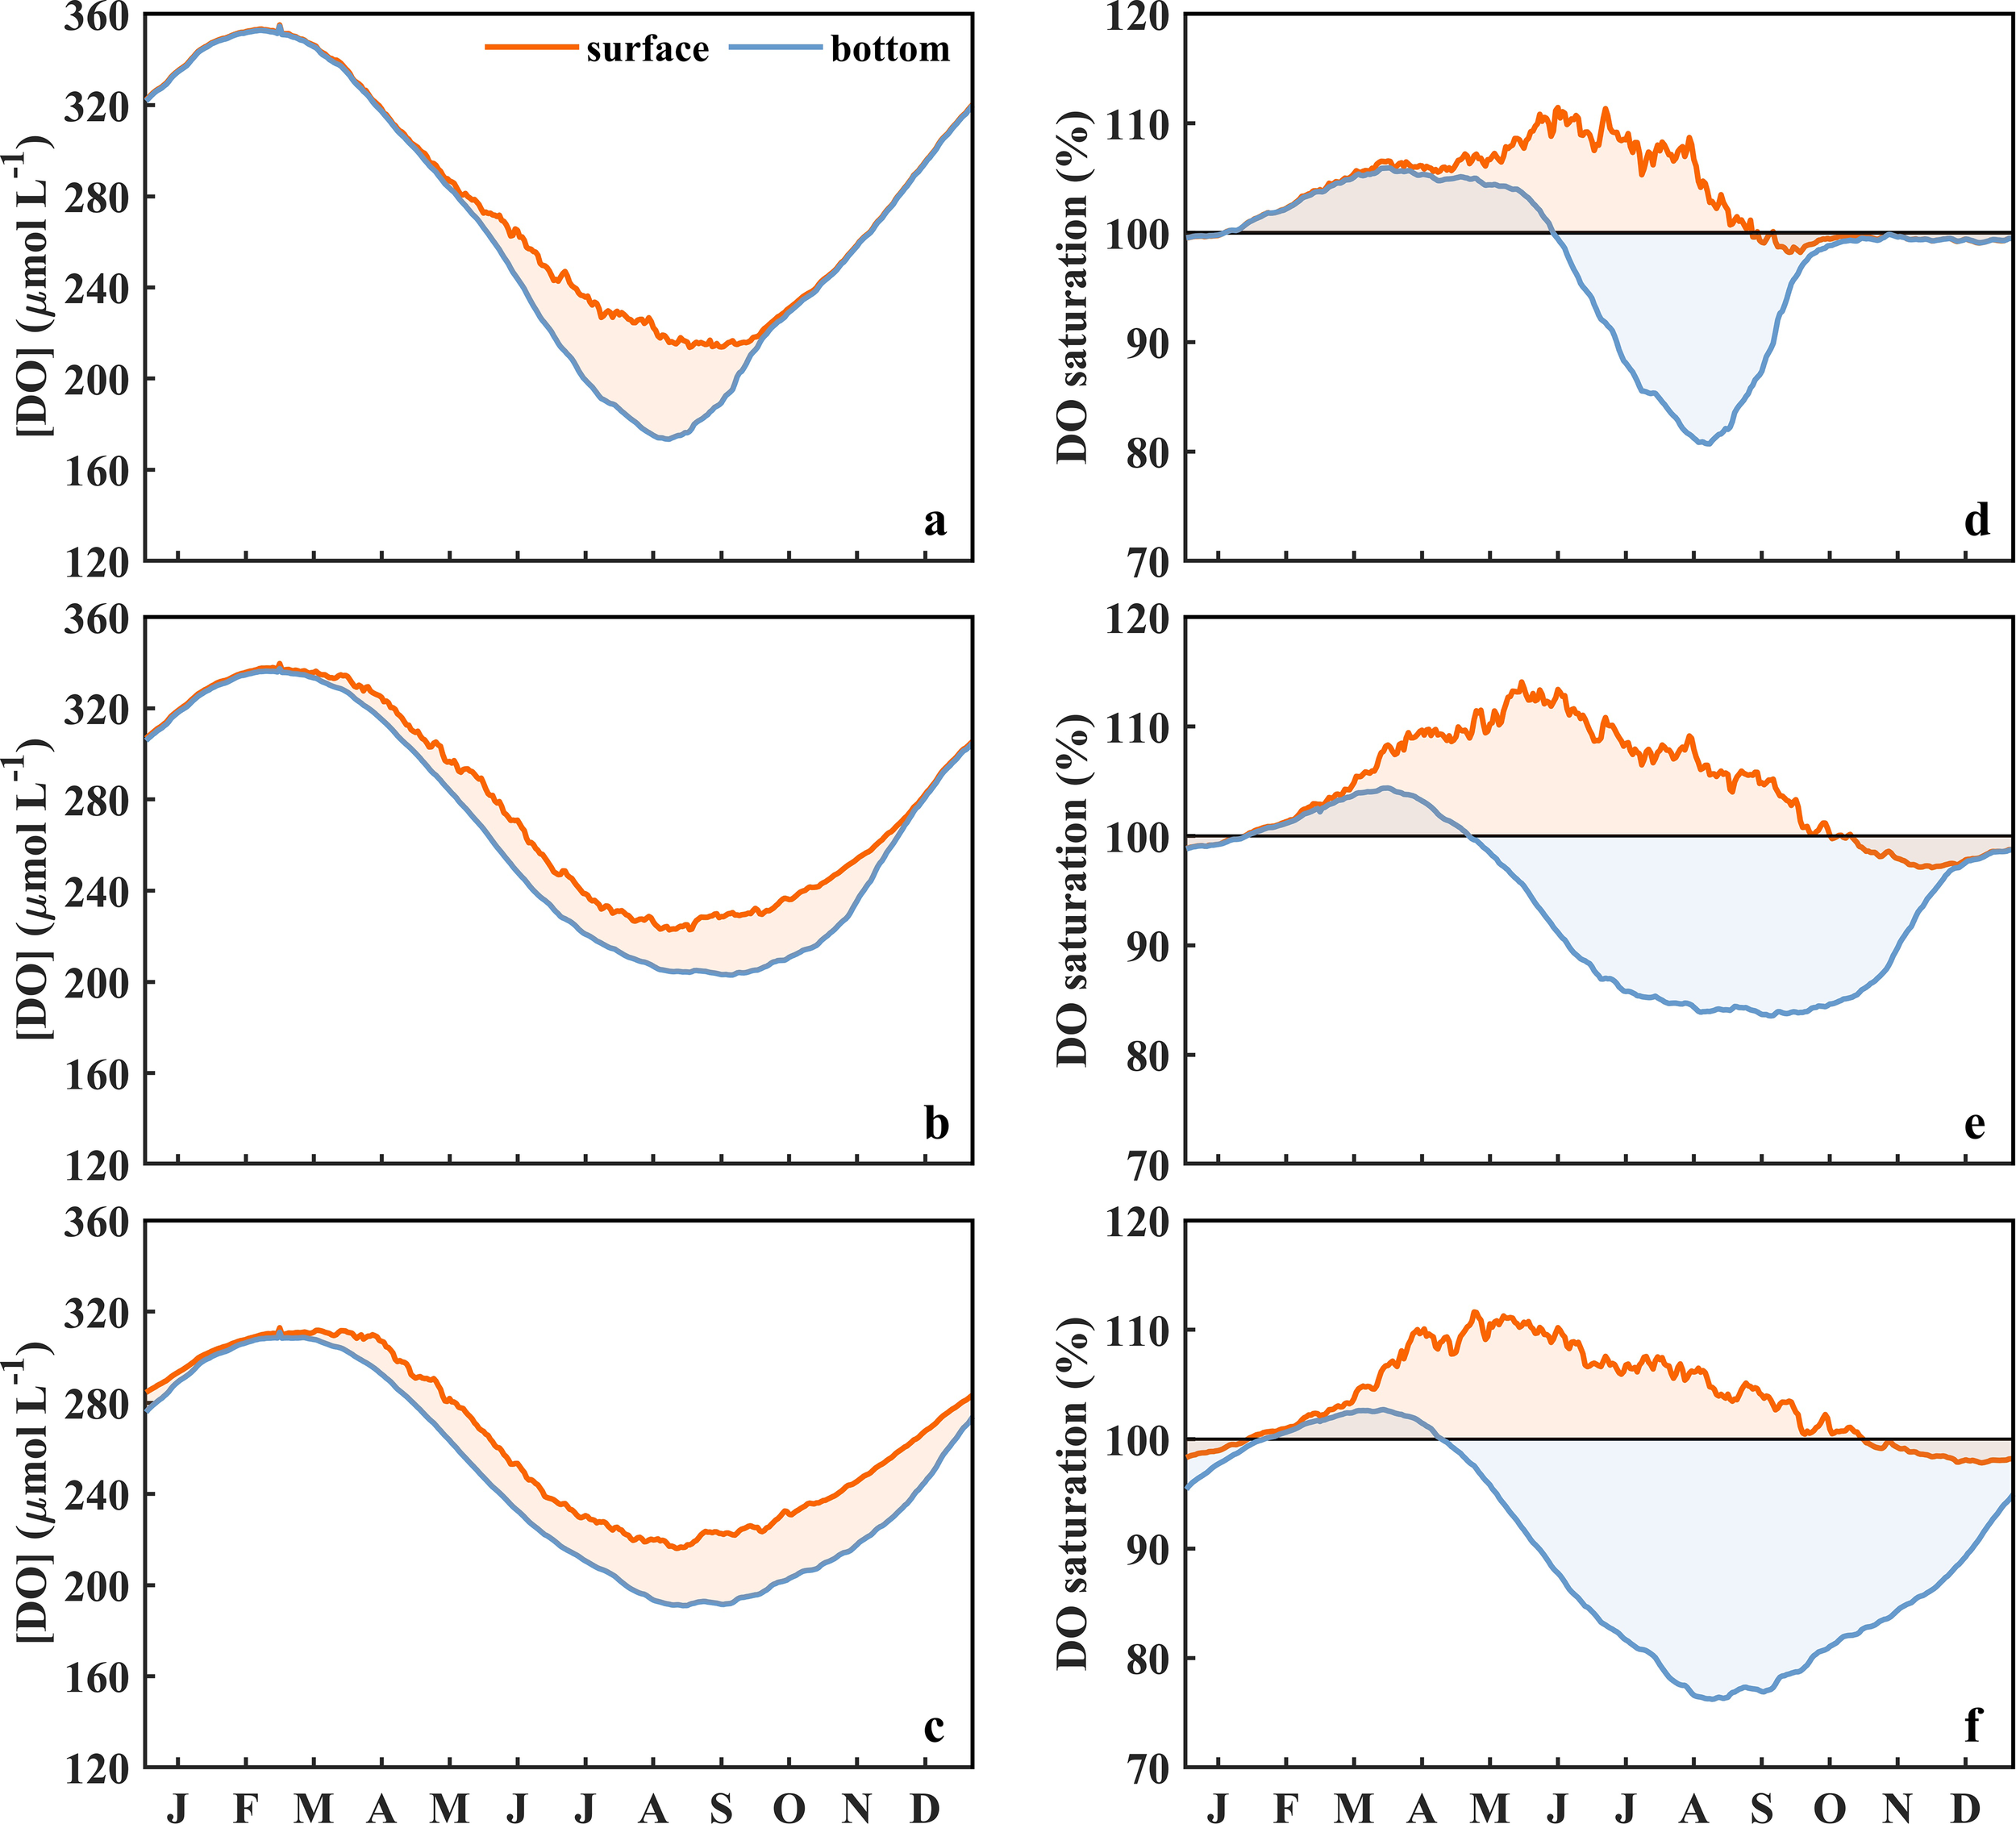
Temporal variations of daily average [DO] and saturation degree in the surface and bottom waters in the BS (a, d), nYS (b, e), and sYS (c, f). The black horizontal lines in panels d–f indicate the saturation degree of 100%. The shadings represent the discrepancies of the [DO] (a–c) and saturation degree (d–f) between surface and bottom waters.
Figure 5
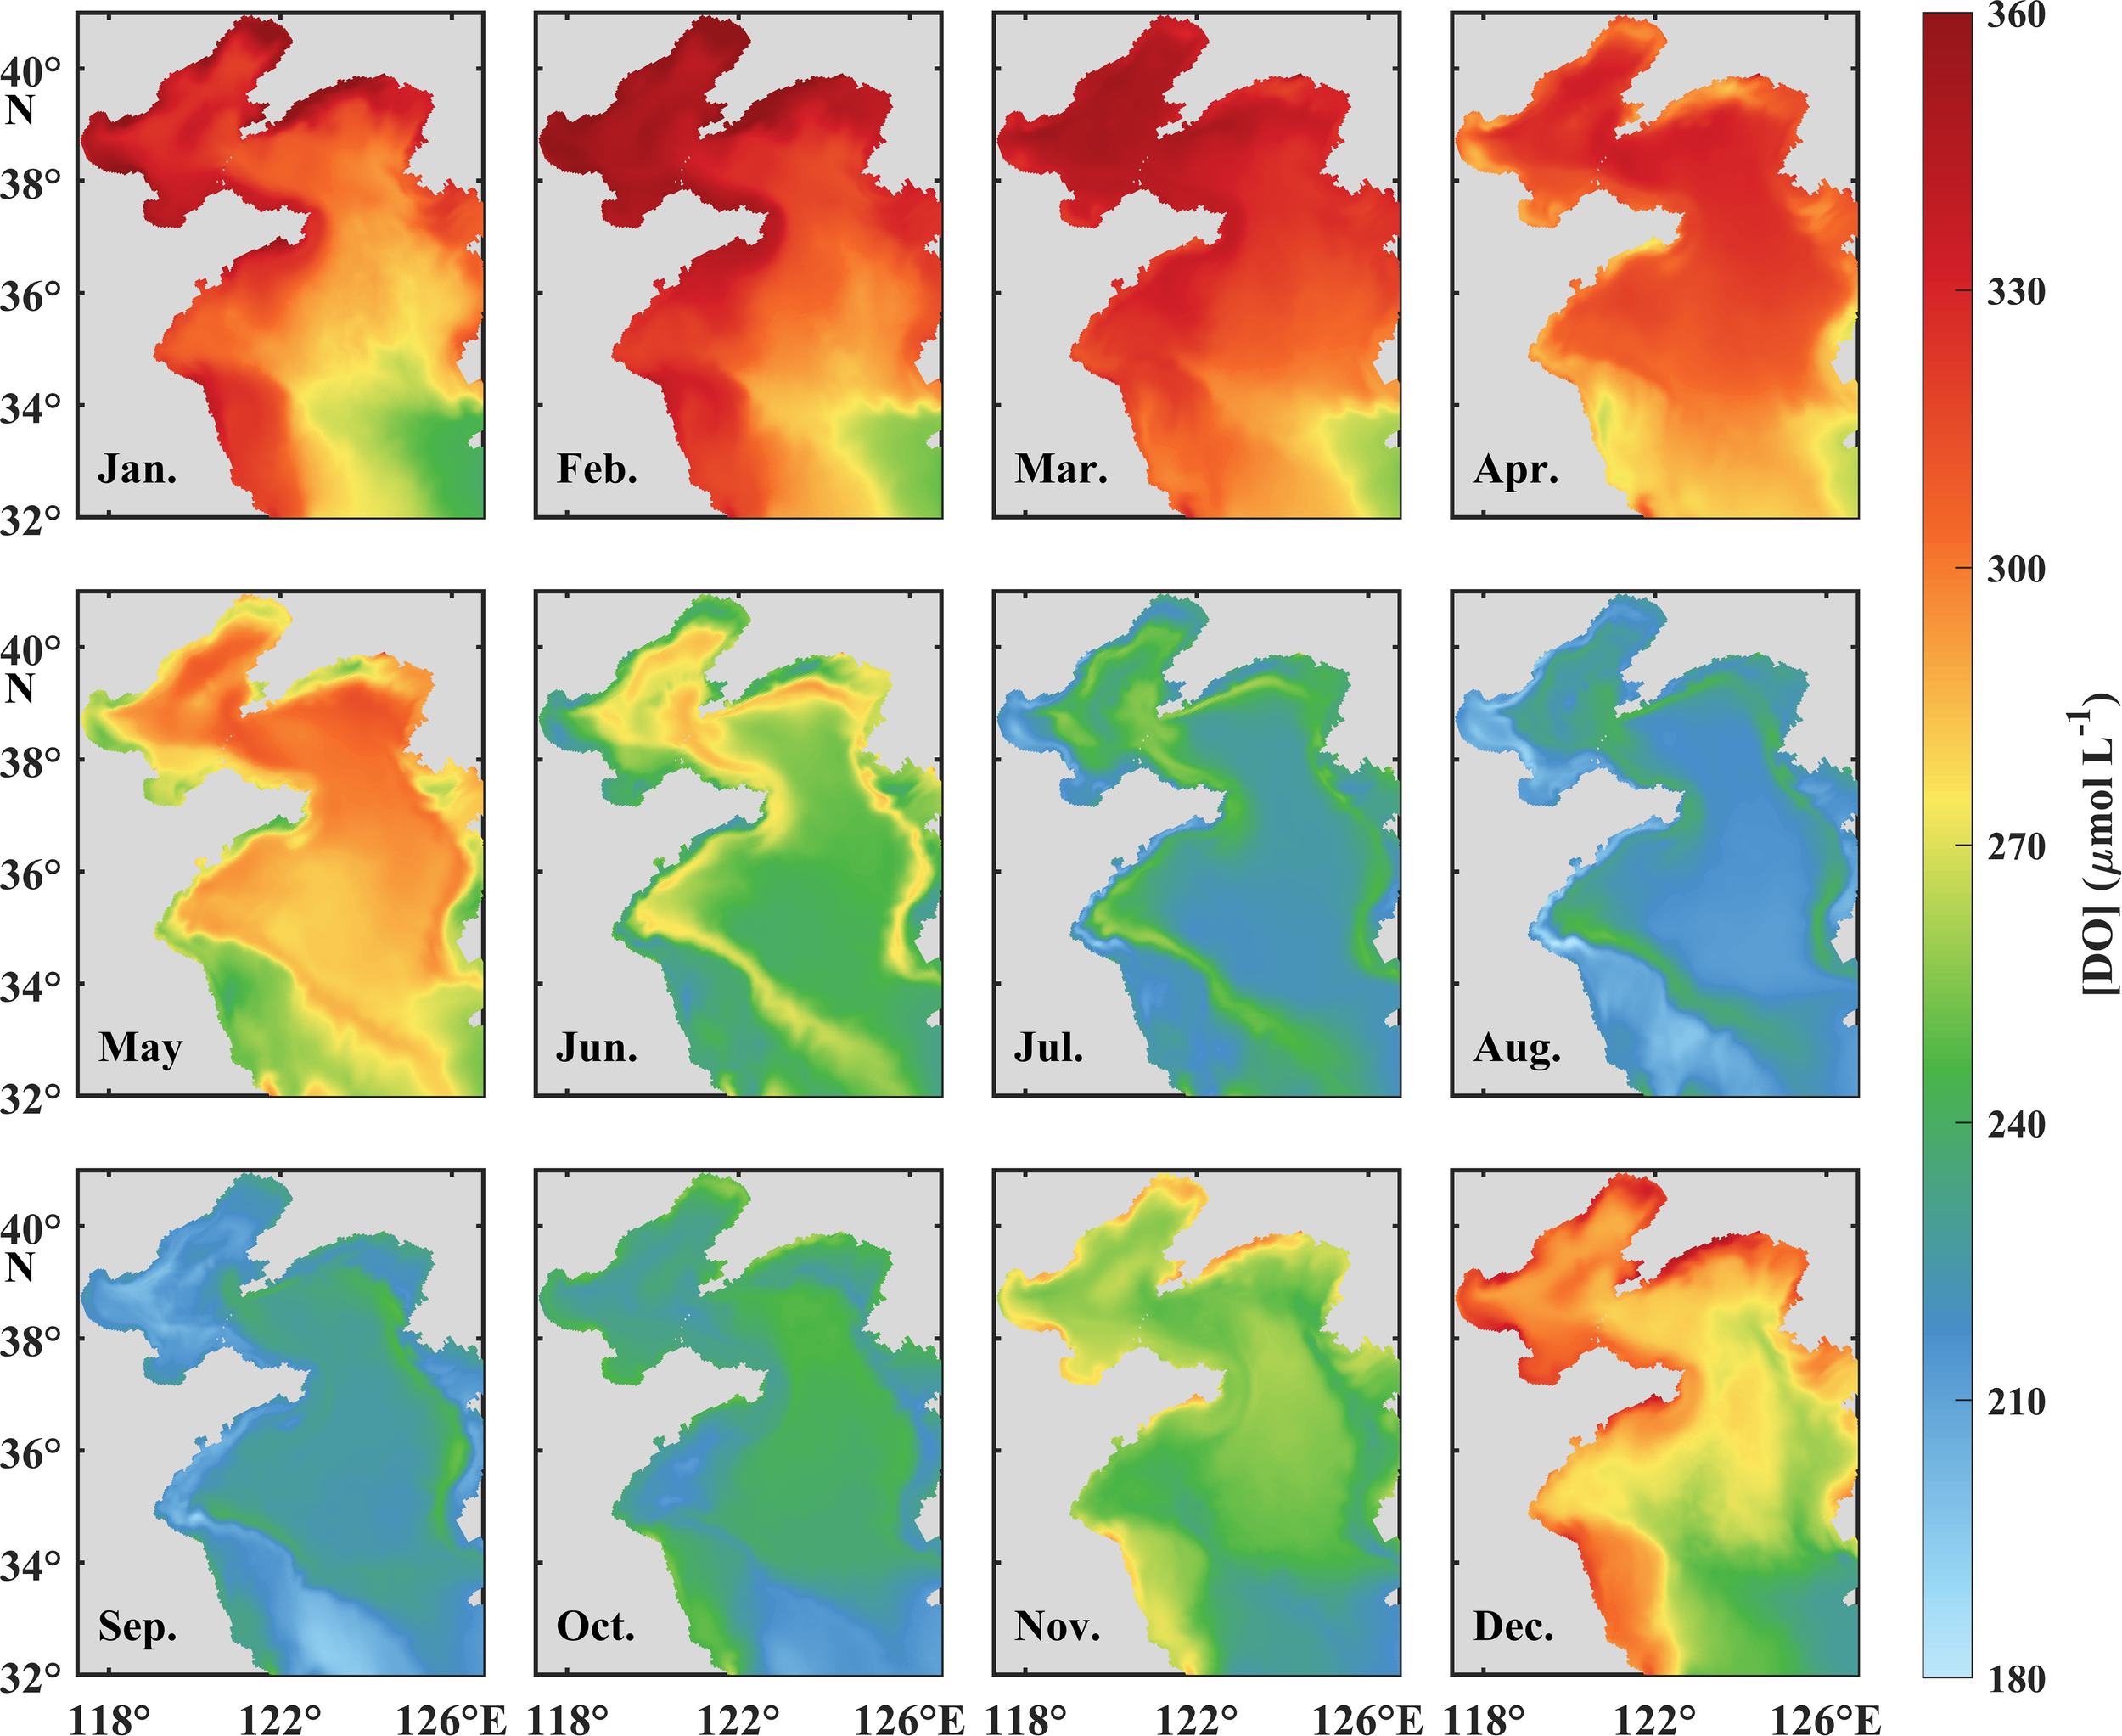
Monthly mean surface [DO]s in the BS and YS from January to December.
Figure 6
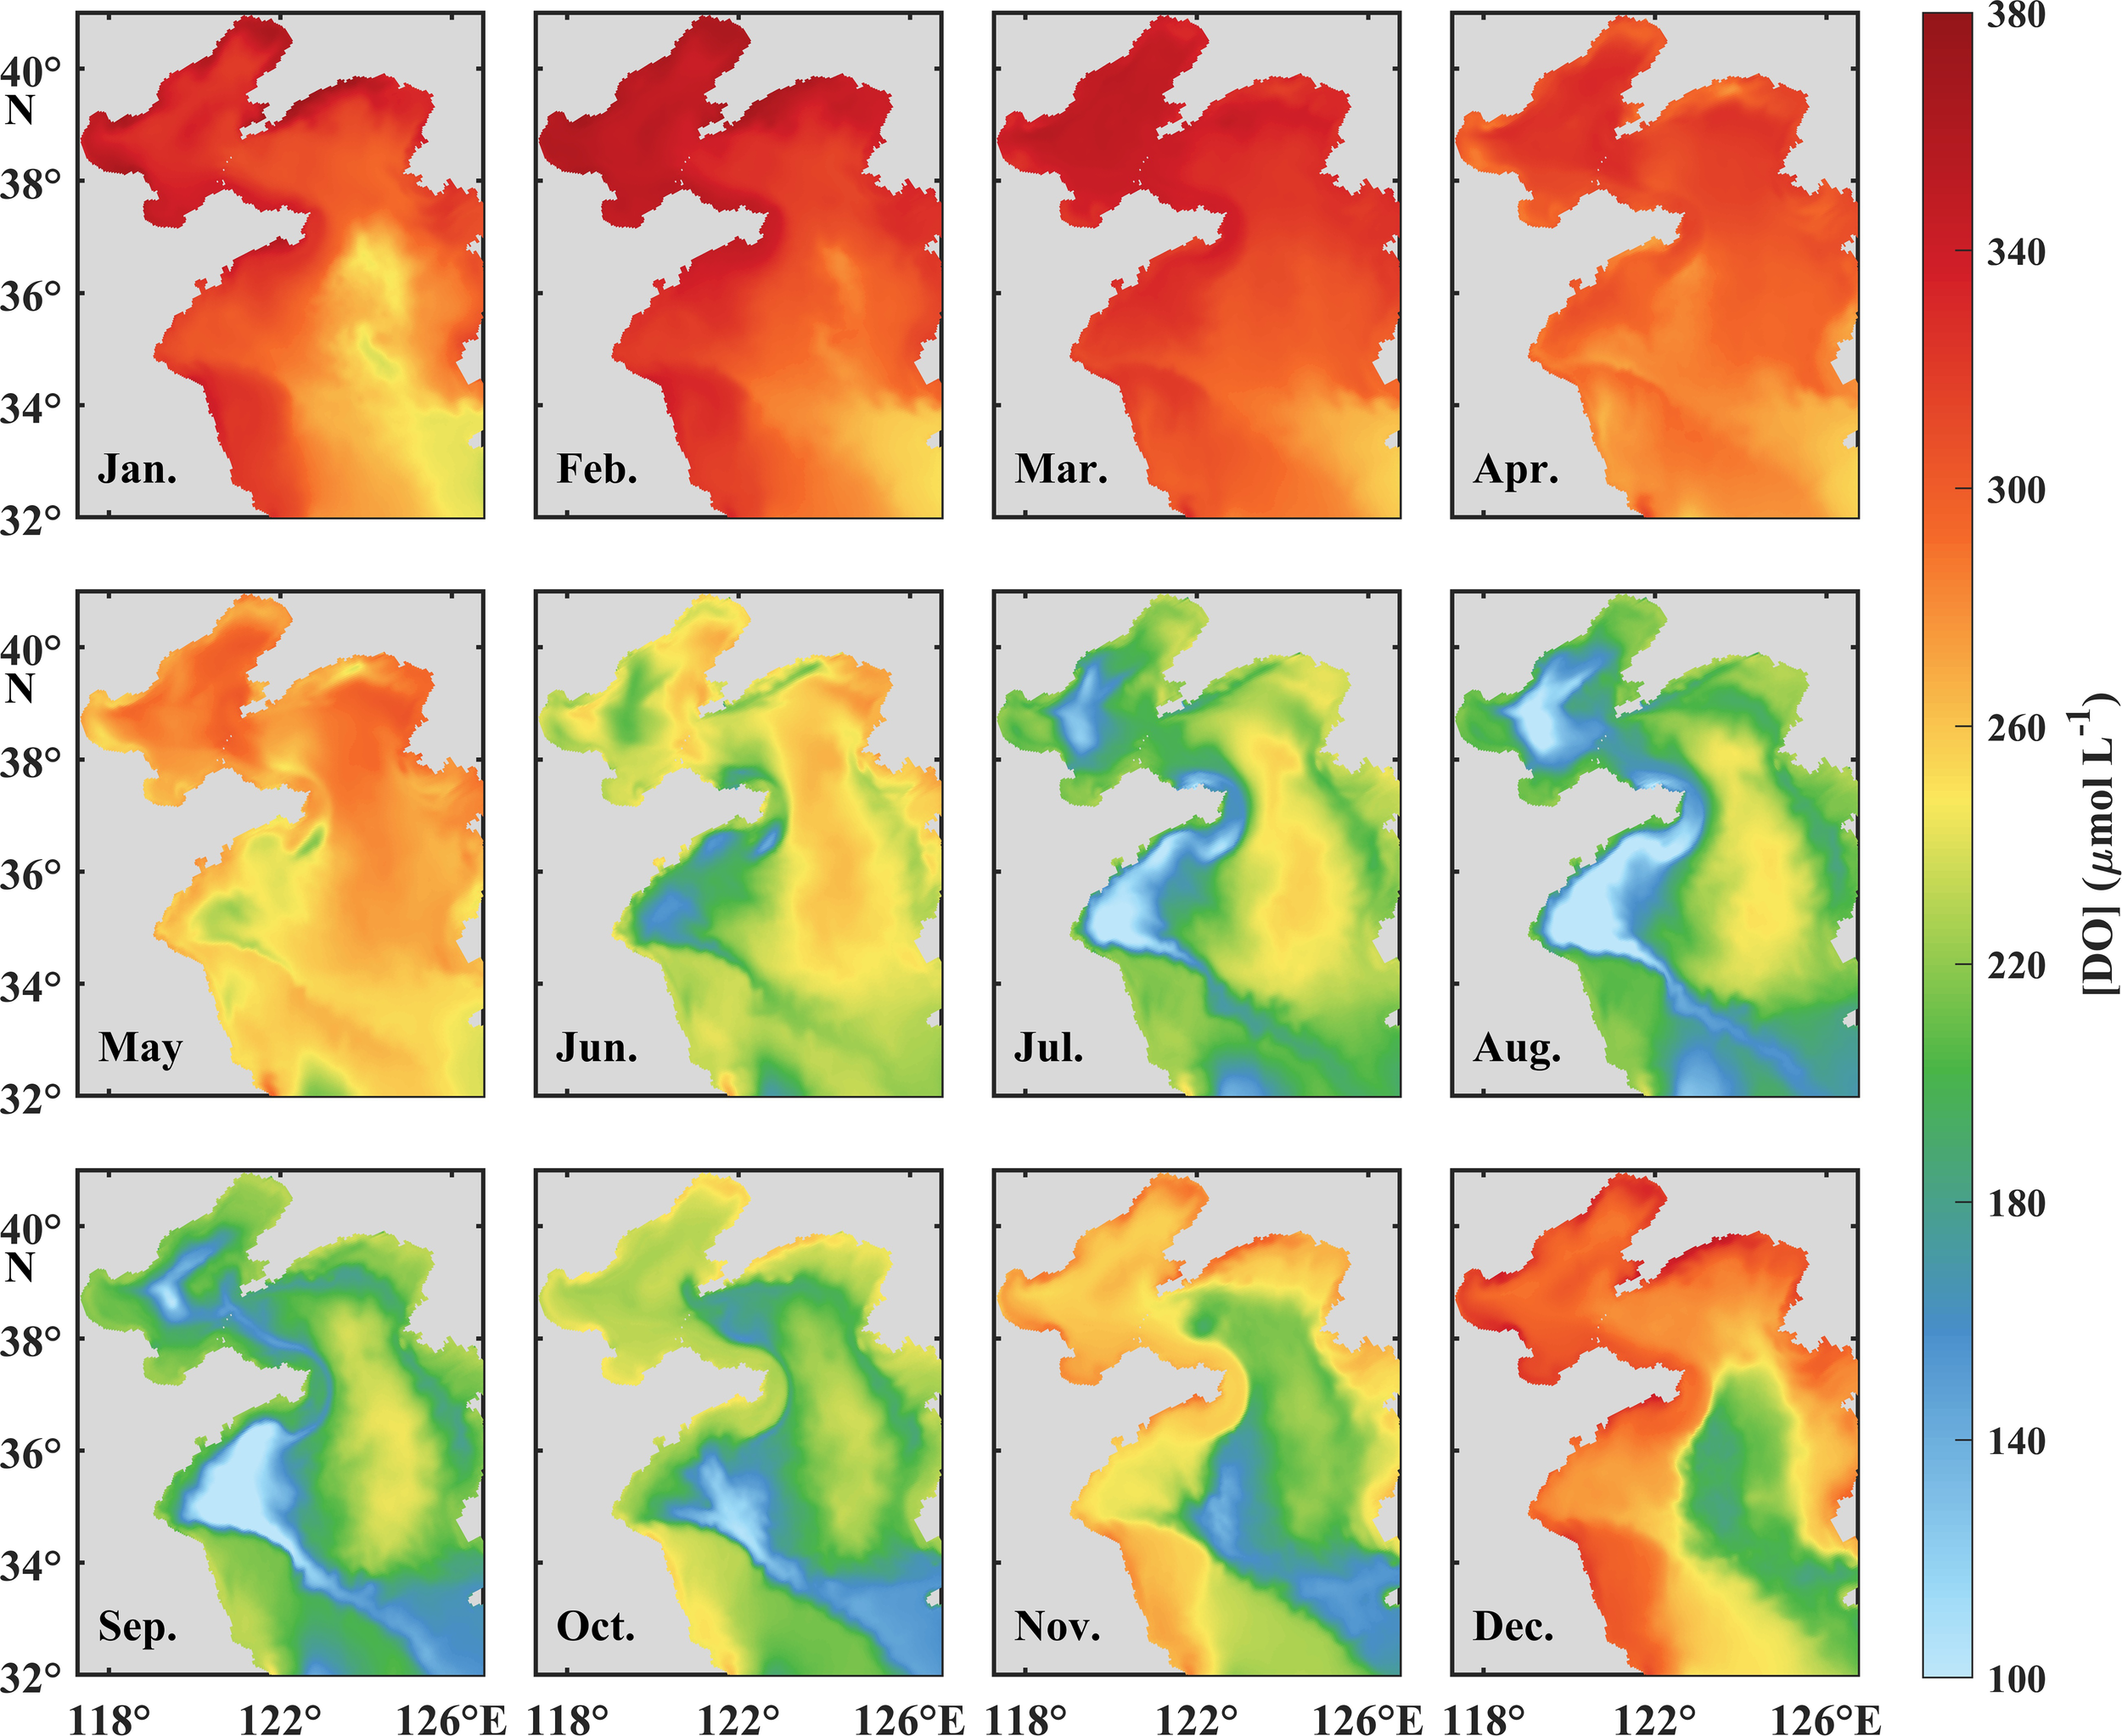
Monthly mean bottom [DO]s in the BS and YS from January to December.
The DO% in the surface and bottom layers exhibits fundamentally distinct seasonal variations (Figures 4d–f). Surface DO is obviously supersaturated in spring and summer, transitioning to near equilibrium (98%−100%) in autumn and winter. The supersaturation initiates from February and reaches maximum DO% (>110%) in May to June in the YS and June to July in the BS. Spatial analysis reveals an extended supersaturation duration exceeding 300 days in shallow coastal regions, contrasting with 260 days in the central YS and 240 days in the central BS (Figure 7a). The bottom DO% is comparable to the surface in spring before developing stratification, while prominent undersaturation occurs from June to late September in the BS and from April to December in the YS. The minimum DO% in the bottom water occurs in August, with the values of 80%, 85%, and 73% in the BS, nYS, and sYS. Chronic undersaturation persists over 300 days in the central sYS and shorter durations in the central nYS and BS (Figure 7b). The results demonstrate a more persistent oxygen depletion in the YS than that in the BS but a relatively lower [DO] in the BS (Figure 4).
Figure 7
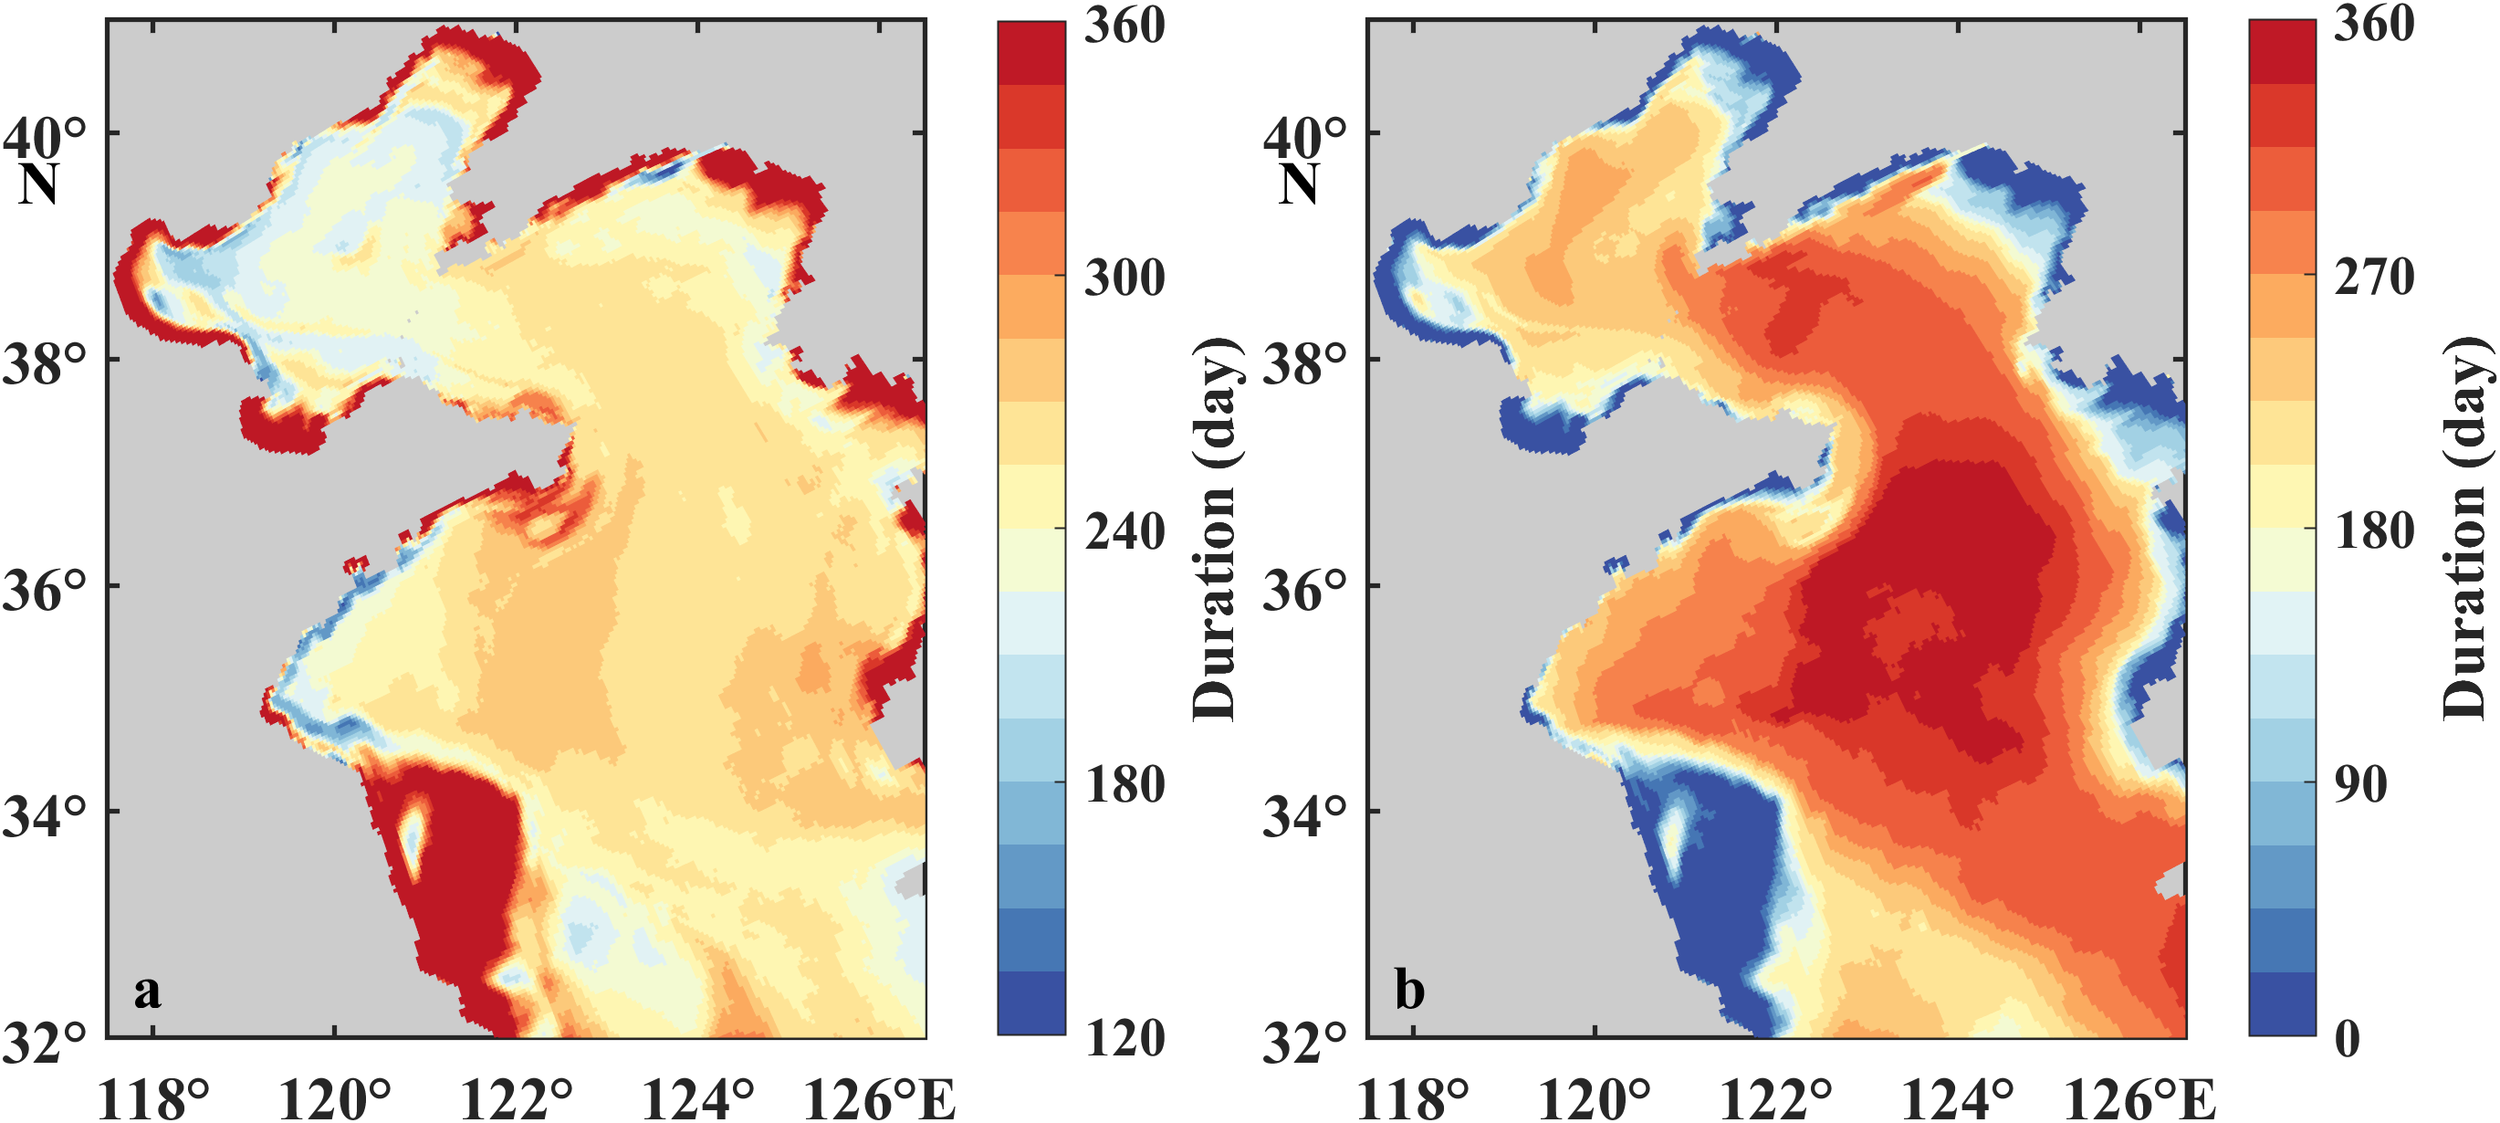
Duration of supersaturation in the surface water (a) and undersaturation in the bottom water (b) of the BS and YS.
4 Discussions
4.1 Factors in controlling surface DO
The significant negative relationship between the [DO] and SST (R2 = 0.96) demonstrates that SST is the primary driver of seasonal [DO] variation in surface seawater (Figures 3a–c, 4a–c), consistent with previous statistical analyses (Kim et al., 2020; Chen et al., 2022b). The thermal regulation primarily operates through temperature-dependent solubility that mediates air–sea oxygen exchange. Specifically, during the continuous autumn-winter cooling season (Figures 3a–c), enhanced oxygen solubility results in persistent undersaturation (Figures 4d–f), driving atmospheric oxygen dissolving in surface seawater. Conversely, the elevation of SST reduces oxygen solubility and consequentially generates supersaturation and promotes oxygen efflux to the atmosphere in spring and summer (Figures 8a–c). In the YS, the absorption of atmospheric oxygen shifts from the coast in autumn to the central regions in winter. Differently from the YS, the BS exhibits reduced winter oxygen uptake (Figures 9a–d), induced by the quasi-equilibrium status (~99% saturation) (Figure 4d). In most cases, the monthly [DO] variation induced by air-to-sea oxygen flux (i.e., absorption) maintains approximately 100 μmol L−1 in each sub-region, except for that in February in the BS, whereas it is much lower in September (~0 μmol L−1) and October (~50 μmol L−1) in the YS (Figures 8a–c). In spring, the efflux of oxygen to the atmosphere in the BS is comparable to that in the YS, whereas it increases in the BS and decreases in the YS in summer, implying a higher release rate of oxygen to the atmosphere from the BS. The monthly oxygen solubility differences (ΔDOs), matching or exceeding its corresponding [DO] variation (Δ[DO]) (Figures 8a–c), further evidenced SST controlled the seasonal [DO] variations. Quantitative analysis suggests SST explains 93% and 90% of the [DO] variations in winter and spring. Reduced correlations in summer (R2 = 0.41) and autumn (R2 = 0.71) (Supplementary Figure S12), indicating secondary processes, also influence the [DO] during warm season (see below).
Figure 8
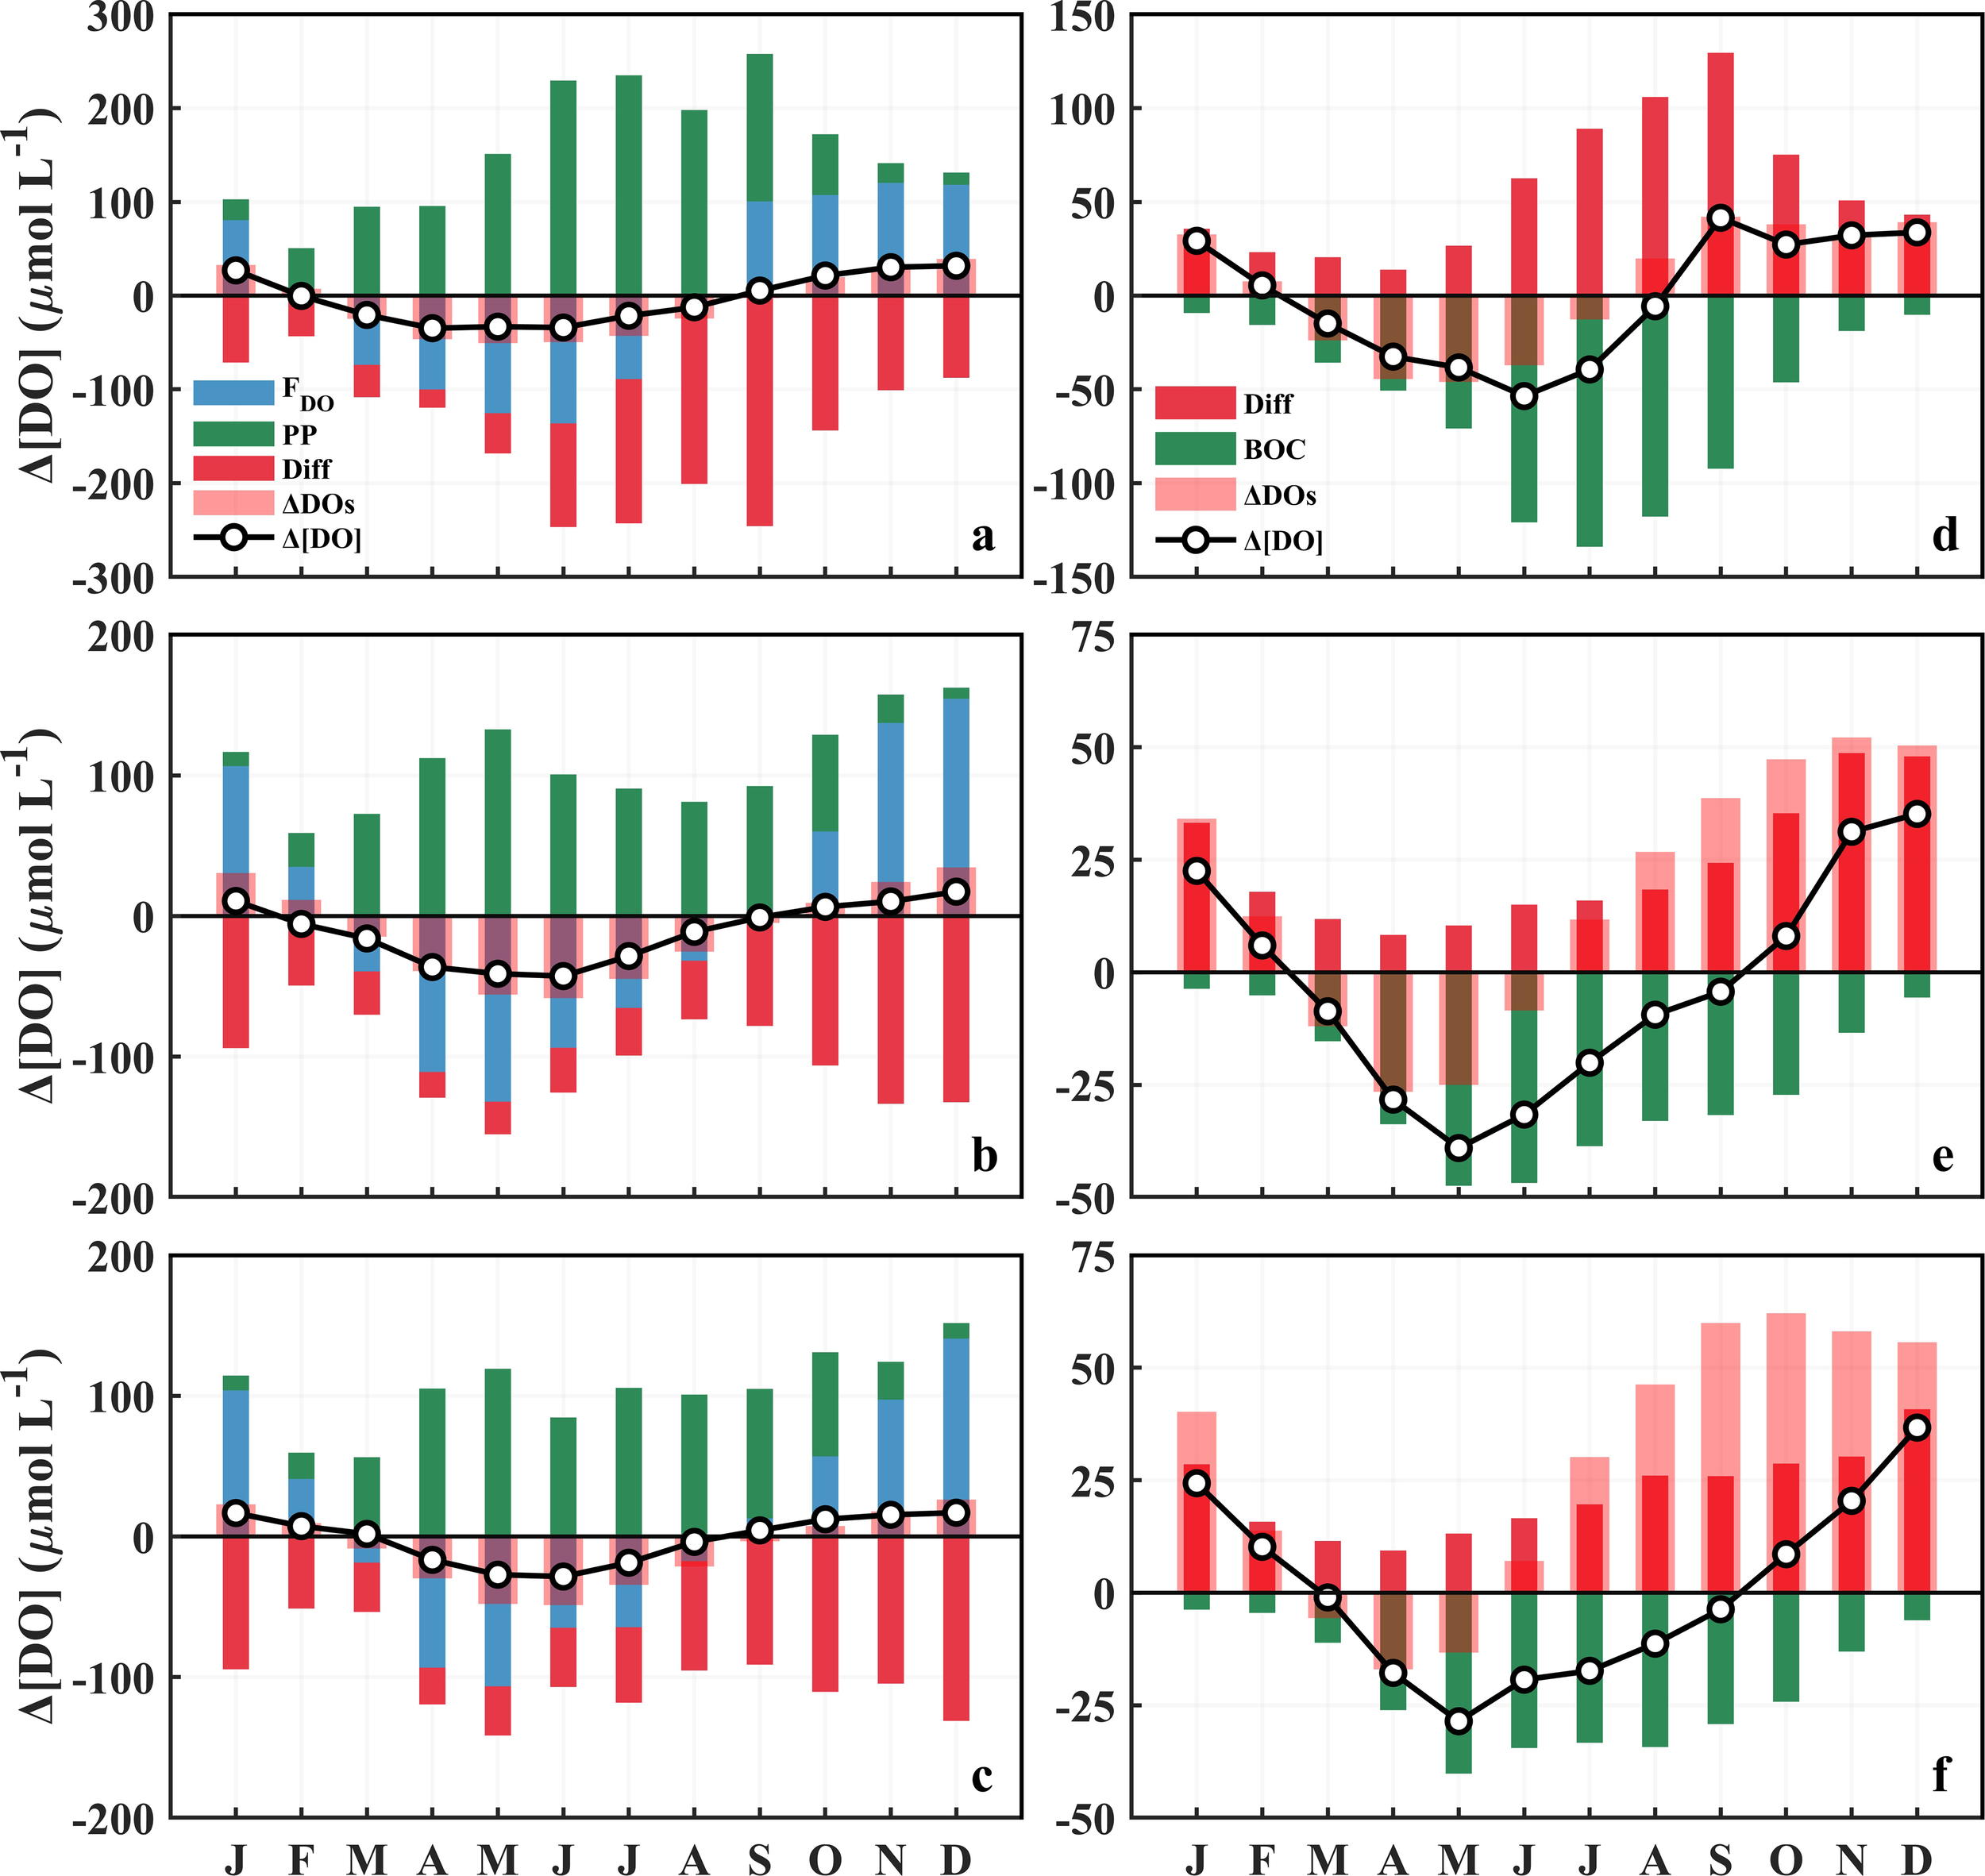
DO budgets in the surface and bottom waters of the BS (a, d), nYS (b, e), and sYS (c, f). FDO, PP, BOC, Diff, and ΔDOs denote the air–sea exchange flux (positive for oceanic uptake, negative for release), net production via photosynthesis, net loss via biological respiration, vertical transportation, and DO solubility variation, respectively, and Δ[DO] is the actual variation of the monthly average DO concentration.
Figure 9
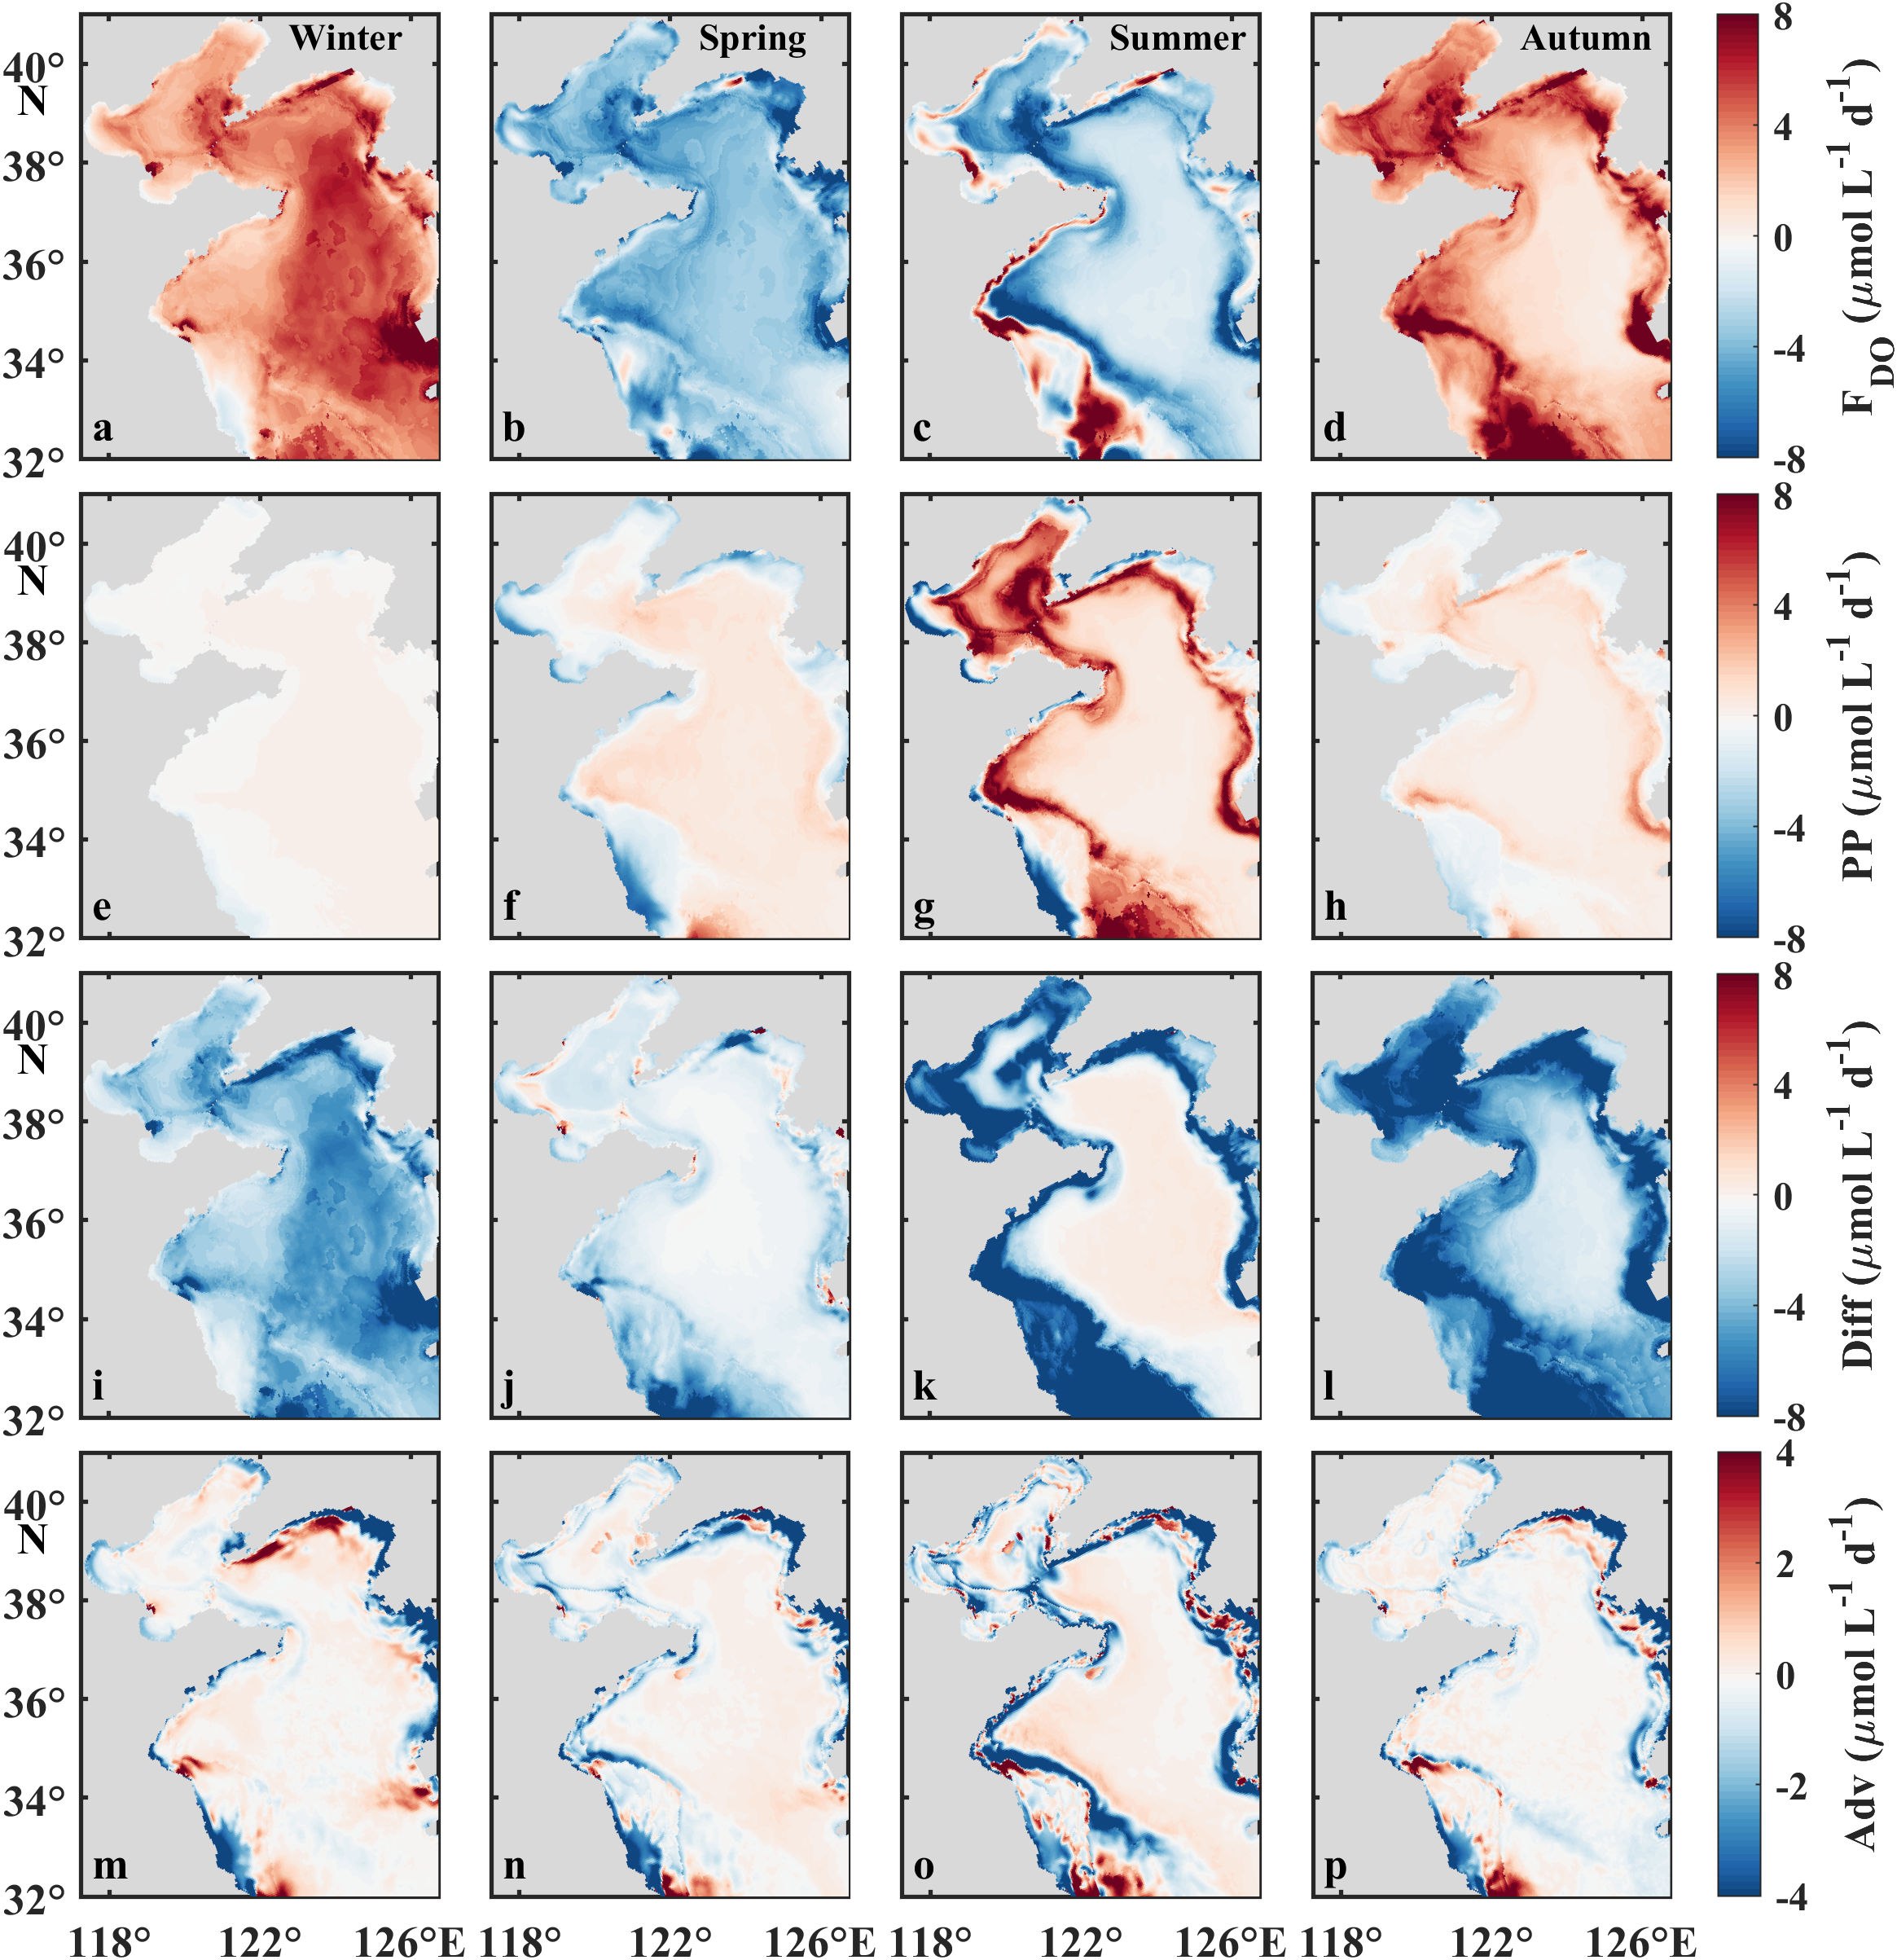
Seasonal mean values of FDO(a–d), PP (e–h), Diff (i–l), and Adv (m–p) in the surface water of the BS and YS. FDO, PP, Diff, and Adv denote the air–sea exchange flux, net production via photosynthesis, vertical transportation, and advection, respectively.
Net oxygen production via phytoplankton photosynthesis (PP hereafter, calculated as gross production minus BOC) generally elevates in spring (monthly average of 113.9 μmol L−1) and summer (220.8 μmol L−1) and declines in autumn (81.0 μmol L−1) and winter (27.8 μmol L−1) in the BS (Figures 8a–c). PP mainly occurs in stratified regions, particularly along tidal fronts and estuaries (Figures 9e–h). PP in the YS (138.5 μmol L−1) is significantly lower than that in the BS in summer but comparable in other seasons. Notably, the greatest PP-induced oxygen replenishment in summer strongly compensates the temperature-induced oxygen decrease, and thus sustains persistent supersaturation (Figures 4d−f). This also explains the spatial heterogeneity in summer air–sea fluxes across sub-regions.
In autumn, vertical oxygen diffusion to the bottom layer is remarkably enhanced, due to the weakening of the pycnocline. The greatest vertical oxygen diffusion occurs in September in the BS (245.8 μmol L−1), followed by the nYS in November (133.5 μmol L−1) and the sYS in December (131.1 μmol L−1). The YSCWM sustains increasing vertical mixing through winter, providing a mechanistic explanation for the previously mentioned sea-air oxygen disequilibrium in the YS (Figures 9i−l). Advection process mainly influences the DO budget in shallow coastal zones, whereas its overall contribution to the DO budget remains negligible across most of the study area (Figures 9m−p).
4.2 Factors in controlling bottom DO
In contrast to the surface layer, the seasonal variation of Δ[DO] in the bottom layer shows decoupled relationships with ΔDOs (Figures 8d−f). From September to May in the BS and January to April in the YS when the water column is well mixed, Δ[DO] closely tracks ΔDOs, indicating that temperature controls the [DO] in bottom water by altering the solubility and thus causing vertical oxygen replenishment. This thermal dominance dissipates from June to August in the BS and May to December in the YS when the water column is stratified and persistent oxygen undersaturation develops. The results demonstrate SBT can no longer influence the [DO] during this period. Bottom oxygen budgets indicate vertical diffusion as the principal source and BOC as the dominant sink. BOC generally increases in spring, peaks in summer, and weakens in autumn and winter (Figures 8d−f). Coastal zones and tidal fronts are BOC hotspots (Figures 10a−d), mirroring surface primary production patterns. This vertical coupling implies rapid export of freshly produced labile organic matter from euphotic zone fuels benthic respiration, consistent with previous studies (Fennel and Testa, 2019; Song et al., 2020; Chen et al., 2022b; Dai et al., 2023).
Figure 10
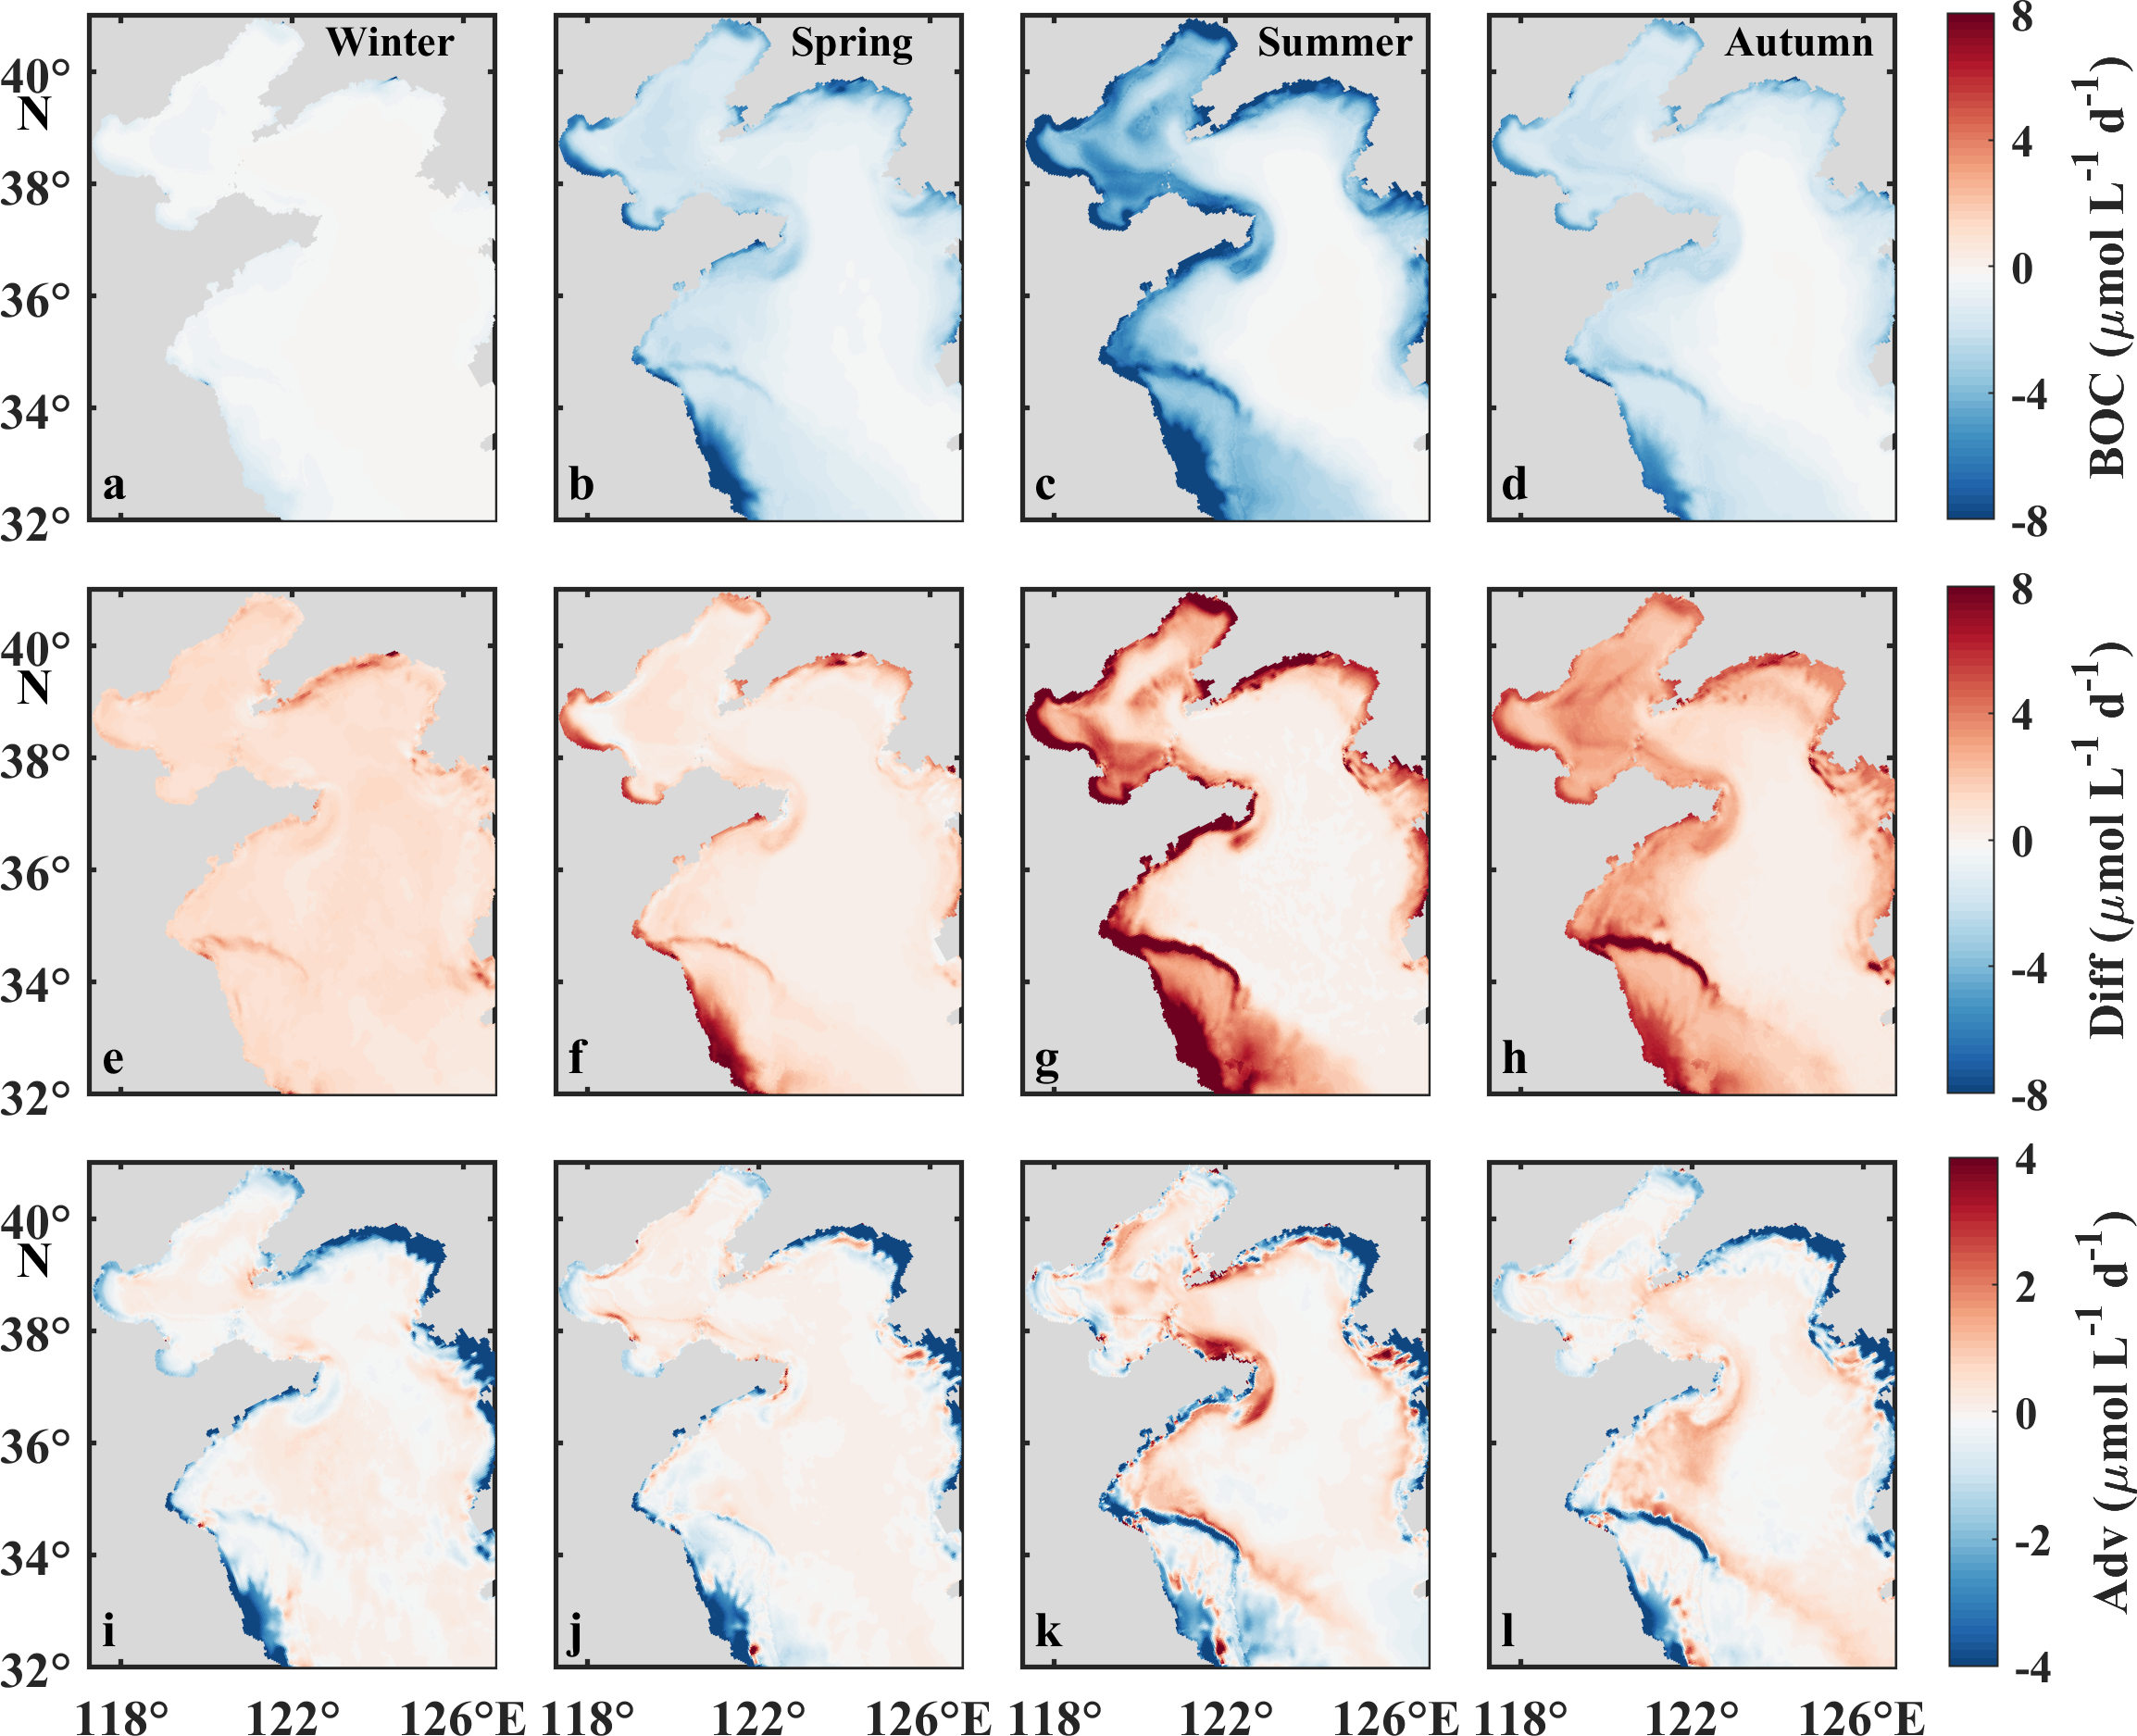
Seasonal mean values of BOC (a–d), Diff (e–h), and advection (i–l) in the bottom water of the BS and YS. BOC, Diff, and Adv denote the net loss via biological respiration, vertical transportation, and advection, respectively.
The monthly BOC in the BS exhibits a pronounced seasonal pattern, peaking sharply in July (133.9 μmol L−1) and declining precipitously in both preceding and subsequent months (Figure 8d). Similar to the BS, the monthly average BOC in the YS is also much lower in winter. However, during stratification season (May to September), BOC keeps relatively stable, with the maxima presenting in May in both the nYS and sYS (Figures 8e, f). The monthly BOC decreases from north to south, with that in the BS being 1.4−3.6 times of that in the nYS and 1.4−4.0 of that in the sYS. Notably, depth-integrated BOC is comparable across regions during their respective peak periods: 49.8 mmol m−2 d−1 in the BS from June to August versus 49.1and 49.3 mmol m−2 d−1 in the nYS and sYS from May to September. This spatial equivalence arises from bathymetric compensation. The depths of the bottom mixed layers in the nYS (38.0 m) and sYS (44.0 m) are significantly greater than that in the BS (12.3 m), counteracting the lower BOC value per unit volume in the YS.
Vertical diffusion exhibits distinct seasonal patterns between the BS and YS, higher in summer in the BS but lower in autumn and winter in the YS (Figure 8). Vertical diffusion in the BS in summer predominantly concentrates in the coastal zones, expanding to the central zone during autumn. Conversely, it exhibits a progressive intensification from autumn to winter in the central area of the YS (Figures 10e−h). This diffusion variability fundamentally influences oxygen dynamics. Notably, weakened vertical mixing in stratified waters creates favorable conditions for summer oxygen depletion development and persistence, as documented in previous studies (Hetland and DiMarco, 2008; Zhang et al., 2022). Subsequent enhanced diffusion in the BS in autumn is driven by strong vertical mixing and facilitated by elevated air–sea exchange processes as described earlier. A delayed response occurs in the YS, with significant diffusion recovery occurring primarily in winter, particularly within the YSCWM region. In all four seasons, the advection process, like the surface, is minor in the central region but contributes a measurable effect in the coastal zones (Figures 10i−l).
The combing effects of vertical diffusion, advection and BOC drive a progressive decline of bottom water [DO] from March to August (see Section 3.3). In this duration, the BS exhibits a mean [DO] decline of 1.88 μmol L−1 d−1, approximately 2.5 times of that in the YS (0.78 μmol L−1 d−1), consistent with previous in situ investigations in these regions (Song et al., 2020; Xiong et al., 2020). Moreover, the [DO] decreasing rate in the BS significantly exceeds that in the Gulf of Mexico (1.04 μmol L−1 d−1) (Fennel et al., 2016) but lower than that in the Chesapeake Bay (2.32 μmol L−1 d−1) (Li et al., 2015). This should be attributed to the different organic matter fluxes, with greater oxygen production rates in the euphotic zone of the Chesapeake Bay (100–200 mmol O2 m−2 day−1), driving proportionally higher particulate organic matter sedimentation compared to the BS (50–100 mmol O2 m−2 day−1).
4.3 Underestimation of oxygen consumption by AOU
AOU has been widely used to indicate the net BOC in hypoxic zone (Bianchi et al., 2010; Chen et al., 2022a) to estimate the contributions of aerobic respiration to regional oxygen depletion (Su et al., 2017; Zhai et al., 2019) and associated nutrient dynamics (Zhu et al., 2011). As mentioned above (see Section 4.2), the [DO] in oxygen-depleted bottom water becomes decoupled from temperature-dependent solubility controls under undersaturated conditions. However, the variation of SBT during hypoxic events can intrinsically influence AOU calculations, introducing systematic error in the net BOC estimation, consistent with the methodological limitation previously documented in open ocean (Ito et al., 2004; Holzer, 2022). To address this constraint in coastal systems, true oxygen utilization (TOU) is proposed as a more accurate metric, calculated as the difference between the [DO] at the oxygen saturation level of 100% and the measured [DO] during oxygen depletion development.
In this study, comparative analyses of AOU and TOU at minimum DO% were conducted in the BS, nYS, and sYS, respectively (Table 1). The results demonstrate significant discrepancies between the two metrics, particularly in the nYS where AOU substantially underestimated oxygen consumption. Extended analysis of other hypoxic systems reveals similar patterns, with AOU values of 36 μmol L−1 and 80 μmol L−1 lower than TOU in the Gulf of Mexico (Fennel et al., 2016) and Chesapeake Bay (Li et al., 2015), respectively. These consistent underestimations across diverse coastal hypoxic zones highlight the critical importance of adopting TOU for accurate BOC quantification in shallow marine environments.
Table 1
| Region | BS | nYS | sYS | |
|---|---|---|---|---|
| Date | DO% = 100% | 14 Jun. | 23 Apr. | 17 Apr. |
| Minimum DO% | 14 Aug. | 16 Sep. | 27 Aug. | |
| Duration (day) | 61 | 146 | 132 | |
| Minimum DO% | 65.1 | 77.9 | 69.8 | |
| DO1 (μmol L−1) | 261.2 | 307.0 | 286.1 | |
| DO2 (μmol L−1) | 146.4 | 201.4 | 181.1 | |
| TOU (μmol L−1) | 114.8 | 105.6 | 105.0 | |
| AOU (μmol L−1) | 79.2 | 58.0 | 77.4 | |
| TOU-AOU (μmol L−1) | 35.6 | 47.6 | 27.6 | |
| ΔT (°C) | 7.8 | 8.2 | 5.6 | |
Dates of 100% and minimum DO saturation, intervening duration, corresponding [DO] at 100% saturation (DO1) and minimum DO saturation (DO2), TOU, AOU, TOU-AOU discrepancy, and ΔT in the bottom waters of the BS and YS.
Relationships between AOU, TOU, and DIN variation (ΔDIN, calculated over the same duration as TOU) were systematically examined (Figures 11a−b). The regression analysis suggests a strong alignment between ΔDIN-AOU slope (0.120) and the classical Redfield ratio (0.116), whereas the ΔDIN-TOU relationship exhibits a markedly lower slope (0.086). In our opinion, this divergence likely reflects substantial denitrification in the BS and YS during oxygen depletion (Bai et al., 2007), which should be gradually promoted at lower [DO] (i.e., higher TOU and AOU) (Figures 11a−b). As a result, the discrepancy between the relationship of ΔDIN-TOU and the Redfield ratio becomes larger at lower DO conditions (i.e., higher TOU). This corroborates our viewpoint from a spatial perspective. Quantitatively, our model estimates approximately 18.3% of nitrogen removal via denitrification, which agrees well with in situ observations (16.7%) in the Bohai Bay (Yang et al., 2014).
Figure 11
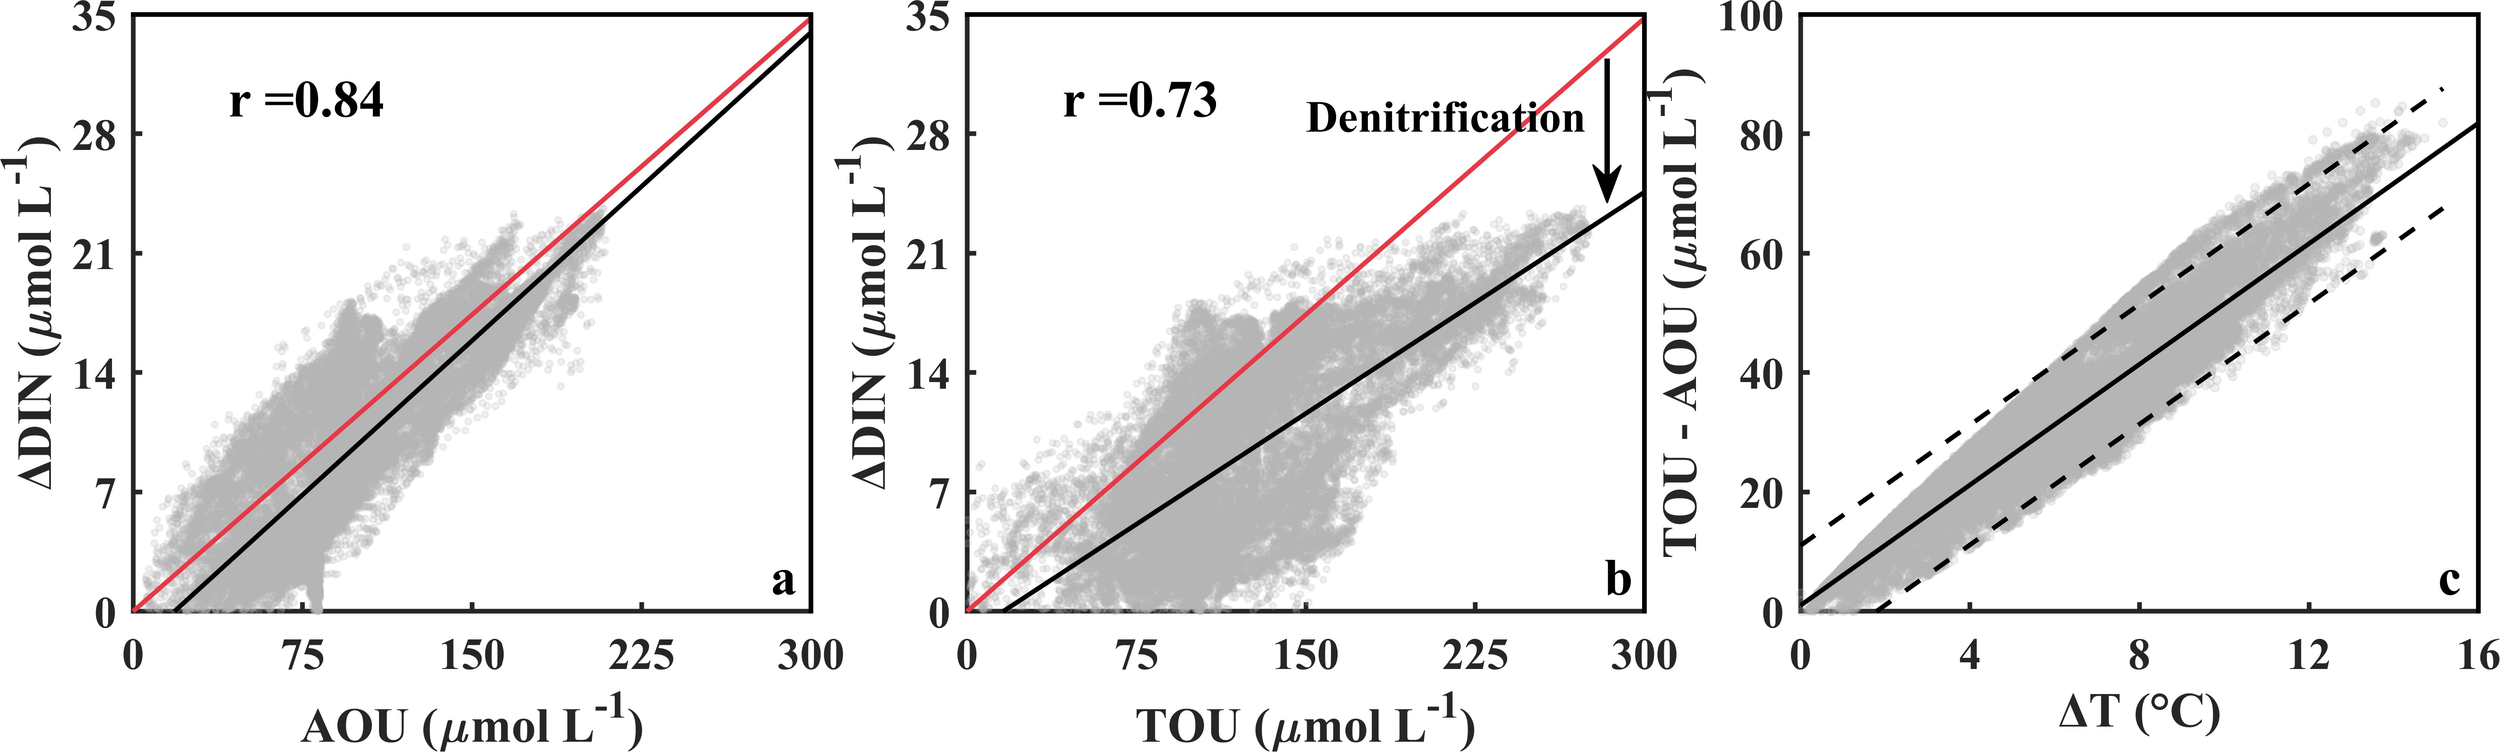
ΔDIN versus AOU (a) and TOU (b), and the TOU-AOU discrepancy versus ΔT in the bottom water in the BS and YS (c). In panels a and b, the red straight lines denote the Redfield ratio (slope: 16/138), and the black lines are the linear regressed lines; in panel c, the black straight line is the linear regressed line, and the black dashed lines denote the 95% prediction interval.
The discrepancy between AOU and TOU is primarily attributed to thermohaline variations during oxygen depletion evolution (Broecker and Takahashi 1985; Ito et al., 2004). In the BS and YS, SBT exhibits 7.2°C elevation during oxygen depletion, whereas the variation of salinity is negligible (0.47). Therefore, the underestimation of oxygen consumption (i.e., the difference between TOU and AOU) is dominated by temperature shift (ΔT), as evidenced by a robust linear correlation (r = 0.9, p < 0.01) between ΔT and the TOU-AOU discrepancy (Figure 11c). These findings highlight the critical importance of continuous temperature monitoring for accurately quantifying net oxygen consumption in shallow ecosystems.
5 Conclusions
In this study, a coupled physical-biogeochemical model is used to investigate the seasonal variation of DO and quantify the contributions of various physical and biogeochemical processes to the DO budgets in both the surface and bottom layers in the BS and YS. Surface and bottom [DO]s present a coincident seasonal pattern, which is overall opposite to that of temperature. In the surface water, SST dominates the [DO], particularly in spring and winter, whereas photosynthesis is mainly responsible for the supersaturation status in summer and downward diffusion plays an important role in regulating the [DO] in autumn. In the bottom water, vertical diffusion and BOC are overall the predominant source and sink of DO. When the water column is stratified, BOC, other than temperature, dominates the [DO] and is mainly responsible for the deoxygenation in bottom water. Geographically, the YS experiences more moderate and prolonged oxygen depletion than the BS, associated with the deeper water depth and thicker bottom layer and persistent stratification. This study also reveals the underestimation of BOC using AOU in coastal ecosystems. Therefore, TOU is proposed as a more robust metric in evaluating BOC for seasonal oxygen-depleted zones. The TOU-AOU discrepancy is strongly correlated with temperature changes during oxygen depletion development, suggesting continuous temperature monitoring as a viable for quantifying oxygen consumption in shallow coastal ecosystems.
Statements
Data availability statement
The raw data supporting the conclusions of this article will be made available by the authors, without undue reservation.
Author contributions
WZ: Investigation, Validation, Writing – original draft. HZ: Conceptualization, Methodology, Writing – review & editing. GS: Conceptualization, Methodology, Writing – review & editing. LZ: Methodology, Validation, Writing – review & editing. HW: Conceptualization, Methodology, Writing – review & editing.
Funding
The author(s) declare that financial support was received for the research and/or publication of this article. This work was financially supported by the Natural Science Foundation of China (Grant Nos. 42376199, 42376039, 42449302, and 42076033) and the Laoshan Laboratory (LSKJ202202104).
Acknowledgments
DIN observations in 2017 were collected onboard of R/V Dongfanghong 2 implementing the open research cruise NORC2017–01 supported by NSFC Shiptime Sharing Project.
Conflict of interest
The authors declare that the research was conducted in the absence of any commercial or financial relationships that could be construed as a potential conflict of interest.
Generative AI statement
The author(s) declare that no Generative AI was used in the creation of this manuscript.
Publisher’s note
All claims expressed in this article are solely those of the authors and do not necessarily represent those of their affiliated organizations, or those of the publisher, the editors and the reviewers. Any product that may be evaluated in this article, or claim that may be made by its manufacturer, is not guaranteed or endorsed by the publisher.
Supplementary material
The Supplementary Material for this article can be found online at: https://www.frontiersin.org/articles/10.3389/fmars.2025.1600636/full#supplementary-material
References
1
Bai J. Wang X. D. Li J. Liang S. Yu J. H. Wei H. et al . (2007). A study of the denitrification rate and its influence factors at the sediment-water interface in summer in the north Yellow Sea. Periodical. Ocean. Univ. China37, 653–656. doi: 10.3969/j.issn.1672-5174.2007.04.025
2
Bianchi T. S. DiMarco S. F. Cowan J. H. Hetland R. D. Chapman P. Day J. W. et al . (2010). The science of hypoxia in the Northern Gulf of Mexico: A review. Sci. Total. Environ.408, 1471–1484. doi: 10.1016/j.scitotenv.2009.11.047
3
Breitburg D. L. Hondorp D. W. Davias L. A. Diaz R. J. (2009). Hypoxia, nitrogen, and fisheries: integrating effects across local and global landscapes. Annu. Rev. Mar. Sci.1, 329–349. doi: 10.1146/annurev.marine.010908.163754
4
Breitburg D. Levin L. A. Oschlies A. Grégoire M. Chavez F. P. Conley D. J. et al . (2018). Declining oxygen in the global ocean and coastal waters. Science359, eaam7240. doi: 10.1126/science.aam7240
5
Broecker W. S. Takahashi T. (1985). Reconstruction of Past Atmospheric CO2 Contents from the Chemistry of the Contemporary Ocean: An Evaluation. Washington, D. C.: National Technical Reports Library. doi: 10.7916/d8-rct4-4y17
6
Caballero-Alfonso A. M. Carstensen J. Conley D. J. (2015). Biogeochemical and environmental drivers of coastal hypoxia. J. Mar. Sy.141, 190–199. doi: 10.1016/j.jmarsys.2014.04.008
7
Catalá T. S. Reche I. Álvarez M. Khatiwala S. Guallart E. F. Benítez-Barrios V. M. et al . (2015a). Water mass age and aging driving chromophoric dissolved organic matter in the dark global ocean. Global Biogeochem. Cy.29, 917–934. doi: 10.1002/2014GB005048
8
Catalá T. S. Reche I. Fuentes-Lema A. Romera-Castillo C. Nieto-Cid M. Ortega-Retuerta E. et al . (2015b). Turnover time of fluorescent dissolved organic matter in the dark global ocean. Nat. Commun.6, 5986. doi: 10.1038/ncomms6986
9
Chai F. Dugdale R. C. Peng T.-H. Wilkerson F. P. Barber R. T. (2002). One-dimensional ecosystem model of the equatorial Pacific upwelling system. Part I: model development and silicon and nitrogen cycle. Deep. sea. Res. Pt. II.: Topical. Stud. Oceanogr.49, 2713–2745. doi: 10.1016/S0967-0645(02)00055-3
10
Chen Y. Zhai F. Gu Y. Cao J. Liu C. Liu X. et al . (2022a). Seasonal variability in dissolved oxygen in the Bohai Sea, China. J. Ocean. Limnol.40, 78–92. doi: 10.1007/s00343-021-0235-6
11
Chen Z. Zhai W. Yang S. Zhang Y. Liu P. (2022b). Exploring origin of oxygen-consuming organic matter in a newly developed quasi-hypoxic coastal ocean, the Bohai Sea (China): A stable carbon isotope perspective. Sci. Total. Environ.837, 155847. doi: 10.1016/j.scitotenv.2022.155847
12
Dai M. Zhao Y. Chai F. Chen M. Chen N. Chen Y. et al . (2023). Persistent eutrophication and hypoxia in the coastal ocean. Camb. Prisms. Coast. Futures.1, e19. doi: 10.1017/cft.2023.7
13
Deutsch C. Penn J. L. Lucey N. (2024). Climate, oxygen, and the future of marine biodiversity. Annu. Rev. Mar. Sci.16, 217–245. doi: 10.1146/annurev-marine-040323-095231
14
Diaz R. J. (2001). Overview of hypoxia around the world. J. Environ. Qual.30, 275–281. doi: 10.2134/jeq2001.302275x
15
Diaz R. J. Rosenberg R. (1995). Marine benthic hypoxia: A review of its ecological effects and the behavioral response of benthic macrofauna. Oceanogr. Mar. Biol. Annu. Rev.: an Annu. Rev.33, 245–303.
16
Diaz R. J. Rosenberg R. (2008). Spreading dead zones and consequences for marine ecosystems. Science321, 926–929. doi: 10.1126/science.1156401
17
Díaz R. J. Rosenberg R. (2011). Introduction to environmental and economic consequences of hypoxia. Int. J. Water Resour. Dev.27, 71–82. doi: 10.1080/07900627.2010.531379
18
Engel A. Kiko R. Dengler M. (2022). Organic matter supply and utilization in oxygen minimum zones. Annu. Rev. Mar. Sci.14, 355–378. doi: 10.1146/annurev-marine-041921-090849
19
Feely R. A. Sabine C. L. Schlitzer R. Bullister J. L. Mecking S. Greeley D. (2004). Oxygen utilization and organic carbon remineralization in the upper water column of the pacific ocean. J. Oceanogr.60, 45–52. doi: 10.1023/B:JOCE.0000038317.01279.aa
20
Fennel K. Laurent A. Hetland R. Justić D. Ko D. S. Lehrter J. et al . (2016). Effects of model physics on hypoxia simulations for the northern Gulf of Mexico: A model intercomparison: HYPOXIA MODELS FOR THE GULF OF MEXICO. J. Geophys. Res. Oceans.121, 5731–5750. doi: 10.1002/2015JC011577
21
Fennel K. Mattern J. P. Doney S. C. Bopp L. Moore A. M. Wang B. et al . (2022). Ocean biogeochemical modelling. Nat. Rev. Methods Primers2, 76. doi: 10.1038/s43586-022-00154-2
22
Fennel K. Testa J. M. (2019). Biogeochemical controls on coastal hypoxia. Annu. Rev. Mar. Sci.11, 105–130. doi: 10.1146/annurev-marine-010318-095138
23
Garcia H. E. Gordon L. I. (1992). Oxygen solubility in seawater: Better fitting equations. Limnol. Oceanogr.37, 1307–1312. doi: 10.4319/lo.1992.37.6.1307
24
Guo J. Yuan H. Song J. Li X. Duan L. (2020). Hypoxia, acidification and nutrient accumulation in the Yellow Sea Cold Water of the South Yellow Sea. Sci. Total. Environ.745, 141050. doi: 10.1016/j.scitotenv.2020.141050
25
Hagy J. D. Boynton W. R. Keefe C. W. Wood K. V. (2004). Hypoxia in chesapeake bay 1950–2001: Long-term change in relation to nutrient loading and river flow. Estuaries27, 634–658. doi: 10.1007/BF02907650
26
Helm K. P. Bindoff N. L. Church J. A. (2011). Observed decreases in oxygen content of the global ocean. Geophys. Res. Lett.38, L23602. doi: 10.1029/2011GL049513
27
Hetland R. D. DiMarco S. F. (2008). How does the character of oxygen demand control the structure of hypoxia on the Texas–Louisiana continental shelf? J. Mar. Syst.70, 49–62. doi: 10.1016/j.jmarsys.2007.03.002
28
Holzer M. (2022). The fate of oxygen in the ocean and its sensitivity to local changes in biological production. J. Geophys. Res. Oceans.127, e2022JC018802. doi: 10.1029/2022JC018802
29
Ito T. Follows M. J. Boyle E. A. (2004). Is AOU a good measure of respiration in the oceans? Geophys. Res. Lett.31, n/a–n/a. doi: 10.1029/2004GL020900
30
Jackett D. R. Mcdougall T. J. (1995). Minimal adjustment of hydrographic profiles to achieve static stability. J. Atmos. Oceanic. Technol.12, 381–389. doi: 10.1175/1520-0426(1995)012<0381:MAOHPT>2.0.CO;2
31
Karstensen J. Stramma L. Visbeck M. (2008). Oxygen minimum zones in the eastern tropical Atlantic and Pacific oceans. Prog. Oceanogr.77, 331–350. doi: 10.1016/j.pocean.2007.05.009
32
Keeling R. F. Körtzinger A. Gruber N. (2010). Ocean deoxygenation in a warming world. Annu. Rev. Mar. Sci.2, 199–229. doi: 10.1146/annurev.marine.010908.163855
33
Kim Y. H. Son S. Kim H.-C. Kim B. Park Y.-G. Nam J. et al . (2020). Application of satellite remote sensing in monitoring dissolved oxygen variabilities: A case study for coastal waters in Korea. Environ. Int.134, 105301. doi: 10.1016/j.envint.2019.105301
34
Li D. Zhang J. Huang D. Wu Y. Liang J. (2002). Oxygen depletion off the Changjiang (Yangtze River) Estuary. Sci. China Earth Sci-D.45, 1137–1146. doi: 10.1360/02yd9110
35
Li Y. Li M. Kemp W. M. (2015). A budget analysis of bottom-water dissolved oxygen in chesapeake bay. Estuaries. Coasts.38, 2132–2148. doi: 10.1007/s12237-014-9928-9
36
Li Z. Wei H. Zhang H. Zhao H. Zheng N. Song G. (2021). The interannual difference in summer bottom oxygen deficiency in Bohai Sea. Oceanol. Et Limnol. Sini.52, 601–613. doi: 10.11693/hyhz20200800227
37
Meier H. E. M. Andersson H. C. Eilola K. Gustafsson B. G. Kuznetsov I. Müller-Karulis B. et al . (2011). Hypoxia in future climates: A model ensemble study for the Baltic Sea. Geophys. Res. Lett.38, L24608. doi: 10.1029/2011GL049929
38
Nelson N. B. Siegel D. A. (2013). The global distribution and dynamics of chromophoric dissolved organic matter. Annu. Rev. Mar. Sci.5, 447–476. doi: 10.1146/annurev-marine-120710-100751
39
Rabalais N. N. Turner R. E. Gupta B. K. S. Boesch D. F. Chapman P. Murrell M. C. (2007). Hypoxia in the northern gulf of Mexico: does the science support the plan to reduce, mitigate, and control hypoxia? Estuaries. Coasts.30, 753–772. doi: 10.1007/BF02841332
40
Rabalais N. N. Turner R. E. Scavia D. (2002). Beyond science into policy: gulf of Mexico hypoxia and the mississippi river. BioScience52, 129. doi: 10.1641/0006-3568(2002)052[0129:BSIPGO]2.0.CO;2
41
Seitzinger S. Harrison J. A. Böhlke J. K. Bouwman A. F. Lowrance R. Peterson B. et al . (2006). Denitrification across landscapes and waterscapes: A synthesis. Ecolo. Appl.16, 2064–2090. doi: 10.1890/1051-0761(2006)016[2064:DALAWA]2.0.CO;2
42
Shchepetkin A. F. McWilliams J. C. (2005). The regional oceanic modeling system (ROMS): a split-explicit, free-surface, topography-following-coordinate oceanic model. Ocean. Modell.9, 347–404. doi: 10.1016/j.ocemod.2004.08.002
43
Song G. Zhao L. Chai F. Liu F. Li M. Xie H. (2020). Summertime oxygen depletion and acidification in bohai sea, China. Front. Mar. Sci.7. doi: 10.3389/fmars.2020.00252
44
Stramma L. Johnson G. C. Sprintall J. Mohrholz V. (2008). Expanding oxygen-minimum zones in the tropical oceans. Science320, 655–658. doi: 10.1126/science.1153847
45
Su J. Dai M. He B. Wang L. Gan J. Guo X. et al . (2017). Tracing the origin of the oxygen-consuming organic matter in the hypoxic zone in a large eutrophic estuary: the lower reach of the Pearl River Estuary, China. Biogeosciences14, 4085–4099. doi: 10.5194/bg-14-4085-2017
46
Sulpis O. Trossman D. S. Holzer M. Jeansson E. Lauvset S. K. Middelburg J. J. (2023). Respiration patterns in the dark ocean. Global Biogeochem. Cy.37, e2023GB007747. doi: 10.1029/2023GB007747
47
Testa J. M. Kemp W. M. (2011). “Oxygen – dynamics and biogeochemical consequences,” in Treatise on Estuarine and Coastal Science (Amsterdam, Netherlands: Elsevier), 163–199. doi: 10.1016/B978-0-12-374711-2.00505-2
48
Tu J. (1992). Distribution and variation of thermocline layers in the Bohai Sea and Yellow Sea. Mar. Sci. Bull.11, 27–32.
49
Vaquer-Sunyer R. Duarte C. M. (2008). Thresholds of hypoxia for marine biodiversity. Proc. Natl. Acad. Sci. U.S.A.105, 15452–15457. doi: 10.1073/pnas.0803833105
50
Wang H. Zhang H. Wei H. Zuo H. (2023). Temporal variations of the two oxygen depleted zones in the Bohai Sea. Front. Mar. Sci.10. doi: 10.3389/fmars.2023.1247579
51
Wei Q. Yao Q. Wang B. Xue L. Fu M. Sun J. et al . (2019). Deoxygenation and its controls in a semienclosed shelf ecosystem, Northern Yellow Sea. J. Geophys. Res. Oceans.124, 9004–9019. doi: 10.1029/2019JC015399
52
Wei H. Zhang H. Yang W. Feng J. Zhang C. (2020). “The changing bohai and yellow seas: A physical view,” in Changing Asia-Pacific Marginal Seas. Eds. ChenC.-T. A.GuoX. (Springer, Singapore), 105–120. doi: 10.1007/978-981-15-4886-4_7
53
Wei H. Zhao L. Zhang H. Lu Y. Yang W. Song G. (2021). Summer hypoxia in Bohai Sea caused by changes in phytoplankton community. Anthropocene. Coasts.4, 77–86. doi: 10.1139/anc-2020-0017
54
Xiao X. Yamashita Y. Gonsior M. Jiao N. (2023). The efficiency of the microbial carbon pump as seen from the relationship between apparent oxygen utilization and fluorescent dissolved organic matter. Prog. Oceanogr.210, 102929. doi: 10.1016/j.pocean.2022.102929
55
Xiong T. Wei Q. Zhai W. Li C. Wang S. Zhang Y. et al . (2020). Comparing subsurface seasonal deoxygenation and acidification in the yellow sea and northern east China sea along the north-to-south latitude gradient. Front. Mar. Sci.7. doi: 10.3389/fmars.2020.00686
56
Xiu P. Chai F. (2011). Modeled biogeochemical responses to mesoscale eddies in the South China Sea. J. Geophys. Res.116, C10006. doi: 10.1029/2010JC006800
57
Yamashita Y. Tanoue E. (2008). Production of bio-refractory fluorescent dissolved organic matter in the ocean interior. Nat. Geosci.1, 579–582. doi: 10.1038/ngeo279
58
Yang L. Lei K. Meng W. Li Z. Liu Q. (2014). Preliminary results concerning summer-time denitrification in the Bohai Bay, China. Mar. Environ. Sci.33, 927–933. doi: 10.13634/j.cnki.mes.2014.06.019
59
Yin K. Lin Z. Ke Z. (2004). Temporal and spatial distribution of dissolved oxygen in the Pearl River Estuary and adjacent coastal waters. Cont. Shelf. Res.24, 1935–1948. doi: 10.1016/j.csr.2004.06.017
60
Zhai W. Zhao H. Su J. Liu P. Li Y. Zheng N. (2019). Emergence of summertime hypoxia and concurrent carbonate mineral suppression in the central Bohai Sea, China. JGR. Biogeo.124, 2768–2785. doi: 10.1029/2019JG005120
61
Zhang H. Wei H. Zhao L. Zhao H. Guo S. Zheng N. (2022). Seasonal evolution and controlling factors of bottom oxygen depletion in the Bohai Sea. Mar. Pollut. Bull.174, 113199. doi: 10.1016/j.marpolbul.2021.113199
62
Zhao H.-D. Kao S.-J. Zhai W.-D. Zang K.-P. Zheng N. Xu X.-M. et al . (2017). Effects of stratification, organic matter remineralization and bathymetry on summertime oxygen distribution in the Bohai Sea, China. Cont. Shelf. Res.134, 15–25. doi: 10.1016/j.csr.2016.12.004
63
Zhu Z.-Y. Zhang J. Wu Y. Zhang Y.-Y. Lin J. Liu S.-M. (2011). Hypoxia off the Changjiang (Yangtze River) Estuary: Oxygen depletion and organic matter decomposition. Mar. Chem.125, 108–116. doi: 10.1016/j.marchem.2011.03.005
64
Zou E. Guo B. Tang Y. Li Z. (2000). The hydrographic features and water masses analyses ofthe southern Huanghai Sea in the spring of 1996. Acta Oceanolog. Sin.22, 17–26.
Summary
Keywords
dissolved oxygen, seasonal variation, photosynthesis, biological oxygen consumption, true oxygen utilization, coupled physical-biogeochemical model, Bohai and Yellow Seas
Citation
Zhang W, Zhang H, Song G, Zhao L and Wei H (2025) Physical and biogeochemical processes in controlling the seasonal variation of dissolved oxygen in the Bohai and Yellow Seas. Front. Mar. Sci. 12:1600636. doi: 10.3389/fmars.2025.1600636
Received
26 March 2025
Accepted
02 May 2025
Published
22 May 2025
Volume
12 - 2025
Edited by
Giandomenico Foti, Mediterranea University of Reggio Calabria, Italy
Reviewed by
Yoshimi Kawai, Japan Agency for Marine-Earth Science and Technology (JAMSTEC), Japan
JeongHee Shim, National Institute of Fisheries Science, Republic of Korea
Dongliang Lu, Beibu Gulf University, China
Jie Guo, Chinese Academy of Sciences (CAS), China
Updates
Copyright
© 2025 Zhang, Zhang, Song, Zhao and Wei.
This is an open-access article distributed under the terms of the Creative Commons Attribution License (CC BY). The use, distribution or reproduction in other forums is permitted, provided the original author(s) and the copyright owner(s) are credited and that the original publication in this journal is cited, in accordance with accepted academic practice. No use, distribution or reproduction is permitted which does not comply with these terms.
*Correspondence: Haiyan Zhang, haiyan_zhang@tju.edu.cn; Guisheng Song, guisheng.song@tju.edu.cn
Disclaimer
All claims expressed in this article are solely those of the authors and do not necessarily represent those of their affiliated organizations, or those of the publisher, the editors and the reviewers. Any product that may be evaluated in this article or claim that may be made by its manufacturer is not guaranteed or endorsed by the publisher.