Abstract
Submarine groundwater discharge (SGD) can be a critical driver of nutrient transport to coral reef ecosystems, shaping water quality, primary productivity, and overall reef health. This study quantifies SGD fluxes and associated nutrient dynamics in two reef flat pools within the National Park of American Samoa on Ofu Island: Papaloloa Point and Fattuana Point. A multi-method approach integrating multichannel electrical resistivity tomography (ERT), unoccupied aerial system-based thermal infrared (UAS-TIR) surveys, radon-based SGD measurements, and discrete water sampling was used to assess SGD rates and nutrient contributions to nearshore pools. UAS-TIR imagery revealed cooler sea-surface temperatures relative to ambient seawater emanating from coastal point sources in both pools, indicative of SGD, with higher fluxes observed at Papaloloa Point. Time-series radon measurements revealed a strong inverse correlation between calculated SGD rates and tidal stage, further indicative of SGD. The SGD response was immediate (i.e., in phase with the tides) at Papaloloa Point, likely due to its highly permeable calcareous sand and gravel substrate. In contrast, a 2–3-hr lag in SGD response at Fattuana Point indicates discharge from a more inland aquifer with lower transmissivity. Nutrient concentrations correlated directly with temperature and salinity, confirming SGD as the dominant nutrient transport mechanism, whereas isotopic analyses demonstrated inputs from both groundwater and potential anthropogenic sources. These findings underscore the complexity of SGD-mediated nutrient dynamics in coral-reef environments and emphasize the need for an integrated geochemical and geophysical approach to support effective coral-reef conservation and management strategies.
1 Introduction
Efforts to mitigate nutrient pollution in coral reef environments have traditionally focused on surface runoff, but submarine groundwater discharge (SGD) is increasingly recognized as a critical vector for nutrient transport in many coastal systems (Moosdorf et al., 2015; Camacho-Cruz et al., 2025). SGD refers to the movement of groundwater from terrestrial sources through coastal sediment into the marine environment and can be particularly important in regions with limited riverine input and highly permeable bedrock (Bienfang and Johnson, 1980; Parsons et al., 2008; Hunt and Rosa, 2009; Swarzenski et al., 2012; Nelson et al., 2015; Amato et al., 2016; Fackrell et al., 2016; Swarzenski et al., 2017, Camacho-Cruz et al., 2025). SGD can deliver bioactive solutes, including nutrients (N, P, Si), dissolved gases (CH4, CO2), trace metals (Fe, Ni, Zn), as well as potential contaminants such as pathogens and toxins (Taniguchi et al., 2002; Burnett et al., 2006; Paytan et al., 2006; Swarzenski et al., 2006).
Although SGD can serve as a nutrient source to oligotrophic reef systems (e.g., Paytan et al., 2006; Nelson et al., 2015) and provide thermal refugia (Bachman et al., 2022), human-derived nutrient inputs via SGD pose significant threats to reef health (Santos et al., 2021). Elevated N and P levels associated with SGD have been linked to increased coral disease susceptibility (Bruno et al., 2003; Redding et al., 2013), reductions in coral abundance and diversity (Fabricius, 2005; Lapointe et al., 2005), and the promotion of harmful algal blooms (Anderson et al., 2002; Hu et al., 2006). Excess nutrient input via SGD has also been implicated in enhanced coral bioerosion, leading to reef structure degradation and loss of critical habitat for marine organisms (Prouty et al., 2017). A notable example of SGD-driven eutrophication is in Maui, Hawaii where excessive macroalgal growth has been linked to nutrient-rich SGD originating from treated wastewater discharge (Dailer et al., 2010, 2012).
In American Samoa, primary threats to groundwater quality include pesticide residues, sediment loading from land-based pollution sources (e.g., quarry operations, development), automobile-related pollution, and nutrient and pathogen contamination from wastewater disposal systems (USACE, 2022). According to Shuler et al. (2019), wastewater and manure are likely sources of elevated nutrient levels to coastal ecosystems in nearby Tutuila Island, American Samoa, the largest and most populous island of American Samoa. The ecological impacts of SGD, however, are strongly modulated by hydrodynamic processes (Monismith, 2006; Hearn, 2011; Storlazzi et al., 2018; Camacho-Cruz et al., 2025). SGD is a dynamic and spatially heterogeneous process influenced by terrestrial hydrogeology, tides, and wave action, occurring as both localized point-source discharges and diffuse seepage (Dimova et al., 2012). Consequently, SGD-related impacts on reef health depend on the balance between dispersive and retentive water circulation processes (Erftemeijer et al., 2012; Shedrawi et al., 2017; Storlazzi et al., 2018).
Previous studies demonstrated that SGD is the primary freshwater source to coral-reef environments within the Ofu island unit of the National Park of American Samoa (NPSA), suggesting that SGD may play a significant role in nutrient transport to Ofu Island’s coral reefs (Garrison et al., 2007). As climate change intensifies threats to coral reefs through rising ocean temperatures and acidification (Hoegh-Guldberg et al., 2007; Fabricius et al., 2011; Gattuso et al., 2015), managing local stressors such as eutrophication is increasingly critical for reef conservation. Notably, the corals of the Ofu island unit exhibit exceptional thermal tolerance, with daily temperature fluctuations exceeding 6°C and frequent exposure to temperatures above the local coral bleaching threshold of 30°C (Craig et al., 2001; Palumbi et al., 2014). As a result, these corals may provide critical insights into the potential of coral acclimatization and adaptation to climate change (Barshis et al., 2013; Palumbi et al., 2014; Barker, 2018). However, in 2017, a significant outbreak of the macroalga Valonia fastigiata was reported on the coral reefs within the NPSA Ofu island unit (Vaeoso, 2022). Prior to the recent V. fastigiata outbreak, macroalgal cover on Ofu island unit coral reefs was estimated to be less than 20%. Surveys in the late 2010s indicated that V. fastigiata cover increased to more than 50% in many reef flat pools and was actively overgrowing healthy coral colonies (Vaeoso, 2022). This shift was hypothesized to be in response to a change in local nutrient dynamics that favors macroalgal proliferation (Littler and Littler, 1985). However, there remains limited understanding of local SGD rates and associated nutrient fluxes
To address this knowledge gap, we present findings from an integrated study using oceanographic, remote sensing, geophysical, and geochemical analyses conducted in two reef flat pools within the NPSA Ofu island unit. Whereas traditional SGD assessments typically rely on simplified hydrogeological, bathymetric, and hydrodynamic assumptions, potentially leading to oversimplified estimations of nutrient fluxes, recent advancements, such as high-resolution Unoccupied Aerial System (UAS)-based thermal infrared (TIR) imaging, have improved the ability to characterize fine-scale SGD heterogeneity. For example, Oberle et al. (2022) demonstrated that SGD in Fagaʻalu Bay, Tutuila Island, American Samoa, is spatially heterogeneous and controlled by both hydrogeologic and oceanographic processes modulated by the reef structure itself. Therefore, by applying an integrated approach, we can better understand the spatial and temporal variability of nutrient-enriched SGD in the context of coral-reef health.
2 Materials and methods
2.1 Study site
Ofu Island, part of the Manuʻa Islands in American Samoa, is in the South Pacific Ocean and is surrounded by a fringing reef ranging from 80–180 m in width. Our study sites were situated on the southern reef, within the Ofu island unit of NPSA (Figure 1). Previous research on the south shore of Ofu Island (Oliver and Palumbi, 2009) has described the reef flat as having a series of semi-independent, shallow, sand-filled depressions or pools, wherein each pool exhibits greater water exchange with the offshore ocean via depressions in the reef flat than with adjacent pools. The reef flat pools of Ofu Island support high biodiversity, including nearly 300 fish species and 80 coral species, several of which are listed under the U.S. Endangered Species Act (Craig et al., 2001) and contains one of the best preserved Indo-Pacific coral-reef ecosystems in the U.S. National Park system (National Park Service, 2017). The reef also provides essential coastal protection by buffering wave energy and reducing beach erosion (Storlazzi et al., 2019). This study focused on two pools within the NPSA’ Ofu island unit: Papaloloa Point, located near the island’s airstrip (previously designated as Pool 200), and Fattuana Point, situated approximately 800 m northeast of Papaloloa Point (previously designated as Pool 300). Ofu Island consists predominantly of thin-bedded basaltic lava with high permeability (Davis, 1963) and represents the erosional remnant of a larger volcanic island that was bisected into Ofu and Olosega Islands by fluvial and marine erosion. The geology of the beach-ridge deposits where this study took place is characterized by homogeneous unconsolidated calcareous sand that was deposited during the seaward progradation during the past 2–3 kyr B.P. (Kirch and Hunt 1993).
Figure 1
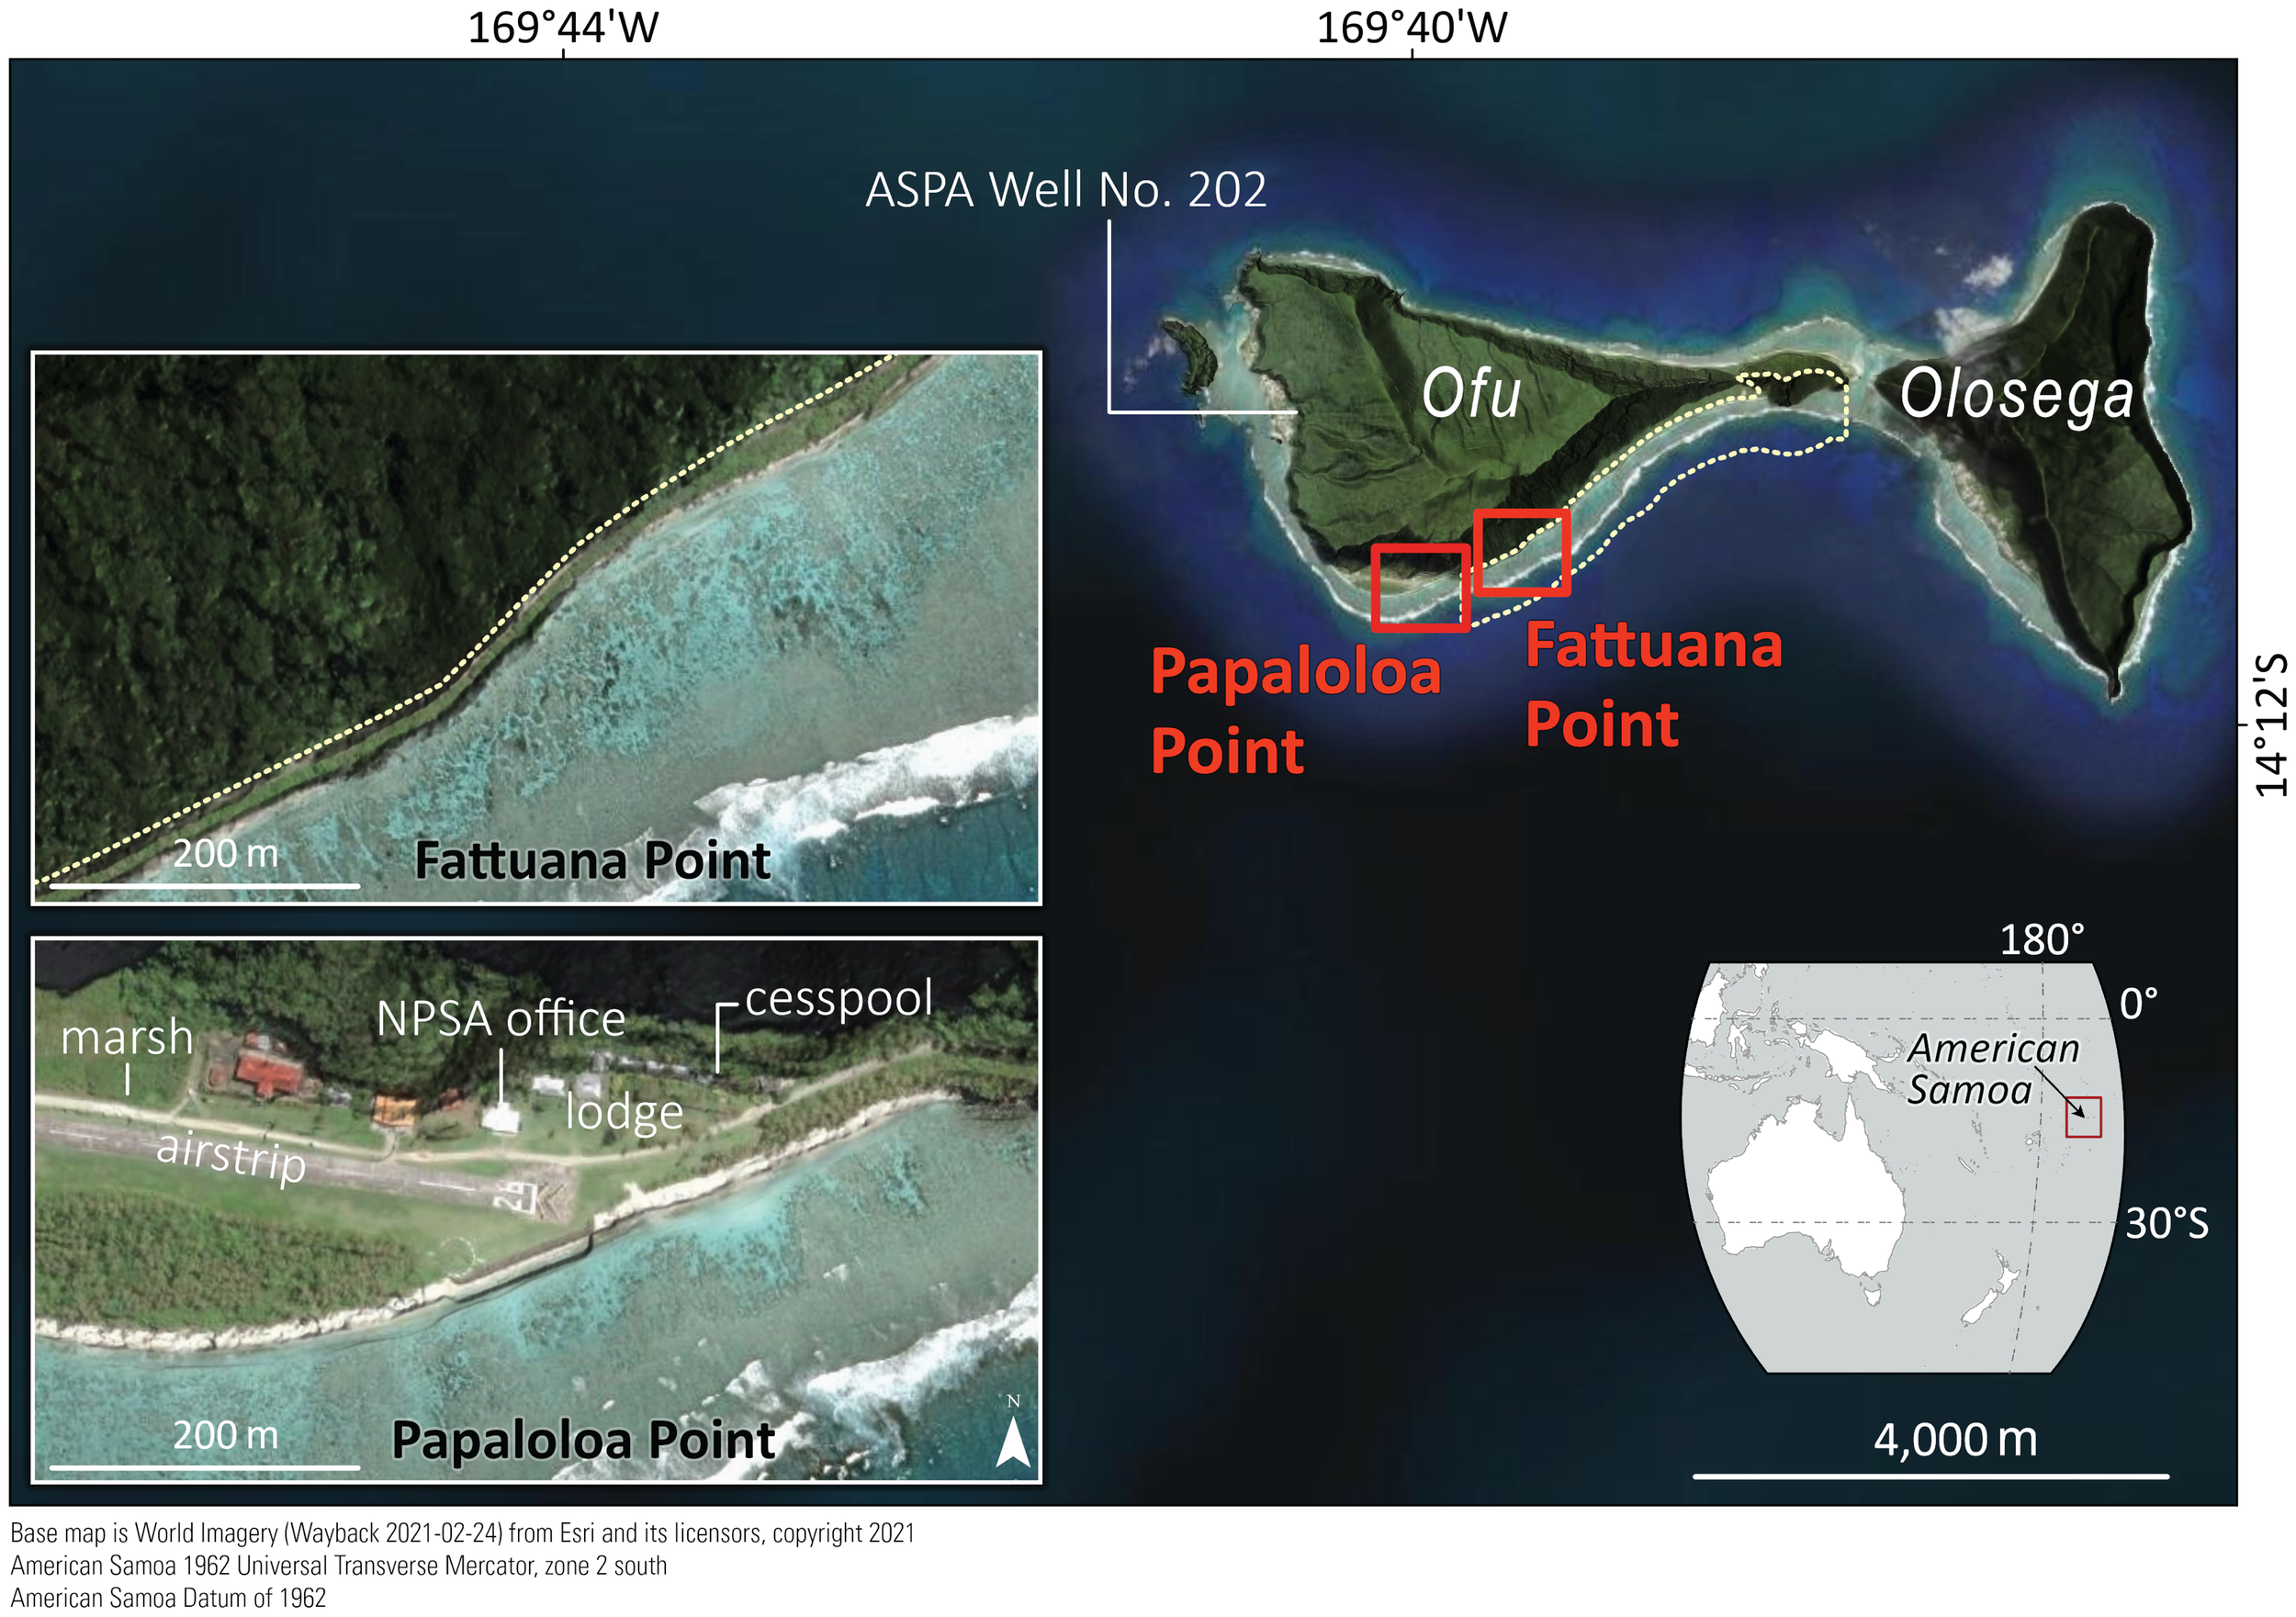
Map of study area, showing Ofu and Olosega Islands with the location of the pools at Papaloloa Point and Fattuana Point, as well as the American Samoa Power Authority Well No. 202. The inset maps show the location of American Samoa in the southwestern Pacific Ocean and the inset satellite imagery shows the location of the Va’oto Lodge, Va’oto Lodge cesspool, Va’oto Marsh, airstrip, and the NPSA Ofu Ranger Station in the vicinity of Papaloloa Point.
Although a few spring-fed streams exist on Ofu Island, they percolate rapidly into the underlying volcanic bedrock. At sea level, the highly permeable basaltic substrate hosts a substantial volume of fresh groundwater, forming a thin freshwater lens within a high-recharge aquifer (Davis, 1963). The lens is likely thickest in the island’s interior of Ofu Island and thinnest at the coast, where abundant groundwater discharge may occur. The absence of a significant coastal plain, and steep slopes along the coast facilitate the direct discharge of groundwater from the freshwater lens into the Pacific Ocean. Coastal springs are readily identifiable along the present shoreline during spring low tides within the study area (Vaeoso, 2022). Early hydrological investigations of Ofu Island (Davis, 1963) revealed that during periods when upland springs—traditionally the primary source of drinking water—failed to meet demand, residents were compelled to rely on abundant SGD springs, locally known as vai puna o le mata o le vasa, underscoring their critical cultural and historical significance. This historical reliance is further exemplified by the Toʻaga archaeological site, which spans nearly three millennia of Samoan history and features a deep sequence of ceramics dating back over 3000 yr, when the beach shoreline was positioned further inland (Kirch et al., 1990; Anderson, 1995). The proximity of the Toʻaga site (<1 km to the east) to present SGD springs at Fattuana Point indicates that these springs may have been the only readily accessible water source for its former occupants. Similar cultural valuations of freshwater sources have been documented in other Pacific regions, such as Molokaʻi, Hawaii (Oberle et al., 2023), where SGD springs were also used for drinking water during times of water shortages.
Hydrodynamic processes within the reef flat pools are influenced by a combination of tidally modulated wave-forced flows and longer-period (>100 s) infragravity waves propagating across the reef flat (Cheriton et al., 2024). Ofu Island has a microtidal regime; at low tide, flow is focused from reef crest into the pools, whereas at high tide, flow is predominantly seaward from the pools (Maticka et al., 2022; Cheriton et al., 2024). Ofu Island is sparsely populated, with the main village located on the western shore, approximately 2.2 km from Papaloloa Point pool study site. Key infrastructure at Papaloloa Point includes a small airport with associated government buildings, Va’oto Lodge and its existing cesspool, and the NPSA Ofu Ranger Station (Figure 1). Ofu Island has one active well, managed by the American Samoa Power Authority (ASPA) Well No. 202. Additionally, a small wetland, Va’oto Marsh, is situated adjacent to the airport and several government facilities.
2.2 Field sampling
In February 2020, the U.S. Geological Survey (USGS) conducted a field campaign at the Papaloloa Point and FatTuana Point reef flat pools within the Ofu island unit of NPSA (Figures 1, 3, 4). The study aimed to quantify SGD and its role in nutrient delivery and possible impact on the reef health.
2.2.1 Electrical resistivity
Electrical resistivity has long been recognized as a robust tool for delineating the dynamics and spatial extent of the freshwater–saltwater interface in coastal aquifers (Manheim et al., 2004; Swarzenski et al., 2006, 2007; Oberle et al., 2017, 2019, 2023). In this investigation, multichannel electrical resistivity tomography (ERT) surveys were conducted along four transects on the beach ridge consisting of unconsolidated calcareous sand deposits: (1) Papaloloa Point Center (shore perpendicular), (2) Papaloloa Point Center (shore parallel), (3) Papaloloa Point East, and (4) Fattuana Point (Figure 2). At Papaloloa Point Center, one transect was oriented perpendicular to the shoreline, whereas all other transects were aligned parallel to the shoreline. Subsurface resistivity was measured using an AGI SuperSting R8 system equipped with a 56-electrode cable, with electrodes spaced 2 m apart. Each electrode was affixed to the sediment using a 35-cm stainless steel spike, and the relative elevation of each electrode was recorded. The ERT measurements were acquired using a dipole–dipole array configuration, and resistivity values were processed using AGI EarthImager inverse modeling routines. The Root Mean Square (RMS) error for each model profile is shown in Figure 2. The primary objective was to identify SGD point sources along the beachfront for subsequent flux quantification.
Figure 2
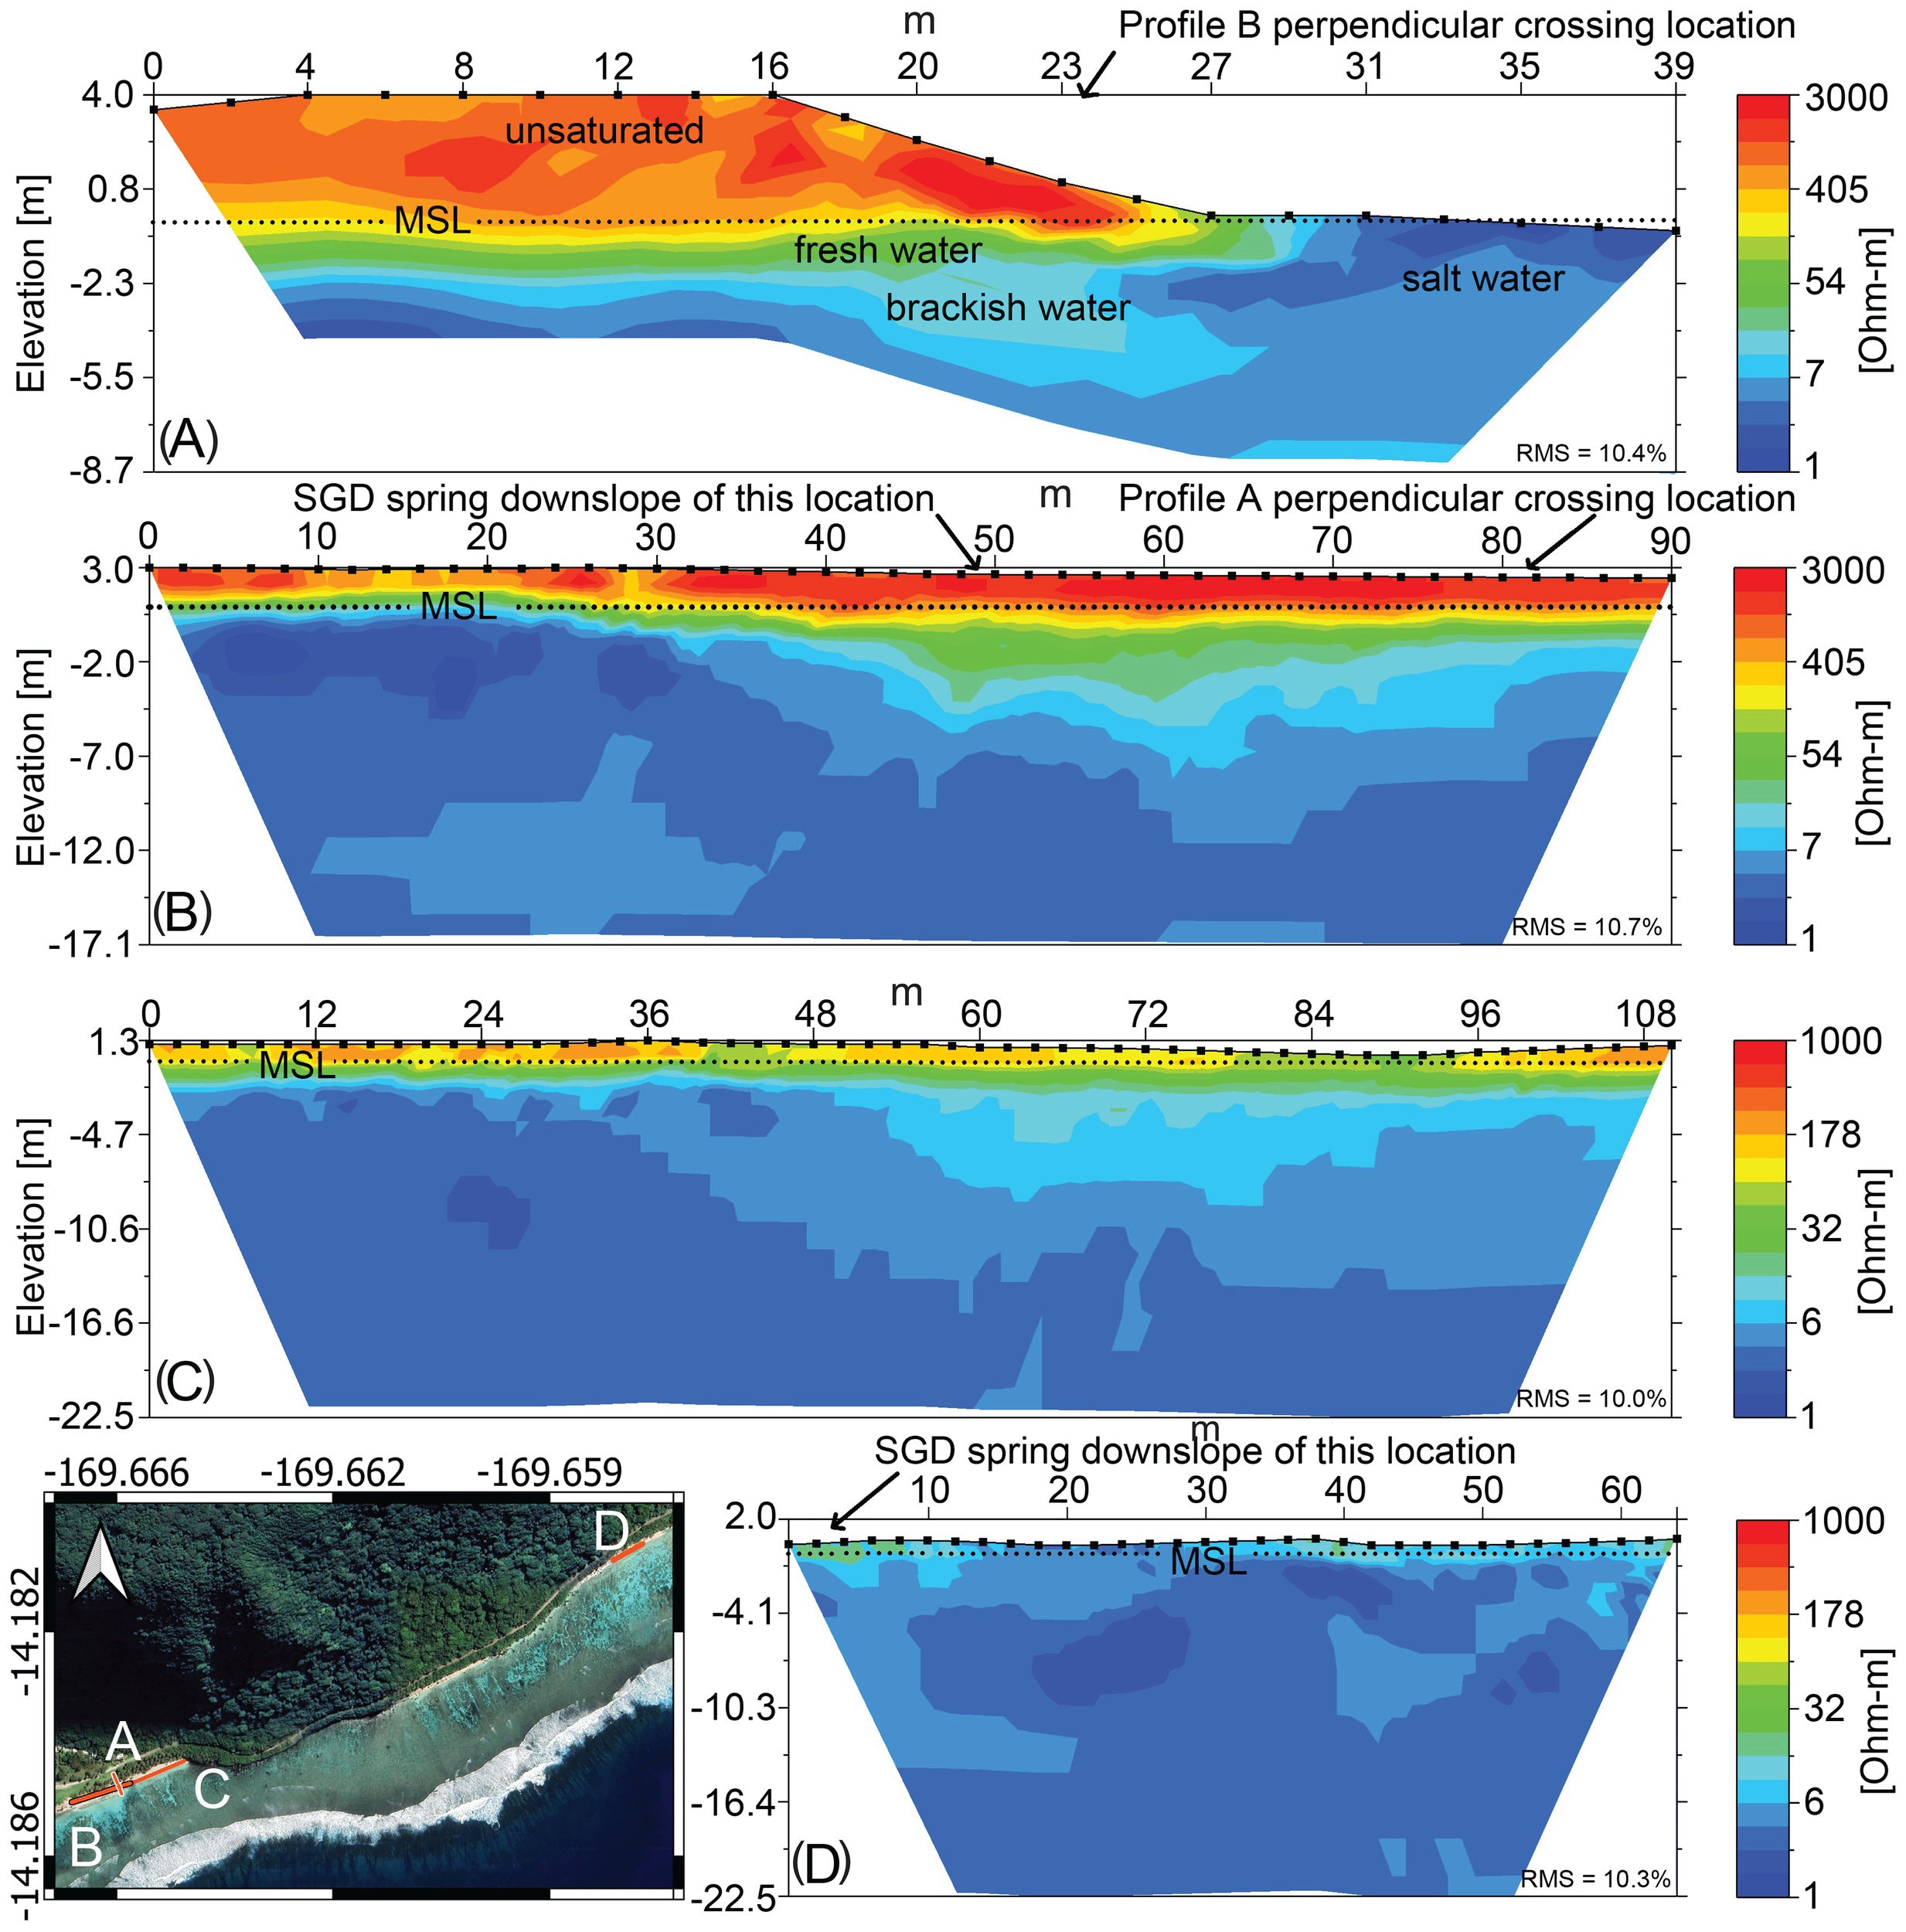
Electrical Resistivity Tomography (ERT) profiles at: (A) Papaloloa Point Center (shore perpendicular), (B) Papaloloa Point Center (shore parallel), (C) Papaloloa Point East, and (D) Fattuana Point. The x-axis is distance along the profile in meters. Profile A is oriented shore perpendicular (north to south); all other profiles (B, C, D) are shore-parallel and oriented west to east (refer to Figures 3 and 4 for detailed location). Profiles A, B, and D were recorded during low tide and profile C was recorded during high tide. Approximate mean sea level (MSL) is indicated to give elevation reference. Saltwater intrusion (blue) is shown below a brackish or freshwater lens (green), underlying a flat, unsaturated thin topsoil layer (orange and yellows) and basaltic flows with low permeability (orange and red). The map in the lower left shows the location of the ERT profiles, labeled by panel letter. Note that the color bar scales for (A, B) are different from (C, D) Electrode spacing (2 m) shown as a line with square symbols denoting the electrodes. The Root Mean Square (RMS) error for each model profile is shown in lower right corner.
2.2.2 Thermal infrared and YSI surveys
Unoccupied Aerial System (UAS)-based thermal infrared (TIR) surveys were conducted using methodologies outlined in Oberle et al. (2022). The surveys employed a 3DR Solo drone platform equipped with a gimbaled FLIR TAU2–640 TIR camera integrated with a ThermalCapture module (TeAx Technology UG). The TAU2–640 features a pixel resolution of 640 × 512, a spectral range of 7.5–13.5 µm, and a 13 mm lens, providing a 45° × 37°field of view. The camera has an emissivity sensitivity of 0.05 K and an internal accuracy of ± 5°C. The UAS-TIR surveys were conducted during morning hours under calm wind conditions (~0.4 m/s) at altitudes of 50 and 200 m above mean sea level. Data were recorded from a stationary hover position during low tide, yielding ground pixel resolutions of 8 and 26 cm, respectively for each altitude, at a capture rate of 4 Hz. TIR imagery was post-processed in ThermoViewer v.3.0.7., compensating for ‘cold corners’ using ThermoViewer’s motion-based non-uniformity correction and drift compensation using flat-field correction events (DiNapoli et al., 2021). Individual frames were extracted from the raw TIR data as radiometric RJPG files and subsequently assembled into orthomosaics using Agisoft Metashape Professional’s (v.1.6) thermal mapping workflow. Thermal orthomosaics were georeferenced using QGIS relative to fixed features, and areas of surficial groundwater discharge were visually delineated based on thermal contrast with surrounding waters. These temperature features were ground-truthed with Solinst 3001 Levelogger pressure/temperature sensors. The resulting images were used to identify SGD point sources and associated surface plumes. To complement the UAS-TIR surveys, a calibrated YSI ProDSS multiparameter instrument with GPS was towed by kayak across the lagoons and reef flat, measuring spatial temperature and salinity patterns at 5–10 cm depth.
2.2.3 Radon‐222
Radon‐222 is an effective tracer for quantifying SGD, because its short half‐life (3.8 d) and its significant enrichment in groundwater relative to surface water allow it to detect short-term (days to weeks) variability in SGD, such as tidal or seasonal fluctuations (Adyasari et al., 2023). In this study, a specially designed autonomous SGD buoy (Oberle et al., 2022) was deployed at 6 locations within SGD plumes for a duration of at least 2 d at each site. The buoy contained one Durridge RAD7 radon detection system (factory calibrated with NIST/IAEA standards of known 222Rn activity) that was employed in conjunction with a water/air exchanger to measure 222Rn in air. This configuration permits near real‐time calculation of aqueous 222Rn concentrations by measuring the air‐phase 222Rn and applying the temperature‐dependent partitioning coefficient (Burnett et al., 2003, 2006; Swarzenski et al., 2006; Schubert et al., 2014). The sampling sites were strategically selected based on ERT results, the YSI water quality surveys, UAS-surveys, and inferred gradients in oceanographic, geologic, and hydrologic controls. Time‐series measurements of 222Rn were recorded at 30‐min intervals over the deployment period at 6 locations on the reef flat composing three cross-shore transects: Papaloloa Point Center and East (Figure 3A), and Fattuana Point (Figure 4A). Each transect included two measurement sites: (1) a coastal spring point source within 3 m of the shoreline and (2) an offshore site 40 m seaward over the shallow reef flat. Freshwater endmembers were collected from a coastal spring at Fattuana Point and from ASPA Well No. 202 (~2 km NW of study site) that supplies drinking water to Ofu, with the endmember value established after peak concentrations stabilized (n = 10). Concurrent and co-located measurements in the surface and bottom waters were conducted using Solinst LTC Leveloggers at the buoy sites, which continuously monitored pressure, conductivity, and temperature. A non‐steady‐state radon mass‐balance box model was then implemented to estimate SGD rates, following methodologies previously described in the literature (Burnett et al., 2003, 2006; Burnett and Dulaiova, 2006; Swarzenski et al., 2006; Schubert et al., 2014). The model incorporates radon inputs from (i) total benthic fluxes via SGD, (ii) diffusive fluxes from sediment, and (iii) in situ production from dissolved 222Ra, while accounting for radon losses due to gas evasion, radioactive decay, and mixing with offshore radon-depleted water. Groundwater discharge rates were calculated by dividing the net radon inventory (i.e., the difference between source and sink fluxes) by the discharging groundwater 222Rn concentration. The combined uncertainty of the SGD rates was calculated by taking the square root of the sum of the squares of individual independent errors of the box model. Most existing SGD studies use standard deviation as a method to calculate uncertainty, which commonly yields uncertainties that are significantly lower than our more robust calculations.
Figure 3
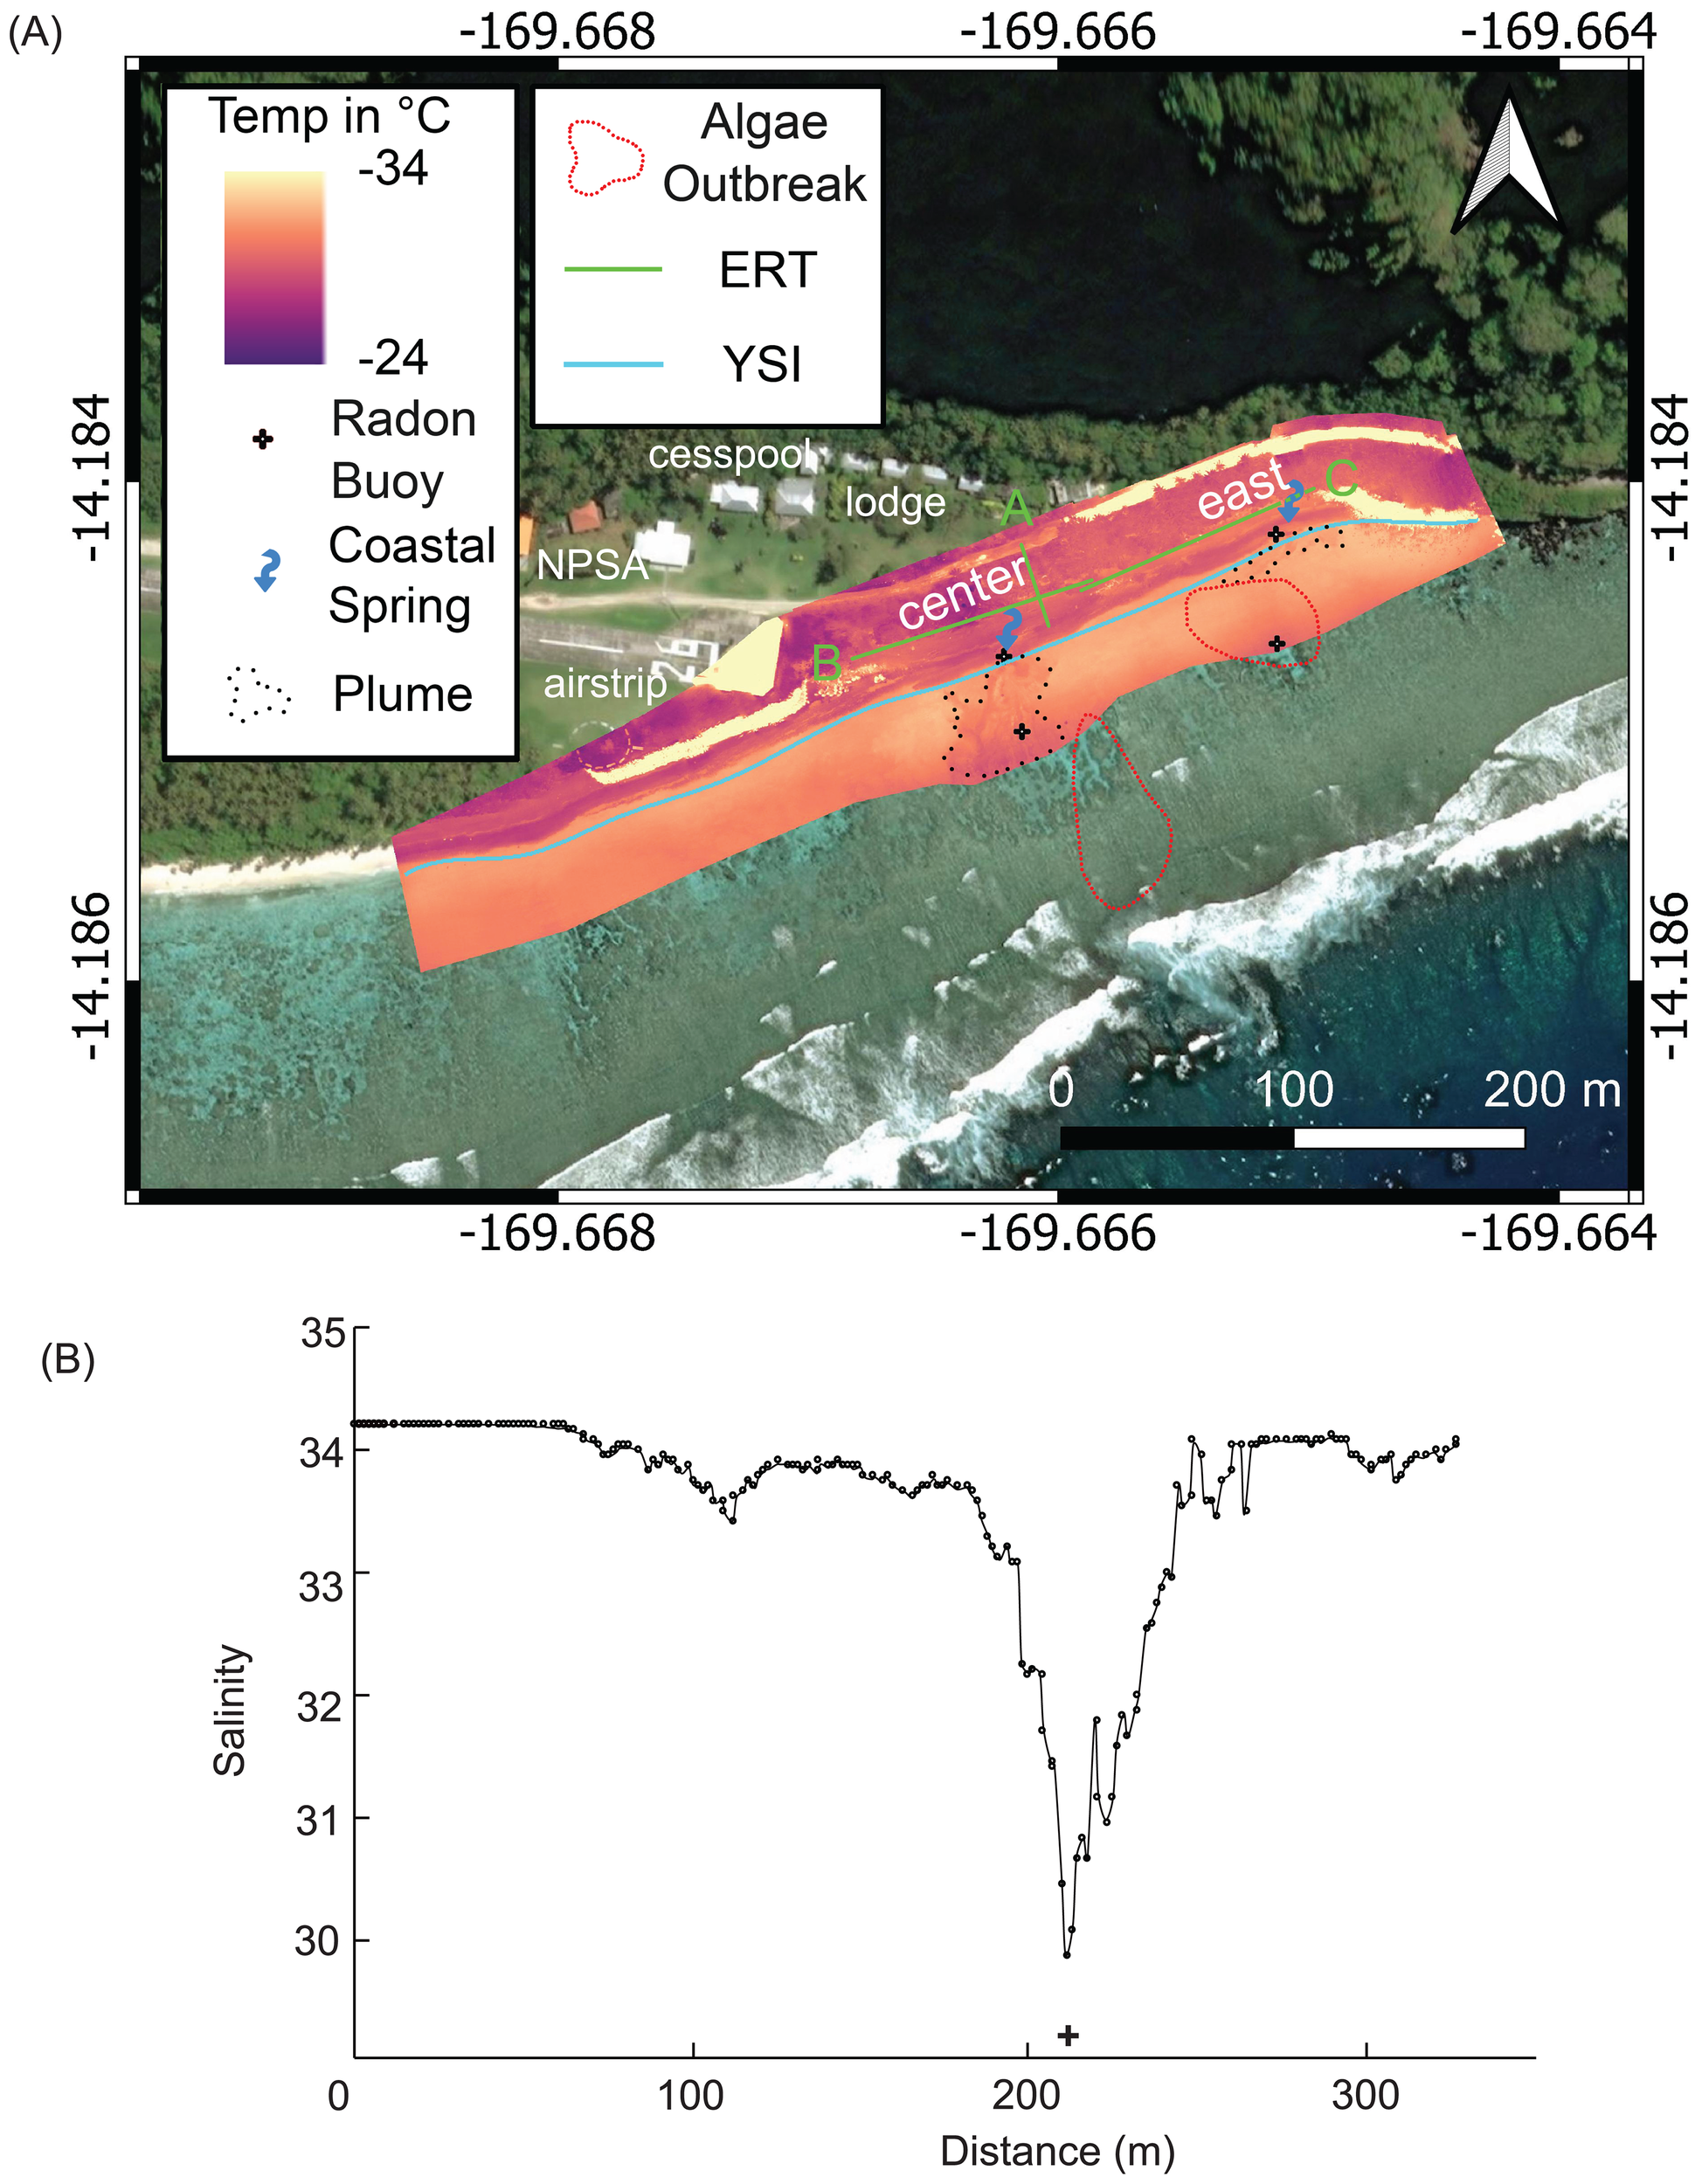
Geophysical and geochemical data at Papaloloa Point. (A) Aerial thermal infrared data (± 5°C). (B) Alongshore YSI salinity plot with relative location of radon buoy alongshore (+). In (A), the map denotes the locations of the SGD radon buoy (black crosses), the electrical resistivity tomography (ERT) surveys A, B,and C (green lines), the YSI transect (blue line), the coastal SGD plumes (black dotted area), and the region of higher algal cover (>11%) Valonia fastigiata (red dotted area). The low salinity (fresher water) coastal SGD plumes emanate from the source springs (blue arrows).
Figure 4

Geophysical and geochemical data at Fattuana Point. (A) Aerial thermal infrared data (± 5°C); (B) Alongshore YSI salinity plot with relative location of radon buoy alongshore (+). In (A), the map denotes the locations of the SGD radon buoy (black crosses), the electrical resistivity tomography (ERT) surveys A, B, and C (green lines), the YSI transect (blue line), the coastal SGD plumes (black dotted area), coastal spring (CS) and the region of higher cover (>11%) Valonia fastigiata (red dotted area). The low salinity (fresher water) coastal SGD plumes emanate from the source springs (blue arrows).
2.2.4 Nutrient and macroalgae analysis
Discrete water samples were collected at low tide from free-flowing coastal springs, a groundwater well (ASPA Well No. 202), Va’oto Marsh, and Va’oto Lodge cesspool (Figure 1). Samples were obtained using a peristaltic pump with a YSI ProDSS sensor to provide in-situ temperature and salinity, and an inline 0.45-µm cellulose nitrate filter to remove particulates. Nearshore and reef-flat samples were filtered with 0.20-µm polyethersulfone syringe filters and frozen until analysis. Dissolved nutrient concentrations were measured at the SOEST Laboratory for Analytical Biogeochemistry at the University of Hawaii via flow injection analysis for ammonium (NH4+), silicate (SiO44-), phosphate (PO43-), and nitrate (NO3-) + nitrite (NO2-), referred to as N+N, with analytical precision ranging from 0.6–3.0%, 0.6–0.8%, 0.9–1.3%, and 0.3–1.0% relative standard deviation, respectively. Select samples were analyzed for nitrate isotope ratios (δ15NNO3 and δ18ONO3) at the University of California, Davis Stable Isotope Facility using the denitrifier method (Sigman et al., 2001) and calibration standards USGS 32, USGS 34, and USGS 35. Isotope values were reported in per mil (‰) relative to AIR for δ15N and VSMOW for δ18O, with precisions of ±0.3‰–0.4‰ and ±0.5‰–0.6‰, respectively.
Macroalgae V. fastigiata samples were collected opportunistically in February 2020 from each pool for δ15N analysis to assess nutrient integration over time (Prouty, 2025). Samples were photographed, frozen, freeze-dried, homogenized, and analyzed using an Elemental Analyzer-Isotope Ratio Mass Spectrometer at the Stable Isotope Geosciences Facility, Texas A&M University and calibration standards USGS 40 and USGS 41a. Analytical uncertainty for δ15N was ±0.2‰.
2.2.5 Hydrodynamic sensors
A suite of hydrodynamic sensors was also deployed along shore-parallel transects in each reef flat pool. However, due to COVID-19-related travel restrictions, many instruments were lost or could not be recovered. Only four RBR Virtuoso pressure sensors—two from the Papaloloa Point reef flat and two from the Fattuana Point reef flat—were successfully retrieved (Cheriton et al., 2024).
3 Results
3.1 Freshwater-saline interface
Spatial ERT measurements from our study represent the first application of this technique on Ofu. Given the relative uniformity of the shoreline and coastal plain geology (Kirch and Hunt, 1993), variations in ERT are assumed to be predominantly driven by changes in salinity (Oberle et al., 2017; Buquet et al., 2016; Johnson et al., 2015). The ERT profiles delineate a distinct nearshore freshwater layer at Papaloloa Point, a feature that is nearly absent at Fattuana Point (Figure 2). Additionally, the profiles reveal a depth-dependent increase in salinity, with the saltwater interface predominantly occurring at mean sea level. The observed freshwater saturation at mean sea level is consistent with the presence of tidally driven SGD springs. In particular, the shore-perpendicular ERT profile at Papaloloa Point Center (Figure 2A) documents a thin freshwater lens (~1 m thick) extending toward the main SGD spring as reported below.
3.2 Submarine groundwater discharge plume
UAS-TIR imagery identified cooler sea-surface temperatures in the Papaloloa Point and Fattuana Point pools, confirming active SGD (Figures 3, 4). Near the SGD point sources captured in the UAS-TIR surveys, YSI transects recorded a 3–4 unit decrease in salinity (Figures 3B, 4B). Based on UAS-TIR imagery, the estimated SGD plume areas were 750 m², 200 m², and 400 m² at Papaloloa Point Center, Papaloloa Point East, and Fattuana Point, respectively, but the imagery also identified spatial heterogeneity at the meter scale. The difference between the average temperature in the SGD plumes and surrounding waters ranged from 2°C to 4°C.
3.3 Submarine groundwater discharge point source
The radon buoy data at Papaloloa Point exhibited a classic inverse relationship between tidal stage and 222Rn concentrations, indicating increased groundwater discharge during low tide when hydraulic gradients between coastal groundwater and seawater were greatest (Figure 5). At Fattuana Point, however, there was a 2–3 hr lag between the minimum water level at low tide and maximum 222Rn concentrations. The highest mean SGD rates were observed at Papaloloa Point Center, followed by Fattuana Point, and Papaloloa Point East (Table 1). Maximum SGD rates at the point sources ranged from 0.15 m d-1 to 2.90 m d-1. Within 40 m offshore, SGD rates decreased by 4% at Papaloloa Point Center and 54% at Fattuana Point, whereas SGD was undetectable offshore at Papaloloa Point East (Table 1).
Figure 5
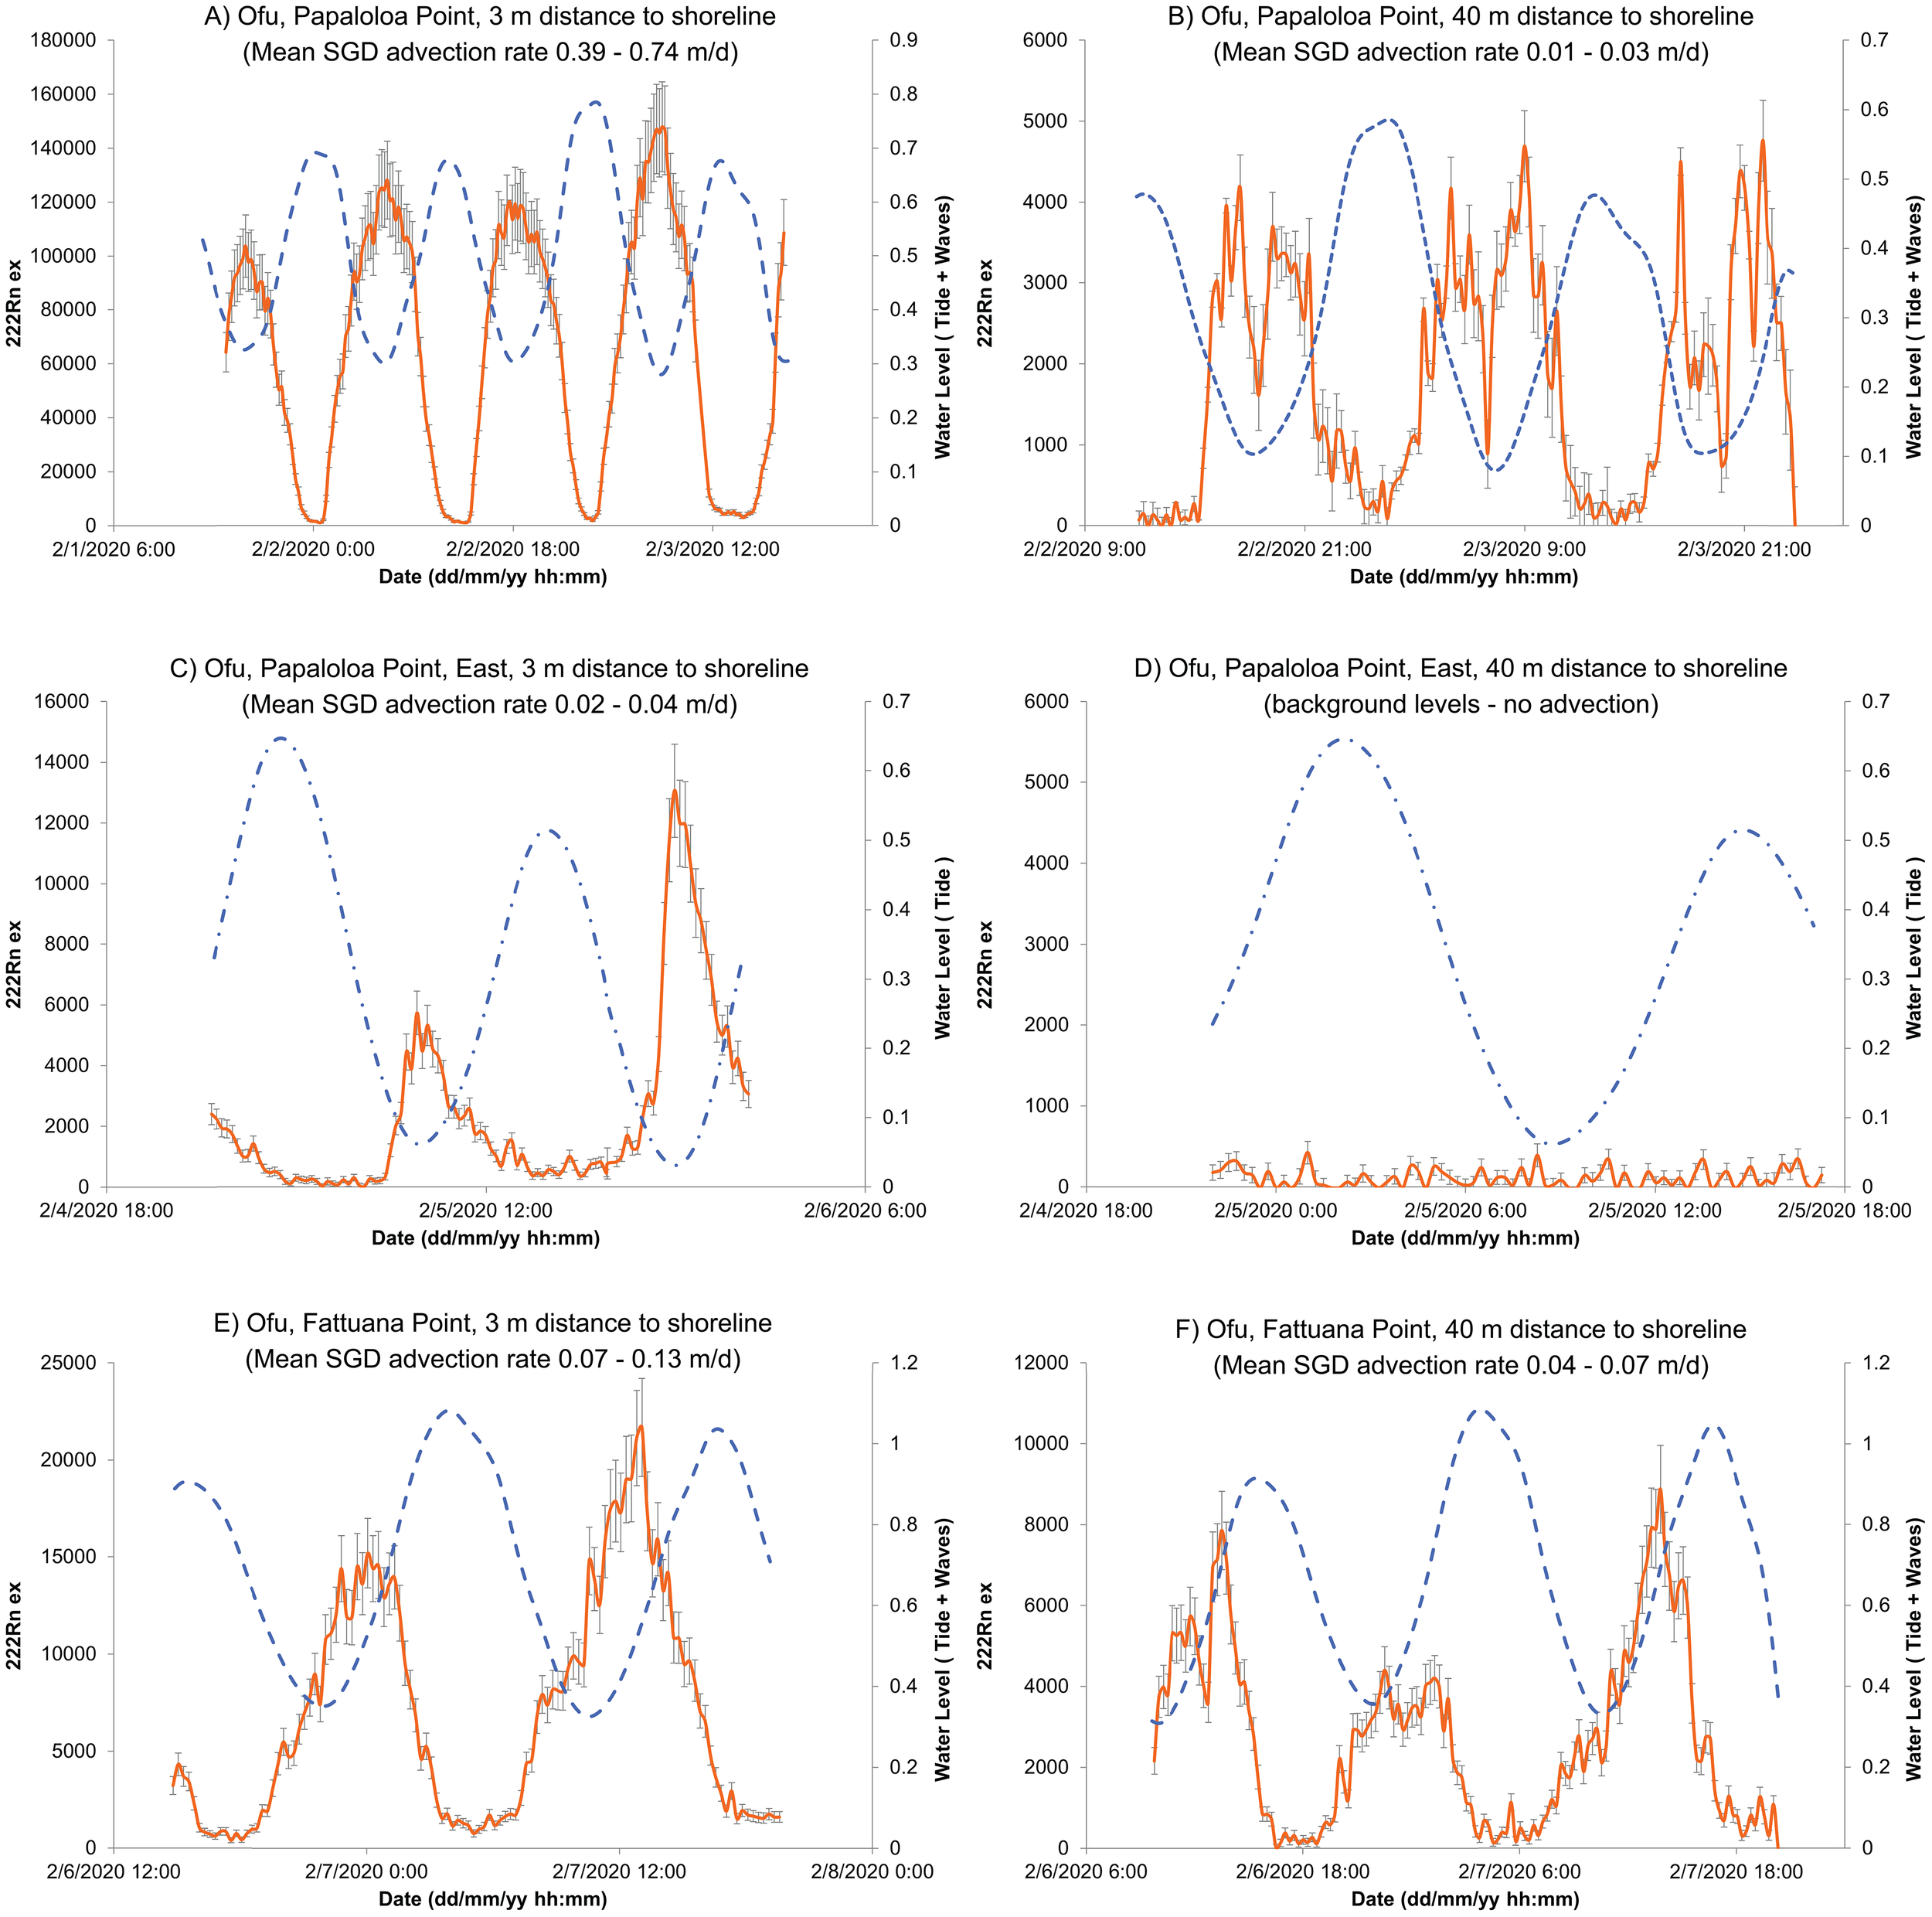
Relationship between excess radon concentrations (222Rn ex; disintegrations min-1 m-3; orange) with ± 1 standard deviation (vertical gray bars) and reef-flat water levels (m; blue dashed line) for three transects: Papaloloa Point Center (A, B), Papaloloa Point East (C, D), and Fattuana Point (E, F). The point-source measurements are the left-hand panels, and the corresponding sites 40 m farther offshore are the right-hand panels. Refer to Figures 3 and 4 for deployment locations. These timeseries, in local time, demonstrate the tidal control on SGD rates, such that the highest excess radon concentrations occur at or after low tide when the hydraulic gradients between the coastal groundwater and the seawater are highest. The highest SGD rates were observed at the point source in Papaloloa Point Center (A).
Table 1
| Location | Papaloloa Point Center nearshore | Papaloloa Point Center offshore | Papaloloa Point East nearshore | Papaloloa Point East offshore | Fattuana Point nearshore | Fattuana Point offshore |
|---|---|---|---|---|---|---|
| Mean SGD rate (m d-1) | 0.39-0.74 | 0.01-0.03 | 0.02-0.04 | n.d. | 0.07-0.13 | 0.04-0.07 |
| Maximum SGD rate (m d-1) | 1.69-2.90 | 0.09-0.17 | 0.15-0.28 | n.d. | 0.38-0.71 | 0.39-0.74 |
| Combined uncertainty (m d-1) | 1.15-2.19 | 0.03-0.06 | 0.04-0.07 | n.d. | 0.21-0.39 | 0.09-0.18 |
| Discharge area (m2) | 750 | 750 | 200 | n.d. | 400 | 400 |
| Mean SGD flux (m3 d-1) | 293-555 | 8-23 | 4-8 | n.d. | 28-52 | 16-28 |
| Maximum SGD flux (m3 d-1) | 1268-2175 | 68-128 | 30-56 | n.d. | 152-284 | 156-296 |
Submarine groundwater discharge (SGD) rates (m d-1) and resulting SGD flux (m3 d-1) at nearshore (~3 m from shore) and offshore (~40 m from shore) locations.
The range in SGD rate and flux represents the use of both the coastal spring and well endmember. The combined uncertainty of the SGD rates was calculated by taking the square root of the sum of the squares of individual independent errors of the box model. The discharge area was determined from the aerial thermal imagery (Figures 3 and 4). Note: Radon‐222 was not detected at the Papaloloa Point East offshore sample station, as denoted by n.d.
The SGD-influenced area delineated with the UAS-TIR (Figures 3, 4) was multiplied with radon-derived advection rates to calculate volumetric SGD rates (Table 1). Following a similar pattern to SGD rates reported above, the highest SGD flux occurred at Papaloloa Point Center (Table 1), with a maximum flux of 2,175 m³ d-1, whereas fluxes at Papaloloa Point East and Fattuana Point were an order of magnitude lower (Table 1). Although SGD fluxes diminished with distance from shore, corals within 40 m of point sources at Papaloloa Point Center and Fattuana Point nonetheless receive input from SGD as documented from the flux measurements made at the offshore buoy locations (Table 1).
3.4 Submarine groundwater discharge composition and nutrient fluxes
Nutrient concentrations were lowest in fore-reef water samples compared to all other sample types (Table 2). Elevated SiO44- levels in the SGD, Va’oto Lodge cesspool, and ASPA Well No. 202 samples indicated freshwater movement through the basaltic aquifer (Stefánsson and Gíslason, 2001), whereas lower SiO44- concentrations in the Va’oto Marsh indicated contributions from other freshwater sources (e.g., rainwater). The cesspool sample contained the highest PO43- and NH4+ concentrations; however, NH4+ was minimal in the SGD samples. PO43- concentrations in the SGD and marsh samples were lower than in the cesspool. In contrast, N+N concentrations were elevated in the cesspool, SGD, and ASPA Well No. 202 samples (Figure 6A). Excluding NH4+, nutrient concentrations correlated significantly (Pearson-product correlation coefficient (r) at p ≤ 0.05) with temperature and salinity (Prouty, 2025), with correlation coefficients ranging from -0.65 to -0.95 and -0.72 to -0.98 (Supplementary Figure 1), respectively supporting the hypothesis that SGD is the primary pathway for nutrient delivery to the pools. Nutrient concentrations at higher salinities are close to oceanic levels, reflecting the effectiveness of physical mixing (e.g., dilution) on nearshore nutrient concentrations (Bienfang et al., 2009). The δ15NNONO3 values from select SGD samples (N+N > 4 μmol L-1) ranged from 5.7‰ to 9.8‰, overlapping with ASPA Well No. 202-water δ15NNONO3 values (Table 3). In contrast, the cesspool sample was 15N-depleted (δ15NNONO3 = -9.2 ± 0.7‰), indicating nitrification (microbial NH4+ oxidation to NO3-) (Figure 6B). Mean δ15N (± SD) values in macroalgae were 5.9 ± 0.6‰ and 3.7 ± 1.3‰ at Fattuana Point and Papaloloa Point, respectively (Table 3). Water sample δ18ONONO3 values ranged from -1.8 to 4.8‰, with the highest values in the cesspool (Table 3). The slope between δ15NNO and δ18ONONO3 at both pools was less than 0.5, indicating minimal, if any fractionation due to denitrification (Kendall et al., 2007).
Table 2
| Location | Salinity | PO43- | SiO44- | N+N | NH4+ |
|---|---|---|---|---|---|
| Papaloloa Point | 18.1 ± 12.8 | 1.1 ± 0.6 | 336.5 ± 247.7 | 9.9 ± 7.9 | 1.1 ± 3.5 |
| Fattuana Point | 11.8 ± 11.5 | 1.7 ± 0.9 | 580.6 ± 411.8 | 20.8 ± 12.3 | 0.1 ± 0.1 |
| fore-reef | 35.0 ± 0.1 | 0.2 ± 0.0 | 1.0 ± 0.1 | 0.5 ± 0.2 | 0.2 ± 0.2 |
| ASPA Well No. 202 | 0.20 ± 0.0 | 2.1 ± 0.1 | 1163.3 ± 16.1 | 11.6 ± 0.1 | 0.1 ± 0.0 |
| Va’oto Lodge cesspool | n.a. | 336.3 ± 5.4 | 1057.2 ± 7.0 | 37.8 ± 4.0 | 2532.0 ± 355.4 |
| Va’oto marsh | 0.1 ± 0.0 | 5.1 ± 0.0 | 129.2 ± 1.3 | 0.7 ± 0.5 | 0.9 ± 0.7 |
Salinity and nutrient concentrations (μmol/L) for the SGD point sources at Papaloloa Point and Fattuana Point, and from the fore reef, ASPA Well No. 202, Va’oto Lodge cesspool and Va’oto marsh, given as the mean (± 1 standard-deviation).
Note: no salinity measurement was taken for the Va’oto Lodge cesspool sample, as denoted by n.a.
Figure 6
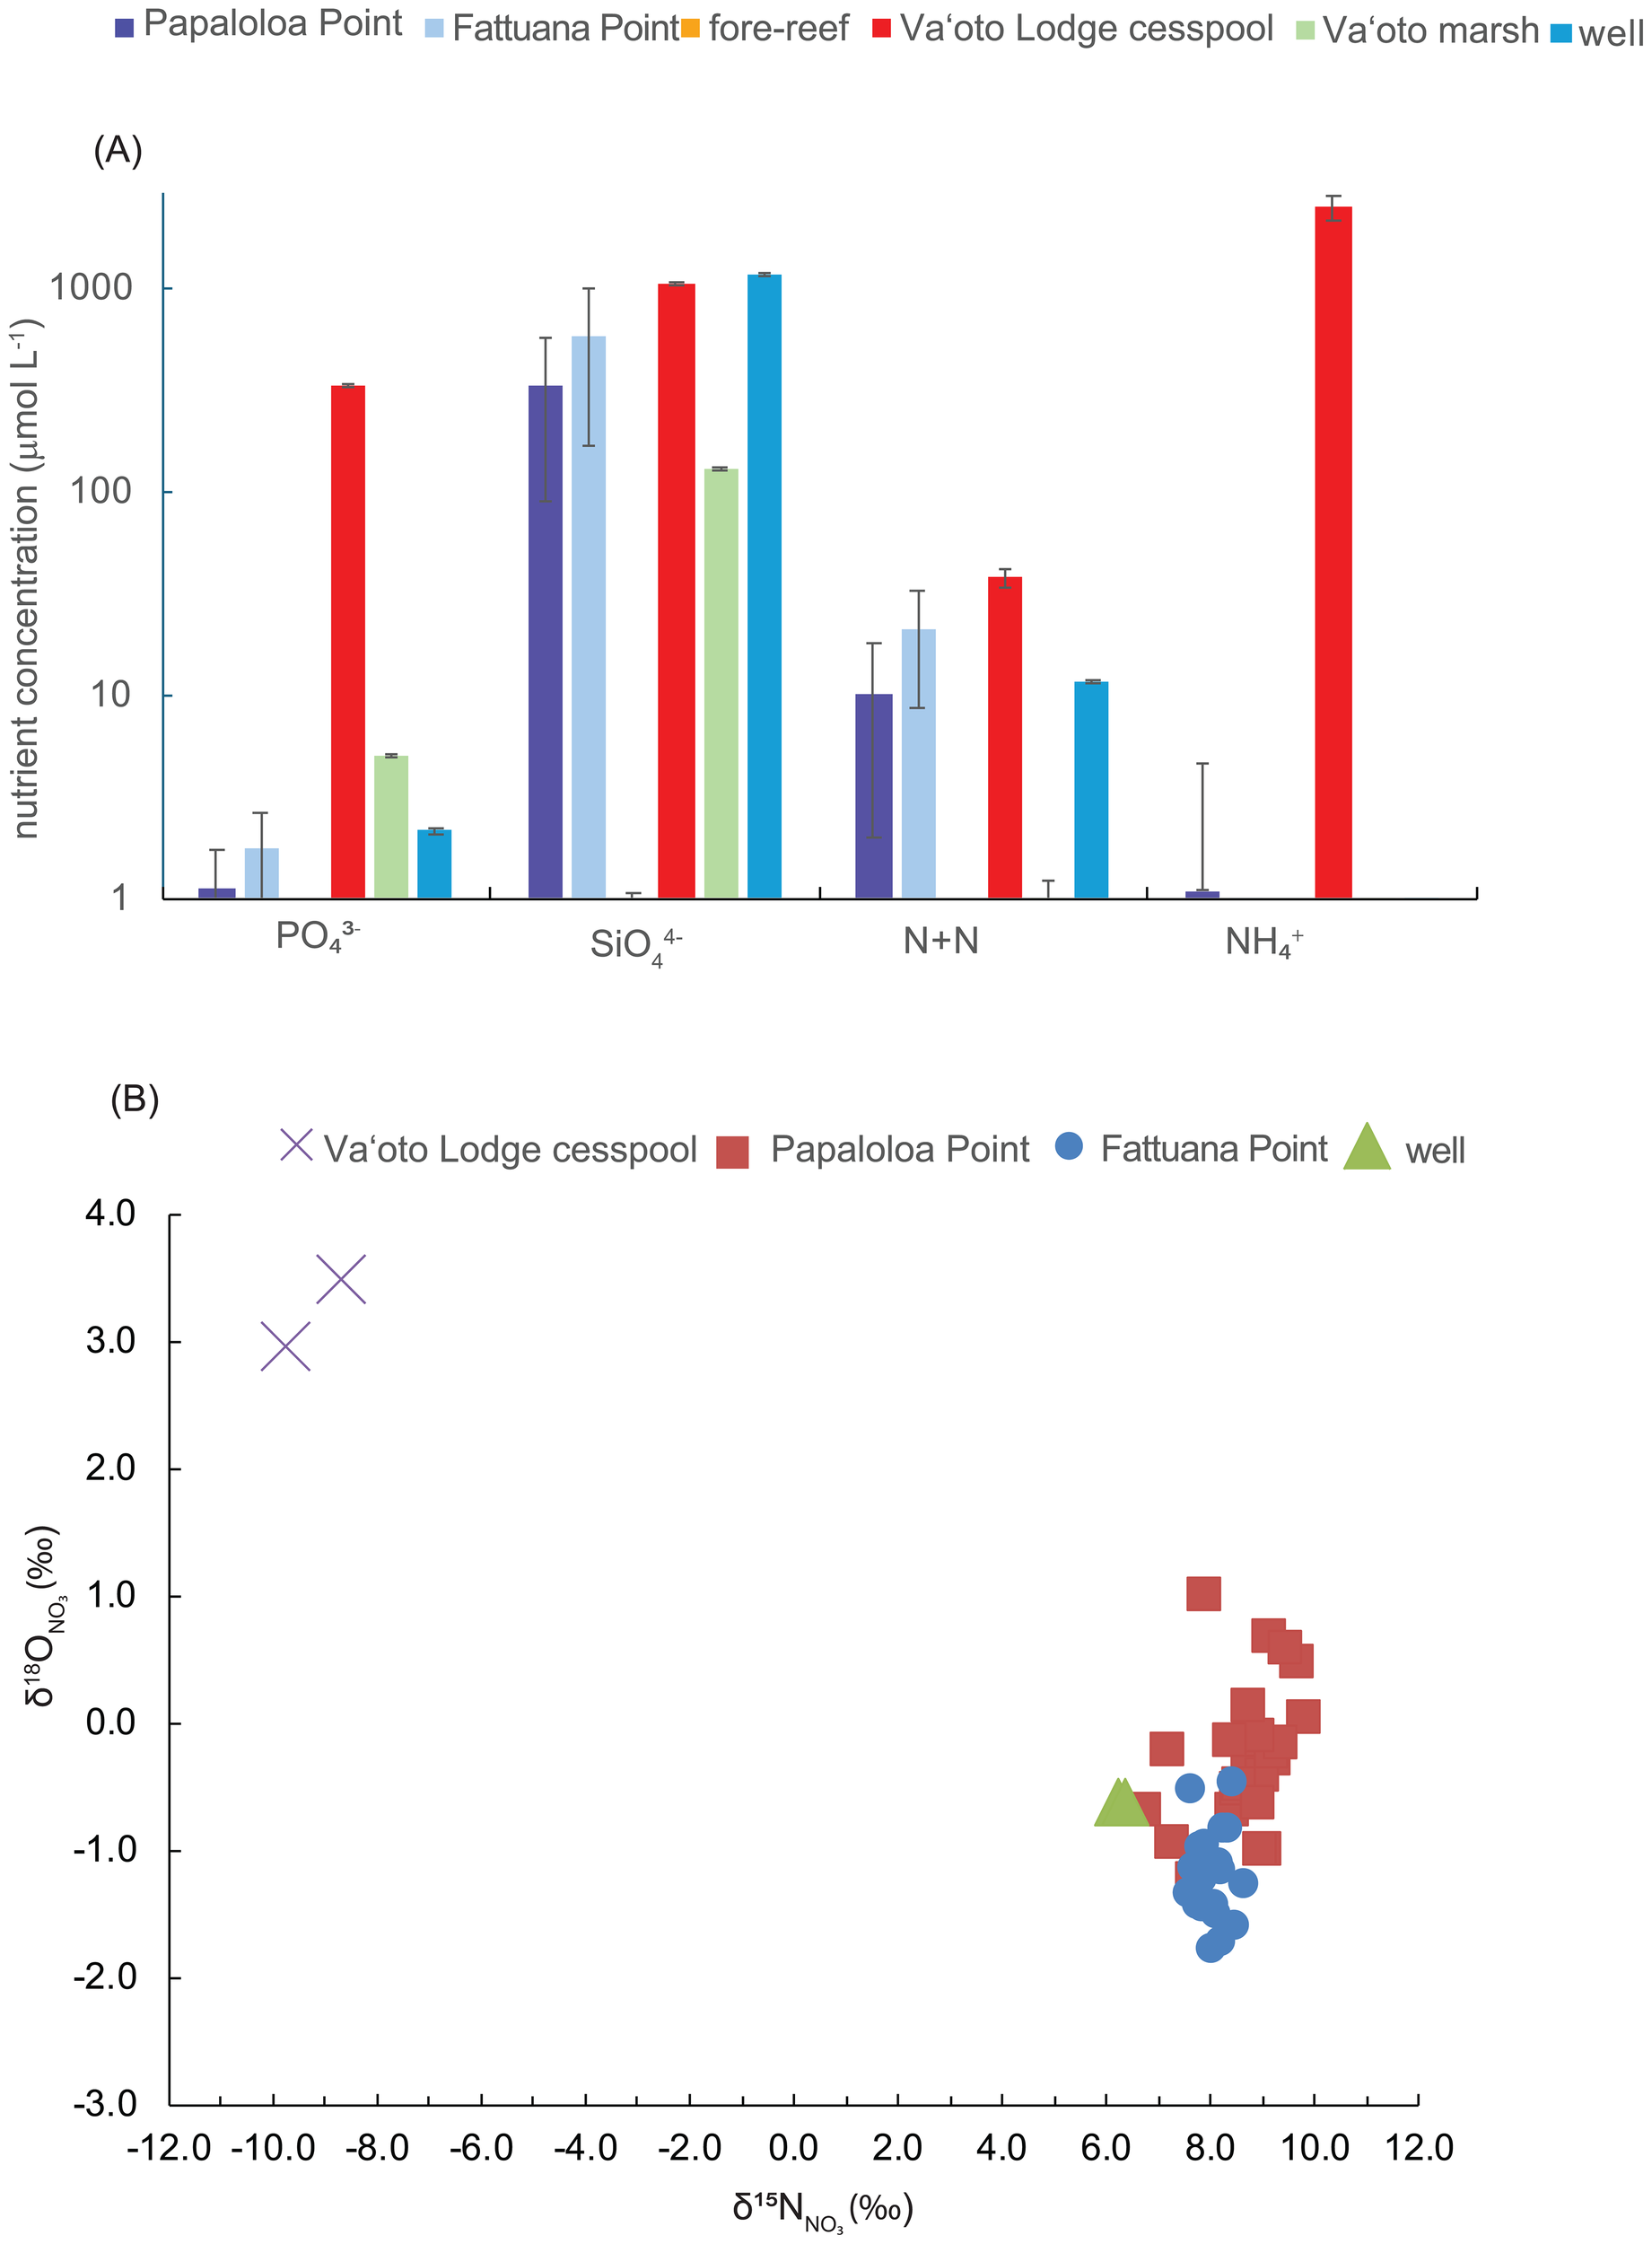
(A) Comparison of nutrient concentrations (mean ± SD; μmol L-1; log scale) from the Papaloloa Point and Fattuana Point SGD point sources, the marine endmember from the fore reef, and potential nutrients sources, including the Va’oto Lodge cesspool, Va’oto Marsh, and ASPA Well No. 202 (Figure 1). (B) The δ15NNONO3 values (x-axis) versus δ18ONONO3 values (y-axis) from Papaloloa Point (red squares) and Fattuana Point (blue circles), ASPA Well No. 202 (green triangle), and Va’oto Lodge cesspool (purple X).
Table 3
| Location | δ15NNO3 | δ18ONO3 |
|---|---|---|
| Papaloloa Point (n = 24) | 8.6 ± 0.8 | -1.2 ± 0.3 |
| Fattuana Point (n = 23) | 7.9 ± 0.6 | -0.2 ± 0.6 |
| ASPA Well No. 202 (n = 2) | 6.3 ± 0.1 | -0.6 ± 0.0 |
| cesspool (n = 2) | -9.2 ± 0.7 | 3.2 ± 0.4 |
| δ15N algae | ||
| Fattuana Point (n = 16) | 5.9 ± 0.6 | |
| Papaloloa Point (n = 17) | 3.7 ± 1.3 |
The upper rows present nitrate isotopes (δ15N and δ18O; ‰) (mean ± 1 standard deviation) from the Papaloloa Point and Fattuana Point SGD sources, fresh groundwater endmember (ASPA Well No. 202), Va’oto Lodge cesspool, and the bottom rows present the algae δ15N values (mean ± 1 standard deviation; ‰).
The number of samples, n, analyzed are indicated in parentheses.
Nutrient fluxes were estimated using mean SGD fluxes and SGD nutrient concentrations normalized to the salinity of groundwater to obtain an unmixed SGD endmember. This approach was necessary because SGD is a mixture of recirculated seawater and freshwater (e.g., Peterson et al., 2009), as confirmed by the high variability in salinity within the SGD samples (Table 2). Despite higher SiO44- and N+N concentrations in the Fattuana Point SGD point-source samples, nutrient fluxes at Papaloloa Point Center were nearly 10 times greater due to higher SGD rates (Table 4).
Table 4
| Location | PO43- | SiO44- | N+N | NH4+ |
|---|---|---|---|---|
| Papaloloa Point Center | ||||
| mean (g d-1) nearshore | 118-223 | 32,080-60,765 | 1,076-2,038 | 66-125 |
| mean (g d-1) offshore | 3-9 | 876-2518 | 29-84 | 2-5 |
| Papaloloa Point East | ||||
| mean (g d-1) nearshore | 2-3 | 438-876 | 15-29 | 1-2 |
| mean (g d-1) offshore | n.d. | n.d. | n.d | n.d. |
| Fattuana Point | ||||
| mean (g d-1) nearshore | 10-19 | 2,501-4,645 | 131-243 | 22-41 |
| mean (g d-1) offshore | 6-10 | 1,429-2,501 | 75-131 | 13-22 |
Calculated SGD nutrient fluxes Papaloloa Point Center, Papaloloa Point East, and Fattuana Point ~3 m from shore and offshore was ~40 m from shore.
Radon‐222 was not detected at the Papaloloa Point East offshore sample station, as denoted by n.d.
4 Discussion
4.1 Inter-site comparison
The field measurements revealed that the SGD plumes exhibit variable spatial extents across each pool. Notably, the largest plume was detected by infrared imaging (i.e., UAS-TIR) at Papaloloa Point Center, whereas comparatively smaller plumes were observed at Papaloloa Point East and Fattuana Point. Differences in the spatial extent of these SGD plumes is supported by a range of SGD fluxes at each point source, and the ERT observations that demonstrate different inland freshwater heads. These differences indicate that subsurface hydrological dynamics strongly influence plume development.
Fresh, cooler water discharging from coastal springs was detected in both Papaloloa Point and Fattuana Point, with a higher flux of SGD and nutrients at Papaloloa Point, particularly at Papaloloa Point Center as discussed above. However, the higher nutrient concentrations at Fattuana Point may indicate variations in subsurface filtration prior to discharge, potentially influenced by differences in sediment composition and hydraulic conductivity (Burnett et al., 2006; Moore, 2010). The permeable calcareous sand and gravel at Papaloloa Point likely function both as a nutrient sink and a freshwater reservoir, facilitating greater groundwater storage and nutrient attenuation through adsorption and microbial processes (Bokuniewicz, 1995). In contrast, the absence of a similar coastal plain at Fattuana Point would result in more limited filtration capacity and reduced groundwater residence times, leading to higher nutrient concentrations in SGD. The observed differences in response times between tidal fluctuations and SGD variations reinforce the conclusion that the hydrogeologic settings at the two sites are distinct. The 2–3-hr time lag at Fattuana Point indicates that SGD originates from an aquifer that has lower diffusivity, indicating a lower permeability and a smaller local storage (Li and Jiao, 2003; Robinson et al., 2006).
In comparison, the coastal plain at Papaloloa Point may act as a highly permeable aquifer that can exhibit a more immediate response to tidal forcing along the coast (Bokuniewicz, 1992). This is supported by the near-synchronous fluctuations in SGD observed at Papaloloa Point, which align closely with tidal cycles (Figure 5). Results from the ERT data are consistent with this interpretation, demonstrating high resistivity and a diffuse discharge zone near Papaloloa Point Center and a smooth boundary between the surface and saturated zone (Figure 2A). At Papaloloa Point, and especially at Papaloloa Point Center, a thicker and more extensive freshwater lens formed, likely because of the presence of a coastal beach platform composed of several meters of Pleistocene to Holocene calcareous sediment (Davis, 1963). This configuration promotes freshwater saturation at mean sea level and facilitates the formation of tidally driven SGD springs (Figure 5A). Additionally, the greater hydraulic tidal connectivity at Papaloloa Point may make it more vulnerable to saltwater intrusion, particularly under conditions of reduced freshwater input or sea-level rise (Michael et al., 2013). This intrusion could contribute to the dilution of nutrient concentrations and an overall increase in salinity, as indicated in the field data (Table 2). In contrast, at Fattuana Point, in the absence of such a coastal beach platform, SGD is directly expelled from the underlying Pleistocene to Pliocene volcanic talus deposits, with only a thin veneer of beach sediment present. The localized high-conductivity (low-resistivity) anomaly and lack of a diffuse, coastal freshwater lens at Fattuana Point (Figure 2D) suggest that SGD here is derived from a more inland aquifer, and the increased time required for the tidal pressure to affect the aquifer (Robinson et al., 2006), results in the observed 2–3-hr lag (Figures 5E, F).
Recirculated volumetric fluxes from Papaloloa Point Center are within the lower range (168 to 6,115 m3 d-1) reported in Shuler et al. (2019) from three watersheds on the adjacent island of Tutuila Island with similar geologic structure. The smaller plume at Papaloloa Point East delivered significantly less freshwater and nutrients, with a negligible offshore (~40 m) SGD signal. The observed variability between coastal springs located approximately 130 m apart within a single pool underscores the spatial heterogeneity of SGD along the shore, demonstrating that traditional box-model methods may misrepresent SGD-driven nutrient fluxes. The high local-scale spatial variability in SGD is further supported by UAS-TIR imagery, which captured a non-uniform distribution of cooler water from the springs (Figures 3, 4). SGD plume size and shape varied with distance from shore but were also influenced by external forces such as currents, waves, and internal discharge dynamics. For example, at Papaloloa Point Center, winds and tides predominantly controlled the SGD plume’s surface area. At Fattuana Point, an asymmetric SGD plume extended westward (Figure 4), further demonstrating that the plume extent and distribution are affected by external hydrodynamic forces. Given these spatial heterogeneities, nutrient fluxes and hydrodynamics must be considered when evaluating the impact of SGD on coral reef health and macroalgal distribution.
4.2 Submarine groundwater sourced nutrients
Despite variations in nutrient concentration and fluxes, SGD remains the dominant nutrient delivery pathway in both pools, consistent with estimates that SGD contributes nutrient loads 10 to 100 times higher than riverine inputs to many tropical watersheds (Santos et al., 2021). Unlike riverine inputs, which fluctuate with precipitation, tidally driven SGD provides a near-continuous nutrient source to reefs (Nelson et al., 2015; Jiang et al., 2021, Camacho-Cruz et al., 2025).
Although we did not conduct a direct tracer study, nutrient concentrations and isotopic values indicate multiple possible nutrient sources to the pools. Elevated NH4+ and PO43- levels in the cesspool relative to the ASPA Well No. 202 demonstrate that these nutrients may serve as tracers for cesspool contributions versus pristine freshwater because they were negligible in the ASPA Well No. 202 sample (Table 2). In contrast, SGD N+N could originate from both the cesspool and groundwater, given their elevated concentrations in both sources. Isotopic signatures can provide additional information on origin and transformation processes (e.g., Kendall et al., 2007). The 15N-depleted cesspool sample (Table 3), combined with high NH4+ concentrations, reveal incomplete nitrification (microbial oxidation of NH4+ to NO3-), leading to significant δ15N fractionation. In some cases, high δ15NNONO3 values in SGD can indicate denitrification, a process commonly associated with wastewater treatment and detected in tropical SGD samples (Prouty et al., 2017). However, the cesspool was untreated, and the slope between the SGD δ15NNO and δ15ONONO3 values does not indicate denitrification. Instead, the SGD δ15NNONO3 values are within the range reported from coastal water samples collected from four watershed on Tutuila along a human land-use gradient (Shuler et al., 2019; 7.4 to 10.3‰). These results suggest that the coral-reef ecosystem in these Ofu pools may be more susceptible to elevated nutrient levels than in other parts of American Samoa.
Unlike water samples, algal δ15N values integrate nutrient sources over time. At Fattuana Point, the mean (± SD) algal δ15N value is 5.9‰ (± 0.6) and 3.7‰ (± 1.3) at Fattuana Point (Table 3). These values are either within or below the range reported from Tutuila (Shuler, 2019; 5.5 to 9.6‰). Previous studies in the Ofu–Olosega reef flat pools (Garrison et al., 2007) found that oceanic and atmospheric sources, rather than anthropogenic inputs, were the dominant nutrient contributors based on algal δ15N values. However, results from our current study yield N+N and PO43- concentrations that exceed those established by the American Samoa Water Quality Standards for coastal waters, 10.7 and 0.65 μmol L-1, and can be considered poor condition according to the National Coastal Condition Assessment (NCCA) program (NCCA, 2010). Despite the small population size on Ofu, the SGD point source N+N and PO43- values were as high, if not higher, than those reported for moderately to highly impacted (i.e., land-use) watersheds on Tutuila Island (Shuler et al., 2019).
4.3 Potential drivers of the algae outbreak
Regardless of nutrient origin, SGD supplies elevated nutrients to the Ofu pools, potentially influencing macroalgal distribution. Notably, V. fastigata was absent from areas of the pools where no SGD was observed, indicating that SGD-derived nutrients may be promoting algal growth. If SGD-derived nutrients were the primary driver of algal proliferation, higher V. fastigata densities would be expected at Papaloloa Point due to its greater SGD flux. However, surveys demonstrate that the algal outbreak was more widespread in Fattuana Point (Figure 4), indicating a more complex relationship between SGD and algal growth. Several factors may help explain this paradox.
Macroalgae require hard substrate for anchoring. In the Ofu reef flat pools, available substrate includes basalt boulders and coral. At Papaloloa Point Center, the reef-flat region immediately surrounding the spring is primarily a large, sand area (>2,000 m²) with very little hard substrate or coral cover, as evident in the aerial imagery (Figure 1). The absence of coral could be due to SGD input or other factors, but the lack of hard substrate likely limits algal establishment. In contrast, Fattuana Point provides more suitable substrate, with higher coral cover and basalt boulders near and to the west of the SGD spring. SGD impacts on coral reef health are also influenced by water motion, particularly residence time. Nutrient exposure depends on nutrient concentration and how long water remains in an area. Differences in residence time may contribute to the observed disparity in algal distributions. Due to lost instruments, precise residence time calculations were not possible. However, temperature differences suggest hydrodynamic variability between sites. Warmer waters at Fattuana Point imply less mixing and longer residence times, whereas cooler temperatures at Papaloloa Point indicate more dynamic conditions and, thus, lower residence times. This aligns with findings from Cheriton et al. (2024), who examined infragravity waves on the southwest Ofu reef flat and found that at Papaloloa Point, moderate infragravity waves (significant wave heights > 0.2 m) occurred nearly 25% of the time, compared to only 13% of the time at Fattuana Point. The higher wave energy at Papaloloa Point likely enhances water mixing and drives increased flow, leading to shorter residence times (Storlazzi et al., 2018). In contrast, the lower wave energy at Fattuana Point suggests longer residence times, thereby allowing SGD-derived nutrients to accumulate over time (Oberle et al., 2019). This would lead to sustained nutrient enrichment, which, when combined with suitable substrate availability, would create favorable conditions for the proliferation of V. fastigiata. In contrast, the more vigorous water mixing at Papaloloa Point likely dilutes nutrient concentrations despite higher SGD fluxes, limiting nutrient retention and the potential for algal overgrowth.
5 Conclusion
This study highlights the spatial and hydrodynamic variability of SGD and its influence on nutrient delivery in small coastal coral-reef ecosystems such as the Ofu reef flat pools. The highest SGD flux was observed at Papaloloa Point Center, whereas Fattuana Point exhibited elevated nutrient concentrations despite lower discharge volumes. This pattern is likely caused by differences in subsurface filtration and hydrogeology, as well as water-mass residence time. At Papaloloa Point, the near-synchronous SGD response with tidal cycles, is consistent with SGD sourced from a coastal, highly permeable aquifer, as captured in the ERT, which depict a broad freshwater lens with direct hydraulic connectivity to a local aquifer. In contrast, a 2–3-hr lag in SGD response at Fattuana Point demonstrates discharge from a more inland aquifer with lower permeability. Although Papaloloa Point exhibited higher SGD fluxes, algal cover was greater at Fattuana Point, likely due to differences in available substrate and hydrodynamics. These findings indicate that local geological and hydrodynamic factors modulate nutrient delivery and impacts on coral reef environments. The isotopic composition of nitrogen in SGD and macroalgae point towards a mixture of natural and anthropogenic nutrient sources. Whereas SGD serves as a continuous nutrient source to the reef, its relationship with macroalgal proliferation is complex and influenced by substrate availability and hydrodynamics. Understanding these dynamics is crucial for managing nutrient impacts on coral-reef ecosystems and mitigating potential eutrophication risks. Further research could help assess long-term ecological consequences and refine nutrient source attribution within these reef environments.
Statements
Data availability statement
The datasets presented in this study can be found in online repositories. The names of the repository/repositories and accession number(s) can be found below: Measurements analyzed in this manuscript are available at the USGS ScienceBase data repository and include https://doi.org/10.5066/P1DVZPUV, https://doi.org/10.5066/P13RJCAJ and https://doi.org/10.5066/P1QPSVMZ.
Author contributions
NP: Writing – original draft, Writing – review & editing. FO: Writing – review & editing, Writing – original draft. OC: Writing – review & editing, Writing – original draft. LT: Writing – review & editing, Writing – original draft. EB: Writing – original draft, Writing – review & editing. CS: Writing – original draft, Writing – review & editing.
Funding
The author(s) declare that financial support was received for the research and/or publication of this article. This research was financially supported by the U.S. Department of Interior, U.S. Geological Survey (USGS) through the Coastal and Marine Hazards and Resources Program and the National Park Service-USGS Water Quality Partnership Program.
Acknowledgments
We thank Ian Moffitt and Valentine Vaeoso from the National Park of American Samoa and Josh Logan and Cordell Johnson from USGS for field work assistance, and Meredith McPherson from USGS for assistance. Thank you to P. Swarzenski from USGS for a thorough and timely review and two reviewers for constructive input.
Conflict of interest
The authors declare that the research was conducted in the absence of any commercial or financial relationships that could be construed as a potential conflict of interest.
Generative AI statement
The author(s) declare that no Generative AI was used in the creation of this manuscript.
Publisher’s note
All claims expressed in this article are solely those of the authors and do not necessarily represent those of their affiliated organizations, or those of the publisher, the editors and the reviewers. Any product that may be evaluated in this article, or claim that may be made by its manufacturer, is not guaranteed or endorsed by the publisher.
Author disclaimer
Any use of trade, firm, or product names is for descriptive purposes only and does not imply endorsement by the U.S. Government.
Supplementary material
The Supplementary Material for this article can be found online at: https://www.frontiersin.org/articles/10.3389/fmars.2025.1600827/full#supplementary-material
References
1
Adyasari D. Dimova N. T. Dulai H. Gilfedder B. S. Cartwright I. McKenzie T. et al . (2023). Radon-222 as a groundwater discharge tracer to surface waters. Earth-Science Rev.238, 104321. doi: 10.1016/j.earscirev.2023.104321
2
Amato D. W. Bishop J. M. Glenn C. R. Dulai H. Smith C. M. (2016). Impact of submarine groundwater discharge on marine water quality and reef biota of Maui. PloS One11, e0165825. doi: 10.1371/journal.pone.0165825
3
Anderson A. (1995). The to’aga site: three millennia of polynesian occupation in the manu’a islands, american Samoa. J. R. Anthropological Institute1, 838–840. doi: 10.2307/3034969
4
Anderson D. M. Glibert P. M. Burkholder J. M. (2002). Harmful algal blooms and eutrophication: nutrient sources, composition and consequences. Estuaries25, 562–584. doi: 10.1007/BF02804901
5
Bachman S. D. Kleypas J. A. Erdmann M. Setyawan E. (2022). A global atlas of potential thermal refugia for coral reefs generated by internal gravity waves. Front. Mar. Sci. 9. doi: 10.3389/fmars.2022.921879
6
Barker V. (2018). Exceptional thermal tolerance of coral reefs in american Samoa: a review. Curr. Climate Change Rep.4, 417–427. doi: 10.1007/s40641-018-0112-3
7
Barshis D. J. Ladner J. T. Oliver T. A. Seneca F. O. Traylor-Knowles N. Palumbi S. R. (2013). Genomic basis for coral resilience to climate change. Proc. Natl. Acad. Sci.110, 1387–1392. doi: 10.1073/pnas.1210224110
8
Bienfang P. De Carlo E. H. Christopher S. DeFelice S. Moeller P. (2009). Trace element concentrations in Coastal Hawaiian waters. Mar. Chem.113(3–4), 164–171.
9
Bienfang P. Johnson W. (1980). Planktonic properties of Honokohau Harbor: A nutrient-enriched subtropical embayment. Pacific Sci.34, 164–171. Available at: https://hdl.handle.net/10125/1627.
10
Bokuniewicz H. (1995). Sedimentary systems of coastal-plain estuaries. Developments Sedimentology Elsevier.53, 49–67. doi: 10.1016/S0070-4571(05)80023-8
11
Bokuniewicz H. J. (1992). Analytical descriptions of subaqueous groundwater seepage. Estuaries15, 458–464. doi: 10.2307/1352390
12
Bruno J. F. Petes L. E. Harvell C. D. Hettinger A. (2003). Nutrient enrichment can increase the severity of coral diseases. Ecol. Lett.6, 1056–1061. doi: 10.1046/j.1461-0248.2003.00544.x
13
Buquet D. Sirieix C. Anschutz P. Malaurent P. Charbonnier C. Naessens F. et al . (2016). Shape of the shallow aquifer at the fresh water–sea water interface on a high-energy sandy beach. Estuarine Coast. Shelf Sci.179, 79–89. doi: 10.1016/j.ecss.2015.08.019
14
Burnett W. C. Aggarwal P. K. Aureli A. Bokuniewicz H. Cable J. E. Charette M. A. et al . (2006). Quantifying submarine groundwater discharge in the coastal zone via multiple methods. Sci. Total Environ.367, 498–543. doi: 10.1016/j.scitotenv.2006.05.009
15
Burnett W. C. Bokuniewicz H. Huettel M. Moore W. S. Taniguchi M. (2003). Groundwater and pore water inputs to the coastal zone. Biogeochemistry66, 3–33. doi: 10.1023/B:BIOG.0000006066.21240.53
16
Burnett W. C. Dulaiova H. (2006). Radon as a tracer of submarine groundwater discharge into a boat basin in Donnalucata, Sicily. Continental Shelf Res.26, 862–873. doi: 10.1016/j.csr.2005.12.003
17
Camacho-Cruz K. Ortiz-Hernández M. C. Carrillo L. Sánchez A. (2025). Variability of the trophic state in a coastal reef system associated with submarine groundwater discharge in the Mexican Caribbean. Environ. Sci. pollut. Res.32, 3174–3319. doi: 10.1007/s11356-024-32818-9
18
Cheriton O. M. Storlazzi C. D. Oberle F. K. Rosenberger K. J. Brown E. K. (2024). Extreme low-frequency waves on the Ofu, American Samoa, reef flat. Coral Reefs43, 185–191. doi: 10.1007/s00338-023-02453-w
19
Craig P. Birkeland C. Belliveau S. (2001). High temperatures tolerated by a diverse assemblage of shallow-water corals in American Samoa. Coral Reefs20, 185–189. doi: 10.1007/s003380100159
20
Dailer M. L. Knox R. S. Smith J. E. Napier M. Smith C. M. (2010). Using δ15N values in algal tissue to map locations and potential sources of anthropogenic nutrient inputs on the island of Maui, Hawai’i, USA. Mar. pollut. Bull.60, 655–671. doi: 10.1016/j.marpolbul.2009.12.021
21
Dailer M. L. Ramey H. L. Saephan S. Smith C. M. (2012). Algal δ15N values detect a wastewater effluent plume in nearshore and offshore surface waters and three-dimensionally model the plume across a coral reef on Maui, Hawai’i, USA. Mar. pollut. Bull.64, 207–213. doi: 10.1016/j.marpolbul.2011.12.004
22
Davis D. A. (1963). Ground-water reconnaissance of american Samoa. US Government Printing Office21, 21. doi: 10.3133/wsp1608C
23
Dimova N. T. Swarzenski P. W. Dulaiova H. Glenn C. R. (2012). Utilizing multichannel electrical resistivity methods to examine the dynamics of the fresh water–seawater interface in two Hawaiian groundwater systems. J. Geophysical Research: Oceans117. doi: 10.1029/2011JC007509
24
DiNapoli R. J. Lipo C. P. de Smet T. S. Hunt T. L. (2021). Thermal imaging shows submarine groundwater discharge plumes associated with ancient settlements on rapa nui (Easter island, Chile). Remote Sens.13, 2531. doi: 10.3390/rs13132531
25
Erftemeijer P. L. A. Riegl B. Hoeksema B. W. Todd P. A. (2012). Environmental impacts of dredging and other sediment disturbances on corals: A review. Mar. pollut. Bull.64, 1737–1765. doi: 10.1016/j.marpolbul.2012.05.008
26
Fabricius K. E. (2005). Effects of terrestrial runoff on the ecology of corals and coral reefs: review and synthesis. Mar. pollut. Bull.50, 125–146. doi: 10.1016/j.marpolbul.2004.11.028
27
Fabricius K. E. Langdon C. Uthicke S. Humphrey C. Noonan S. De’ath G. et al . (2011). Losers and winners in coral reefs acclimatized to elevated carbon dioxide concentrations. Nat. Climate Change1, 165–169. doi: 10.1038/nclimate1122
28
Fackrell J. K. Glenn C. R. Popp B. N. Whittier R. B. Dulai H. (2016). Wastewater injection, aquifer biogeochemical reactions, and resultant groundwater N fluxes to coastal waters: Kā’anapali, Maui, Hawai’i. Mar. pollut. Bull.110, 281–292. doi: 10.1016/j.marpolbul.2016.06.050
29
Garrison V. Kroeger K. Fenner D. Craig P. (2007). Identifying nutrient sources to three lagoons at Ofu and Olosega, American Samoa using δ15N of benthic macroalgae. Mar. pollut. Bull.54, 1830–1838. doi: 10.1016/j.marpolbul.2007.08.016
30
Gattuso J. P. Magnan A. Billé R. Cheung W. W. L. Howes E. L. Joos F. et al . (2015). Contrasting futures for ocean and society from different anthropogenic CO2 emissions scenarios. Science349. doi: 10.1126/science.aac4722
31
Hearn C. J. (2011). Perspectives in coral reef hydrodynamics. Coral Reefs30, 1. doi: 10.1007/s00338-011-0752-4
32
Hoegh-Guldberg O. Mumby P. J. Hooten A. J. Steneck R. S. Greenfield P. Gomez E. et al . (2007). Coral reefs under rapid climate change and ocean acidification. Science318, 1737–1742. doi: 10.1126/science.1152509
33
Hu C. Muller-Karger F. E. Swarzenski P. W. (2006). Hurricanes, submarine groundwater discharge, and Florida’s red tides. Geophysical Res. Lett.33. doi: 10.1029/2005GL025449
34
Hunt C. D. Jr. Rosa S. N. (2009). A multitracer approach to detecting wastewater plumes from municipal injection wells in nearshore marine waters at Kihei and Lahaina, Maui, Hawaii. U.S. Geological Survey Sci. Investigations Rep. 2009-5253, 166. doi: 10.3133/sir20095253
35
Jiang Z.-P. Lv J. Li Q. Dai M. Kao S.-J. Zheng N. et al . (2021). Tidal-driven submarine groundwater discharge and its influences on the carbonate system of a coastal cora reef in the Northern South China Sea. J. Geophysical Research: Oceans126, e2021JC017203. doi: 10.1029/2021JC017203
36
Johnson C. Swarzenski P. W. Richardson C. M. Smith C. F. Kroeger K. Ganguli P. M. (2015). Ground-truthing electrical resistivity methods in support of submarine groundwater discharge studies: Examples from Hawaii, Washington, and California. J. Environ. Eng. Geophysics20, 81–87. doi: 10.2113/JEEG20.1.81
37
Kendall C. Elliott E. M. Wankel S. D. (2007). “Tracing anthropogenic inputs of nitrogen to ecosystems,” in Stable isotopes in ecology and environmental science. Eds. MichenerR. H.LajthaK. (Blackwell Publishing, Malden, MA), 375–344.
38
Kirch P. V. Hunt T. L. (1993). The To’aga site: three millennia of Polynesian occupation in the Manu’a Islands, American Samoa. Cambridge University Press, Cambridge.
39
Kirch P. V. Hunt T. L. Nagaoka L. Tyler J. (1990). An ancestral Polynesian occupation site at To’aga, Ofu Island, American Samoa. Archaeology Oceania25, 1–15. doi: 10.1002/j.1834-4453.1990.tb00225.x
40
Lapointe B. E. Barile P. J. Littler M. M. Littler D. S. (2005). Macroalgal blooms on southeast Florida coral reefs. II. Cross-shelf δ15N values provide evidence of widespread sewage enrichment. Harmful Algae4, 1106–1122. doi: 10.1016/j.hal.2005.06.002
41
Li H. Jiao J. J. (2003). Tide-induced seawater–groundwater circulation in a multi-layered coastal leaky aquifer system. J. Hydrology274, 211–224. doi: 10.1016/S002-1694(02)00413-4
42
Littler M. M. Littler D. S. (1985). “Ecological field methods: macroalgae,” in Handbook of Phycological Methods. Eds. LittlerM. M.LittlerD. S.. Cambridge University Press, Cambridge, 161–175.
43
Manheim F. T. Krantz D. E. Bratton J. F. (2004). Studying ground water under Delmarva coastal bays using electrical resistivity. Groundwater42, 1052–1068. doi: 10.1111/j.1745-6584.2004.tb02643.x
44
Maticka S. A. Rogers J. S. Woodson C. B. Hefner B. B. Monismith S. G. (2022). Reef flat flow dynamics for a nearly closed fringing reef lagoon: Ofu, American Samoa. J. Geophysical Research: Oceans127, e2022JC018831. doi: 10.1029/2022JC018831
45
Michael H. A. Russoniello C. J. Byron L. A. (2013). Global assessment of vulnerability to sea-level rise in topography-limited and recharge-limited coastal groundwater systems. Water Resour. Res.49, 2228–2240. doi: 10.1002/wrcr.20213
46
Monismith S. G. (2006). Hydrodynamics of coral reefs. Annu. Rev. Fluid Mechanics39, 37–55. doi: 10.1146/annurev.fluid.38.050304.092125
47
Moore W. S. (2010). The fffect of submarine groundwater discharge on the ocean. Annu. Rev. Mar. Sci.2, 59–88. doi: 10.1146/annurev-marine-120308-081019
48
Moosdorf N. Stieglitz T. Waska H. Dürr H. H. Hartmann J. (2015). Submarine groundwater discharge from tropical islands: a review. Grundwasser20, 53–67. doi: 10.1007/s00767-014-0275-3
49
National Park Service (2017). Foundation document: national park of american Samoa Vol. 82 (National Park Service, Washington, D.C.).
50
NCCA (2010). US EPA national coastal assessment 2010, american Samoa reef flat. Available online at: https://www.epa.gov/national-aquatic-resource-surveys/ncca (Accessed January 2019).
51
Nelson C. E. Donahue M. J. Dulaiova H. Goldberg S. J. La Valle F. F. Lubarsky K. et al . (2015). Fluorescent dissolved organic matter as a multivariate biogeochemical tracer of submarine groundwater discharge in coral reef ecosystems. Mar. Chem.177, 232–243. doi: 10.1016/j.marchem.2015.06.026
52
Oberle F. K. Cheriton O. M. Swarzenski P. W. Brown E. K. Storlazzi C. D. (2023). Physicochemical coastal groundwater dynamics between Kauhakō Crater lake and Kalaupapa settlement, Moloka ‘i, Hawai ‘i. Mar. pollut. Bull.187, 114509. doi: 10.1016/j.marpolbul.2022.114509
53
Oberle F. K. Prouty N. G. Swarzenski P. W. Storlazzi C. D. (2022). High-resolution observations of submarine groundwater discharge reveal the fine spatial and temporal scales of nutrient exposure on a coral reef: Faga’alu, AS. Coral Reefs41, 849–854. doi: 10.1007/s00338-022-02245-8
54
Oberle F. K. J. Storlazzi C. D. Cheriton O. M. Takesue R. K. Hoover D. J. Logan J. B. et al . (2019). Physicochemical controls on zones of higher coral stress where black band disease occurs at mākua reef, kaua’i, hawai’i. Front. Mar. Sci.6. doi: 10.3389/fmars.2019.00552
55
Oberle F. K. Swarzenski P. W. Storlazzi C. D. (2017). Atoll groundwater movement and its response to climatic and sea-level fluctuations. Water9, 650. doi: 10.3390/w9090650
56
Oliver T. A. Palumbi S. R. (2009). Distributions of stress-resistant coral symbionts match environmental patterns at local but not regional scales. Mar. Ecol. Prog. Ser.378, 93–103. doi: 10.3354/meps07871
57
Palumbi S. R. Barshis D. J. Traylor-Knowles N. Bay R. A. (2014). Mechanisms of reef coral resistance to future climate change. Science344, 895–898. doi: 10.1126/science.1251336
58
Parsons M. L. Walsh W. J. Settlemier C. J. White D. J. Ballauer J. M. Ayotte P. M. et al . (2008). A multivariate assessment of the coral ecosystem health of two embayments on the lee of the island of Hawai’i. Mar. pollut. Bull.56, 1138–1149. doi: 10.1016/j.marpolbul.2008.03.004
59
Paytan A. Shellenbarger G. G. Street J. H. Gonneea M. E. Davis K. Young M. B. et al . (2006). Submarine groundwater discharge: An important source of new inorganic nitrogen to coral reef ecosystems. Limnology Oceanography51, 343–348. doi: 10.4319/lo.2006.51.1.0343
60
Peterson R. N. Burnett W. C. Glenn C. R. Johnson A. G. (2009). Quantification of point-source groundwater discharges from the shoreline of the Big Island, Hawaii. Limnol. Oceanogr.54, 890–904. doi: 10.4319/lo.2009.54.3.0890
61
Prouty N. G. (2025). Water and algal chemistry measurements collected from the National Park Service’s National Park of American Samoa (NPS-NPSA) Ofu Island unit: U.S. Geological Survey. doi: 10.5066/P1DVZPUV
62
Prouty N. G. Cohen A. Yates K. K. Storlazzi C. D. Swarzenski P. W. White D. (2017). Vulnerability of coral reefs to bioerosion from land-based sources of pollution. J. Geophysical Research: Oceans122, 9319–9331. doi: 10.1002/2017JC013264
63
Redding J. E. Myers-Miller R. L. Baker D. M. Fogel M. Raymundo L. J. Kim K. (2013). Link between sewage-derived nitrogen pollution and coral disease severity in Guam. Mar. pollut. Bull.73, 57–63. doi: 10.1016/j.marpolbul.2013.06.002
64
Robinson C. Gibbes B. Li L. (2006). Driving mechanisms for groundwater flow and salt transport in a subterranean estuary. Geophysical Res. Lett.33. doi: 10.1029/2005GL025247
65
Santos I. R. Chen X. Lecher A. L. Sawyer A. H. Moosdorf N. Rodellas V. et al . (2021). Submarine groundwater discharge impacts on coastal nutrient biogeochemistry. Nat. Rev. Earth Environ.2, 307–323. doi: 10.1038/s43017-021-00152-0
66
Schubert M. Scholten J. Schmidt A. Comanducci J. F. Pham M. K. Mallast U. et al . (2014). Submarine groundwater discharge at a single spot location: evaluation of different detection approaches. Water6, 584–601. doi: 10.3390/w6030584
67
Shedrawi G. Falter J. L. Friedman K. J. Lowe R. J. Pratchett M. S. Simpson C. J. et al . (2017). Localised hydrodynamics influence vulnerability of coral communities to environmental disturbances. Coral Reefs36, 861–872. doi: 10.1007/s00338-017-1576-7
68
Shuler C. K. (2019). From recharge to reef: assessing the sources, quantity, and transport of groundwater on Tutuila Island, American Samoa, University of Hawai’i at Manoa. University of Hawaii, Manoa, Hawaii.
69
Shuler C. K. Amato D. W. Gibson V. Baker L. Olguin A. N. Dulai H. et al . (2019). Assessment of terrigenous nutrient loading to coastal ecosystems along a human land-use gradient, Tutuila, American Samoa. Hydrology6, 18. doi: 10.3390/hydrology6010018
70
Sigman D. M. Casciotti K. L. Andreani M. Barford C. Galanter M. Bohlke J. K. (2001). A bacterial method for the nitrogen isotopic analysis of nitrate in seawater and freshwater. Anal. Chem.73, 4145–4415. doi: 10.1021/ac010088e
71
Stefánsson A. Gíslason S. R. (2001). Chemical weathering of basalts, Southwest Iceland: effect of rock crystallinity and secondary minerals on chemical fluxes to the ocean. Am. J. Sci.301, 513–556. doi: 10.2475/ajs.301.6.513
72
Storlazzi C. D. Gingerich S. B. van Dongeren A. Cheriton O. M. Swarzenski P. W. Quataert E. et al . (2018). Most atolls will be uninhabitable by the mid-21st century because of sea-level rise exacerbating wave-driven flooding. Sci. Adv.4, eaap9741. doi: 10.1126/sciadv.aap9741
73
Storlazzi C. D. Reguero B. G. Cole A. D. Lowe E. Shope J. B. Gibbs A. E. et al . (2019). Rigorously valuing the role of U.S. coral reefs in coastal hazard risk reduction: U.S. Geological Survey Open-File Report 2019–1027. U.S. Geological Survey, Reston, VA. 42.
74
Swarzenski P. W. Burnett W. C. Greenwood W. J. Herut B. Peterson R. Dimova N. et al . (2006). Combined time-series resistivity and geochemical tracer techniques to examine submarine groundwater discharge at Dor Beach, Israel. Geophysical Res. Lett.33. doi: 10.1029/2006GL028282
75
Swarzenski P. W. Dulai H. Kroeger K. D. Smith C. G. Dimova N. Storlazzi C. D. et al . (2017). Observations of nearshore groundwater discharge: Kahekili Beach Park submarine springs, Maui, Hawaii. J. Hydrology: Regional Stud.11, 147–165. doi: 10.1016/j.ejrh.2015.12.056
76
Swarzenski P. W. Reich C. Kroeger K. D. Baskaran M. (2007). Ra and Rn isotopes as natural tracers of submarine groundwater discharge in Tampa Bay, Florida. Mar. Chem.104, 69–84. doi: 10.1016/j.marchem.2006.08.001
77
Swarzenski P. W. Storlazzi C. D. Presto M. K. Gibbs A. E. Smith C. G. Dimova N. T. et al . (2012). Nearshore morphology, benthic structure, hydrodynamics, and coastal groundwater discharge near Kahekili Beach Park, Maui, Hawaii. U.S. Geological Survey Open-File Rep. 2012–116683, 34. doi: 10.3133/ofr20121166
78
Taniguchi M. Burnett W. C. Cable J. E. Turner J. V. (2002). Investigation of submarine groundwater discharge. Hydrological Processes16, 2115–2129. doi: 10.1002/hyp.1145
79
USACE (2022). American Samoa final post disaster watershed plan. US Army Corps Engineers Rep.9, 155. Available at: https://www.poh.usace.army.mil/Portals/10/Civil%20Works/American%20Samoa%20Draft%20Watershed%20Plan%20March%202022/Main%20Report%20American%20Samoa%20Draft%20Watershed%20Plan.pdf.
80
Vaeoso V. (2022). Ofu-olosega invasive algae monitoring report, NPS monitoring report. National Park Service, Washington, D.C.17.
Summary
Keywords
submarine groundwater, coral, algae, nutrients, hydrogeology
Citation
Prouty NG, Oberle FKJ, Cheriton OM, Toth LT, Brown EK and Storlazzi CD (2025) Land-based nutrient flux to a fringing reef: insights from Ofu Island, American Samoa. Front. Mar. Sci. 12:1600827. doi: 10.3389/fmars.2025.1600827
Received
27 March 2025
Accepted
08 July 2025
Published
31 July 2025
Volume
12 - 2025
Edited by
Wei Jiang, Guangxi University, China
Reviewed by
Alberto Sánchez-González, National Polytechnic Institute (IPN), Mexico
Qianqian Wang, East China Normal University, China
Updates
Copyright
© 2025 Prouty, Oberle, Cheriton, Toth, Brown and Storlazzi.
This is an open-access article distributed under the terms of the Creative Commons Attribution License (CC BY). The use, distribution or reproduction in other forums is permitted, provided the original author(s) and the copyright owner(s) are credited and that the original publication in this journal is cited, in accordance with accepted academic practice. No use, distribution or reproduction is permitted which does not comply with these terms.
*Correspondence: Nancy G. Prouty, nprouty@usgs.gov
Disclaimer
All claims expressed in this article are solely those of the authors and do not necessarily represent those of their affiliated organizations, or those of the publisher, the editors and the reviewers. Any product that may be evaluated in this article or claim that may be made by its manufacturer is not guaranteed or endorsed by the publisher.