Abstract
In response to the Benyon review the UK Government introduced three Highly Protected Marine Areas (HPMAs), adding to the 178 Marine protected areas (MPAs) already designated in English waters. All extractive, destructive and depositional activities are prohibited within HPMAs to promote ecosystem recovery. However, it is a requirement of the designation process to consider the socio-economic impacts of the placement of a HPMA. There are many marine sectors competing for space in English waters, therefore displacing all damaging or disturbing activities occurring within newly designated HPMAs could further exacerbate this conflict. One key marine sector that is vulnerable to displacement from HPMAs is commercial fishing. Although a template to assess displacement has been developed, this template has not yet been applied. Therefore, this study aims to bridge this gap; applying a full displacement assessment to a Hypothetical HPMA (HypHPMA, 25km2), located within English inshore waters. This study investigates the extent to which commercial fishing vessels use the HypHPMA and potential reductions in catch (kg) and gross revenue changes (£) resulting from their displacement following hypothetical designation, using the R package VMStools. In addition, the habitat type and sensitivity within the HypHPMA and surrounding areas were analysed to highlight sensitive areas now protected by the HypHPMA or surrounding areas that may be more sensitive to fishing displacement. Our method allows fine spatial and temporal scales of socioeconomic analysis which can identify fleet and individual vessel vulnerabilities to displacement, alongside environmental analyses which quantify interactions between fishing gear and specific sensitive habitats. This method has wider utility than assessing displacement from HPMAs – it can be used to assess displacement resulting from other spatial management measures that restrict fishing activity.
1 Introduction
Marine Protected Areas (MPAs) are internationally recognised as having an important role in conserving biodiversity with virtually all coastal states implementing at least one MPA ranging on the IUCN scale of protected areas categories from Ia (strict nature reserve) to VI (protected area with sustainable use of natural resources) (Vaughan and Agardy, 2020). The MPA network now consists of 181 MPAs across 35,000 square miles, or 40% of English waters (JNCC, 2023). After the third tranche of Marine Conservation Zone (MCZ) designations in 2019, the Department for Environment, Food and Rural Affairs (Defra) considered the MPA network to be substantially complete and representative of the English and Northern Ireland offshore marine environment (Defra, 2025). The focus of conservation advisors and regulators is to ensure effective management within these MPAs is in place and delivering against the Global Biodiversity Framework 30x30 commitments. In an English context the purpose of an MPA is to protect and recover rare threatened and important marine ecosystems, habitats and species from damage caused by human activities. In England, MPAs are designated to protect marine ecosystems or specific habitats or species and have conservation objectives which state what conservation outcomes the MPA is designed to achieve (MMO, 2023). Furthermore, to aid the delivery of Good Environmental Status (GES) as set out by the UK Marine Strategy (Defra, 2010) and ‘leave nature in a better state than found’ highlighted by the Environmental Improvement Plan (EIP) (Defra, 2023a), the UK Government designated three Highly Protected Marine Areas (HPMAs) (Defra, 2023b). These designations came into force in July 2023: Allonby Bay, North-East of Farnes Deep and Dolphin Head. HPMAs take a whole site approach to designation, whereas all other MPAs in England protect a particular habitat or feature (feature-based approach) and may allow other activities to continue within the site (Solandt et al., 2020). HPMAs protect all habitats and species within their boundaries from all damaging or disturbing activities (Schratzberger et al., 2019), promoting the recovery and protection of marine ecosystems (Defra, 2023b).
The practicability of HPMAs was summarized by the Benyon Review, a report published in 2020 to look at the feasibility of HPMAs in Secretary of State waters and how HPMAs could be best introduced (Benyon et al., 2020). The review concluded that that HPMAs were an essential component of the MPA network and should be introduced. However, the review and subsequent government response also recognized the complex and competing demands for marine space (Benyon et al., 2020; Defra, 2021). Multiple marine sectors such as offshore windfarms and commercial fishing are already competing for space in UK waters (De Groot et al., 2014; Hull, 2013; Püts et al., 2023), therefore, the displacement of commercial fishing activities from HPMAs could further exacerbate the competition for space (Benyon et al., 2020), which could have socio-economic consequences for the fishing sector and the wider environment. The Benyon review stated that the fishing industry is likely to be most negatively impacted by the introduction of HPMAs; due to loss of catch within the HPMA and displacement of effort to other areas. This ‘spatial squeeze’ to the fishing industry from HPMAs and other sea users, was also highlighted in a recent report by the National Federation of Fishermen’s Organisations (NFFO) and Scottish Fishermen’s Federation (SFF) (NFFO, 2022).
Fishing effort displacement can be defined as the change in fishing pattern or behaviour due to the introduction of different management measures (McLeod, 2014; Vaughan, 2017). As all fishing activities will be prohibited within HPMAs, displacement may occur in three main ways; 1) Removal: fishing effort may be removed as it may not be economically viable to fish in other areas, this could be permanent or short term if it becomes viable to fish in other areas. 2) Relocation: fishing effort may be transferred to other areas outside of the HPMA. This may increase environmental impacts in the surrounding area as displaced vessels may move to nearby areas which currently have a low fishing intensity or compete with vessels already fishing outside of the HPMA, intensifying fishing effort. 3) Substitution: displaced vessels may also switch gear types to fish in other areas (ABPmer, 2017; Vaughan, 2017).
The type of displacement that occurs, and where the effort is displaced to, is dependent on multiple factors including gear type, vessel size, habitat type and knowledge or availability of alternative fishing grounds (ABPmer, 2017). For example, smaller fishing vessels may be less able to travel further from their home port to alternative fishing grounds due to smaller operating ranges (ABPmer, 2017; Benyon et al., 2020), so could have a higher risk of exit from the industry. However, there are some common behaviours associated with displacement; fishing in close proximity to the closed area, ‘fishing the line’ has been observed around multiple MPAs (Cabral et al., 2017; Kellner et al., 2007; Nillos Kleiven et al., 2019; Van Der Lee et al., 2013).
This behaviour may be a response or a pre-emptive response to the potential for a spillover effect (ABPmer, 2017); that protected areas support larger densities of fish and there will eventually be a net movement from these areas to outside of the boundaries (Buxton et al., 2014; Rowley, 1994). The spillover effect can potentially have both socioeconomic and environmental benefits; fish populations can recover within the protected area, before spilling over and increasing the biomass transfer to surrounding fishing grounds (Di Lorenzo et al., 2020; Rowley, 1994). Two different types of spillover have been defined by Di Lorenzo et al. (2016): “ecological spillover” the net emigration of all species out of the protected area and “fishery spillover” the fraction of ecological spillover that directly benefits fishery yields and revenues. A metanalysis of 23 marine protected areas by Di Lorenzo et al. (2020) found that on average fish biomass and abundance was higher closer to the border of the marine protected areas compared to locations further away (>200m), this was true for species with high commercial values, highlighting potential socio-economic benefits for fishers. However, spillover can be variable depending on the size of the protected area, duration of protection, connectivity to surrounding areas and the fishing intensity on the border of the area (Da Silva et al., 2015). Fishing displacement may also be dependent on habitat type; as displaced fishers are likely to visit preferred habitats of target species in the surrounding area (Cabral et al., 2017; Forcada et al., 2010; Horta e Costa et al., 2013). Therefore, it is vital to consider surrounding habitats, similar to those within the HPMA.
The last decade has seen significant improvements in the capability of regulators to track commercial fishing vessels to aid enforcement, compliance with regulations and to discern how management measures alters fishing fleet behaviour (Mangi et al., 2018). There are two key monitoring systems for tracking the location of the English fishing fleet; VMS and IVMS (Vessel Monitoring System and Inshore) devices (MMO, 2025). Both systems provide positional information of fishing vessels, including: latitude and longitude, course and speed, as well as the date and time of the reading (also known as a ping), with information sent to the Marine Management Organisation’s (MMO) UK VMS Hub. Unlike VMS data which has a nominal two-hour ping rate transmitted via satellite, I-VMS pings have a much higher frequency (normally three minutes). Currently VMS is only mandatory for vessels >12m in length (MMO, 2019; Shepperson et al., 2018). This leaves much of the English fleet without VMS; as of 2021, 81.8% of the English fleet were<10m in length (MMO, 2021). However, legislation making I-VMS mandatory for<12m vessels in English waters has recently come into force, with a licence variation condition issued by MMO requiring any English<12m vessel to use IVMS when undertaking a trip to sea as of May 12th 2025 (MMO, 2025).
Fishing displacement and its impacts on surrounding areas has been assessed for multiple MPAs and other spatial restrictions (Bastardie et al., 2015; Guenther et al., 2015; Langton et al., 2020). However, these assessments vary significantly from each other; some are quantitative, identifying the vessels using areas via VMS data (Bastardie et al., 2015; Campbell et al., 2014) or assessing benthic habitat impacts using a quantitative index (Langton et al., 2020), whilst others use social surveys to assess the socioeconomic impacts of displacement (Stevenson et al., 2013). Furthermore, the vessels assessed also differ between studies; information on inshore fishing activity is often limited, as less satellite monitoring data are available for smaller vessels (Vaughan, 2017). Therefore, a standardised method for assessing displacement needs to be applied to HPMAs.
In 2017 Natural England (the Government’s Statutory Nature Conservation Adviser for England) published a commissioned report detailing two methods (rapid and comprehensive) for assessing environmental and socio-economic impacts of displacement (ABPmer, 2017). Our study develops and applies a comprehensive Natural England displacement assessment to a Hypothetical HPMA (25km2), located within English waters. The aim of the study was to establish whether displacement assessments are suitable for HPMAs. The chosen location for the HypHPMA is within the Devon and Severn Inshore Fisheries and Conservation Authority (D&S IFCA) district. D&S IFCA has the largest demersal gear fleet operating within its district compared to the other nine IFCAs, with circa 180 permitted mobile fishing vessels operating in 2019. Furthermore, all mobile gear vessels >6.99m operating within D&S IFCA’s district are required to have I-VMS fitted and operational, making the location suitable for a high-resolution displacement assessment. The year 2019 was chosen, to avoid the impacts on fishing vessels during and post the COVID-19 pandemic.
The key aims of the study are to: 1) develop a standardised assessment method for fishing displacement within HPMAs, based on the 2017 Natural England displacement template; 2) demonstrate the assessment method using a HypHPMA; 3) recommend data products required for appropriate assessment of fishing displacement from HPMAs, to inform management and policy. The analyses used in this study are applicable to other situations where fishing activities are displaced following the introduction of management measures or spatial zoning associated with marine developments or infrastructure.
2 Materials and methods
The outline of the assessment methods is highlighted within the flowchart (Supplementary Figure S1), within the Supplementary Material. This flowchart suggests the datasets required for a displacement assessment and the appropriate analyses to undertake.
2.1 HypHPMA and overview of the surrounding area
The HypHPMA for the case-study was located in South Devon, just south-east of the mouth of the river Exe, within the 6nm boundary of the D&S IFCA (Figure 1). The Natural England (NE)/Joint Nature Conservation Committee (JNCC) criteria for choosing a location of a HypHPMA was reviewed (JNCC, 2021), to ensure that the location of the HypHPMA was appropriate. The HypHPMA was a square of 5km by 5km, covering a total an area of 25km2. The size of the HypHPMA was based on the NE/JNCC recommendation of a minimum HPMA size of 5km diameter. In addition, the HypHPMA was bounded by; a 10km by 10km square (100km2) and a 20km by 20km square (400km2) (Figure 1). These areas were considered within the study as smaller fishing vessels are often displaced to areas within a close proximity of the protected area or demonstrate ‘fishing the line’ behaviour (ABPmer, 2017). Of the two assessment types developed in ABPMer 2017 the comprehensive assessment was chosen due to the district’s large number of mobile vessels, as it is likely multiple vessels operate within the HypHPMA. Bathymetry data used in plot of HypHPMA was acquired from GEBCO (GEBCO, 2024).
Figure 1
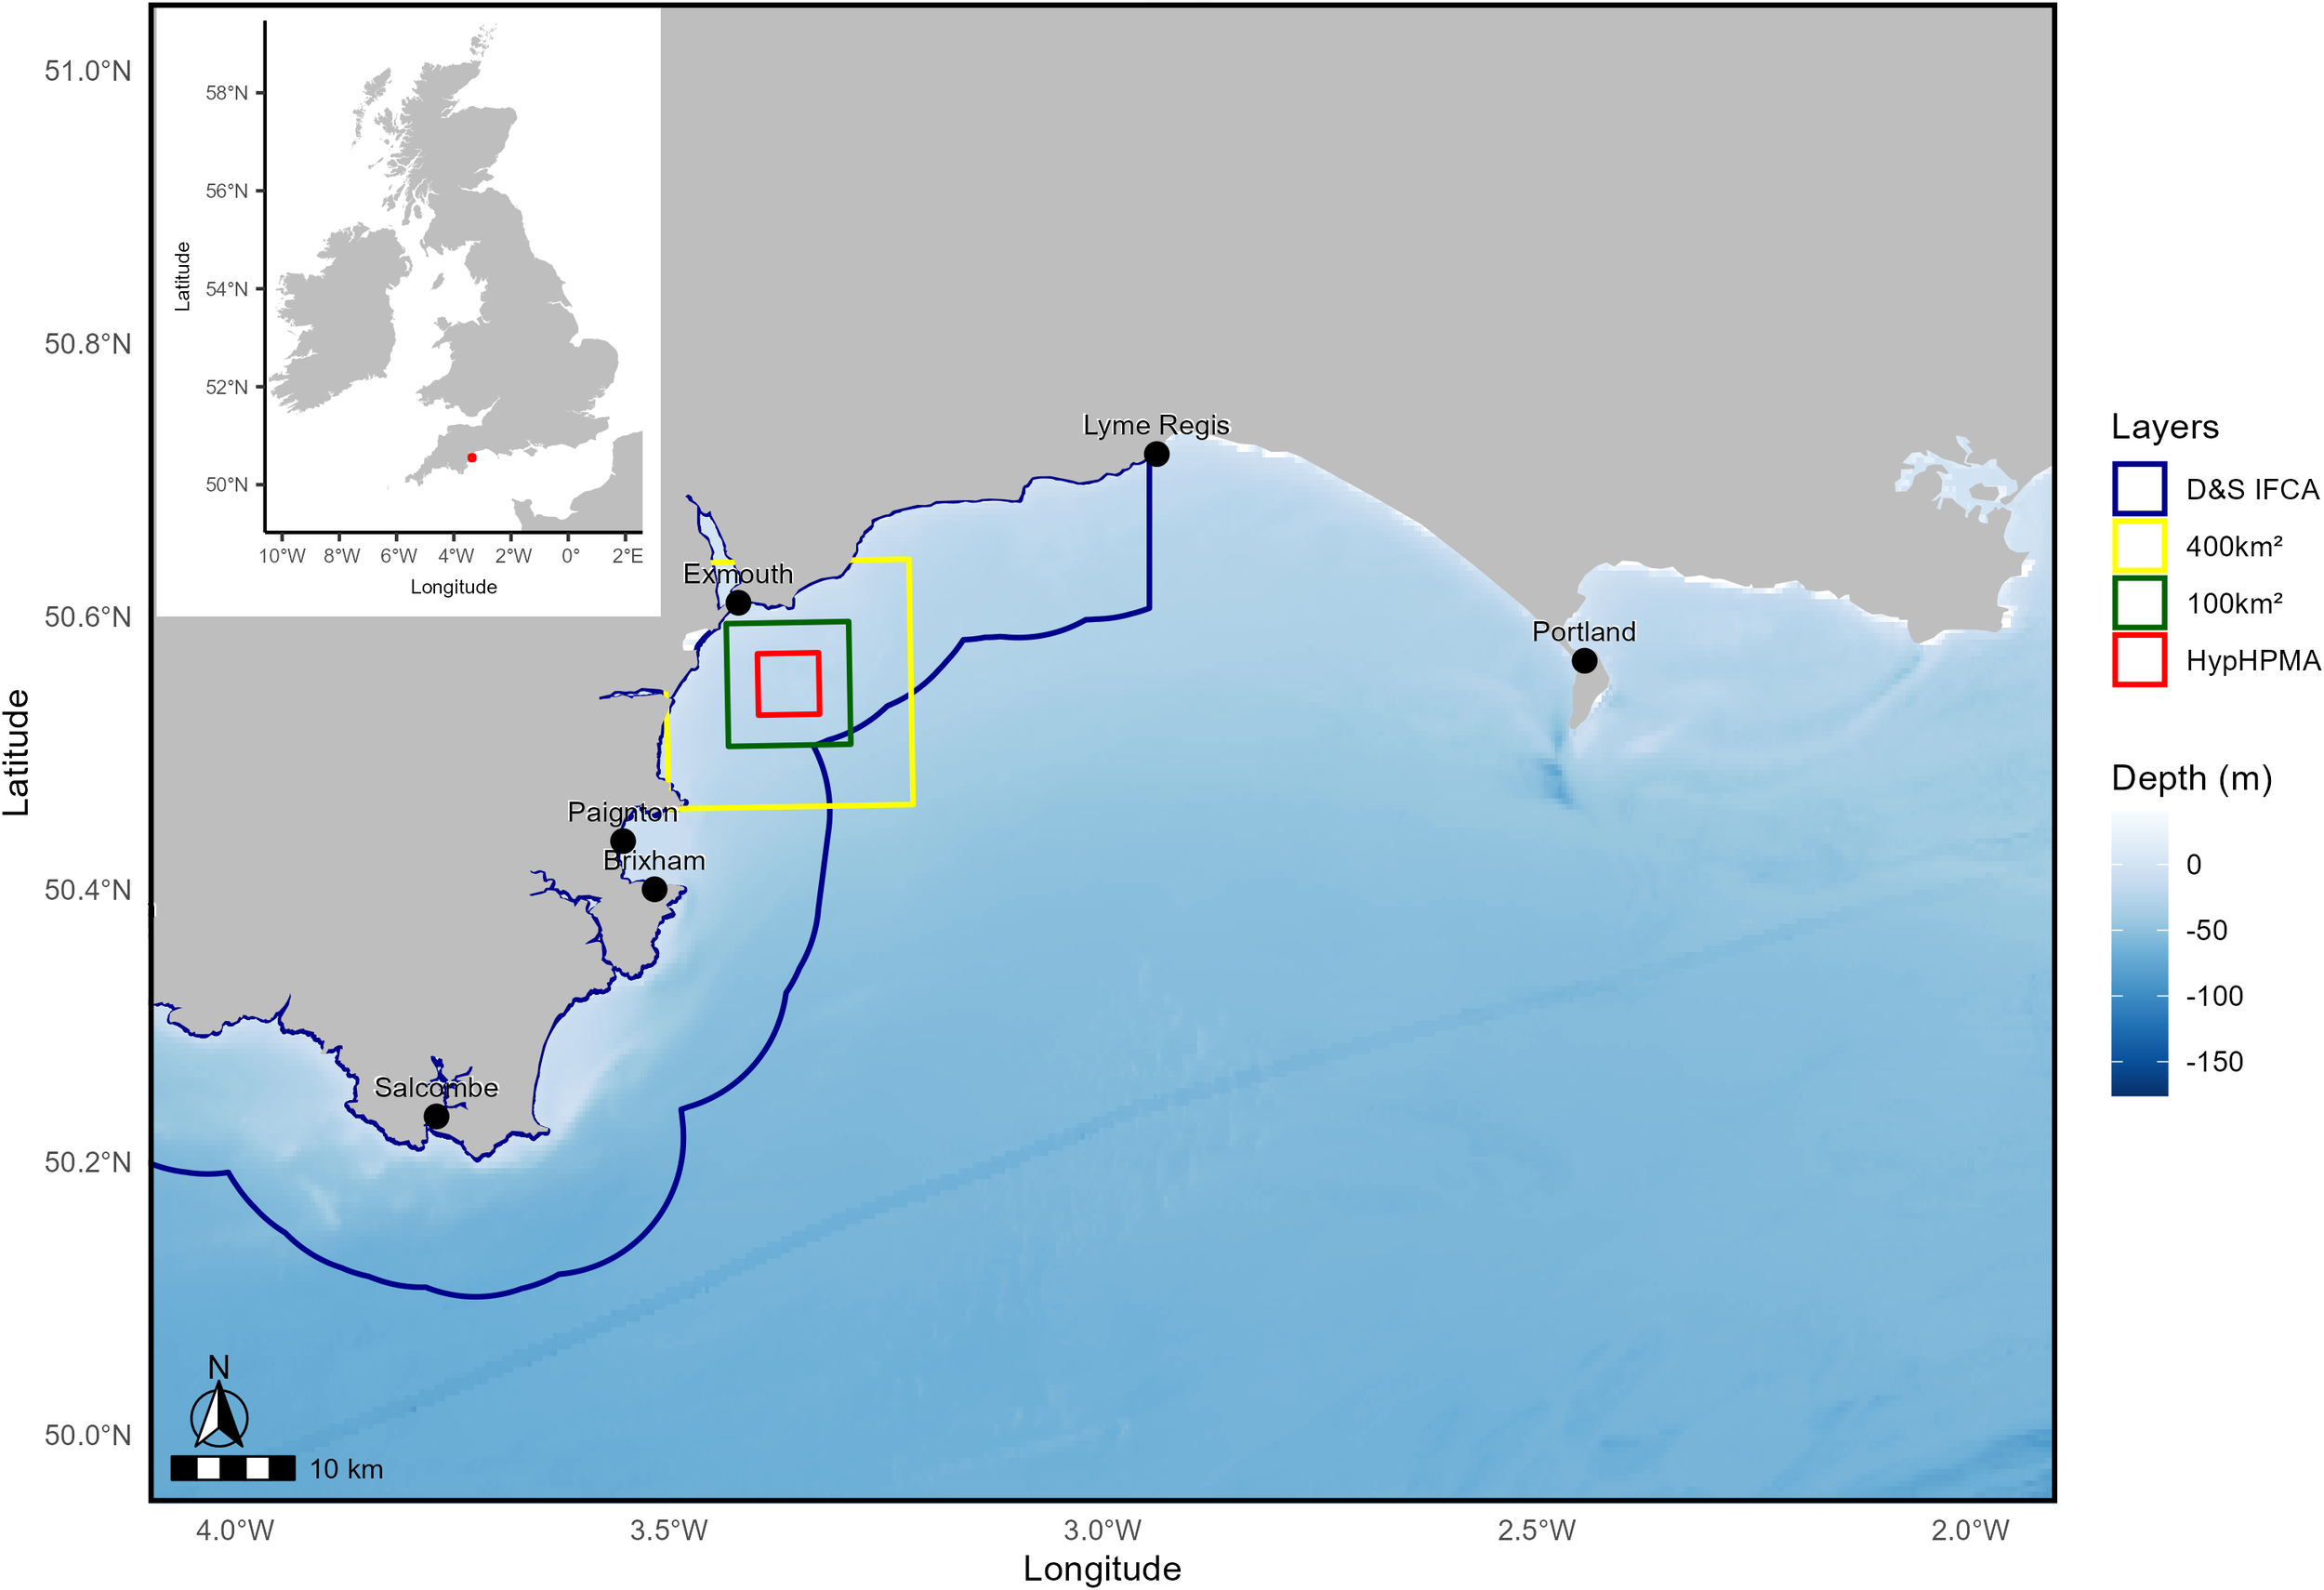
Location of the 25km2 HypHPMA (red box), in English waters within the Devon and Severn IFCA, with an inset map of the HypHPMA’s position relative to the rest of the UK. The green box represents the 100km2 surrounding area and yellow box is the 400km2 surrounding area, used as a comparison within habitat and displacement assessments. The dark blue outline represents D&S IFCA boundaries.
2.2 I-VMS and VMS data for mobile gear
For use of mobile fishing vessels within the D&S IFCA’s District a permit holder or representative must have a fully functioning, remotely accessed electronic reporting device on board the vessel at all times. This applies to vessels between 6.99 m and 15.24 m, which must transmit information at least every 3 minutes when in a restricted access area, based on the D&S IFCA’s Mobile Fishing Permit Byelaw, correct as of April 2024 (D&S-IFCA, 2013, 2024). For VMS reporting outside of the District it is an EU requirement that all fishing vessels 12 m or more in length must transmit their position every 2 hours when at sea (MMO, 2019).
The data supplied by the MMO were I-VMS and VMS pings for all 180 D&S IFCA mobile fishing permit holders operating during 2019 (hereafter referred to as the mobile fleet). Variables recorded for the VMS/I-VMS data included: vessel ID, latitude, longitude, date, time, speed and heading of vessel. These variables were all required for analysis within VMStools.
Landings (logbook) data were provided for 180 vessels by the MMO. The iFISH2 landings dataset was requested as this dataset is commonly used in other studies analysing fishing effort in UK waters (Dignan et al., 2014; Enever et al., 2017; MacNab and Nimmo, 2022), allowing comparison and the development of a standardised method. The datasets were based on all D&S IFCA mobile fishing permit holders operating during 2019. The variables present within the dataset included: date of landing, species, value (£), live weight (kg), gear type, vessel power (kWh), vessel size (m), landing port and vessel ID. Data were then combined with I-VMS and VMS data for VMStools analysis, if I-VMS/VMS data were available.
2.3 Fishing effort sightings, potting and netting activity
As only mobile gear vessels >6.99m are required to provide I-VMS data, D&S IFCA potting and netting activity (fixed gear vessels) surveys and permits were used to give an idea of the potential number of potting and netting vessels fishing within the HypHPMA and surrounding areas. D&S IFCA undertook potting and netting activity surveys in 2014. These survey data enabled the number of potters/netters that fished within the HypHPMA to be quantified along with the port they operated from. Noting however, the overall response rate of the 2014 survey was low (potters 28.7%, netters 26.6%). Potting and netting permit numbers issued by the D&S IFCA in 2021 were analysed to give an idea of the total number of potters and netters fishing in the surrounding area.
2.4 Benthic habitat type and sensitivity
Benthic habitats within the HypHPMA were identified using the Natural England Marine Habitats and Species Map (MHabS), a spatial database comprised of the UK combined habitat map and Natural England data (v. 2024) (NE, 2024). Habitats are classified using the EUNIS (European Nature Information System) classification system, where all habitat types are listed via a EUNIS code (Tyler-Walters et al., 2018, Tyler-Walters et al., 2023). This hierarchical classification system describes more detail with increasing levels of the hierarchy; for example, A1 is a marine habitat of littoral rock and other hard substrata, whilst A1.111 is a marine habitat of Mytilus edulis and barnacles on very exposed eulittoral rock (MARLIN, 2022). For the EUNIS habitat maps layer, the EUNIS code for each area is as detailed as the habitat survey data provided. For areas with overlapping survey data a MESH confidence assessment is used to decide which layer is shown. A MESH confidence assessment was used to assess the confidence in each of the mapping studies that make up the overall habitat map (EMODnet, 2021; JNCC, 2016b).
Benthic habitat sensitivity was also assessed for demersal trawling and dredging for two different pressures: ‘Penetration and/or disturbance of the substratum below the surface of the seabed’ and ‘Abrasion/disturbance of the substrate on the surface of the seabed’ (MARLIN, 2024), during this paper these will be referred to as subsurface abrasion (SAB) and surface abrasion (AB) respectively. These pressures were assessed for the HypHPMA and surrounding areas. The assessment was carried out using the Natural England Spatial Seabed Sensitivity Tool (NESSST), (v. 2023); a map that spatially presents the sensitivity of benthic habitats to standardised pressures caused by human activities. The sensitivity assessment is based on the Marine Evidence based Sensitivity Assessment (MarESA) (Tyler-Walters et al., 2018, Tyler-Walters et al., 2023), whilst the habitat assessment uses the NE MHabS map. The assessment considers the resistance (the likelihood of damage from a pressure) and the resilience (the speed of recovery, assuming the pressure has stopped), the product of these defines the overall sensitivity. The sensitivity is assessed based on a pressure of particular threshold or benchmark and each pressure type is assessed individually. The sensitivity ranges from low to high, with other assessments included such as data deficient and not sensitive, depending on the data and literature available. Confidence scores for pressures were also presented; these considered the quality of evidence for resistance and resilience, alongside the MESH confidence score of the confidence in habitat type. A Biotope assignment confidence estimate was also generated; this is a score (0 – 1) representing a quantitative estimation of the certainty associated with the biotope assigned to mapped habitat. A more detailed explanation of the NESSST can be found within the Supplementary Material.
The blue carbon habitats were identified using the inshore layer generated from the Blue Carbon Natural England Research Report (Swale et al., 2022). This identifies important marine and coastal habitats for carbon storage and sequestration. Habitats include kelp, saltmarsh, seagrass, oyster beds, subtidal and intertidal sand and mud.
2.5 Nursery and spawning grounds
The Essential Fish Habitat (EFH) map (project MMO1133) was used to identify adult, juvenile and spawning hotspots (Katara et al., 2021) within the study area. The EFH layer is based on individual species’ hotspots, identified using the Optimised Hot Spot Analysis tool, clipped to areas of >99% hotspot confidence and given a value of 1. The EFH layer is comprised of 29 commercially and ecologically important fish species overlapped with each other. If there is an overlap the score is summed, so three different species would have a score of 3.
3 Data analyses
3.1 Socio-economic analysis using VMStools
A large proportion of the data analysis was carried out using the R package “VMStools”; a package that focuses on analysing and visualising logbook (eflalo) and VMS/I-VMS (tacsat) data (Hintzen et al., 2012). Firstly, the data were converted into the correct format for use in VMS tools. Eflalo and tacsat data were then cleaned so: a) points on land; b) points in harbour; c) points with incorrect latitude or longitude; d) vessels travelling too fast to be considered fishing and; e) duplicate records were removed from the tacsat dataset. Whilst vessels with arrival date before departure date, duplicate records, and records with significantly higher catch weights or values (approximately thirty times larger on a log10 scale compared to the next highest value) were removed from the eflalo dataset. Due to the differences in ping frequency between VMS (ping every 2hrs) and I-VMS (ping every 3 minutes) data, the ping rate was standardised using the interpolateTacsat() function, using a Cubic Hermite Spline interpolation, with the recommended fm value of 0.2 to give a more detailed resolution for the VMS data, adding 38 extra points in between pings (Hintzen et al., 2012).
To identify when the vessels were fishing, rather than drifting or steaming, tacsat data were then analysed using the function activityTacsat(), this function fits a normal density curve based on speed profile. Tacsat and eflalo data were linked using the mergeEflalo2Tacsat function based on date, time and vessel ref. The number of vessels using the HypHPMA and surrounding areas were identified using the st_over() function, which identifies which points are within a polygon. Heatmaps of total time spent fishing (hrs), catch value (£) and catch weight (kg) and fishing effort (kWh) were plotted for the HypHPMA and surrounding areas for 0.025 by 0.025 decimal degree cells using “VMStools” and “ggplot2” (Wickham, 2011), histograms of these variables based on month were also created. Any squares containing fewer than three vessels were not plotted due to data sensitivity, to prevent individual vessel activity being discerned. To identify differences in catch value, weight and fishing effort, depending on vessel and month Kruskal Wallis tests were performed, as data were not normally distributed. A Dunn’s test was then applied for post hoc comparisons, coupled with a Bonferroni correction.
3.2 Static gear analysis - potting, netting and diving
The total number of potting and netting permits for each port within the D&S IFCA district, in close proximity to the HypHPMA were calculated. These ports were plotted using “ggplot2”, to give an indication of how close ports were to the HypHPMA, with the size of points representing number of permits present. The total number of vessels that responded to the potting and netting surveys was used, as well as the number identified that would have fished within the HypHPMA boundary. A brief analysis occurred identifying the total landings weights and values and most common species caught, for potting and netting vessels with D&S IFCA permit.
3.3 Environmental analysis: swept area ratios and linking tacsat to other spatial datasets
For the environmental analysis Swept Area Ratio (SAR) was calculated using the equation:
The SAR was calculated for 0.025 by 0.025 decimal degree grid cells using “VMStools” and plotted using “ggplot2” (Wickham, 2011). Any squares containing fewer than three vessels were not plotted due to data sensitivity. This occurred for both surface abrasion (AB), width of gear that came into contact with the surface of the seabed and subsurface abrasion (SAB), width of gear that penetrated >2cm into the seabed, this definition is used in multiple marine studies (Eigaard et al., 2016, Eigaard et al., 2017; Rijnsdorp et al., 2018). Gear width was assigned based on gear type, vessel length and most common species type caught. This was based on expert opinion from Seafish (Supplementary Tables S1, S2).
The swept sensitivity ratio (SSR) was also calculated using the following equation:
NESSST sensitivity was linked to VMS/I-VMS data using the st_over() function and used within the equation above, in order to present both swept area (AB and SAB) and habitat sensitivity (abrasion and penetration) to demersal trawling and dredging. Sensitivities were rescored with a value between 0 and 3 (from not relevant to high sensitivity), for the calculation of a composite score for swept sensitivity ratios, rescoring used a precautionary approach described in Supplementary Table S3. A composite scoring approach is often used for risk indexes and appropriate for this study as the composite variable has similar meaning to the original variable (Dolge and Blumberga, 2021; Song et al., 2013). For benthic habitat analysis the NE MHabS was linked to VMS/I-VMS data using the st_over() function, fishing effort based on habitat type was plotted in “ggplot2” (Wickham, 2011), stacked bar charts were also created for fishing effort depending on habitat type. The percentage coverage of each habitat type within the HypHPMA and surrounding areas were calculated using the st_area() function within the “sf” R package (Pebesma, 2018), with the crs set at ETRS89 LAEA, the UK standard for geospatial statistics, as part of retained EU legislation. The percentage area coverage of each habitat type was plotted on a stacked bar chart for the HypHPMA and surrounding areas. The MESH confidence scores for habitat type, the biotope assignment confidence estimate and confidence scores for quality of evidence for resistance and resilience, were also plotted to indicate the confidence in sensitivity and habitat type there is for each area. This method was also used for essential fish habitat and blue carbon maps.
3.4 Predicted displacement analysis
This study used three simple methods to predict fishing displacement, based on known fishing behaviours:
Method 1: Fishing the line
Vessels are likely to concentrate fishing effort at the boundary area of the closed area, to exploit the benefits of the spillover effect (ABPmer, 2017). This was achieved by identifying pings within the HypHPMA and moving them to the closest point on the boundary line, via the st_nearest_points() function within the “sf” R package (Pebesma, 2018).
Method 2: Habitat similarity
Fishing displacement may also be dependent on habitat type; as displaced fishers are likely to visit preferred habitats of target species in the surrounding area (Cabral et al., 2017; Forcada et al., 2010; Horta e Costa et al., 2013). Therefore, the habitat similarity method moves points found within a certain habitat type in the HypHPMA to the closest similar habitat polygon outside of the HypHPMA, also using the st_nearest_points() function (Pebesma, 2018).
Method 3: Equal distribution
The percentage increase in fishing effort in areas outside of the HypHPMA was calculated using the formula:
Where is the percentage of total fishing effort currently occurring in the HypHPMA and is the percentage of total fishing effort in the area of interest (ABPmer, 2017). Fishing effort, SAR (AB and SAB) and SSR (AB and SAB) increase was calculated for the 100km2 and 400km2 areas surrounding the HypHPMA as well as inside and outside of the rest of the D&S IFCA. A map of the change in fishing activity before and after the HypHPMA closure was used by using the formula on ICES rectangles.
4 Results
4.1 Socioeconomic assessment
4.1.1 Overview of vessels in the HPMA and surrounding areas
From I-VMS and VMS data analysis 27 vessels were found fishing within the HypHPMA during 2019, with 35 vessels found fishing within the 100km2 and 49 within the 400km2 surrounding areas. Of the 27 fishing vessels, 18 were boat dredges (DRB), 6 were bottom otter trawls (OTB), 2 vessels switched between DRB and OTB and one vessel switched between DRB and bottom pair trawling (PTB) within the HypHPMA. The size of vessels using the HypHPMA ranged from 9.34m to 14.98m, with 15 of the vessels using the HypHPMA measuring at<12m in length and 12 vessels ≥12m.
4.1.2 Landings values within the HypHPMA
The total landings value within the HypHPMA during 2019 was £121,994.96, which was 0.82% of the total landings value made by the D&S IFCA mobile fleet and 2.94% for the 27 vessels found within the HypHPMA. Landings values per fishing trip within the HypHPMA differed significantly depending on fishing vessel; Kruskal Wallis H(26) = 154.64, p< 0.001. A Dunn’s test was used to compare differences between individual vessels, with a Bonferroni correction applied, 19 of these vessel comparisons significantly differed from each other depending on landings value (Supplementary Table S7). The total value caught ranged from £17.46 to £35,919.04 in the HypHPMA per vessel in 2019, with an average catch value of £4,518.33 ± 8,614.76 SD per vessel, which was 3.31% ± 4.63 SD of the total value caught per vessel. The four species with the highest landings values within the HypHPMA were: Great Atlantic scallop (SCE) Pecten maximus (£106,096.67), Cuttlefish and bobtail squids (CTL) Sepiidae and Sepiolidae (£4,800.51), Common sole (SOL) Solea solea (£2,640.65) and Common squids (SQC) Loligo spp (£2,636.62). SCE also had the highest landings value in all surrounding areas including outside and inside the D&S IFCA district, however, landings values of other species differed in the surrounding areas. Earnings also differed depending on gear type with DRB amounting to the largest total landings value within the HypHPMA, followed by OTB and PTB (Table 1). Catch value also differed depending on vessel length,<12m vessels had a higher total catch value within the HypHPMA than ≥12m vessels (Table 1). Of the vessels fishing within the HypHPMA three vessels earned over ten percent of their landings values within the HypHPMA (19.61%, 12.74% and 10.03%), all of which were dredgers. For the 27 vessels, a total of 7.73% of their earnings were within the surrounding 100km2 and 13.42% was within the surrounding 400km2 (excluding the HypHPMA itself) of the HypHPMA (Figure 2A). Furthermore, 22.00% of the landings value was made within the D&S IFCA district (excluding the HypHPMA and surrounding areas), whilst 53.91% of the total landings value for the 27 vessels was outside of the D&S IFCA district.
Table 1
| Vessel type | Time (hrs) | Fishing effort (kWh) | Catch weight (kg) | Catch value (£) | Surface SAR | Subsurface SAR | Surface SSR | Subsurface SSR |
|---|---|---|---|---|---|---|---|---|
| <12m | 274.90 | 50819.54 | 52797.29 | 102222.10 | 1.099 | 0.410 | 2.198 | 1.229 |
| ≥12m | 176.25 | 38497.49 | 11065.80 | 19772.87 | 0.859 | 0.290 | 1.718 | 0.868 |
| DRB | 380.80 | 77334.17 | 58448.69 | 110578.13 | 0.682 | 0.682 | 1.364 | 2.043 |
| OTB | 56.35 | 8454.86 | 5048.01 | 10210.40 | 0.833 | 0.0181 | 1.666 | 0.0541 |
| PTB | 14.00 | 3528.00 | 366.39 | 1206.43 | 0.443 | 0.000 | 0.886 | 0.000 |
Total time spent (hrs), fishing effort (kwh), catch weight (kg), catch value (£) swept area ratio for surface abrasion, swept area ratio for subsurface abrasion, Swept sensitivity ratio for surface abrasion and swept sensitivity ratio for subsurface abrasion, within the HypHPMA depending on vessel type.
Depending on whether the vessel was<12m or ≥12m in length, or the gear type used: dredging (DRB), Bottom otter trawling (OTB) or Bottom pair trawl (PTB).
Figure 2
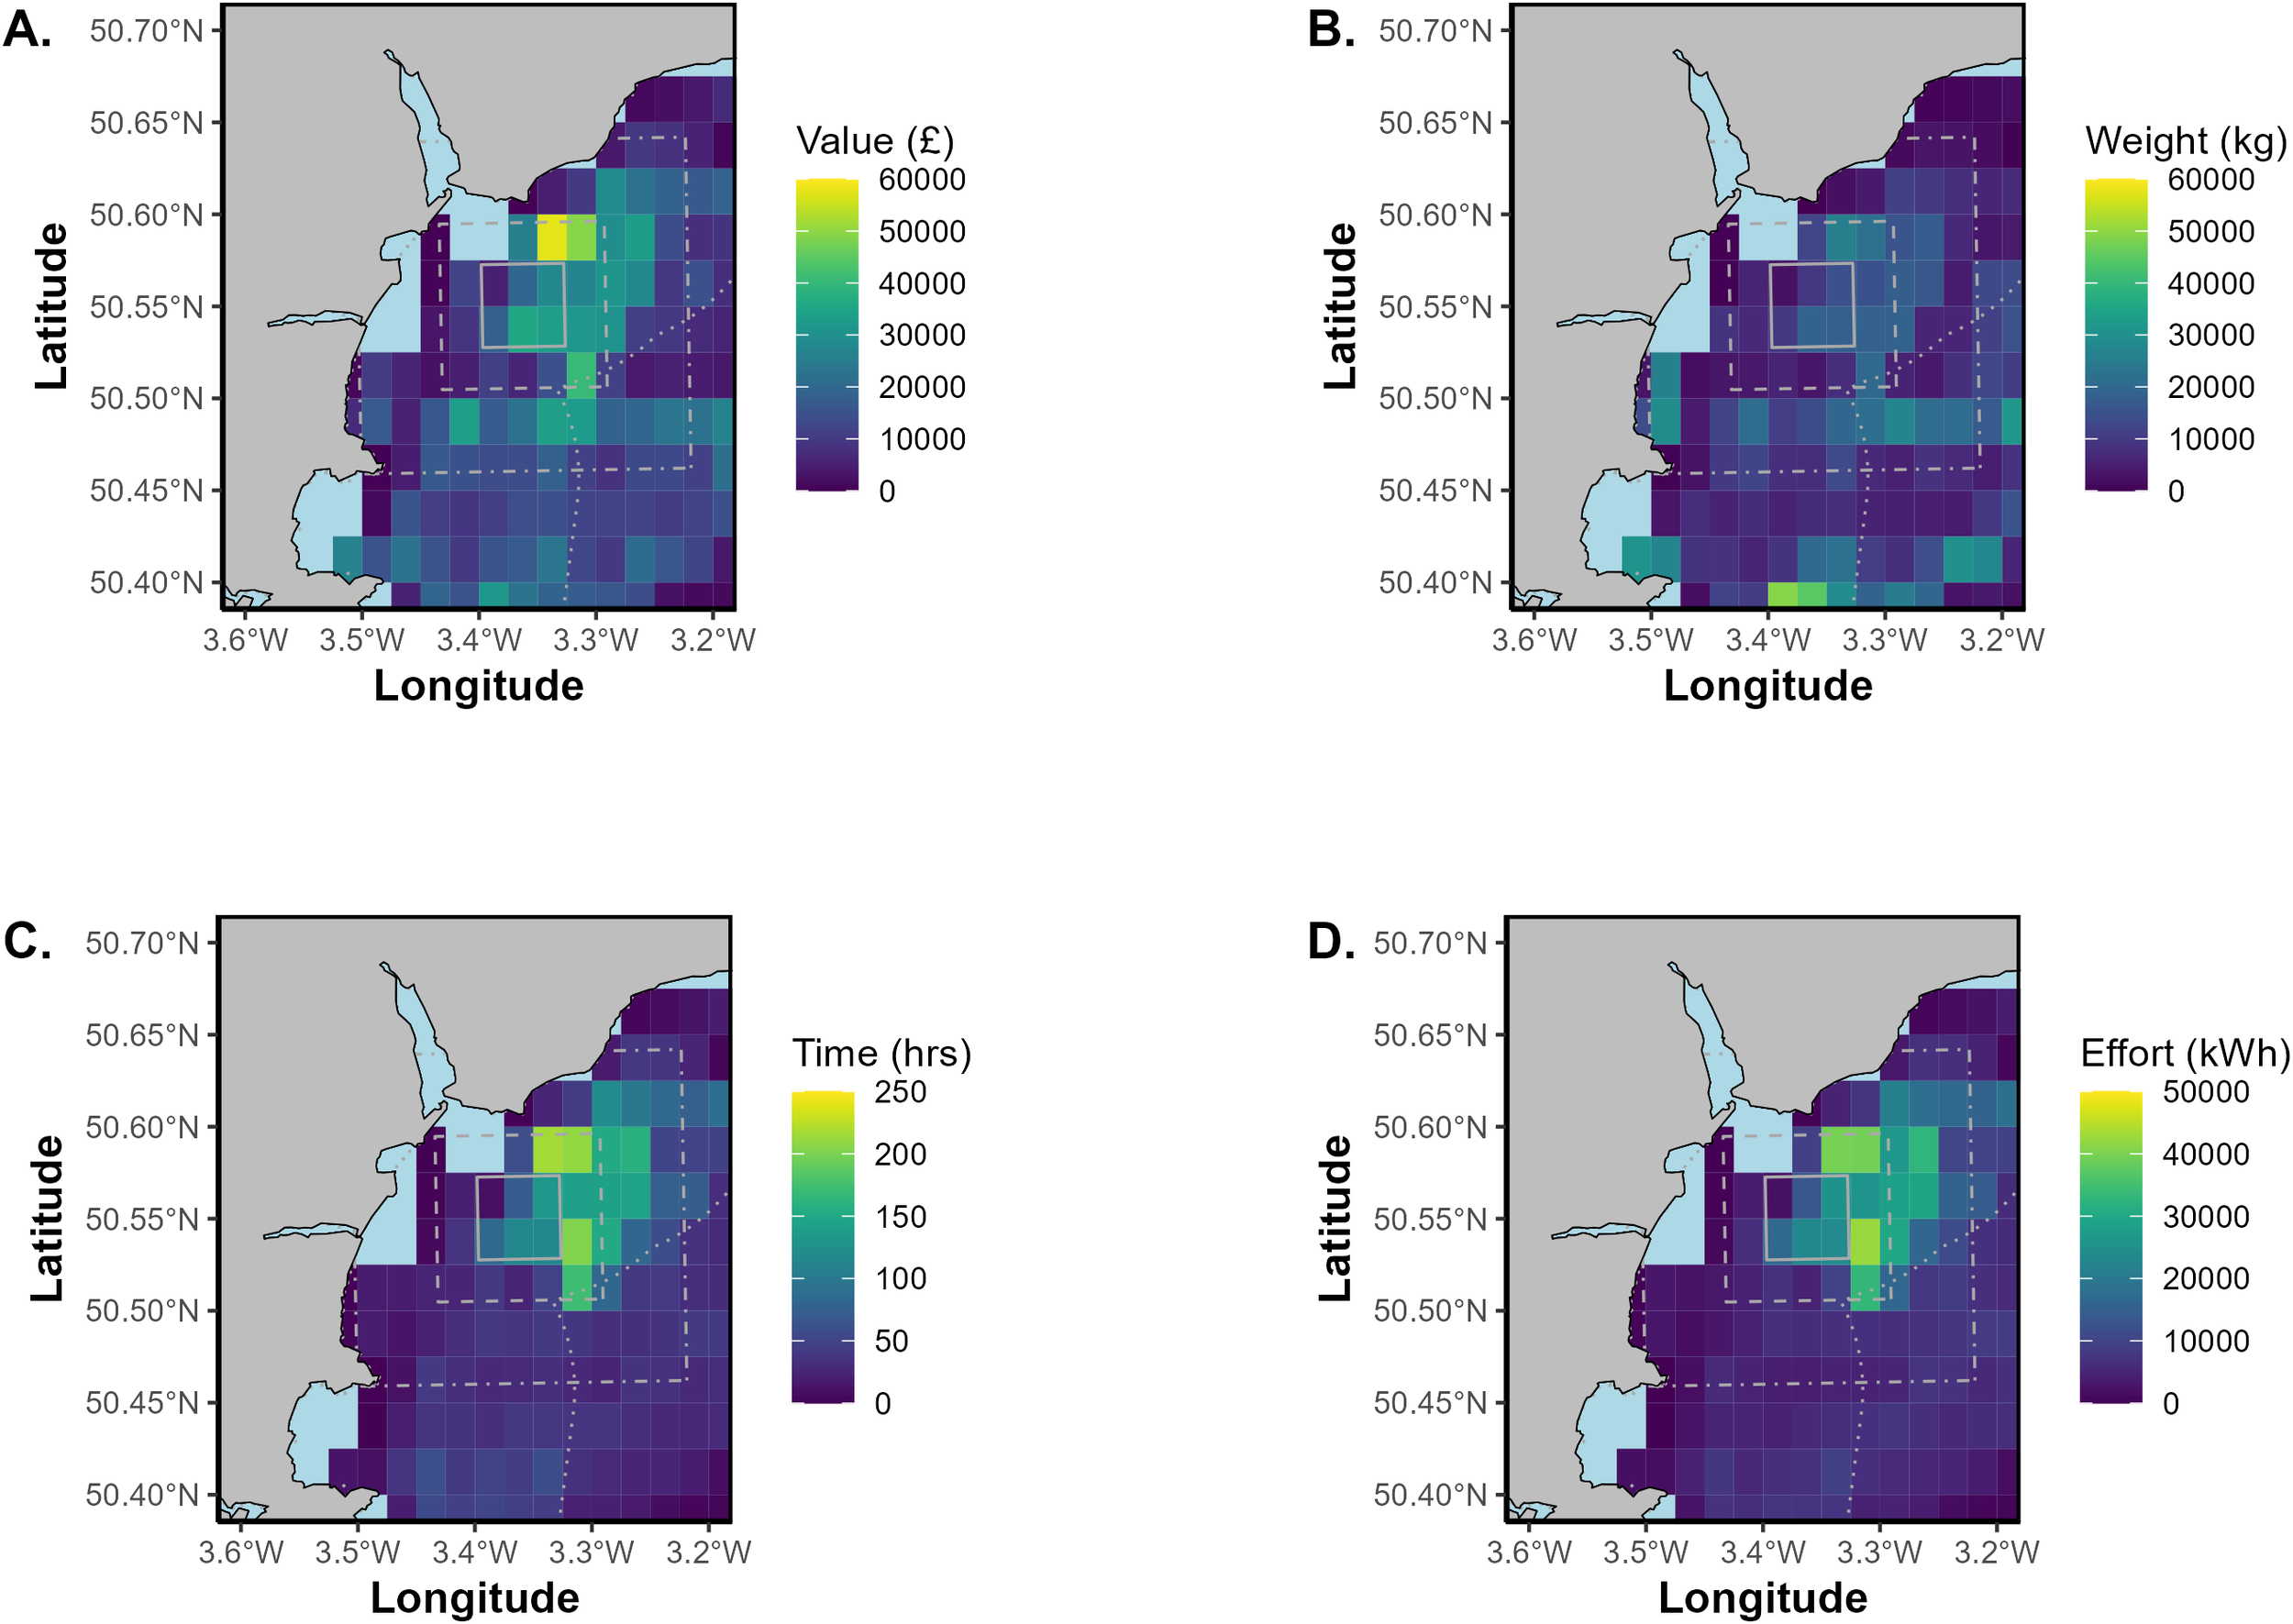
A heatmap of total (A) catch value (£), (B) catch weight (kg), (C) time spent (hrs) and (D) fishing effort (kWh) within the HypHPMA and surrounding areas during 2019, based on 0.025° by 0.025°C-squares. The solid grey box is the 25km2 HypHPMA, the dashed grey box represents the 100km2 surrounding area and the dot-dash box is the 400km2 surrounding area. The dotted grey outline represents D&S IFCA boundaries. C-squares containing fewer than 3 vessels have been removed from the analysis due to data sensitivity.
4.1.3 Landings weights within the HypHPMA
The total landings weights within the HypHPMA during 2019 was 63,863.09 kg, which was 0.85% of the total landings weight made by the whole mobile fleet and 2.23% for the 27 vessels found within the HypHPMA. Landings weights per fishing trip within the HypHPMA differed significantly depending on vessel; Kruskal Wallis H(26) = 157.95, p< 0.001. A Dunn’s test was used to compare differences between individual vessels, with a Bonferroni correction applied, 16 of these vessel comparisons significantly differed from each other depending on landings weight (Supplementary Table S8). The total catch weight within the HypHPMA ranged from 10.09 kg to 187,69.14 kg, with an average catch weight 2,365.3kg ± 4462.28 SD per vessel, which was 3.38% ± 4.65 SD of the total weight caught per vessel. The four most common species caught within the HypHPMA depending on landings weight were Great Atlantic scallop (SCE) (57,288.20 kg), Cuttlefish and bobtail squids (CTL) (1,859.71 kg), Small-spotted catshark (SYC) (1,749.83 kg) and Thornback ray (RJC) (563.14 kg). SCE also had the highest landings weight in all surrounding areas including outside and inside the D&S IFCA district, however, landings weights of other species differed in the surrounding areas. Landings weights also differed depending on gear type with DRB ammounting to the largest total landings weight within the HypHPMA, followed by OTB and PTB (Table 1). Catch weight also differed depending on vessel length,<12m vessels had a higher total catch value within the HypHPMA than ≥12m vessels (Table 1). Of the vessels fishing within the HypHPMA three vessels caught over ten percent of their landings weight within the HypHPMA (19.81%, 13.47% and 10.41%), all three of which were dredgers. For the 27 vessels, 6.08% of their earnings were within the surrounding 75km2 and 14.00% was within the surrounding 375km2 of the HypHPMA (Figure 2B). Furthermore, 24.12% of the landings value was made within the D&S IFCA district (excluding the HypHPMA and surrounding area), whilst 53.57% of the total landings weight for the 27 vessels was outside of the district.
4.1.4 Monthly analysis and time spent fishing within the HypHPMA
A total of 451.15 hrs (time) and 89,317.03 kWh (fishing effort) was spent within the HypHPMA (Figures 2C, D). This was 0.65% of the total time spent fishing by the mobile fleet and 2.17% of the 27 vessels. Time spent within the HypHPMA differed significantly depending on vessel; Kruskal Wallis H(26) = 139.81, p< 0.001. A Dunn’s test was used to compare differences between individual vessels, with a Bonferroni correction applied, 23 of these vessel comparisons significantly differed from each other depending on time spent fishing (hrs, Supplementary Table S9). The total time spent in the HypHPMA per vessel ranged from 0.20 hrs to 79.70 hrs, with an average time of 16.71hrs ± 18.03 SD per vessel, which was 3.17% ± 3.37 SD of the total time spent fishing per vessel. Two vessels spent over 10% of their total time within the HypHPMA, both of which were dredgers. The catch value within the HypHPMA varied significantly depending on month for the 27 vessels; Kruskal Wallis: H(11) = 67.13, p< 0.001, as did the catch weight (Kruskal Wallis: H(11) = 68.81, p< 0.001) and time spent within the HypHPMA (Kruskal Wallis: H(11) = 58.99, p< 0.001). Dunn’s tests were used to compare differences between individual months depending on catch value, weight and time with a Bonferroni correction applied, results can be found within the Supplementary Material (Supplementary Tables S4-S6). October was the month that had the highest catch value (£45,191.07), weight (24,771.11 kg), time spent (168.45 hrs) and fishing effort (34,857.22 kWh) within the HypHPMA (Figure 3), differing significantly from multiple other months based on Pairwise Wilcox tests. The catch value in October was 37.04% of the total catch value within the HypHPMA and 38.79% of the total catch weight. On the other hand, summer months such as July had far lower values with a catch value of 0.31% and a catch weight of 0.48% of the total catch within the HypHPMA. Great Atlantic scallop (SCE) had the highest landing values for all months apart from July, August and September, where Cuttlefish and bobtail squids (CTL) had the highest landings value for August and September and Thornback rays (RJC) for July. Scallops also had the highest landing weights for all months apart from July, August and September, where CTL again had the highest landings weight for August and September and Small-spotted catshark (SYC) for July.
Figure 3
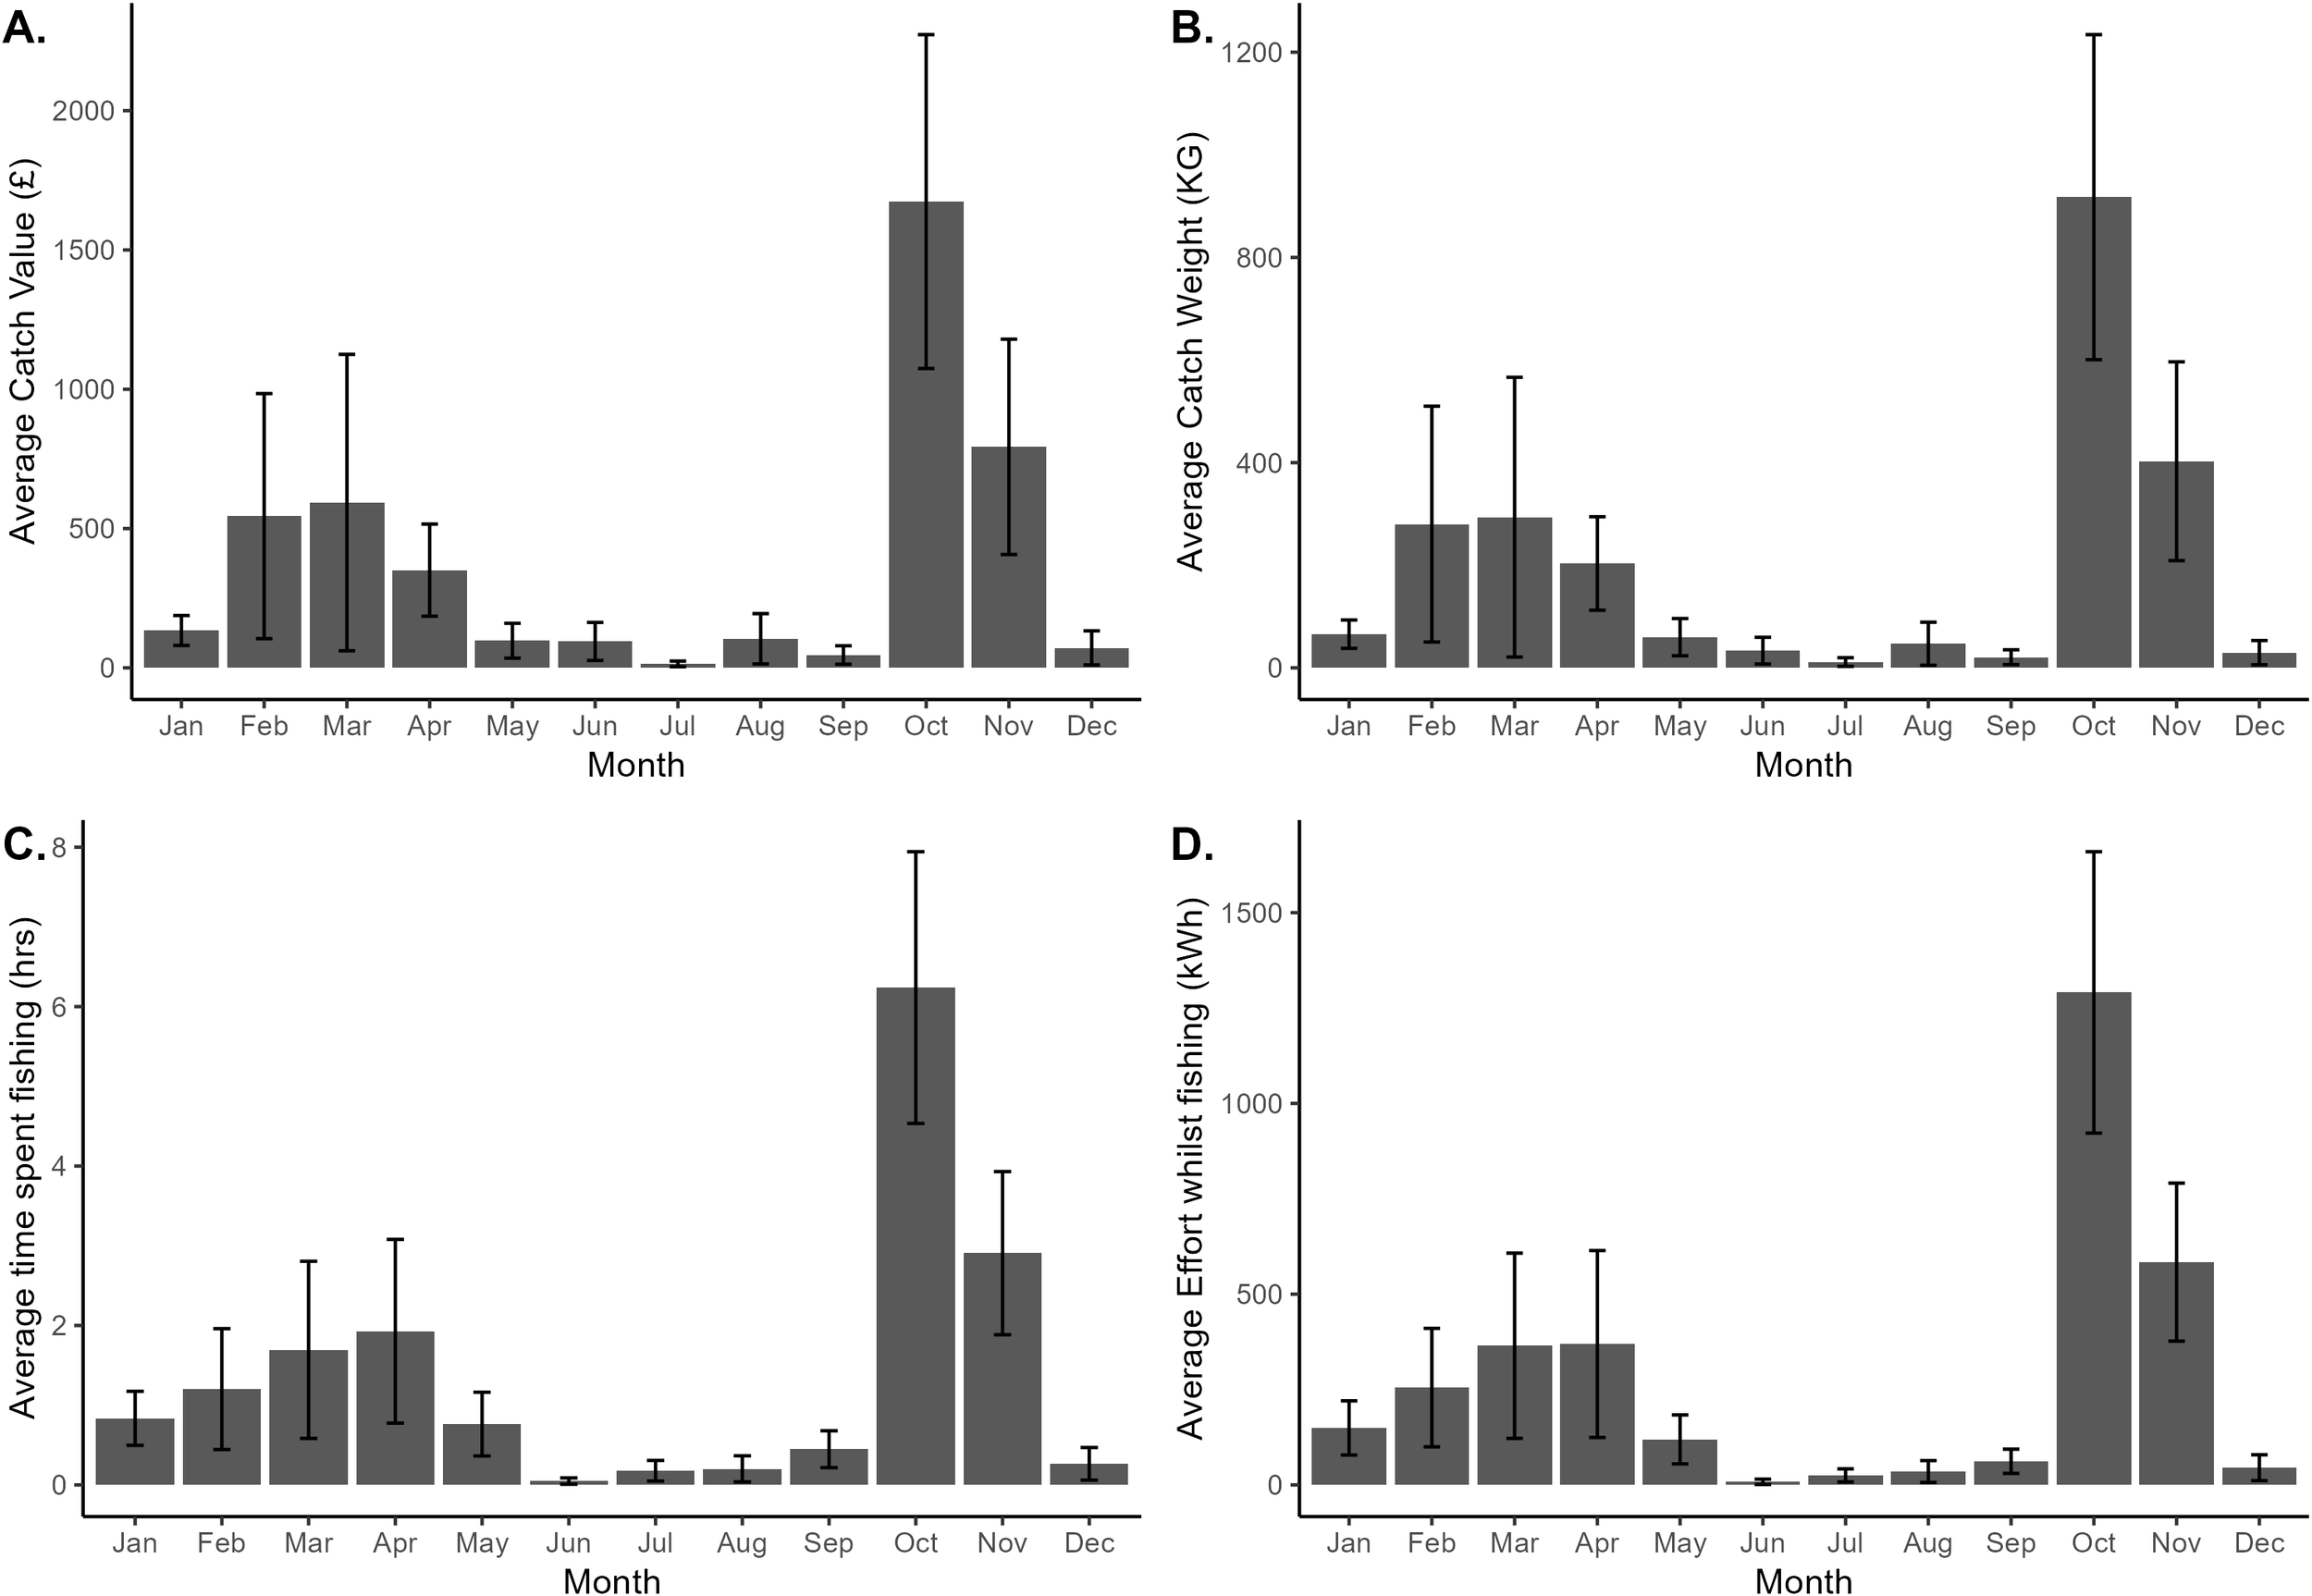
Monthly analysis of the average (A) catch value (£), (B) catch weight (kg), (C) time spent (hrs) and (D) fishing effort (kwh) per vessel in the HypHPMA within 2019, including standard error bars for the 27 vessels in the HypHPMA.
4.1.5 Potting, netting and diving
As most potting, netting and diving (diver caught scallop) vessels do not have I-VMS within the D&S IFCA district, both permits and surveys were taken into account; 87 potting permits and 65 netting permits within the D&S IFCA district in close proximity of the HypHPMA (Figure 4) were issued by D&S IFCA as of 2021. Additionally, 12 commercial diving vessels operate out of Brixham, Axmouth and Lyme Regis, 42 commercial rod and line vessels operated between Brixham and Lyme Regis and 20 angling/charter boats operated between Exmouth and Brixham during 2021 (this is likely to be an underestimation). All commercial permits were for vessels under 10m in length, apart from 3 potting vessels from Brixham, thus it is difficult to highlight potential fishing displacement with the lack of VMS/I-VMS data for 98.17% of the static fleet in this area. The three closest ports to the HypHPMA were Exmouth, Teignmouth and Budleigh Salterton. The number of permits issued was slightly higher for potting permits, with more potting permits issued compared to netting in 7 out of 11 ports. The port with the largest number of permits was Brixham with 34 potting permits and 25 netting permits, although this port is further away from the HypHPMA. Based on the vessels that responded to the 2014 potting and netting activity surveys, 28% of potting vessels (7 vessels) and 47.06% of netting vessels (8 vessels) fished within the HypHPMA. However, the response to the potting and netting surveys was low, only 28.74% of potters and 26.15% of netters responded to the survey.
Figure 4
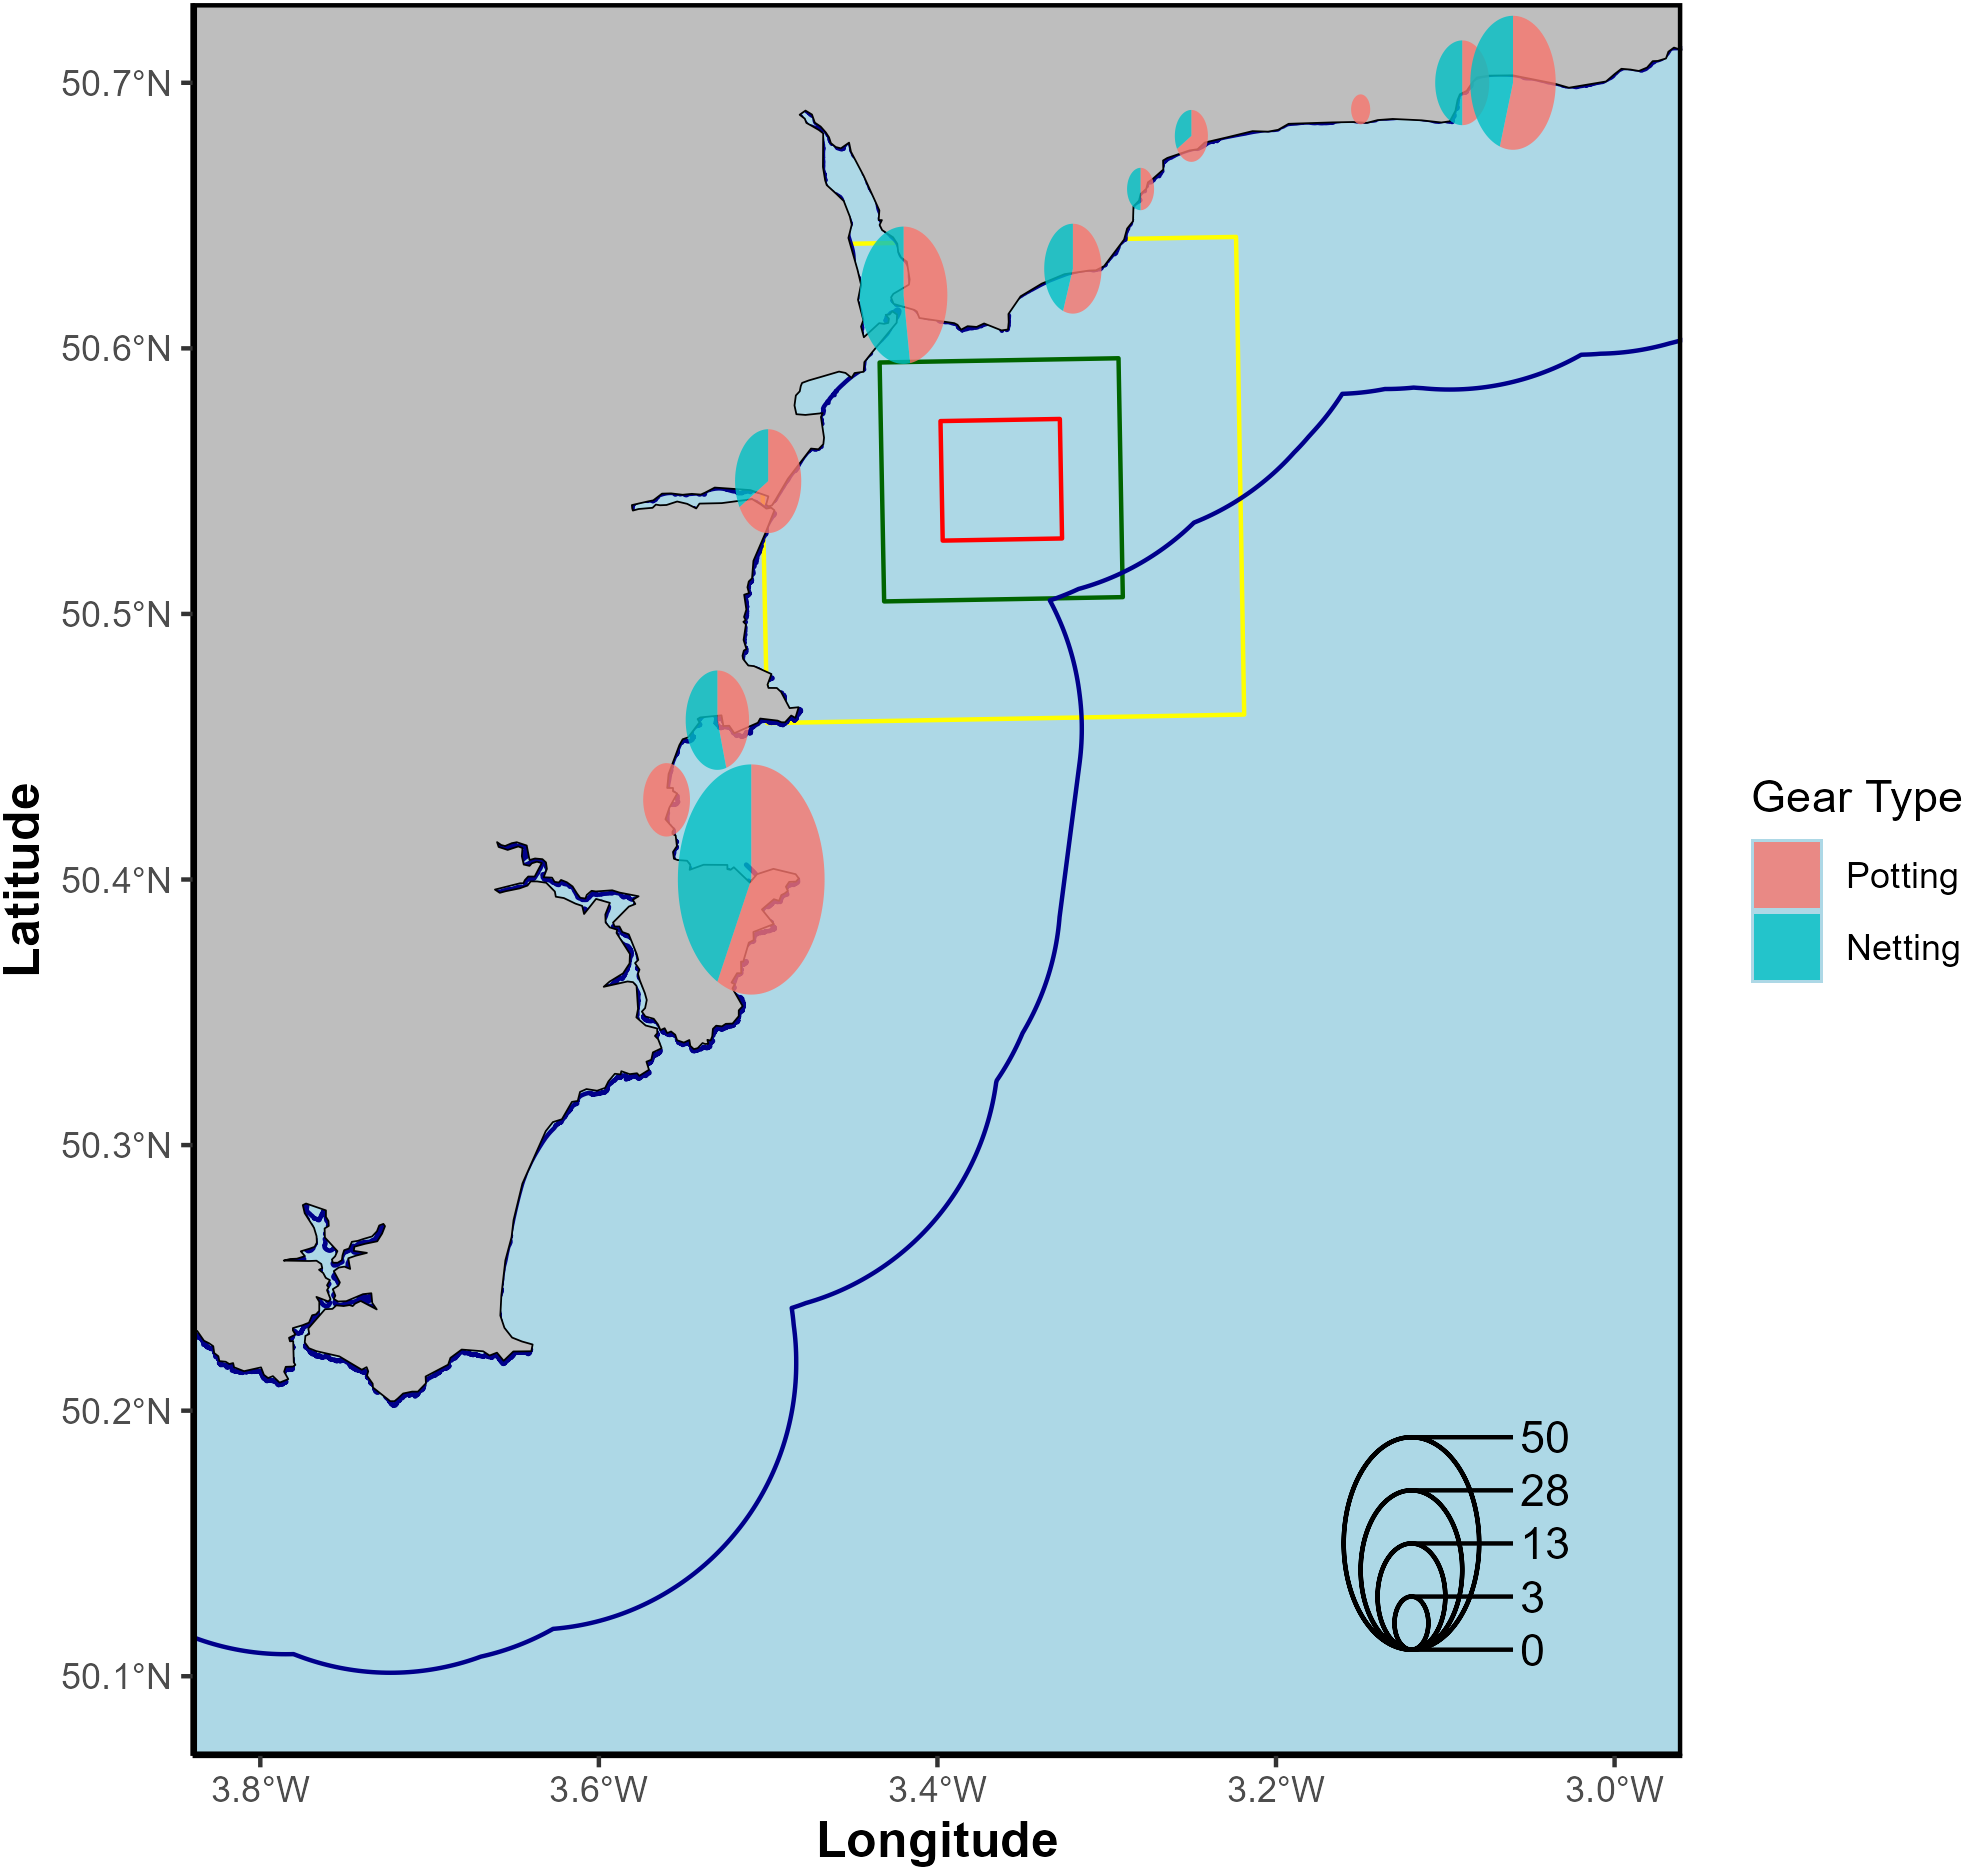
The number of static vessels that have been issued permits within the D&S IFCA, for ports close to the HypHPMA (within 20 n mi). The size of the circle represents the number of permits given, whilst the colour of the circle represents the proportion of each gear type (potting or netting). The red box represents the HypHPMA, green box represents the 100km2 surrounding area and yellow box is the 400km2 surrounding area, used as a comparison within habitat and displacement assessments. The dark blue outline represents D&S IFCA boundaries.
Based on landings, the total value for potting vessels (FPO) with D&S IFCA potting permits in 2019 was £1,099,850.72 and landings weight was 393,017.70 kg. The top species caught based on catch value were CRE edible crab £592,732.97, LBE European lobster £220,844.21, WHE whelks £201,697.61 and CTL Cuttlefish and bobtail squids £49,939.39. The ports with highest landings values for potting vessels were Salcombe, Exmouth, Brixham and Paignton, the closest of which was Exmouth, under 5km away from the HypHPMA. The top species caught based on catch weight, were CRE (191,679.90 kg), WHE (158,367.30 kg), LBE (16,433.50 kg) and CTL (15,594.40 kg).
For netting vessels (GN, GND, GNS) the total landings value for 2019 was £668,443.92 and landings weight was 191,079.50 kg. The top species caught based on catch value, were SOL Common sole £311,614.99, WHE £ 67,132.36, PLE European plaice £39,259.34 and CTL £28,669.64. The ports with highest landings values for netting vessels were Lyme Regis, Brixham, Exmouth and Plymouth, the closest of which was Exmouth, under 5km away from the HypHPMA. The top species caught based on catch weight, were WHE 53,048.30kg, SOL 19,183.70kg, PLE 17,766.3kg and HER Atlantic herring (Clupea harengus) 15,503.30kg.
The recreational permits (which include details on fishing restrictions) issued by the D&S IFCA were also recorded. For 2021 there were 288 recreational diving permits and 532 recreational potting permit holders recorded. The recreational potting and diving locations are unknown. Furthermore, recreational potters, netters and divers will not necessarily have a base port that can be used to highlight their activity.
4.2 Environmental assessment
4.2.1 Swept area ratios
The surface SAR of the HypHPMA was 1.96 and subsurface SAR was 0.700 (Figure 5). OTB was responsible for 42.54% of the total surface swept area within the HypHPMA whilst DRB and PTB were responsible for 34.83% and 22.63% (Table 1). Vessels<12m in length were responsible for 56.13% of the total surface swept area of the HypHPMA, whilst vessels ≥12m were responsible for 43.87%. The highest surface SAR was outside of the HypHPMA to the north-east of the area, whilst the highest subsurface SAR was to the east of the HypHPMA within the 100km2 area.
Figure 5
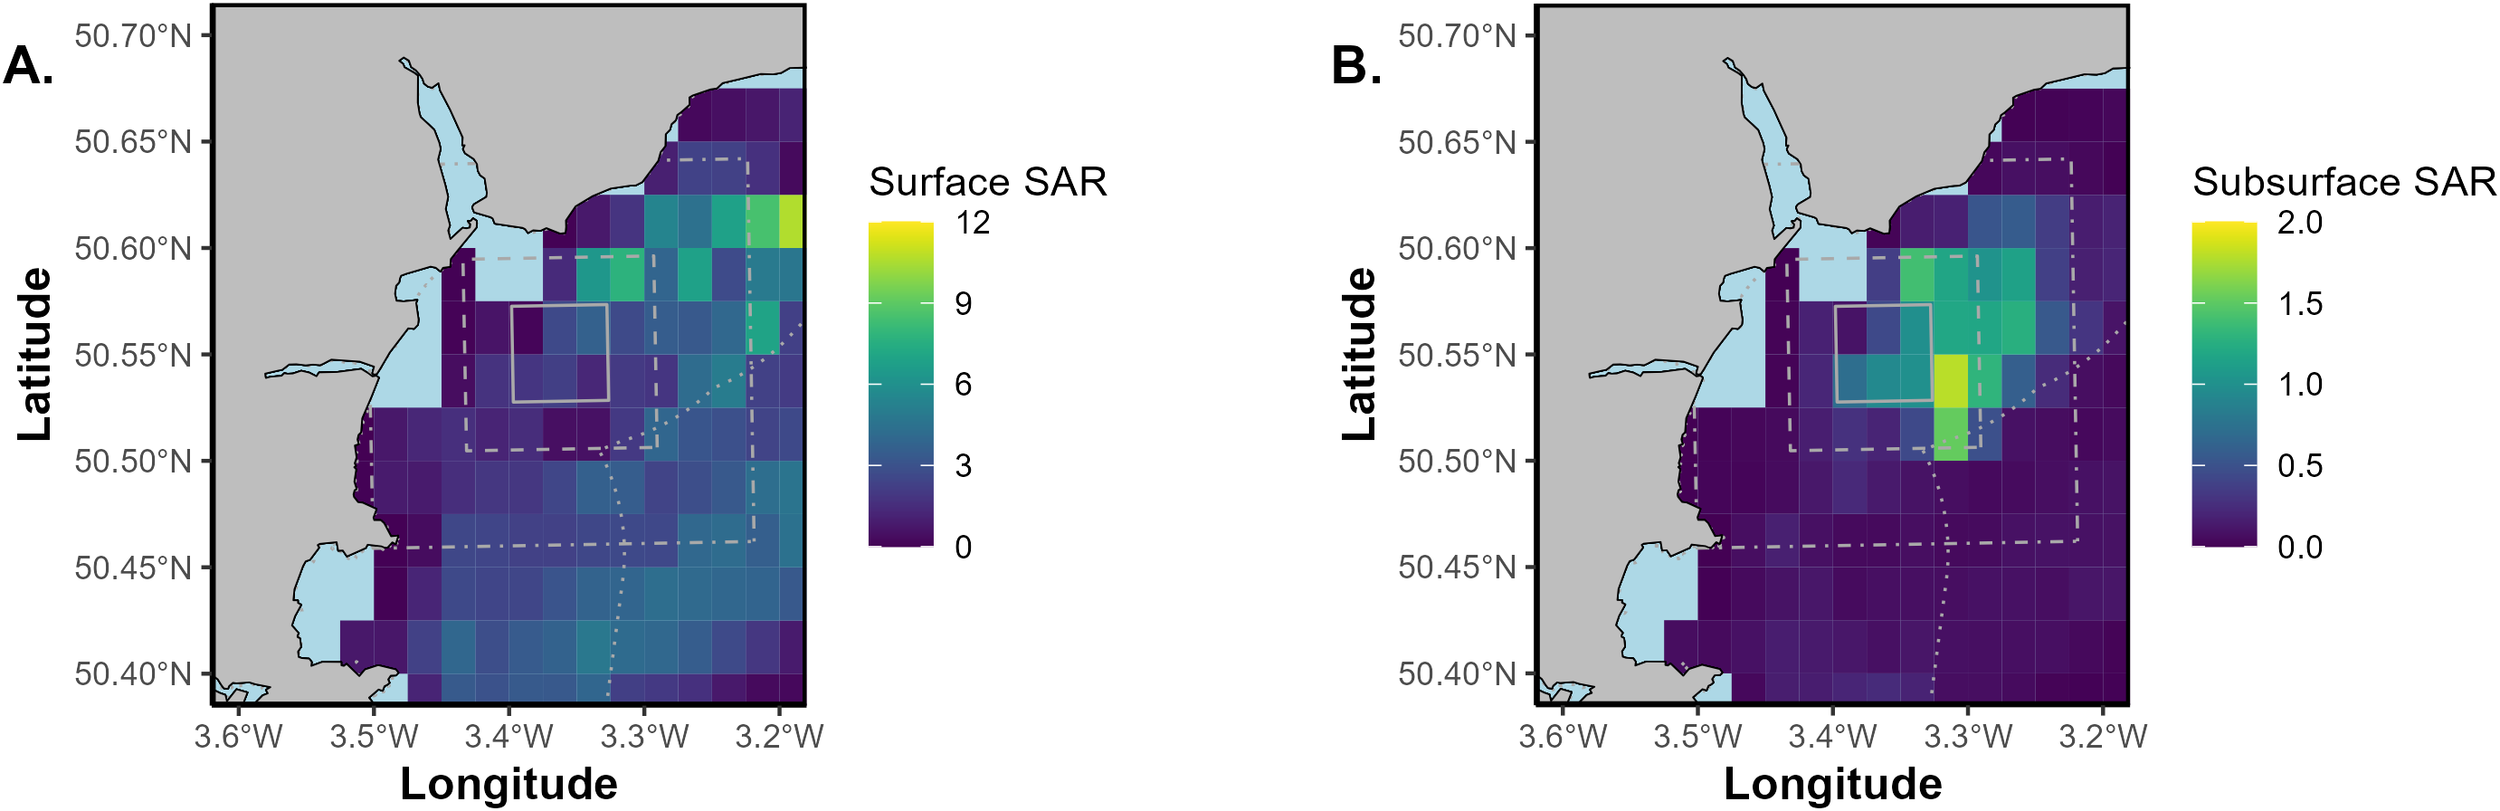
A heatmap of total (A) surface swept area ratio and (B) subsurface swept area ratio (>2cm penetration into the seabed) within the HypHPMA and surrounding areas during 2019, based on 0.025° by 0.025°C-squares. The solid grey box is the 25km2 HypHPMA, the dashed grey box represents the 100km2 surrounding area and the dot-dash box is the 400km2 surrounding area. The dotted grey outline represents D&S IFCA boundaries. C-squares containing fewer than 3 vessels have been removed from the analysis due to data sensitivity.
4.2.2 Benthic habitat type
The HypHPMA was comprised of two different benthic habitat types: A5.35: circalittoral sandy mud (94.01%) and A5.44: circalittoral mixed sediments (5.99%). A large proportion of the surrounding 100km2 and 400km2 areas also contained similar habitat types, however the area inside the D&S IFCA boundary and the outside area were more variable in habitat type (Figure 6A). The MESH confidence score for EUNIS habitat type for the whole of the HypHPMA was 0, as was the 100km2 area and 37.59% of the 400km2 area, indicating that the habitat classification is derived from modelled rather than surveyed data. For fishing activity within each habitat type, vessels spent 449.35hrs fishing within A5.35 in the HypHPMA and 1.80hrs fishing within A5.44 in the HypHPMA (Figure 6B). This is the equivalent of 19.17hrs fishing per km2 in the A5.35 habitat and 1.20hrs fishing per km2 in the A5.44 habitat. It is likely that a large proportion of fishing activity would occur over the A5.35 habitat, as it is the predominant habitat in the area. The SAR of each of the two habitats within the HypHPMA was 2.09 for A5.35 and 0.081 for A5.44.
Figure 6
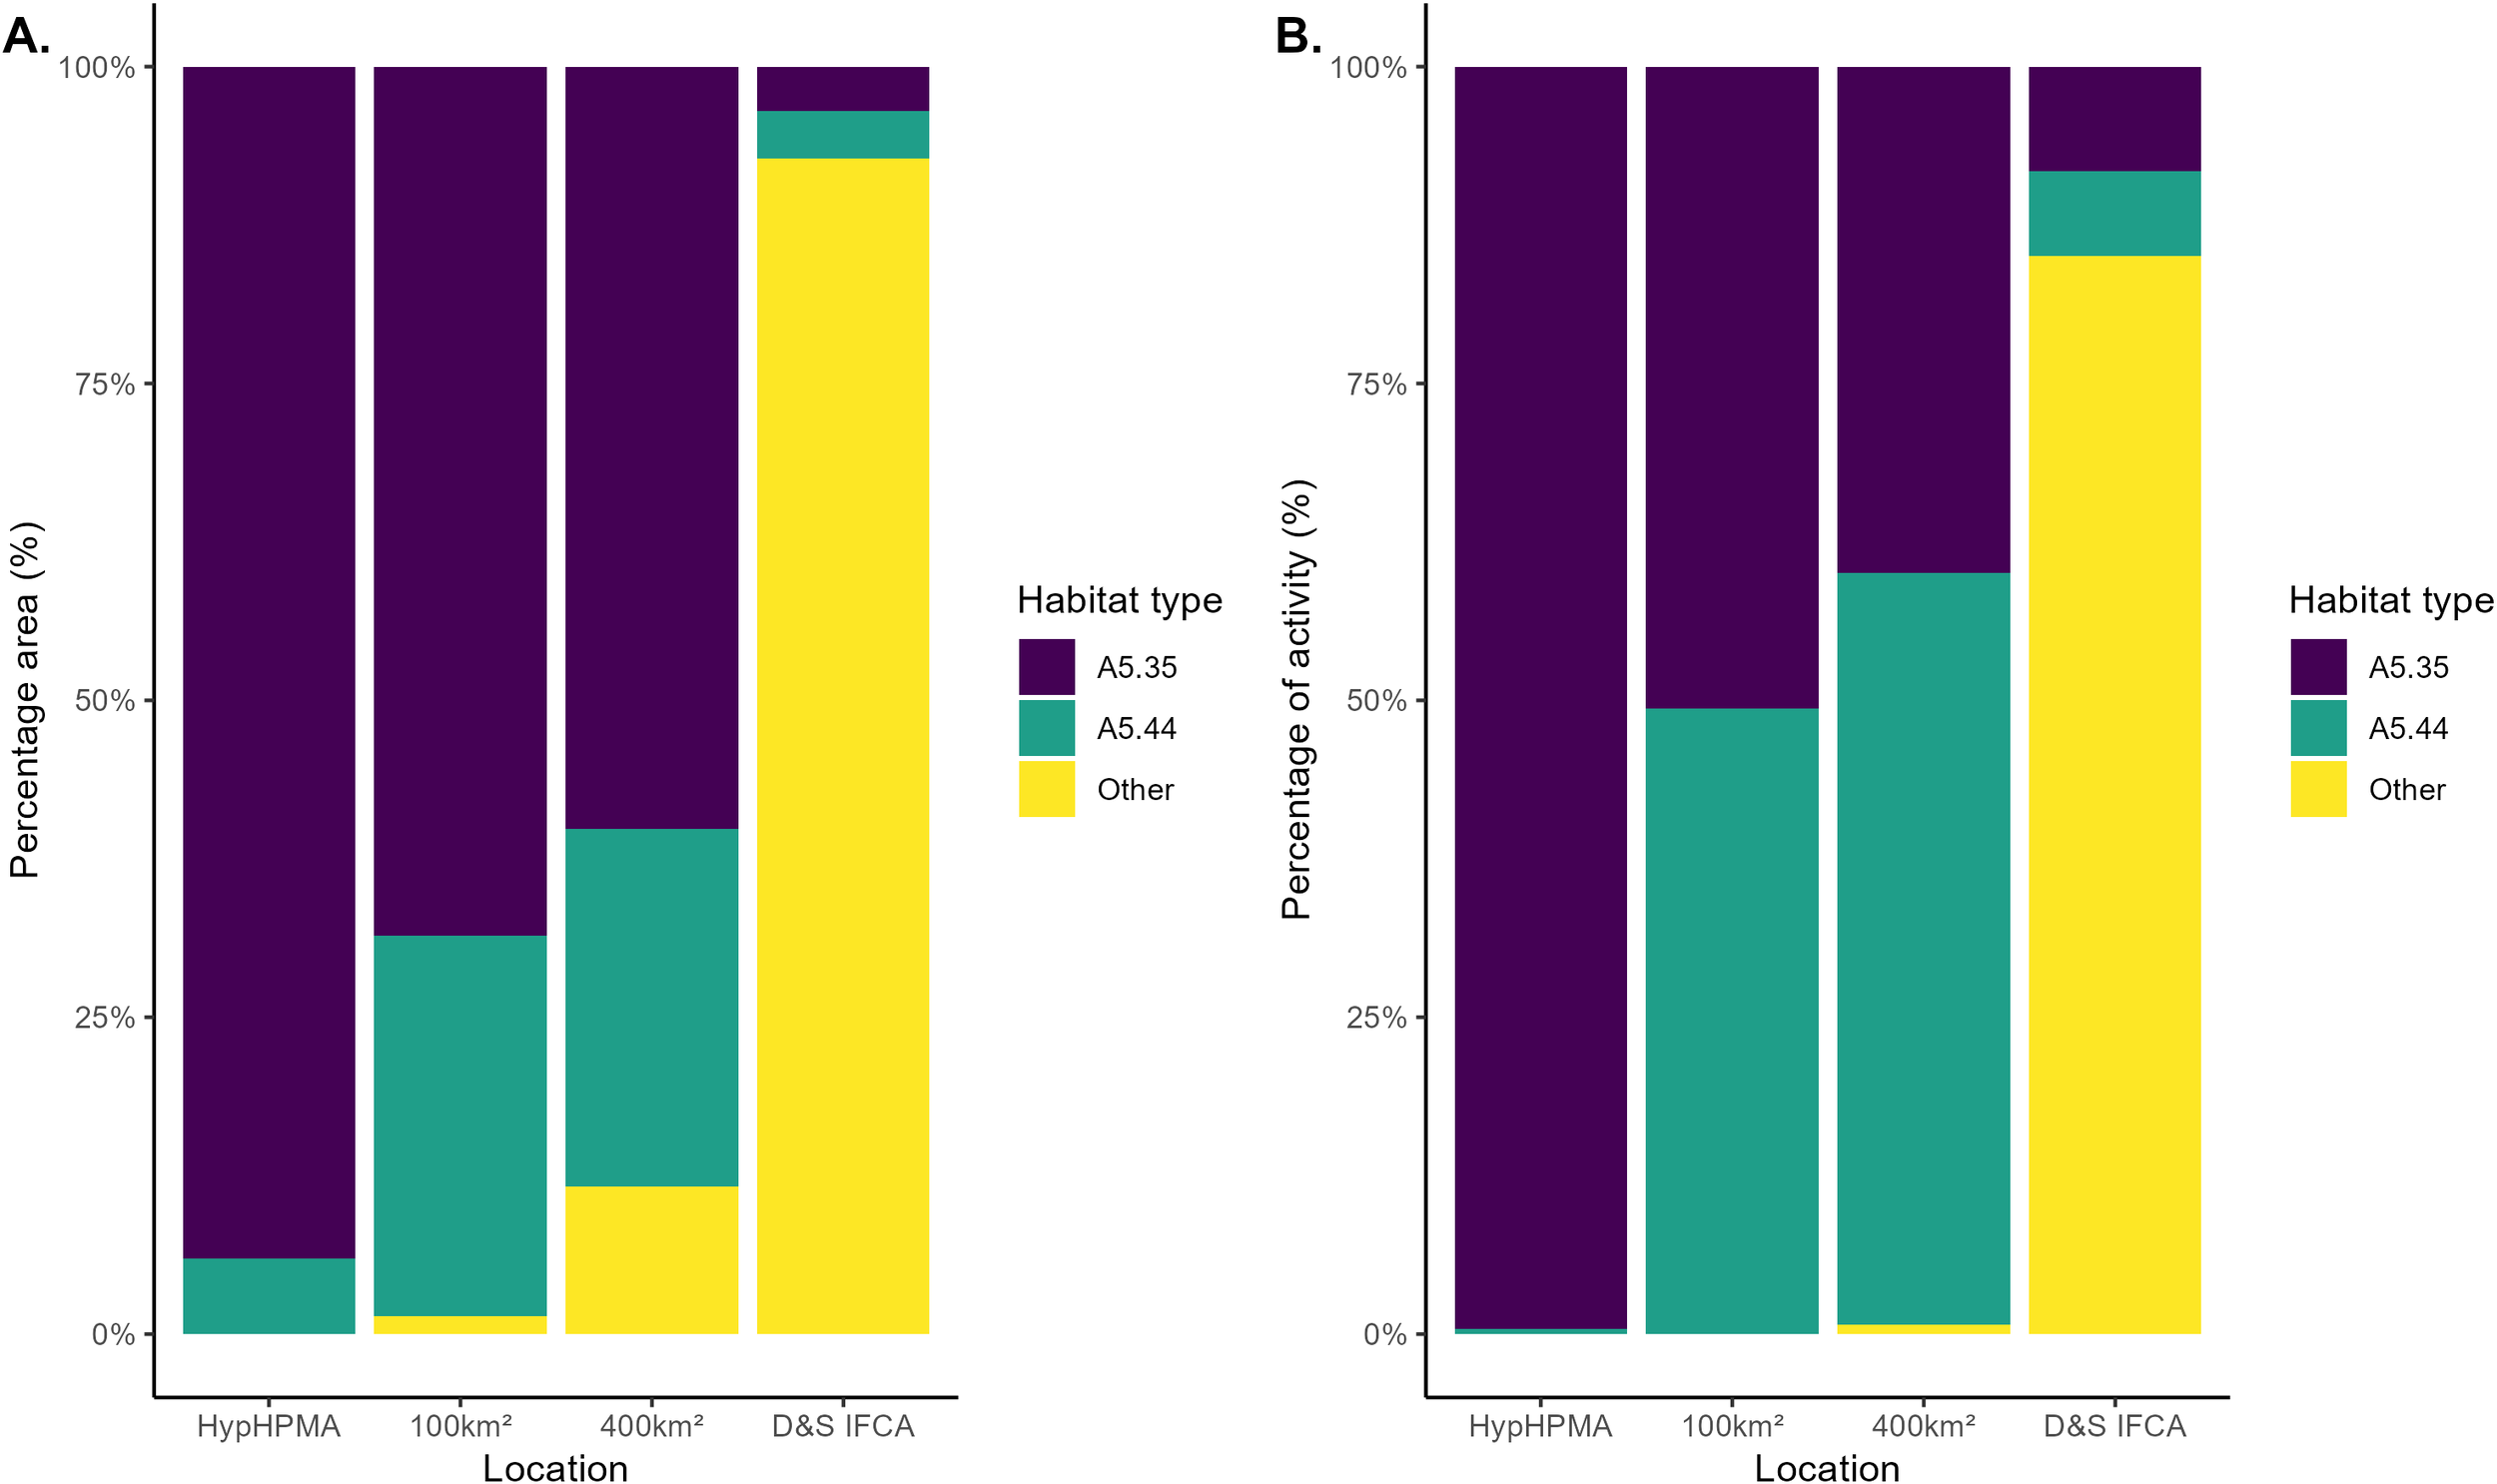
(A) Percentage of area covered by different EUNIS benthic habitat types within the HypHPMA, 100km2 surrounding area, 400km2 surrounding area and within the D&S IFCA boundary, (B) Percentage of fishing activity (hrs), depending on EUNIS habitat code, based on time spent within the HypHPMA and surrounding areas. EUNIS codes: A5.35: circalittoral sandy mud and A5.44: circalittoral mixed sediments, Other: other EUNIS codes.
4.2.3 Benthic habitat sensitivity
For the benthic habitat sensitivity assessment, NESSST indicated that 100% of the HypHPMA had a medium sensitivity for surface abrasion risk from demersal trawling and dredging (Figure 7A). For sensitivity to penetration (subsurface abrasion >2cm into the seabed) from demersal trawling and dredging 94.01% of the HypHPMA had a high sensitivity and 5.99% had a medium sensitivity (Figure 7B). The confidence for abrasion pressure was low in the HypHPMA (Figure 7C) and confidence the penetration pressure ranged from low to medium (Figure 7D). The confidence in biotope simulation was low and the MESH confidence was very low (Figures 7E, F). For fishing activity within each habitat type, vessels spent 449.35hrs fishing in areas of high sensitivity within the HypHPMA and 1.80hrs fishing within areas of medium sensitivity. This is the equivalent of 19.17hrs fishing per km2 in high sensitivity and 1.20hrs fishing per km2 in medium sensitivity. The swept sensitivity ratio of the HypHPMA was 3.93 for abrasion pressure (AB) and 2.10 for penetration pressure (SAB) (Table 2, Figures 8A, B).
Figure 7
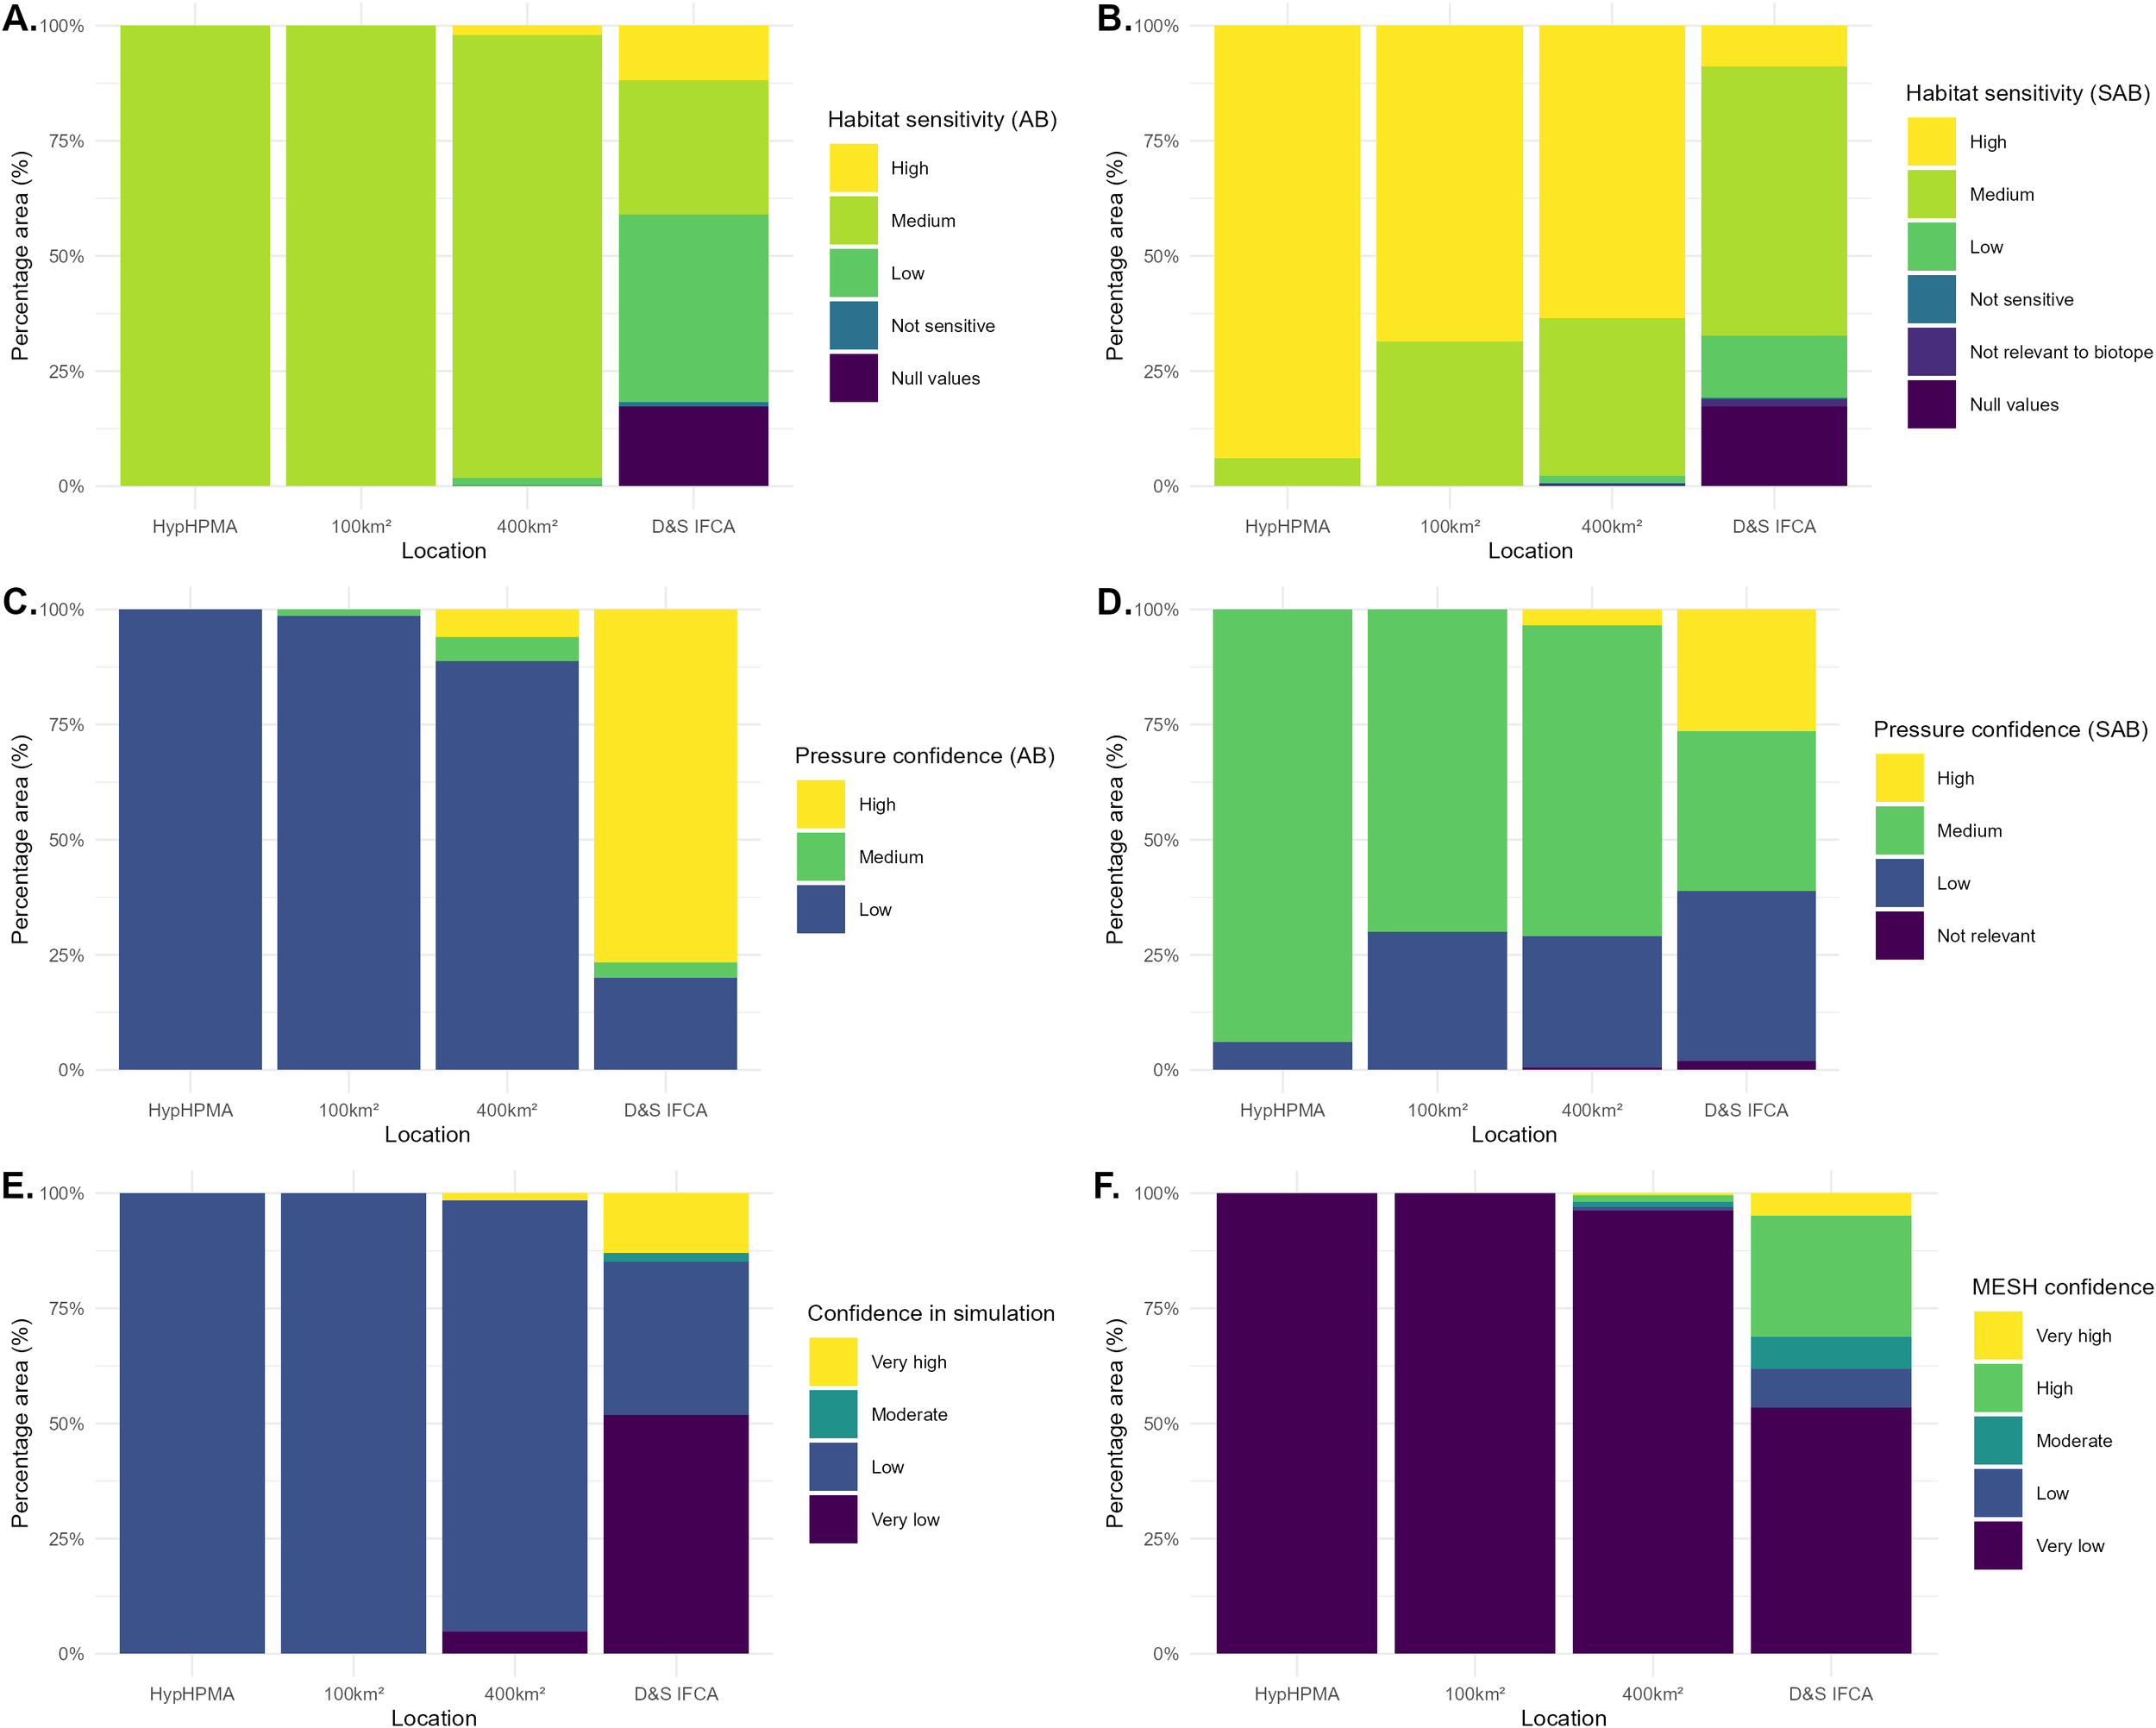
The percentage of area coverage by different benthic habitat sensitivities ranging from not sensitive to high sensitivity for (A) abrasion pressure from demersal trawling and dredging and (B) penetration pressure from demersal trawling and dredging. Confidences were also included for quality of evidence for resistance and resilience depending on the source quality, (C) for confidence in abrasion pressure from demersal trawling and dredging and (D) confidence in penetration pressure from demersal trawling and dredging (ranging from not sensitive to high). The (E) confidence in the simulation was also presented; a score (0 – 1) representing a quantitative estimation of the certainty associated with the biotope assigned to mapped habitat, alongside the (F) MESH confidence score, which represents the confidence in each of the mapping studies that make up the habitat map. These are presented for the HypHPMA, 100km2 surrounding area, 400km2 surrounding area and within the D&S IFCA boundary.
Table 2
| Location | Time (hrs) | Effort (kWh) | Catch weight (kg) | Catch value (£) | Surface SAR | Subsurface SAR | Surface SSR | Subsurface SSR | Area size (km2) |
|---|---|---|---|---|---|---|---|---|---|
| HypHPMA | 18.09 | 3582.71 | 2561.69 | 4893.50 | 1.958 | 0.700 | 3.916 | 2.097 | 25.02 |
| 100 km2 | 18.60 | 3510.03 | 2341.79 | 4336.07 | 2.059 | 0.684 | 4.119 | 1.720 | 75.05 |
| 400 km2 | 7.22 | 1344.04 | 1533.60 | 2214.51 | 2.336 | 0.223 | 4.676 | 0.502 | 242.86 |
| Boundary | 2.76 | 569.02 | 440.07 | 755.85 | 0.597 | 0.0961 | 1.401 | 0.261 | 4253.36 |
Total time spent (hrs), fishing effort (kwh), catch weight (kg), catch value (£), swept area ratio for surface abrasion, swept area ratio for subsurface abrasion, swept sensitivity ratio for surface abrasion and swept sensitivity ratio for subsurface abrasion and size of the area (excluding the other areas, in km2) in each location (HypHPMA, 100km2, 400 km2 surrounding areas and the D&S IFCA boundary).
Time, fishing effort, catch weight and catch value was standardized per km2 for comparison.
Figure 8
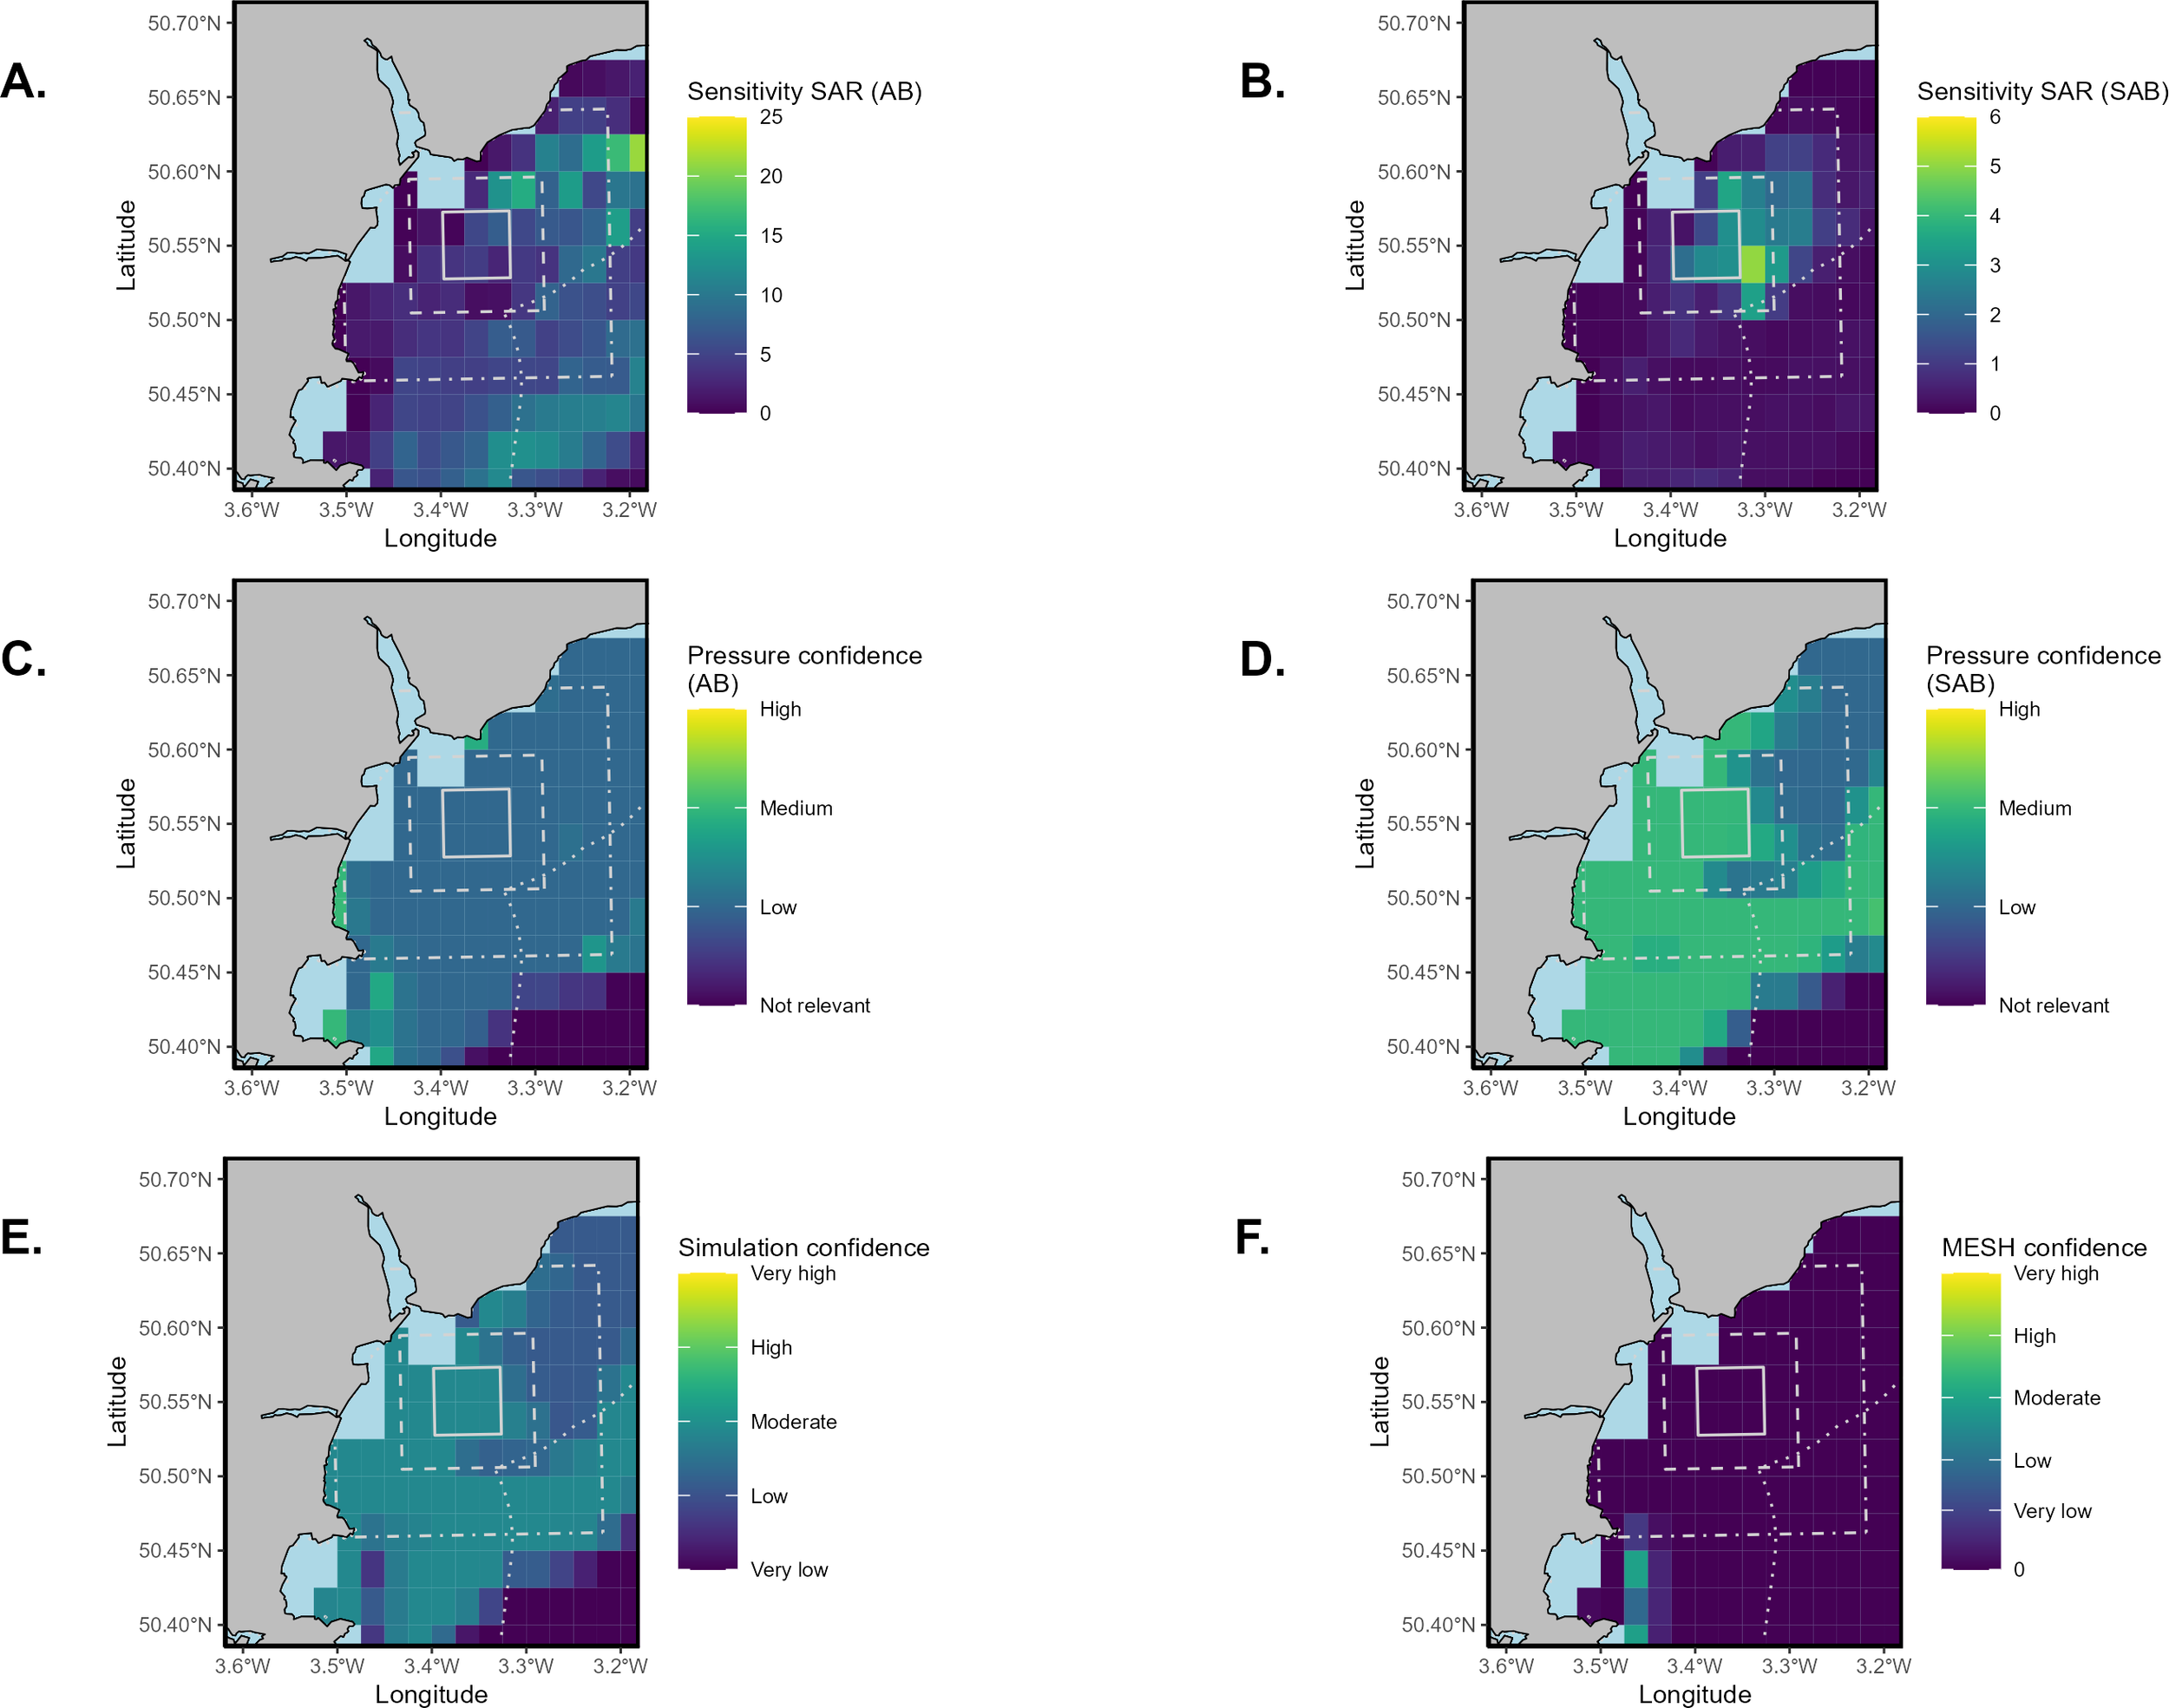
Heatmaps of swept sensitivity ratio (SSR) over different benthic habitat sensitivities ranging from not sensitive to high sensitivity for (A) abrasion pressure from demersal trawling and dredging and (B) penetration pressure from demersal trawling and dredging. Heatmaps of confidences were also included for quality of evidence for resistance and resilience depending on the source quality (C) for confidence in abrasion pressure from demersal trawling and dredging and (D) confidence in penetration pressure from demersal trawling and dredging (ranging from not sensitive to high). The (E) confidence in the simulation was also presented; a score (0 – 1) representing a quantitative estimation of the certainty associated with the biotope assigned to mapped habitat, alongside the (F) MESH confidence score, which represents the confidence in each of the mapping studies that make up the habitat map. These are presented for the HypHPMA, 100km2 surrounding area, 400km2 surrounding area and within the D&S IFCA boundary. Heatmaps are presented at 0.025° by 0.025°C-squares. The solid grey box is the 25km2 HypHPMA, the dashed grey box represents the 100km2 surrounding area and the dot-dash box is the 400km2 surrounding area. The dotted grey outline represents D&S IFCA boundaries. C-squares containing fewer than 3 vessels have been removed from the analysis due to data sensitivity.
4.2.4 Nursery and spawning grounds
There was an average species richness of 5.00 for spawning grounds, 6.08 for juveniles and 5.21 for adults within the HypHPMA, from the 29 fish species used within the hotspot analysis, the total number of fish species in an area ranged from 1–7 for spawning, juveniles and adults. Fishing activity within the HypHPMA occurred over an average of 5.61 species for spawning grounds, 6.49 for juveniles and 5.64 for adults (Figure 9).
Figure 9
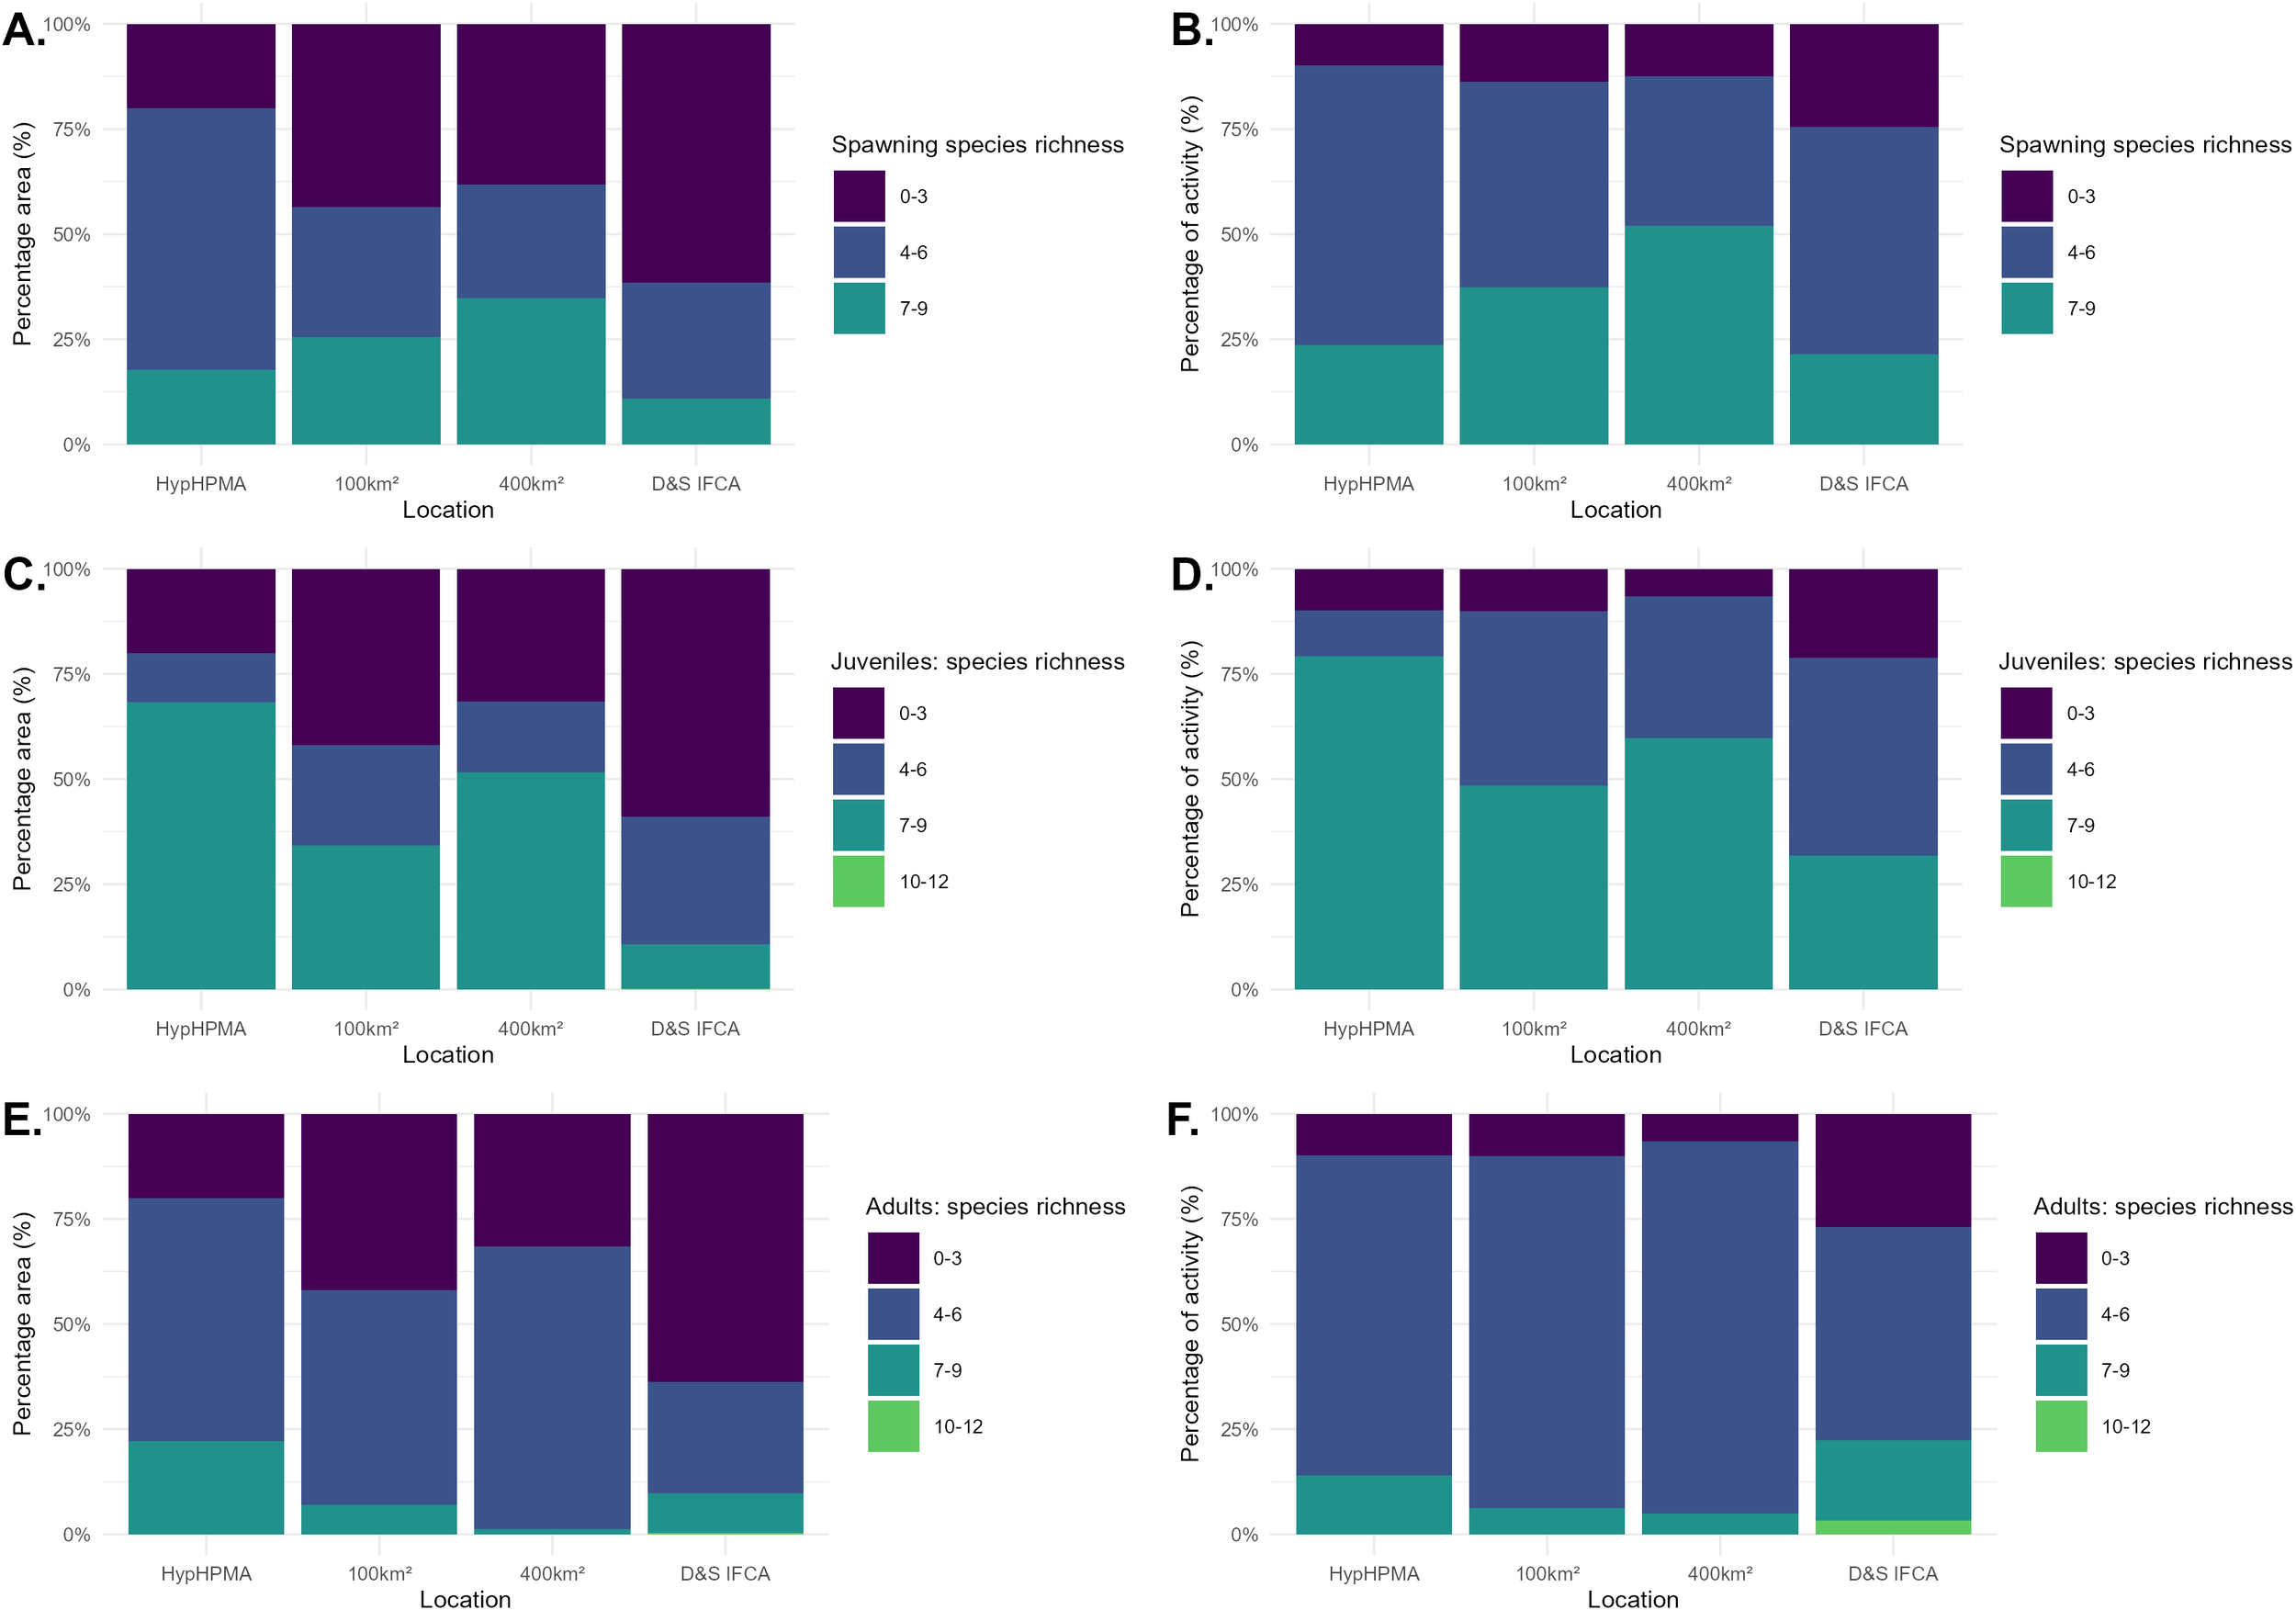
Percentage of area depending on fish species richness based on the EFH map within the HypHPMA, 100km2, 400km2, within the D&S IFCA boundary, for (A) Spawning grounds (C) juveniles and (E) adults. Percentage of fishing activity (hrs), depending on different fish species richness based on the EFH map, within the HypHPMA and surrounding areas for (B) Spawning grounds (D) juveniles and (F) adults.
4.2.5 Blue carbon habitats
94.01% of the HypHPMA was blue carbon habitat, all of which was A5.3 Subtidal mud. This habitat type has an average organic carbon stock of 5.5 kg C m-2 (Swale et al., 2022), giving a total of 129,263.75 tonnes of carbon stored. The total time spent fishing over blue carbon habitat within the HypHPMA was 449.35hrs (Figure 10), with a SAR of 2.09.
Figure 10
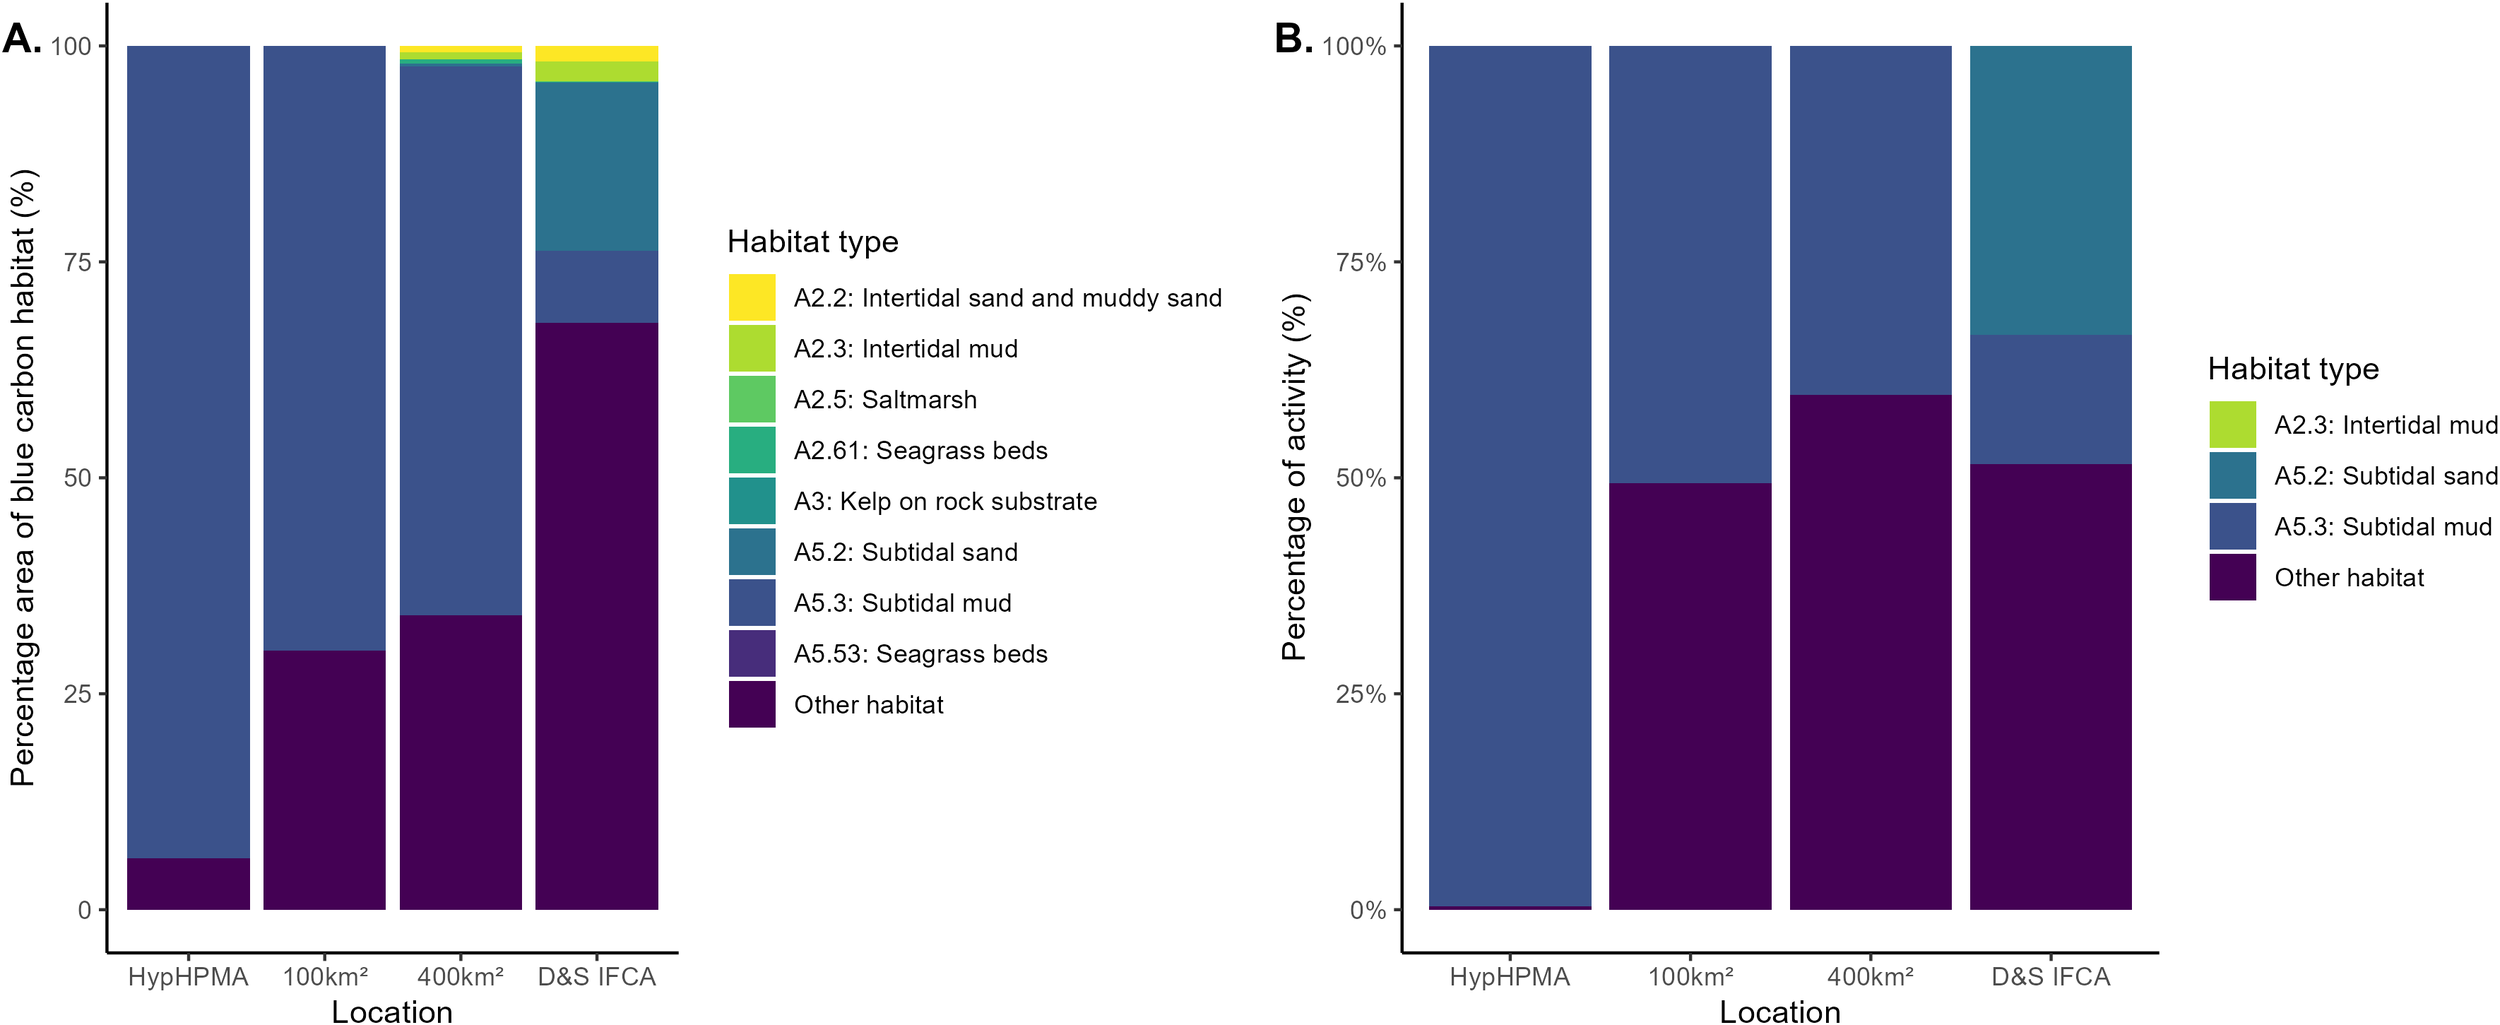
(A) Percentage of area covered by different blue carbon habitat types within the HypHPMA, 100km2, 400km2, within the D&S IFCA boundary, (B) Percentage of fishing activity (hrs), depending on EUNIS habitat code, based on time spent within the HypHPMA and surrounding areas. Other is other habitat types with a low level of blue carbon sequestration.
4.2.6 Predicting displacement
The fishing the line model for predicting displacement moves all fishing pings to the closest point outside the boundary line of the HypHPMA, thus the fishing activity in the 100km2 area increases from 1,390.95 hrs to 1,842.10 hrs which is a 32.43% increase in fishing activity in that area, the SAR of the 100km2 area also increases from 2.07 to 2.72.
Using the habitat similarity model where all points within the HypHPMA are moved to the closest point outside the boundary line of the same habitat type, the fishing activity in the A5.35 habitat in the 100km2 area increases from 704.70 hrs to 1,154.05hrs which is a 63.76% increase in fishing activity in that area, for the A5.44 habitat in the 100km2 area increases from 686.25 hrs to 688.05 hrs which is a 0.26% increase. SAR increases from 1.51 for the A5.35 habitat within the 100km2 area to 2.46 and from 3.43 to 3.44 in the A5.44 habitat within the 100km2 area. It is likely that a large proportion of fishing activity would occur over the A5.35 habitat, as it is the predominant habitat in the area. However, the increases in fishing pressure in predicted for A5.35 habitat should be interpreted with caution, since the forecasted patterns may largely reflect the inherent imbalance in habitat distribution. As 94.01% of the HypHPMA is A5.35 and only 5.99% is A5.44.
The amount and percentage time spent fishing and SAR in other areas if the HypHPMA was introduced, was predicted using the formula . Time spent fishing and SAR was predicted to increase within all surrounding areas, with the greatest percentage increase in fishing time (5.08%) and surface SAR (3.44%) and subsurface SAR (5.98%) within the 100km2 area (Table 3), with greatest surface SAR (AB) increases shown within the North-East of the 100km2 area (Figure 11). Swept sensitivity ratios were also predicted to increase within the surrounding areas (Figure 12, Table 3), with surface SSR increasing by 3.44% in the 100km2 surrounding area and subsurface SSR increasing by 5.78%.
Table 3
| Period | Measurement | Location | ||||
|---|---|---|---|---|---|---|
| HypHPMA | 100 km2 | 400 km2 | Boundary | Outside | ||
| Before | Time spent fishing (hrs) | 451.15 | 1390.95 | 2158.90 | 11378.45 | 54310.30 |
| After | ~ | 1461.57 | 2221.89 | 11449.78 | 54556.51 | |
| Percentage increase (%) | ~ | 5.08 | 2.92 | 0.627 | 0.453 | |
| Before | Surface swept area ratio (AB) | 1.958 | 2.059 | 2.336 | 0.597 | ~ |
| After | ~ | 2.130 | 2.374 | 0.600 | ~ | |
| Percentage increase (%) | ~ | 3.45 | 1.61 | 0.503 | ~ | |
| Before | Subsurface swept area ratio (SAB) | 0.700 | 0.684 | 0.223 | 0.0961 | ~ |
| After | ~ | 0.725 | 0.231 | 0.0966 | ~ | |
| Percentage increase (%) | ~ | 5.99 | 3.59 | 0.544 | ~ | |
| Before | Surface swept Sensitivity ratio (AB) | 3.916 | 4.119 | 4.676 | 1.401 | ~ |
| After | ~ | 4.261 | 4.752 | 1.407 | ~ | |
| Percentage increase (%) | ~ | 3.45 | 1.61 | 0.428 | ~ | |
| Before | Subsurface swept Sensitivity ratio (SAB) | 2.097 | 1.720 | 0.502 | 0.261 | ~ |
| After | ~ | 1.823 | 0.521 | 0.262 | ~ | |
| Percentage increase (%) | ~ | 5.99 | 3.75 | 0.513 | ~ | |
Total time spent (hrs), swept area ratio for surface abrasion (AB), swept area ratio for subsurface abrasion (SAB), swept sensitivity ratio for surface abrasion (AB) and swept sensitivity ratio for subsurface abrasion (SAB), in each location (HypHPMA, 100km2, 400 km2 surrounding areas, inside the D&S IFCA boundary and outside the D&S IFCA boundary) before closure and predicted time after closure.
Figure 11
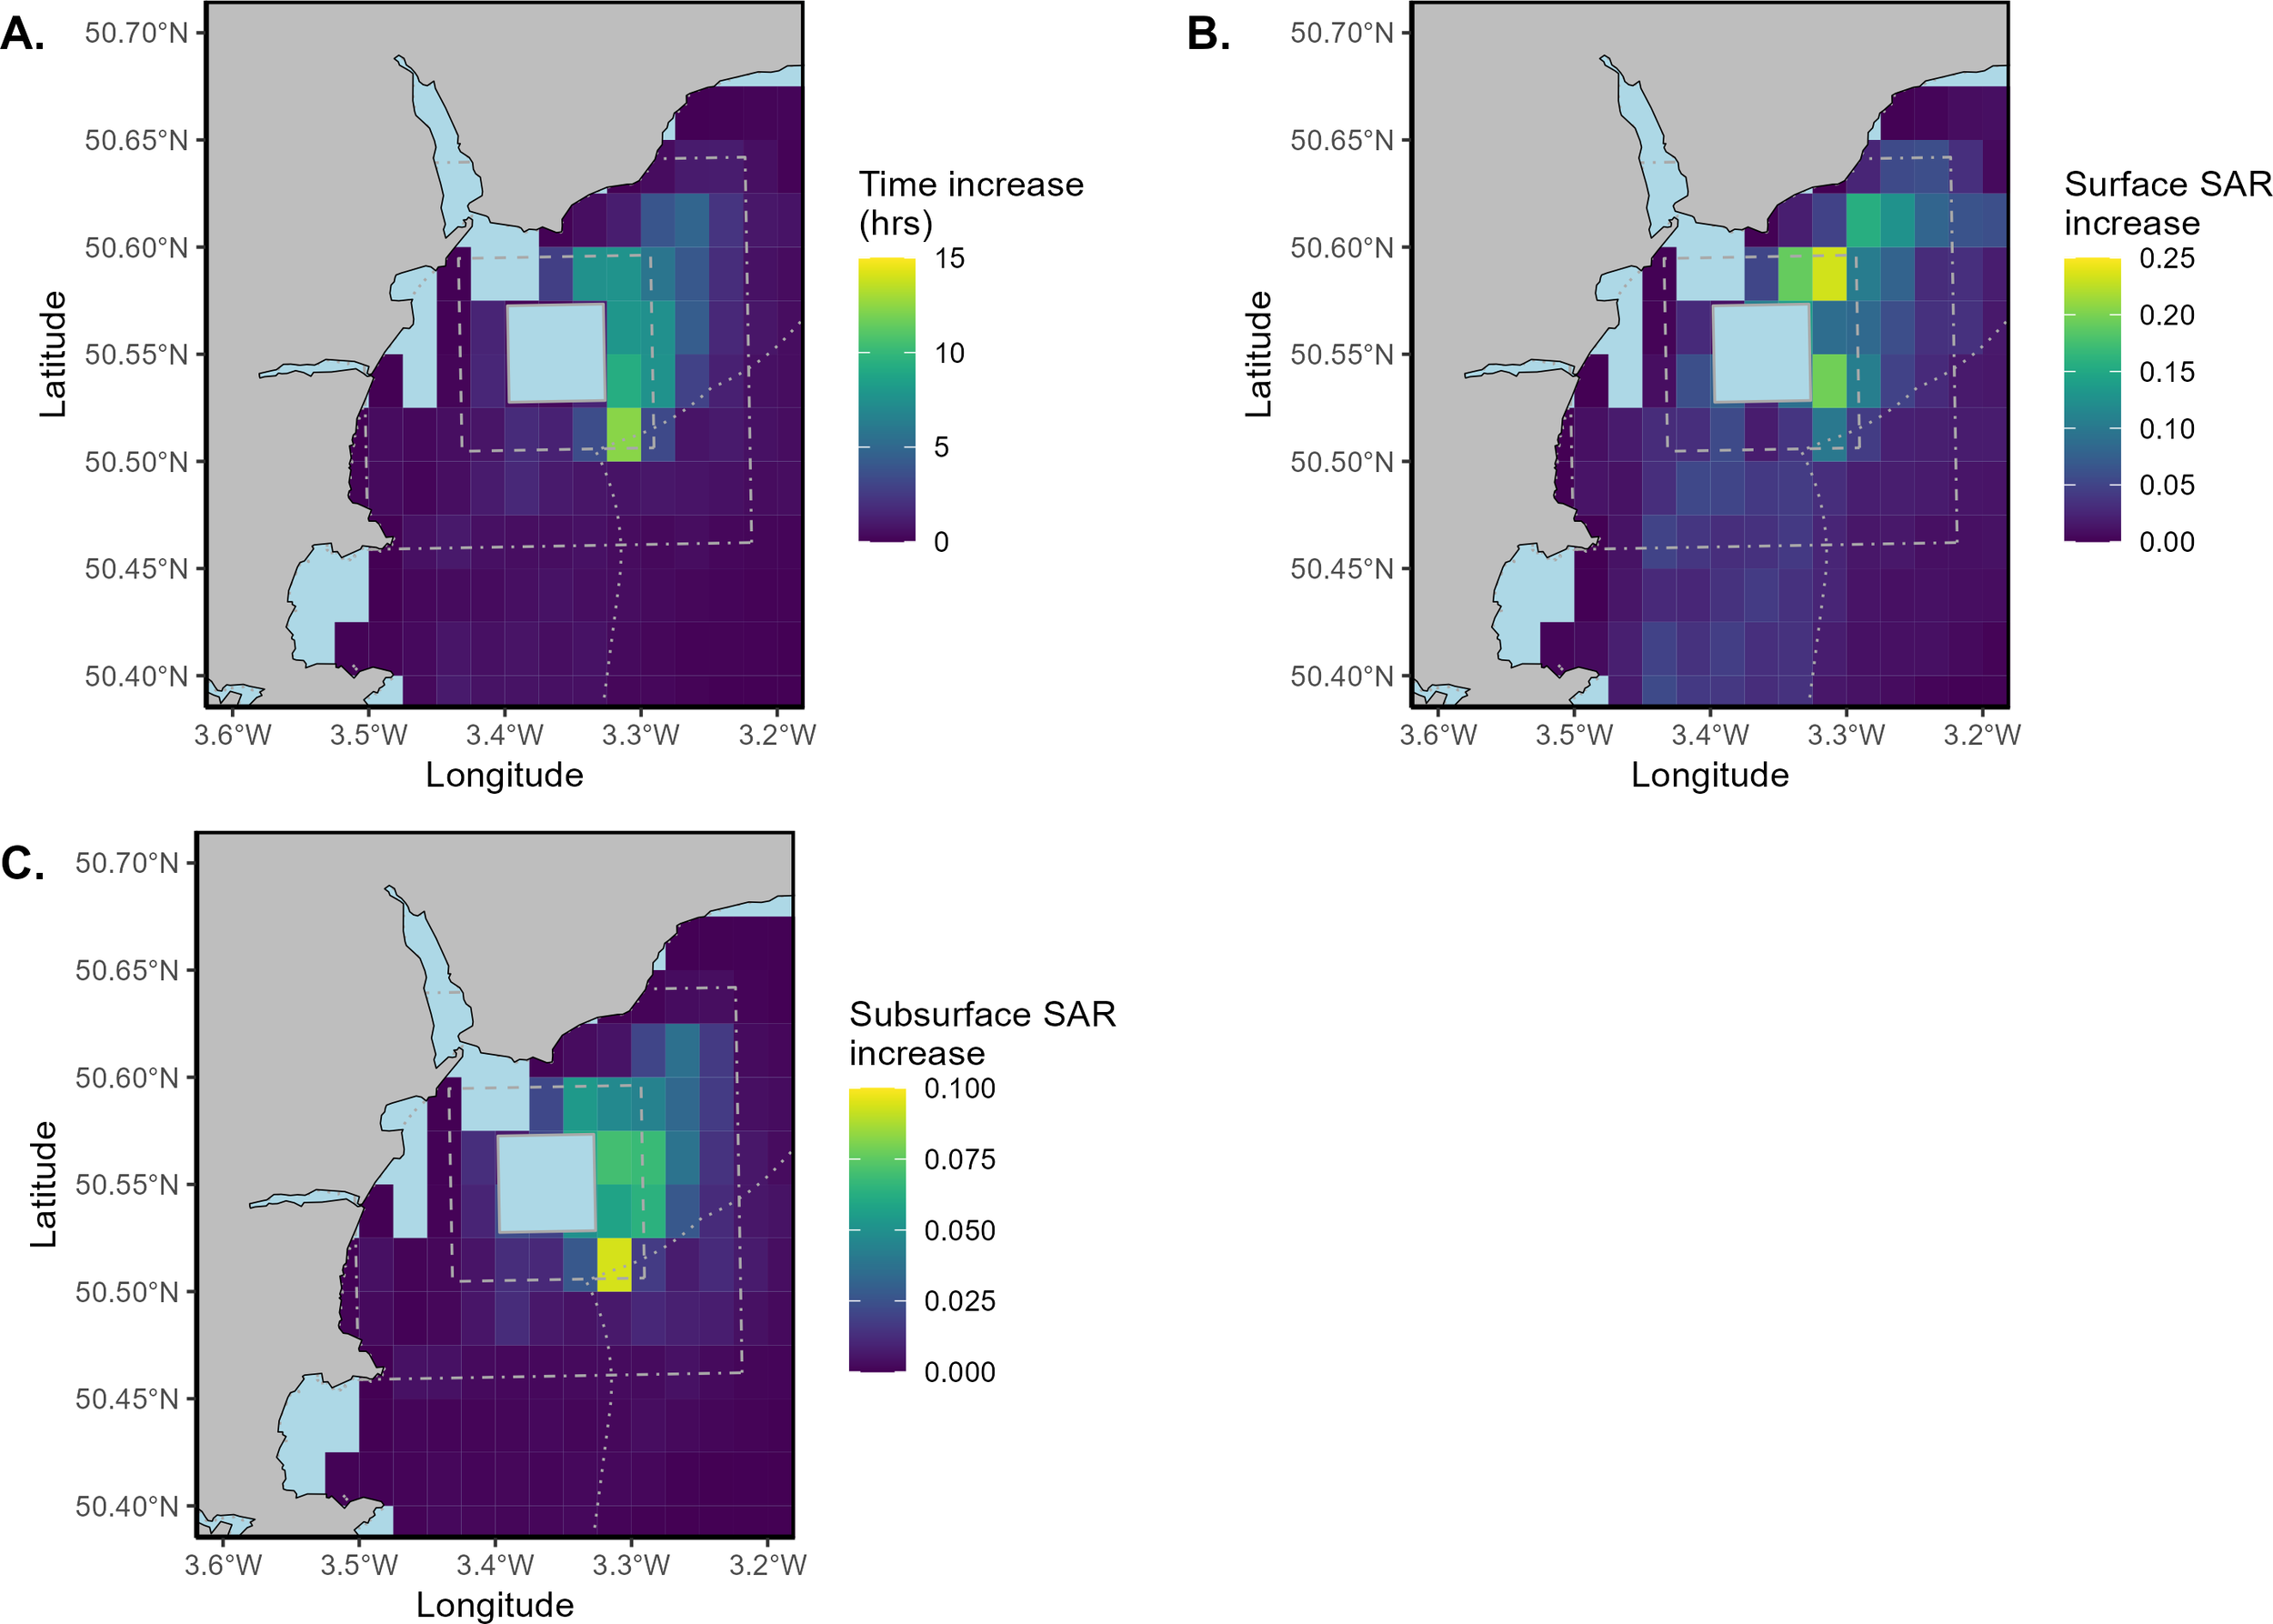
A heatmap of total increase in (A) time spent (hrs) (B) swept area ratio (SAR) for surface abrasion and (C) swept area ratio (SAR) for subsurface abrasion, within the HypHPMA and surrounding areas during 2019 predicted using the formula , based on 0.025° by 0.025°C-squares. The solid grey box is the 25km2 HypHPMA, the dashed grey box represents the 100km2 surrounding area and the dot-dash box is the 400km2 surrounding area. The dotted grey outline represents D&S IFCA boundaries. C-squares containing fewer than 3 vessels have been removed from the analysis due to data sensitivity.
Figure 12
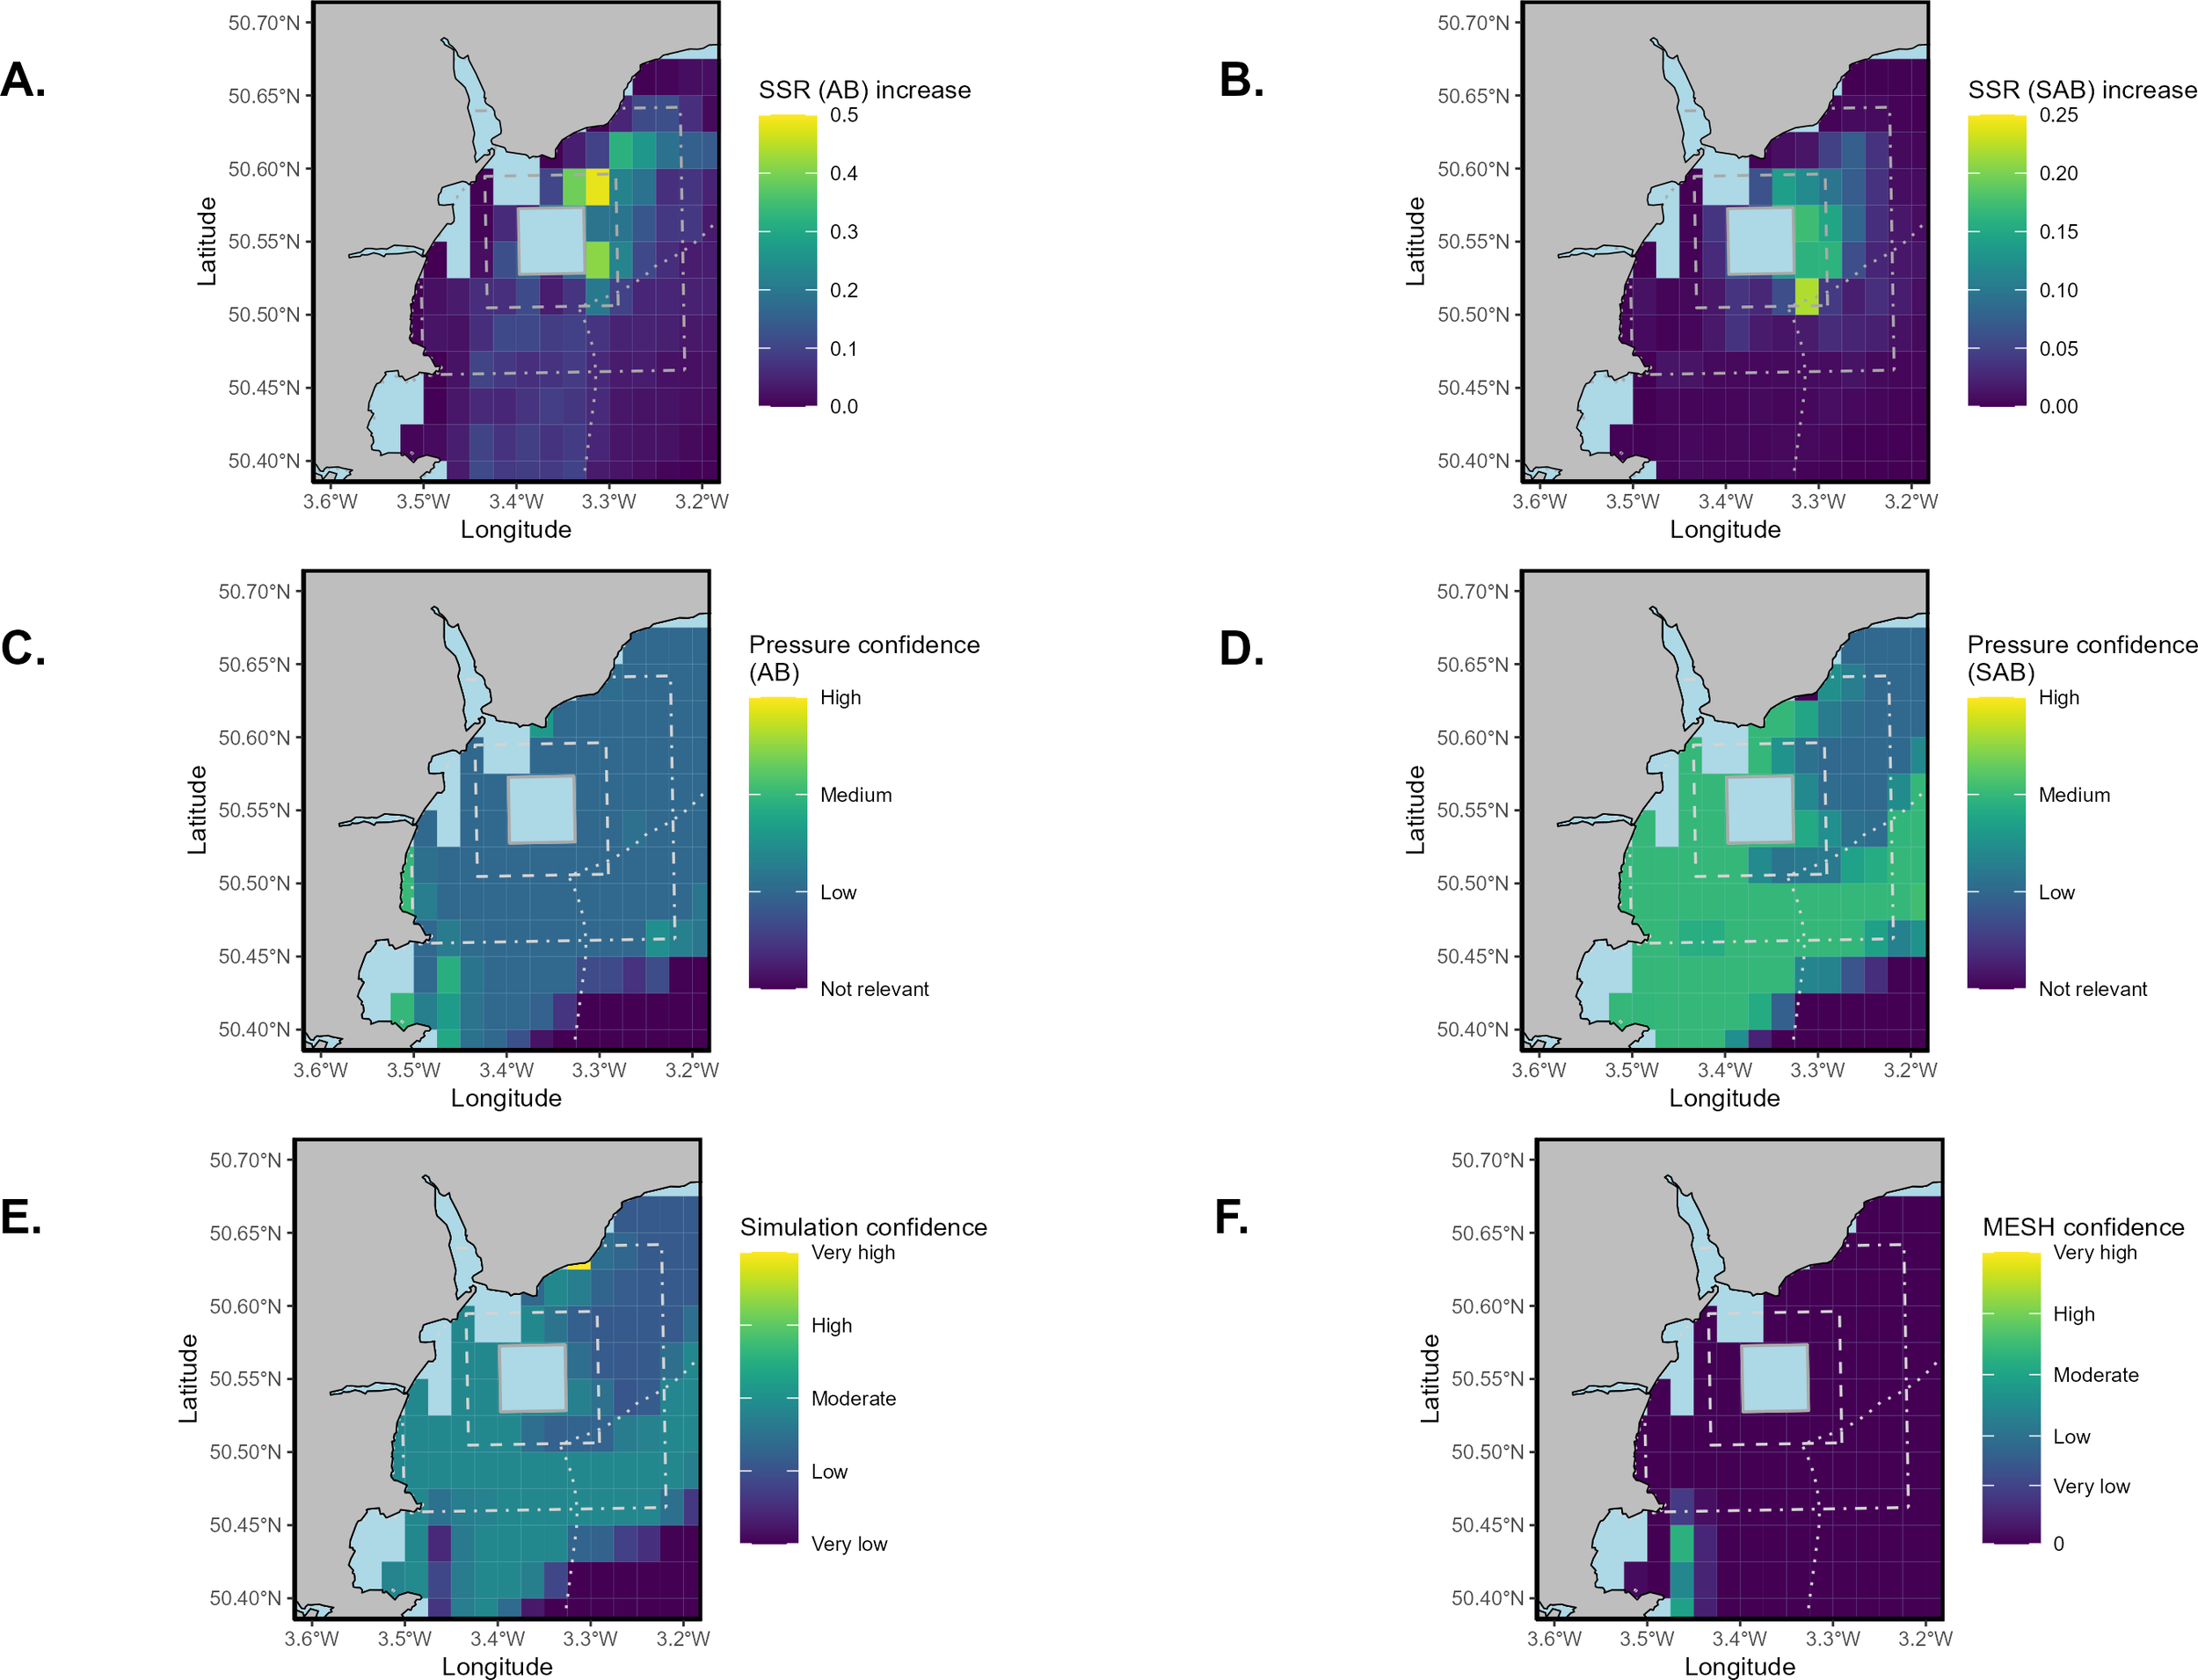
Heatmaps of predicted increase in swept sensitivity ratio (SSR) over different benthic habitat sensitivities ranging from not sensitive to high sensitivity for (A) abrasion pressure from demersal trawling and dredging (AB) and (B) penetration pressure from demersal trawling and dredging (SAB). Heatmaps of confidences were also included for quality of evidence for resistance and resilience depending on the source quality, (C) for confidence in abrasion pressure from demersal trawling and dredging and (D) confidence in penetration pressure from demersal trawling and dredging (ranging from not sensitive to high). The €. confidence in the simulation was also presented; a score (0 – 1) representing a quantitative estimation of the certainty associated with the biotope assigned to mapped habitat, alongside the (F) MESH confidence score, which represents the confidence in each of the mapping studies that make up the habitat map. These are presented for the HypHPMA, 100km2 surrounding area, 400km2 surrounding area and within the D&S IFCA boundary. Heatmaps are presented at 0.025° by 0.025°C-squares. The solid grey box is the 25km2 HypHPMA, the dashed grey box represents the 100km2 surrounding area and the dot-dash box is the 400km2 surrounding area. The dotted grey outline represents D&S IFCA boundaries. C-squares containing fewer than 3 vessels have been removed from the analysis due to data sensitivity.
5 Discussion
The aim of this study was to develop and evaluate a standardised approach for assessing displacement from protected areas due to management measures by applying the 2017 Natural England template (ABPmer, 2017). This assessment addressed both the socio-economic and environmental impacts of displacement and predicts where effort could potentially be displaced to. This method is standardized and appropriate for future assessments of fishing displacement from HPMAs, to inform management and policy.
5.1 Socioeconomic impacts
For the socio-economic analysis, results indicated that the average vessel using the HypHPMA could lose 2.98% ± 4.49 SD of their catch value due to closure assuming no redistribution of fishing effort. Furthermore, three vessels using dredges earnt over 10% of their income within the HypHPMA; a >10% loss in earnings is deemed a high risk for fishing vessels (Hintzen, 2023). 15% of the overall D&S IFCA mobile fleet used the HypHPMA at some point during the year, these were a mixture of<12m and ≥12m vessel lengths with the majority deploying scallop dredges. Assessing both individual and fleet wide impacts of displacement is recommended (ABPmer, 2017; Bastardie et al., 2015), especially for<12m vessels, as these may have a smaller operating range and may be more adversely impacted by loss in income (ABPmer, 2017; Benyon et al., 2020). In this case, two of the three of vessels with >10% of earnings from the HypHPMA were<12m in length, highlighting the importance of consultation with fishers before site designation.
There was significant variation in fishing activity throughout 2019; with the highest fishing activity in October and significantly lower activity over the summer and during the winter months in the HypHPMA. This could be due to a) the seasonality of fish caught (Bell et al., 2017; Respondek et al., 2014); b) holidays during those months (Guiet et al., 2019) c) fishing opportunities both within the study area and elsewhere, due to area closures or restrictions. In addition, 85.29% of the total catch value within the HypHPMA was Great Atlantic scallop; scallops have seasonally variable yield and are highly seasonal fisheries (Bell et al., 2017). Thus, it is likely that fishing effort may have decreased over the summer due to seasonal closures during the spawning season. Scallop closure occurs within this area between 1st July – 30th September, which would explain the low fishing effort over the summer months. There was also variation in fishing effort and landings weights and values spatially; this was much higher in the northeast of the 100km2 surrounding area, however the average effort and landings in the HypHPMA and 100km2 per km2 were similar. This could suggest that they are both similar quality fishing grounds, however it also highlights the potential for competition for displaced vessels and vessels currently fishing in the 100km2 area. Once again the need for multiple years of data is emphasised, to see if this spatial trend is consistent.
5.2 Environmental impacts
Swept Area Ratios (SAR) are an important tool for benthic impact assessments (Gerritsen et al., 2013; Hiddink et al., 2017; OSPAR, 2023), as they convert fishing activity data into a metric that is representative of the pressure on the seabed, that considers gear width, vessel speed and time (JNCC, 2016a). The SAR of the HypHPMA was 1.96; this means on average the area of HypHPMA was trawled 1.96 times a year. This is supported by the ICES data outputs on mobile bottom fishing disturbance (ICES, 2021); based on the interactive ICES pressure map a large proportion of the area within the D&S IFCA had an average SAR of between 1-5. Although, this only included >12m vessels so is likely to be underestimated. Furthermore, the SAR for<12m was higher than ≥12m length vessels within the HypHPMA, emphasizing the amount of fishing activity in inshore areas by smaller vessels, currently overlooked by VMS data.
Although the total time spent fishing by dredges within the HypHPMA was significantly higher than bottom otter trawling, the average SAR of bottom otter trawling was higher. This is because the gear width for OTB is much higher than DRB (Supplementary Table S1). This is also evident in the JNCC report on Pressure Mapping Methodology (JNCC, 2016a); where the average width of OTB was five times that of DRB (for ≥ 15m vessels), leading to a larger SAR for that gear type. However, this is only for surface abrasion, for subsurface abrasion (deeper than 2cm), the gear width used in the JNCC report was 12m for DRB and 2m for OTB, due to the fact only the trawl doors of OTB gear types penetrate >2cm into the seabed. Subsurface abrasion or penetration is important for assessing the sensitivity of different benthic habitats, especially those with burrowing infauna (Collie et al., 1997; JNCC, 2016a). Our findings indicate that the subsurface abrasion SAR for dredges within the HypHPMA (0.684) was far higher than OTB (0.0181). In addition, penetration depth should also be considered, this is important for calculating Swept Volume Ratio (SVR), which can be used to assess blue carbon disturbance (Epstein and Roberts, 2022); for example DRBs are estimated to penetrate 5.47cm into the seabed whilst OTBs penetrate 2.44cm (Hiddink et al., 2017). For this assessment SVR would be particularly useful, as 94.01% of the HypHPMA was blue carbon habitat, however penetration depths for smaller vessels are under researched, highlighting an area of further research.
Based on the NESSST, a high proportion of the HypHPMA was highly sensitive to penetration from demersal trawling or dredging, with 99.6% of fishing activity over a highly sensitive area in the HypHPMA, whilst 100% of the HypHPMA had a medium sensitivity to abrasion. As the 27 vessels using the HypHPMA are dredgers or demersal trawlers this poses a risk to the area. However, it is worth noting that a large proportion of the surrounding area also has a high or medium sensitivity to these pressures, thus a proportion of displaced effort is likely to be displaced into highly sensitive areas. This is also relevant for blue carbon habitat due to the high proportion of subtidal mud in the 100km2 and 400km2 surrounding areas. However, this displacement is likely to allow recovery within the HypHPMA itself, which could allow fishers to benefit from a potential spillover effect; that protected areas support larger densities of individuals and there will eventually be a net movement from these areas to outside of the boundaries (Buxton et al., 2014; Rowley, 1994). Furthermore, the predicted increase in fishing activity is below 15hrs a year for all c-squares based on the equal distribution model, which is a minimal increase compared to the amount of fishing activity already present. SSRs should also be considered, as they account for both habitat sensitivity and SAR; surface abrasion SSR was highest to the northeast, outside of the HypHPMA, whilst subsurface abrasion SSR was highest to the east within the 100km2 surrounding area.
5.3 Predicting displacement
For both the fishing the line and the habitat similarity models 100% of displaced fishing effort was displaced to the 100km2 area, whereas in the equal distribution model 15.67% was. Although fishing the line can be common for displaced effort (ABPmer, 2017; Benyon et al., 2020; Kellner et al., 2007) it is unlikely that all displaced effort will be shifted to that area (Murawski et al., 2005). Thus, the equal distribution model is recommended for a quick assessment, with perhaps a certain percentage distributed for fishing the line. One study by Murawski et al. (2005) found that about 10% of effort targeting groundfish was deployed within 1km of MPA boundaries and 25% to the nearest 5km, so perhaps 10% of effort could be re-distributed as fishing the line in predictions. In addition, the displacement assessment does not consider potential removal of effort from the system, due to competition with vessels in the surrounding area, or gear switching to reduce competition with those of the same gear type (ABPmer, 2017; Vaughan, 2017), thus the increase in effort in surrounding areas may be reduced. For a more detailed prediction of fishing displacement, the DISPLACE model may be more beneficial (Bastardie et al., 2015, Bastardie et al., 2014), this platform runs Monte-Carlo simulations that project scenarios of different spatial management scenarios including area closures. However, this platform requires a large amount of computing power and is currently based on larger vessels.
5.4 Evaluating the displacement assessment
Smaller vessels are often overlooked, with benthic disturbance studies often concentrating on ≥12m or ≥15m vessels (ICES, 2021; JNCC, 2016a). This underrepresentation of smaller vessels is probably due to the fact VMS is not currently a requirement for<12m vessels (MMO, 2019; Vaughan, 2017). This is a problem for management of the English fleet, especially in inshore waters; in 2021, 81.8% of the English fleet were<10m in length (MMO, 2021). This study has provided guidance on bridging this gap, looking at both<12m and ≥12m vessels, as well as highlighting the importance of inshore areas to smaller vessels. As of December 2023, 80% of the<12m English fleet had purchased an I-VMS device, with an I-VMS legislation that has recently come into force as of May 12th 2025 (MMO, 2025). Thus, the underrepresentation of smaller inshore vessels is likely to be mitigated by this act (ABPmer, 2017), this includes the potting and netting vessels that were underrepresented in this study. Local knowledge of D&S IFCA authors indicates that potting and netting may be prevalent in the north-west of the area, where trawling and dredging is less common. However, with the lack of I-VMS data for smaller vessels and no standardised method for identifying when a >12m potting and netting vessel is fishing, it is difficult to assess these activities. With I-VMS legislation now in force (as of 12th May 2025), it is essential that these vessels are represented in future studies using a standardised method.
The fact that only one year of data was used within this study, at one site was also a limitation. I-VMS data was previously only available for a small number of sites in English waters, with COVID disrupting fishing activity for a few years after 2019. Thus, these years were not included, as they were unlikely to be representative of fishing activity in the HypHPMA and surrounding areas. Once a long-term dataset of IVMS data is available across English waters, it would be beneficial to analyse multiple sites for HypHPMAs, considering the variability in fishing activity across years. Looking at a designated HPMA would also be valuable to inform the displacement assessment, when predicting fisher behaviour. Assessing the proportion of effort relocated or removed from the system and assessing behaviours such as fishing the line would be vital to consider. Thus, this area of research is recommended as a future case study.
Another potential drawback of this method is the limited effectiveness in areas where geolocation data is limited. A large number of countries now use satellite-based monitoring for tracking fishing vessels (Dunn et al., 2018; Orofino et al., 2023). However, there are still areas where satellite coverage is poor and the use of VMS and AIS among small vessels or small-scale fisheries is quite limited (Orofino et al., 2023). Lightweight and more cost-efficient alternatives have been developed for monitoring smaller vessels, including multiple GPS tracking devices. These devices can be solar or battery powered, using cellular networks or a mixture of cellular networks and satellites to transmit data (Fujita et al., 2018; Orofino et al., 2023). As these tracking devices can transmit similar information as VMS, such as speed, heading, latitude and longitude, they could be used as potential alternatives within the analysis.
The swept sensitivity ratios used in this study were a novel approach that considered both habitat sensitivity and swept area, allowing areas of high sensitivity which are trawled frequently to be highlighted for the displacement assessment. These heatmaps could be very effective when predicting displacement impacts, however they should always be presented alongside their confidence levels. As a large proportion of the confidence for the HypHPMA and surrounding areas were low, especially the MESH confidence and confidence in biotope simulation, highlighting that further surveys and consultations may be required when assessing the sensitivity of a HPMA. In addition, the gear widths for smaller vessels were also novel, as few studies consider<12m vessels when assessing SAR. These were based on expert opinion for average vessels within the area of interest, however further research into surface and subsurface abrasion is highly recommended, as gear widths can be location specific.
Deciding on suitable c-square size was one challenge of this study, many other studies use 0.05° by 0.05° grid cells (ICES, 2021; JNCC, 2016a), however due to the size of the HypHPMA smaller grid cells were required to observe fishing activity within it. One argument is that the grid cell should not be less than the maximum distance a vessel can travel between two pings whilst fishing (Fock, 2008), as I-VMS pings are every 3 mins the vessel is highly unlikely to go undetected within a grid squareOne caveat to this study is that it is only based on one year’s worth of data, so it is difficult to assess how variable seasonal and spatial trends are for different years. This study recommends multiple years of data for HPMA assessments and other spatial closures, although as I-VMS data will only be available from 2025 at the earliest this may be more challenging for<12m vessels. In addition to this assessment this study recommends consultation with local fishers and fishing authorities, to help account for seasonality in fishing activity, gauge how important the area is as a fishing ground and explore whether gear switching or using alternative fishing grounds will minimize impacts of displacement.
Although fishers’ behaviour (fishing the line) was somewhat considered with respect to the spillover effect, the socio-economic and environmental benefits of spillover were not fully assessed due to lack of dispersal and biomass data. The spillover effect is the net movement fish from protected areas (as they support larger population densities) to areas outside of the boundaries (Buxton et al., 2014; Rowley, 1994). This movement can increase fish populations in areas surrounding the protected area and catch rates in adjacent fisheries. For example, a study by Lynham and Villaseñor-Derbez (2024) on marine protected areas found a 12-18% percent increase in catch-per-unit-of-fishing-effort in the waters near protected area boundaries, for tuna purse seine fisheries. Therefore, if a similar increase was seen for the HypHPMA, this could reduce the effects of landings loss due to area closure. Spillover has the potential to result in positive net-benefits for fishers over time; due to increased recruitment of eggs and larvae, alongside spillover of adults into adjacent fishing grounds (Goñi et al., 2010; Medoff et al., 2022). Goñi et al. (2010) demonstrated a mean annual net benefit of 10% of the catch in weight for lobster (Palinurus elephas) from the Columbretes Islands Marine Reserve, the mean size of the lobsters emigrating from the reserve was larger than those outside. Estimating the potential benefits of spillover would be a useful addition to the displacement assessment but is challenging due to the variability of the effect depending on protected area size, duration of protection, initial fish biomass, connectivity to surrounding areas and the fishing intensity on the border of the area (Da Silva et al., 2015). This analysis is not currently suited to predict or evaluate the potential benefits of spillover, but it should still be considered when instating management measures or designations.
In addition, other costs with respect to changes in fishers’ behaviour are not fully considered within the analysis, one of these is changes in fuel costs and journey time due to area closure. Fishers may spend more time and fuel travelling to alternative fishing grounds, further increasing the socio-economic impact of fishing displacement (Bastardie et al., 2014; Vaughan, 2017). Thus, calculating current fuel consumption for each fishing trip and predicted fuel consumption after displacement, would be important to consider in future analyses. The DISPLACE model takes into account The fuel consumption rate (FCR in litres per hour), based on vessel engine power (kW) and operational conditions (Bastardie et al., 2014), which may be useful to consider in future analyses. However, predicting this after displacement would be more challenging, as the route taken from port to alternative fishing grounds and time spent travelling would need to be estimated.
6 Conclusion
This study provides a standardized approach for a displacement assessment in an area under consideration for closure to fishing, such as a HypHPMA, providing key information on landings weights and values, SAR, SSR and fishing activity over different habitat types. Socio-economically the HypHPMA is an important fishing ground for multiple vessels, with three vessels earning over 10% of their income in the area. However, from an environmental perspective a large proportion of the HypHPMA is highly sensitive and consists of blue carbon habitat. This assessment is applicable to different sites and other areas of closure such as offshore wind and is representative of different gear types and vessel lengths. This will be particularly relevant to smaller inshore vessels with the I-VMS legislation recently introduced, as they are often underrepresented in studies on fishing activity. For future assessments we recommend an interactive interface that shows fishing effort, catch weight and value, as well as linking to other spatial habitat maps, for both I-VMS and VMS data. This will be particularly beneficial for highlighting the risks of displacement and informing future policy, as it will be easier for regulators to assess how economically important an area is for fishers when considering an area of closure. In addition, the calculation of swept volume ratio (SVR) would also be useful for any future displacement studies considering blue carbon, highlighting the research required for penetration depth of smaller fishing vessels.
Statements
Data availability statement
The original contributions presented in the study are included in the article/Supplementary Material. Further inquiries can be directed to the corresponding author/s.
Author contributions
LR: Formal Analysis, Visualization, Data curation, Methodology, Writing – review & editing, Software, Writing – original draft. MH: Conceptualization, Investigation, Writing – review & editing, Supervision, Project administration, Validation, Funding acquisition, Writing – original draft, Methodology, Data curation, Resources. JS: Writing – review & editing, Investigation, Software, Writing – original draft, Formal Analysis. SC: Formal Analysis, Supervision, Writing – review & editing, Investigation, Writing – original draft. LP: Formal Analysis, Writing – original draft, Investigation, Writing – review & editing. DV: Funding acquisition, Conceptualization, Investigation, Writing – original draft, Resources, Writing – review & editing, Project administration, Validation, Supervision, Methodology.
Funding
The author(s) declare that financial support was received for the research and/or publication of this article. The Department of Environment, Food and Rural Affairs provided D&S IFCA with a grant to support the VMS/I-VMS analysis underpinning this manuscript. The authors are grateful to the UKRI, and the NERC ACCE DTP internship programme that helped make this work possible.
Acknowledgments
The authors would like to thank David Warwick from Seafish for his assistance on assigning gear widths depending on vessel size and métier, your knowledge was very insightful. Thank you to Libby West from Natural England for her guidance on fishing effort within the D&S IFCA district.
Conflict of interest
The authors declare that the research was conducted in the absence of any commercial or financial relationships that could be construed as a potential conflict of interest.
Generative AI statement
The author(s) declare that no Generative AI was used in the creation of this manuscript.
Publisher’s note
All claims expressed in this article are solely those of the authors and do not necessarily represent those of their affiliated organizations, or those of the publisher, the editors and the reviewers. Any product that may be evaluated in this article, or claim that may be made by its manufacturer, is not guaranteed or endorsed by the publisher.
Supplementary material
The Supplementary Material for this article can be found online at: https://www.frontiersin.org/articles/10.3389/fmars.2025.1601392/full#supplementary-material
References
1
ABPmer (2017). Displacement of Fishing Effort from Marine Protected Areas. Available online at: https://publications.naturalengland.org.uk/publication/5674265573064704 (Accessed March 15, 2024).
2
Bastardie F. Nielsen J. R. Eigaard O. R. Fock H. Jonsson P. Bartolino V. (2015). Competition for marine space: modelling the Baltic Sea fisheries and effort displacement under spatial restrictions. ICES J. Mar. Sci.72, 824–840. doi: 10.1093/icesjms/fsu215
3
Bastardie F. Nielsen J. R. Miethe T. (2014). DISPLACE: a dynamic, individual-based model for spatial fishing planning and effort displacement—integrating underlying fish population models. Can. J. Fish. Aquat. Sci.71, 366–386. doi: 10.1139/cjfas-2013-0126
4
Bell J. D. Watson R. A. Ye Y. (2017). Global fishing capacity and fishing effort from 1950 to 2012. Fish Fish.18, 489–505. doi: 10.1111/faf.12187
5
Benyon R. Barham P. Edwards J. Kaiser M. Owens S. de Rozarieux N. et al . (2020). Benyon review into highly protected Marine Areas: final report. Available online at: https://www.gov.uk/government/publications/highly-protected-marine-areas-hpmas-review-2019 (Accessed March 10, 2024).
6
Buxton C. D. Hartmann K. Kearney R. Gardner C. (2014). When is spillover from marine reserves likely to benefit fisheries? PLoS One9, e107032. doi: 10.1371/journal.pone.0107032
7
Cabral R. B. Gaines S. D. Johnson B. A. Bell T. W. White C. (2017). Drivers of redistribution of fishing and non-fishing effort after the implementation of a marine protected area network. Ecol. Appl.27, 416–428. doi: 10.1002/eap.1446
8
Campbell M. S. Stehfest K. M. Votier S. C. Hall-Spencer J. M. (2014). Mapping fisheries for marine spatial planning: Gear-specific vessel monitoring system (VMS), marine conservation and offshore renewable energy. Mar. Policy.45, 293–300. doi: 10.1016/j.marpol.2013.09.015
9
Collie J. S. Escanero G. A. Valentine P. C. (1997). Effects of bottom fishing on the benthic megafauna of Georges Bank. Mar. Ecol. Prog. Ser.155, 159–172. doi: 10.3354/meps155159
10
D&S-IFCA (2013). Devon and Severn Inshore Fisheries Conservation Authority Mobile Fishing Permit Byelaw Marine and Coastal Access Act 2009 (Brixham, Devon: Mobile Fishing Permit Byelaw). Available online at: https://www.devonandsevernifca.gov.uk/wp-content/uploads/2023/08/Mobilefishingpermitbyelaw.pdf.
11
D&S-IFCA (2024). Devon and Severn IFCA Mobile Fishing Permit Byelaw. Available online at: https://www.devonandsevernifca.gov.uk/wp-content/uploads/2024/04/Mobile-Fishing-Cat-1-Permit-Conditions-10th-April-2024.pdf (Accessed May 16, 2024).
12
Da Silva I. M. Hill N. Shimadzu H. Soares A. M. Dornelas M. (2015). Spillover effects of a community-managed marine reserve. PLoS One10, e0111774. doi: 10.1371/journal.pone.0111774
13
Defra (2010). The Marine Strategy Regulations 2010. Available online at: https://www.legislation.gov.uk/uksi/2010/1627/contents/made (Accessed April 20, 2024).
14
Defra (2021). Government response to the Highly Protected Marine Areas (HPMAs) review. Available online at: https://www.gov.uk/government/publications/government-response-to-the-highly-protected-marine-areas-hpmas-review/government-response-to-the-highly-protected-marine-areas-hpmas-review (Accessed March 10, 2024).
15
Defra (2023a). Environmental Improvement Plan 2023. Available online at: https://www.gov.uk/government/publications/environmental-improvement-plan (Accessed April 16, 2024).
16
Defra (2023b). Highly Protected Marine Areas (HPMAs). Available online at: https://www.gov.uk/government/publications/highly-protected-marine-areas/highly-protected-marine-areas-hpmas (Accessed March 10, 2024).
17
Defra (2025). Marine Protected Areas Network Report 2019–2024. Available online at: https://assets.publishing.service.gov.uk/media/67601b1fb745d5f7a053ef97/Marine_Protected_Areas:MPA:Network_Report_2019-2024_Web_Accessible:002_.pdf (Accessed May 16, 2025).
18
De Groot J. Campbell M. Ashley M. Rodwell L. (2014). Investigating the co-existence of fisheries and offshore renewable energy in the UK: Identification of a mitigation agenda for fishing effort displacement. Ocean Coast. Manage.102, 7–18. doi: 10.1016/j.ocecoaman.2014.08.013
19
Dignan S. Bloor I. Murray L. Kaiser M. (2014). “Predicted impacts of proposed management measures in the Isle of Man queen scallop (Aequipecten opercularis) fishery to be introduced in the 2015 fishing season,” in Fisheries & Conservation Report (Bangor University, Bangor).
20
Di Lorenzo M. Claudet J. Guidetti P. (2016). Spillover from marine protected areas to adjacent 421 fisheries has an ecological and a fishery component. J. Nat. Conserv.32, 422. doi: 10.1016/j.jnc.2016.04.004
21
Di Lorenzo M. Guidetti P. Di Franco A. Calò A. Claudet J. (2020). Assessing spillover from marine protected areas and its drivers: A meta-analytical approach. Fish. Fish.21. doi: 10.3389/fpsyg.2018.02347
22
Dolge K. Blumberga D. (2021). Composite risk index for designing smart climate and energy policies. Environ. Sustain.12, 100159. doi: 10.1016/j.indic.2021.100159
23
Dunn D. C. Jablonicky C. Crespo G. O. McCauley D. J. Kroodsma D. A. Boerder K. et al . (2018). Empowering high seas governance with satellite vessel tracking data. Fish Fish19, 729–739. doi: 10.1111/faf.12285
24
Eigaard O. R. Bastardie F. Breen M. Dinesen G. E. Hintzen N. T. Laffargue P. et al . (2016). Estimating seabed pressure from demersal trawls, seines, and dredges based on gear design and dimensions. ICES J. Mar. Sci.73, 24–43. doi: 10.1093/icesjms/fsv099
25
Eigaard O. R. Bastardie F. Hintzen N. T. Buhl-Mortensen L. Buhl-Mortensen P. Catarino R. et al . (2017). The footprint of bottom trawling in European waters: distribution, intensity, and seabed integrity. ICES J. Mar. Sci.74, 847–865. doi: 10.1093/icesjms/fsw194
26
EMODnet (2021). Seabed Habitats. Available online at: https://emodnet.ec.europa.eu/en/seabed-habitats (Accessed April 17, 2024).
27
Enever R. Lewin S. Reese A. Hooper T. (2017). Mapping fishing effort: Combining fishermen’s knowledge with satellite monitoring data in English waters. Fish. Res.189, 67–76. doi: 10.1016/j.fishres.2017.01.009
28
Epstein G. Roberts C. M. (2022). Identifying priority areas to manage mobile bottom fishing on seabed carbon in the UK. PLoS Clim.1, e0000059. doi: 10.1371/journal.pclm.0000059
29
Fock H. O. (2008). Fisheries in the context of marine spatial planning: defining principal areas for fisheries in the German EEZ. Mar. Policy.32, 728–739. doi: 10.1016/j.marpol.2007.12.010
30
Forcada A. Valle C. Sánchez-Lizaso J. L. Bayle-Sempere J. T. Corsi F. (2010). Structure and spatio-temporal dynamics of artisanal fisheries around a Mediterranean marine protected area. ICES J. Mar. Sci.67, 191–203. doi: 10.1093/icesjms/fsp234
31
Fujita R. Cusack C. Karasik R. Takade-Heumacher H. Baker C. (2018). Technologies for improving fisheries monitoring (San Francisco: Environmental Defense Fund), 71.
32
GEBCO (2024). GEBCO Gridded Bathymetry Data Download. Available online at: https://download.gebco.net/ (Accessed May 19, 2024).
33
Gerritsen H. D. Minto C. Lordan C. (2013). How much of the seabed is impacted by mobile fishing gear? Absolute estimates from Vessel Monitoring System (VMS) point data. ICES J. Mar. Sci.70, 523–531. doi: 10.1093/icesjms/fst017
34
Goñi R. Hilborn R. Díaz D. Mallol S. Adlerstein S. (2010). Net contribution of spillover from a marine reserve to fishery catches. Mar. Ecol. Prog. Ser.400, 233–243. doi: 10.3354/meps08419
35
Guenther C. López-Carr D. Lenihan H. S. (2015). Differences in lobster fishing effort before and after MPA establishment. Appl. Geogr.59, 78–87. doi: 10.1016/j.apgeog.2014.12.016
36
Guiet J. Galbraith E. Kroodsma D. Worm B. (2019). Seasonal variability in global industrial fishing effort. PLoS One14, e0216819. doi: 10.1371/journal.pone.0216819
37
Hiddink J. G. Jennings S. Sciberras M. Szostek C. L. Hughes K. M. Ellis N. et al . (2017). Global analysis of depletion and recovery of seabed biota after bottom trawling disturbance. Proc. Natl. Acad. Sci.114, 8301–8306. doi: 10.1073/pnas.1618858114
38
Hintzen N. (2023). Socio-economic analysis of area closures. Available online at: https://github.com/nielshintzen/vmstools/wiki/Practicals6 (Accessed March 12, 2024).
39
Hintzen N. T. Bastardie F. Beare D. Piet G. J. Ulrich C. Deporte N. et al . (2012). VMStools: open-source software for the processing, analysis and visualisation of fisheries logbook and VMS data. Fish. Res.115, 31–43. doi: 10.1016/j.fishres.2011.11.007
40
Horta e Costa B. Batista M. I. Gonçalves L. Erzini K. Caselle J. E. Cabral H. N. et al . (2013). Fishers’ behaviour in response to the implementation of a marine protected area. PLoS One8, e65057. doi: 10.1371/journal.pone.0065057
41
Hull A. D. (2013). Managing competition for marine space using the tools of planning in the UK. Plan. Pract. Res.28, 503–526. doi: 10.1080/02697459.2013.812375
42
ICES (2021). EU request on how management scenarios to reduce mobile bottom fishing disturbance on seafloor habitats affect fisheries landing and value (Copenhagen V Denmark: ICES Advice). doi: 10.17895/ices.advice.8191
43
JNCC (2016a). “JNCC pressure mapping methodology,” in Physical Damage (Reversible Change) - Penetration and/or disturbance of the substrate below the surface of the seabed, including abrasion (Peterborough, UK: Joint Nature Conservation Committee). Available online at: https://data.jncc.gov.uk/data/5874e65d-324b-4f6b-bce2-bfc7aab5ba7f/JNCC-Report-515-FINAL-WEB.pdf.
44
JNCC (2016b). A three-step confidence assessment framework for classified seabed maps. Available online at: https://data.jncc.gov.uk/data/56e7a140-04c1-4159-bc6b-d28946ebc196/JNCC-Report-591-FINAL-WEB.pdf (Accessed June 21, 2024).
45
JNCC (2021). Identifying pilot Highly Protected Marine Areas in English waters: Ecological principles and criteria guidance note. Available online at: https://data.jncc.gov.uk/data/47bafb41-05d8-4929-b236-162f4eddd22f/pilot-hpma-ecological-guidance-note-v2.pdf (Accessed March 18, 2024).
46
JNCC (2023). UK Marine Protected Area network statistics. Available online at: https://jncc.gov.uk/our-work/uk-marine-protected-area-network-statistics/ (Accessed March 18, 2024).
47
Katara I. Peden W. J. Bannister H. Ribeiro J. Fronkova L. Scougal C. et al . (2021). Conservation hotspots for fish habitats: A case study from English and Welsh waters. Reg. Stud. Mar. Sci.44, 101745. doi: 10.1016/j.rsma.2021.101745
48
Kellner J. B. Tetreault I. Gaines S. D. Nisbet R. M. (2007). Fishing the line near marine reserves in single and multispecies fisheries. Ecol. Appl.17, 1039–1054. doi: 10.1890/05-1845
49
Langton R. Stirling D. A. Boulcott P. Wright P. J. (2020). Are MPAs effective in removing fishing pressure from benthic species and habitats? Biol. Conserv.247, 108511. doi: 10.1016/j.biocon.2020.108511
50
Lynham J. Villaseñor-Derbez J. C. (2024). Evidence of spillover benefits from large-scale marine protected areas to purse seine fisheries. Science386, 1276–1281. doi: 10.1126/science.adn1146
51
MacNab S. Nimmo F. (2022). Awel y Môr Offshore Wind Farm Commercial Fisheries Baseline Report. Available online at: https://infrastructure.planninginspectorate.gov.uk/wp-content/ipc/uploads/projects/EN010112/EN010112-000249-6.4.8.1_AyM_ES_Volume4_Annex8.1_CommercialFisheriesBaseline_Final.pdf (Accessed March 16, 2024).
52
Mangi S. C. Kupschus S. Mackinson S. Rodmell D. Lee A. Bourke E. et al . (2018). Progress in designing and delivering effective fishing industry–science data collection in the UK. Fish Fish19, 622–642. doi: 10.1111/faf.12279
53
MARLIN (2022). EUNIS Habitat classification list. Available online at: https://www.marlin.ac.uk/habitats/eunis (Accessed April 17, 2024).
54
MARLIN (2024). Marine evidence and sensitivity assessment. Available online at: https://www.marlin.ac.uk/evidence (Accessed April 17, 2024).
55
McLeod M. (2014). Scottish MPA Project Assessing the potential levels and effect of fisheries displacement as a consequence of possible management measures for future inshore Marine Protected Areas. Available online at: https://www.scotlink.org/wp-content/uploads/2024/10/LINK-Consultation-Response_Fisheries-Management-Measures-within-Scottish-Offshore-MPAs-.pdf (Accessed June 27, 2024).
56
Medoff S. Lynham J. Raynor J. (2022). Spillover benefits from the world’s largest fully protected MPA. Science378, 313–316. doi: 10.1126/science.abn0098
57
MMO (2019). Vessel Monitoring System (VMS+) Guidance. Available online at: https://assets.publishing.service.gov.uk/media/5fec8075d3bf7f08a2024564/Vessel_Monitoring_System:VMS+:Guidance.pdf (Accessed May 4, 2024).
58
MMO (2021). UK Sea Fisheries Statistics 2021. Available online at: https://assets.publishing.service.gov.uk/media/63343a0d8fa8f50689de7cdc/UK_Sea_Fisheries_Statistics_2021.pdf (Accessed April 12, 2024).
59
MMO (2023). Marine Protected Areas (MPAs). Available online at: https://www.gov.uk/guidance/marine-protected-areas-mpas:~:text=MPAs%20are%20areas%20of%20the,damage%20caused%20by%20human%20activities (Accessed May 14, 2025).
60
MMO (2025).Inshore Vessel Monitoring (I-VMS) for under-12 metre fishing vessels registered in England. In: Inshore Vessel Monitoring (I-VMS) for under-12 metre fishing vessels registered in England (GOV.UK). Available online at: https://www.gov.uk/guidance/inshore-vessel-monitoring-i-vms-for-under-12m-fishing-vessels-registered-in-england (Accessed July 24, 2025).
61
Murawski S. A. Wigley S. E. Fogarty M. J. Rago P. J. Mountain D. G. (2005). Effort distribution and catch patterns adjacent to temperate MPAs. ICES J. Mar. Sci.62, 1150–1167. doi: 10.1016/j.icesjms.2005.04.005
62
NE (2024). Marine Habitats and Species Open Data (England). Available online at: https://www.data.gov.uk/dataset/bfc23a6d-8879-4072-95ed-125b091f908a/marine-habitats-and-species-open-data-england (Accessed December 12, 2024).
63
NFFO (2022). Spatial Squeeze in Fisheries. Available online at: https://www.nffo.org.uk/wp-content/uploads/2022/06/R3900_SpatialSqueeze_Final_23Jun2022-part-1.pdf (Accessed April 9, 2024).
64
Nillos Kleiven P. J. Espeland S. H. Olsen E. M. Abesamis R. A. Moland E. Kleiven A. R. (2019). Fishing pressure impacts the abundance gradient of European lobsters across the borders of a newly established marine protected area. Proc. R. Soc B.286, 20182455. doi: 10.1098/rspb.2018.2455
65
Orofino S. McDonald G. Mayorga J. Costello C. Bradley D. (2023). Opportunities and challenges for improving fisheries management through greater transparency in vessel tracking. ICES J. Mar. Sci.80, 675–689. doi: 10.1093/icesjms/fsad008
66
OSPAR (2023). Extent of Physical Disturbance to Benthic Habitats: Fisheries. Available online at: https://oap.ospar.org/en/ospar-assessments/quality-status-reports/qsr-2023/indicator-assessments/phys-dist-habs-fisheries/ (Accessed May 16, 2024).
67
Pebesma E. J. (2018). Simple features for R: standardized support for spatial vector data. R J.10, 439. doi: 10.32614/RJ-2018-009
68
Püts M. Kempf A. Möllmann C. Taylor M. (2023). Trade-offs between fisheries, offshore wind farms and marine protected areas in the southern north Sea–winners, losers and effective spatial management. Mar. Policy.152, 105574. doi: 10.1016/j.marpol.2023.105574
69
Respondek G. Gröger J. Floeter J. Temming A. (2014). Variability of fishing effort for the German brown shrimp (Crangon crangon) fishing fleet: influencing factors, and seasonal and spatial patterns. ICES J. Mar. Sci.71, 1805–1817. doi: 10.1093/icesjms/fsu016
70
Rijnsdorp A. D. Bolam S. G. Garcia C. Hiddink J. G. Hintzen N. T. Van Denderen P. D. et al . (2018). Estimating sensitivity of seabed habitats to disturbance by bottom trawling based on the longevity of benthic fauna. Ecol. Appl.28, 1302–1312. doi: 10.1002/eap.1731
71
Rowley R. J. (1994). Marine reserves in fisheries management. Aquat. Conserv. Mar. Freshw. Ecosyst.4, 233–254. doi: 10.1002/aqc.3270040305
72
Schratzberger M. Neville S. Painting S. Weston K. Paltriguera L. (2019). Ecological and socio-economic effects of highly protected marine areas (HPMAs) in temperate waters. Front. Mar. Sci.6. doi: 10.3389/fmars.2019.00749
73
Shepperson J. L. Hintzen N. T. Szostek C. L. Bell E. Murray L. G. Kaiser M. J. (2018). A comparison of VMS and AIS data: the effect of data coverage and vessel position recording frequency on estimates of fishing footprints. ICES J. Mar. Sci.75, 988–998. doi: 10.1093/icesjms/fsx230
74
Solandt J.-L. Mullier T. Elliott S. Sheehan E. (2020). “Managing marine protected areas in Europe: Moving from ‘feature-based’to ‘whole-site’management of sites,” in Marine protected areas (Amsterdam, Netherlands: Elsevier), 157–181. doi: 10.1016/B978-0-08-102698-4.00009-5
75
Song M.-K. Lin F.-C. Ward S. E. Fine J. P. (2013). Composite variables: when and how. Nurs. Res.62, 45–49. doi: 10.1097/NNR.0b013e3182741948
76
Stevenson T. C. Tissot B. N. Walsh W. J. (2013). Socioeconomic consequences of fishing displacement from marine protected areas in Hawaii. Biol. Conserv.160, 50–58. doi: 10.1016/j.biocon.2012.11.031
77
Swale G. Marsh M. Elias J. Burton S. Todd D. Walker P. et al . (2022). Blue carbon – mapping risks and opportunities. Available online at: https://randd.defra.gov.uk/ProjectDetails?ProjectID=20827 (Accessed July 17, 2024).
78
Tyler-Walters H. Tillin H. M. D’Avack E. A. S. Perry F. Stamp T. (2023). Marine Evidencebased Sensitivity Assessment (MarESA) – Guidance Manual. Available online at: https://www.marlin.ac.uk/assets/pdf/MarLIN-MarESA-Manual-Jun2023.pdf (Accessed May 23, 2024).
79
Tyler-Walters H. Tillin H. Perry F. Stamp T. D’Avack E. (2018). Marine evidence-based sensitivity assessment (MarESA): A guide. Available online at: https://plymsea.ac.uk/id/eprint/7942/ (Accessed May 23, 2024).
80
Van Der Lee A. Gillis D. Comeau P. Hurley P. (2013). Fishing the line: catch and effort distribution around the seasonal haddock (Melanogrammus aeglefinus) spawning closure on the Scotian Shelf. Can. J. Fish. Aquat. Sci.70, 973–981. doi: 10.1139/cjfas-2012-0341
81
Vaughan D. (2017). Fishing effort displacement and the consequences of implementing marine protected area management–an English perspective. Mar. Policy.84, 228–234. doi: 10.1016/j.marpol.2017.07.007
82
Vaughan D. Agardy T. (2020). Marine protected areas and marine spatial planning–allocation of resource use and environmental protection (Amsterdam, Netherlands: Elsevier). doi: 10.1016/B978-0-08-102698-4.00002-2
83
Wickham H. (2011). ggplot2. Wiley Interdiscip. Rev. Comput. Stat.3, 180–185. doi: 10.1002/wics.147
Summary
Keywords
fishing effort displacement, marine protected area, remote electronic monitoring, inshore vessel monitoring system, VMStools, benthic habitat sensitivity
Citation
Reeves LA, Hartley M, Stewart JE, Clark S, Parkhouse L and Vaughan D (2025) Predicting the environmental and socio-economic impacts of displaced fishing effort from a hypothetical highly protected marine area, located in English inshore waters. Front. Mar. Sci. 12:1601392. doi: 10.3389/fmars.2025.1601392
Received
27 March 2025
Accepted
15 July 2025
Published
04 August 2025
Volume
12 - 2025
Edited by
Lorenzo Mari, Polytechnic University of Milan, Italy
Reviewed by
John Joaquin Bohorquez, Ocean Foundation, United States
Thamiris Christina Karlovic, University of São Paulo, Brazil
Updates
Copyright
© 2025 Reeves, Hartley, Stewart, Clark, Parkhouse and Vaughan.
This is an open-access article distributed under the terms of the Creative Commons Attribution License (CC BY). The use, distribution or reproduction in other forums is permitted, provided the original author(s) and the copyright owner(s) are credited and that the original publication in this journal is cited, in accordance with accepted academic practice. No use, distribution or reproduction is permitted which does not comply with these terms.
*Correspondence: Melanie Hartley, melanie.hartley@naturalengland.org.uk; Duncan Vaughan, duncan.vaughan@naturalengland.org.uk
†ORCID: Laura A. Reeves, orcid.org/0000-0001-5353-3044; James E. Stewart, orcid.org/0000-0003-4250-0073; Duncan Vaughan, orcid.org/0000-0002-6585-108X
Disclaimer
All claims expressed in this article are solely those of the authors and do not necessarily represent those of their affiliated organizations, or those of the publisher, the editors and the reviewers. Any product that may be evaluated in this article or claim that may be made by its manufacturer is not guaranteed or endorsed by the publisher.