 Qianmei Li1,2,3
 Jin Xu
 Wenzhou Xiang
 Tao Li
- 1State Key Laboratory of Tropical Oceanography, Guangdong Key Laboratory of Marine Materia Medica, South China Sea Institute of Oceanology, Chinese Academy of Sciences, Guangzhou, China
- 2Agro-Tech Extension Center of Guangdong Province, Guangzhou, China
- 3Institute of Hydrobiology, Jinan University, Guangzhou, China
- 4CAS Key Laboratory of Renewable Energy, Guangdong Provincial Key Laboratory of New and Renewable Energy Research and Development, Guangzhou Institute of Energy Conversion, Chinese Academy of Sciences, Guangzhou, China
Exopolysaccharides (EPS) of Porphyridium purpureum have attracted much attention in biotechnology due to their unique physicochemical properties and bioactivities. Nitrogen is a critical environmental factor affecting microalgal metabolism, but its effect on the structural characteristics of EPS is not widely reported. This study aimed to investigate the effects of nitrogen concentrations on EPS production and the structural properties of P. purpureum by determining the yield, substituents proportions and molecular weight of EPS. The results showed that nitrogen concentrations of 9.0 mM and 18.0 mM optimized cell division, while photosynthetic efficiency decreased as nitrogen concentration decreased. Nitrogen concentration was positively correlated with total EPS yield, with the highest yield (663.5 mg L-1) observed at 54.0 mM. Furthermore, the proportions of carbohydrates, proteins and uronic acid in EPS increased with rising nitrogen concentrations. The monosaccharide composition (xylose, glucose and galactose) and the molecular weight of EPS (ranging from 6.6 to 8.3 × 10⁶ Da) were also influenced by nitrogen concentration. In conclusion, nitrogen concentration significantly influences the synthesis and biochemical characteristics of EPS in P. purpureum, offering new insights for structural modifications and biotechnological applications of EPS.
1 Introduction
Exopolysaccharides (EPS) are extracellular carbohydrate polymers synthesized and secreted into the surrounding environment by microalgae during their growth (Salimi and Farrokh, 2023). Microalgal EPS are heteropolysaccharides primarily composed of diverse monosaccharides interconnected through glycosidic bonds (Garza-Rodríguez et al., 2022). For example, the monosaccharide composition of EPS in Chlamydomonas primarily consisted of galactose, arabinose, glucose and xylose, while that in Dunaliella sp. RCC5 was mainly composed of galactose, rhamnose, xylose and mannose (Lewin, 1956; Gaignard et al., 2019b). Microalgal EPS also contain non-carbohydrate substituents like acetate, pyruvate and succinate (Delattre et al., 2016). Various microalgae species, particularly those from the Rhodophyta and Cyanobacteria, synthesize large amounts of EPS (Morais et al., 2022). EPS perform important functions for microalgae, such as acting as a protective barrier against biotic and abiotic stresses, and serving as a reservoir for carbon and energy during physiological stress (Morais et al., 2022). Additionally, EPS contribute to biofilm formation and facilitate cell adhesion and interaction (Xiao and Zheng, 2016). Furthermore, microalgal EPS possess various biological activities, including antiviral, antioxidant and antitumor properties and have attracted considerable attention in pharmaceuticals, food and cosmetics (Laroche, 2022).
Among marine microalgae, the red algal genus Porphyridium holds particular prominence in EPS research due to its high yield and excellent bioactivities. Porphyridium EPS are secreted into the culture medium but can also remain bound to the cell surface as mucilage (Gaignard et al., 2019a). The EPS surrounding Porphyridium cells play a dual protective function. They can not only maintain the homeostasis of the cellular microenvironment but also serve as a physicochemical barrier against environmental stressors (Xiao and Zheng, 2016). Although extensive research efforts have been devoted to investigating the EPS produced by Porphyridium, algal researchers have yet to establish a consensus regarding the structural characteristics of the EPS. Previous studies have shown substantial variations in the molecular characteristics of Porphyridium EPS. Geresh and Dawadi (2000) reported a molecular weight of Porphyridium EPS was 7.0 × 10⁶ Da, while Sun et al. (2009) found a significantly lower value of 2.9 × 10⁶ Da for Porphyridium cruentum (Geresh and Dawadi, 2000; Sun et al., 2009). The monosaccharide composition of Porphyridium marinum EPS consisted of xylose, glucose, galactose and fucose, with sulfate groups and uronic acid contents quantified at 8.3% and 17.3%, respectively (Soanen et al., 2016). In contrast, Gargouch et al. (2021) reported an expanded monosaccharide profile for Porphyridium marinum EPS, comprising arabinose in addition to xylose, glucose, galactose and fucose, alongside elevated sulfate (9.2%) and uronic acid (22.0%) concentrations (Gargouch et al., 2021). In addition, environmental stressors species-specifically modulate EPS functional groups. For instance, high salinity reduced the contents of polysaccharides, protein, uronic acid and sulfate groups in Porphyridium purpureum EPS (Ferreira et al., 2021). However, the content of uronic acid of Porphyridium cruentum EPS was decreased, while the contents of protein and sulfate groups were increased under high sulfate concentration (de Jesus Raposo et al., 2014). Beyond their essential physiological roles, such as protection against desiccation and UV radiation, structural variations in EPS may directly affect their biological properties, including antiviral, antioxidant, and antitumor activities. This highlights the importance of understanding how environmental factors, such as nitrogen availability, can modulate both the quantity and structure of EPS. The biosynthesis of EPS in Porphyridium may involve several key processes, including the activation of nucleotide sugar precursors, the assembly of repeating units catalyzed by glycosyltransferases and subsequent modifications of these units (Schmid et al., 2015). Environmental factors could modulate these pathways by altering the activity or expression of enzymes critical to EPS synthesis, thereby influencing the final composition and structure of EPS. Furthermore, these studies demonstrate that the structure of EPS exhibits dynamic changes contingent upon interspecific variations, divergent growth parameters and distinct cellular physiological states, thereby providing a mechanistic framework for elucidating the biosynthesis and secretion regulation of microalgal EPS.
Nitrogen supply significantly affects key cellular processes such as cell division, photosynthesis and central metabolic pathways, including tricarboxylic acid cycle flux and lipid biosynthesis, directly influencing EPS production and other secondary metabolites (Zarrinmehr et al., 2020). Strategic modulation of nitrogen availability serves as a critical regulatory lever for enhancing secondary metabolite biosynthesis in microalgae. For example, nitrogen limitation promotes lipid accumulation of oleaginous microalgae and enhances astaxanthin production in Haematococcus pluvialis (Yang et al., 2023; Wilawan et al., 2024). The nitrogen-mediated regulatory mechanisms governing EPS biosynthesis, a critical secondary metabolite, remain unclear. While nitrogen-limitation strategies effectively stimulate secondary metabolite biosynthesis in microalgae, these cultivation regimes impose concurrent physiological constraints. For instance, nitrogen limitation in Chlorella vulgaris JNU13 represses cell division while degrading photosynthetic apparatus integrity, manifesting as a 38% reduction in Fv/Fm (maximum quantum yield of photosystem II) compared to nitrogen-replete controls (Li et al., 2016). This will affect the yield of secondary metabolites. In addition, nitrogen supply not only influences the yield of EPS but also affects the molecular structure (e.g., branching frequency and glycosidic linkage patterns) and functional group distribution of EPS. Nitrogen starvation can increase the proportions of rhamnose and glucose in the EPS of Microcoleus vaginatus (Qian et al., 2023). Similarly, the molar percentage of xylose, rhamnose and arabinose in Nostoc flagelliforme EPS was reduced under nitrogen limitation (Han et al., 2017). Therefore, the analysis of structural changes in EPS under different nitrogen concentrations is crucial for elucidating the molecular regulation of their biosynthesis pathway.
This study aims to investigate how different nitrogen concentrations influence the yield and biochemical properties of EPS in P. purpureum, with the goal of optimizing cultivation strategies to improve both EPS productivity and structural characteristics. The findings establish an optimized nitrogen-regulation strategy for producing EPS with enhanced productivity and structure-defined characteristics in Porphyridium.
2 Materials and methods
2.1 Microorganisms and culture condition
Porphyridium purpureum SCS-02 was isolated from the South China Sea by the South China Sea Institute of Oceanology, Chinese Academy of Sciences (Guangzhou, China). Starter cultures were maintained in Φ 6 cm × 60 cm column photobioreactors containing 1000 mL modified ASW medium, which contained 462.0 mM NaCl, 26.8 mM MgSO4·7H2O, 27.5 mM MgCl2·7H2O, 10.2 mM CaCl2·2H2O, 17.6 mM NaNO3, 0.69 mM K2HPO4·3H2O, 0.48 mM NaHCO3, 11.7 μM EDTANa2·2H2O, 11.7 μM FeCl3·6H2O, 0.91 μM MnCl2·4H2O, 0.08 μM ZnSO4·7H2O, 0.02 μM Na2MoO4·2H2O, 0.04 μM Co(NO3)2·6H2O and 0.04 μM CuSO4·5H2O (Li et al., 2019). The cells in the logarithmic growth phase were harvested via centrifugation at 3500 rpm (1125 × g) for 5 min and subsequently re-inoculated into fresh modified ASW medium containing six nitrogen concentrations: 0 mM, 3.6 mM, 9.0 mM, 18.0 mM (the control group), 36.0 mM and 54.0 mM NaNO3. Initial optical density (OD750) was standardized to 0.50 ± 0.02 using a UV-Vis spectrophotometer (Shimadzu Scientific Instruments, Inc., Columbia, USA). The microalgae cultivation occurred under continuous illumination (300 μmol photons m-2 s-1) provided by T8 fluorescent lamps (Philips, Shanghai, China) with a 24:0 h light: dark cycle at 25.0 ± 1.0°C. Cultures were aerated with CO2-enriched compressed air (1% CO2, v/v). All experimental groups were exposed to identical light intensity, CO2 concentration and flow rate (1 L min-1), under dynamic culture conditions with continuous aeration. The experimental design included three biological replicates per treatment with triplicate analytical measurements. Cell density and EPS production were monitored at 3 day intervals from day 0 to 24. EPS were collected on day 24 for subsequent compositional analysis through sequential purification involving ethanol precipitation, dialysis and lyophilization.
2.2 Cell count measurements
The microalgae cells were counted every three days using a hematocytometer (Shanghai Qiujing Biochemical Reagent Instrument, Shanghai, China). The hemocytometer’s counting chamber features a 25 × 16 grid pattern: each large grid (1 × 1 mm2) is divided into 25 intermediate grids (0.2 × 0.2 mm2 each), and each intermediate grid is further subdivided into 16 small grids (0.05 × 0.05 mm2 each). A 500 μL aliquot of the culture suspension was collected and diluted 1: 15 (v/v) with fresh modified ASW medium. A 10 μL aliquot of the diluted suspension was loaded onto the hemocytometer chamber via capillary action. Algal cells in 80 small grids (5 intermediate grids: four corners and one central) were counted under a 40× microscope (Olympus CX21FS1, Olympus Optical Co. Ltd., Japan), and each biological replicate was counted three times. Using this information, the following cell count was calculated:
2.3 Photosynthetic efficiency
Photosynthetic fluorescence parameters were analyzed using PAM fluorometry (XE-PAM, Walz, Germany) (Li et al., 2016). Before conducting photosynthetic parameter measurements, it is necessary to turn on the power supply of the PAM instrument and allow it to warm up for a period of time, typically 30 minutes to 1 hour. This helps stabilize components such as the light source and detectors, reducing measurement errors caused by temperature fluctuations and other factors. Additionally, calibrations for the optical path and detectors, chlorophyll fluorescence parameters, and temperature in the PAM instrument are generally performed periodically. After calibration, standard reference samples be used for validation to ensure accurate and reliable measurements. Cell suspensions were adjusted to OD750 of 0.50 ± 0.02 using fresh ASW medium to ensure the instrument accuracy. Prior to measurements, the cultures were dark-adapted for 30 min. Then 3 mL culture was put into the fluorescence cuvette and illuminated under the measuring light (< 0.1 μmol photons m-2 s-1) for the measurement of minimum fluorescence (F0). Subsequently, the culture was subjected to saturation pulse light (4000 μmol photons m-2 s-1, 0.8 s) to determine the maximum fluorescence (Fm). Finally, the culture was exposed to actinic light (300 μmol photons m-2 s-1, 300 s) and saturation pulse light (4000 μmol photons m-2 s-1, 0.8 s) was switched on again to measure Fm′. Using this information, the following photosynthetic fluorescence parameters were calculated:
Photosynthetic oxygen evolution rate and dark respiration rate were measured using a Clark-type oxygen electrode (Hansatech Oxygraph, UK). Prior to measurements, algae cultures were adjusted to OD750 of 0.50 ± 0.02 to ensure the instrument accuracy. Then the cultures were subjected to a 30 min dark adaptation period. Photosynthetic oxygen evolution rate was subsequently measured under continuous actinic light (300 μmol photons m-2 s-1) for 10 min. Following illumination, the cultures were returned to dark conditions for an additional 10 min interval to measure dark respiration rate.
2.4 EPS concentration determination
EPS concentration in the culture medium was quantified via the phenol-sulfuric acid method with glucose as the calibration standard (DuBois et al., 1956). Aliquots (10 mL) of the cultured suspension were centrifuged at 8000 rpm (5878 × g) for 10 min to obtain cell-free supernatants. Briefly, 1.0 mL of supernatant was combined in sequence with 0.5 mL of 6% phenol solution (w/v) and 2.5 mL concentrated sulfuric acid (98%) in glass tubes. Following 30 min incubation at room temperature, colorimetric reaction products were measured at 490 nm using a UV-Vis spectrophotometer (Shimadzu Scientific Instruments, Inc., Columbia, USA). The EPS productivity per cell was calculated using the following formula:
Where EPS production is the cumulative EPS production recorded from the start to exponential phase of the culture, cell count is the average cell count recorded from the start to exponential phase of the culture.
2.5 Preparation of crude EPS
After 24 days of cultivation, the culture was centrifuged at 10000 rpm (9184 × g) for 10 min at 4°C. The supernatant was concentrated using an Eyela N-1300 rotary evaporator (Eyela, Tokyo, Japan) at 50°C. Four volumes of 95% ethanol were slowly added to one volume of supernatant under stirring and the flocs were collected via centrifugation at 8000 rpm (5878 × g) for 10 min at 4°C (Chen et al., 2009). The resulting flocs were collected and washed twice with 95% ethanol and redissolved in ultrapure water. To remove salts of EPS, the obtained solution was subjected to dialysis for 48 h against deionized water under stirring, utilizing a dialysis membrane with a molecular weight cutoff range of 100 to 500 Da. During dialysis, the deionized water should be replaced every four hours. Following the dialysis process, four volumes of 95% ethanol were slowly added to one volume of supernatant under stirring. After that, the resulting flocs were collected and washed twice with 95% ethanol. Finally, the flocs were freeze-dried for 48 h using a SCIENTZ-10YG/A freeze-dryer (Ningbo Xinzhi Freeze-Drying Equipment Co., Ltd., Zhejiang, China). The freeze-dried flocs were crude exopolysaccharides.
2.6 Removal of free proteins from crude exopolysaccharides
Crude exopolysaccharides (240 mg) were dissolved in distilled water (120 mL). Then 30 mL Sevag reagent (n-butanol: chloroform = 1: 4, v:v) was added and the mixture was vortex-mixed for 30 min (Wang et al., 2021). After 30 min, the mixture was centrifuged at 4000 rpm (1469 × g) for 5 min and the supernatant was carefully aspirated. These processes were repeated four times. Finally, four volumes of 95% ethanol were slowly added to one volume of supernatant under stirring. The flocs were collected and freeze-dried for 48 h using a SCIENTZ-10YG/A freeze-dryer (Ningbo Xinzhi Freeze-Drying Equipment Co., Ltd., Zhejiang, China). The freeze-dried flocs were exopolysaccharides (EPS). EPS loss was not measured throughout this step, and the EPS were used directly for qualitative determination.
2.7 Determination of EPS total soluble protein
Total soluble protein content was quantified through the Lowry method with bovine serum albumin as calibration standard (Lowry et al., 1951). Aliquots (200 μL) of EPS solutions were mixed with 20 μL Folin-phenol A. After 10 min incubation under ambient conditions (25°C), 20 μL of Folin-phenol B was added with immediate mixing. The reaction mixtures were subsequently incubated at 37°C for 30 min. Absorbance measurements at 650 nm were conducted using a UV-Vis spectrophotometer (Shimadzu Scientific Instruments, Inc., Columbia, USA).
2.8 Uronic acid content determination
Uronic acid quantification was performed using the modified meta-hydroxyphenyl colorimetric assay with glucuronic acid as calibration standard (Blumenkrantz and Asboe-Hansen, 1973). The standard curve of uronic acid was drawn using the glucuronic acid as the standard substance. Regression equation of standard curve is “y = 0.0627x – 0.0052, R2 = 0.999”. Reaction mixtures contained 1.5 mL cold sulfuric acid-tetraborate reagent (pre-chilled to 4°C) and 250 μL EPS solution, and the mixture was incubated in borosilicate glass tubes (13 × 100 mm) with screw-cap at 100°C boiling water bath for 5 min. After immediate cooling in an ice-water slurry, 25 μL of 0.15% meta-hydroxyphenyl (w/v) was added and was immediately vortex-mixed to ensure homogeneous chromogenic reaction initiation. Absorbance measurements at 520 nm (A) were recorded using a UV-Vis spectrophotometer (Shimadzu Scientific Instruments, Inc., Columbia, USA). The 0.15% meta-hydroxyphenyl was replaced by 25 μL of 0.5% NaOH and the absorbance value at 520 nm was recorded as A0. The purpose was to eliminate the interference of pinkish color produced by tetraborate sulfate with non-hexuronic acids at 100°C. The value of the difference between A and A0 was acquired and employed to calculate the uronic acid content.
2.9 Sulfate content determination
Sulfate content was measured by ICS-5000 ion chromatography (Thermo Scientific, Sunnyvale, CA, USA) (Reim, 2006). Samples were prepared through acid hydrolysis of EPS (1.0 mg) in 2.0 mL 1.0 mmol L-1 HCl in borosilicate glass screw-cap vials with PTFE-lined septa at 100°C for 6 h. The PTFE lining ensures chemical inertness, while the screw-cap design prevents vapor leakage during prolonged heating. To mitigate pressure buildup, vials were loosely capped during initial heating (first 30 minutes) and fully tightened once thermal equilibrium was reached. The hydrolysate was filtered through 0.45 μm polyether sulfone microporous membranes (Millipore, Billerica, MA, USA) and quantitatively transferred to 5 mL volumetric flasks using ultrapure water. Chromatographic separation was achieved on a Dionex IonPac AS11-HC analytical column (4 × 250 mm, 4 μm) with isocratic elution (a mixed solution of 4.5 mM NaHCO3 and 3.6 mM Na2CO3, 1.0 mL min-1), coupled to a reversed-phase C18 guard column and conductivity detector. Stringent anti-contamination protocols were implemented, including exclusive use of certified sulfate-free reagents and dedicated glassware pretreated with 10% HCl (24 h) followed by rinsing three times with deionized water.
2.10 Determination of EPS monosaccharide composition
Monosaccharide composition analysis was conducted through pre-column derivatization gas chromatography following optimized protocols (Wang et al., 2017). EPS samples (5.0 mg) were subjected to acid hydrolysis in 2.0 mL of 3.0 mol L-1 trifluoroacetic acid within sealed glass hydrolysis tubes at 120°C for 3 h. The hydrolysate was subjected to three successive methanol co-evaporations using a rotary evaporator and was dried it with nitrogen gas to ensure complete trifluoroacetic acid removal. The residual dryness was confirmed by gravimetric analysis (< 0.5% weight variation between successive evaporations). Hydroxylamine hydrochloride, inositol hydrochloride and pyridine-acetic anhydride derivatization cocktail were added to the hydrolysate and the mixture was shaken at 90°C for 30 min. After acetic anhydride was added, the mixture was shaken at 90°C for another 30 min. After the mixture was cooled, the aldononitrile acetate derivative of EPS was obtained. The chromatographic system used was the Thermo ICS 5000+ ion chromatography system (ICS 5000+, Thermo Fisher Scientific, USA). The liquid chromatography column was Dionex™ CarboPac™ PA20 (3.0 × 150 mm, 10 μm). Nitrogen was used as the carrier gas (1 mL min-1). The column temperature was programmed from 120°C to 180°C at 3°C min-1. Injection port and detector temperatures were maintained at 250°C and 280°C, respectively. Monosaccharide standards, including fucose, rhamnose, arabinose, galactose, glucose, xylose, mannose, fructose, ribose, galacturonic acid, glucuronic acid, galactosamine hydrochloride, glucosamine hydrochloride, N-acetyl-D-glucosamine, guluronic acid and mannuronic acid, were systematically derivatized using identical experimental conditions. Inositol was incorporated as an internal standard for data normalization. Monosaccharide identification was performed by comparing the retention times to those of pre-derivatized reference standards. The relative contents of monosaccharide were determined by normalizing target peak areas to both the internal standard and a calibration curve generated from derivatized standards of known concentrations. The molar quantities of individual monosaccharides were simultaneously determined using their respective molecular weights and content values. The monosaccharide composition was expressed in molar percentages, calculated using the following formula:
Where Ni is the molar quantity of the monosaccharide, Nt is the total molar quantity of all monosaccharides.
2.11 Determination of EPS molecular weight
The EPS samples (5.0 mg) were dissolved in 1.0 mL of 0.2 mol L-1 NaCl and the mixture was centrifuged at 12000 rpm (13225 × g) for 10 min. The supernatant was filtered through a 0.22 μm aqueous microfiltration membrane and transferred to a 1.8 mL injection vial. The molecular weight was analyzed by a high-performance gel permeation chromatography system equipped with a BRT105-103–101 gel column (8.0 × 300 mm; Tosoh Biosep, Tokyo, Japan) and a Shodex RI-20A refractive index detector (Showa Denko, Tokyo, Japan) (Lv et al., 2024a). The mobile phase (0.2 mol L-1 NaCl) was delivered at 0.8 mL min-1 under the following conditions: 25 μL injection volume, 40°C column temperature, 0.8 mL min-1 flow rate and 60 min elution time.
2.12 Fourier transform infrared spectroscopy analysis of EPS
The 1.0 mg of EPS mixed with 200 mg spectroscopic grade KBr (Merck, Germany) was ground in an agate mortar to ensure homogeneous dispersion. The mixture was pressed into translucent pellets using a hand press at constant pressure. Then the infrared spectrum of EPS (500–4000 cm-1) was measured using a Thermo Nicolet iS50 Fourier transform infrared spectrometer (Thermo Scientific, Sunnyvale, CA, USA).
2.13 Statistical analysis
All experimental data presented in figures and tables were derived from three biological replicates and three technical replicates. Statistical analyses were performed using one-way analysis of variance (ANOVA) in SPSS 18.0 software (SPSS Inc., Chicago, IL, USA). The differences between sample means were analyzed using the least significant difference (LSD) test, with statistical significance defined at p < 0.05.
3 Results
3.1 Growth characteristics of P. purpureum
The 9.0 mM was the optimal condition for P. purpureum growth, achieving the highest cell density (5.9 × 10⁷ cells mL-1) by the end of cultivation (Figure 1A). The 9.0 mM group maintained higher cell density than 3.6 mM, 36.0 mM and 54.0 mM groups after day 6. In contrast, the 0 mM group exhibited transient growth phase from day 0 to day 3 and then reached a steady state on day 3. The cell count of 0 mM group was lower than those of the other groups throughout the culture period. Notably, the cell density of 18.0 mM group was also higher than that of other groups except the 9.0 mM group. As shown in Figure 1B, the color of 9.0 mM, 18.0 mM, 36.0 mM and 54.0 mM groups maintained red throughout the whole cultivation period. In contrast, the color in the 0 mM and 3.6 mM groups gradually turned green after day 3, implying the reduction of phycobiliproteins. From the above results, the optimal nitrogen concentrations for the cell division of P. purpureum were 9.0 mM and 18.0 mM.
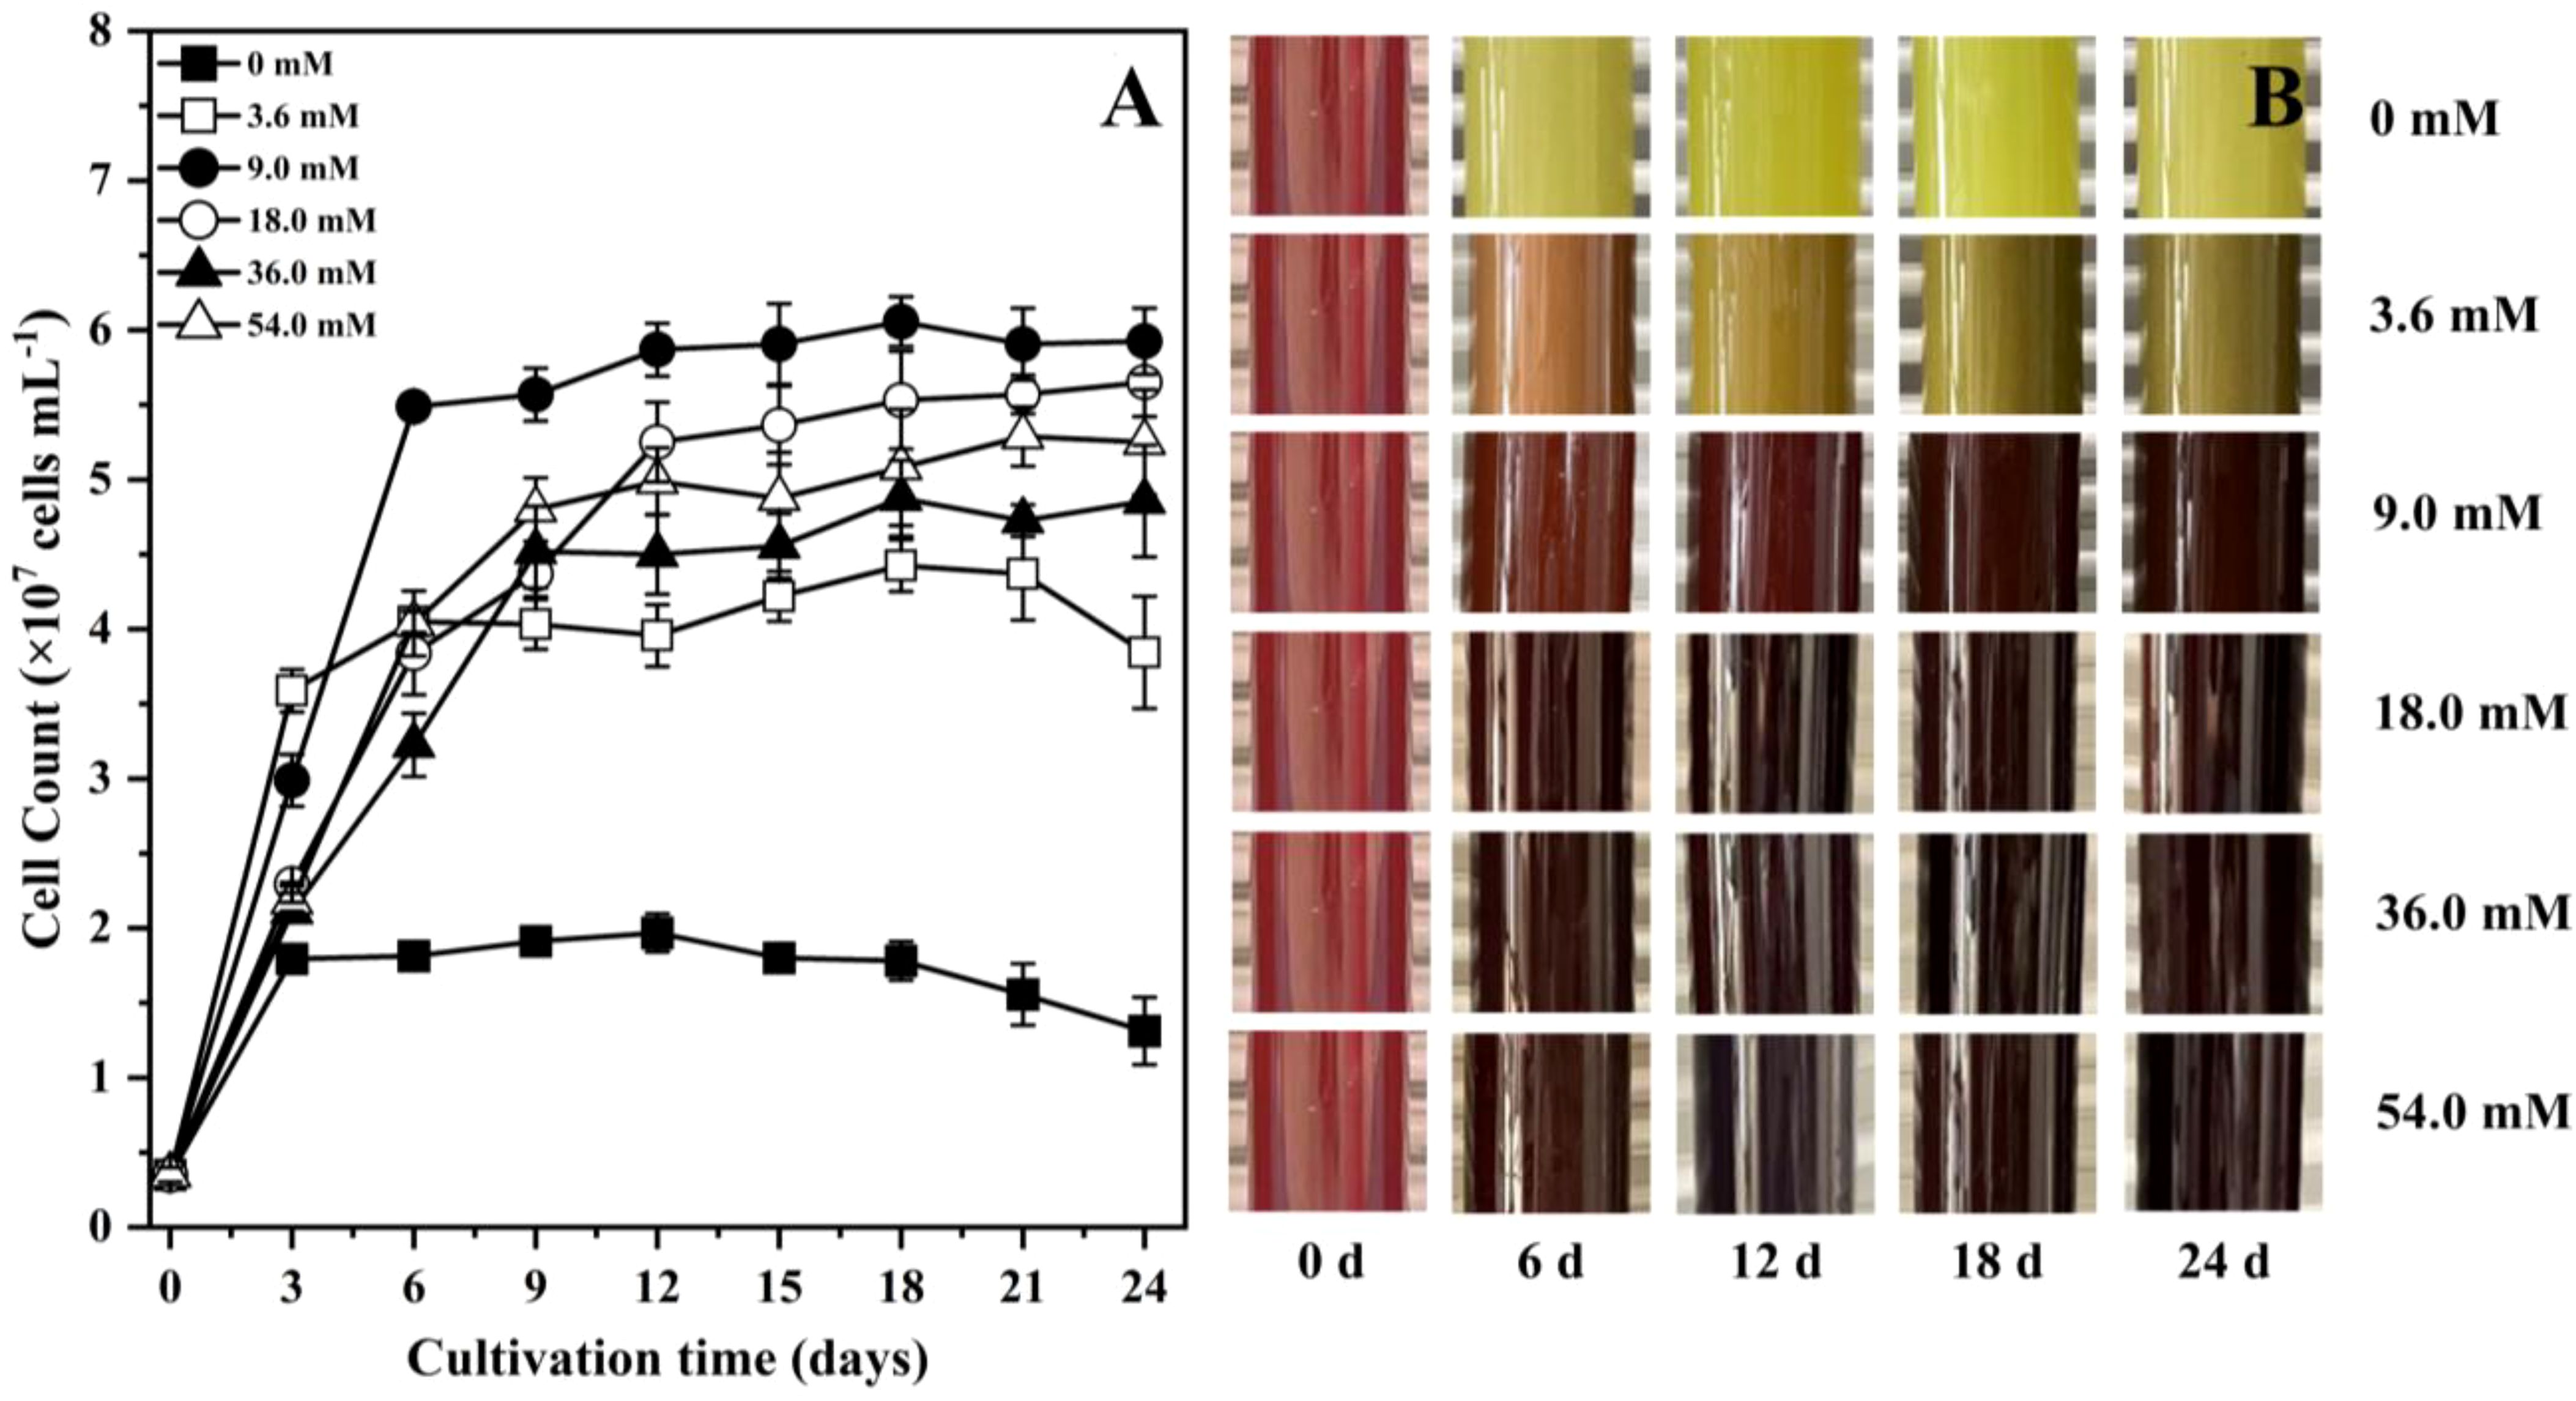
Figure 1. Growth characteristics of Porphyridium purpureum under different nitrogen concentrations. (A) cell count; (B) color change. The values shown are the averages of three biological replicates and three technical replicates ± standard deviation.
3.2 Photosynthetic efficiency of P. purpureum
For the 0 mM, 3.6 mM and 9.0 mM groups, the value of Fv/Fm decreased over the cultivation period (Figure 2A). The Fv/Fm of 18.0 mM, 36.0 mM and 54.0 mM groups gradually increased and reached the maximum (0.664, 0.689 and 0.641, respectively) on day 15. From the above results, the Fv/Fm was reduced under low nitrogen concentrations.
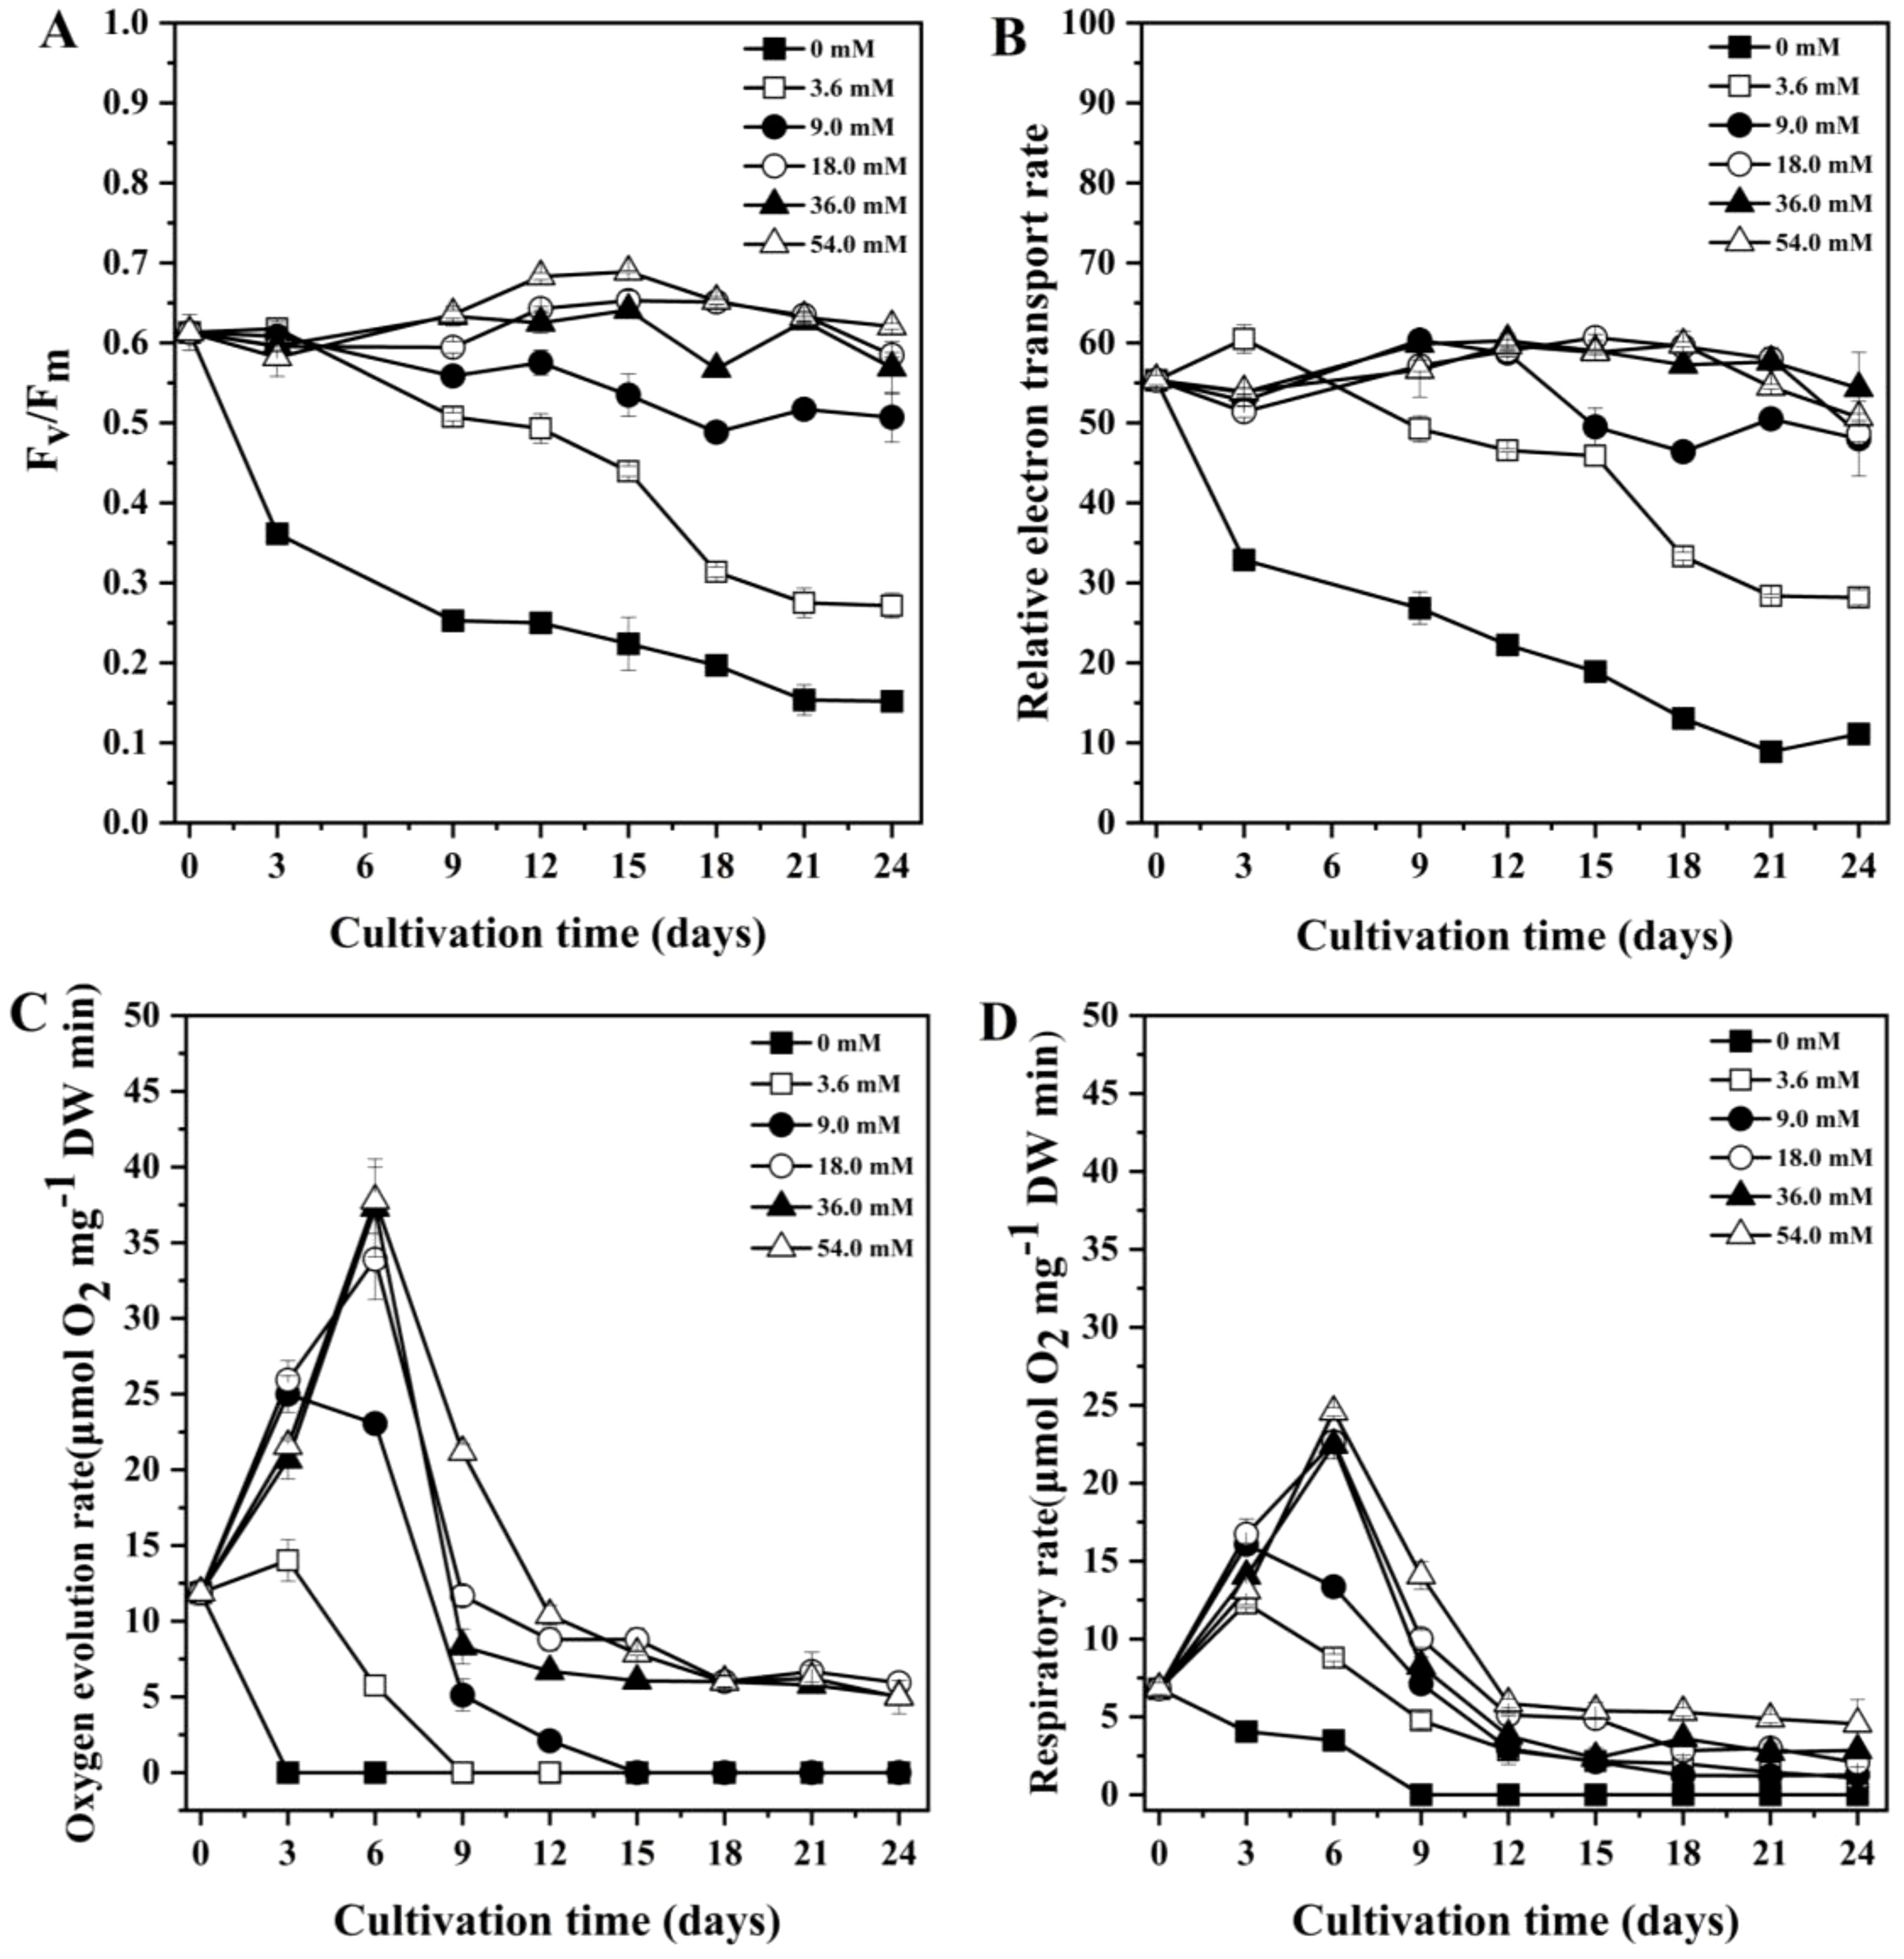
Figure 2. Changes in chlorophyll fluorescence parameters of Porphyridium purpureum under different nitrogen concentrations. (A) maximum photosynthetic efficiency of PS II (Fv/Fm); (B) relative electron transport rate (rETR); (C) photosynthetic oxygen evolution rate; (D) dark respiration rate. The values shown are the averages of three biological replicates and three technical replicates ± standard deviation.
The rETR of 0 mM and 3.6 mM groups decreased throughout the experiment (Figure 2B). The rETR of 9.0 mM, 18.0 mM, 36.0 mM and 54.0 mM groups reached the maximum on day 12 and then gradually decreased. These results indicated that the rETR of P. purpureum decreased with the decrease in nitrogen concentration.
As shown in Figures 2C, D, the photosynthetic oxygen evolution rate of 0 mM group dropped to 0 μmol O2 mg-1 DW min-1 on day 3, and its dark respiration rate also fell to 0 μmol O2 mg-1 DW min-1 on day 9. For the 3.6 mM and 9.0 mM groups, both the photosynthetic oxygen evolution rate and dark respiration rate peaked on day 3. The photosynthetic oxygen evolution of 3.6 mM and 9.0 mM groups decreased to 0 μmol O2 mg-1 DW min-1 on day 9 and day 15, respectively. By the end of the culture period, the dark respiration rates of 3.6 mM and 9.0 mM groups decreased to 1.0 and 1.3 μmol O2 mg-1 DW min-1, respectively. In contrast, the photosynthetic oxygen evolution rate and dark respiration rate of 18.0 mM, 36.0 mM and 54.0 mM groups peaked on day 6. Notably, the 54.0 mM group exhibited the highest photosynthetic oxygen evolution rate (37.8 μmol O2 mg-1 DW min-1) and dark respiration rate (24.6 μmol O2 mg-1 DW min-1) among all groups.
3.3 Production of EPS in P. purpureum
The total EPS yield of P. purpureum under different nitrogen concentrations were shown in Figure 3A. With the prolonging of the culture time, the total EPS yield of all treatments gradually increased. Additionally, an increase in nitrogen concentration led to enhanced EPS production. At the end of the culture time, the 54.0 mM group achieved the highest total EPS yield (663.5 mg L-1). As depicted in Figure 3B, the EPS productivity per cell in the low nitrogen concentrations group was lower than that of the high nitrogen concentrations groups. Moreover, the 36.0 mM group achieved the highest EPS productivity per cell (7.9 pg cell-1 day-1). These results indicated that 36.0 mM showed the highest EPS productivity per cell, while 54.0 mM had the greatest total EPS yield.
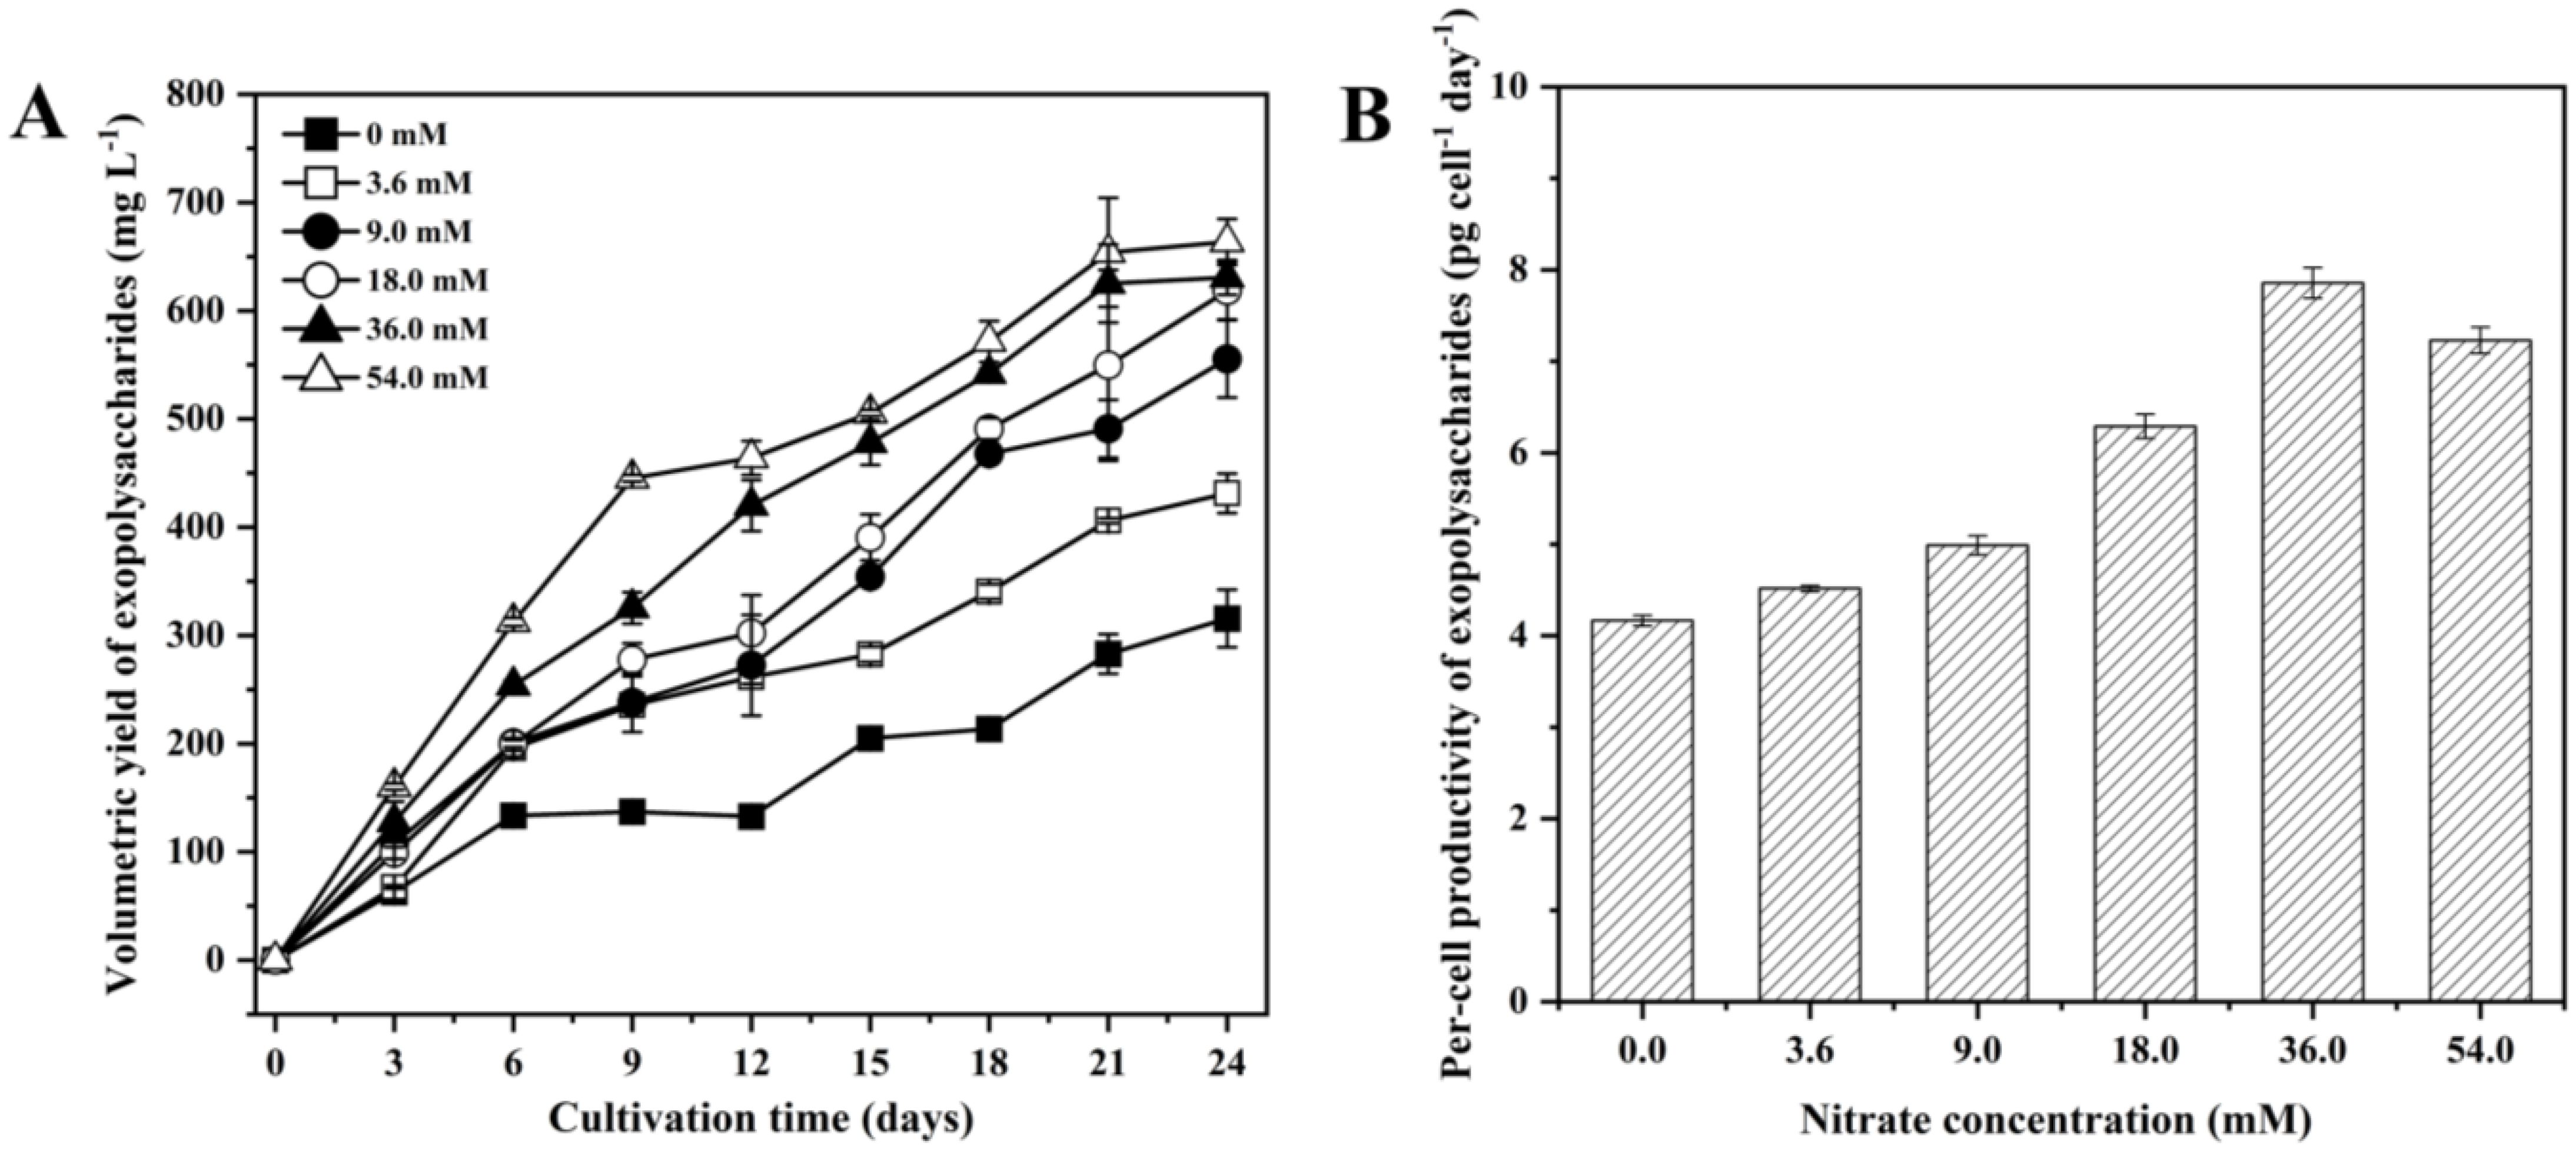
Figure 3. Production of Porphyridium purpureum under different nitrogen concentrations. (A) exopolysaccharide yield; (B) exopolysaccharides productivity per cell. The values shown are the averages of three biological replicates and three technical replicates ± standard deviation.
3.4 Biochemical composition of EPS
As shown in Table 1, the proportions of carbohydrate, protein and uronic acid increased with rising nitrogen concentrations. Maximal proportions of carbohydrate, protein and uronic acid were observed in the 54.0 mM group, reaching 67.6% DW, 9.1% DW and 13.9% DW, respectively. The 18.0 mM group demonstrated the highest sulfate content (12.9% DW). However, the low nitrogen group had higher sulfate content compared to the high nitrogen groups. These results demonstrated that the proportions of carbohydrate, protein and uronic acid of EPS increased with the increase in nitrogen concentration. In addition, high protein and uronic acid content of EPS may indicate more functional EPS.
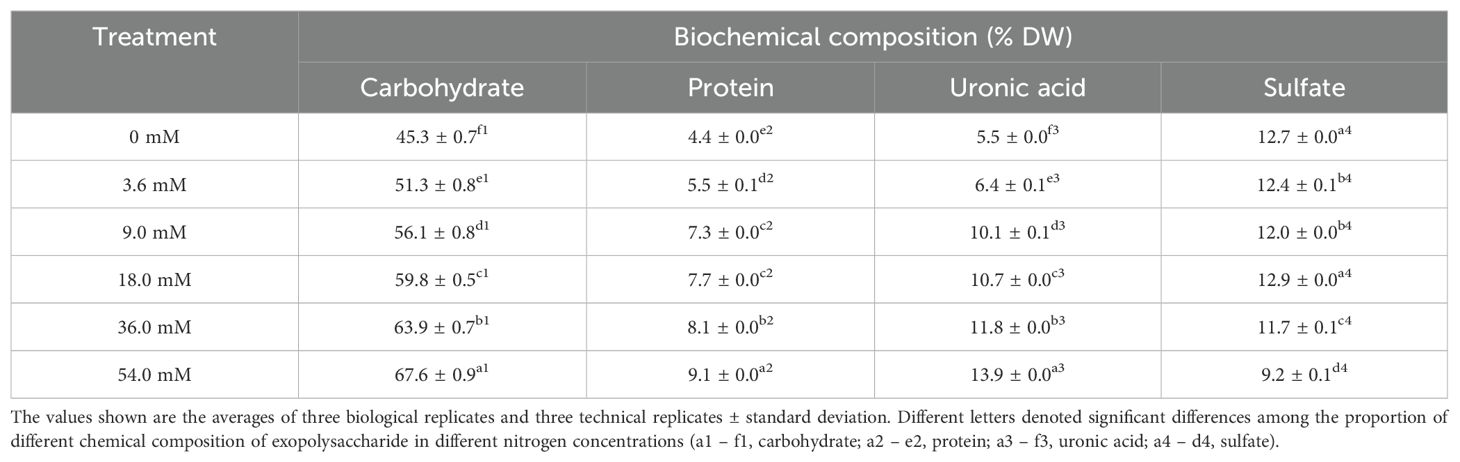
Table 1. Chemical composition of Porphyridium purpureum exopolysaccharide under different nitrogen concentrations.
Table 2 showed that the monosaccharide composition of EPS mainly included xylose, glucose and galactose. Xylose represented a significant proportion within the monosaccharide composition (39.4% to 45.6%). Its proportion significantly increased under high nitrogen concentrations, peaking at 45.6% in the 36.0 mM group. In contrast, the change in glucose proportion was relatively stable (17.0% to 19.4%), with the 0 mM group exhibiting the highest value (19.4%). However, low nitrogen concentrations were beneficial to increasing the galactose proportion, reaching a maximum of 43.0% in the 3.6 mM group. These results demonstrated that nitrogen concentration influenced the monosaccharide percentage of EPS.
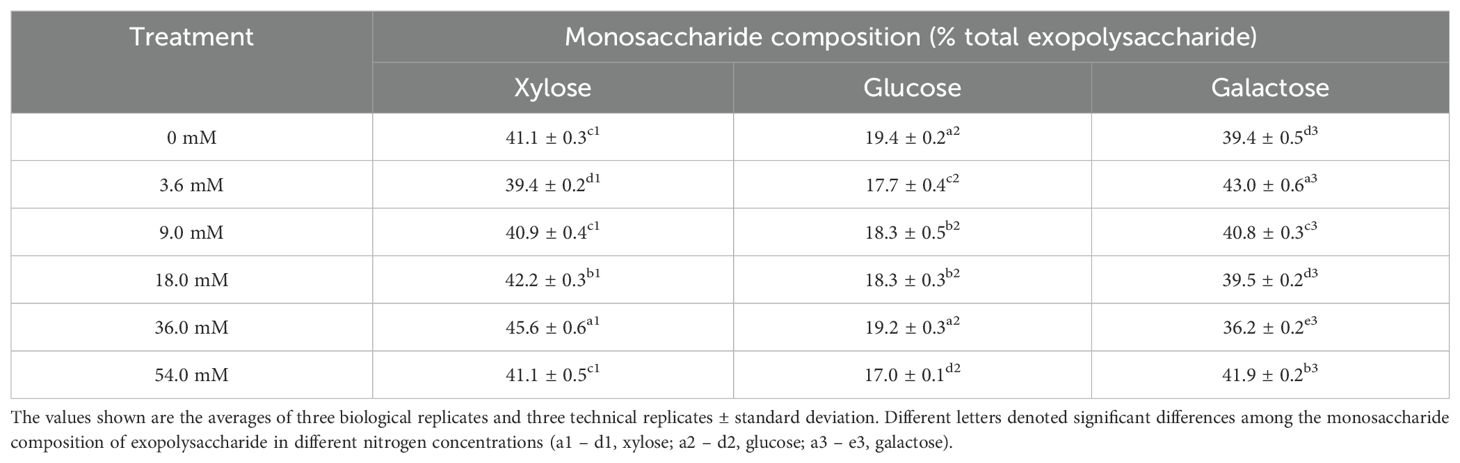
Table 2. Monosaccharide percentage of Porphyridium purpureum exopolysaccharide under different nitrogen concentrations.
3.5 Molecular weight of EPS
As shown in Figure 4, the 0 mM group exhibited the maximum molecular weight (8.3 × 10⁶ Da), significantly exceeding all other treatment groups (p < 0.05). Within the range of 0 mM to 18.0 mM, the molecular weight decreased with increasing nitrogen concentration. However, when the nitrogen concentration was higher than 18 mM, the molecular weight exhibited a nonlinear relationship. The molecular weights of 36.0 mM and 54.0 mM groups were higher than that of the 18.0 mM group. These results indicated that the molecular weight of EPS was affected by nitrogen concentration.
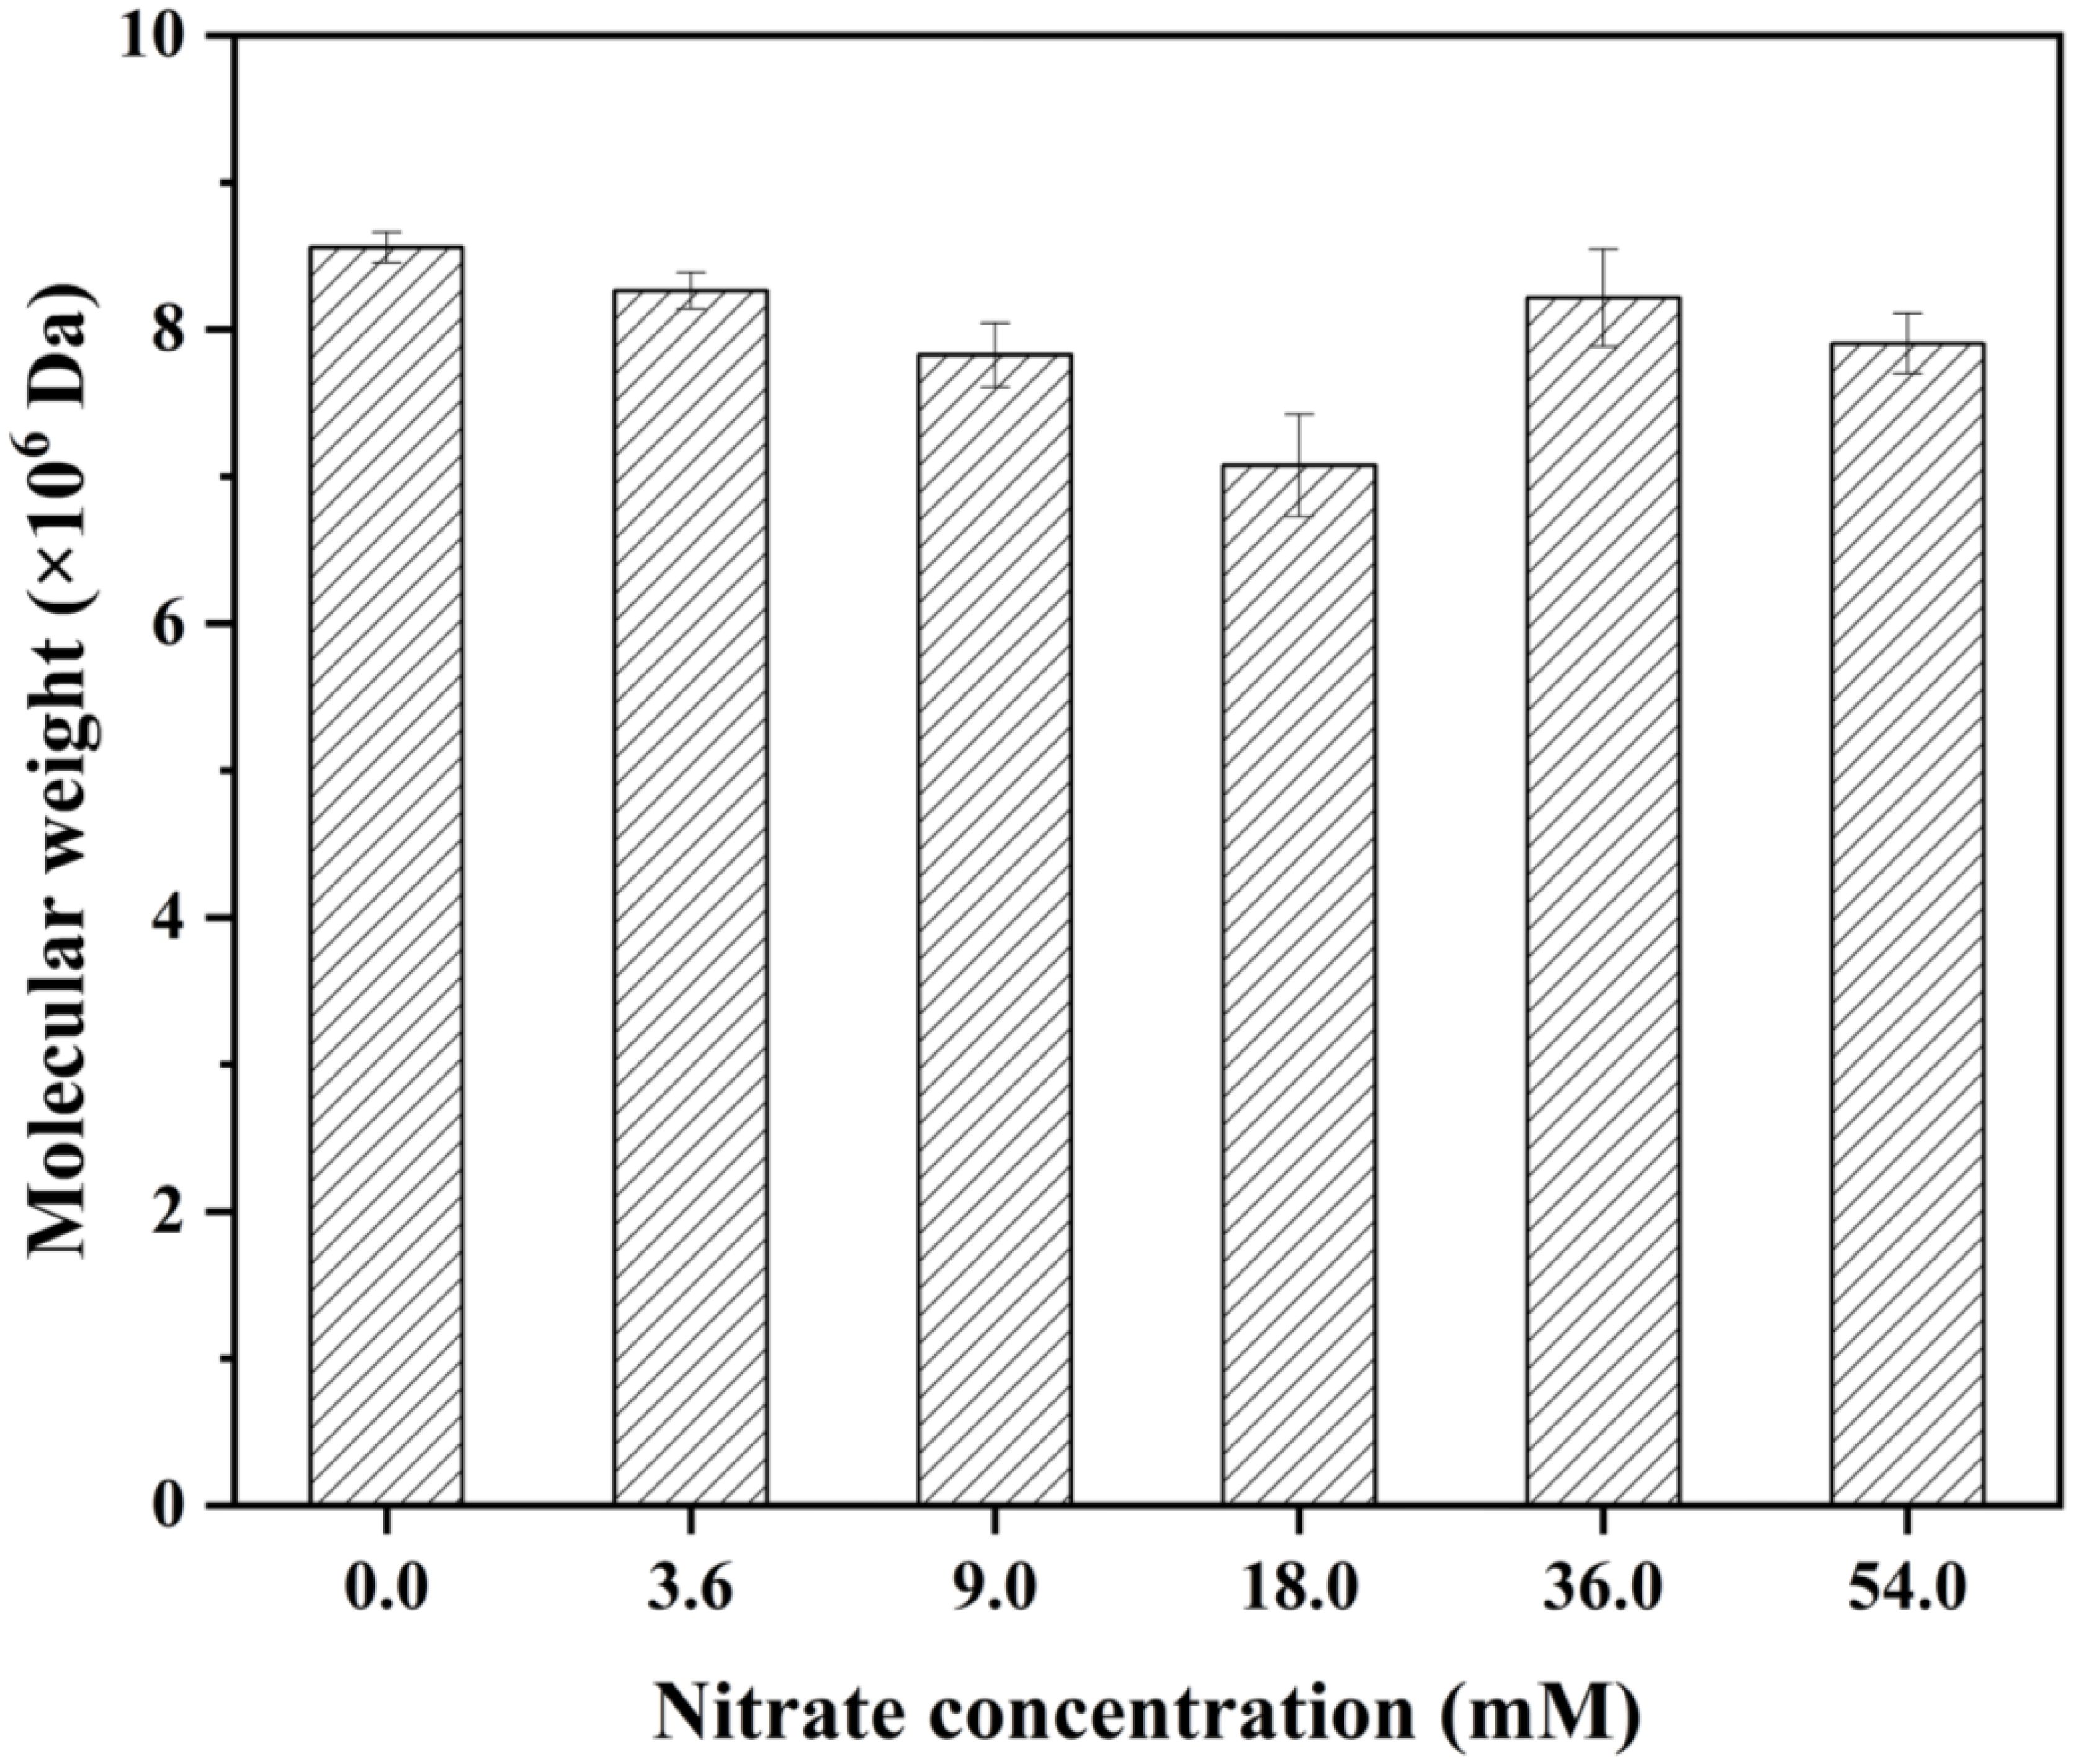
Figure 4. The molecular weight of Porphyridium purpureum under different nitrogen concentrations. The values shown are the averages of three biological replicates and three technical replicates ± standard deviation.
3.6 Fourier transform infrared spectroscopy of EPS
Variations in the FT-IR spectra correlated with structural modifications of polysaccharides. The FTIR spectra of EPS in P. purpureum remained largely consistent across different nitrogen concentrations (Figure 5, Table 3). Absorption peaks at 3430–3435 cm-1 corresponded to the hydrogen-bonded (-OH) stretching vibrations (Lv et al., 2024b). Weak peaks at 2,930–2935 cm-1 were assigned to C-H stretching vibrations of -CH3 groups (He et al., 2022). Peaks at 1630–1640 cm-1 indicated asymmetric C=O stretching vibrations. (Lv et al., 2024b). The absorption peak at 1419–1400 cm-1 indicated the stretching vibration of the C-O bond in C-OH. Absorption bands at 1205–1232 cm-1 arose from the asymmetrical S=O stretching of sulfate group (Wang et al., 2013). Peaks at 1110–1122 cm-1 were attributed to the C-O bending vibrations of C-O-C or C-O-H (Kacurakova et al., 2000). Additionally, peaks at 871–905 cm-1 corresponded to β-configuration pyran ring (Choi et al., 2021). These results demonstrated that the EPS of P. purpureum under six different nitrogen concentrations exhibited typical absorption features of polysaccharide and possessed a β-configuration glycosidic bond. It illustrates that the EPS of P. purpureum have structural stability under different nitrogen concentrations.
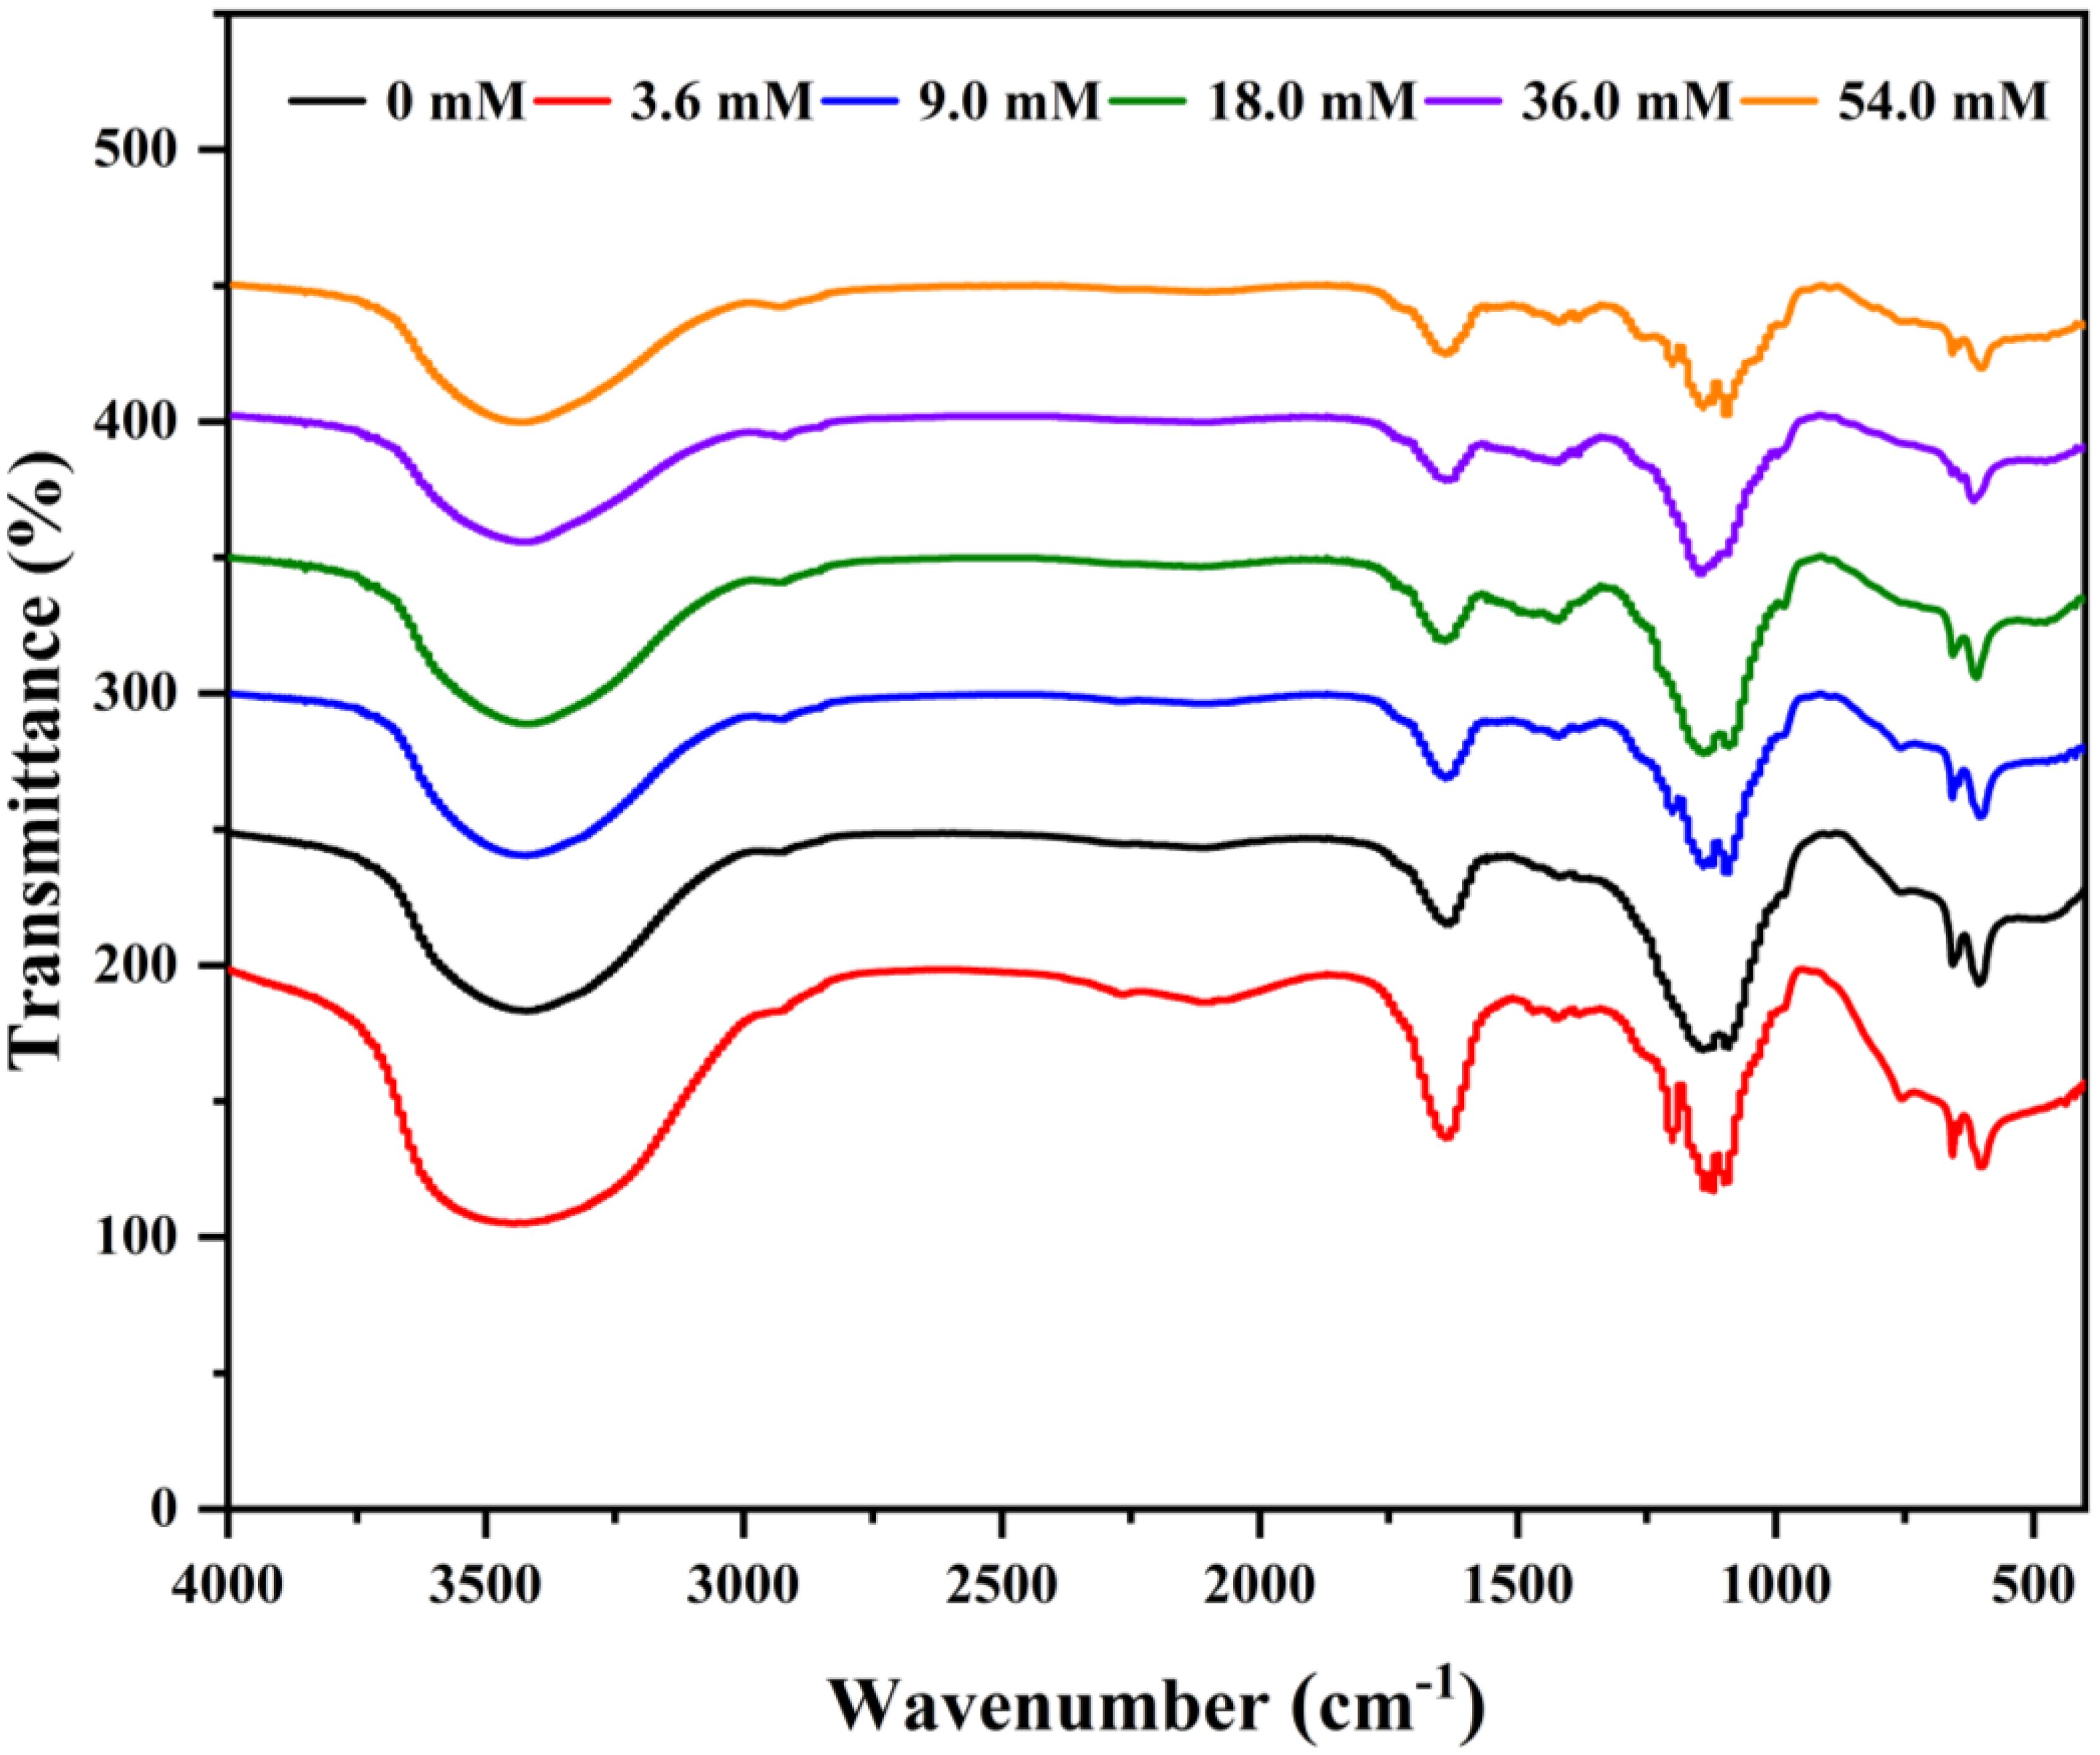
Figure 5. Fourier transform infrared absorption spectra of Porphyridium purpureum exopolysaccharide under different nitrogen concentrations.
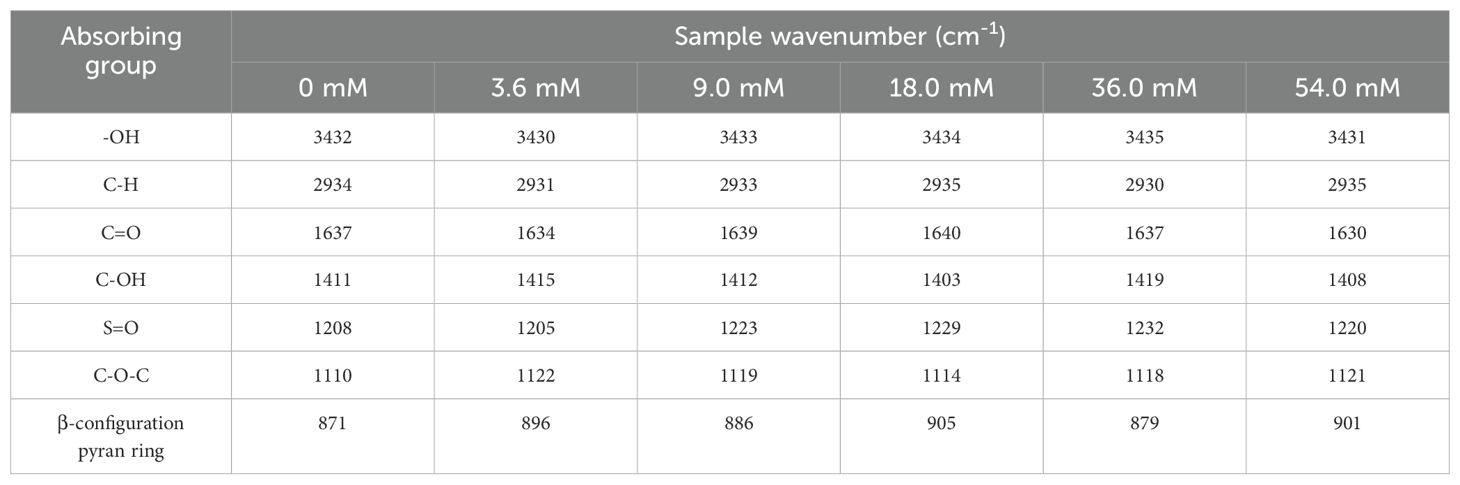
Table 3. FTIR absorption of Porphyridium purpureum exopolysaccharide under different nitrogen concentrations.
4 Discussion
Nitrogen deficiency can block the synthesis of proteins and chlorophylls required for photosynthesis, thereby inhibiting the cell division (Yaakob et al., 2021). In the present study, the 0 mM and 3.6 mM groups remarkably inhibited the cell division of P. purpureum. Similarly, the 9.6 mM group markedly decreased the cell density of Chlamydomonas reinhardtii and Scenedesmus subspicatus (Dean et al., 2010). Nannochloropsis, Chlorella and Haematococcus stopped dividing under nitrogen deficiency (Baroni et al., 2019). In the present study, 36.0 mM and 54.0 mM also suppressed the cell division of P. purpureum. Exposure of microalgae to nitrogen-rich environments enhances nitrate reductase activity, leading to excessive accumulation of cytotoxic intermediates, including nitrite and ammonium ions (Markou et al., 2014). This metabolic imbalance has toxic effects on the physiology of the microalgae, ultimately inhibiting their growth.
The Fv/Fm and rETR have been widely used to evaluate photosynthetic efficiency (Renuka et al., 2017). The present study showed that the photosynthetic efficiency of P. purpureum were decreased with the decrease in nitrogen concentration. Similar findings have been reported in previous studies. The Fv/Fm and rETR of Isochrysis galbana were significantly decreased under nitrogen-deprived conditions (Song et al., 2018). A marked decrease in Fv/Fm from 0.60 to 0.20 in Dunaliella tertiolecta was observed during nitrogen starvation (Young and Beardall, 2003). The color of the culture gradually turned green in the 0 mM and 3.6 mM groups, indicating the degradation of phycoerythrin. The above results showed that P. purpureum might fail to synthesize phycoerythrin, leading to damage to PS II reaction center, inhibiting the primary photosynthesis or disrupting the photosynthetic electron transport process.
Our study reveals a positive correlation between nitrogen concentration and EPS yield in P. purpureum, contradicting the previously reported results of nitrogen limitation-driven EPS synthesis in microalgae. Nitrogen limitation increased the EPS production of Parachlorella sp. BX1.5 (Sasaki et al., 2020). The EPS production of Botryococcus braunii was enhanced by 38.8% under nitrogen limitation (Díaz Bayona and Garcés, 2014). The 2.1-fold EPS increase in the 54.0 mM group compared to the 0 mM group might imply an undiscovered metabolic pathway in this species. The potential reasons may include the following aspects. First, nitrogen limitation significantly reduces the photosynthetic efficiency, thereby impairing their carbon fixation capacity and consequently affecting EPS biosynthesis which requires photosynthesis to provide energy and carbon sources (Pierre et al., 2019). Second, microalgae may have specific intracellular carbon-nitrogen balance mechanism. Under nitrogen-replete conditions, cells tend to synthesize carbohydrates and lipids (Zhu et al., 2014). When the intracellular storage of these compounds is restricted, EPS are synthesized as an efficient carbon carrier to maintain cellular metabolic balance (Stuart et al., 2016). Third, high nitrogen concentration induces elevated osmotic pressure relative to low nitrogen concentration. In response to this osmotic stress, algal cells upregulate EPS biosynthesis as a protective mechanism to counteract sodium ion influx via osmosis, thereby maintaining cellular homeostasis (Philippis and Vincenzini, 1998). In this study, the EPS concentration (663.5 mg L-1) was relatively low compared to some of previous results, which may be attributed to the cultivation duration. Due to the high molecular weight and the lack of glycoside hydrolases, EPS cannot be reabsorbed or reutilized by cells. Consequently, the sustained EPS production drives continuous extracellular accumulation in the culture medium, eventually resulting in a gel-like colloidal matrix that restricts fluid mobility. Despite the exceptionally high EPS yield under these conditions, the inseparable cell-polysaccharide complex precluded effective centrifugal separation, thereby resulting in suboptimal industrial EPS harvesting efficiency. In conclusion, this study not only proposes a model of high nitrogen-promoted EPS synthesis but also highlights the necessity of integrating physiological mechanisms with process optimization for advancing microalgal EPS development.
The present study showed that the monosaccharide composition, substituents content and molecular weight were affected by the culture conditions. The monosaccharide percentage of EPS in P. purpureum was influenced by nitrogen concentration. The findings of numerous studies are consistent with our results. Nitrogen limitation increased the percentage of xylose, galactose and glucose, but reduced the percentage of fucose, rhamnose and arabinose of EPS in Cyanobacterial biocrusts (Qian et al., 2023). The underlying cause may be attributed to altered glycosyltransferase activity in the EPS biosynthesis pathway or discrepancies in the synthesis rates of distinct UDP-monosaccharides (Soumya and Nampoothiri, 2021). The percentages of xylose and galactose in EPS secreted by Nostoc flagelliforme showed a positive correlation with UDP-glucose pyrophosphorylase and UDP-glucose dehydrogenase (Han et al., 2017). The uronic acid content of EPS in P. purpureum increased with the increase in nitrogen concentration. Similar nitrogen limitation-induced reductions in uronic acid content have been documented in Cylindrotheca fusiformis (Bacillariophyceae) (Magaletti et al., 2004). The uronic acid content of EPS is modulated via the coordinated regulation of biosynthetic pathway components, particularly the gene expression and enzymatic activity of key uronic acid-forming enzymes (e.g., UDP-glucose dehydrogenase), and through adjustments in the metabolic flux of precursor substrates (e.g., UDP-glucose) (Schmid et al., 2015). For example, targeted knockout of Peuxs1 and Peuxs2 genes significantly enhanced the content of UDP-glucuronic acid in Paenibacillus elgii EPS (Li et al., 2015). Nitrogen concentration influenced the molecular weight of EPS in P. purpureum. When glucose and yeast powder were used as carbon and nitrogen sources, the molecular weight of EPS from Ganoderma lucidum was increased (Liu et al., 2022). Substantial experimental evidence indicates that molecular weight regulation of EPS can be achieved through overexpression or mutation of genes involved in the polymerization/degradation process (e.g., synthase, Wzy, PCP/lyases and glucosidases) (Schmid et al., 2015). For example, Co-overexpression of gumB and gumC led to high-molecular-weight xanthan in Xanthomonas campestris (Galván et al., 2013). This phenomenon might be attributed to the formation of a stable physical barrier around P. purpureum by high-molecular-weight EPS, thereby creating a microenvironment that protects the cells from nitrogen stress. However, these findings highlight the potential of tailoring EPS to achieve targeted functions through nitrogen regulation. The presence of uronic acid in EPS enhances its binding capacity for cations and positively charged molecules (Sardar et al., 2018). Notably, EPS produced by P. purpureum under high nitrogen concentrations are characterized by increased uronic acid content, which may confer advantages in medical hydrogel formulations and bioremediation applications due to their superior viscosity and pollutant chelation capabilities. The anti-inflammatory properties and macrophage stimulatory activity of EPS showed a positive correlation with galactose content (Lo et al., 2007; Chen et al., 2019). Significantly, EPS produced by P. purpureum under low nitrogen concentrations, which exhibited high galactose percentages, could serve as anti-allergy agents, repair products or drug carriers in cosmetics and functional foods.
These findings provide a theoretical foundation for structurally modifying EPS through nitrogen concentration regulation. However, the relationship between structure and bioactivities of EPS remains underexplored. Based on these findings, subsequent investigations should prioritize elucidating the tripartite relationship between nitrogen levels, EPS characteristics and bioactivities, thereby establishing a mechanistic framework for nitrogen-regulated structure-function causality in EPS.
In summary, nitrogen concentration significantly affects the yield, monosaccharide composition, substituents content and molecular weight of microalgal EPS. Such regulation may be mediated through multiple metabolic pathways: the coordinated expression of key biosynthetic genes and the allocation of metabolic flux in precursor substrates collectively determine the structure of EPS. Notably, the species-specific responses of microalgae to nitrogen stress likely originate from evolutionary adaptive divergence in EPS biosynthetic pathways. Future studies should focus on systematically deciphering the coupling mechanisms between nitrogen signaling transduction and EPS synthesis networks, while utilizing genetic engineering tools to directionally regulate EPS properties, thereby expanding their potential for biotechnological applications.
5 Conclusion
The increase in nitrogen concentration not only enhanced EPS yield but also significantly influenced its structural properties, including the monosaccharide composition and molecular weight. These findings are critical for optimizing the production of EPS from P. purpureum in industrial applications, particularly in areas such as biopolymer production and the food industry. Nitrogen concentration affected the monosaccharide composition (xylose, glucose and galactose) and the molecular weight of the EPS, suggesting the role of nitrogen in EPS biosynthesis regulation. The increase in nitrogen concentration led to a rise in uronic acid and sulfate content in the EPS, which could have implications for its bioactivity and potential applications. Future research should explore the underlying molecular mechanisms of nitrogen regulation in EPS biosynthesis and examine the potential of genetic engineering to optimize EPS production for industrial application. In conclusion, the optimal nitrogen concentrations for P. purpureum growth and EPS production are 9.0 mM and 18.0 mM, with nitrogen concentration playing a pivotal role in shaping the composition and molecular properties EPS.
Data availability statement
The original contributions presented in the study are included in the article/supplementary material. Further inquiries can be directed to the corresponding authors.
Author contributions
QL: Conceptualization, Data curation, Formal Analysis, Investigation, Methodology, Validation, Writing – original draft. JX: Funding acquisition, Resources, Writing – review & editing. YC: Writing – review & editing, Data curation, Formal Analysis, Investigation, Validation. WX: Data curation, Formal Analysis, Writing – review & editing. HW: Writing – review & editing, Project administration, Validation. SG: Project administration, Writing – review & editing, Funding acquisition. AL: Funding acquisition, Project administration, Conceptualization, Resources, Supervision, Writing – review & editing. TL: Conceptualization, Funding acquisition, Resources, Supervision, Writing – review & editing.
Funding
The author(s) declare that financial support was received for the research and/or publication of this article. This work was supported by the Guangdong Basic and Applied Basic Research Foundation, grant numbers 2024A1515010754 and 2023A1515012391, Research on breeding technology of candidate species for Guangdong modern marine ranching (2024-MRB-00-001) and the Nansha District Science and Technology Program, grant number 2023ZD014.
Conflict of interest
The authors declare that the research was conducted in the absence of any commercial or financial relationships that could be construed as a potential conflict of interest.
Generative AI statement
The author(s) declare that no Generative AI was used in the creation of this manuscript.
Publisher’s note
All claims expressed in this article are solely those of the authors and do not necessarily represent those of their affiliated organizations, or those of the publisher, the editors and the reviewers. Any product that may be evaluated in this article, or claim that may be made by its manufacturer, is not guaranteed or endorsed by the publisher.
References
Baroni É.G., Yap K. Y., Webley P. A., Scales P. J., and Martin G. J. O. (2019). The effect of nitrogen depletion on the cell size, shape, density and gravitational settling of Nannochloropsis salina, Chlorella sp. (marine) and Haematococcus pluvialis. Algal Res. 39, 101454. doi: 10.1016/j.algal.2019.101454
Blumenkrantz N. and Asboe-Hansen G. (1973). New method for quantitative determination of uronic acids. Anal. Biochem. 54, 484–489. doi: 10.1016/0003-2697(73)90377-1
Chen B. L., You W. L., Huang J., Yu Y., and Chen W. P. (2009). Isolation and antioxidant property of the extracellular polysaccharide from Rhodella reticulata. World J. Microbi. Biot. 26, 833–840. doi: 10.1007/s11274-009-0240-y
Chen Y. C., Wu Y. J., and Hu C. Y. (2019). Monosaccharide composition influence and immunomodulatory effects of probiotic exopolysaccharides. Int. J. Biol. Macromol. 133, 575–582. doi: 10.1016/j.ijbiomac.2019.04.109
Choi I. S., Ko S. H., Lee M. E., Kim H. M., Yang J. E., Jeong S. G., et al. (2021). Production, characterization, and antioxidant activities of an exopolysaccharide extracted from spent media wastewater after Leuconostoc mesenteroides WiKim32 fermentation. ACS Omega 6, 8171–8178. doi: 10.1021/acsomega.0c06095
Dean A. P., Sigee D. C., Estrada B., and Pittman J. K. (2010). Using FTIR spectroscopy for rapid determination of lipid accumulation in response to nitrogen limitation in freshwater microalgae. Bioresour. Technol. 101, 4499–4507. doi: 10.1016/j.biortech.2010.01.065
de Jesus Raposo M. F., de Morais A. M. M. B., and de Morais R. M. S. C. (2014). Influence of sulphate on the composition and antibacterial and antiviral properties of the exopolysaccharide from Porphyridium cruentum. Life Sci. 101, 56–63. doi: 10.1016/j.lfs.2014.02.013
Delattre C., Pierre G., Laroche C., and Michaud P. (2016). Production, extraction and characterization of microalgal and cyanobacterial exopolysaccharides. Biotechnol. Adv. 34, 1159–1179. doi: 10.1016/j.bioteChadv.2016.08.001
Díaz Bayona K. C. and Garcés L. A. (2014). Effect of different media on exopolysaccharide and biomass production by the green microalga Botryococcus braunii. J. Appl. Phycol. 26, 2087–2095. doi: 10.1007/s10811-014-0242-5
DuBois M., Gilles K. A., Hamilton J. K., Rebers P. A., and Smith F. (1956). Colorimetric method for determination of sugars and related substances. Anal. Chem. 28, 350–356. doi: 10.1021/ac60111a017
Ferreira A. S., Mendonça I., Póvoa I., Carvalho H., Correia A., Vilanova M., et al. (2021). Impact of growth medium salinity on galactoxylan exopolysaccharides of Porphyridium purpureum. Algal Res. 59, 102439. doi: 10.1016/j.algal.2021.102439
Gaignard C., Gargouch N., Dubessay P., Delattre C., Pierre G., Laroche C., et al. (2019a). New horizons in culture and valorization of red microalgae. Biotechnol. Adv. 37, 193–222. doi: 10.1016/j.bioteChadv.2018.11.014
Gaignard C., Laroche C., Pierre G., Dubessay P., Delattre C., Gardarin C., et al. (2019b). Screening of marine microalgae: Investigation of new exopolysaccharide producers. Algal Res. 44, 101711. doi: 10.1016/j.algal.2019.101711
Galván E. M., Ielmini M. V., Patel Y. N., Bianco M. I., Franceschini E. A., Schneider J. C., et al. (2013). Xanthan chain length is modulated by increasing the availability of the polysaccharide copolymerase protein GumC and the outer membrane polysaccharide export protein GumB. Glycobiology 23, 259–272. doi: 10.1093/glycob/cws146
Gargouch N., Elleuch F., Karkouch I., Tabbene O., Pichon C., Gardarin C., et al. (2021). Potential of exopolysaccharide from Porphyridium marinum to contend with bacterial proliferation, biofilm formation, and breast cancer. Mar. Drugs 19, 66. doi: 10.3390/md19020066
Garza-Rodríguez Z. B., Hernández-Pérez J., Santacruz A., Jacobo-Velázquez D. A., and Benavides J. (2022). Prospective on the application of abiotic stresses to enhance the industrial production of exopolysaccharides from microalgae. Curr. Res. Biotechnol. 4, 439–444. doi: 10.1016/j.crbiot.2022.09.007
Geresh S. and Dawadi R. (2000). Chemical modifications of biopolymers: quaternization of the extracellular polysaccharide of the red microalga Porphyridium sp. Carbohyd. Polym. 43, 75–80. doi: 10.1016/S0144-8617(99)00194-0
Han P. P., Yao S. Y., Guo R. J., Shen S. G., Yan R. R., Tan Z. L., et al. (2017). The relationship between monosaccharide composition of extracellular polysaccharide and activities of related enzymes in Nostoc flagelliforme under different culture conditions. Carbohyd. Polym. 174, 111–119. doi: 10.1016/j.carbpol.2017.05.093
He Y. L., Chen H., Ye Z. Y., Zhang X. M., Ye H. L., and Ye M. (2022). Structural characterization and bioactivities of a novel polysaccharide obtained from Lachnum YM38 together with its zinc and selenium derivatives. Process Biochem. 122, 282–298. doi: 10.1016/j.procbio.2022.08.035
Kacurakova M., Capek P., Sasinkova V., Wellner N., and Ebringerova A. (2000). FT-IR study of plant cell wall model compounds: Pectic polysaccharides and hemicelluloses. Carbohyd. Polym. 43, 195–203. doi: 10.1016/S0144-8617(00)00151-X
Laroche C. (2022). Exopolysaccharides from microalgae and cyanobacteria: diversity of strains, production strategies, and applications. Mar. Drugs 20, 336. doi: 10.3390/md20050336
Lewin R. A. (1956). Extracellular polysaccharides of green algae. Can. J. Microbiol 2, 665–672. doi: 10.1139/m56-079
Li O., Qian C. D., Zheng D. Q., Wang P. M., Liu Y., Jiang X. H., et al. (2015). Two UDP-glucuronic acid decarboxylases involved in the biosynthesis of a bacterial exopolysaccharide in Paenibacillus elgii. Appl. Microbiol. Biotechnol. 99, 3127–3139. doi: 10.1007/s00253-017-8673-y
Li T., Xu J., Gao B. Y., Xiang W. Z., Li A. F., and Zhang C. W. (2016). Morphology, growth, biochemical composition and photosynthetic performance of Chlorella vulgaris (Trebouxiophyceae) under low and high nitrogen supplies. Algal Res. 16, 481–491. doi: 10.1016/j.algal.2016.04.008
Li T., Xu J., Wu H. B., Jiang P. L., Chen Z. S., and Xiang W. Z. (2019). Growth and biochemical composition of Porphyridium purpureum SCS-02 under different nitrogen concentrations. Mar. Drugs 17, 124. doi: 10.3390/md17020124
Liu L. P., Feng J., Gao K., Zhou S., Yan M. Q., Tang C. H., et al. (2022). Influence of carbon and nitrogen sources on structural features and immunomodulatory activity of exopolysaccharides from Ganoderma lucidum. Process Biochem. 119, 96–105. doi: 10.1016/j.procbio.2022.05.016
Lo T. C. T., Jiang Y. H., Chao A. L. J., and Chang C. A. (2007). Use of statistical methods to find the polysaccharide structural characteristics and the relationships between monosaccharide composition ratio and macrophage stimulatory activity of regionally different strains of Lentinula edodes. Anal. Chim. Acta 584, 50–56. doi: 10.1016/j.aca.2006.10.051
Lowry O. H., Rosebrough N. J., Farr A. L., and Randall R. J. (1951). Protein measurement with the folin phenol reagent. J. Biol. Chem. 193, 265–275. doi: 10.1016/s0021-9258(19)52451-6
Lv D. H., Chen J., and Yang C. (2024a). The physicochemical properties and antioxidant activities of the hawthorn pectin extracted using ultra-high pressure assisted acid extraction (UPAAE). Foods. 13, 983. doi: 10.3390/foods13070983
Lv J. T., Li Z. C., Zhou X. D., Xue Y., Wang Y. W., and Li Q. (2024b). Facile preparation of sodium alginate based hybrid material and its enhanced flame retardancy: Unravelling the role of silver phosphate. J. Anal. Appl. Pyrol. 177, 106342. doi: 10.1016/j.jaap.2023.106342
Magaletti E., Urbani R., Sist P., Ferrari C. R., and Cicero A. M. (2004). Abundance and chemical characterization of extracellular carbohydrates released by the marine diatom Cylindrotheca fusiformis under N- and P-limitation. Eur. J. Phycol. 39, 133–142. doi: 10.1080/0967026042000202118
Markou G., Vandamme D., and Muylaert K. (2014). Microalgal and cyanobacterial cultivation: The supply of nutrients. Water Res. 65, 186–202. doi: 10.1016/j.watres.2014.07.025
Morais M. G., Santos T. D., Moraes L., Vaz B. S., Morais E. G., and Costa J. A. V. (2022). Exopolysaccharides from microalgae: Production in a biorefinery framework and potential applications. Bioresour. Technol. Rep. 18, 101006. doi: 10.1016/j.biteb.2022.101006
Philippis R. D. and Vincenzini M. (1998). Exocellular polysaccharides from cyanobacteria and their possible applications. FEMS Microbiol. Rev. 22, 151–175. doi: 10.1111/j.1574-6976.1998.tb00365.x
Pierre G., Delattre C., Dubessay P., Jubeau S., Vialleix C., Cadoret J.-P., et al. (2019). What is in store for EPS microalgae in the next decade? Molecules. 24, 4296. doi: 10.3390/molecules24234296
Qian L., Xiao J. S., Zhang Z. L., Yang L., Xia L., Farías M. E., et al. (2023). Impact of different nitrogen additions on microbes and exopolysaccharides excretion in cyanobacterial biocrusts. Plant Soil 487, 229–247. doi: 10.1007/s11104-023-05920-z
Reim R. E. (2006). Total sulfite in cellulosics by ion exclusion chromatography with electrochemical detection. J. Food Sci. 56, 1079–1090. doi: 10.1111/j.1365-2621.1991.tb14646.x
Renuka N., Guldhe A., Singh P., Ansari F. A., Rawat I., and Bux F. (2017). Evaluating the potential of cytokinins for biomass and lipid enhancement in microalga Acutodesmus obliquus under nitrogen stress. Energy Convers. Manage. 140, 14–23. doi: 10.1016/j.enconman.2017.02.065
Salimi F. and Farrokh P. (2023). Recent advances in the biological activities of microbial exopolysaccharides. World J. Microbiol. Biotechnol. 39, 213. doi: 10.1007/s11274-023-03660-x
Sardar U. R., Bhargavi E., Devi I., Bhunia B., and Tiwari O. N. (2018). Advances in exopolysaccharides based bioremediation of heavy metals in soil and water: a critical review. Carb. Polym. 199, 353–364. doi: 10.1016/j.carbpol.2018.07.037
Sasaki M., Takagi A., Ota S., Kawano S., Sasaki D., and Asayama M. (2020). Coproduction of lipids and extracellular polysaccharides from the novel green alga Parachlorella sp. BX1. 5 depending on cultivation conditions. Biotechnol. Rep. 25, e00392. doi: 10.1016/j.btre.2019.e00392
Schmid J., Sieber V., and Rehm B. (2015). Bacterial exopolysaccharides: biosynthesis pathways and engineering strategies. Front. Microbiol. 6. doi: 10.3389/fmicb.2015.00496
Soanen N., Da Silva E., Gardarin C., Michaud P., and Laroche C. (2016). Improvement of exopolysaccharide production by Porphyridium marinum. Bioresour. Technol. 213, 231–238. doi: 10.1016/j.biortech.2016.02.075
Song P. P., Zhang L. T., and Li Q. (2018). Response of photosynthetic apparatus of Isochrysis galbana to different nitrogen concentrations. Bioresour Technol. Rep. 4, 74–79. doi: 10.1016/j.biteb.2018.09.003
Soumya M. and Nampoothiri K. M. (2021). An overview of functional genomics and relevance of glycosyltransferases in exopolysaccharide production by lactic acid bacteria. Int. J. Biol. Macromol. 184, 1014–1025. doi: 10.1016/j.ijbiomac.2021.06.131
Stuart R. K., Mayali X., Lee J. Z., Craig Everroad R., Hwang M., Bebout B. M., et al. (2016). Cyanobacterial reuse of extracellular organic carbon in microbial mats. ISME J. 10, 1240–1251. doi: 10.1038/ismej.2015.180
Sun L. Q., Wang C. H., Shi Q. J., and Ma C. H. (2009). Preparation of different molecular weight polysaccharides from Porphyridium cruentum and their antioxidant activities. Int. J. Biol. Macromol. 45, 42–47. doi: 10.1016/j.ijbiomac.2009.03.013
Wang W. N., Li T., Li Y., Zhang Y., Wu H. L., Xiang W. Z., et al. (2021). Exopolysaccharides from the energy microalga strain Botryococcus braunii: Purification, characterization, and antioxidant activity. Foods 11, 110. doi: 10.3390/foods11010110
Wang X., Zhang L. H., Wu J. L., Xu W. Q., Wang X. Q., and Lü X. (2017). Improvement of simultaneous determination of neutral monosaccharides and uronic acids by gas chromatography. Food Chem. 220, 198–207. doi: 10.1016/j.foodchem.2016.10.008
Wang X. M., Zhang Z. S., Yao Q., Zhao M. X., and Qi H. M. (2013). Phosphorylation of low-molecular-weight polysaccharide from Enteromorpha linza with antioxidant activity. Carb. Polym. 96, 371–375. doi: 10.1016/j.carbpol.2013.04.029
Wilawan B., Chan S. S., Ling T. C., Show P. L., Ng E.-P., Jonglertjunya W., et al. (2024). Advancement of carotenogenesis of astaxanthin from Haematococcus pluvialis: Recent insight and way forward. Mol. Biotechnol. 66, 402–423. doi: 10.1007/s12033-023-00768-1
Xiao R. and Zheng Y. (2016). Overview of microalgal extracellular polymeric substances (EPS) and their applications. Biotechnol. Adv. 34, 1225–1244. doi: 10.1016/j.bioteChadv.2016.08.004
Yaakob M. A., Mohamed R. M. S. R., Al-Gheethi A., Aswathnarayana Gokare R., and Ambati R. R. (2021). Influence of nitrogen and phosphorus on microalgal growth, biomass, lipid, and fatty acid production: An overview. Cells. 10, 393. doi: 10.3390/cells10020393
Yang Y. N., Ge S. H., Pan Y. T., Qian W. Y., Wang S. N., Zhang J., et al. (2023). Screening of microalgae species and evaluation of algal-lipid stimulation strategies for biodiesel production. Sci. Total Environ. 857, 159281. doi: 10.1016/j.scitotenv.2022.159281
Young E. B. and Beardall J. (2003). Photosynthetic function in Dunaliella Tertiolecta (Chlorophyta) during a nitrogen starvation and recovery cycle. J. Phycol. 39, 897–905. doi: 10.1046/j.1529-8817.2003.03042.x
Zarrinmehr M. J., Farhadian O., Heyrati F. P., Keramat J., Koutra E., Kornaros M., et al. (2020). Effect of nitrogen concentration on the growth rate and biochemical composition of the microalga, Isochrysis galbana. Egypt J. Aquat. Res. 46, 153–158. doi: 10.1016/j.ejar.2019.11.003
Keywords: Porphyridium, nitrogen, photosynthetic efficiency, exopolysaccharides, biochemical composition
Citation: Li Q, Xu J, Chen Y, Xiang W, Wu H, Gan S, Li A and Li T (2025) Effect of nitrogen concentration on the yield and biochemical characteristics of exopolysaccharide of Porphyridium purpureum. Front. Mar. Sci. 12:1603109. doi: 10.3389/fmars.2025.1603109
Received: 31 March 2025; Accepted: 05 May 2025;
Published: 21 May 2025.
Edited by:
Santhiyagu Prakash, Tamil Nadu Fisheries University, IndiaReviewed by:
Priscilla Bezerra, Université Clermont Auvergne, FranceManikandan Gurusamy, Tshwane University of Technology, South Africa
Subham Chakraborty, Sathyabama Institute of Science and Technology, India
Junxiang Lai, Guangxi Academy of Sciences, China
Copyright © 2025 Li, Xu, Chen, Xiang, Wu, Gan, Li and Li. This is an open-access article distributed under the terms of the Creative Commons Attribution License (CC BY). The use, distribution or reproduction in other forums is permitted, provided the original author(s) and the copyright owner(s) are credited and that the original publication in this journal is cited, in accordance with accepted academic practice. No use, distribution or reproduction is permitted which does not comply with these terms.
*Correspondence: Tao Li, dGFvbGlAc2NzaW8uYWMuY24=; Aifen Li, dGlnZXJAam51LmVkdS5jbg==