Abstract
To investigate the impact of freshwater discharge variations from the Nanliu River on the phytoplankton community structure in Lianzhou Bay, we conducted surveys of total chlorophyll-a (Tchl-a) concentrations and specific pigment groups during wet and dry seasons of 2016. During wet season, freshwater discharge introduced substantial freshwater, nutrients, and suspended particulate matter into Lianzhou Bay. Due to reduced light availability, Tchl-a concentrations at most stations were lower compared to dry season. The result indicated that light availability often exerts a greater influence than nutrient availability in estuarine environments. Furthermore, the spatial distribution of Tchl-a concentrations in Lianzhou Bay is correlated with the feeding activities of bivalve aquaculture and water movement within the bay. During the high-water period, the phytoplankton community was primarily composed of diatoms (35.0%), cyanobacteria (21.0%), prasinophytes (13.0%), chlorophytes (19.0%), and cryptophytes (11.0%). In contrast, the low-water period saw a phytoplankton community dominated by diatoms (62.0%), prasinophytes (18.0%), cyanobacteria (12.0%), and cryptophytes (7.0%). The absence of osmotic regulation in chlorophytes restricts their distribution primarily to estuarine environments characterized by high water availability. In contrast, diatoms exhibit a greater affinity for well-illuminated conditions, thereby contributing significantly to primary productivity in neritic zones and during periods of low water flow.
1 Introduction
Estuarine systems represent some of the most productive and dynamic ecosystems on Earth (Paerl, 2006). Estuaries serve as significant conduits for organic carbon, primarily due to their terrestrial connectivity. This linkage facilitates the transport of allochthonous organic matter via fluvial runoff, concurrently supplying essential nutrients that underpin primary productivity (Godrijan et al., 2013). Phytoplankton, as a critical indicator of aquatic ecosystem integrity, exerts substantial influence on biogeochemical cycles, contributing to roughly half of the global primary productivity (Cabrerizo et al., 2017). As primary producers, phytoplankton form the base of the food web, supporting secondary and tertiary production in estuarine environments.
Phytoplankton biomass and community structure dynamics are influenced by environmental factors including nutrient concentrations, turbidity, salinity, and hydrodynamics within estuarine systems (Bharathi et al., 2022; Mo et al., 2024). In offshore environments, phytoplankton biomass is often primarily regulated by nutrient availability (Zhu et al., 2009). Estuaries receive significant nutrient and biogenic substance inputs from rivers, which promote phytoplankton proliferation (Cabrerizo et al., 2017). Phytoplankton biomass distribution in some estuarine areas positively correlates with nutrient concentration gradients (Goebel et al., 2006). Conversely, in nearshore regions, where turbidity is high, light limitation usually becomes the primary factor controlling phytoplankton biomass (Cloern, 1987; Bharathi et al., 2022). Terrestrial runoff profoundly influences estuarine ecosystems through the introduction of allochthonous mineral sediments. This input can subsequently limit primary production within the photic zone, thereby impeding efficient nutrient assimilation by phytoplankton communities (Gazeau et al., 2005). Phytoplankton biomass gradients in estuarine environments are significantly influenced by fluctuations in suspended particulate matter (SPM), generally demonstrating a decline from the riverine to the marine interface. Phytoplankton productivity peaks near the estuary’s mouth, whereas it diminishes near SPM sources or within the maximum turbidity zone. Furthermore, fluctuations in wind force can also influence phytoplankton’s access to light energy. Wind action disrupts the water column’s stratification, leading to the suspension of sediments (Cloern and Jassby, 2012). Additionally, salinity variations impact phytoplankton community dynamics in estuarine regions (Lionard et al., 2005; Jiang et al., 2014; Xu et al., 2022), driving a shift in community composition from freshwater to marine algae. Freshwater algae may experience mortality upon entering oligohaline and mesohaline zones due to their inability to withstand abrupt osmotic pressure increases (Wang and Zhang, 2020). In summary, a strong correlation exists between river discharge and phytoplankton biomass and distribution. On one hand, rivers serve as a source of nutrients and low-density freshwater, which stratifies in the estuary, creating horizontal density gradients that drive gravitational circulation and sustain phytoplankton biomass within the estuary (Abreu et al., 2009; Ara et al., 2011). On the other hand, riverine inputs also introduce substantial sediment loads (Tao et al., 2020) and colored dissolved organic matter (Lawrenz et al., 2013), thereby limiting phytoplankton growth.
Phytoplankton pigments are crucial chemical compounds in phytoplankton photosynthesis, thus providing valuable insights into parameters such as biomass, community structure, and prevailing environmental conditions. Specific phytoplankton functional groups can be classified based on diagnostic pigments, including fucoxanthin (fucox), peridinin (perid), chlorophyll b (chl b), phycobilins (phyco), and prasinoxanthin (pras) (Xiao et al., 2018). The abundance of these functional groups can vary in response to environmental changes (Barlow et al., 2007). For instance, large phytoplankton, such as diatoms, are typically the dominant group in estuaries and coastal regions with high nutrient concentrations (Sarthou et al., 2005), and thus their associated pigments, such as fucox, are relatively high in these areas (Wysocki et al., 2006). In contrast, pigments associated with prokaryotes, such as zeaxanthin (zeax), are usually found in nutrient-poor waters (Gibb et al., 2000). Pigment analysis by high-performance liquid chromatography (HPLC) can detect pigment components from pico-phytoplankton to micro-phytoplankton, which is more advantageous than microscopic identification (Havskum et al., 2004). Pigment detection based on the HPLC method had been widely used to study the characteristics of phytoplankton in marine ecosystems (Paerl et al., 2003; Wang et al., 2018; Eker-Develi et al., 2023; Mo et al., 2024).
Lianzhou Bay is a semi-enclosed coastal embayment located in the northern waters of the Beibu Gulf (Ye et al., 2017; Zhang et al., 2022). The Nanliu River, a major watercourse along the northern coast of the Beibu Gulf, flows through several cities including Yulin, Qinzhou, and Beihai. Accelerated urbanization has led to ecological degradation, severe soil erosion, and substantial nutrient inputs into the river system, consequently altering the nutrient dynamics and structural composition in Lianzhou Bay (Li et al., 2017; Zhang et al., 2022). As a characteristic temperate estuarine ecosystem, understanding the seasonal variations in Nanliu River discharge and their ecological impacts on Lianzhou Bay is of considerable importance (Li et al., 2017; Tong et al., 2022). Current research on phytoplankton community structure in Lianzhou Bay remains limited, with most previous studies treating the bay as a subsidiary research area within the northern coastal waters of the Beibu Gulf (Lao et al., 2021; Wang et al., 2024). Ye et al. (2017) investigated phytoplankton community structure and influencing factors in the middle-lower reaches and estuary of the Nanliu River during normal water periods. Tan et al. (2025) evaluated the relationship between Tchl-a concentration and environmental factors such as antibiotics in aquaculture zones, analyzing the spatial distribution of Tchl-a in Lianzhou Bay. However, these studies did not address seasonal variations in Tchl-a concentration or phytoplankton community structure. As the largest freshwater river discharging into the sea in Guangxi, China, the Nanliu River exhibits pronounced seasonal discharge characteristics, with wet season (summer-half year) runoff accounting for over 70.00% of the annual total (Li et al., 2017). Yu et al. (2016) demonstrated through water age studies that residence times in Lianzhou Bay were 70 days during dry seasons and 45 days during wet seasons. Nevertheless, research remains scarce regarding how seasonal variations in Nanliu River discharge influence phytoplankton community structure in Lianzhou Bay. This study therefore aims to address two primary scientific questions: (1) the phytoplankton community structure and distribution in Lianzhou Bay during both wet and dry seasons; and (2) the key factors driving spatial variability in phytoplankton biomass and community composition within the bay.
2 Materials and methods
2.1 Study area
Lianzhou Bay, one of the five largest bays in the Guangxi Zhuang Autonomous Region of China, spans 215 km2 (Figure 1A). The study area is characterized by shallow water depths (average depth of 5 m) and is strongly influenced by tidal dynamics. Tidal currents dominate water movement within the bay, with a primary pattern of reversing tidal flows (Sun et al., 2014). Under the influence of the East Asian monsoon, the study region is dominated by the southwest monsoon in spring and summer, while the northeast monsoon prevails in autumn and winter. The ecological environment of Lianzhou Bay is impacted by the economic activities of approximately 320,000 residents within the Nanliu River basin (Li et al., 2017). As the largest freshwater river discharging into the ocean in Guangxi Zhuang Autonomous Region, the Nanliu River exhibits distinct seasonal flow patterns, characterized by maximum discharge during the summer months (June-August) (Li et al., 2017), followed by a dry season with markedly reduced flow from October through May of the subsequent year. The upper reaches of the Nanliu River are primarily used for agriculture, while areas near the coast are used for aquaculture. Sediments from the Nanliu River are the primary source of material for Lianzhou Bay (Zhang et al., 2022).
Figure 1
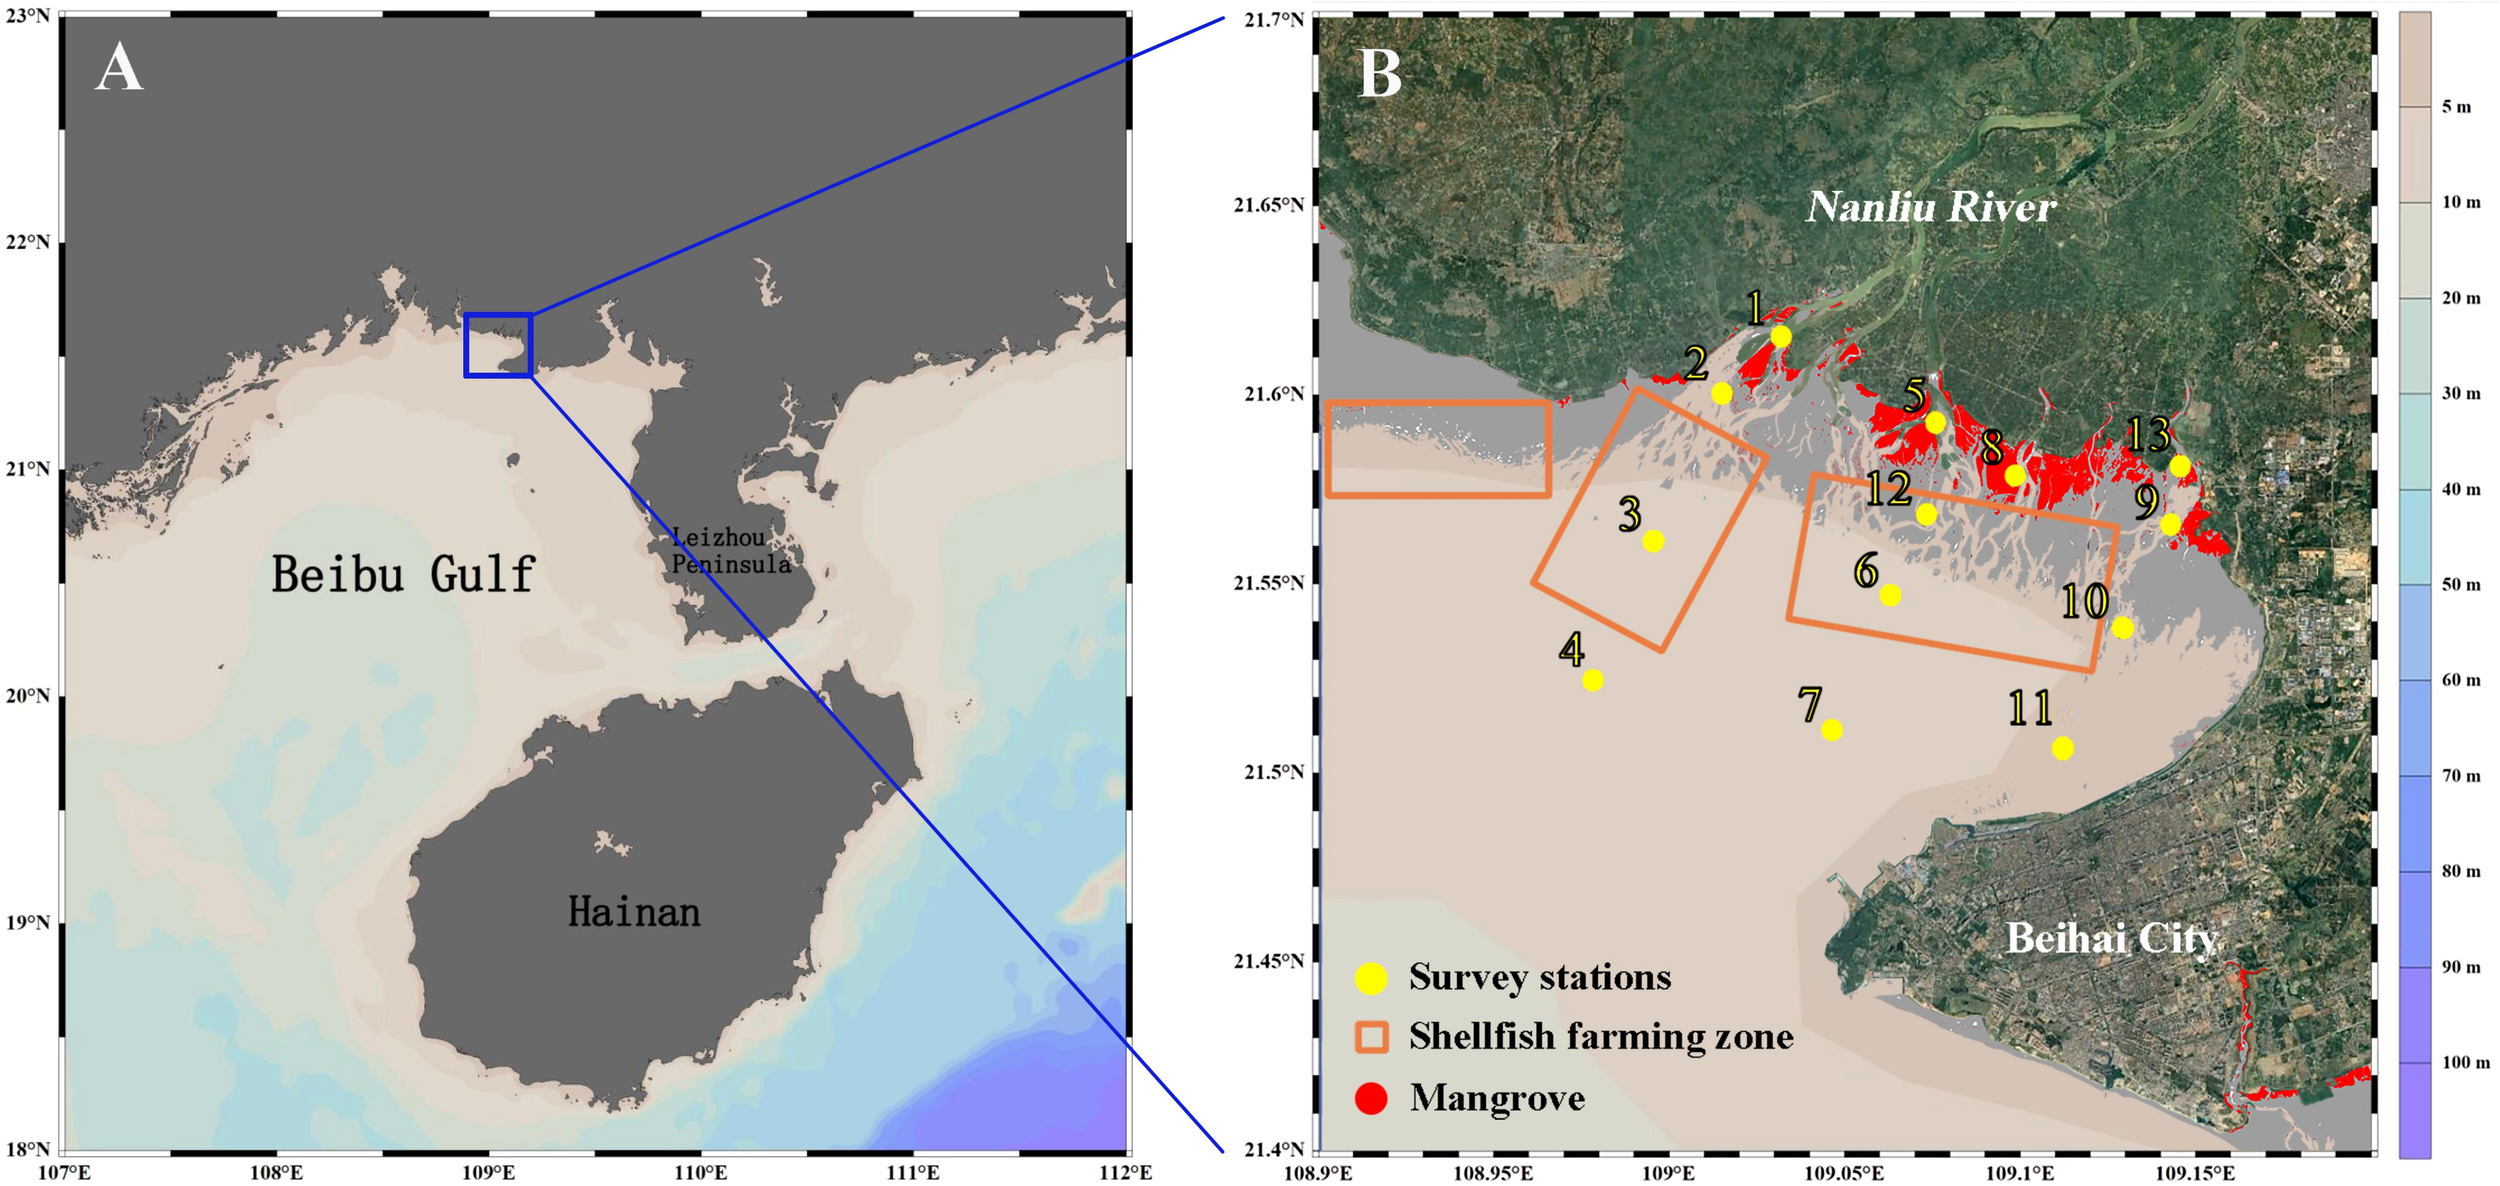
Study area and sampling sites in Lianzhou Bay, Guangxi, China, (A) location of the Lianzhou Bay and the Beibu Gulf, (B) survey stations, distribution map of shellfish farming zone and mangroves in the Lianzhou Bay.
Furthermore, the bay provides a diverse habitat for various aquatic organisms, encompassing biological resources such as mangroves (Liu et al., 2024). The bay also supports numerous aquaculture farms of varying scales, with the main cultivated species being bivalves such as oysters, clams, and scallops (Figure 1B).
2.2 Sample collection and analysis
The field survey was conducted in Lianzhou Bay during July (wet season) and November (dry season) of 2016, with 13 sampling stations established for phytoplankton photosynthetic pigment collection. Among these, Stations 3, 6, and 12 were located within aquaculture areas (Figure 1B). Surface seawater samples (3 L) were collected using a Niskin bottle for photosynthetic pigment analysis.
Seawater temperature, salinity and dissolved oxygen (DO) were measured in situ using a YSI EXO2 multi-parameter water quality sonde (YSI Inc., Ohio, USA). Transparency was measured using the Secchi disk method. A 0.5 L seawater sample was filtered through a pre-cleaned 0.45 μm cellulose acetate membrane and stored at 4°C. Nutrient analysis was performed immediately upon return to the laboratory. Concentrations of ammonia nitrogen (NH4+-N), nitrate nitrogen (NO3−-N), nitrite (NO2−-N), phosphate (PO43−), and silicate (SiO32−) were determined using the colorimetric method specified in the “Specification for Oceanographic Survey Part 4: Investigation of Chemical Elements in Seawater” (General Administration of Quality Supervision, Inspection and Quarantine of the People’s Republic of China, 2007). Dissolved inorganic nitrogen (DIN) was calculated as the sum of NH4+-N, NO3−-N, and NO2−-N. The precipitation data were obtained from the Asia-Pacific Data-Research Center (APDRC) with a spatial resolution of 1°×1°.
Photosynthetic pigment samples were stored in a cool, dark place after collection and were immediately filtered upon return to the laboratory. Water samples (2–3 L) were collected on 0.7 μm GF/F filters, with a filtration negative pressure of less than 0.6 atm (1 atm = 101325 Pa). The filters were folded and placed in aluminum foil bags and stored in liquid nitrogen. The filters were thawed between filter papers, and excess water was absorbed. 2 mL of N, N-dimethylformamide (DMF) was used as the extraction solvent. The samples were placed in the dark at -20°C for 2 hours to fully extract the pigments. After thorough mixing, the samples were centrifuged (5 min, 4 kg, -4°C), and the supernatant was collected. The supernatant was filtered through a 13 mm syringe filter (Millipore) with a GF/F filter, and the filtrate (2 mL) was collected in a brown chromatographic vial. The entire process was conducted under low light intensity and low-temperature conditions to minimize pigment degradation.
2.3 Phytoplankton pigments analysis
2.3.1 Pigment extraction
During the extraction procedure, residual seawater was first removed from the filter membrane, which was then fragmented. Subsequently, 3 mL of DMF was added, and the mixture was kept in the dark at -20°C for 1 hour for extraction (Furuya et al., 1998). The extract was then oscillated for several seconds in a dark room, and the supernatant was collected. The supernatant was filtered through a 13 mm diameter Whatman GF/F filter membrane (Swinnex Filter Holder). A 0.6 mL aliquot of the filtered supernatant was mixed with 0.6 mL of 1 mol/L ammonium acetate in a 1.5 mL brown chromatographic vial, and the mixture was stored in the dark at -20°C until HPLC analysis. DMF was selected as the organic extraction solvent for photosynthetic pigments in this study due to its rapid extraction speed, high recovery rate, and superior extraction efficiency compared to other reagents such as methanol and acetone (Furuya et al., 1998; Zapata et al., 2000).
2.3.2 HPLC analysis
The analysis was performed using a Shimadzu LC20A liquid chromatography workstation equipped with a diode array detector (DAD) to detect the elution peaks, with a scanning range of 300–700 nm. Peak spectral characteristics were recorded at fixed wavelengths of 440 nm and 663 nm. A 3.5 μm particle size Eclipse XDB-C8 separation column (100 × 4.6 mm; Agilent Technologies, Germany) was used. Mobile phase A consisted of a 4:1 (v/v) mixture of methanol and 1 mol/L ammonium acetate buffer, and mobile phase B was methanol. The gradient elution program is shown in Table 1, with a flow rate of 1 mL/min. The interval between each sample injection and the start of the program was 10 min to ensure complete equilibration of the column’s polarity (Mendes et al., 2007).
Table 1
| Time/min | Mobile phase A/% | Mobile phase B/% | Gradient system |
|---|---|---|---|
| 0 | 100 | 0 | Injection |
| 2 | 100 | 0 | Linear gradient |
| 16 | 55 | 45 | Linear gradient |
| 27 | 0 | 100 | Linear gradient |
| 32 | 0 | 100 | Linear gradient |
| 36 | 100 | 0 | Balance |
The linear gradient elution procedure of HPLC-pigment analysis.
2.3.3 Photosynthetic pigments qualitative analysis
Photosynthetic pigment standards for qualitative and quantitative analyses were purchased from DHI (DK 2970 Hørsholm, Denmark). The retention times (tR) and absorption spectra (300–800 nm) of various photosynthetic pigments were determined through HPLC analysis of the standards. Qualitative analysis of environmental samples was performed by referencing the standard pigment spectral scans and parameters such as tR and maximum absorption wavelengths provided in the literature (Zapata et al., 2000; Mendes et al., 2007). Due to differences in the gradient elution program used in the chromatographic analysis compared to that in the relevant literature, the tR values also varied, although the overall order remained consistent.
2.3.4 Photosynthetic pigments quantitative analysis
The method of Stoń and Kosakowska was referenced for the chromatographic analysis of pigment standards at different dilution concentrations (Ston and Kosakowska, 2000). The light absorption signals of each pigment at a wavelength of 440 nm were measured at different concentrations. A linear regression was then performed with the concentrations, and the slope was used as the conversion factor (fp) for each pigment concentration. After obtaining the fp for each pigment, the concentration was calculated using the formula Cp=ApfpVext/VinjVfiltB. In the formula, Cp represents the pigment concentration, in mg/m3. Ap is the peak area of each pigment elution, in mAU·s. fp is the slope of the linear regression equation of each pigment concentration and peak area, in mg/mAU. Vext is the volume of the sample extraction liquid, in mL. Vfilt is the volume of filtered seawater sample, in L. Vinj is the injection volume for HPLC analysis, in μL. B is the dilution factor of the buffer solution.
2.3.5 Phytoplankton community composition using diagnostic pigments analysis
Based on the detected types of diagnostic pigments, the phytoplankton groups were primarily classified into diatoms, dinoflagellates, cryptophytes, prymnesiophytes, chrysophytes, chlorophytes, prasinophytes, and cyanobacteria. The abundance of each phytoplankton group was mainly determined through the CHEMTAX matrix factorization program, using 12 characteristic pigments, and expressed as total chl-a (Tchl-a) biomass (ng/L). CHEMTAX starts from the initial pigment ratios of algae to Tchl-a and then optimizes a pigment ratio matrix for each algal species iteratively using the steepest descent algorithm, based on the raw pigment data obtained from HPLC analysis, to quantitatively determine the phytoplankton community composition and abundance. The initial values of the characteristic photosynthetic pigment to Tchl-a ratios for each phytoplankton group are provided in the literature (Mackey et al., 1996) (Table 2).
Table 2
| Algae | Perid | 19-butfu | Fucox | 19-hexfu | Neox | Pras | Diad | Violax | Allox | Zeax | Chl b |
|---|---|---|---|---|---|---|---|---|---|---|---|
| Initial ratio | |||||||||||
| Prasinophytes | 0.046 | 0.320 | 0.060 | 0.030 | 0.890 | ||||||
| Dinoflagellates | 0.530 | 0.140 | |||||||||
| Cryptophytes | 0.229 | ||||||||||
| Haptophyceae | 1.705 | 0.080 | |||||||||
| Crysophytes | 0.370 | 0.360 | 0.068 | ||||||||
| Chlorophytes | 0.063 | 0.054 | 0.009 | 2.263 | |||||||
| Cyanobacteria | 0.347 | ||||||||||
| Diatoms | 0.460 | 0.240 | |||||||||
| Optimize ratio | |||||||||||
| Prasinophytes | 0.031 | 0.280 | 0.050 | 0.020 | 0.370 | ||||||
| Dinoflagellates | 0.505 | 0.100 | |||||||||
| Cryptophytes | 0.440 | ||||||||||
| Haptophyceae | 0.610 | 0.040 | |||||||||
| Crysophytes | 0.170 | 0.270 | 0.088 | ||||||||
| Chlorophytes | 0.060 | 0.050 | 0.010 | 0.360 | |||||||
| Cyanobacteria | 0.330 | ||||||||||
| Diatoms | 0.430 | 0.073 | |||||||||
Input pigment: Chl-a ratios and output values for CHEMTAX analysis.
Perid, peridinin; 19’-butfu, 19’-but-fucoxanthin; Fucox, fucoxanthin; 19’-hexfu, 19’-hex-fucoxanthin; Neox, neoxanthin; Pras, prasinoxanthin; Diad, diatoxanthin; Violax, violaxanthin; Allox, alloxanthin; Zeax, zeaxanthin; Chl b, chlorophyll b; Chl a, chlorophyll a; et seq.
2.4 Data analysis
Mapping was performed using ODV 5.3.0, Surfer 16.0 and Excel 2016. Pearson correlation heatmaps were generated using the pheatmap package in R statistical software.
3 Results
3.1 Environmental parameters
3.1.1 Hydrological parameters
Spatially, salinity exhibited a decreasing gradient from the Nanliu River estuary toward the open sea during the investigation period (Figures 2A, E). During the wet season, the monthly average rainfall reached 8.27 mm/d (Table 3), and the substantial freshwater discharge resulted in a predominantly freshwater-dominated estuary, with limited salinity variation (0-6.5). The low-salinity water extended as far as Station 12 in the central part of the study area. In contrast, during the dry season, reduced rainfall (5.83 mm/d) led to significantly higher salinity (21.46) across the study area. The influence of low-salinity water was confined to Station 5 (Figure 3). Unlike salinity, temperature displayed pronounced spatiotemporal variations (Figures 2B, F). During the wet season, the mean temperature reached 30.17°C, with the highest temperatures recorded along the northeastern coast and the lowest at the western distributary of the Nanliu River estuary. In the dry season, temperatures decreased to 25.92°C, peaking in the western study area and reaching their minimum near the southeastern estuary. Based on salinity distribution, the study area was classified into two zones: an estuarine zone (salinity<15) and an offshore zone (salinity≥15). Accordingly, Stations 1, 2, 5, 8, 9, 12, and 13 were categorized as the estuarine zone, while the remaining stations were assigned to the offshore zone.
Figure 2
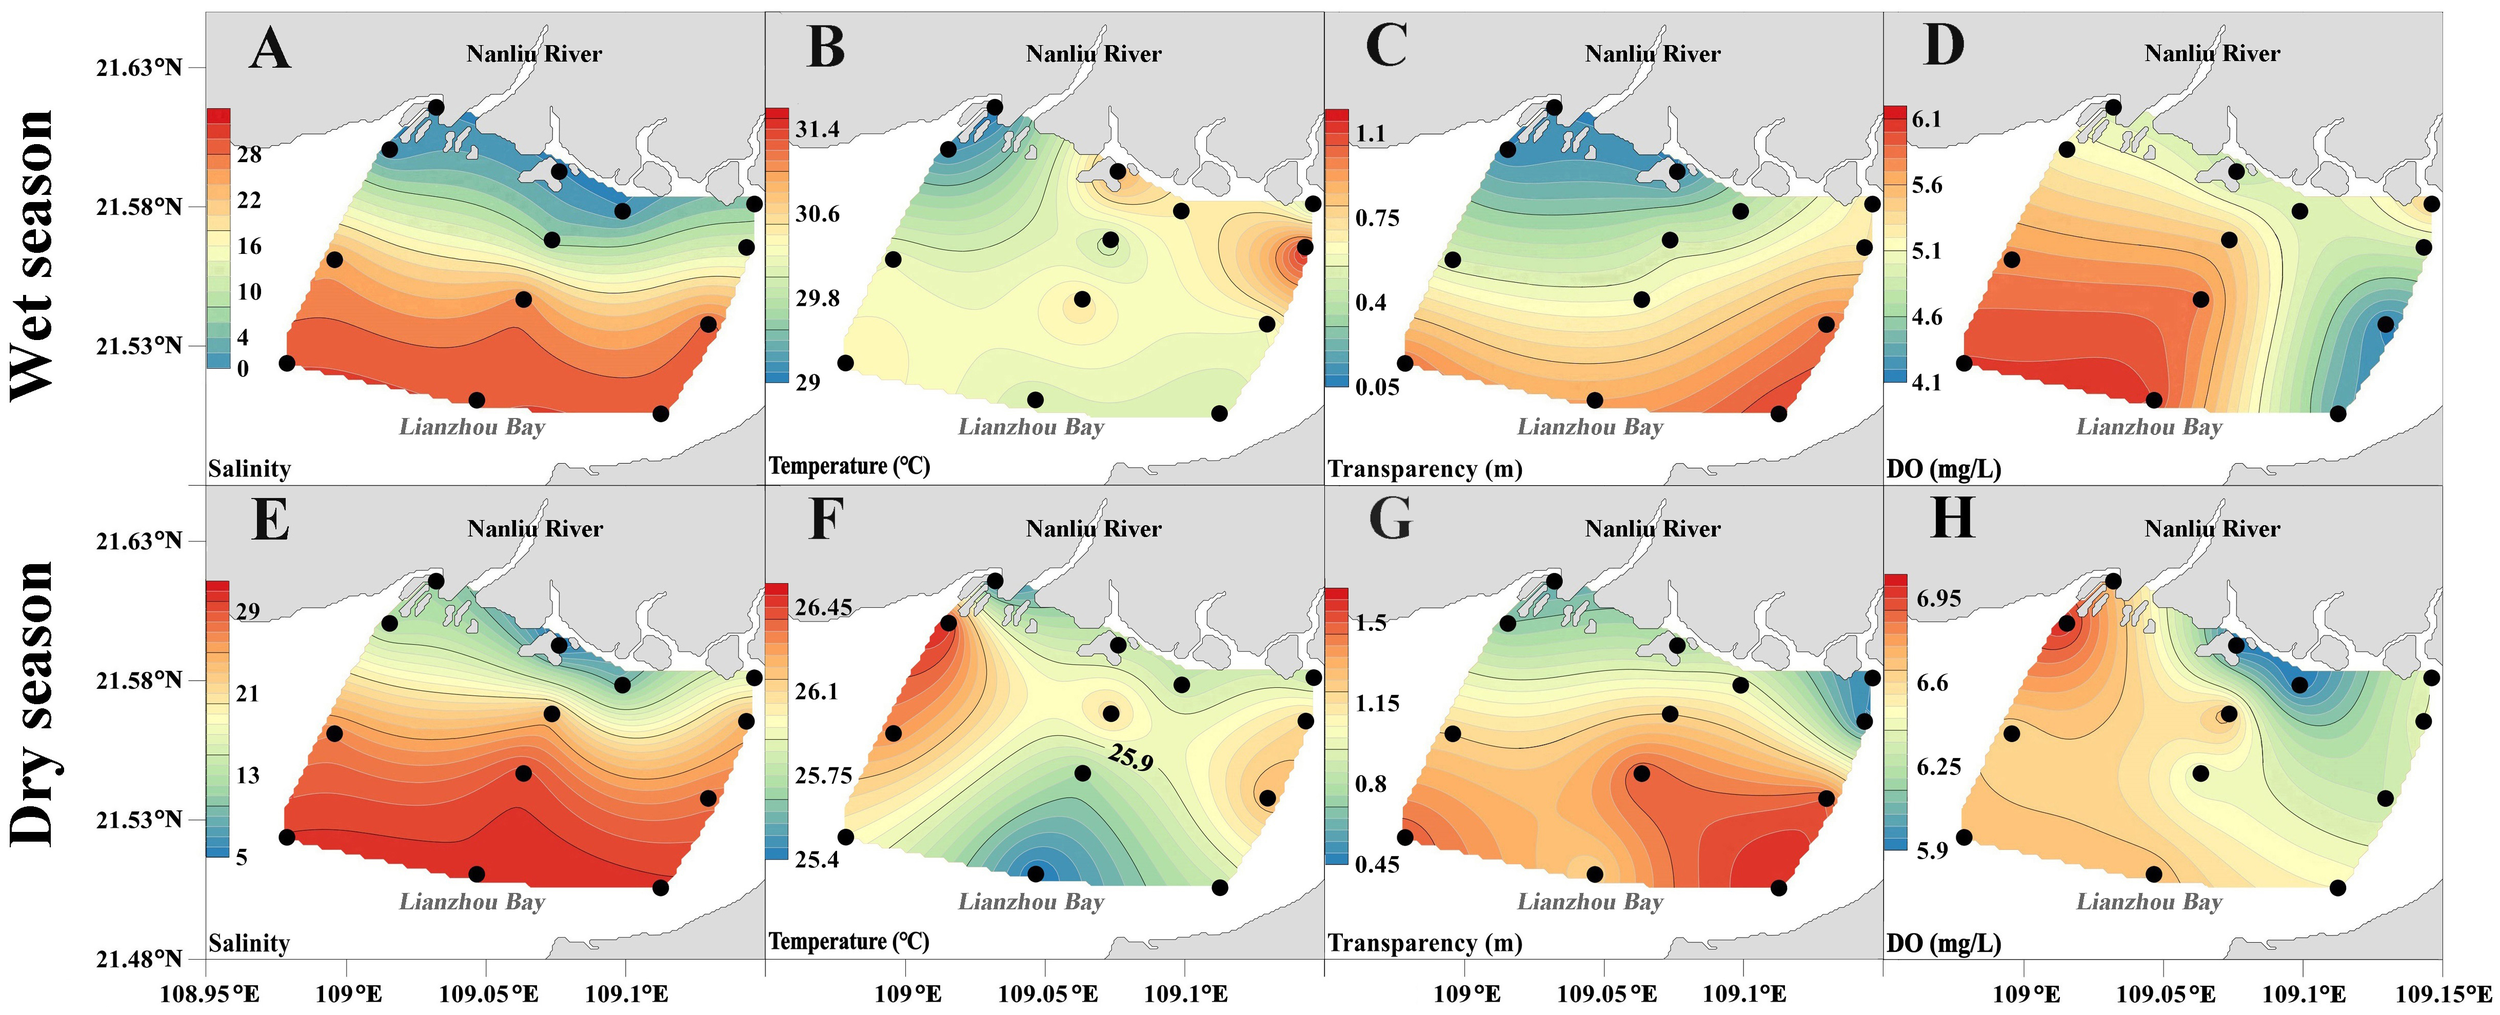
Spatial variation of salinity, temperature, transparency and DO in the study area, (A–H) spatial distribution, black dots indicate measurement points.
Table 3
| Parameters | Items | Wet season | Dry season |
|---|---|---|---|
| Temperature (°C) | Range | 29.00-31.50 | 25.40-26.50 |
| Average | 30.17 ± 0.64 | 25.92 ± 0.33 | |
| Salinity | Range | 0.00-29.8 | 5.30-30.30 |
| Average | 14.84 ± 13.23 | 21.46 ± 8.97 | |
| DO (mg/L) | Range | 4.17-6.01 | 5.90-7.00 |
| Average | 5.21 ± 0.60 | 6.48 ± 0.32 | |
| Transparency (m) | Range | 0.10-1.10 | 0.50-1.60 |
| Average | 0.36 ± 0.36 | 1.06 ± 0.41 | |
| DIN (mg/L) | Range | 0.071-1.547 | 0.003-1.125 |
| Average | 0.840 ± 0.630 | 0.475 ± 0.420 | |
| PO43− (mg/L) | Range | 0.007-0.115 | 0.003-0.068 |
| Average | 0.059 ± 0.040 | 0.035 ± 0.018 | |
| SiO32− (mg/L) | Range | 0.840-3.130 | 0.280-2.610 |
| Average | 1.969 ± 0.840 | 1.230 ± 0.840 | |
| N/P | Range | 4.77-23.09 | 1.00-29.96 |
| Average | 13.38 ± 5.84 | 12.51 ± 10.08 | |
| Rainfall (mm/d) | Range | 0.00-34.55 | 0.00-18.48 |
| Average | 8.27 | 5.83 |
Range and mean values (± SD) of environmental factors during the wet and dry season.
Figure 3
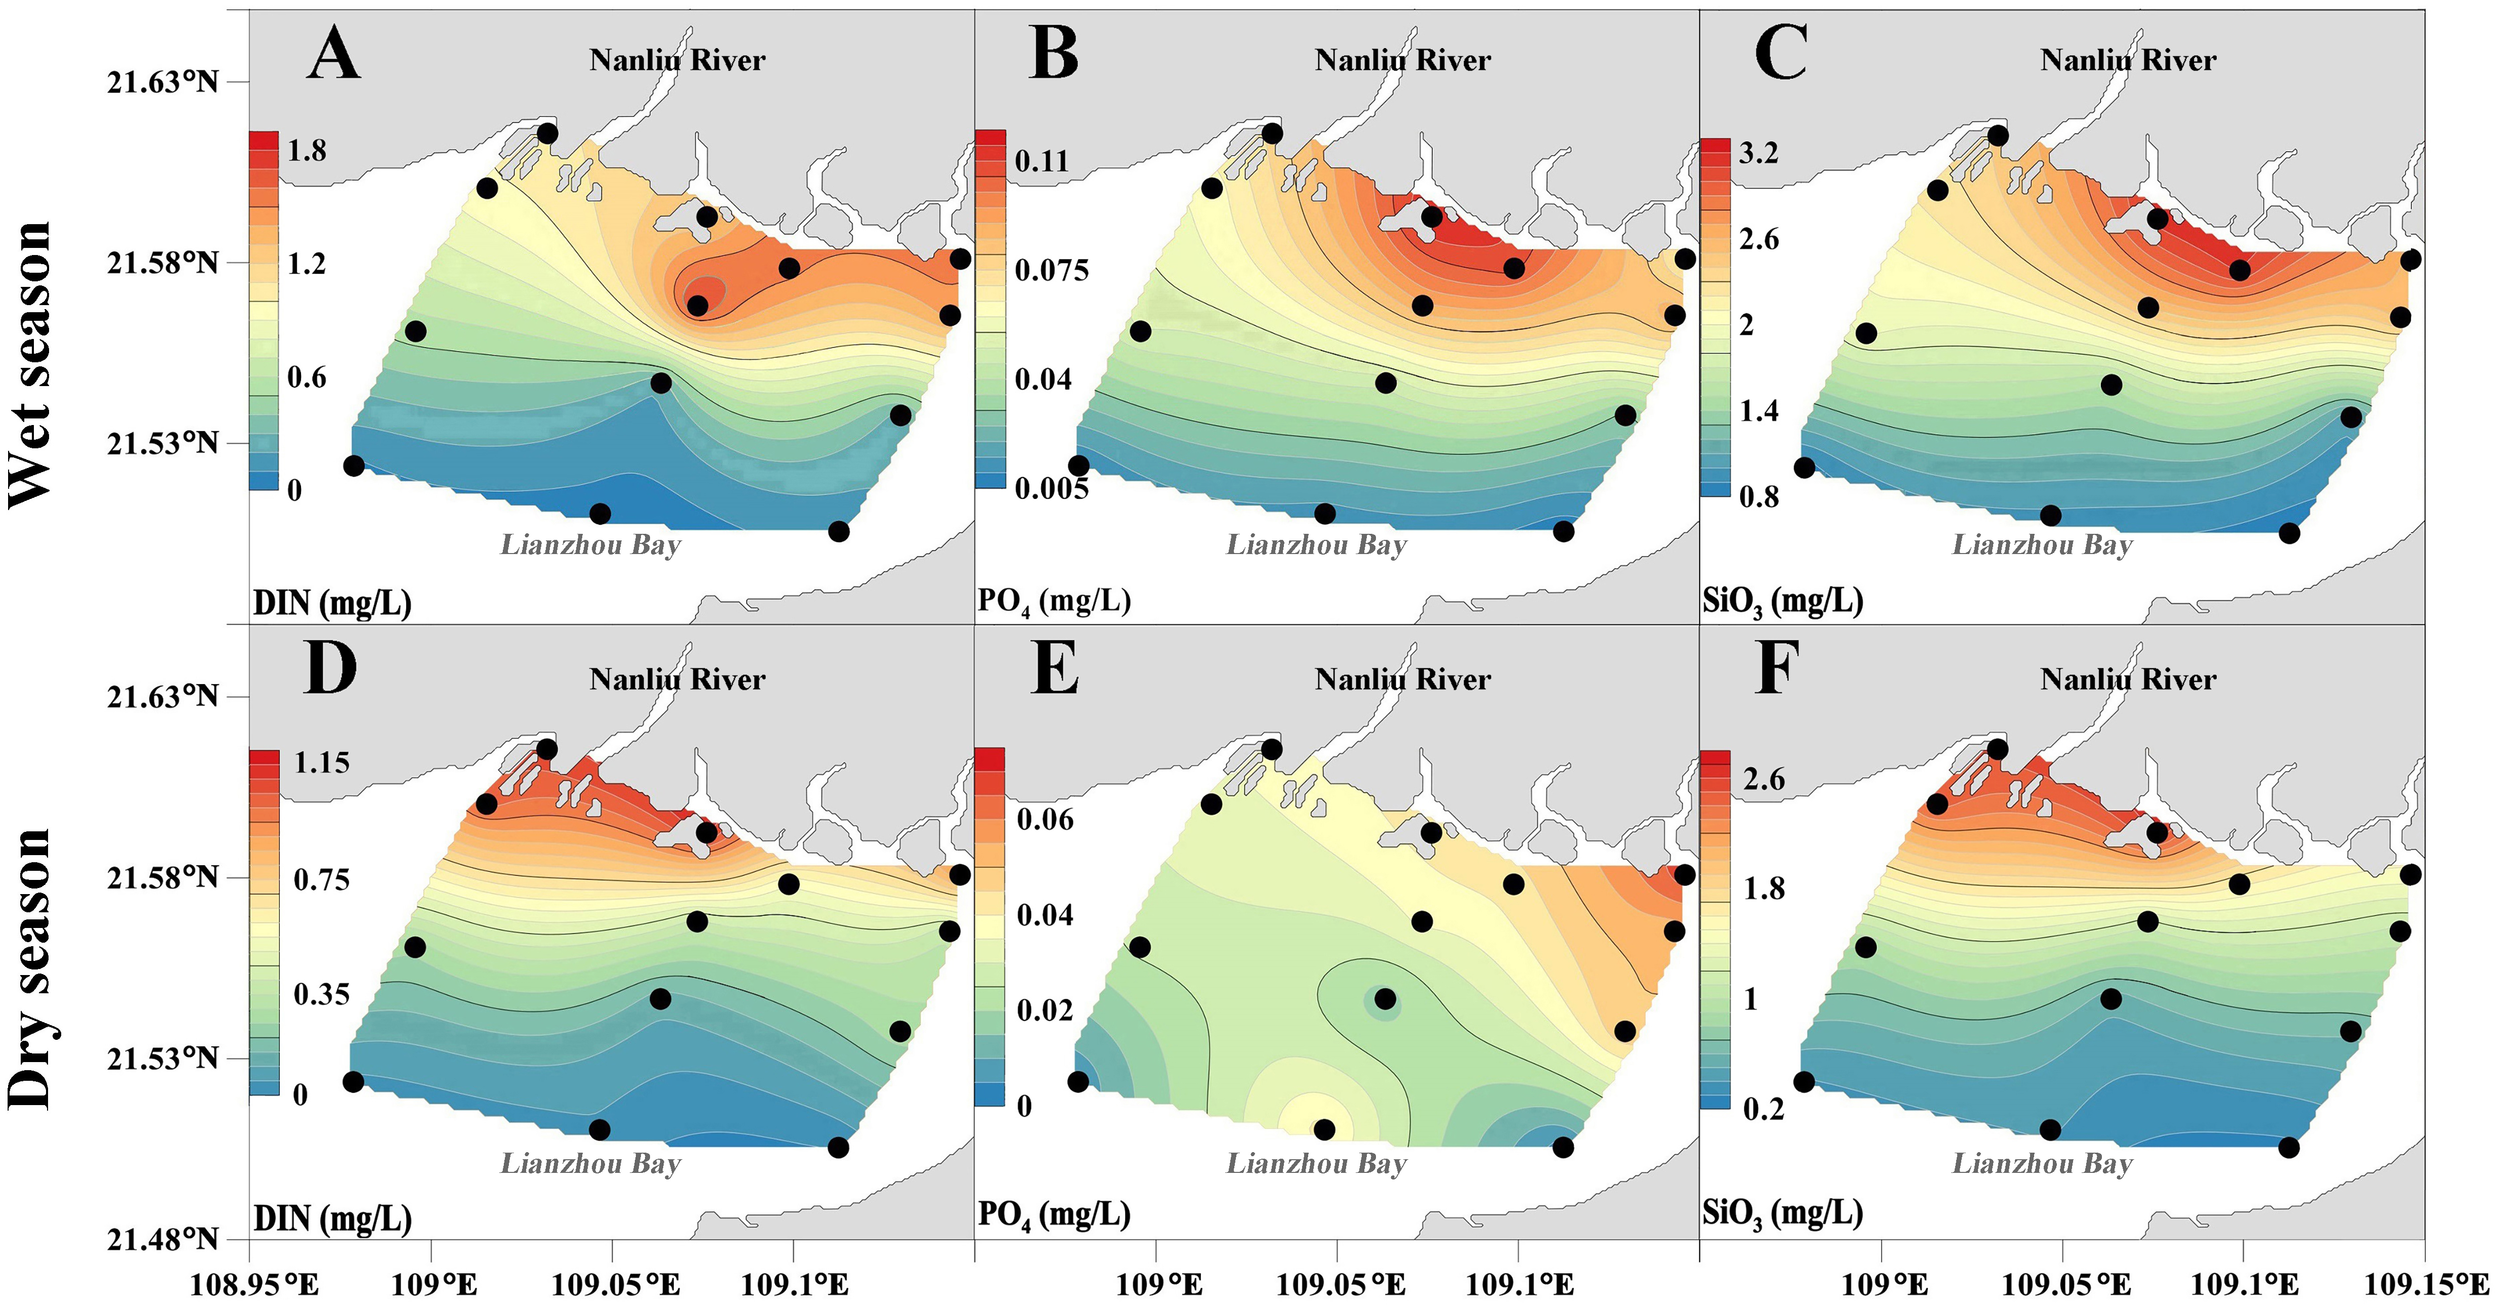
Spatial variation of DIN, PO43−, and SiO32−in the study area, (A–F) spatial distribution, black dots indicate measurement points.
During the survey period, the distribution of seawater transparency showed an increasing trend from the estuary towards the sea, with the highest transparency areas located at the southeast entrance to the sea (Figures 2C, G). The transparency of the surveyed sea area was low during the high-flow period, with an average value of 0.36 m. The transparency in the estuarine area was only 0.13 m. During the dry season, the transparency of the surveyed sea area increased to 1.06 m, and the transparency in the estuarine and offshore areas increased to 0.76 m and 1.42 m, respectively (Table 3).
The spatial and temporal variations in DO concentration were significant (Figures 2D, H). During the high-flow period, the mean DO concentration was only 5.21 mg/L, with a fluctuation range of 4.17-6.01 (Table 3). Its high values appeared in the southwest of the surveyed sea area, and low values appeared in the area near the Beihai City. During the dry season, the DO fluctuation range was 5.90-7.00, with its high values appearing in the northwest of the surveyed sea area, and the low-value area appearing in the estuarine area.
3.1.2 Nutrients
During the survey period, the concentrations of DIN, PO43−, and SiO32− showed a decreasing trend from the estuary towards the sea during the high-flow period, and the high-value areas were concentrated in the estuarine area (Figures 3A–C). The proportion of NO3−-N in DIN decreased from the estuarine area to the offshore area, with values of 78.41% and 56.39%, respectively. The proportion of NH4+-N in DIN increased from the estuarine area to the offshore area, with values of 10.86% and 33.88%, respectively (Figure 4A). Compared with the high-flow period, the concentrations of DIN, PO43−, and SiO32− decreased during the dry season (Table 3). The concentrations of DIN and SiO32− were concentrated in the northwest of the surveyed sea area, while the concentration of PO43− was concentrated in the northeast of the surveyed sea area (Figures 3D–F). NO3−-N accounted for 78.16% and 64.46% of DIN in the estuarine and offshore waters, respectively, while NH4+-N accounted for 17.50% and 32.76% of DIN in the estuarine and offshore waters, respectively (Figure 4B).
Figure 4
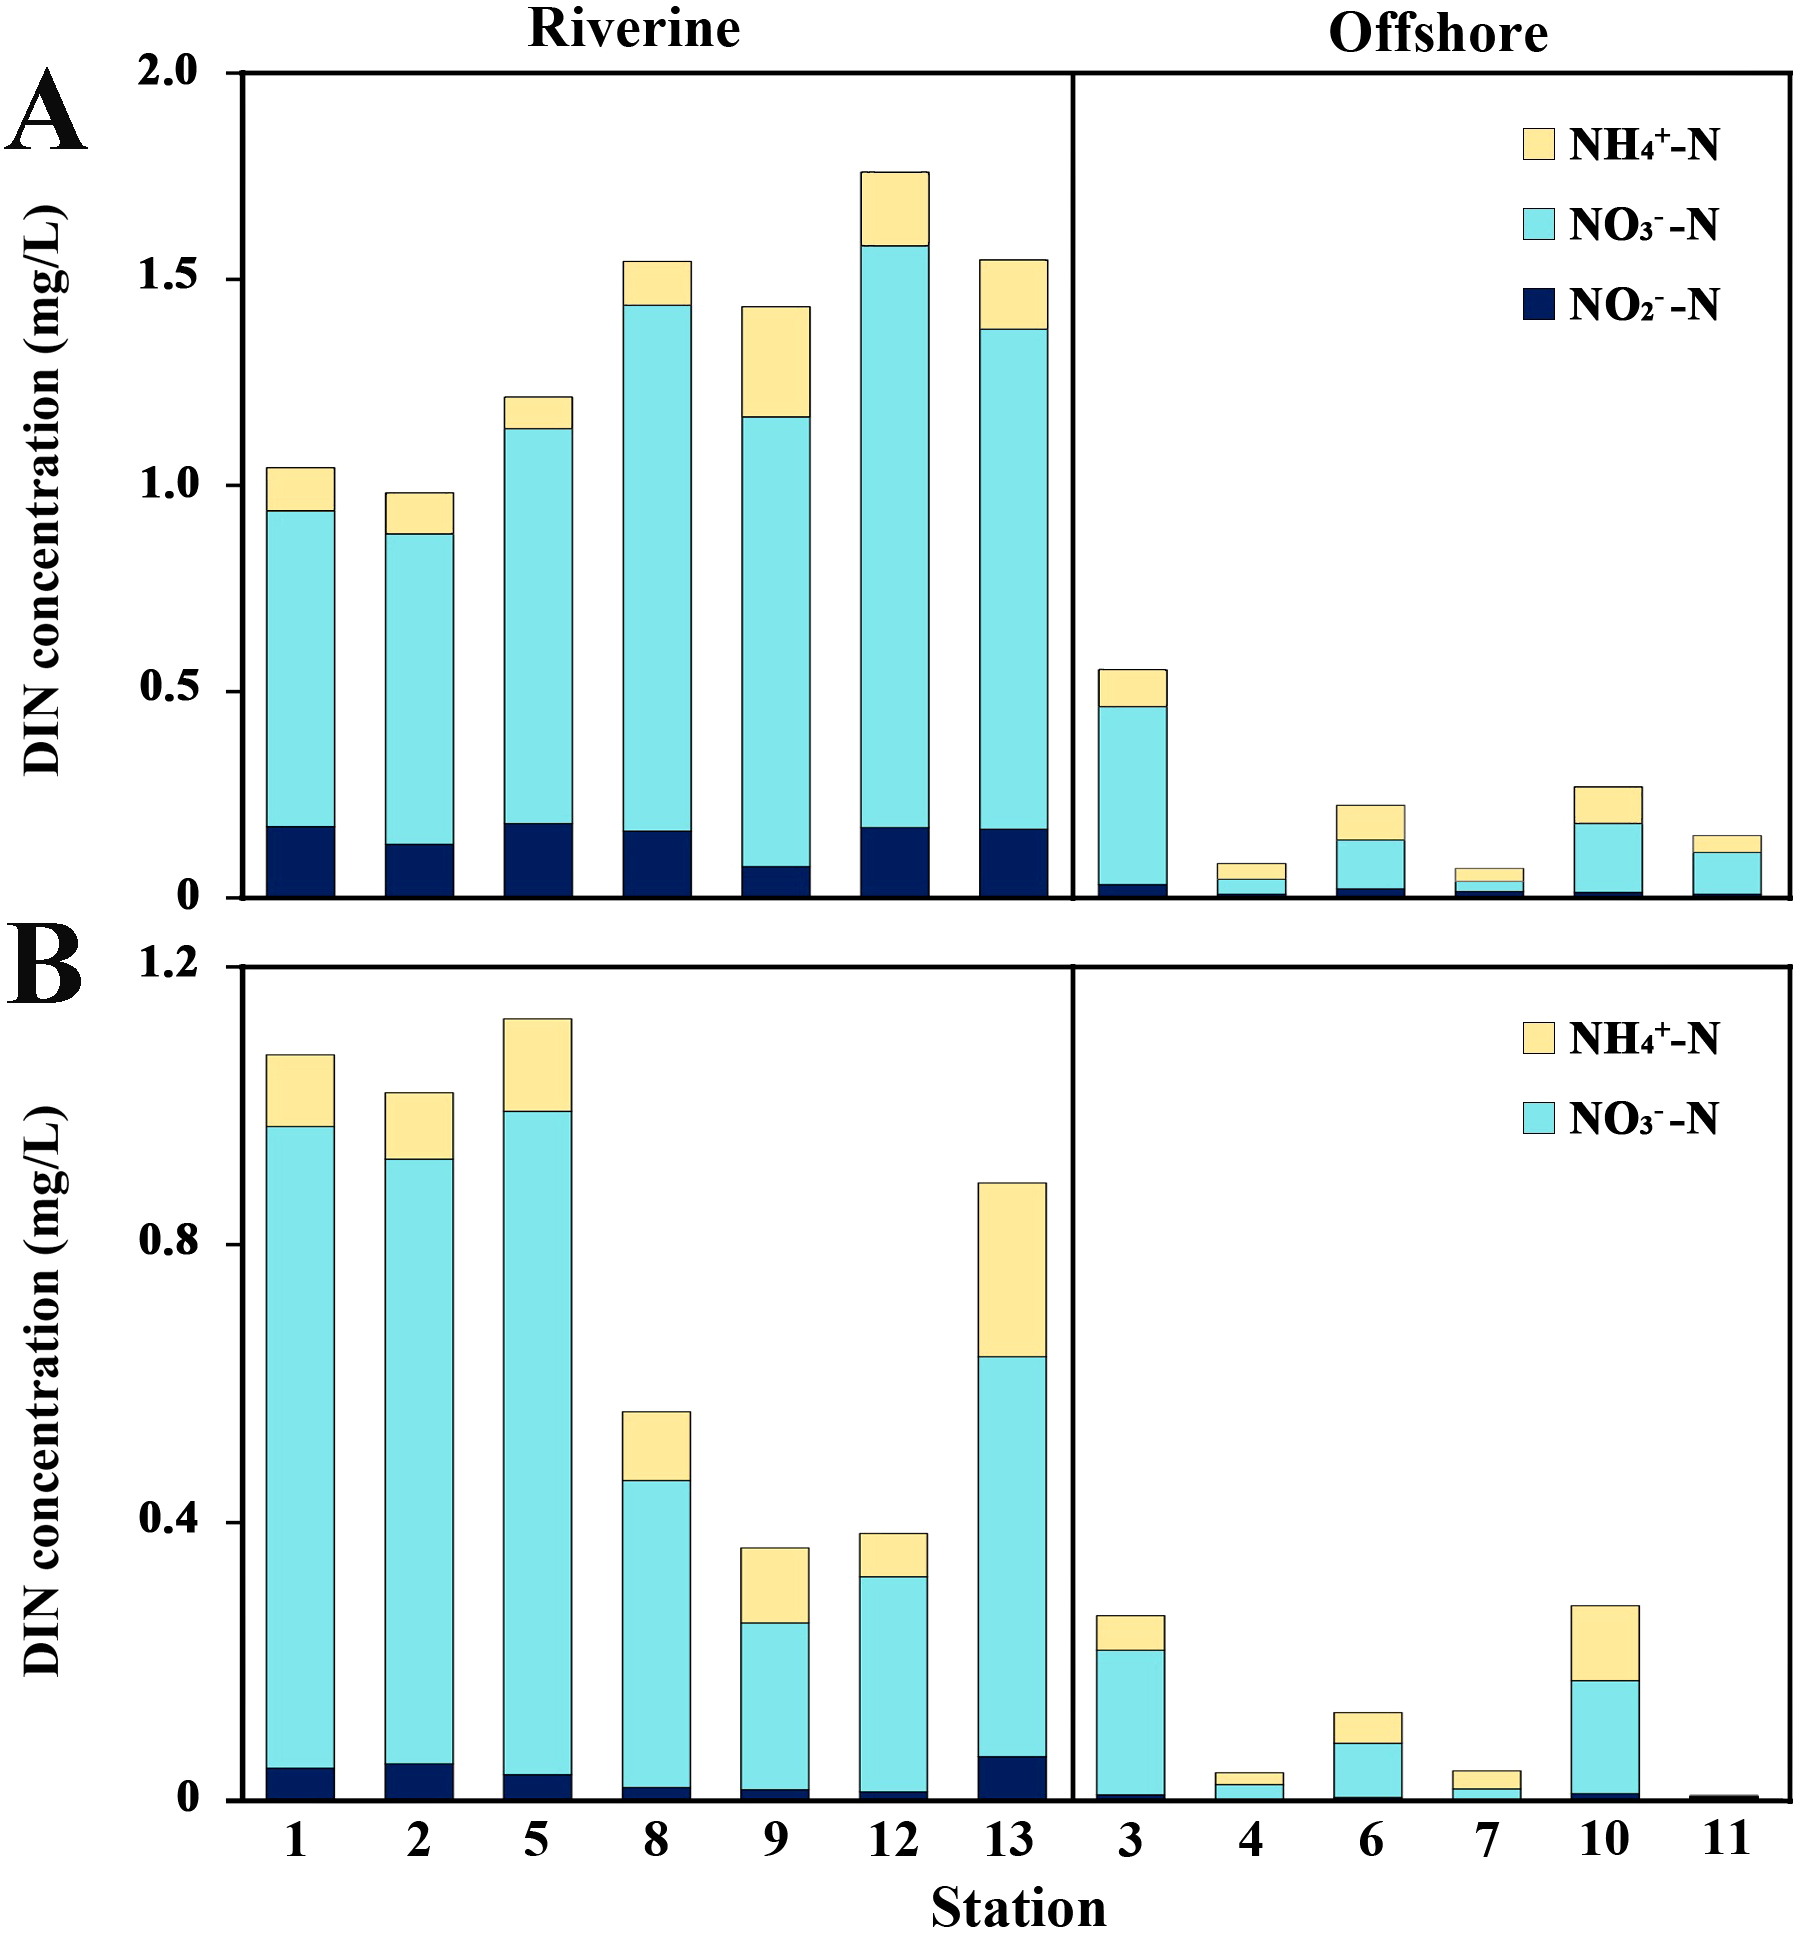
Contribution of ammonia nitrogen (NH4+-N), nitrate nitrogen (NO3−-N), nitrite (NO2−-N) to dissolved inorganic nitrogen (DIN) among stations. (A) In the wet season. (B) In the dry season.
To identify the specificity of ecosystem dynamics and functions, we calculated the nitrogen/phosphorus ratio (N/P). During the high-flow period, the average N/P ratio in the estuarine area was close to 16, and the N/P ratio in the offshore area was 10.07. During the dry season, the N/P ratio in the estuarine area increased to 18.67, while the N/P ratio in the offshore area decreased to 5.33 (Table 3).
3.2 Photosynthetic pigments
The distribution of Tchl-a concentration in the waters of Lianzhou Bay exhibited distinct seasonal and spatial variations (Table 4; Figures 5A, E). During the wet season, Tchl-a concentrations showed significant fluctuations, with a peak value of 13.34 μg/L observed only at Station 13 in the estuarine zone, while concentrations at most other stations remained below 3.00 μg/L. Specifically, the mean Tchl-a concentration in the estuarine zone was 3.92 μg/L, decreasing to 0.93 μg/L in the offshore area. Similarly, the mean concentration in non-fishing zones was 3.02 μg/L, whereas it declined to 0.95 μg/L in fishing zones. During the dry season, elevated Tchl-a concentrations were predominantly concentrated in the estuarine zone and the southeastern inlet, with concentrations in the central and western parts of the study area remaining below 1.50 μg/L. Consistent with the wet season, Tchl-a concentrations in the estuarine zone remained higher than those in the offshore area, while fishing zones exhibited significantly lower concentrations compared to non-fishing zones (Table 4).
Table 4
| Region | Wet season | Dry season |
|---|---|---|
| Estuarine area | 3.92 | 2.56 |
| Coastal waters | 0.93 | 1.91 |
| Aquaculture zone | 0.95 | 1.72 |
| Non-aquaculture zone | 3.02 | 2.42 |
| Range | 0.51-13.34 | 1.02-3.43 |
| Average | 2.54 | 2.26 |
Variations in Tchl-a concentration (range and mean) and its spatial distribution in different zones of Lianzhou Bay (μg/L).
Figure 5
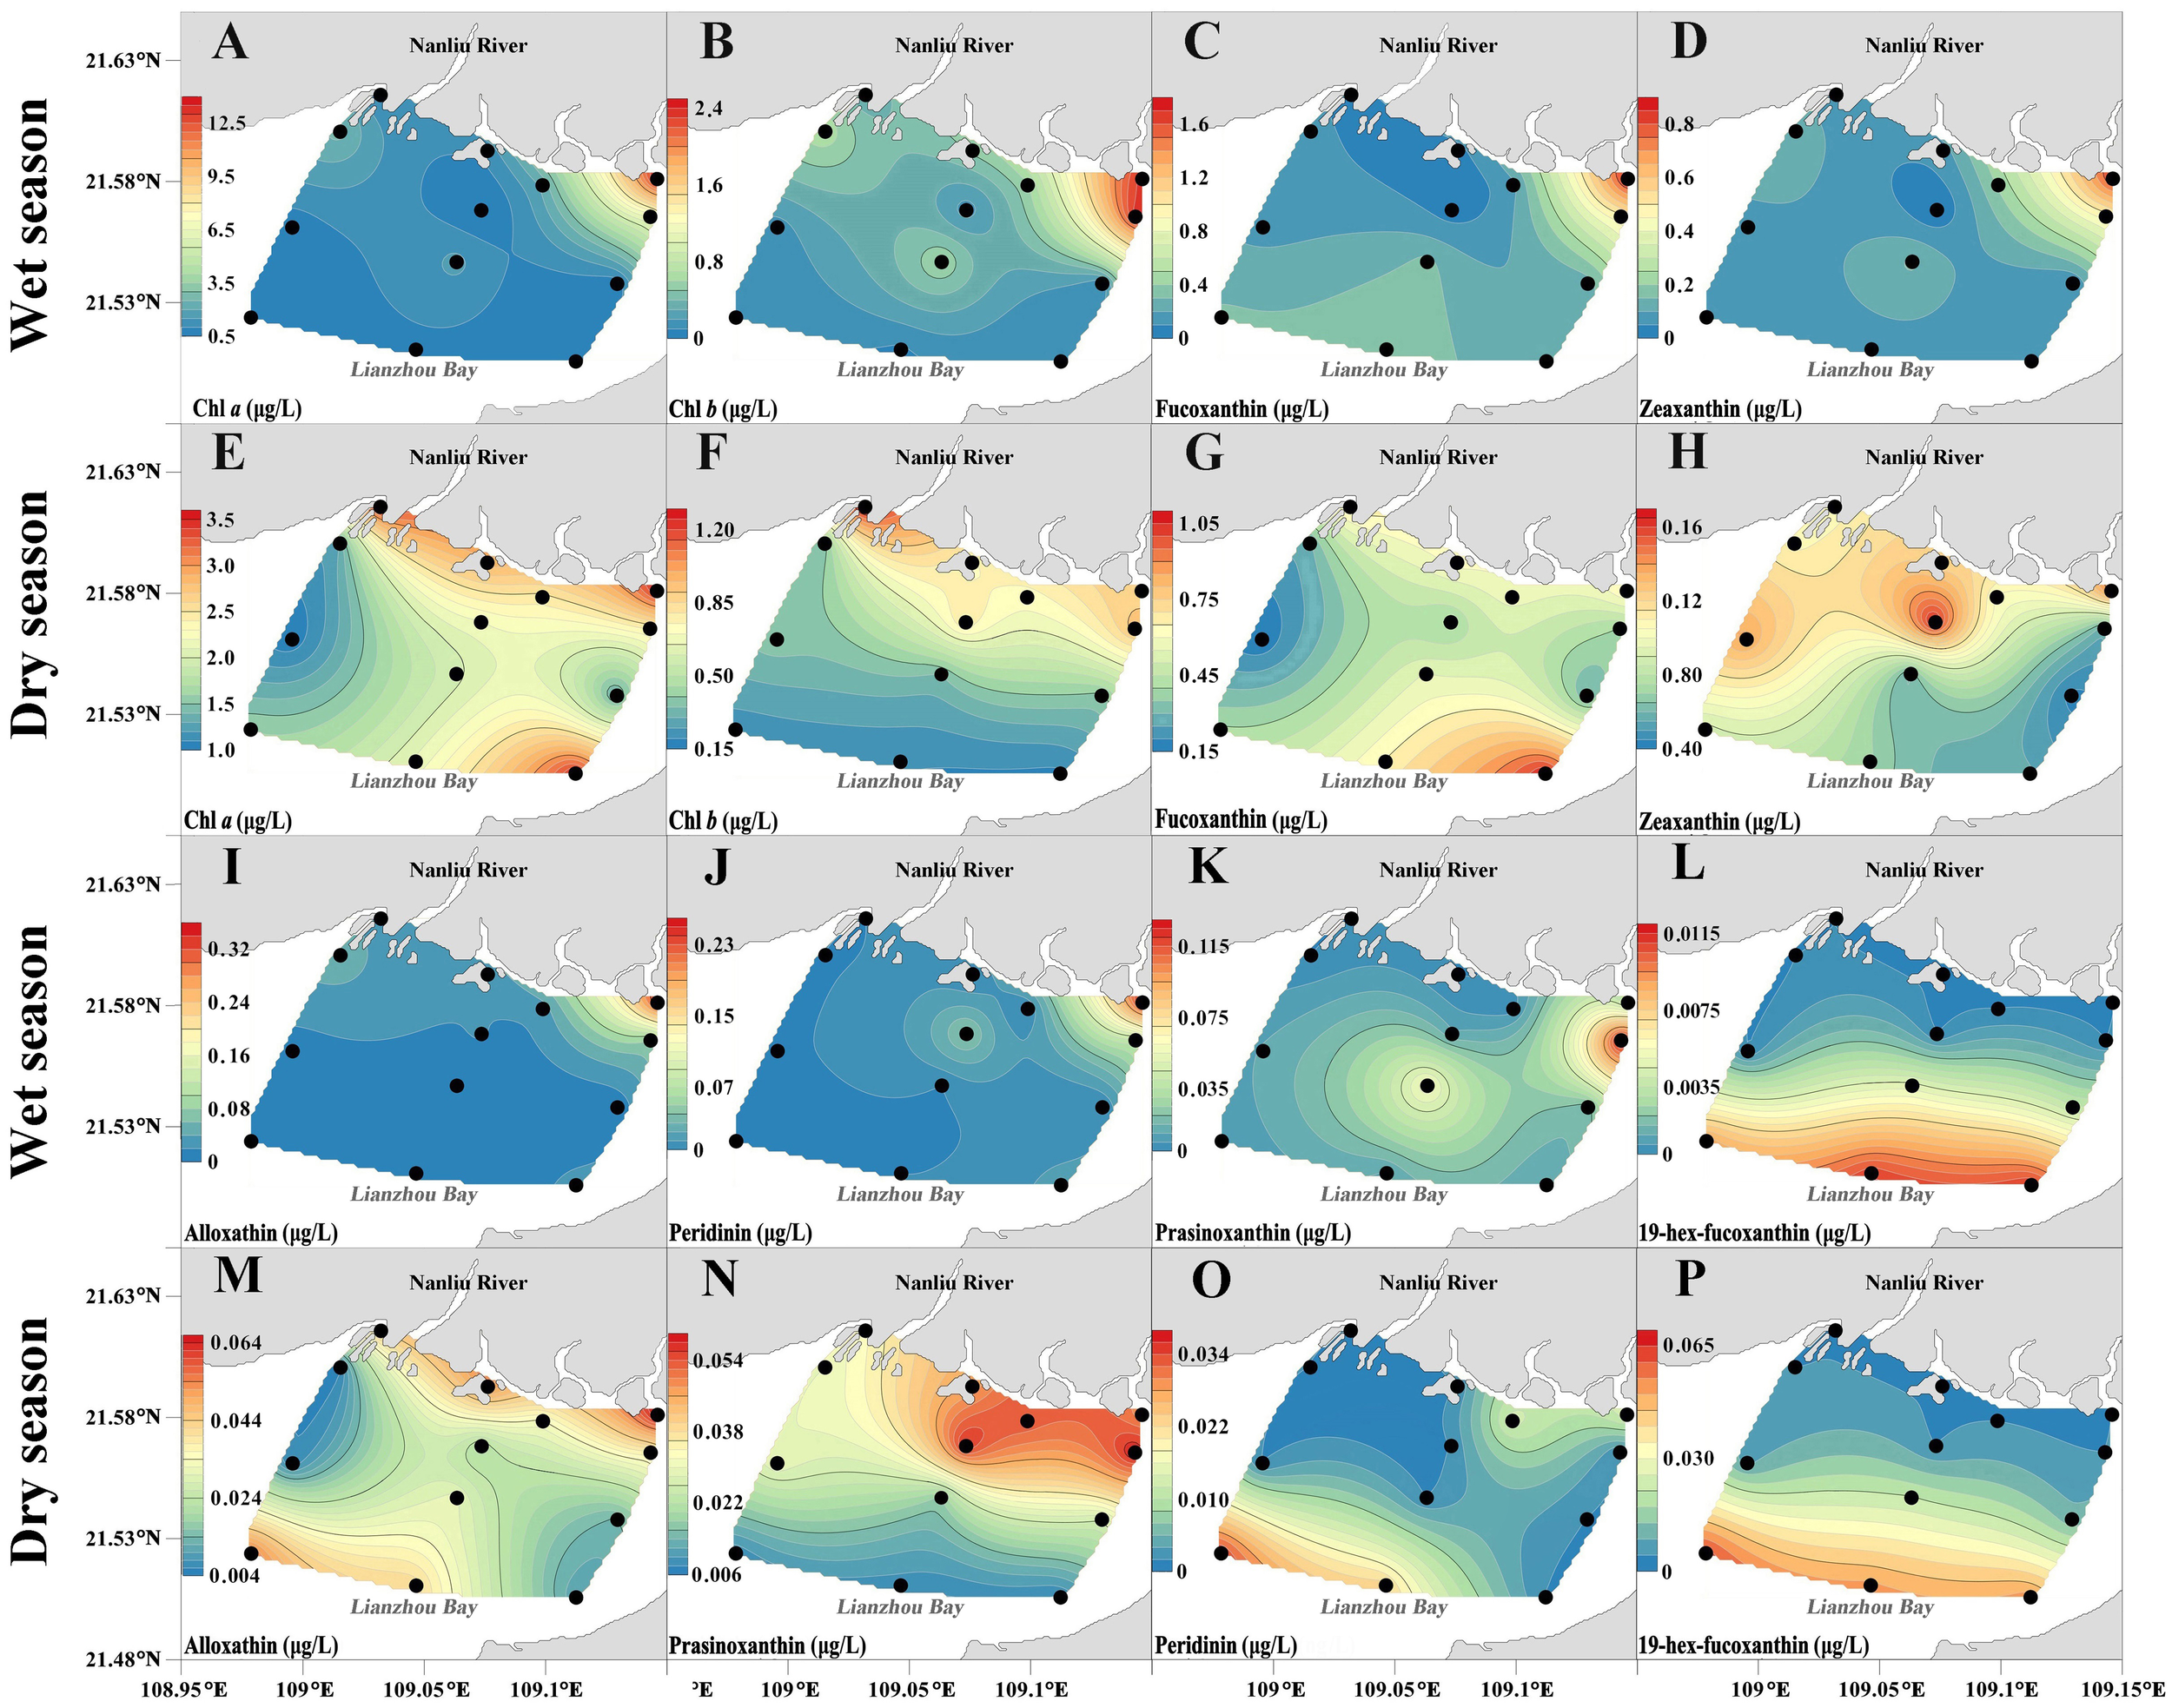
Spatial variation of chlorophyll-a, chlorophyll-b, fucoxanthin, zeaxanthin, alloxanthin, peridinin, prasinoxanthin, and 19-hex-fucoxanthin in the study area, (A–P) spatial distribution, black dots indicate measurement points.
According to HPLC analysis, 14 pigments were detected during the high-water period, but 19-butfu and DV-chl a were not detected, and perid was not observed in the estuary. During the low-water period, 19 pigments were detected, but DV-chl a was not detected, and perid was not observed in the estuary.
Chl-b was the most abundant pigment during the high-water period, with a total concentration ranging from 0.13 μg/L to 2.34 μg/L. The spatial distributions of chl-b, fucox, zeax, allox, and perid were similar to that of Tchl-a, reaching a peak at station 13 in the estuary (Figure 5). High concentrations of pras appeared at station 9, with the second highest value detected in the central part of the surveyed sea area. Unlike all characteristic pigments, the concentration distribution of 19-hexfu showed a trend of increasing from the estuary to the sea. Compared with the high-water period, the spatial distribution of each characteristic pigment during the low-water period was significantly different (Figure 5). Chl-b was also the most abundant pigment, with a concentration range of 0.19 μg/L to 1.26 μg/L, mainly concentrated in the estuary. The spatial distribution of fucox was similar to that of Tchl-a, with higher concentrations in the estuary and the southeastern sea inlet. Similar to the distribution of chl-b, the concentration distribution of pras showed a decreasing trend towards the sea. High concentrations of allox and perid were concentrated in the northern coastal area and the southwestern part of the surveyed sea area. The concentration distribution of zeax showed a decreasing trend from northwest to southeast, while the concentration distribution of 19-hexfu showed a decreasing trend from the estuary to the sea.
3.3 Phytoplankton community composition
CHEMTAX analysis revealed fluctuations in phytoplankton community composition between the two seasons (Figure 6). During the wet season, diatoms, cyanobacteria, prasinophytes, chlorophytes, and cryptophytes contributed over 99.0% of the Tchl-a concentration. The average contributions of diatoms, cyanobacteria, prasinophytes, chlorophytes, and cryptophytes were 35.0%, 21.0%, 13.0%, 19.0%, and 11.0%, respectively. The contribution of three phytoplankton groups, including chlorophytes, cryptophytes, and dinoflagellates, to Tchl-a decreased from the estuarine to the offshore region. Conversely, the contributions of diatoms, cyanobacteria, and chrysophytes to Tchl-a showed an increasing trend towards the sea. Diatoms and chlorophytes exhibited the greatest variability, with diatoms increasing from 20.0% in the estuarine region to 52.0%, and chlorophytes decreasing from 31.0% in the estuarine region to 4.0% in the offshore region. The contribution of prasinophytes to Tchl-a did not change between the estuarine and offshore regions (Figure 6A). During the dry season, diatoms, prasinophytes, cyanobacteria, and cryptophytes contributed over 98% of the Tchl-a concentration. The average contributions of diatoms, prasinophytes, cyanobacteria, and cryptophytes were 62.0%, 18.0%, 12.0%, and 7.0%, respectively. The contribution of prasinophytes and chlorophytes to Tchl-a decreased from the estuarine to the offshore region, while the contribution of diatoms to Tchl-a increased from the estuarine to the offshore region. The contributions of cyanobacteria and cryptophytes to Tchl-a did not differ between the estuarine and offshore regions (Figure 6B).
Figure 6
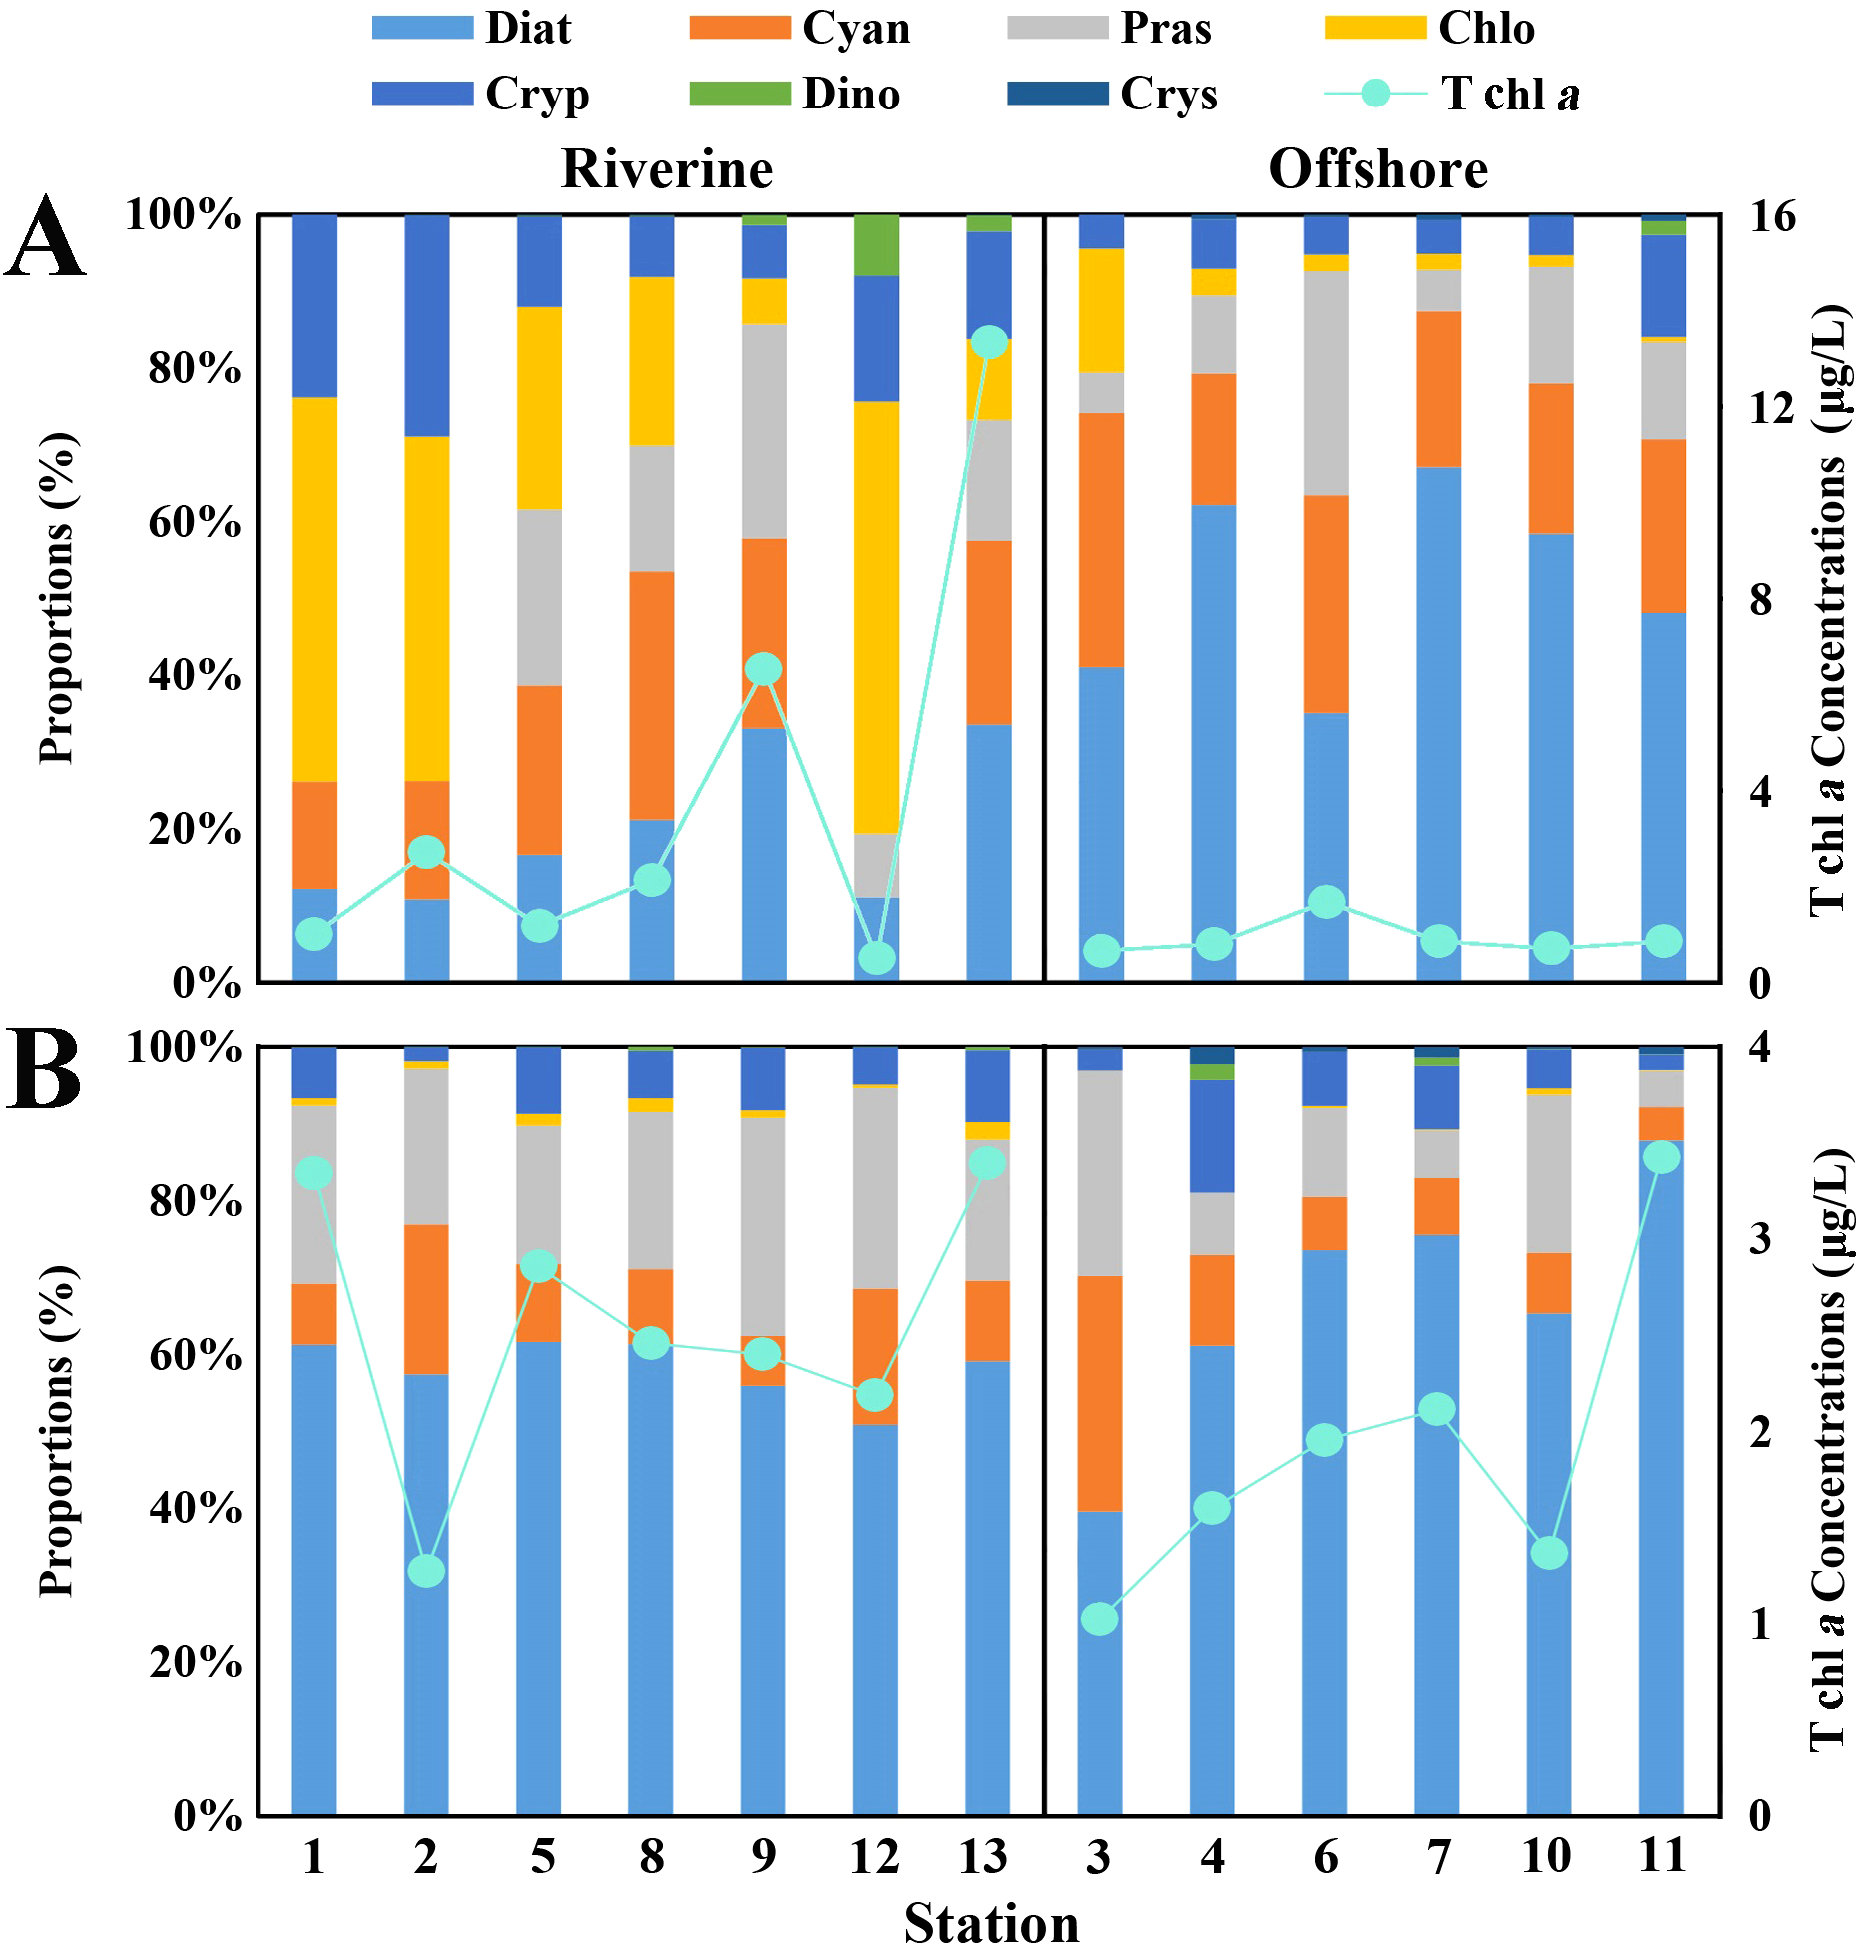
Schematic diagram of contribution of different phytoplankton groups to phytoplankton biomass in Lianzhou Bay. (A) In the wet season. (B) In the dry season.
It is evident that diatoms and chlorophytes exhibited the greatest variability between the two periods. From the wet season to the dry season, diatoms increased from 31.95% to 62.0% of the Tchl-a concentration, while chlorophytes decreased from 14.51% to 0.89%.
3.4 Correlation analysis of photosynthetic pigments, nutrients, and environmental factors
Correlation analysis was performed between water salinity and transparency, DO, and various nutrients during the survey period (Figure 7). The results showed that during the wet season, salinity and transparency were significantly positively correlated, and significantly negatively correlated with PO43−, SiO32−, DIN, NO2−-N, and NO3−-N. During the dry season, salinity was also significantly positively correlated with transparency, and negatively correlated with SiO32−, DIN, N/P, NH4+-N, NO3−-N, and NO2−-N.
Figure 7
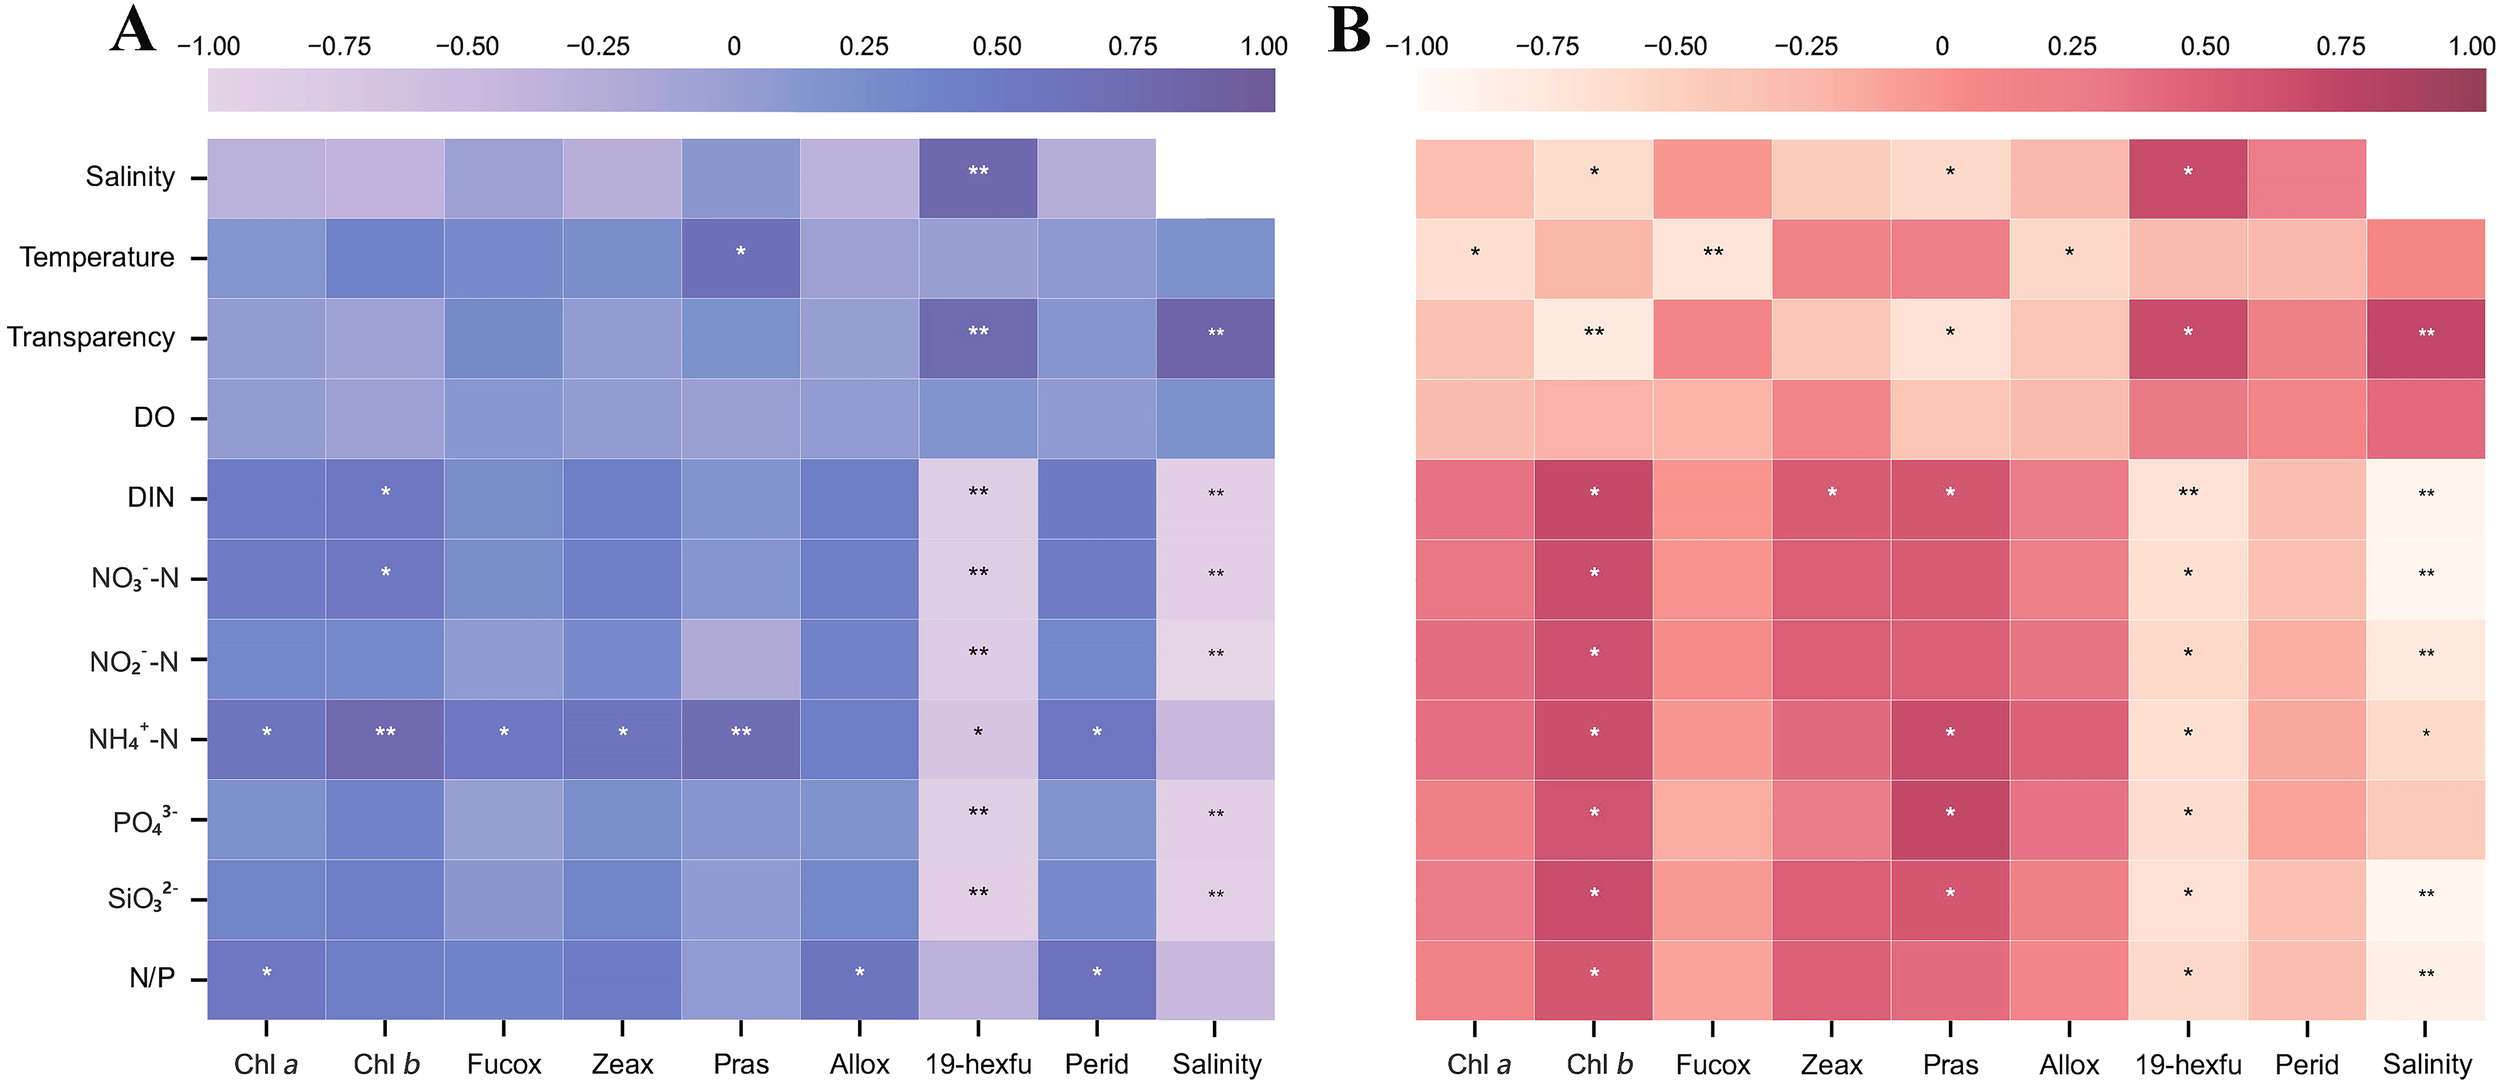
Correlation analysis between environmental factors and major photosynthetic pigments. (A) In the wet season. (B) In the dry season. ** denotes significance at p<0.01, * denotes significance at p<0.05.
Correlation analysis was performed between Tchl-a, major characteristic pigments, and environmental factors such as salinity (Figure 7). The results revealed that during the wet season, Tchl-a, chl-b, and zeax exhibited significant correlations with NH4+-N concentration. Pras showed positive correlations with both NH4+-N concentration and seawater temperature. Allox concentration was closely associated with the N/P ratio, while perid demonstrated significant relationships with both the N/P ratio and NH4+-N concentration. Notably, 19-hexfu displayed distinct coastal population characteristics, with its concentration showing significant positive correlations with salinity and transparency, but negative correlations with nutrient concentrations (Figure 7A). During the dry season, negative correlations were observed between Tchl-a, fucox, allox, and seawater temperature. The chl-b concentration exhibited typical estuarine population characteristics, being associated with low salinity, low transparency, and high nutrient conditions. In contrast, 19-hexfu displayed clear coastal population features, correlating with high salinity, high transparency, and low nutrient concentrations. This indicates that chl-b and 19-hexfu occupy completely opposite ecological niches. The ecological niche of pras was similar to that of chl-b, showing negative correlations with salinity and transparency but positive correlations with PO43− and NH4+-N concentrations (Figure 7B).
4 Discussion
4.1 Impact of riverine dilution on environmental factors
During the rainy season, significant rainfall transports accumulated sediments from the dry season into the Nanliu River (Tao et al., 2020), leading to a direct decrease in water transparency (Table 3; Figure 7A). Throughout our study, we observed a gradient in water transparency, which increased from the northern nearshore region towards the open sea. Analysis using SPSS revealed that the primary factor contributing to reduced transparency was the input of freshwater runoff, regardless of whether it was the wet or dry season (Figure 7). As a result, the estuarine region exhibited the lowest transparency values across the entire study area. In contrast, the southeastern part of the bay showed the highest transparency, likely due to the dynamics of water movement within the bay. The water body of Lianzhou Bay is predominantly shaped by the interaction between tidal currents and coastal currents, with the latter introducing “new” water into the southern part of the bay, which is subsequently brought into the bay during the next high tide. This interplay between tidal and coastal currents facilitates a gradual northwestward movement of water within the bay, which is then replenished by “new” water from the southeast (Sun et al., 2014).
Lianzhou Bay receives a substantial influx of organic matter from the Nanliu River, the largest river in Guangxi (Li et al., 2017; Zhang et al., 2022). During the wet season, the DO concentration at most stations within the bay fell below 6 mg/L, which is lower than the levels recorded in other estuarine waters (Córdoba-Mena et al., 2020). The quality of water is influenced by organic matter from various sources (Rashed-Un-Nabi et al., 2011), including domestic, agricultural, and industrial effluents, which are the primary pollutants of the Nanliu River (Li et al., 2017; Chen et al., 2022; Wei et al., 2024). The lowest DO values were noted along the coast of Beihai City, where urban sewage discharge has a significant impact. Additionally, the detritus food chain within the mangrove ecosystem contributes to the presence of dissolved organic matter in the estuary of the Nanliu River (Holmer and Olsen, 2022).
Throughout the investigation, the concentrations of DIN, PO43−, and SiO32− exhibited a clear decreasing trend as one progressed from the estuary towards the open sea (Figure 3). During the wet season, the significant rise in river runoff markedly increased the nutrient concentrations within the surveyed marine area, with a notable accumulation of these nutrients occurring primarily near the estuary. The analysis conducted using SPSS revealed a significant correlation between PO43−, SiO32−, and DIN with salinity, highlighting the fact that freshwater runoff serves as the main source of nutrients during this period. In contrast, during the dry season, the reduced river runoff led to a corresponding decline in nutrient concentrations within the surveyed marine area. The SPSS analysis further indicated a significant positive correlation between SiO32− and DIN with salinity during this phase, thereby confirming that the primary sources of SiO32− and DIN remain linked to freshwater runoff (Figure 7B). Unlike the wet season, the elevated concentrations of DIN and SiO32− observed during the dry season were predominantly found in the northwestern section of the surveyed area, likely due to intensified coastal currents at this time, which facilitated the movement of water towards the northwest, thereby transporting nutrients into that specific region of the surveyed marine area (Sun et al., 2014). Conversely, the concentration of PO43− was primarily concentrated in the northeastern part of the surveyed area, with heightened levels noted near the coastline. The SPSS analysis indicated that the relationship between salinity and PO43− was not statistically significant (Figure 7B), suggesting that the sources and exchange processes governing PO43− are inherently complex. Previous studies have indicated that, in addition to freshwater runoff, phosphorus in the Lianzhou Bay area also originates from urban wastewater and aquaculture effluents (Guo et al., 2024). Furthermore, a critical process in the exchange of phosphorus within coastal regions involves the adsorption and desorption of particulate matter. On one hand, a reduction in DO levels promotes the release of PO43− from phosphorus-rich sediments (Lønborg et al., 2021), which clarifies the observed correlation between low DO distribution and high PO43− distribution (Figures 2H, 3E). On the other hand, an increase in nearshore salinity may also facilitate the desorption of PO43− from sediments, consequently elevating the concentration of PO43− within the water column (Bharathi et al., 2022).
4.2 The impact of river dilution on Tchl-a concentration and spatial distribution
During the investigation period, the distribution of Tchl-a concentrations in Lianzhou Bay showed a significant negative correlation with temperature exclusively during the dry season (Figure 7). In contrast, no statistically significant relationships were detected between Tchl-a and previously identified key environmental drivers, including salinity, nutrient levels, and water transparency. Notably, the observed spatial patterns of salinity, nutrients, and transparency failed to adequately account for the abrupt decreases in Tchl-a concentrations occurring in specific sub-regions. Furthermore, while previous studies (Tan et al., 2025) proposed that the synergistic effects of strong northeast monsoon winds and decreased temperatures during autumn (dry season) would reduce Tchl-a concentrations in Lianzhou Bay, our empirical results demonstrate the opposite trend (Figure 7B). These findings suggest that in estuarine ecosystems, Tchl-a distribution patterns are unlikely to be governed by any single dominant environmental factor. Consequently, we postulate that alternative mechanisms, particularly zooplankton grazing pressure and hydrodynamic forcing, may constitute more plausible determinants of Tchl-a spatial variability in Lianzhou Bay.
Lianzhou Bay serves as a major aquaculture area, with bivalve species (e.g., oysters, clams, and scallops) being the primary cultivated organisms. Bivalves predominantly feed by filtering plankton and organic detritus from seawater (Riisgard et al., 2003; Galimany et al., 2021). These filter-feeding bivalves exhibit remarkable water filtration capacity, while their metabolic activities and fecal excretion can influence nutrient concentrations in the water column, subsequently promoting phytoplankton growth (Bacher et al., 1995). Consequently, phytoplankton dynamics in the water are simultaneously regulated by both top-down control through bivalve grazing and bottom-up control via nutrient availability. However, in high-density bivalve aquaculture areas, the top-down control typically outweighs the bottom-up effects. Studies have demonstrated that intensive bivalve cultivation significantly reduces phytoplankton biomass in farming zones (Jiang et al., 2016), leading to rapid declines in Tchl-a concentrations - a phenomenon also observed in other coastal bivalve farming regions in China (Wheat and Ruesink, 2013; Petersen et al., 2019; Hulot et al., 2020). Our investigation revealed consistently lower Tchl-a concentrations in aquaculture areas compared to non-farming zones (Table 4). Since bivalves primarily feed by filtering plankton and organic detritus (Galimany et al., 2021), Tchl-a concentrations at sampling stations, including the outer edges of aquaculture areas, were substantially lower than the survey-wide average. Furthermore, during our dry-season survey, areas with elevated temperatures largely coincided with aquaculture zones. We therefore hypothesize that grazing pressure from bivalves may explain the unexpected decrease in Tchl-a concentrations in these warmer areas. Additionally, intensive phytoplankton predation by zooplankton (e.g., shrimp, prawns, bivalves, and fish larvae) inhabiting the mangrove forests of the Nanliu River estuary constitutes another contributing factor (Farid and Baderan, 2024). This explains why phytoplankton abundance remains low even in nutrient-rich estuarine areas. In summary, the micro-food web within Lianzhou Bay’s mangrove ecosystem and bivalve aquaculture activities effectively reduce the probability of algal blooms by directly decreasing Tchl-a concentrations through phytoplankton consumption. Numerous studies have confirmed that both mangrove ecosystems and bivalve aquaculture can serve as effective measures for improving seawater quality in coastal bays (Zhao et al., 2019; Cubillo et al., 2023).
Seasonal variations in water movement also influenced the temporal and spatial distribution of Tchl-a concentrations in Lianzhou Bay. Previous studies demonstrated a strong correlation between river discharge and Tchl-a in estuaries (Lucas et al., 1999). The inflow of river water drove convective transport towards the sea, potentially at a rate that exceeded phytoplankton growth, thereby inhibiting biomass accumulation during periods of high flow. Consequently, phytoplankton biomass was often negatively correlated with river discharge (Burford et al., 2012). This may also elucidate why Tchl-a concentrations in the estuarine area were lower during periods of increased freshwater discharge compared to those during low flow conditions (Table 4).
In estuarine regions, water transparency and light availability were frequently key factors influencing Tchl-a concentrations (Bharathi et al., 2022). Many estuaries experienced significant mineral sediment deposition from terrestrial runoff, and these sediments remained suspended due to wind and tidal action (May et al., 2003). The turbidity associated with sediments restricted the photic zone to a narrow layer, limiting photosynthesis and hindering phytoplankton from fully utilizing available nutrients. This situation was commonly observed in numerous estuarine areas, which often possessed abundant nutrients, high SPM, and extremely low phytoplankton productivity (Kocum et al., 2002; Mo et al., 2024). During wet seasons, increased runoff from the Nanliu River introduced substantial nutrients into Lianzhou Bay, accompanied by significant sediment loads. Therefore, despite nutrient concentrations being 37.42%-43.26% higher during wet seasons compared to dry seasons, the low transparency resulted in Tchl-a concentrations at most sampling sites being lower than those observed during dry periods. Following a decrease in rainfall, the average transparency of the bay’s water rose to 1.06, with the highest transparency recorded in the southeastern region, where coastal currents frequently exchanged. Phytoplankton flourished and reproduced in the well-lit nearshore areas, resulting in Tchl-a concentrations surpassing those during wet seasons. This suggested that light availability was more critical than nutrient levels in estuarine regions (Bharathi and Sarma, 2019; Mo et al., 2024).
It was noteworthy that during wet seasons, Tchl-a concentrations were concentrated in the northeastern part of the surveyed area, likely due to multiple influencing factors. This region was situated farther from the aquaculture zones and possessed a relatively stable water environment, allowing phytoplankton to remain in nutrient-rich waters for extended periods, thus promoting rapid growth and reproduction. Studies indicated that phytoplankton preferentially absorbed NH4+-N from the water, only resorting to nitrate nitrogen when NH4+-N concentrations were insufficient (Glibert et al., 2016). Our survey data revealed that at this site, the concentration of DIN reached 1.547 mg/L, but due to rapid consumption by phytoplankton, NH4+-N accounted for only 10.86% of the DIN concentration in this area.
4.3 The impact of river dilution on phytoplankton community structure
Both freshwater and marine organisms experienced significant osmotic stress due to salinity gradients, with salinity posing a lethal barrier for phytoplankton. Different categories of phytoplankton had specific salinity ranges from estuarine to nearshore environments (Kies, 1997). Furthermore, variations in transparency, nutrient concentration, and grazing pressure led to significant differences in phytoplankton growth rates (Lucas et al., 1999). During periods of high water flow, chlorophytes (31.0%) and diatoms (20.0%) dominated in low salinity estuarine areas, while diatoms (52.0%) were more abundant in nearshore regions with medium to high salinity. In dry periods, diatoms (58.0% and 67.0% in estuarine and nearshore areas, respectively) emerged as the only prominent group. This phenomenon, where diatoms dominated during dry periods and were replaced by chlorophytes and other taxa during wet periods, was observed in many estuaries (Naik et al., 2009; Bharathi et al., 2018).
During periods of increased discharge from the Nanliu River, we observed substantial proliferation of non-diatom phytoplankton in the estuarine zone, along with a seaward increase in diatom dominance (Figure 6A). While diatoms typically dominate in nutrient-rich waters (Sarthou et al., 2005), their contribution to Tchl-a was lower in the estuary than in coastal waters despite elevated SiO32− concentrations in the estuarine zone. SPSS analysis revealed no significant correlations between the diatom biomarker pigment fucox and salinity, transparency, or nutrient concentrations, suggesting more complex factors governing diatom distribution (Figure 7A). This may indicate their broad tolerance ranges for salinity and light availability to sustain growth. Chlorophytes emerged as the dominant group in the estuary during this period, frequently co-dominating with diatoms in low-salinity estuarine waters (Mo et al., 2024). Due to their limited osmoregulatory capacity, most chlorophytes were restricted to the estuarine zone (Figure 6). SPSS results showed that the distribution pattern of chl-b (associated with chlorophytes) closely mirrored that of Tchl-a, with NH4+-N identified as the primary limiting factor. Cyanobacteria, possessing wide ecological niches for temperature, salinity, and nutrients, represented the third dominant group. Their biomarker pigment zeax showed positive correlations with both temperature and NH4+-N concentrations (Figure 7A). Both cyanobacteria and cryptophytes also dominated during high-flow periods, demonstrating adaptability to low N/P environments through nitrogen storage and utilization capabilities (Rocha et al., 2002). Cryptophytes contributed significantly (16.0%) in the high N/P estuarine zone, likely reflecting their ecological preference for low-salinity, high-nitrogen conditions (Mendes et al., 2013; Zhong et al., 2020). Some researchers suggest that cryptophytes, with their rapid growth rates, tend to proliferate in areas receiving frequent nutrient inputs (e.g., estuaries) (Paerl et al., 2010). This may reflect their competitive advantage in unstable waters, with their dominance serving as an indicator of ecosystem instability (Casotti et al., 2000).
Diatoms constituted the dominant phytoplankton group during the dry season, a phenomenon potentially attributable to favorable light conditions during this period (Pednekar et al., 2011). Notably, similar to Tchl-a, the concentration of fucox-the primary pigment of diatoms-showed significant reductions within and around aquaculture areas. In the absence of morphological identification data, this study could not determine whether the major contributors to fucox were temperature-sensitive species or those with size ranges optimal for bivalve grazing. Previous studies in the Beibu Gulf have identified diatoms (particularly Bacteriastrum sp., Chaetoceros sp., and Thalassionema sp. through microscopic observations) as the predominant phytoplankton group during dry seasons (Xu et al., 2024). The observed decrease in fucox concentrations in aquaculture zones may reflect selective grazing pressure on palatable diatom species (Bharathi and Sarma, 2019). Chlorophytes and cyanobacteria occupied similar ecological niches, as evidenced by the widespread distribution of their biomarker pigments (chl-b and zeax) in low-salinity, low-transparency, and nutrient-rich riverine waters. Their contributions were markedly higher in estuarine areas than in coastal waters. Phytoplankton groups associated with zeax and perid pigments (e.g., cyanobacteria and dinoflagellates) showed no distinct correlations with any environmental parameters, indicating their successful colonization across diverse nutrient regimes in estuarine-coastal gradients. These phytoplankton communities with broad niche widths exhibited more complex distribution patterns (Zhong et al., 2020). For instance, elevated PO4³− concentrations in coastal waters favored cyanobacterial biomass accumulation (Mo et al., 2024). Furthermore, Synechococcus cyanobacteria possess genetically mediated niche plasticity, enabling proliferation across river plumes, eutrophic coastal areas, and warm offshore waters (Moisan et al., 2010).
5 Conclusion
As the flow of the Nanliu River increased, significant changes in salinity, DO and transparency were observed in the waters of Lianzhou Bay, transitioning from the estuarine to the offshore regions. The concentration of nutrients in the water body rose dramatically, with a distribution trend showing a decrease from the estuary to the sea. The influx of freshwater carried a substantial amount of suspended particles, which reduced light availability, resulting in Tchl-a concentrations remaining below those observed during dry periods at most sampling sites, even in nutrient-rich conditions. Following a reduction in freshwater flow, both salinity and nutrient concentrations in Lianzhou Bay decreased, while transparency improved. In well-lit offshore areas, Tchl-a concentrations were significantly higher than those in the offshore regions during wet periods. These results indicated that light availability in estuarine areas was often more critical than nutrient levels. Furthermore, the spatial distribution of Tchl-a concentrations was influenced by grazing pressure and water movement. For instance, the substantial grazing by bivalves in aquaculture zones and zooplankton in mangroves accounted for the rapid decline of Tchl-a concentrations in certain areas. During wet periods, the highest Tchl-a concentrations were found in regions farther from marine aquaculture zones, where the water environment was more stable.
During wet periods, the phytoplankton community was primarily composed of diatoms, cyanobacteria, chlorophytes, and cryptophytes. In contrast, during dry periods, the community mainly consisted of diatoms, chlorophytes, cyanobacteria, and cryptophytes. Notably, diatoms and chlorophytes exhibited the greatest variability between the two periods. Due to the lack of osmoregulatory mechanisms, most chlorophytes were restricted to the estuarine areas during wet periods. Diatoms, on the other hand, thrived under well-lit conditions, leading to their higher contribution in offshore areas and during dry periods.
Statements
Data availability statement
The raw data supporting the conclusions of this article will be made available by the authors, without undue reservation.
Ethics statement
The manuscript presents research on animals that do not require ethical approval for their study.
Author contributions
YY: Conceptualization, Data curation, Formal analysis, Methodology, Software, Visualization, Writing – original draft, Writing – review & editing. YT: Conceptualization, Investigation, Writing – original draft, Data curation, Formal analysis, Writing – review & editing. QZ: Conceptualization, Writing – original draft, Investigation, Methodology. YC: Conceptualization, Writing – original draft, Data curation, Software, Visualization. YW: Conceptualization, Writing – review & editing. BX: Conceptualization, Writing – original draft. CJ: Conceptualization, Data curation, Writing – original draft. PX: Funding acquisition, Project administration, Resources, Supervision, Visualization, Writing – original draft, Writing – review & editing. XH: Supervision, Writing – original draft, Writing – review & editing.
Funding
The author(s) declare that financial support was received for the research and/or publication of this article. The National Key Research and Development Program of China (No. 2022-24), the Scientific Research Foundation of Third Institute of Oceanography, MNR (2020017), and the Xiamen Bay Ecological Health Status Assessment (Preliminary Survey).
Acknowledgments
This work was supported by the generous provision of mangrove datasets from the Observation and Research Station of Coastal Wetland Ecosystem in Beibu Gulf, Ministry of Natural Resources, for which we are deeply grateful. We express our sincere gratitude to Dr. Lan Wenlu for sample collection.
Conflict of interest
The authors declare that the research was conducted in the absence of any commercial or financial relationships that could be construed as a potential conflict of interest.
Generative AI statement
The author(s) declare that no Generative AI was used in the creation of this manuscript.
Publisher’s note
All claims expressed in this article are solely those of the authors and do not necessarily represent those of their affiliated organizations, or those of the publisher, the editors and the reviewers. Any product that may be evaluated in this article, or claim that may be made by its manufacturer, is not guaranteed or endorsed by the publisher.
References
1
Abreu P. C. Bergesch M. Proença L. A. Garcia C. A. E. Odebrecht C. (2009). Short- and long-term chlorophyll a variability in the shallow microtidal Patos Lagoon Estuary, Southern Brazil. Estuar. Coast.33, 554–569. doi: 10.1007/s12237-009-9181-9
2
Ara K. Yamaki K. Wada K. Fukuyama S. Okutsu T. Nagasaka S. et al . (2011). Temporal variability in physicochemical properties, phytoplankton standing crop and primary production for 7 years, (2002-2008) in the neritic area of Sagami Bay, Japan. J. Oceanogr.67, 87–111. doi: 10.1007/s10872-011-0010-y
3
Bacher C. Bioteau H. Chapelle A. (1995). Modelling the impact of a cultivated oyster population on the nitrogen dynamics: The Thau Lagoon case (France). Ophelia42, 29–54. doi: 10.1080/00785326.1995.10431496
4
Barlow R. Stuart V. Lutz V. Sessions H. Sathyendranath S. Platt T. et al . (2007). Seasonal pigment patterns of surface phytoplankton in the subtropical southern hemisphere. Deep-Sea Res.Pt I 10, 1687–1703. doi: 10.1016/j.dsr.2007.06.010
5
Bharathi M. D. Sarma V. V. S. S. (2019). Impact of monsoon-induced discharge on phytoplankton community structure in the tropical Indian estuaries. Reg. Stud. Mar. Sci.31, 100795. doi: 10.1016/j.rsma.2019.100795
6
Bharathi M. D. Sarma V. V. S. S. Ramaneswari K. (2018). Intra-annual variations in phytoplankton biomass and its composition in the tropical estuary: influence of river discharge. Mar. Polluti. Bull.129, 14–25. doi: 10.1016/j.marpolbul.2018.02.007
7
Bharathi M. D. Venkataramana V. Sarma V. V. S. S. (2022). Phytoplankton community structure is governed by salinity gradient and nutrient composition in the tropical estuarine system. Cont. Shelf Res.234, 104643. doi: 10.1016/j.csr.2021.104643
8
Burford M. A. Webster I. T. Revill A. T. Kenyon R. A. Whittle M. Curwen G. (2012). Controls on phytoplankton productivity in a wet-dry tropical estuary. Estuar. Coast Shelf S.113, 141–151. doi: 10.1016/j.ecss.2012.07.017
9
Cabrerizo M. J. Carrillo P. Villafane V. E. Helbling E. W. (2017). Differential impacts of global change variables on coastal South Atlantic phytoplankton: role of seasonal variations. Mar. Environ. Res.125, 63–72. doi: 10.1016/j.marenvres.2017.01.005
10
Casotti R. Brunet C. Aronne B. Ribera d’Alcala M. (2000). Mesoscale features of phytoplankton and planktonic bacteria in a coastal area as induced by external water masses. Mar. Ecol. Progr. Ser.195, 15–27. doi: 10.3354/meps195015
11
Chen B. He R. Cai P. Huang G. Wang F. (2022). Geochemical speciation, risk assessment, and sources identification of heavy metals in aangrove surface sediments from the Nanliu River Estuary of the Beibu Gulf, China. Sustainability14, 9112–9112. doi: 10.3390/su14159112
12
Cloern J. E. (1987). Turbidity as a control on phytoplankton biomass and productivity in estuaries. Cont. Shelf Res.7, 1367–1381. doi: 10.1016/0278-4343(87)90042-2
13
Cloern J. E. Jassby A. D. (2012). Drivers of change in estuarine-coastal ecosystems: discoveries from four decades of study in San Francisco Bay. Rev. Geophys.50, RG4001. doi: 10.1029/2012RG000397
14
Córdoba-Mena N. Florez-Leiva L. Atehortúa L. Obando E. (2020). Changes in phytoplankton communities in a tropical estuary in the Colombian Caribbean Sea. Estuar. Coast43, 2106–2127. doi: 10.1007/s12237-020-00750-z
15
Cubillo A. Lopes A. Ferreira J. Moore H. Service M. Bricker S. (2023). Quantification and valuation of the potential of shellfish ecosystem services in mitigating coastal eutrophication. Estuar. Coast. Shelf S.293, 108469. doi: 10.1016/j.ecss.2023.108469
16
Eker-Develi E. Konucu M. Psarra S. Slabakova N. Triantaphyllou M. Dimiza M. et al . (2023). Phytoplankton and pigment composition during an Emiliania huxleyi bloom in the Black Sea. Reg. Stud. Mar. Sci.65, 103070. doi: 10.1016/j.rsma.2023.103070
17
Farid S. Baderan D. (2024). Potential aquatic fauna in the food chain system in the coastal mangrove ecosystem of tomini bay boalemo Gorontalo. Indonesian J. Environ. Sci. Manage.1, 21–32.
18
Furuya K. Hayashi M. Yabushita Y. (1998). HPLC determination of phytoplankton pigments using N, N-dimethylformamide. J. Oeanogr.54, 199–203. doi: 10.1007/BF02751695
19
Galimany E. Lunt J. Freeman C. J. Segura-García I. Mossop M. Domingos A. et al . (2021). Bivalve feeding on the brown iide Aureoumbra lagunensis in a shallow coastal environment. Front. Mar. Sci.8, 714816. doi: 10.3389/fmars.2021.714816
20
Gazeau F. Gattuso J. P. Middelburg J. J. Brion N. Schiettecatte L. S. Frankignoulle M. et al . (2005). Planktonic and whole system metabolism in a nutrient-rich estuary (the Scheldt estuary). Estuaries28, 868–883. doi: 10.1007/BF02696016
21
General Administration of Quality Supervision, Inspection and Quarantine of the People’s Republic of China (2007). The specification for marine monitoring - Part 4: Seawater analysis. (Beijing, China: Standards Press China) 57–121.
22
Gibb S. W. Barlow R. G. Cummings D. G. Rees N. W. Trees C. C. Holligan P. et al . (2000). Surface phytoplankton pigment distributions in the Atlantic Ocean: an assessment of basin scale variability between 50°N and 50°S. Prog. Oceanogr.45, 339–368. doi: 10.1016/S0079-6611(00)00007-0
23
Glibert P. M. Wilkerson F. P. Dugdale R. C. Raven J. A. Dupont C. L. Leavitt P. R. et al . (2016). Pluses and minuses of ammonium and nitrate uptake and assimilation by phytoplankton and implications for productivity and community composition, with emphasis on nitrogen-enriched conditions. Limnol. Oceanogr.61, 165–197. doi: 10.1002/lno.10203
24
Godrijan J. Daniela M. Igor T. Robert P. Martin P. (2013). Seasonal phytoplankton dynamics in the coastal waters of north-eastern Adriatic Sea. J. Sea Res.77, 32–44. doi: 10.1016/j.seares.2012.09.009
25
Goebel N. L. Kremer J. N. Edwards C. A. (2006). Primary production in long island sound. Estuar. Coast.29, 232–245. doi: 10.1007/BF02781992
26
Guo J. Yang F. Costa O. S. Jr. Yan X. Wu M. Qiu H. et al . (2024). Nutrient budgets and biogeochemical dynamics in the coastal regions of northern Beibu Gulf, South China Sea: implication for the severe impact of human disturbance. Mar. Environ. Res.197, 106447. doi: 10.1016/j.marenvres.2024.106447
27
Havskum H. Schlüter L. Scharek R. Berdalet E. Jacquet S. (2004). Routine quantification of phytoplankton groups microscopy or pigment analyses? Mar. Ecol. Prog. Ser.273, 31–42. doi: 10.3354/meps273031
28
Holmer M. Olsen A. B. (2022). Role of decomposition of mangrove and seagrass detritus in sediment carbon and nitrogen cycling in a tropical mangrove forest. Mari. Ecol. Prog. Ser.230, 87–101. doi: 10.3354/meps230087
29
Hulot V. Saulnier D. Lafabrie C. Gaertner-Mazouni N. (2020). Shellfish culture: A complex driver of planktonic communities. Rev. Aquacult.12, 33–46. doi: 10.1111/raq.12303
30
Jiang T. Chen F. Yu Z. Lu L. Wang Z. (2016). Size-dependent depletion and community disturbance of phytoplankton under intensive oyster mariculture based on HPLC pigment analysis in Daya Bay, South China Sea. Environ. Pollut.219, 804–814. doi: 10.1016/j.envpol.2016.07.058
31
Jiang Z. Liu J. Chen J. Chen Q. Yan X. Xuan J. et al . (2014). Responses of summer phytoplankton community to drastic environmental changes in the Changjiang (Yangtze River) Estuary during the past 50 years. Water Res.54, 1–11. doi: 10.1016/j.watres.2014.01.032
32
Kies L. (1997). Distribution, biomass and production of planktonic and benthic algae in the Elbe Estuary. Oceanographic Literature Rev.11, 1328.
33
Kocum E. Underwood G. J. C. Nedwell D. B. (2002). Simultaneous measurement of phytoplanktonic primary production, nutrient and light availability along a turbid, eutrophic UK east coast estuary (the Colne Estuary). Mar. Ecol. Prog. Ser.231, 1–12. doi: 10.3354/meps231001
34
Lao Q. Liu G. Shen Y. Su Q. Lei X. (2021). Biogeochemical processes and eutrophication status of nutrients in the northern Beibu Gulf, South China. J. Earth Syst. Sci.130, 199. doi: 10.1007/s12040-021-01706-y
35
Lawrenz E. Smith E. M. Richardson T. L. (2013). Spectral irradiance, phytoplankton community composition and primary productivity in a salt marsh estuary, North Inlet, South Carolina, USA. Estuar. Coast.36, 347–364. doi: 10.1007/s12237-012-9567-y
36
Li S. Dai Z. Mei X. Huang H. Wei W. Gao J. (2017). Dramatic variations in water discharge and sediment load from Nanliu River (China) to the Beibu Gulf during 1960s–2013. Quat. Int.440, 12–23. doi: 10.1016/j.quaint.2016.02.065
37
Lionard M. Muylaert K. Van Gansbeke D. Vyverman W. (2005). Influence of changes in salinity and light intensity on growth of phytoplankton communities from the Schelde river and estuary (Belgium/The Netherlands). Hydrobiologia540, 105–115. doi: 10.1007/s10750-004-7123-x
38
Liu T. Huang R. Sun Y. Liu Y. Song Z. (2024). Rapid mangrove expansion triggered by low river discharge episode in Nanliu river estuary, Beibu Gulf of China. Front. Mar. Sci.11, 1285518. doi: 10.3389/fmars.2024.1285518
39
Lønborg C. Müller M. Butler E. C. Jiang S. Ooi S. K. Trinh D. H. et al . (2021). Nutrient cycling in tropical and temperate coastal waters: is latitude making a difference? Estuar. Coast Shelf S.262, 107571. doi: 10.1016/j.ecss.2021.107571
40
Lucas L. V. Koseff J. R. Cloern J. E. Monismith S. G. Thompson J. K. (1999). Processes governing phytoplankton blooms in estuaries. I: The local production-loss balance. Mar. Ecol. Prog. Ser.187, 1–15. doi: 10.3354/meps187001
41
Mackey M. D. Mackey D. J. Higgins H. W. Wright S. W. (1996). CHEMTAX-A program for estimating class abundance from chemical markers: Application to HPLC measurements of phytoplankton. Mar. Ecol. Prog. Ser.144, 265–283. doi: 10.3354/meps144265
42
May C. L. Koseff J. R. Lucas L. V. Cloern J. E. Schoellhamer D. H. (2003). Effects of spatial and temporal variability of turbidity on phytoplankton blooms. Mar. Ecol. Prog. Ser.254, 111–128. doi: 10.3354/meps254111
43
Mendes C. R. Cartaxana P. Brotas V. (2007). HPLC determination of phytoplankton and microphytobenthos pigments: comparing resolution and sensitivity of a C18 and a C8 method. Limnol. Oceanogr-Meth.5, 363–370. doi: 10.4319/lom.2007.5.363
44
Mendes C. R. B. Tavano V. M. Leal M. C. de Souza M. S. Brotas V. Garcia C. A. E. et al . (2013). Shifts in the dominance between diatoms and cryptophytes during three late summers in the Bransfield Strait (Antarctic Peninsula). Polar Biol.36, 537–547. doi: 10.1007/s00300-012-1282-4
45
Mo Y. Chen K. Ahmed M. K. Gu H. Ou D. Li W. et al . (2024). Spatial phytoplankton community structure revealed by photosynthetic pigments in the tropical estuarine-coastal zone (Bangladesh). Mar. Environ. Res.201, 106696. doi: 10.1016/j.marenvres.2024.106696
46
Moisan T. A. Blattner K. L. Makinen C. P. (2010). Influences of temperature and nutrients on Synechococcus abundance and biomass in the southern Mid-Atlantic Bight. Cont. Shelf Res.30, 1275–1282. doi: 10.1016/j.csr.2010.04.005
47
Naik S. Acharya B. C. Mohapatra A. (2009). Seasonal variations of phytoplankton in Mahanadi estuary, east coast of India. Indian J. Mar. Geo Sci.38, 184–190.
48
Paerl H. W. (2006). Assessing and managing nutrient-enhanced eutrophication in estuarine and coastal waters: interactive effects of human and climatic perturbations. Ecol. Eng.26, 40–54. doi: 10.1016/j.ecoleng.2005.09.006
49
Paerl H. W. Rossignol K. L. Hall S. N. Peierls B. L. Wetz M. S. (2010). Phytoplankton community indicators of short-and long-term ecological change in the anthropogenically and climatically impacted Neuse River Estuary, North Carolina, USA. Estuar. Coast33, 485–497. doi: 10.1007/s12237-009-9137-0
50
Paerl H. W. Valdes L. M. Pinckney J. L. Piehler M. F. Dyble J. Moisander P. H. (2003). Phytoplankton photopigments as indicators of estuarine and coastal eutrophication. Bioscience53, 953–964. doi: 10.1641/0006-3568(2003)053[0953:PPAIOE]2.0.CO;2
51
Pednekar S. M. Matondkar S. P. Gomes H. D. R. Goes J. I. Parab S. Kerkar V. (2011). Fine-scale responses of phytoplankton to freshwater influx in a tropical monsoonal estuary following the onset of southwest monsoon. J. Earth Syst. Sci.120, 545–556. doi: 10.1007/s12040-011-0073-6
52
Petersen J. K. Loo L. O. Taylor D. (2019). Evaluating chlorophyll depletion in mitigation mussel cultivation at multiple scales. Aquacult. Env. Interac.11, 263–278. doi: 10.3354/aei00312
53
Rashed-Un-Nabi M. Al-Mamun M. A. Ullah M. H. Mustafa M. G. (2011). Temporal and spatial distribution of fish and shrimp assemblage in the Bakkhali river estuary of Bangladesh in relation to some water quality parameters. Mar. Biol. Res.7, 436–452. doi: 10.1080/17451000.2010.527988
54
Riisgard H. U. Kittner C. Seerup D. F. (2003). Regulation of opening state and filtration rate in filter-feeding bivalves (Cardium edule, Mytilus edulis, Mya arenaria) in response to low algal concentration. J. Exp. Mar. Biol. Ecol.284, 105–127. doi: 10.1016/S0022-0981(02)00496-3
55
Rocha L. A. Bass A. L. Robertson D. R. Bowen B. W. (2002). Adult habitat preferences, larval dispersal, and the comparative phylogeography of three Atlantic surgeon fishes (Teleostei: Acanthuridae). Mol. Ecol.11, 243–251. doi: 10.1046/j.0962-1083.2001.01431.x
56
Sarthou G. Timmermans K. R. Blain S. Treguer P. (2005). Growth physiology and fate of diatoms in the ocean: a review. J. Sea Res.53, 25–42. doi: 10.1016/j.seares.2004.01.007
57
Ston J. Kosakowska A. (2000). Qualitative and quantitative analysis of Baltic phytoplankton pigments. Oceanologia42, 493–504.
58
Sun T. Macrander A. Kaiser D. (2014). A water movement study in Lianzhou Bay, Guangxi province, China. J. Ocean U. China13, 13–22. doi: 10.1007/s11802-014-1963-4
59
Tan X. Qu B. Zhu Y. Zhao H. (2025). Spatial Distribution and Influencing Factors of Chlorophyll a in Lianzhou Bay, Guangxi Province, China. Environments12(2), 50. doi: 10.3390/environments12020050
60
Tao W. Niu L. Liu F. Cai H. Ou S. Zeng D. et al . (2020). Influence of river-tide dynamics on phytoplankton variability and their ecological implications in two Chinese tropical estuaries. Ecol. Indic.115, 106458. doi: 10.1016/j.ecolind.2020.106458
61
Tong K. Zhao Y. Wei Y. Hu B. Deng J. Xie Y. (2022). Quantifying sediment retention by high-density small water conservancy facilities under insignificant variation of water discharge in the Nanliu River Basin, Beibu Gulf. Jour. Hydrol-Reg. Stud.43, 101184. doi: 10.1016/j.ejrh.2022.101184
62
Wang C. Gu J. Li W. Wang J. Wang Z. Lin Q. (2024). Metabarcoding reveals a high diversity and complex eukaryotic microalgal community in coastal waters of the northern Beibu Gulf, China. Front. Microbiol.15, 1403964. doi: 10.3389/fmicb.2024.1403964
63
Wang L. Huang H. An L. Thoha H. Bong C. Xiao W. et al . (2018). Comparison of photosynthetic pigments and phytoplankton assemblages in two types of coastal regions in southeast Asia-Indonesian Throughflow and river estuary. Acta Oceanol. Sin.37, 18–27. doi: 10.1007/s13131-018-1284-3
64
Wang J. Zhang Z. (2020). Phytoplankton, dissolved oxygen and nutrient patterns along a eutrophic river-estuary continuum: observation and modeling. J. Environ. Manage.261, 110233. doi: 10.1016/j.jenvman.2020.110233
65
Wei C. Wang Y. Zhang R. Liu F. Zhang Z. E. Wang J. et al . (2024). Spatiotemporal distribution and potential risks of antibiotics in coastal water of Beibu Gulf, South China Sea: Livestock and poultry emissions play essential effect. J. Hazard. Mater.466, 133550. doi: 10.1016/j.jhazmat.2024.133550
66
Wheat E. Ruesink J. L. (2013). Commercially-cultured oysters (Crassostrea gigas) exert top-down control on intertidal pelagic resources in Willapa Bay, Washington, USA. J. Sea Res.81, 33–39. doi: 10.1016/j.seares.2013.04.006
67
Wysocki L. A. Bianchi T. S. Powell R. T. Reuss N. (2006). Spatial variability in the coupling of organic carbon, nutrients, and phytoplankton pigments in surface waters and sediments of the Mississippi River plume. Estuarine. Estuar. Coast. Shelf. S.69, 47–63. doi: 10.1016/j.ecss.2006.03.022
68
Xiao W. Wang L. Laws E. Xie Y. Chen J. Liu X. et al . (2018). Realized niches explain spatial gradients in seasonal abundance of phytoplankton groups in the South China Sea. Prog. Oceanogr.162, 223–239. doi: 10.1016/j.pocean.2018.03.008
69
Xu S. Liu Y. Fan J. Xiao Y. Qi Z. Lakshmikandan M. (2022). Impact of salinity variation and silicate distribution on phytoplankton community composition in Pearl River estuary, China. Ecohydrol. Hydrobiol.3), 466–475. doi: 10.1016/j.ecohyd.2022.01.004
70
Xu S. Xiao Y. Xu Y. Xu L. Cai Y. Qi Z. (2024). Effects of seasonal variations and environmental factors on phytoplankton community structure and abundance in Beibu Gulf, China. Ecohydrol. Hydrobiol.106982. doi: 10.1016/j.ocecoaman.2023.106982
71
Ye Y. Xiang P. Wang L. Yang Y. Wang Y. Lin M. et al . (2017). The structure and distribution of phytoplankton community in the Nanliujiang estuary during spring. Haiyang Xuebao39, 111–123. doi: 10.3969/ji.ssn.0253-4193.2017.10.010
72
Yu J. Zhang X. Liu J. Liu R. Wang X. (2016). Numerical study on the infl uences of Nanliu River runoff and tides on water age in Lianzhou Bay. Chin. J. Oceanol. Limn.34, 1106–1113. doi: 10.1007/s00343-016-5110-5
73
Zapata M. Rodríguez F. Garrido J. L. (2000). Separation of chlorophylls and carotenoids from marine phytoplankton: a new HPLC method using a reversed-phase C8 column and pyridine-containing mobile phases. Mar. Ecol. Prog. Ser.195, 29–45. doi: 10.3354/meps195029
74
Zhang J. Mo L. Li X. Zhu Y. Hu B. Zhang L. (2022). Distribution, historical variations and geochemical fractions of toxic trace metals and their ecological risks in sediments of the Nanliu River Estuary, South China. Ecol. Indic.145, 109708. doi: 10.1016/j.ecolind.2022.109708
75
Zhao C. Liu S. Jiang Z. Wu Y. Cui L. Huang X. et al . (2019). Nitrogen purification potential limited by nitrite reduction process in coastal eutrophic wetlands. Sci. Total Environ.694, 133702. doi: 10.1016/j.scitotenv.2019.133702
76
Zhong Y. Liu X. Xiao W. Laws E. A. Chen J. Wang L. et al . (2020). Phytoplankton community patterns in the Taiwan Strait match the characteristics of their realized niches. Prog. Oceanogr.186, 102366. doi: 10.1016/j.pocean.2020.102366
77
Zhu Z. Y. Ng W. M. Liu S. M. Zhang J. Chen J. C. Wu Y. (2009). Estuarine phytoplankton dynamics and shift of limiting factors: A study in the Changjiang (Yangtze River) Estuary and adjacent area. Estuar. Coast. Shelf S.84, 393–401. doi: 10.1016/j.ecss.2009.07.005
Summary
Keywords
pigments, phytoplankton, community structure, seasonal variation, Brackish bay
Citation
Ye Y, Tian Y, Zhou Q, Chen Y, Wang Y, Xing B, Jia C, Xiang P and He X (2025) Dynamics of phytoplankton in estuaries and changes in environmental driving factors: a study of Lianzhou Bay in Guangxi, China. Front. Mar. Sci. 12:1603340. doi: 10.3389/fmars.2025.1603340
Received
31 March 2025
Accepted
14 May 2025
Published
04 June 2025
Volume
12 - 2025
Edited by
Meilin WU, Chinese Academy of Sciences (CAS), China
Reviewed by
Hongju Chen, Ocean University of China, China
Feixue Fu, University of Southern California, United States
Updates
Copyright
© 2025 Ye, Tian, Zhou, Chen, Wang, Xing, Jia, Xiang and He.
This is an open-access article distributed under the terms of the Creative Commons Attribution License (CC BY). The use, distribution or reproduction in other forums is permitted, provided the original author(s) and the copyright owner(s) are credited and that the original publication in this journal is cited, in accordance with accepted academic practice. No use, distribution or reproduction is permitted which does not comply with these terms.
*Correspondence: Peng Xiang, xiangpeng@tio.org.cn; Xuebao He, hexuebao@tio.org.cn
†These authors have contributed equally to this work and share first authorship
Disclaimer
All claims expressed in this article are solely those of the authors and do not necessarily represent those of their affiliated organizations, or those of the publisher, the editors and the reviewers. Any product that may be evaluated in this article or claim that may be made by its manufacturer is not guaranteed or endorsed by the publisher.