 Mallela Pruthvi Raju1
 Subramanian Veerasingam2*
 V. Suneel3
 Fahad Syed Asim2
 Hana Ahmed Khalil2
 Mark Chatting4
 P. Suneetha1
 P. Vethamony2
- 1Department of Meteorology and Oceanography, Andhra University, Visakhapatnam, India
- 2Environmental Science Center, Qatar University, Doha, Qatar
- 3CSIR-National Institute of Oceanography, Dona Paula, Goa, India
- 4School of Civil Engineering, University College Dublin, Dublin, Ireland
Globally, the growth of plastic production has increased exponentially from 1.5 million metric tons (Mt) in 1950 to 400.3 Mt in 2022, resulting in a substantial increase of marine litter along the coastal region. Presently, there is a growing interest in using an artificial intelligence (AI) based automatic and cost-effective approach to identify marine litter for clean-up processes. This study aims to understand the spatial distribution of marine litter along the central east coast of India using the conventional method and AI based object detection approach. From the field survey, a total of 4588 marine litter items could be identified, with an average of 1.147 ± 0.375 items/m2. Based on clean coast index, 37.5% of beaches were categorized as ‘dirty’ and 62.5% of beaches as ‘extremely dirty’. For the machine learning approach ‘You Only Look Once (YOLOv5)’ model was used to detect and classify various types of marine litter items. A total of 9714 images representing seven categories of marine litter (plastic, metal, glass, fabric, paper, processed wood, and rubber) were extracted from eight field videos recorded across diverse beach settings. The efficiency of the trained machine learning model was assessed using different metrices such as Recall, Precision, Mean average precision (mAP) and F1 score (a metric for forecast accuracy). The model achieved a F1 score of 0.797, mAP 0.5 of 0.95, and mAP@0.5-0.95 of 0.76, and these results show that YOLOv5 model could be used in conjunction with conventional marine litter monitoring, classification and detection to provide quick and accurate results.
1 Introduction
Marine litter is one of the major planetary threats, affecting global biodiversity, ecosystem services, economy, and human health. Though marine litter has been reported in different parts of the world since 1980, it took long time to realize that it is a serious environmental issue for a sustainable and healthy planet (Veerasingam et al., 2020; Bellou et al., 2021). Globally, nearly 85% of the marine litter is plastic debris (UNEP, 2021; Morales-Caselles et al., 2021). Various marine biota (turtles and mammals) and sea birds are entangled and/or ingested by marine litter (Kuhn and van Franeker, 2020; Mghili et al., 2023). When marine litter degrades, it can release chemicals into the waters, which bio-accumulate in marine food webs as well as absorb into it (Agamuthu et al., 2019). Marine litter is one of the vectors for the transport of micro and macro-size biofouling organisms in the ocean over long distances from their origins through winds and currents (Carlton et al., 2017), and hitchhiked rafting species are one of the major stressors to global biodiversity (Al-Khayat et al., 2021).
Globally, organizations such as Joint Group of Experts on the Scientific Aspects of Marine Environmental Protection (GESAMP), Oslo and Paris Conventions (OSPAR), Marine Strategy Framework Directive (MSFD), United Nations Environment Programme (UNEP), National Oceanic and Atmospheric Administration (NOAA), South Asia Co-operative Environment Programme (SACEP), Helsinki Commission (HELCOM), Commonwealth Scientific and Industrial Research Organization (CSIRO), and Permanent Commission for the South Pacific (CPPS) made some efforts, and established a standardized and harmonized conventional marine litter monitoring method. Subsequently, this method has been used in the International Coastal Clean-up (ICC) programs worldwide (Lusher et al., 2021; Song et al., 2021). However, the conventional marine litter monitoring method is expensive, time consuming and needs relatively large manpower. Therefore, research efforts are made to overcome the weakness of conventional method in assessing the marine litter type, concentration and distribution.
Researchers have found that there are several types of machine learning (ML) models that could be used to assist the process of marine litter monitoring and detection. ML models consist of three main sections in marine litter detection: (i) classification of image, (ii) object detection, and (iii) image segmentation (Jia et al., 2023). The ML object detection method can be categorized into two types to detect and classify marine litter - single stage (obtains the classification accuracy of the object and its coordinate position directly), and two stages (creating region proposals, and then categorising each proposal into different object classes) object detection algorithms (Kylili et al., 2019; Zhao et al., 2019; Panwar et al., 2020; Wolf et al., 2020; Garcia-Garin et al., 2021; Luo et al., 2022; Huang et al., 2023).
Marine litter has been detected and classified using the two stages or region proposal based object detection methods such as Faster Region – Conventional Neural Network (Faster R-CNN, Ren et al., 2021), Spatial Pyramid Pooling – network (SPP-net, Zhang et al., 2021), Fully Convolutional Network (FCN, Song et al., 2022), Feature Pyramid Network (FPN, Jia et al., 2022), and Mask Region based Convolutional Neural Network (Mask R–CNN, Deng et al., 2021). Mohsen et al. (2023) used five different supervised ML algorithms [Random Forest (RF), Support Vector Classifier (SVC), Artificial Neural Network (ANN), Decision Tree (DT), and Naïve Bayes (NB)] to train and validate the litter positions in the Sentinel-2 images. To classify and quantify the marine litter, researchers have also used single stage networks such as single shot multibox detector (SSD, Hammedi et al., 2019), and ‘you only look once’ (YOLO, Veerasingam et al., 2022).
The backbone network plays a critical role in the ability of object detection ML model to understand and extract features from input images or data. The common backbone object detection algorithms used in plastic waste object detection models include GoogLeNet (Rad et al., 2017), VGGNet (Papakonstantinou et al., 2021), DarkNet (Veerasingam et al., 2022), ResNeXt (Zhou et al., 2022), ResNet (He et al., 2016), DenseNet (Huang et al., 2017), EfficientNet (Tan and Le, 2019), and MobileNet (Bircanoglu and Arica, 2018). There are several devices and methods used to obtain input marine litter images for ML models including video camera (van Lieshout et al., 2020), smartphone (Veerasingam et al., 2022), unmanned aerial vehicle (Goncalves et al., 2020), underwater vehicle (Fulton et al., 2019; Escobar-Sanchez et al., 2022), satellite (Kikaki et al., 2022), underwater camera (Politikos et al., 2021), Research Vessel-mounted video camera (Armitage et al., 2022), Social Media and Crowdsourcing (Hausmann et al., 2017), collaboration with environmental organizations (Papakonstantinou et al., 2021), and citizen scientists program (Wu et al., 2023).
India has nearly 7500 km length of coastline, and one-third of its population lives close to the coastal areas. The rapid industrialization and population growth along the Indian coastlines contribute to a huge amount of marine litter (Mugilarasan et al., 2021). Numerous studies have been conducted to assess the level of marine litter along the east coast (Arunkumar et al., 2016; Edward et al., 2020; Krishnakumar et al., 2020; Saravanan et al., 2021; Karthikeyan et al., 2023; Mugilarasan et al., 2021, 2023; Kannan et al., 2023; Kiruba-Sankar et al., 2023) and west coast (Sulochanan et al., 2019; Kaladharan et al., 2020; Behera et al., 2021; Selvam et al., 2021; Kaviarasan et al., 2022; Daniel et al., 2020; Daniel and Thomas, 2023; De et al., 2022, 2023) of India. Recently, we have investigated spatial and seasonal variations of primary microplastics (plastic resin pellets) along the central east coast of India (Raju et al., 2023). The literature review shows that information on marine litter along the central east coast of India (Andhra Pradesh) is very scarce. Accumulation of marine litter along the Indian beaches, like any other beaches around the world, has been increasing exponentially for the past two decades, and this is causing negative effects on marine organisms, regional ecosystem, economy, and human (Mugilarasan et al., 2023; Mishra et al., 2023). Therefore, it is important to study types, abundance, and sources of litter for effective marine litter management and enforce policies (Kaviarasan et al., 2022; Sivadas et al., 2022). However, monitoring the marine litter along the Indian coast is a tough task, because of the long stretch of Indian coastline, inaccessibility of some of the beaches and requirement of huge manpower. Therefore, an effort is made in the present study to assess and characterize the marine litter accumulated along the central east coast of India, from the videos recorded by smartphone during surveys, using a machine learning-based object detection model (YOLO v5), which is cost and time-effective.
2 Materials and methods
2.1 Study area
The study area is the Andhra Pradesh (AP) coast, situated on the central east coast of India. Andhra Pradesh is the second longest coastline state (974 km) of India, extending from Srikakulam in the north to Nellore in the south with 9 districts along its stretch. The coastal region includes several harbours, ports, recreational beaches, bird and wildlife sanctuaries, estuaries, and freshwater lakes. The Godavari and Krishna are the two major rivers that enter the Bay of Bengal through the Andhra Pradesh coastline. According to the Marine Fisheries Census 2016, conducted jointly by the Central Marine Fisheries Research Institute (CMFRI) and the Department of Animal Husbandry, Dairying and Fisheries (DAHDF), the marine fisherfolk population in the nine coastal districts of Andhra Pradesh was estimated at 6.05 lakh, comprising 1.63 lakh fishermen families and 1.51 lakh active fishermen across 546 marine fishing villages. Furthermore, the Handbook on Fisheries Statistics – 2023 published by the Department of Fisheries, Government of India, reports that the total fisherfolk population in Andhra Pradesh stands 1,496,688, with an average of 115,129 fisherfolk per district across 13 districts. Annual mean rainfall is 1100 mm ((704 mm during the southwest monsoon (June-Sept), 277 mm during the northeast monsoon (Oct-Dec), 109 mm during pre-monsoon (Mar-May), and 10 mm in winter (Jan-Feb)) (Sangadi et al., 2022). The air temperature of this region ranges from 25°C to 45°C. The coastal region of Andhra Pradesh consists of various geological and geomorphological settings such as delta, tidal flat and coastal plain. Industries related to steel plants, oil refineries, aeronautics, shipbuilding, machine tools, electrical equipment, and pharmaceuticals are established within the coastal district of Visakhapatnam, where the port facilities and raw materials are easily accessible. Several industries that produce textiles, chemicals, fertilizers, cement, petroleum derivatives, and processed foods are found in the areas of Guntur and Vijayawada in the central-east region (Podile and Sree, 2018). In this study, eight popular beaches in Andhra Pradesh were selected for the marine litter survey: Krishnapatnam, Pottisubbayya Palem, Suryalanka, Perupalem, R.K Beach, Rushikonda, Bheemili, and Bandaruvanipeta. These beaches represent a range of environmental stresses due to heavy tourist traffic, proximity to ports and fishing harbours, industrial areas, river mouths, and both urban and rural settlements (Supplementary Table S1).
Several state and central government institutions and non-governmental organizations have conducted many beach cleaning campaigns along the Andhra Pradesh coast (Table 1). These beach cleaning activities were mainly conducted on the urban beaches such as Bheemili Beach, Rushikonda Beach, and Ramakrishna (R.K) Beach. However, beach cleaning activities in the remote beaches including Perupalem, Suryalanka, Pottisubbayyapalem, Krishnapatnam, and Bandaruvaniperta were very limited. In general, every September, beach cleaning activities are conducted in major beaches along the entire Indian coast under the International Coastal Clean-up Day program.
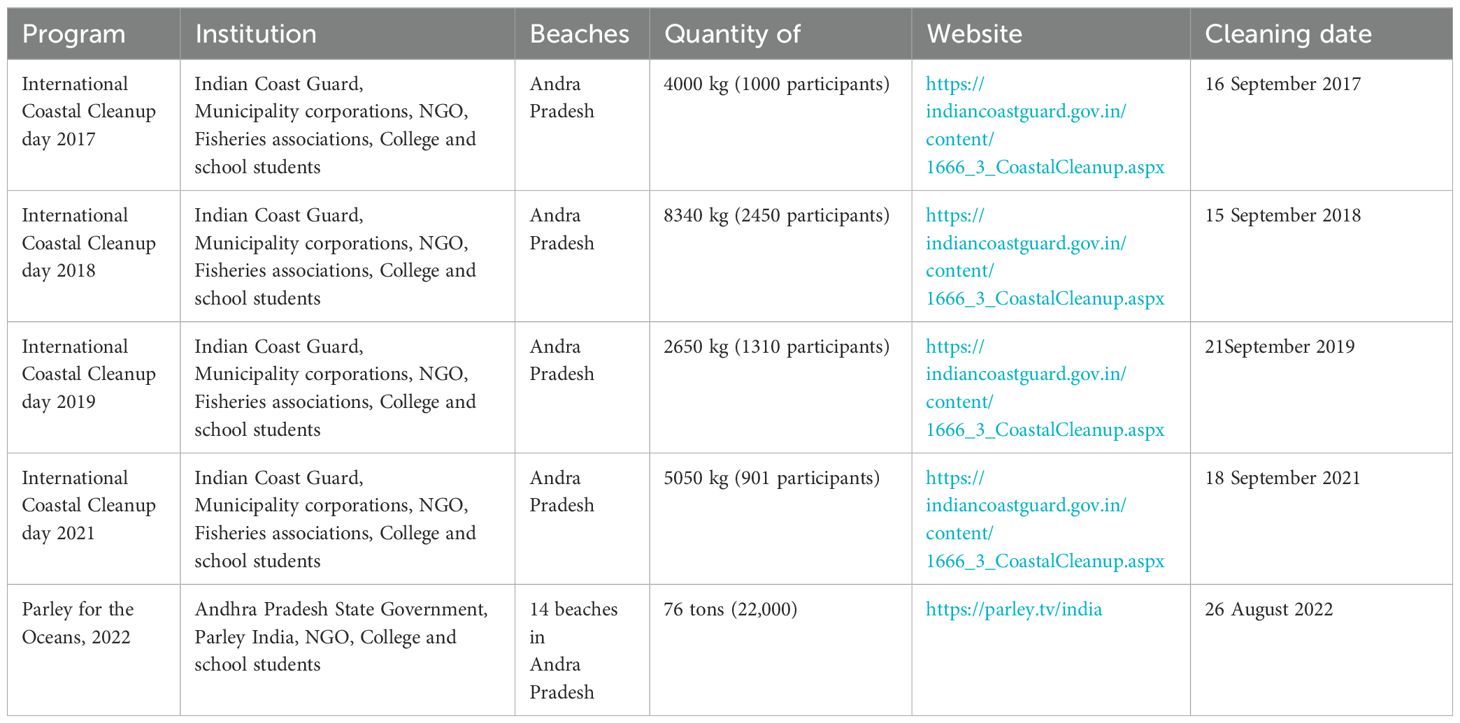
Table 1. Beach cleaning activities by the governmental and non-governmental organizations along the Andhra Pradesh coast.
The Visakhapatnam Tourism Department data show that 2.85 million domestic and 5,191 foreign travellers visited Visakhapatnam in December 2021. The number of tourists visited Visakhapatnam City and its surrounding areas in 2021 is about 1.7 million, including around 35,000 foreigners. Many of them preferred to visit Rushikonda, Kailasagiri, RK beach, Bhimili, Thotlakonda, and Simhachalam temple at Visakhapatnam. However, similar data are not available for the remote beaches.
2.2 Conventional ML survey method
The marine litter survey was conducted on eight beaches along the Andhra Pradesh coast (Figure 1) in June 2022, following the method proposed in (Galgani et al., 2013). At each beach, marine litter items were recorded in an area of 50 m wide x 1000 m long in the middle of the beach using a Vivo U10 smartphone camera of 1080p resolution and 30 frame per second. The width varied according to the natural characteristics of each beach; the maximum width recorded across all beaches was approximately 50 meters. Although some beaches had slightly narrower widths, a consistent length of 1000 meters was maintained throughout the survey. Marine litter items larger than 2.5 cm were considered for this survey, and they were identified and categorized based on the above method. In addition, video footage of marine litter at all the sampling beaches was recorded using a smartphone camera for the machine learning study.
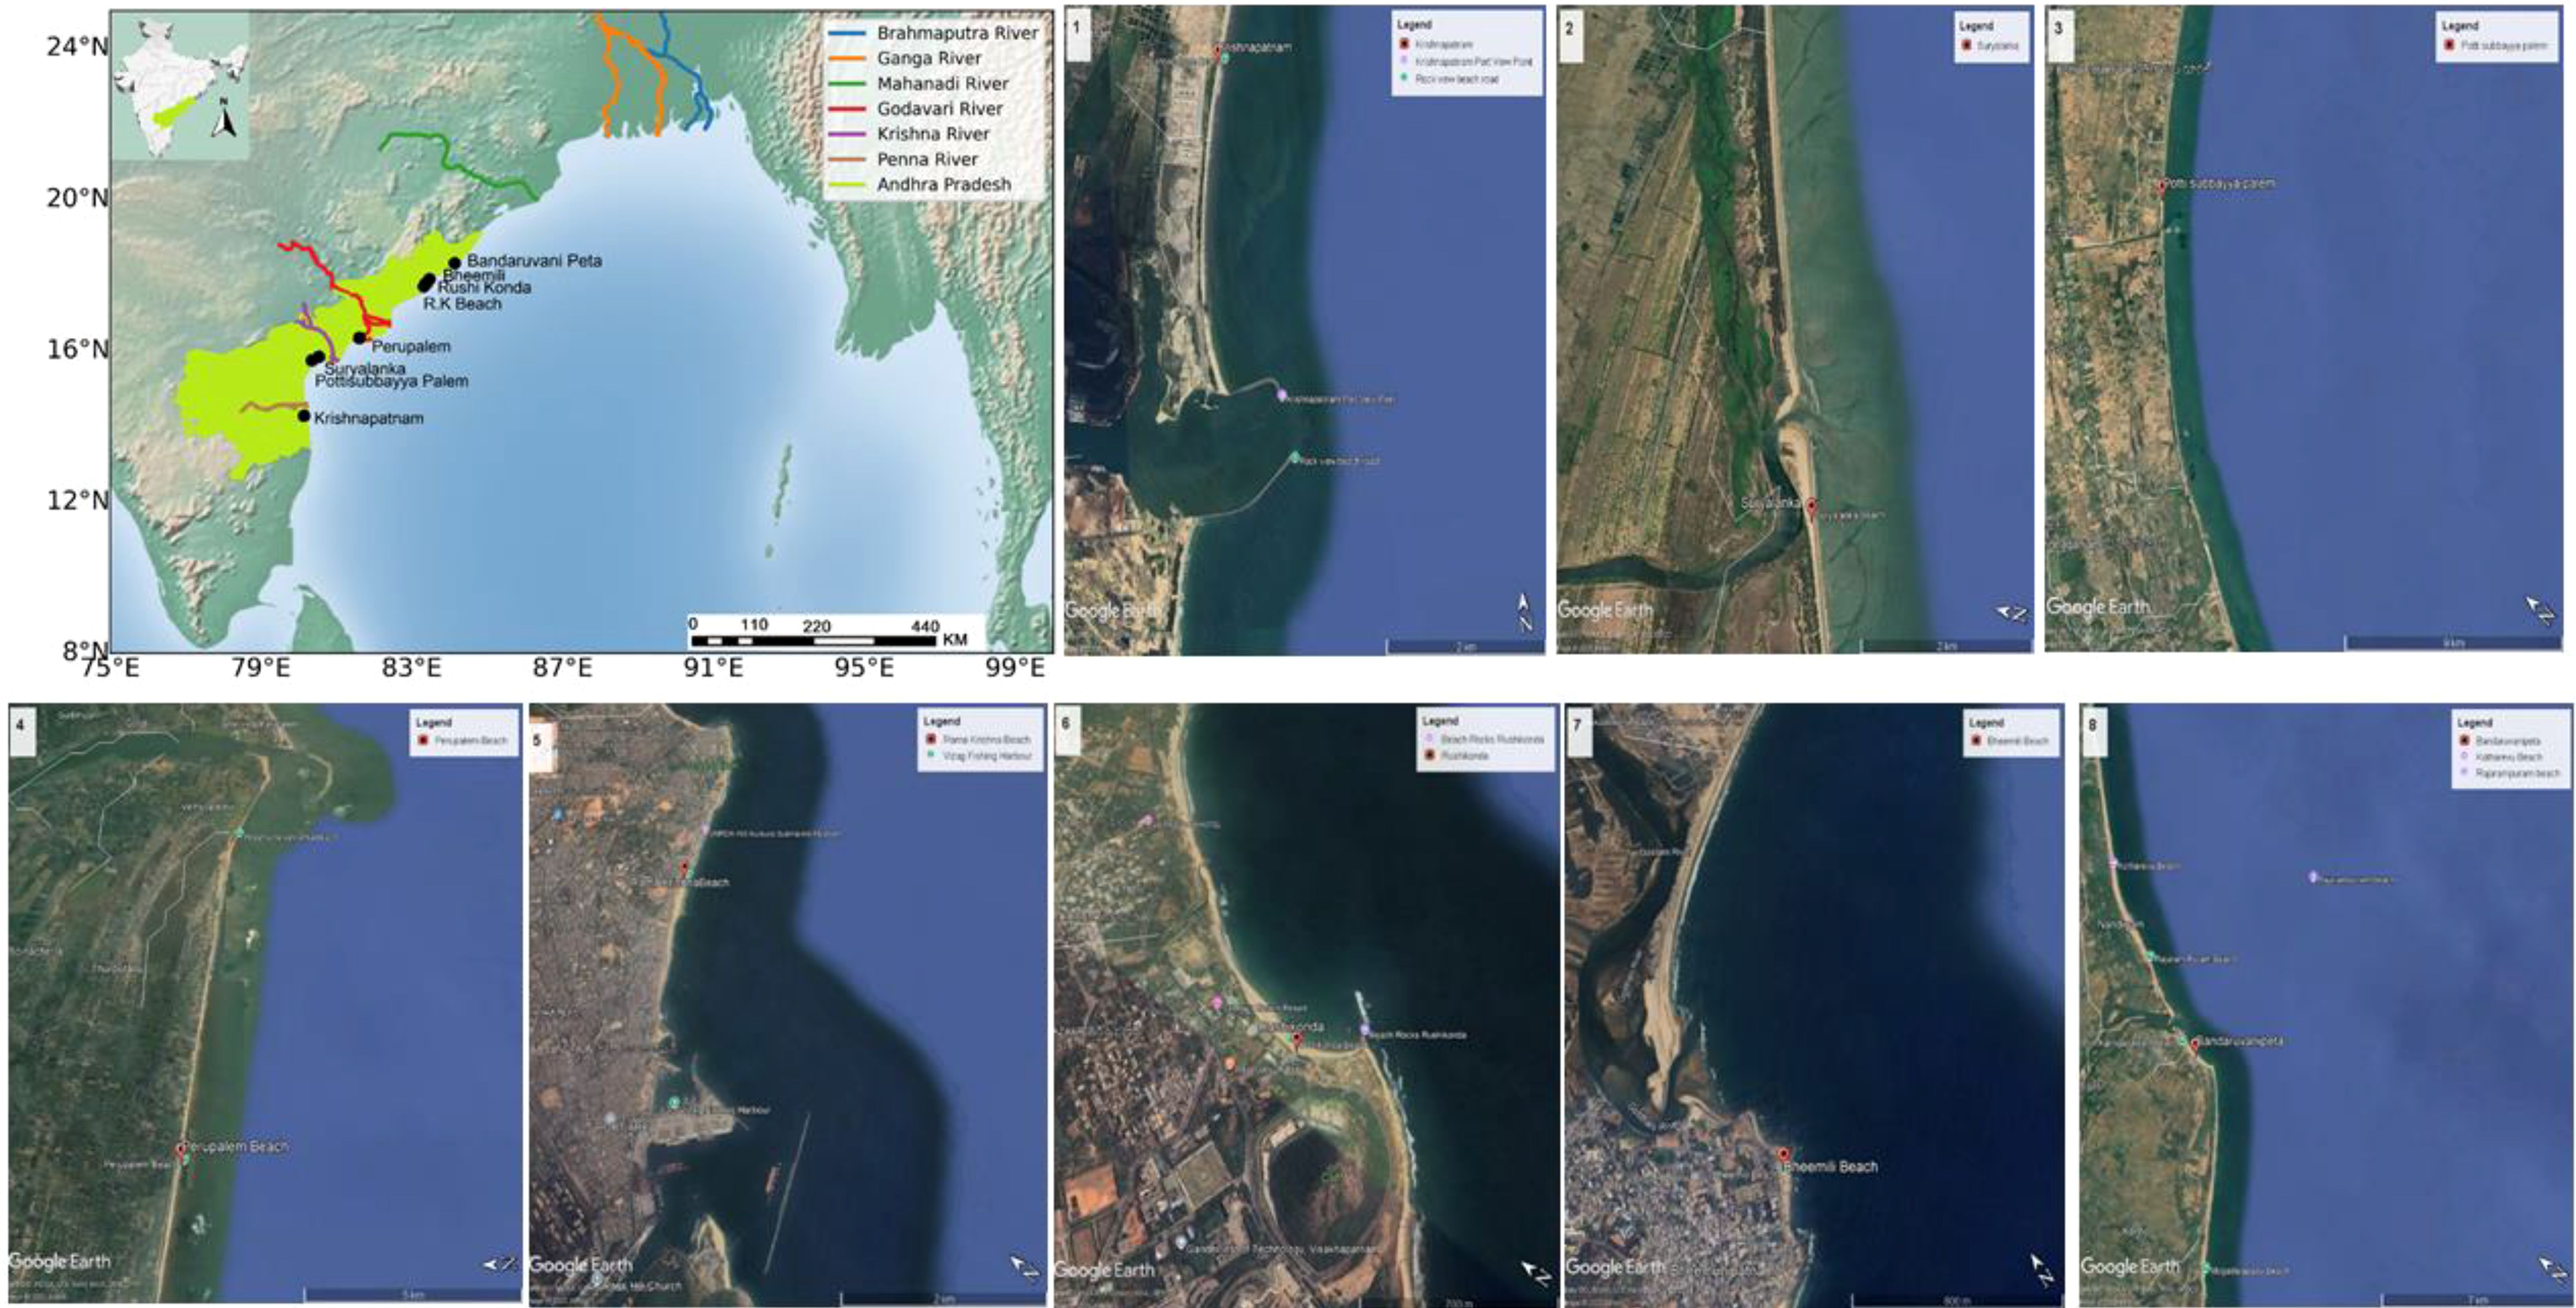
Figure 1. The study area and locations of marine litter survey conducted along the Andhra Pradesh coast. Marine litter survey conducted in the area between shoreline and upper beach limit along the transect.
2.3 Beach quality indices
The environmental status of surveyed beaches was assessed using Clean Coast Index (CCI), and Hazard Litter Index (HLI).
2.3.1 Clean Coast Index
To assess and categorize the environmental quality of beaches, CCI was calculated (only for plastic litter) using the following formula (Alkalay et al., 2007) (Equation 1):
Based on the CCI values, the status of the beaches was categorised into five different classes: (i) (CCI: 0–2) Very clean, (ii) (CCI: 2–5) Clean, (iii) (CCI: 5–10) Moderately clean, (iv) (CCI: 10–20) dirty, and (v) (CCI >20) extremely dirty (Alkalay et al., 2007).
2.3.2 Hazard Litter Index
HLI value is used to assess the probability of hazardous marine litter items such as sharp-edge litter (metal, glass, etc.), and toxic litter (medical waste and sanitary waste) (Rangel-Buitrago et al., 2019) (Equation 2).
HLI values were used to classify the surveyed beaches into different types, and the list is given in Supplementary Table S2.
2.4 Machine learning method
Machine learning (ML) is extensively used in object detection to enable the automatic identification and localization of objects within the images or videos. ‘You Only Look Once’ (YOLO) is one of the ML methods for object detection, proposed and written by Redmon et al. (2016), and it uses an open-source neural network framework, ‘Darknet’. YOLO has different types of computer vision object detectors such as YOLO-NAS, YOLOv8, YOLOv7, YOLOv6, YOLOv5, YOLOv4, YOLOv3, YOLOv2, and YOLO. YOLOv5 has four main versions - YOLO v5s, YOLO v5l, YOLO v5m, and YOLO v5x (Tong et al., 2023). In this study, the YOLO v5m model has been selected for automatic marine litter detection to minimize computing requirements. This model architecture is smaller, requires less training time, and more practical for real-world applications. The YOLO model consists of 3 main sections such as, backbone, neck and head. To extract hierarchical feature maps of various sizes from input images made up of cross-stage partial networks. In this study, Focus and CSPDarknet53 were used as backbone with four convolutional layers of feature maps. To increase the scale invariance of the input image dataset, spatial pyramid pooling was employed. Between the backbone and the detection head, the neck is a transitional stage. Typically, YOLOv5m uses a Path Aggregation Network (PANet) in the neck to combine data from various resolutions or scales. To enable the model to extract rich contextual information and multi-scale representations of objects in the input image, it is utilized to collect, fuse, and enhance features from the backbone. As the backbone and neck extract information from the incoming image, the head is crucial in processing those characteristics. Accurate and efficient predictions of object detection are made by combining the multi-scale and contextual data retrieved by the neck and backbone. Item localization, class prediction, and confidence score information for each item inside each grid cell of the input image are generated by the head (Supplementary Figure S1).
2.4.1 Dataset construction
Marine litter images were taken from the video footage recorded during the survey. From each video, 1 frame per second was extracted to maintain scene variation and avoid redundancy. The types of marine litter in these images were labelled and categorised as plastic, metal, glass, fabric, paper, processed wood, and rubber. A total of 9714 images were extracted from 8 video footages made-up the dataset. Augmentation techniques, including random shearing, rotation, translation, and scaling along with image enhancement techniques such as brightness normalization and contrast adjustment were applied to improve the adaptability of the model. This approach helped balance underrepresented classes, such as glass and metal.
2.4.2 Training and testing the model
The marine litter object detection model was performed using PyTorch 2.10 with an Intel (R) Core (TM) i7–10875 Central Processing Unit @ 2.30 GHz, Graphics Processing Unit chosen NVIDIA Geoforce RTX2080 super max-Q with video memory of 8 GB. Number of epochs and the batch size were set to 212 and 16, respectively in model training. Image datasets (9714 images) were split into training (80%) and validation (20%) datasets. In computer vision study, the ground truth bounding boxes are the most used annotation to evaluate the ML model. These bounding boxes are used in object detection and localization of tasks. The Darklabel tool was used to draw the corresponding ground truth mask of marine litter in the training and testing of images (Supplementary Figure S2). Cosine annealing scheduling was employed, with the learning rate set at 0.01. Stochastic Gradient Descent (SGD) was used as the optimizer, with a weight decay of 0.0005 and a momentum of 0.937. A little imbalance in class detection performance was observed based on the class-wise mean Average Precision (mAP), which was lowest for metal (0.89) and highest for plastic (0.98), followed closely by paper (0.98).
2.4.3 Evaluation matrices
Various indicators such as recall (R), precision (P), F1-Score and mean average precision (mAP) were used to assess the quality of the marine litter object detection model. P is a measure of number of objects detected accurately by the model (Equation 3), whereas R measures the ability of the model to find all positive instances (Equation 4). mAP measures the average P at different IoU (Intersection over Union) thresholds (Equation 5). IoU is the ratio of interaction area between the predicted bounding box and the ground truth bounding box to their union. The mAP was calculated by first computing the P-R curve for different confidence thresholds. Then, the average precision (AP) was calculated for each class, and the mean of these AP values was taken to get the mAP. The F1 score is a metric that balances P and R (Equation 6). The calculation formulae of evaluation matrices are given below:
Overall, the functional block diagram provides a clear summary of the workflow carried out in this study (Supplementary Figure S3).
3 Results and discussion
3.1 Spatial distribution and composition of marine litter
A total of 4588 marine litter items was recorded from 8 beaches along the coast of Andhra Pradesh. The abundance of marine litter in the surveyed beaches ranged from 0.778 items/m2 in Rushikonda to 1.964 items/m2 in the R.K Beach with an average of 1.147 ± 0.375 items/m2. The average abundance of marine litter in the study area is higher than the global average (1.0 items/m2) (Galgani et al., 2015). Marine litter along the central east coast of India was found to be higher than the densities observed along the southwest coast (0.45 ± 0.34, Mugilarasan et al., 2023) and northeast coast (0.98 ± 0.34, Mugilarasan et al., 2021) of India. On the other hand, the marine litter value found in this study was lower than those found in other Indian coasts such as Mumbai coast (1.6 ± 0.13, De et al., 2022), Thondi coast (4.09, Karthikeyan et al., 2021), Kanyakumari coast (6.71, Karthikeyan et al., 2023), and central west coast of India (8.5 ± 1.9, De et al., 2023).
The composition of marine litter was distributed in the following order: plastics > paper > rubber > processed wood > fabric > glass > metal (Supplementary Figure S4). The composition of plastics was dominant at all the beaches along the central east coast of India, ranging between 48.4% (Pottisubbayya Palem) and 80% (Rushi Konda) (Figure 2). The average composition of plastic litter found in this study (67.4%) is lesser than the global average of beach plastic litter (75%).
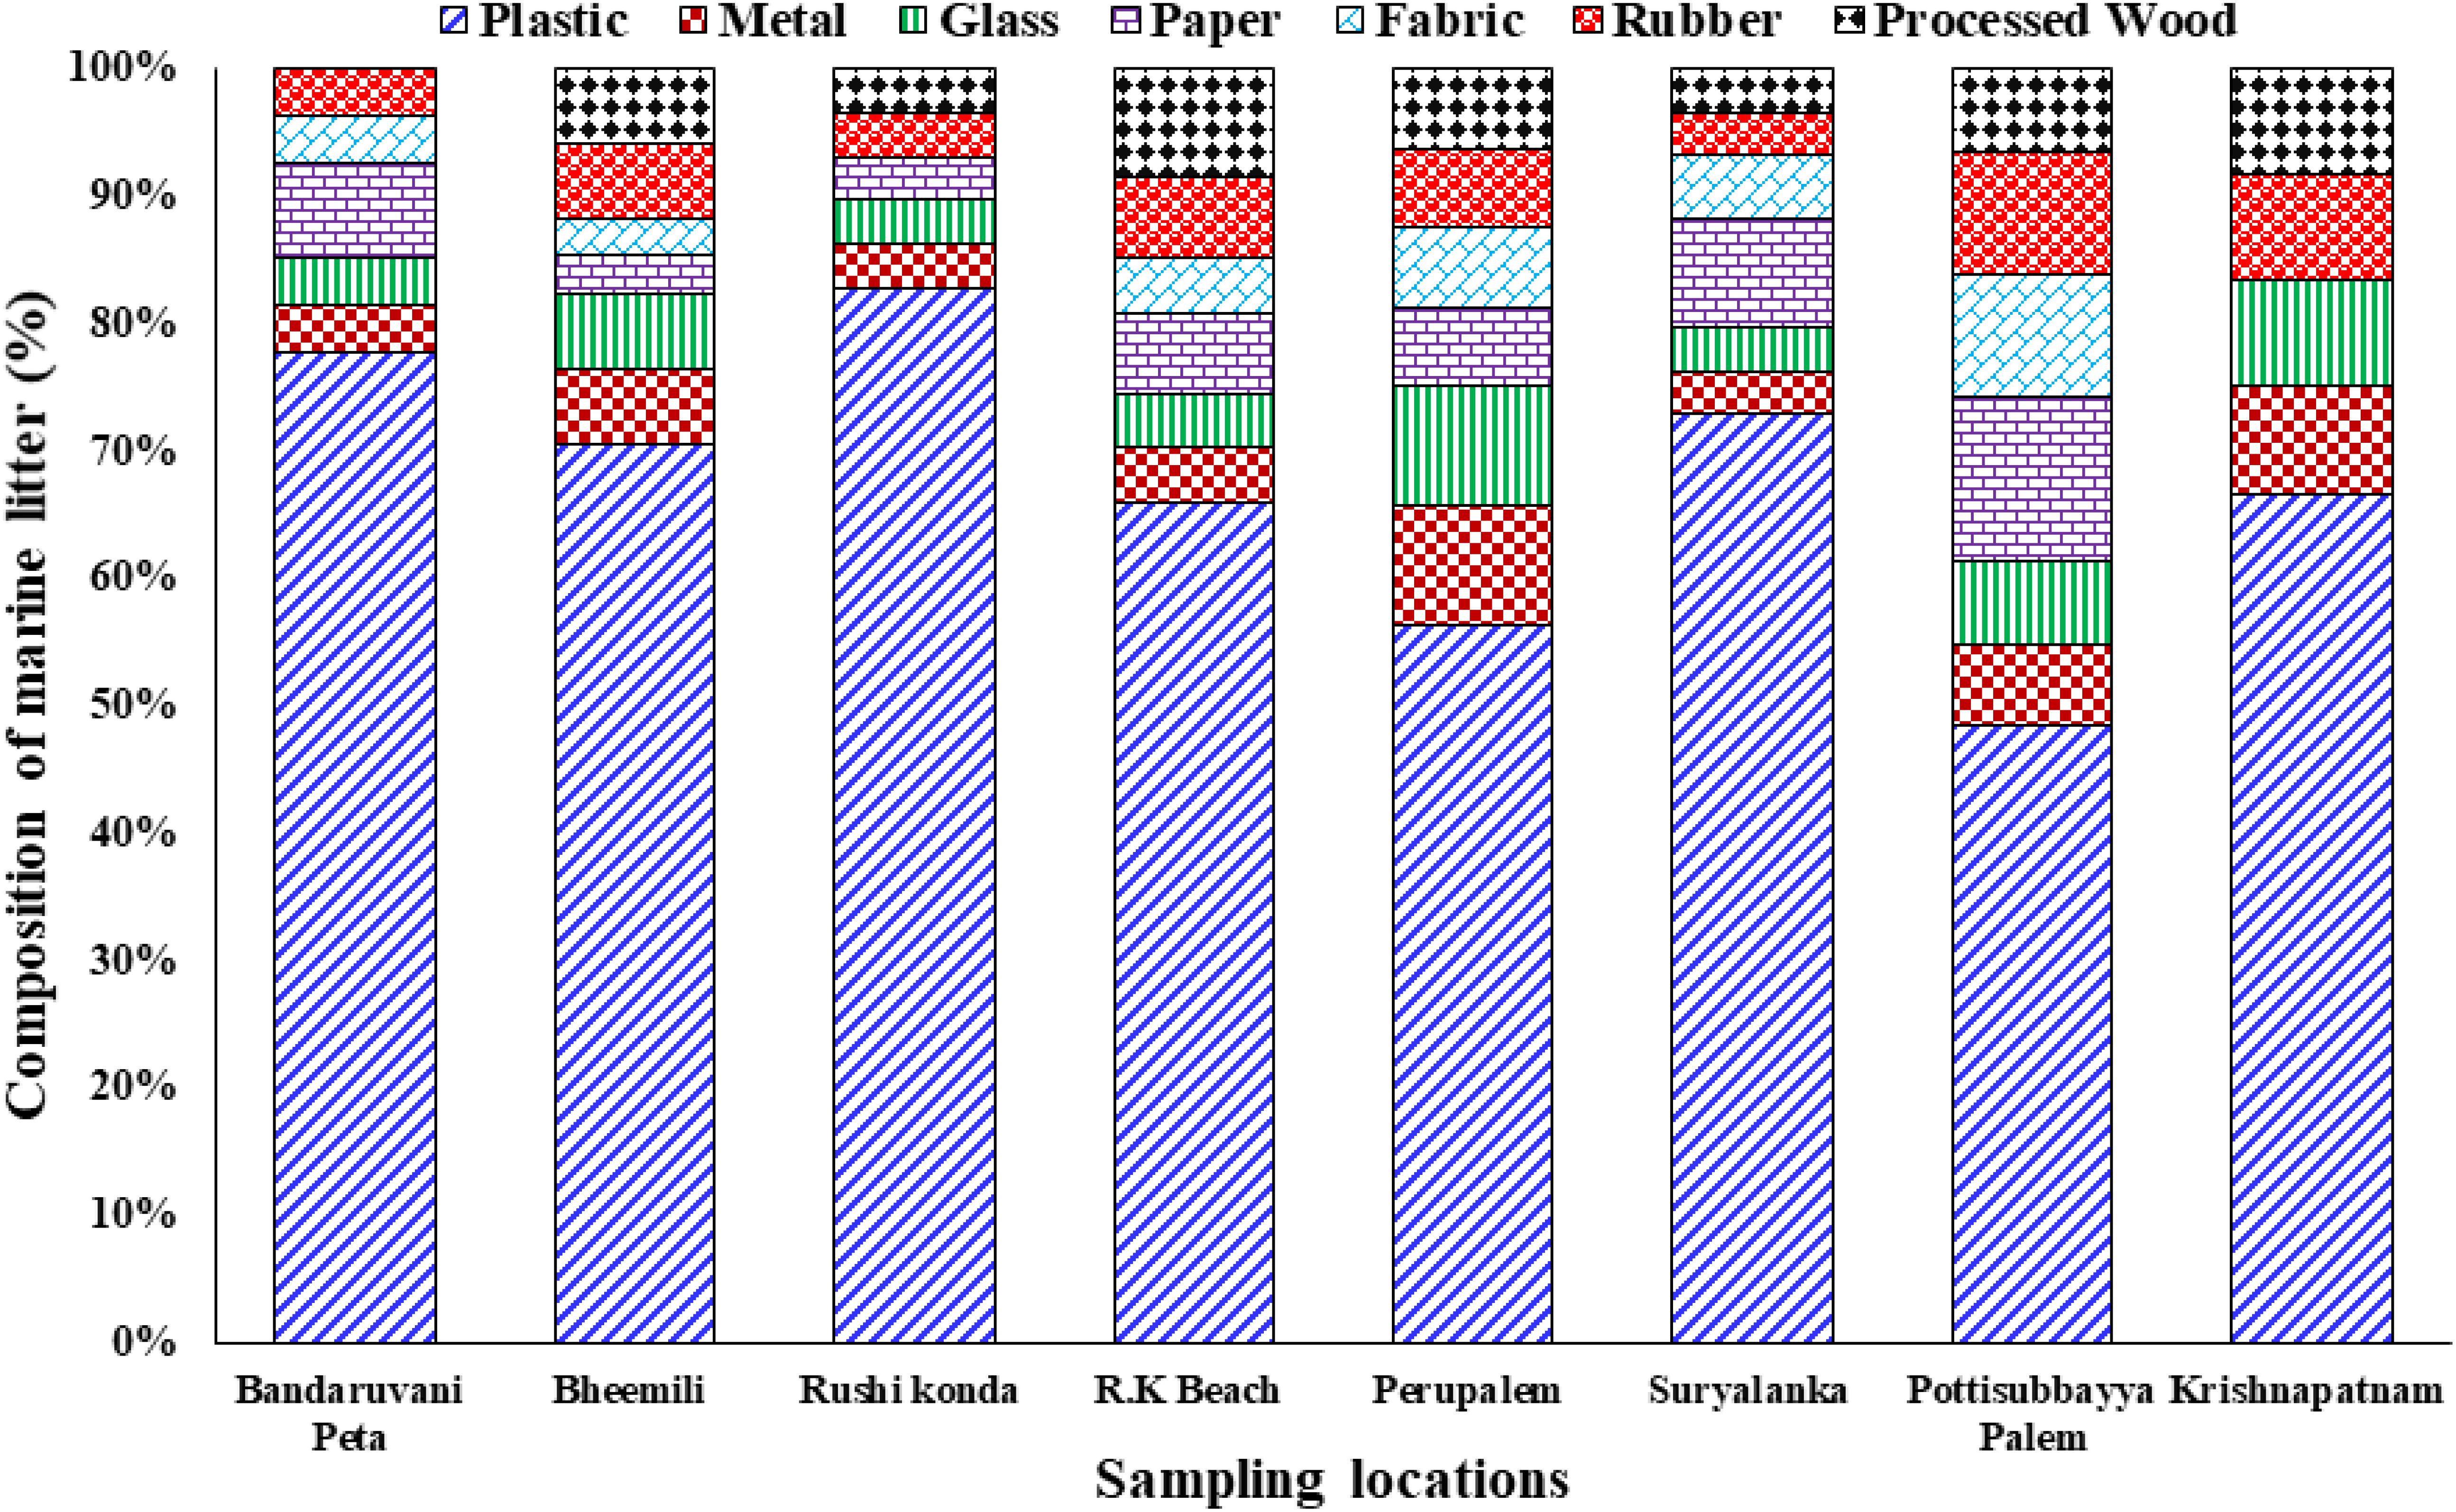
Figure 2. Location-wise percentage composition of marine litter items along the central east coast of India.
3.2 Beach quality assessment
The cleanliness and environmental quality of beaches have been classified using CCI, HLI, and LGI values. The obtained CCI values varied between 15.56 (Rushikonda) and 39.28 (R.K. Beach) (Figure 3). Based on the CCI values, 37.5% of the beaches are categorized as ‘dirty’ and 62.5% of beaches as ‘extremely dirty’. Similar results were reported in the beaches of the central west coast of India (De et al., 2023) and the northeast coast of India (Mugilarasan et al., 2021). According to HLI, seven of the surveyed beaches are categorised as Type II, and one beach as Type III (Figure 4), with considerable quantity of hazardous marine litter items. However, the quantity of hazardous litter items found in this study area was less than those found in the other beaches of India (Mugilarasan et al., 2021, 2023; De et al., 2023). Marine litter found in the Bandaruvanipeta, Bheemili and Perupalem beaches might have been originated from the rivers flowing adjacent to these beaches. As Krishnapatnam beach is in the vicinity of the port, we could find the accumulation of port-related litter. Since Bheemili and Rushikonda are famous tourist beaches, marine litter found in these beaches could be derived from the tourism related activities. In the Ramakrishna Beach, both port and tourism related marine litters are dominant. Perupalem and Suryalanka beaches attract very moderate tourism, and Pottisubbayyapalem beach is a very remote beach, where there are no tourism or port activities. Therefore, the marine litter items found on these beaches were primarily derived from the commercial and recreational activities in the land and nearshore region.
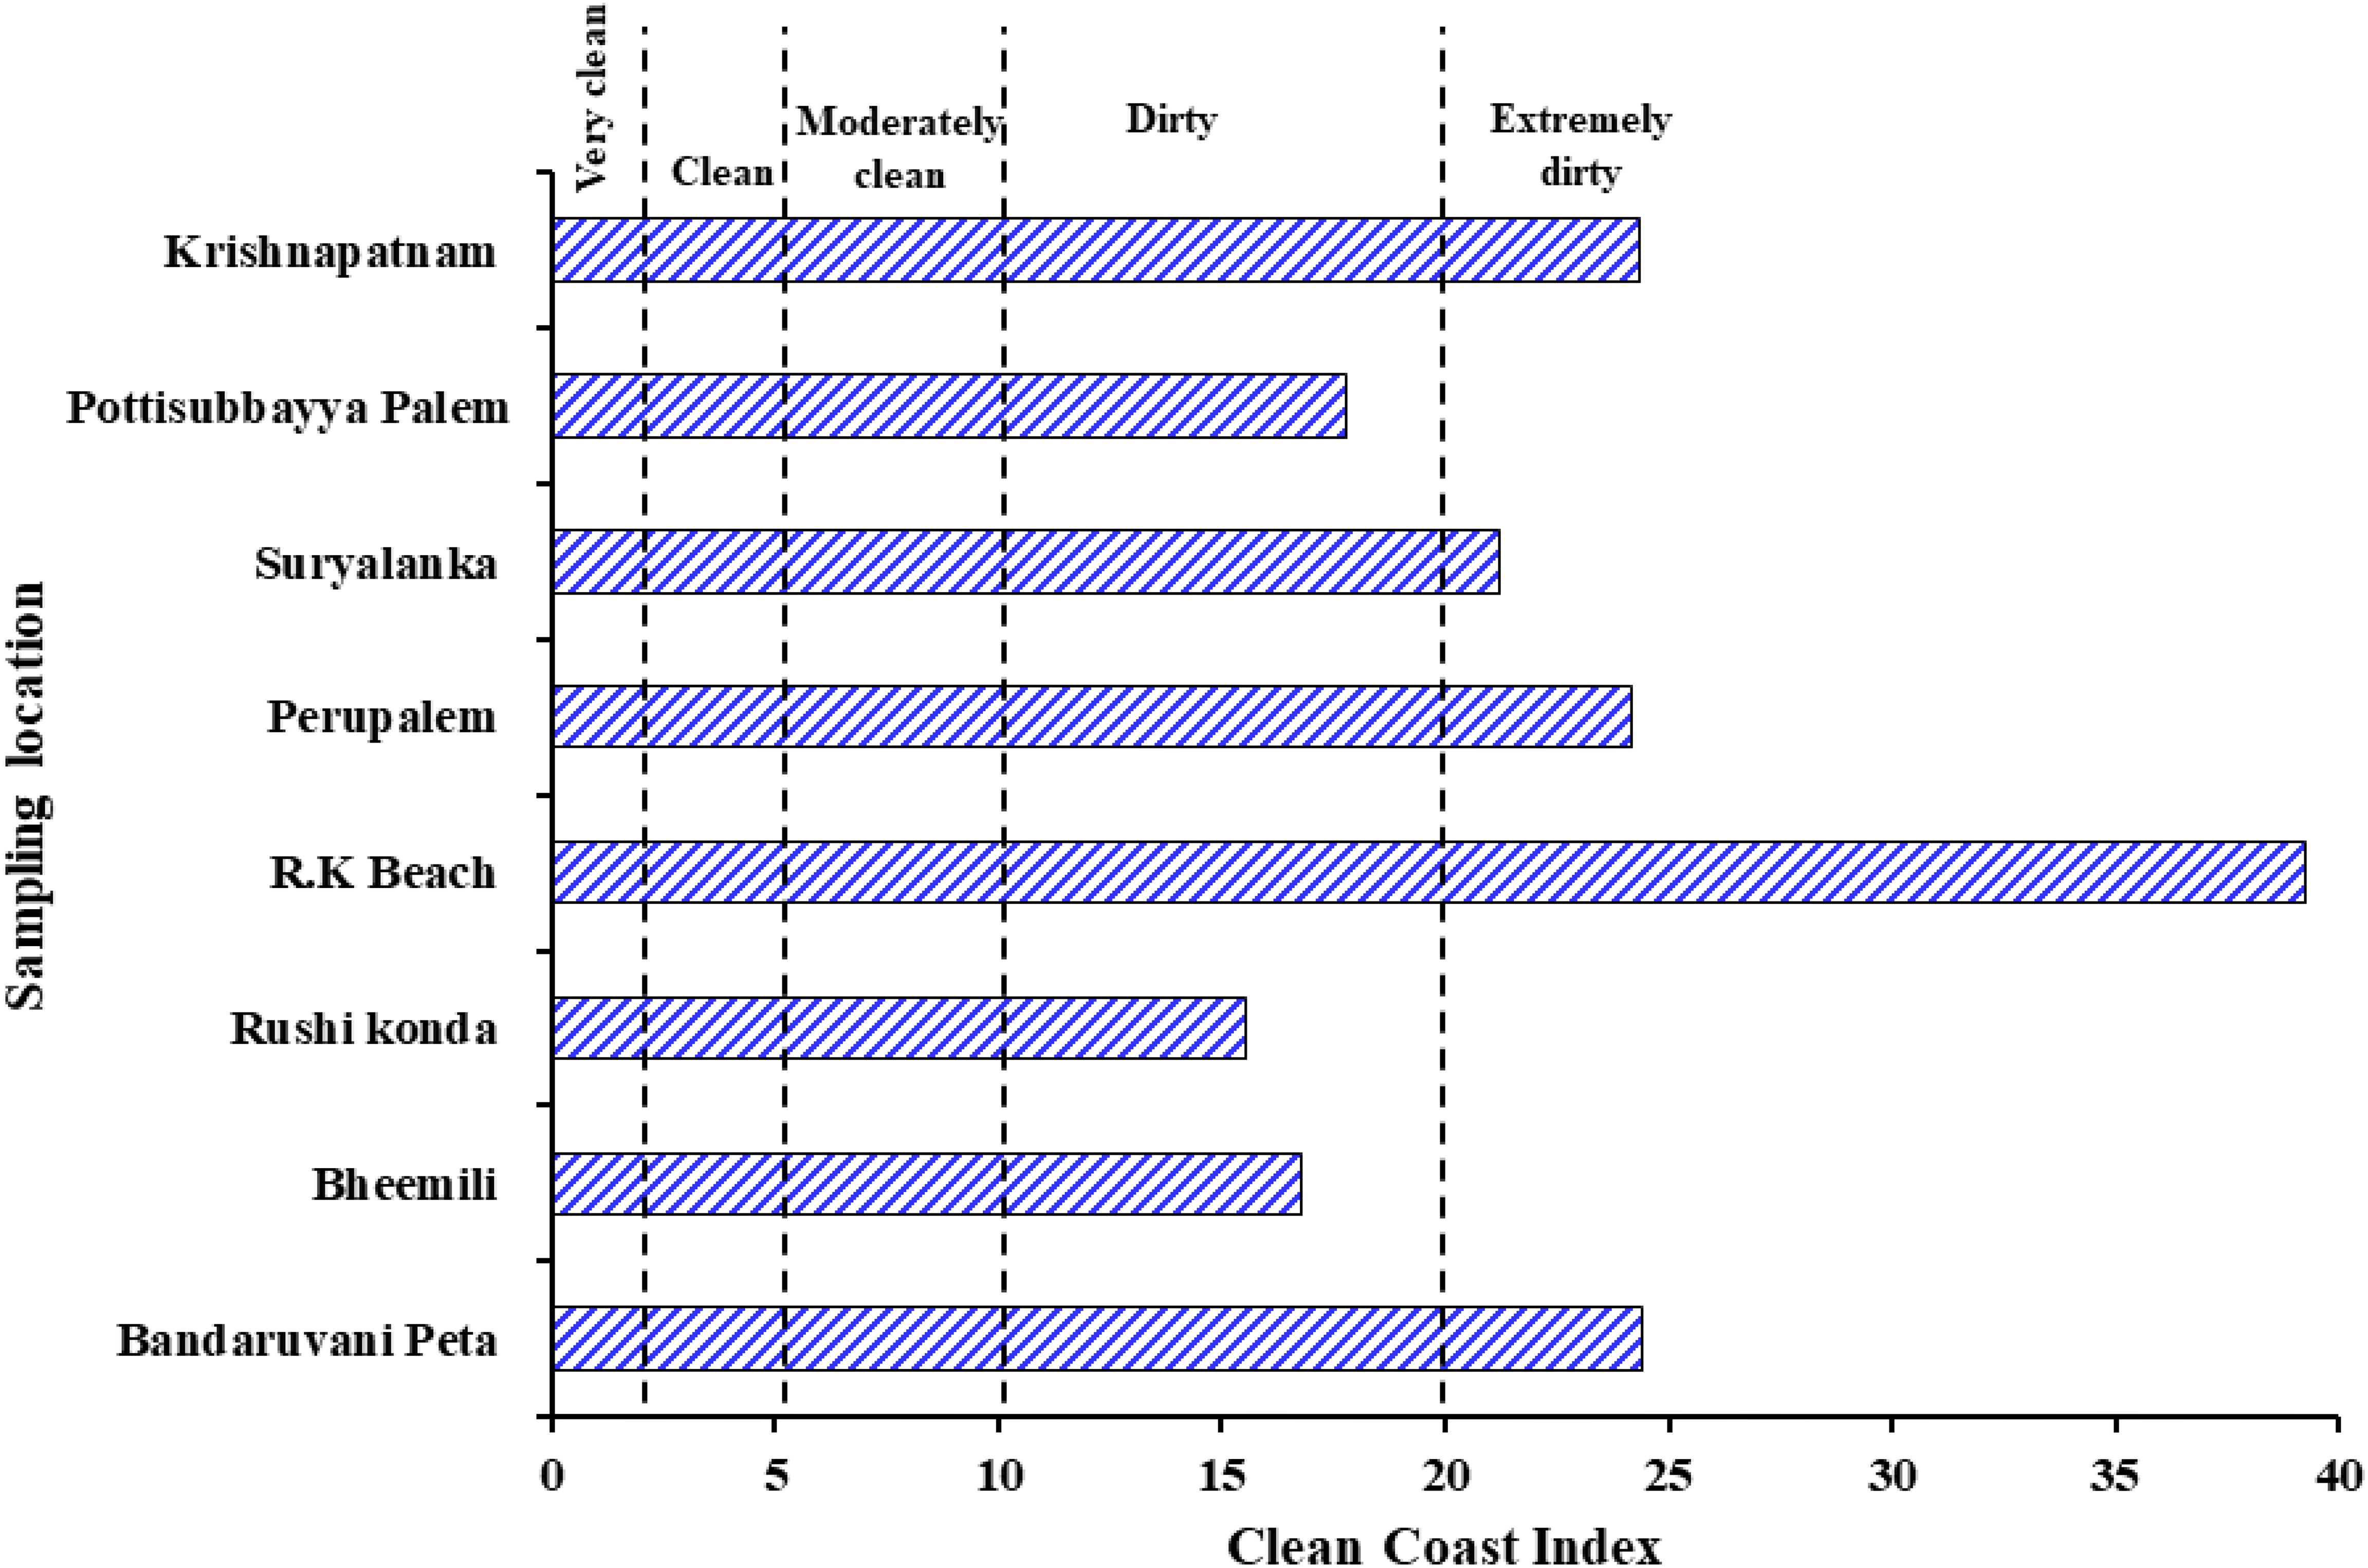
Figure 3. Clean coast index (CCI) values of beaches are showing the cleanliness status of beaches along the central east coast of India.
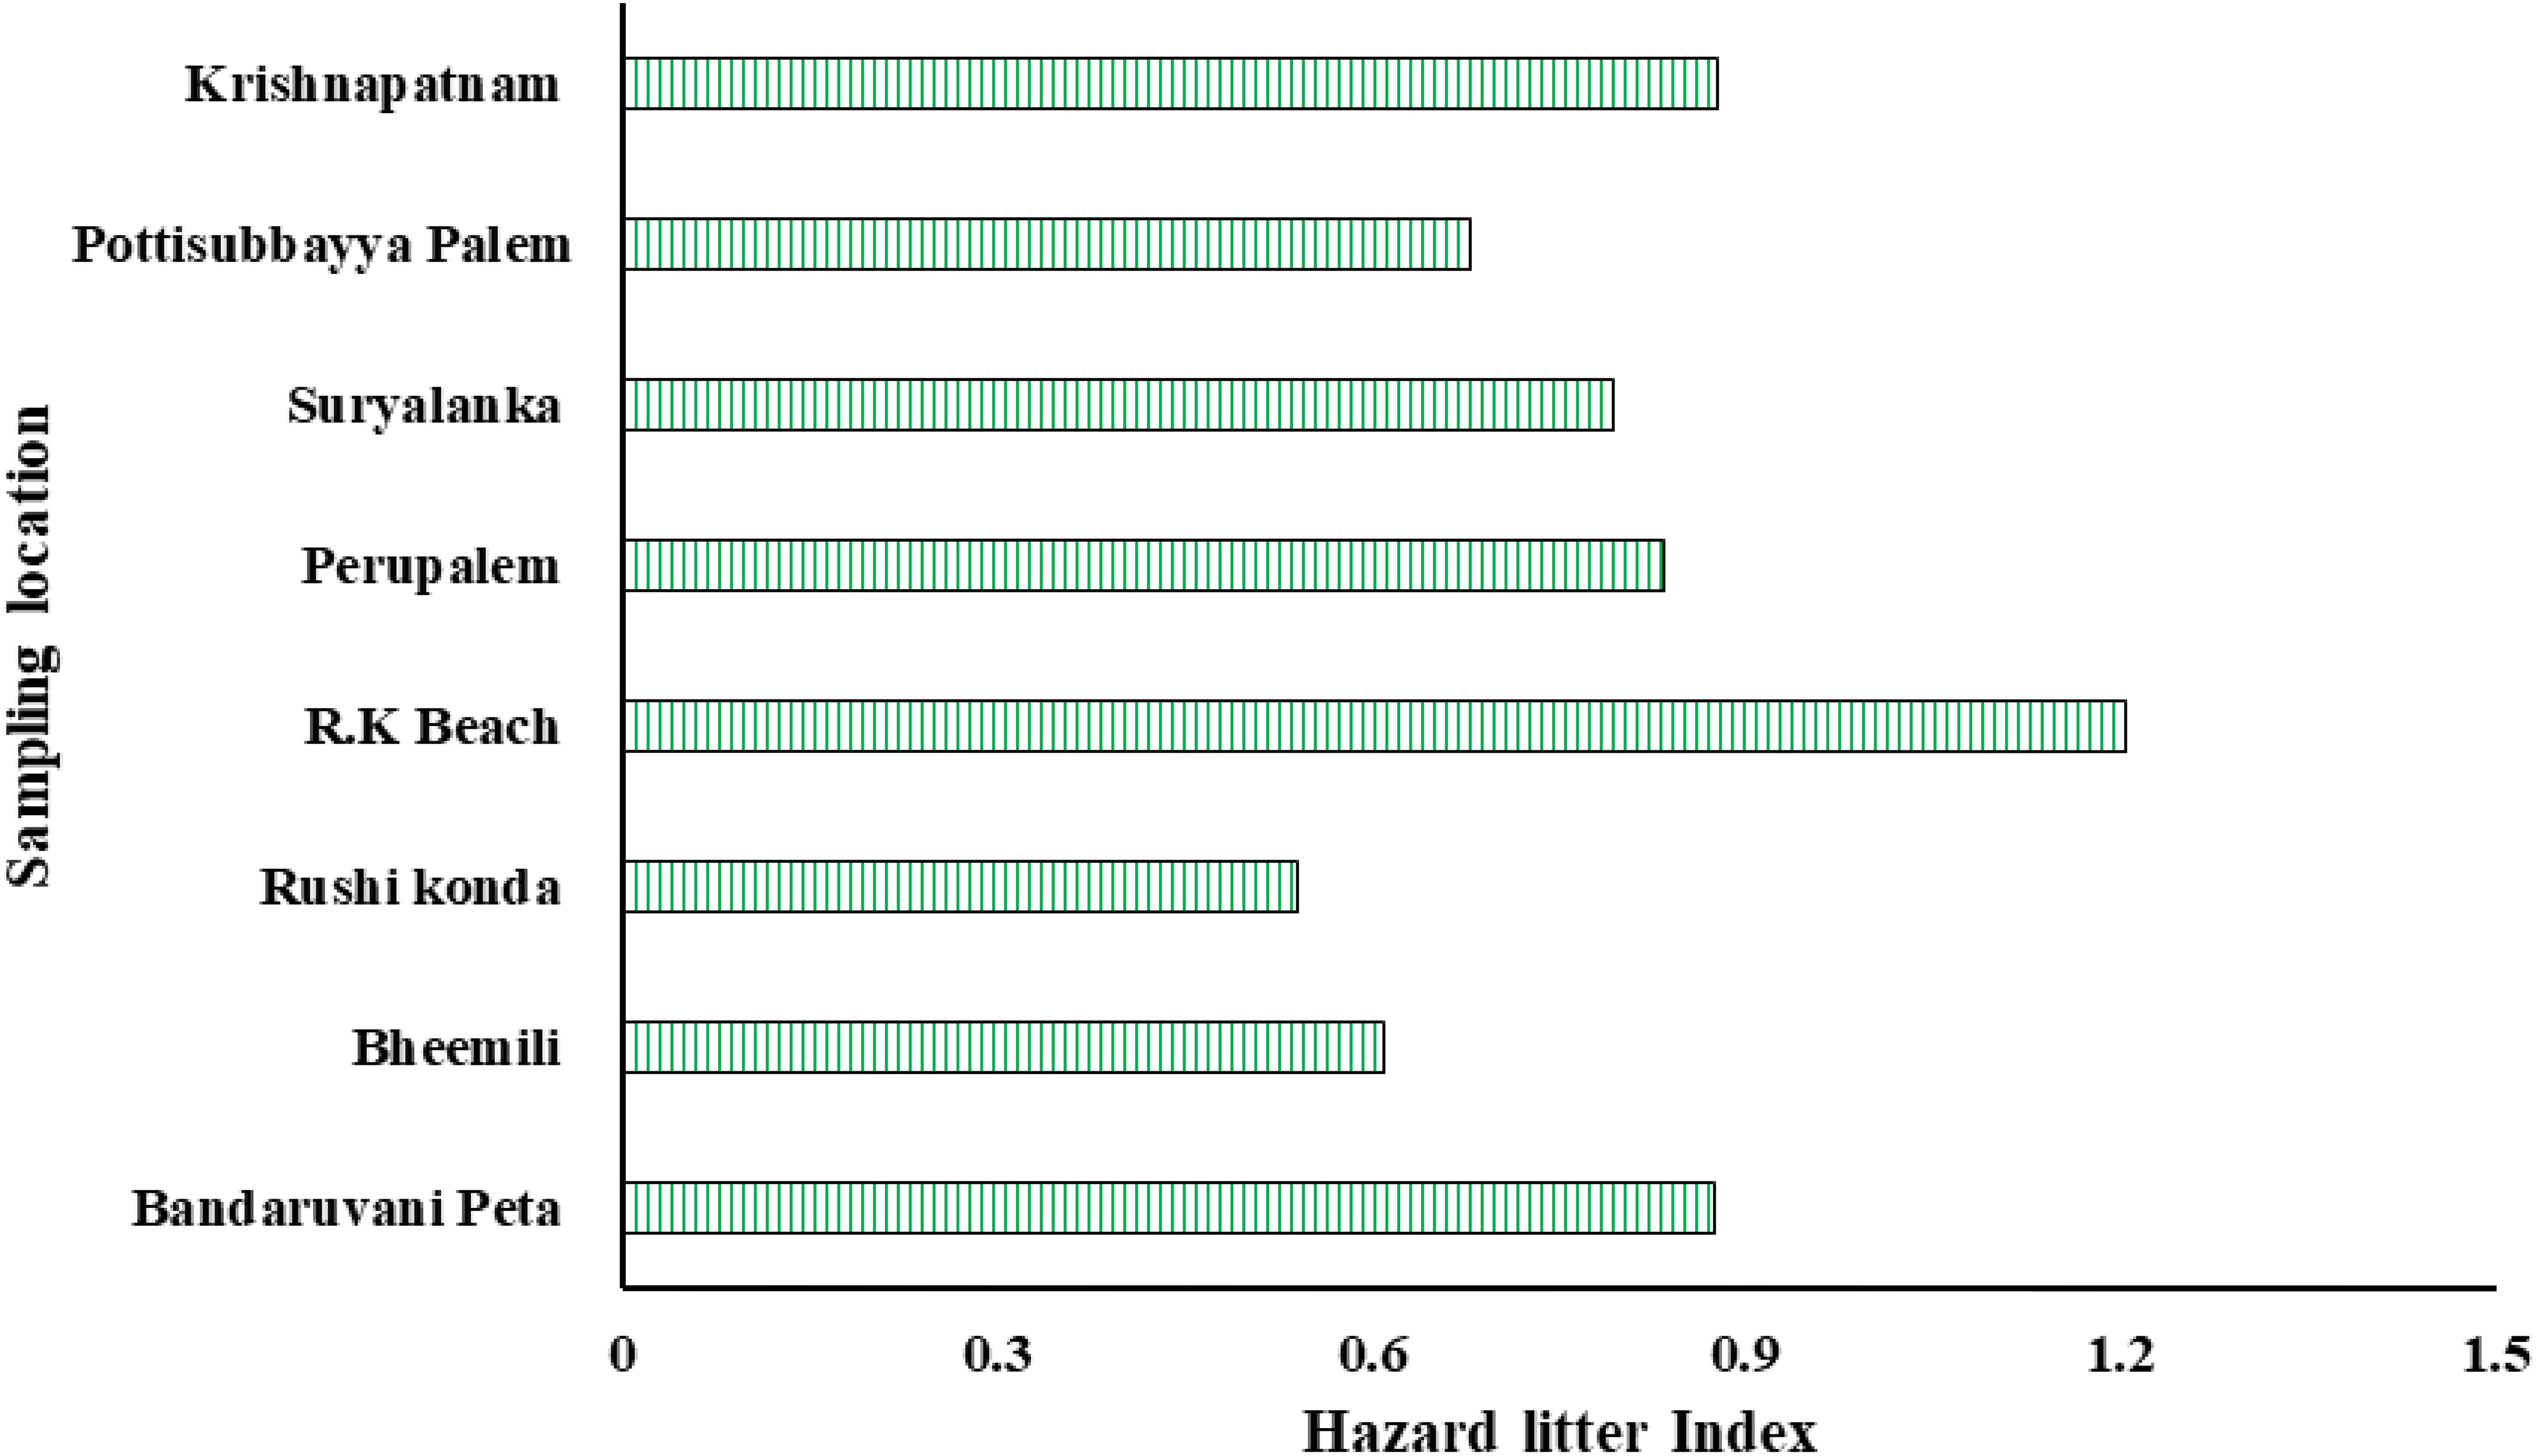
Figure 4. Hazard litter index (HLI) values of beaches showing the percentage and density of hazard litters along the central east coast of India.
The types of marine litter deposited along the Andhra Pradesh coast showed that nearly 70% of the litter is originated from the land-based sources, 15% from sea-based sources, and origin of the remaining 15% could not be identified as those were weathered heavily. The land-based marine litter might have entered the beaches through the major rivers Krishna and Godavari, tourism and recreational activities, and other anthropogenic activities in this region (Mishra et al., 2023). Kaladharan et al. (2020) recorded 2.11 kg/km2 of marine plastic litter including fishing gears in the fishing ground along the Andhra Pradesh coast during April 2016 –March 2017. Therefore, the shipping and fishing activities in the exclusive economic zone (EEZ) of India have considerably contributed to the deleterious effects of plastic pollution. Earlier we have reported that winds and currents during the northeast monsoon are playing major role in the transportation and deposition of floating debris in this region (Raju et al., 2023). Therefore, the 15% of sea-based marine litter could be transported from the prevailing winds and currents in the study area. There is a clear connection between site-specific environmental parameters and the geographical variability of trash accumulation. Higher litter densities were observed on beaches near river mouths, such as Bandaruvanipeta and Krishnapatnam, likely due to fluvial transport. Additionally, as previously noted, marine litter may have accumulated along the coastlines due to northeast monsoon-driven winds and currents (Raju et al., 2023). Morphological features, such as beach orientation and slope, may also influence litter accumulation; however, further hydrodynamic modelling is needed to better understand these effects.
3.3 Automatic marine litter detection using ML model
3.3.1 Training results
The YOLOv5 ML model was trained to automatically classify and detect marine litter using 9714 images, extracted from the eight field videos. The overall training time was 426 min, and the total number of epochs trained was 212. The curves of Precision/Recall, F1-score/Confidence, Precision/Confidence, and Recall/Confidence are shown in Figure 5. To confirm whether the marine litter items detected by the object detection model are positive or not, a confidence score was assigned (0.7 in this study) to set a threshold for accepting or rejecting the detection of marine litter items. When the confidence score is ≥ 0.7, then the sample is considered positive, whereas the score < 0.7 is negative. The precision and recall curves in the object detection model are powerful tools for assessing and fine-tuning the performance of the model. We found that the evaluation matrices of the marine litter object detection model converged after 200 epochs, with a final confidence threshold of 0.7. The F1 curves for all marine litter classes showed that the curves began to plateau near the confidence value of 0.7 (Figure 6). Therefore, the bounding boxes with confidence <0.7 were not considered for further validation. Near real-time detection was achieved with an average inference speed of 15 frames per second on an RTX 2080 GPU. However, due to memory limitations, the model may need to be pruned or quantized before deployment on edge devices.
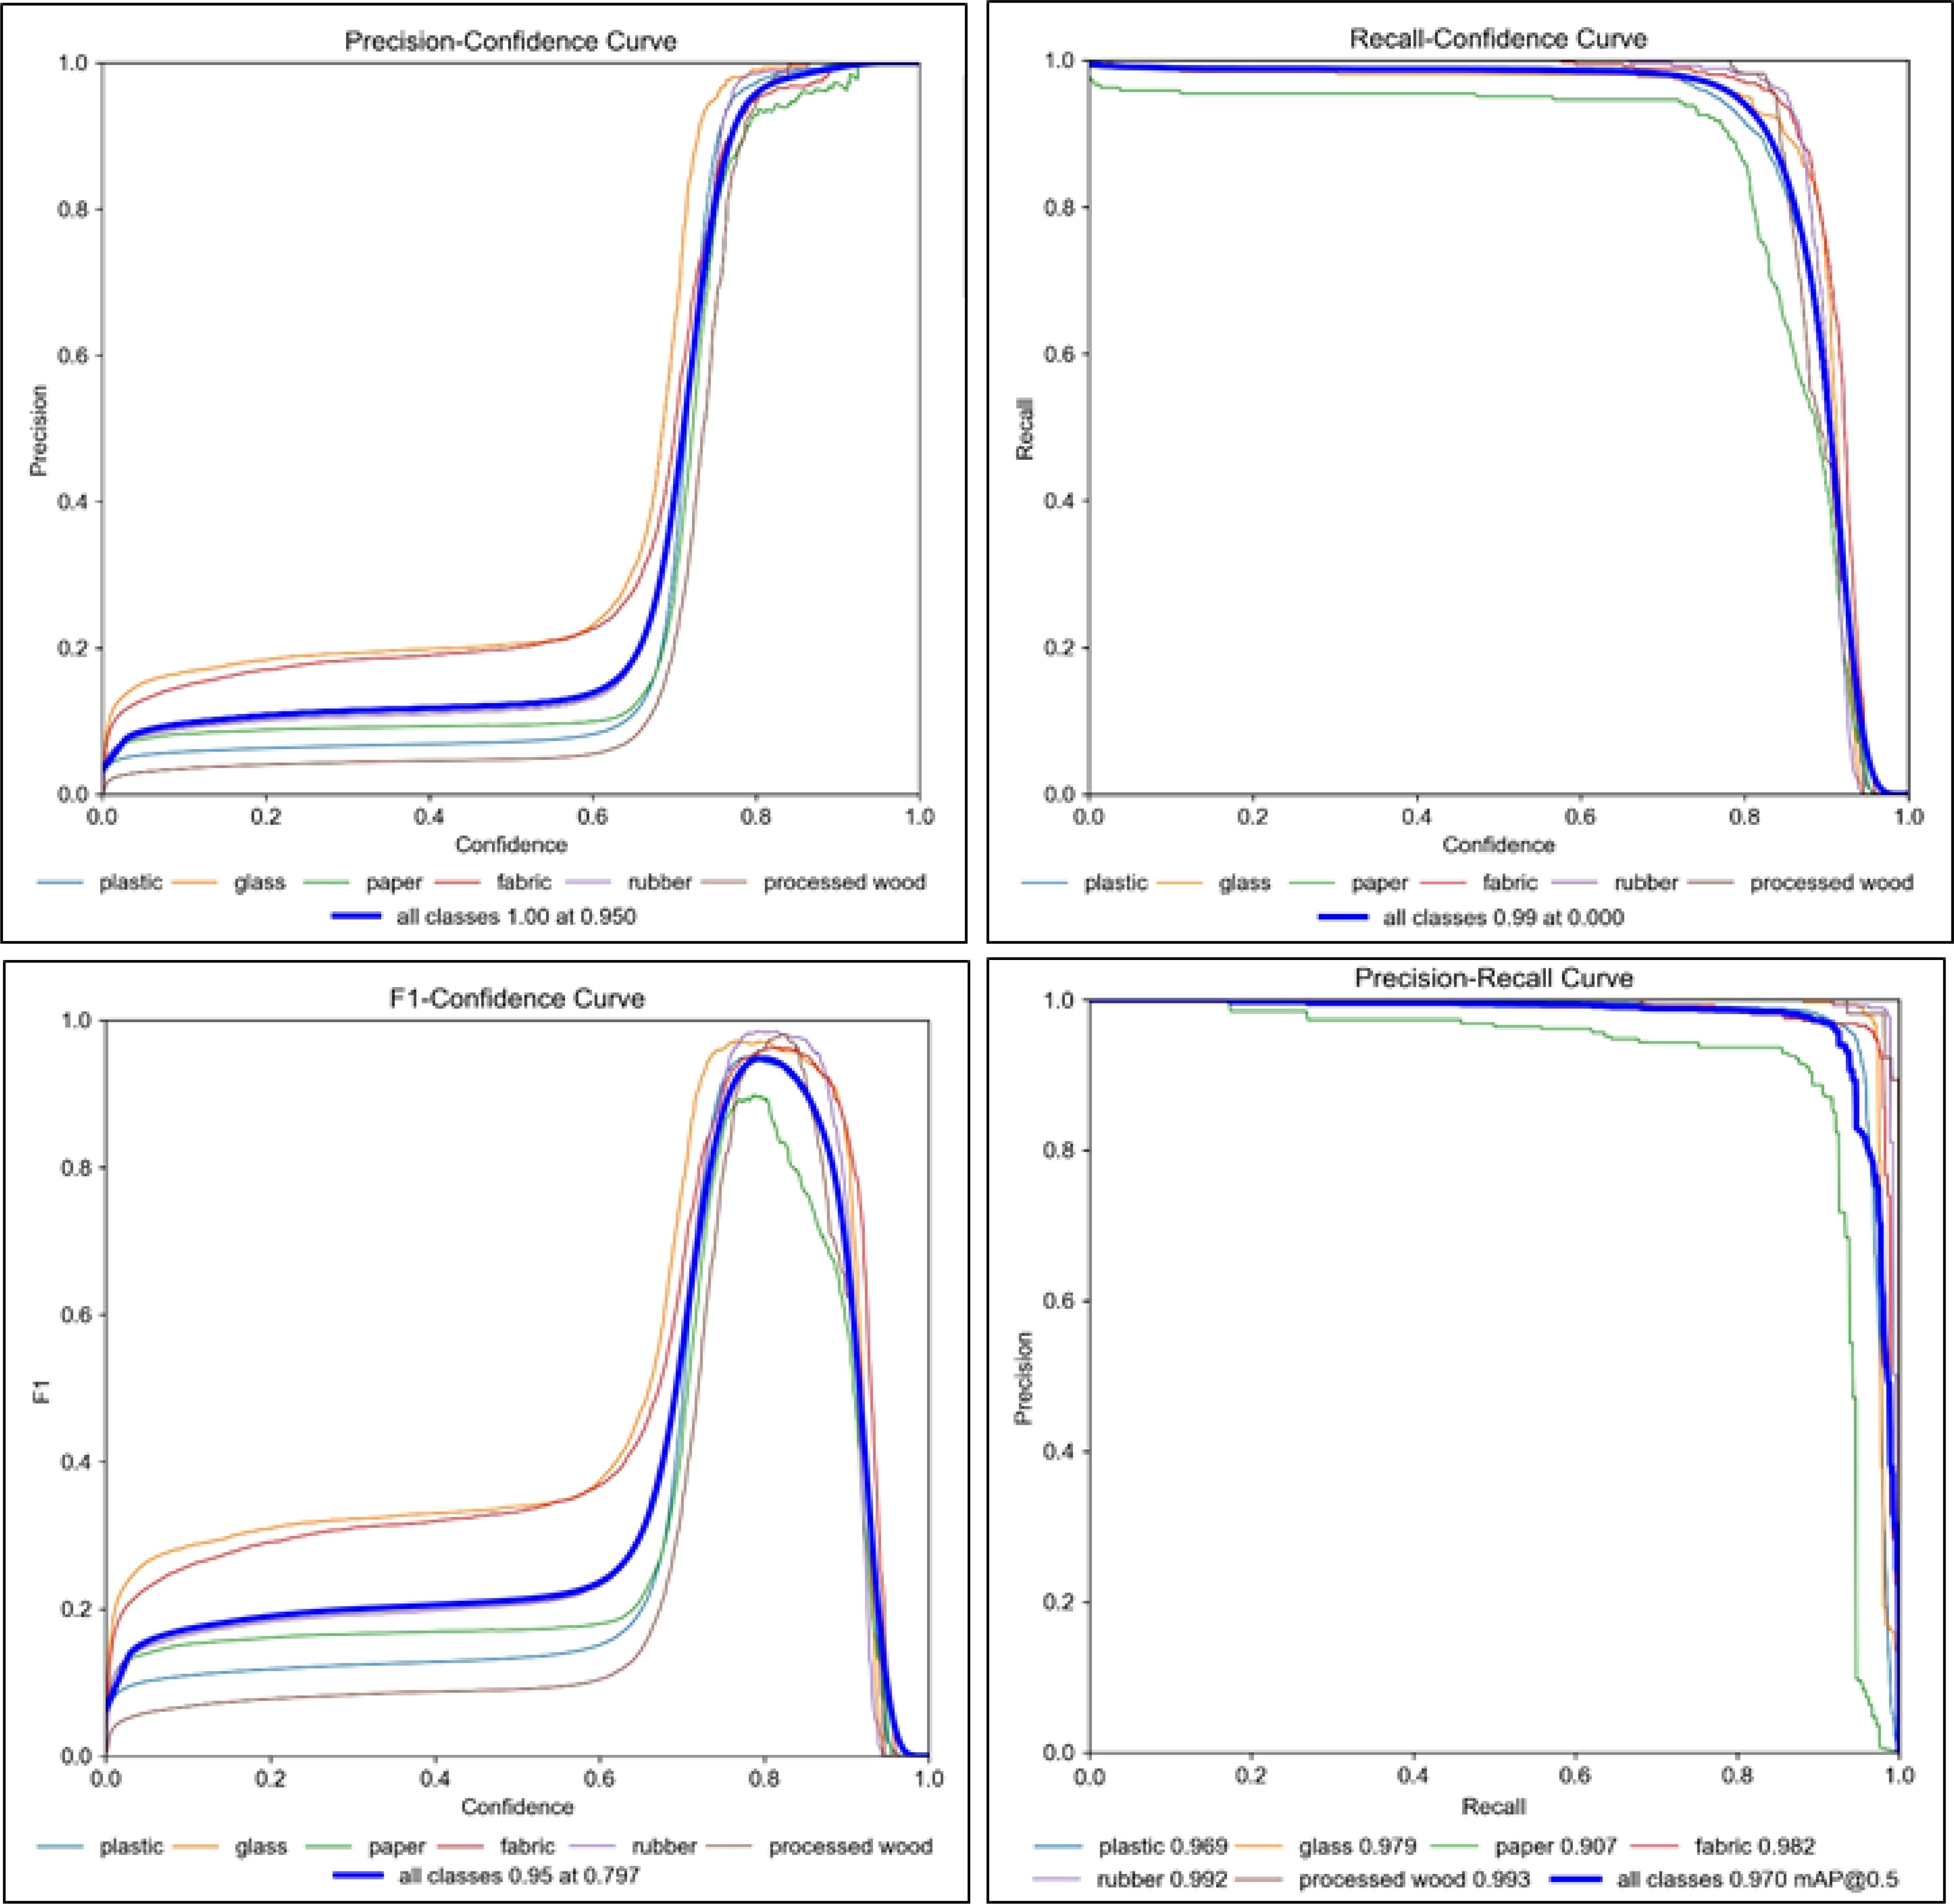
Figure 5. Precision, recall, and F1 score achieved by the YOLOv5 architecture after 212 epochs of training.
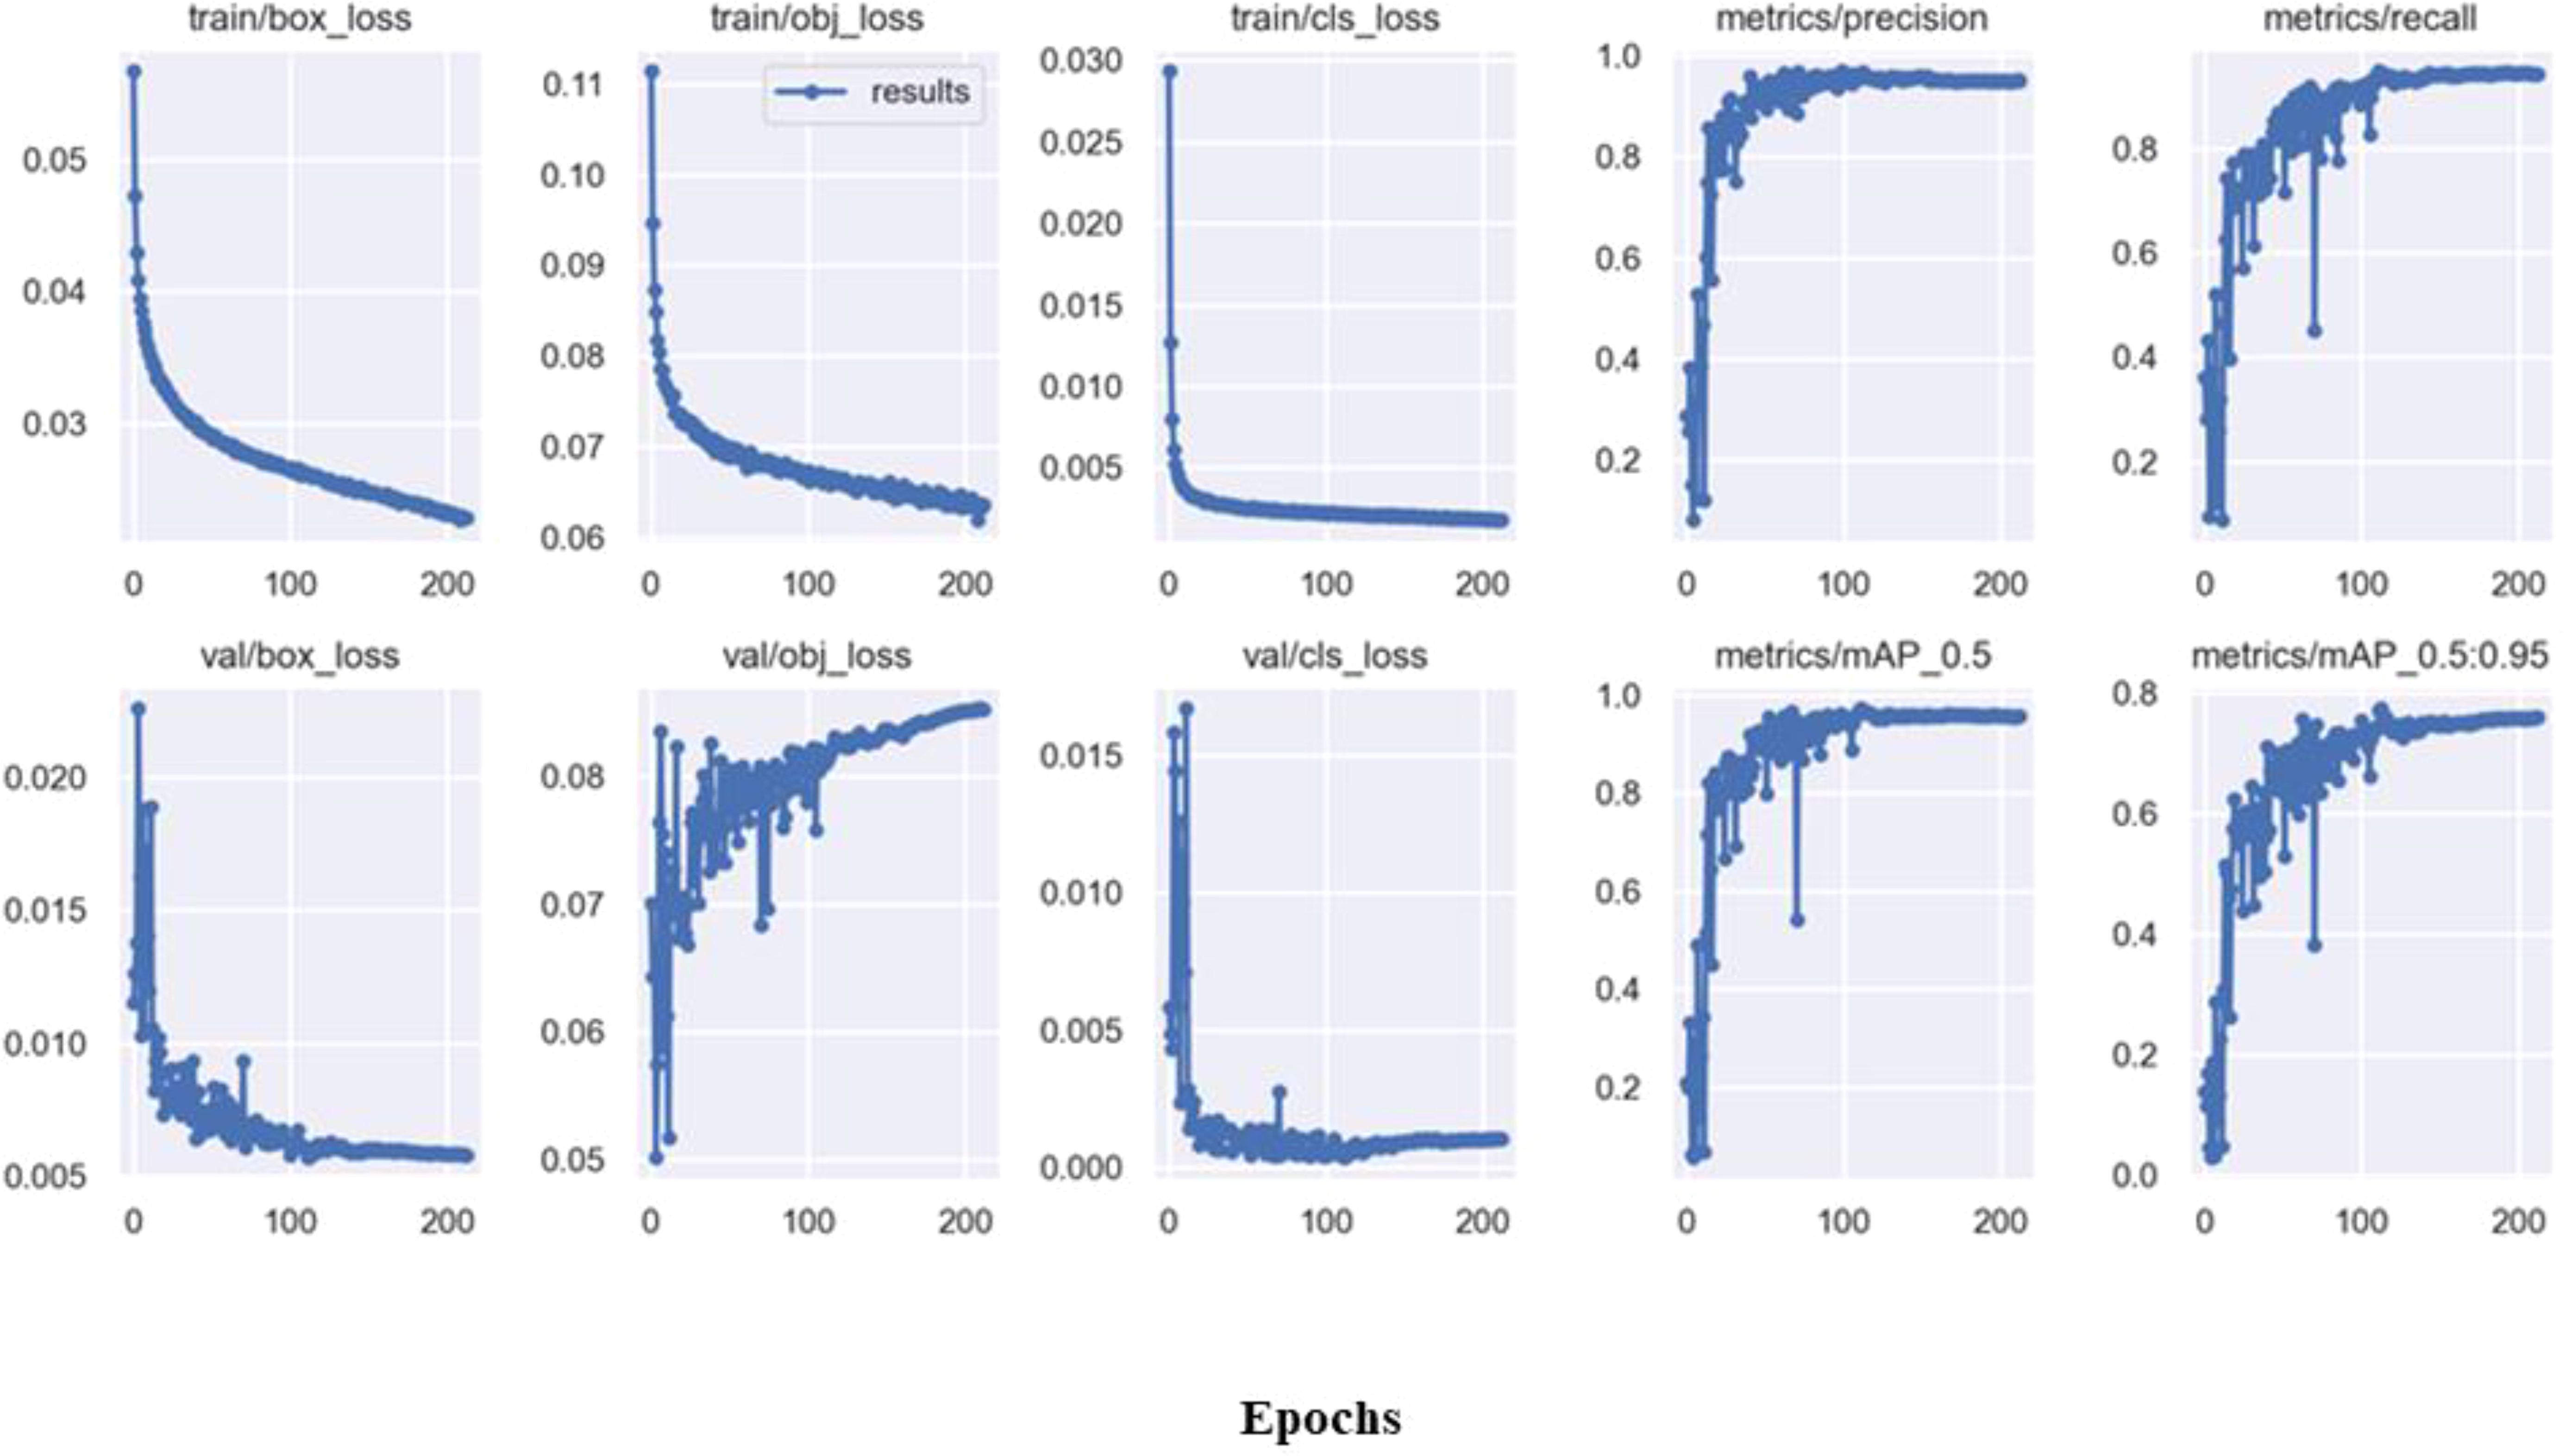
Figure 6. The training curves for loss, precision and mAP of YOLOv5 marine litter model.
3.3.2 Evaluation of ML model
The evaluation matrices such as recall, precision, mAP@0.5, mAP@0.5:0.95, and F1 score were used to assess the performance of the YOLOv5 object detection model. The precision vs. confidence curve (Figure 6) showed that the 1.00 precision values fall inside the 0.950 confidence range for an effect. The recall versus confidence indicates that the effects of the 0.99 confidence interval are included in recall levels of 0.00. The results obtained for P, R, and F1score are 0.95, 0.94 and 0.79, respectively. The quality of the object detection model is evaluated based on two important indicators: mAP, and the loss of training. A model with a high mAP value and low training loss is a well-performing model. The image of mAP showed that after 120 epochs of training, mAP curve has plateaued, whereas the loss of the training curve became gradually stable after 150 epochs. The mAP values of the trained model for different marine litter items are in descending order: plastic (0.98) = paper (0.98) > processed wood (0.97) > fabric (0.96) > rubber (0.95) > glass (0.93) > metal (0.89) (Supplementary Figure S5). The confusion matrix (Figure 7) also confirmed that all marine litter classes (except, metal) could be easily detected (i.e., about a 90% chance). The results of Pearson correlation analysis show a significant positive correlation between the marine litter data obtained through the conventional method and the YOLOv5.
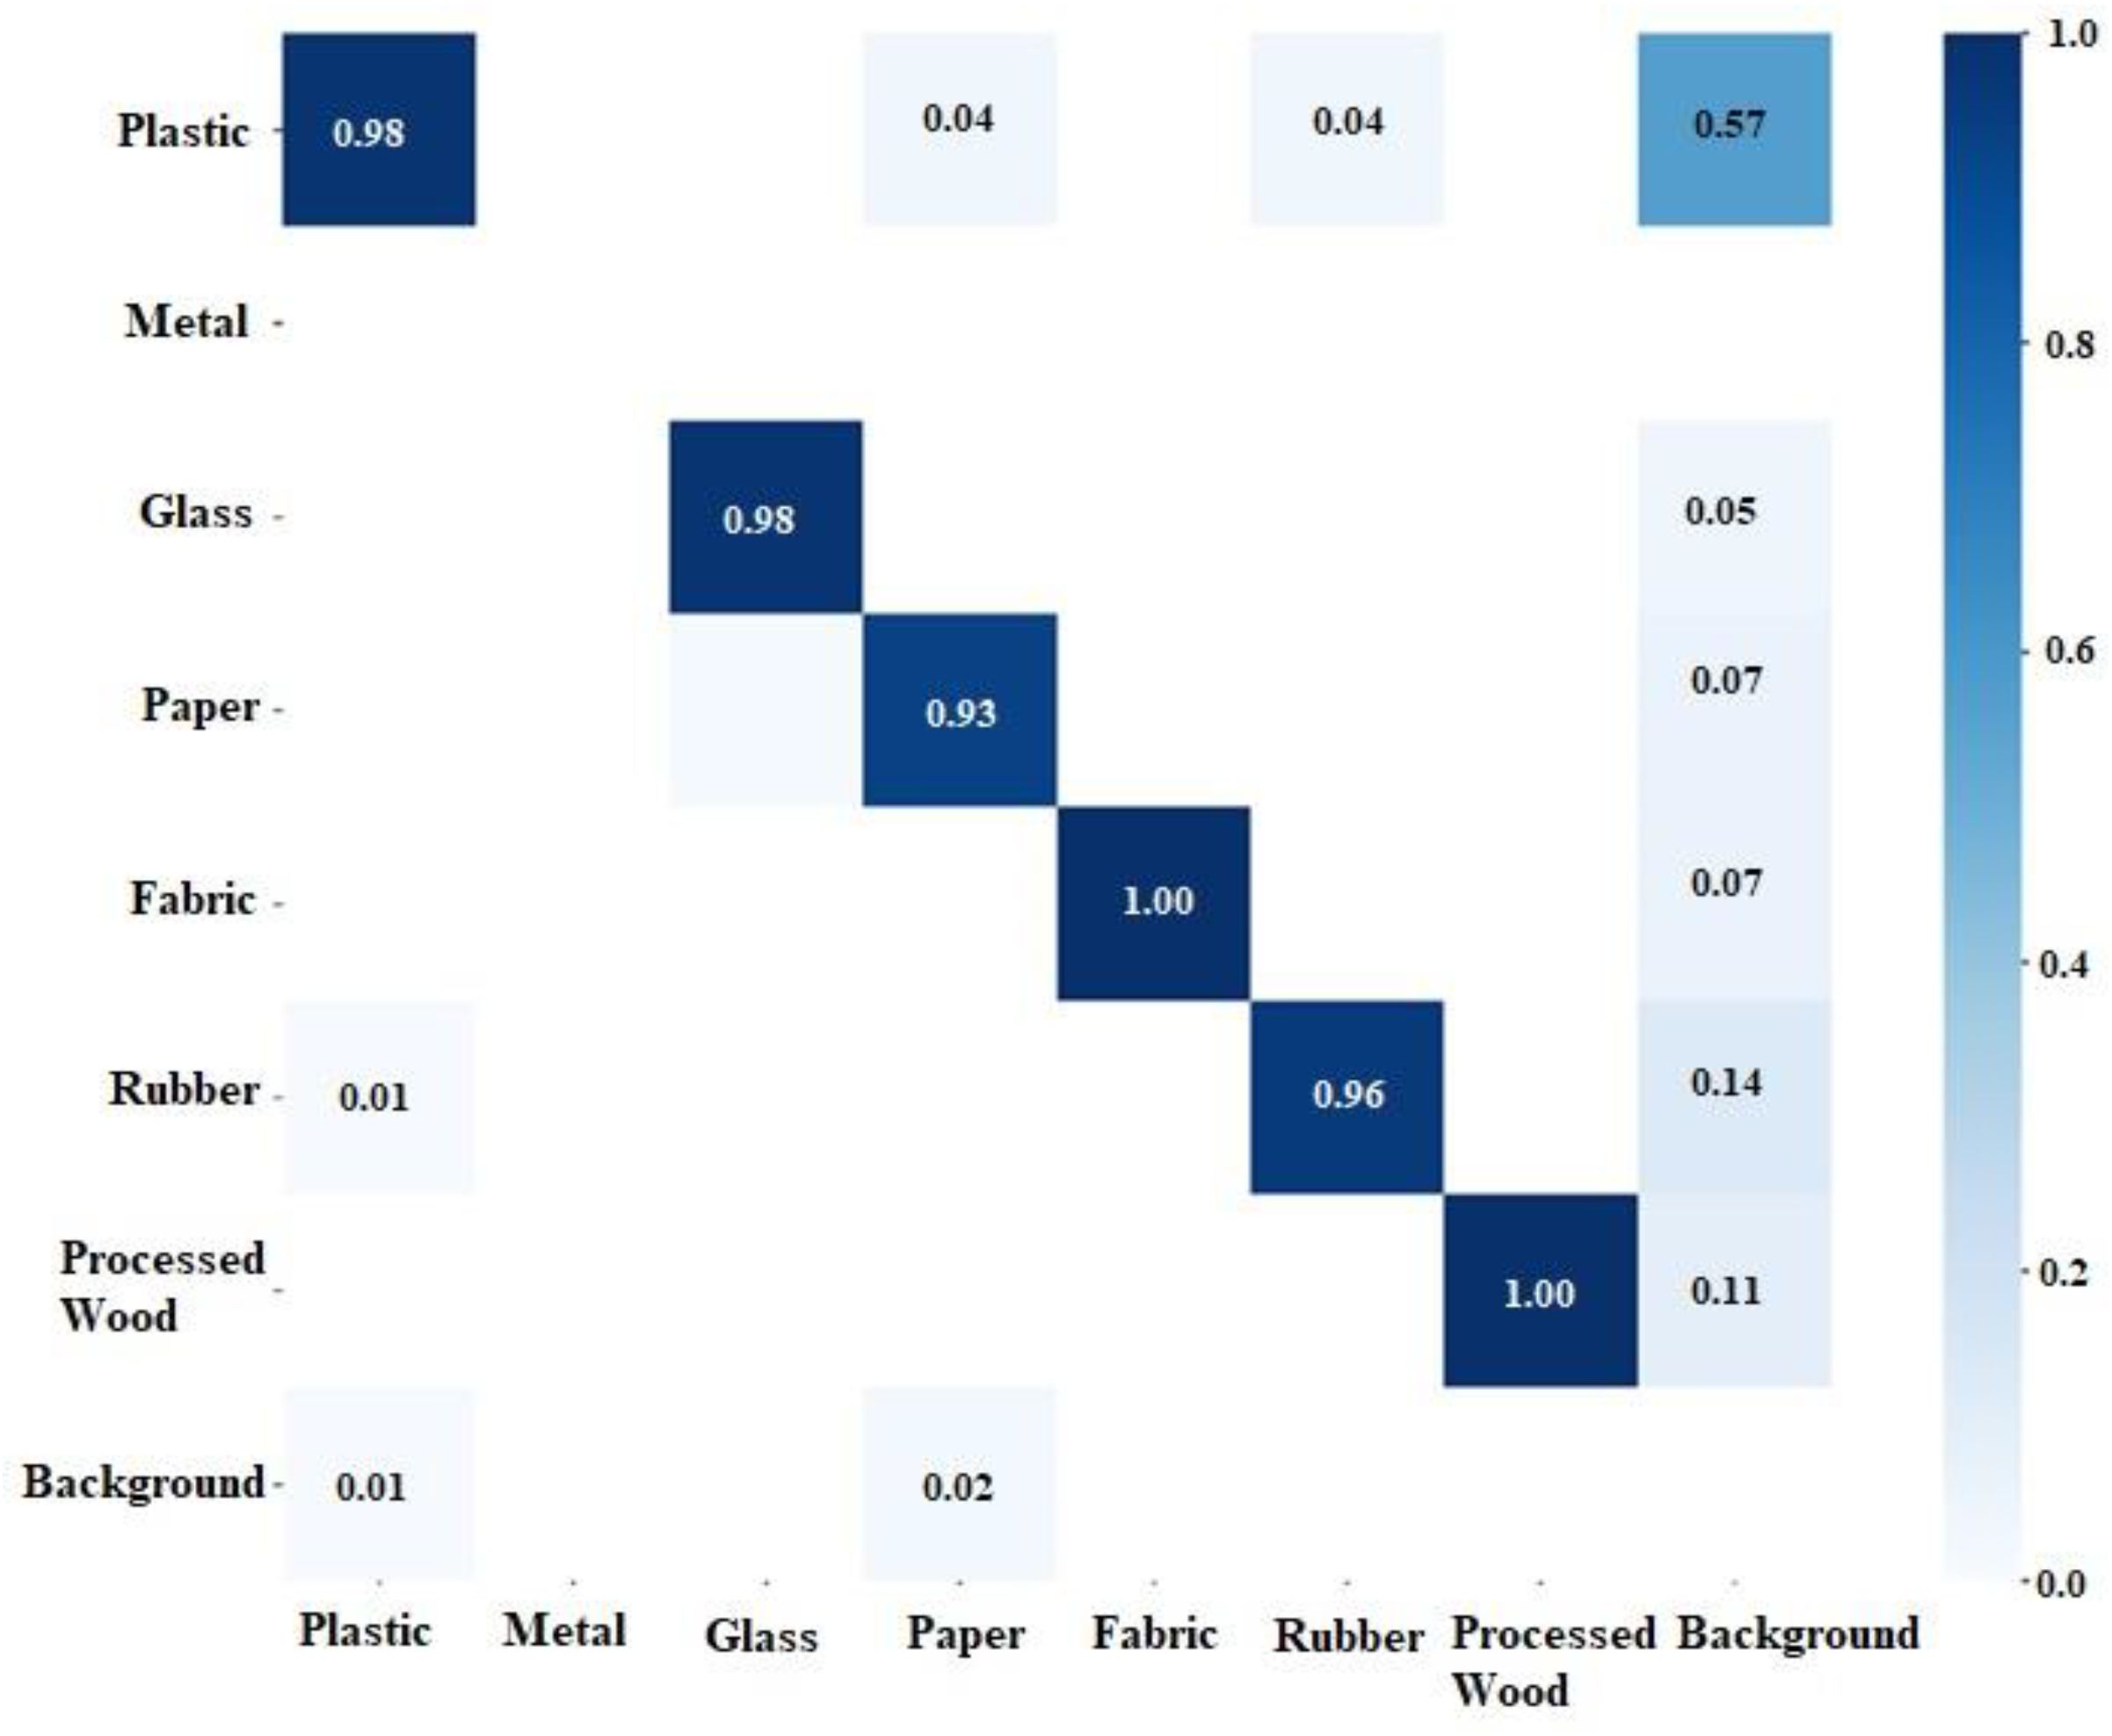
Figure 7. The obtained confusion matrix for YOLOv5 marine litter model.
model. Plastic litter showed a higher coefficient value (r = 0.92) among all marine litter items. The obtained mAP values of this object detection model were higher than those found in other YOLOv5 related studies such as recognition of bird nests (Yang and Wang, 2023), detection of tomato cluster (Rong et al., 2023), detection of lightweight tea bud (Gui et al., 2023), detection of farmed fish (Li et al., 2022), detection of lotus seedpod (Ma et al., 2023), and detection of broiler chicken on litter floor (Guo et al., 2023) since it efficiently strikes a balance between memory and accuracy. Moreover, the mAP values of this YOLOv5 marine litter detection model were higher than the other single-stage and two-stage detector marine litter detection models (Supplementary Table S3). The findings unequivocally demonstrate the potential for the suggested ML model to identify marine trash and its use in monitoring initiatives.
3.3.3 Limitations
Despite the YOLOv5m-based object detection model scored highly on accuracy measures, the following constraints need to be solved for object recognition approaches to be widely used. On extremely complicated situations with numerous overlapping objects, the performance of YOLOv5m is not as quick as Faster R-CNN and Mask R-CNN. The YOLOv5m is a medium-sized model and therefore it is unlikely to pick up small items within image or video data. Like other ML models, YOLOv5m requires large amount of annotated data to train the model, as it is a time-consuming and expensive. YOLOv5m may not handle a large variation in the aspect ratio of the image that led to different shapes of objects observed by the model. It is difficult to handle the highly occluded objects by YOLOv5m, because they may not be fully visible in the image. YOLOv5 model mainly concentrates on object detection and bounding box localization. It does not consider the need for pixel-level semantic segmentation information, which may be necessary for some other applications. Currently, it is expensive to train a large size model as it requires an expensive and powerful GPU.
4 Conclusions
Marine litter accumulation on beaches is an escalating global problem. Existing approaches to identifying and monitoring litter items are often costly, time-consuming, and labor-intensive, making effective management challenging. Given the complexity of marine litter accumulation, there is growing need for artificial intelligence-based approaches to effectively identify, characterize, and track litter, thereby supporting improved coastal management and decision-making. In this study, eight beaches along the central east coast of India were surveyed using both traditional and machine learning-based methods to assess the abundance, composition, and environmental quality of marine litter. The survey revealed that plastic constituted 67.4% of the total litter, making it the most prevalent material. The region’s severe pollution levels were further highlighted by the Clean Coast Index (CCI), which categorized 37.5% of the beaches as “dirty” and 62.5% as “extremely dirty.” Among the surveyed locations, Rushikonda Beach and Bandarvanipeta Beach exhibited the highest proportion of plastic within the overall marine litter composition, whereas Pottisubbayya Palem and Perupalem recorded the lower plastic concentrations compared to other litter categories. According to the CCI, beaches such as Krishnapatnam Beach, R.K. Beach, Bandarvanipeta, and Perupalem were classified as extremely dirty, while the remaining sites were categorized as dirty. Based on the Hazardous Litter Index (HLI), all surveyed beaches except R.K. Beach recorded values below one, placing them in Type II classification, which indicates a comparatively lower hazard level relative to other heavily polluted beaches in India. HLI values suggested the presence of sharp and potentially hazardous objects at all beaches, with seven beaches falling under Type II and one under Type III classification. Approximately 70% of the marine litter originated from land-based sources such industrial operations, tourism, and river discharge; 15% stemmed from marine sources like shipping and fishing; and the remaining 15% was untraceable due to severe weathering. These findings highlight the urgent need for targeted cleanup initiatives and comprehensive waste management strategies. Using field video data, the YOLOv5m object detection model was trained and tested to accurately identify and categorize marine litter (F1 score = 0.79, mAP@0.5 = 0.95). The model outperformed several previous object detection algorithms and showed strong agreement with traditional survey data, indicating its potential integration into long-term marine litter monitoring and management initiatives. Future research should focus on incorporating this AI-based approach into IoT-enabled platforms to enable scalable and real-time applications.
Data availability statement
The original contributions presented in the study are included in the article/Supplementary Material. Further inquiries can be directed to the corresponding author.
Author contributions
MR: Investigation, Methodology, Writing – review & editing. SV: Funding acquisition, Investigation, Methodology, Project administration, Supervision, Writing – original draft, Writing – review & editing. VS: Methodology, Project administration, Supervision, Validation, Writing – review & editing. FA: Investigation, Methodology, Software, Writing – review & editing. HK: Investigation, Software, Writing – review & editing. MC: Writing – review & editing. PS: Supervision, Writing – review & editing. PV: Writing – review & editing.
Funding
The author(s) declare that financial support was received for the research and/or publication of this article. This work is partly supported by QRDI Grant CCEC01-1029-230098.
Acknowledgments
We are grateful to the Directors of CSIR-NIO and ESC-Qatar University for providing all the facilities to carry out this research. The first author is thankful to the Head of the Department of Meteorology and Oceanography for constant support and encouragement. The NFSC-CSIR, India is acknowledged for providing fellowship to the first author. This is CSIR-NIO contribution number 7423.
Conflict of interest
The authors declare that the research was conducted in the absence of any commercial or financial relationships that could be construed as a potential conflict of interest.
Generative AI statement
The author(s) declare that no Generative AI was used in the creation of this manuscript.
Publisher’s note
All claims expressed in this article are solely those of the authors and do not necessarily represent those of their affiliated organizations, or those of the publisher, the editors and the reviewers. Any product that may be evaluated in this article, or claim that may be made by its manufacturer, is not guaranteed or endorsed by the publisher.
Supplementary material
The Supplementary Material for this article can be found online at: https://www.frontiersin.org/articles/10.3389/fmars.2025.1604055/full#supplementary-material
References
Agamuthu P., Mehran S. B., Norkhairah A., and Norkhairiyah A. (2019). Marine debris: a review of impacts and global initiatives;. Waste Manage. Res. 37, 987–1002. doi: 10.1177/0734242X19845041
Alkalay R., Pasternak G., and Zask A. (2007). Clean-coast index – a new approach for beach cleanliness assessment;. Ocean Coastal Manage. 50, 352–362. doi: 10.1016/j.ocecoaman.2006.10.002
Al-Khayat J. A., Veerasingam S., Aboobacker V. M., and Vethamony P. (2021). Hitchhiking of encrusting organisms on floating marine debris along the west coast of Qatar, Arabian/Persian Gulf;. Sci. Total Environ. 776, 145985. doi: 10.1016/j.scitotenv.2021.145985
Armitage S., Awty-Carroll K., Clewley D., and Martinez-Vicente V. (2022). Detection and classification of floating plastic litter using a vessel-mounted video camera and deep learning;. Remote Sens. 14, 3425. doi: 10.3390/rs14143425
Arunkumar A., Sivakumar R., Reddy Y. S. R., Raja M. V. B., Nishanth T., and Revanth V. (2016). Preliminary study on marine debris pollution along Marina beach, Chennai, India;. Regional Stud. Marine Sci. 5, 35–40. doi: 10.1016/j.rsma.2016.01.002
Behera D. P., Kolandhasamy P., Sigamani S., Devi L. P., and Ibrahim Y. S. (2021). A preliminary investigation of marine litter pollution along Mandvi beach, Kachchh, Gujarat;. Marine Pollution Bull. 165, 112100. doi: 10.1016/j.marpolbul.2021.112100
Bellou N., Gambardella C., Karantzalos K., Monteiro J. G., Canning-Clode J., Kemna S., et al. (2021). Global assessment of innovative solutions to tackle marine litter;. Nat. Sustainability 4, 516–524. doi: 10.1038/s41893-021-00726-2
Bircanoglu C. and Arica N. (2018). “A comparison of activation functions in artificial neural networks,” in 26th Signal Processing and Communications Applications Conference (SIU), Izmir, Turkey. 1–4. doi: 10.1109/SIU.2018.8404724
Carlton J. T., Chapman J. W., Geller J. B., Miller J. A., Carlton D. A., McCuller M. I., et al. (2017). Tsunami-driven rafting: Transoceanic species dispersal and implications for marine biogeography;. Science 357, 1402–1406. doi: 10.1126/science.aao1498
Daniel D. B. and Thomas S. N. (2023). Derelict fishing gear abundance, its causes and debris management practices – Insights from the fishing sector of Kerala, India;. Marine Policy 148, 105429. doi: 10.1016/j.marpol.2022.105429
Daniel D. B., Thomas S. N., and Thomson K. T. (2020). Assessment of fishing-related plastic debris along the beaches in Kerala coast, India;. Marine Pollution Bull. 150, 110696. doi: 10.1016/j.marpolbul.2019.110696
De K., Sautya S., Dora G. U., Gaikwad S., Katke D., and Salvi A. (2023). Mangroves in the “Plasticene”: High exposure of coastal mangroves to anthropogenic litter pollution along the Central-West coast of India;. Sci. Total Environ. 858, 160071. doi: 10.1016/j.scitotenv.2022.160071
De K., Sautya S., Gaikwad S., Mitra A., and Nanajkar M. (2022). Characterization of anthropogenic marine macro-debris affecting coral habitat in the highly urbanized seascape of Mumbai megacity;. Environnemental Pollution 298, 118798. doi: 10.1016/j.envpol.2022.118798
Deng H., Ergu D., Liu F., Ma B., and Cai Y. (2021). An embeddable algorithm for automatic garbage detection based on complex marine environment;. Sensors 21, 19. doi: 10.3390/s21196391
Edward J. K. P., Mathews G., Raj K. D., Laju R. L., Bharath M. S., Kumar P. D., et al. (2020). Marine debris – An emerging threat to the reef areas of Gulf of Mannar, India. Marine Pollution Bull. 151, 110793. doi: 10.1029/2019EA000960
Escobar-Sanchez G., Markfort G., Berghald M., Ritzenhofen L., and Schernewski G. (2022). Aerial and underwater drones for marine litter monitoring in shallow coastal waters: factors influencing item detection and cost-efficiency;. Environ. Monitoring Assess. 194, 863. doi: 10.1007/s10661-022-10519-5
Fulton M., Hong J., Islam M. J., and Sattar J. (2019). “Robotic detection of marine litter using deep visual detection models,” in International conference on robotics and automation (ICRA), Montreal, QC, Canada. 5752–5758. doi: 10.1109/ICRA.2019.8793975
Galgani F., Hanke G., and Maes T. (2015). “Global distribution, composition and abundance of marine litter,” in Marine Anthropogenic Litter. Eds. Bergman M., Gutow L., and Klages M. (Springer, Berlin), 29 56.
Galgani F., Hanke G., Werner S., Oosterbaan L., Nilsson P., Fleet D., et al. (2013). “Guidance on monitoring of marine litter in European Seas,” in Scientific and Technical Research Series. Eds. Hanke G., Werner S., Galgani F., Veiga J. M., and Ferreira M. (Office of the European Union, Luxembourg), 1–128. doi: 10.2760/59137
Garcia-Garin O., Monleon-Getino T., Lopez-Brosa P., Borrell A., Aguilar A., Borja-Robalino R., et al. (2021). Automatic detection and quantification of floating marine macro-litter in aerial images: Introducing a novel deep learning approach connected to a web application in R;. Environ. Pollution 273, 116490. doi: 10.1016/j.envpol.2021.116490
Goncalves G., Andriolo U., Pinto L., and Duarte D. (2020). Mapping marine litter with Unmanned Aerial Systems: A showcase comparison among manual image screening and machine learning techniques;. Marine Pollution Bull. 155, 111158. doi: 10.1016/j.marpolbul.2020.111158
Gui Z., Chen J., Li Y., Chen Z., Wu C., and Dong C. (2023). A lightweight tea bud detection model based on YOLOv5;. Comput. Electron. Agric. 205, 107636. doi: 10.1016/j.compag.2023.107636
Guo Y., Aggrey S. E., Yang X., Oladeinde A., Qiao Y., and Chai L. (2023). Detecting broiler chickens on litter floor with the YOLOv5-CBAM deep learning model;. Artif. Intell. Agric. 9, 36–45. doi: 10.1016/j.aiia.2023.08.002
Hammedi W., Ramirez-Martinez M., Brunet P., Senouci S. M., and Messous M. A. (2019). “Deep learning-based real-time object detection in inland navigation,” in IEEE Global Communications Conferences (GLOBECOM), Waikoloa, HI, USA. 1–6. doi: 10.1109/GLOBECOM38437.2019.9013931
Hausmann A., Toivonen T., Slotow R., Tenkanen H., Moilanen A., Heikinheimo V., et al. (2017). Social media data can be used to understand tourists’ preferences for nature-based experiences in protected areas. Conserv. Lett. 11, e12343. doi: 10.1111/conl.12343
He K., Zhang X., Ren S., and Sun J. (2016). “Deep residual learning for image recognition,” in IEEE Conference on Computer Vision and Pattern Recognition (CVPR), Las Vegas, NV, USA. 770–778. doi: 10.1109/CVPR.2016.90
Huang G., Chen D., Li T., Wu F., van der Maaten L., and Weinberger K. Q. (2017). Multi-scale dense networks for resource efficient image classification. arXiv preprint arXiv:1703.09844. doi: 10.48550/arXiv.1703.09844
Huang B., Chen G., Zhang H., Hou G., and Radenkovic M. (2023). Instant deep sea debris detection for maneuverable underwater machines to build sustainable ocean using deep neural network;. Sci. Total Environ. 878, 162826. doi: 10.1016/j.scitotenv.2023.162826
Jia J., Fu M., Liu X., and Zheng B. (2022). Underwater object detection based on improved efficientDet;. Remote Sens. 14, 4487. doi: 10.3390/rs14184487
Jia T., Kapelan Z., de Vries R., Vriend P., Peereboom E. C., Okkerman I., et al. (2023). Deep learning for detecting macroplastic litter in water bodies: A review;. Water Res. 231, 119632. doi: 10.1016/j.watres.2023.119632
Kaladharan P., Singh V. V., Asha P. S., Edward L., and Sukhadane K. S. (2020). Marine plastic litter in certain trawl grounds along the peninsular coasts of India;. Marine Pollution Bull. 157, 111299. doi: 10.1016/j.marpolbul.2020.111299
Kannan G., Kolandhasamy P., Anbukkarasu S., Sigamani S., Ayyappan S., and Rajendran R. (2023). Marine plastics on the beaches of Cuddalore coast, Southeast coast of India: A assessment of their abundance during Covid lockdown and post lockdown. Regional Stud. Marine Sci 65, 103051. doi: 10.1016/j.rsma.2023.103051
Karthikeyan P., Boopathi V., Chellaiyan S., Muthuramalingam S., and Raja P. (2021). Sources, spatial distribution, and abundance of marine debris on Thondi coast, Palk Bay, Southeast coast of India;. Environ. Sci. Europe 33, 136. doi: 10.1186/s12302-021-00576-x
Karthikeyan P., Subagunasekar M., and Stella C. (2023). Marine litter on the beaches of the Kanyakumari, Southern India: An assessment of their abundance and pollution indices;. Marine Pollution Bull. 186, 114443. doi: 10.1016/j.marpolbul.2022.114443
Kaviarasan T., Dhineka K., Sambandam M., Sivadas S. K., Sivyer D., Hoehn D., et al. (2022). Impact of multiple beach activities on litter and microplastic composition, distribution, and characterization along the southeast coast of India;. Ocean Coastal Manage. 223, 106177. doi: 10.1016/j.ocecoaman.2022.106177
Kikaki K., Kakogeorgiou I., Mikeli P., Raitsos D. E., and Karantzalos K. (2022). MARIDA: A benchmark for marine debris detection from Sentinel-2 remote sensing data;. PloS One 17, e0262247. doi: 10.1371/journal.pone.0262247
Kiruba-Sankar R., Saravanan K., Adamala S., Selvam K., Kumar K. L., and Praveenraj J. (2023). First report of marine debris in Car Nicobar, a remote oceanic Island in the Nicobar archipelago, Bay of Bengal;. Regional Stud. Marine Sci. 61, 102845. doi: 10.1016/j.rsma.2023.102845
Krishnakumar S., Anbalagan S., Kasilingam K., Smrithi P., Anbazhagi S., and Srinivasalu S. (2020). Assessment of plastic debris in remote islands of the Andaman and Nicobar Archipelago, India;. Marine Pollution Bull. 151, 110841. doi: 10.1016/j.marpolbul.2019.110841
Kuhn S. and van Franeker J. A. (2020). Quantitative overview of marine debris ingested by marine megafauna;. Marine Pollution Bull. 151, 110858. doi: 10.1016/j.marpolbul.2019.110858
Kylili K., Kyriakides I., Artusi A., and Hadjistassou C. (2019). Identifying floating plastic marine debris using a deep learning approach;. Environ. Sci. Pollution Res. 26, 17091–17099. doi: 10.1007/s11356-019-05148-4
Li H., Yu H., Gao H., Zhang P., Wei S., Xu J., et al. (2022). Robust detection of farmed fish by fusing YOLOv5 with DCM and ATM;. Agric. Eng. 99, 102301. doi: 10.1016/j.aquaeng.2022.102301
Luo W., Han W., Fu P., Wang H., Zhao Y., Liu K., et al. (2022). Water surface contaminants monitoring method based on airborne depth reasoning;. Processes 10, 131. doi: 10.3390/pr10010131
Lusher A. L., Hurley R., Arp H. P. H., Booth A. M., Brate I. L. N., Gabrielsen G. W., et al. (2021). Moving forward in microplastic research: A Norwegian perspective;. Environ. Int. 157, 106794. doi: 10.1016/j.envint.2021.106794
Ma J., Lu A., Chen C., Ma X., and Ma Q. (2023). YOLOv5-lotus an efficient object detection method for lotus seedpod in a natural environment;. Comput. Electron. Agric. 206, 107635. doi: 10.1016/j.compag.2023.107635
Mghili B., Keznine M., Analla M., and Aksissou M. (2023). The impacts of abandoned, discarded and lost fishing gear on marine biodiversity in Morocco;. Ocean Coastal Manage. 239, 106593. doi: 10.1016/j.ocecoaman.2023.106593
Mishra P., Kaviarasan T., Sambandam M., Dhineka K., Murthy M. V. R., Iyengar G., et al. (2023). Assessment of national beach litter composition, sources, and management along the Indian coast – a citizen science approach;. Marine Pollution Bull. 186, 114405. doi: 10.1016/j.marpolbul.2022.114405
Mohsen A., Kiss T., and Kovacs F. (2023). Machine learning-based detection and mapping of riverine litter utilizing Sentinel-2 imagery;. Environ. Sci. Pollution Res. 30, 67742–67757. doi: 10.1007/s11356-023-27068-0
Morales-Caselles C., Viejo J., Marti E., Gonzalez-Fernandez D., Pragnell-Raasch H., Gonzalez-Gordillo J. I., et al. (2021). An inshore-offshore sorting system revealed from global classification of ocean litter;. Nat. Sustainability 4, 484–493. doi: 10.1038/s41893-021-00720-8
Mugilarasan M., Karthik R., Purvaja R., Robin R. S., Subbareddy B., Hariharan G., et al. (2021). Spatiotemporal variations in anthropogenic marine litter pollution along the northeast beaches of India;. Environ. Pollution 280, 116954. doi: 10.1016/j.envpol.2021.116954
Mugilarasan M., Karthik R., Robin R. S., Subbareddy B., Hariharan G., Anandavelu I., et al. (2023). Anthropogenic marine litter: An approach to environmental quality for India’s southeastern Arabian Sea coast;. Sci. Total Environ. 866, 161363. doi: 10.1016/j.scitotenv.2022.161363
Panwar H., Gupta P. K., Siddiqui M. K., Morales-Menendez R., Bhardwaj P., Sharma S., et al. (2020). AquaVision: Automating the detection of waste in water bodies using deep transfer learning;. Case Stud. Chemcial Environemntal Eng. 2, 100026. doi: 10.1016/j.cscee.2020.100026
Papakonstantinou A., Batsaris M., Spondylidis S., and Topouzelis K. (2021). A citizen science unmanned aerial system data acquisition protocol and deep learning techniques for the automatic detection and mapping of marine litter concentrations in the coastal zone. Drones 5, 6. doi: 10.3390/drones5010006
Podile V. and Sree C. H. V. S. (2018). Capital structure analysis of a micro enterprise-A case study of pl plast private limited. Int. J. Management IT Eng. 8, 183–198.
Politikos D. V., Fakiris E., Davvetas A., Klampanos I. A., and Papatheodorou G. (2021). Automatic detection of seafloor marine litter using towed camera images and deep learning;. Marine Pollution Bull. 164, 111974. doi: 10.1016/j.marpolbul.2021.111974
Rad M. S., von Kaenel A., Droux A., Tieche F., Ouerhani N., and Ekenel H.K and Thiran J. P. (2017). “A computer vision system to localize and classify wastes on the streets,” in Computer Vision Systems: 11th International Conference, ICVS 2017, Shenzhen, China, July 10-13, 2017, Revised Selected Papers, vol. 11. (Springer International Publishing), 195–204.
Raju M. P., Veerasingam S., Suneel V., Saha M., Rathore C., Naik A., et al. (2023). Seasonal variation and spatial distribution of microplastic pellets and their associated contaminants along the central east coast of India;. Environ. Sci. Pollution Res. 30, 68489–68503. doi: 10.1007/s11356-023-27100-3
Rangel-Buitrago N., Vergara-Cortes H., Barria-Herrera J., Contreras-Lopez M., and Agredano R. (2019). Marine debris occurrence along Las Salinas beach, Vina Delmar (Chile): magnitudes, impacts and management;. Ocean Coastal Manage. 178, 104842. doi: 10.1016/j.ocecoaman.2019.104842
Redmon J., Divvala S., Girshick R., and Farhadi A. (2016). “You only look once: Unified, real time object detection,” in 2016 IEEE Conference on Computer Vision and Pattern Recognition (CVPR), Las Vegas, NV, USA 779–788. doi: 10.1109/CVPR.2016.91
Ren C., Jung H., Lee S., and Jeong D. (2021). Coastal waste detection based on deep conventional neural networks;. Sensors 21, 7269. doi: 10.3390/s21217269
Rong J., Zhou H., Zhang F., Yuan T., and Wang P. (2023). Tomato cluster detection and counting using improved YOLOv5 based on RGB-D fusion;. Comput. Electron. Agric. 207, 107741. doi: 10.1016/j.compag.2023.107741
Sangadi P., Kuppan C., and Ravinathan P. (2022). Effect of hydro-geochemical processes and saltwater intrusion on groundwater quality and irrigational suitability assessed by geo-statistical techniques in coastal region of eastern Andhra Pradesh, India;. Marine Pollution Bull. 175, 113390. doi: 10.1016/j.marpolbul.2022.113390
Saravanan K., Kiruba-Sankar R., Khan M. J., Hashmi A. S., Velmurugan A., Haridas H., et al. (2021). Baseline assessment of marine debris with soil, sediment, and water quality characteristics from the fish landing centres of South Andaman, Andaman archipelago, India;. Marine Pollution Bull. 172, 112879. doi: 10.1016/j.marpolbul.2021.112879
Selvam K., Xavier K. A. M., Shivakrishna A., Bhutia T. P., Kamat S., and Shenoy L. (2021). Abundance, composition and sources of marine debris trawled-up in the fishing grounds along the north-east Arabian coast;. Sci. Total Environ. 751, 141771. doi: 10.1016/j.scitotenv.2020.141771
Sivadas S. K., Mishra P., Kaviarasan T., Sambandam M., Dhineka K., Murthy M. V., et al. (2022). Litter and plastic monitoring in the Indian marine environment: A review of current research, polices, waste management, and a roadmap for multidisciplinary action;. Marine Pollution Bull. 176, 113424. doi: 10.1016/j.marpolbul.2022.113424
Song K., Jung J.-Y., Lee S. H., and Park S. (2021). A comparative study of deep learning-based network model and conventional method to assess beach debris standing-stock;. Marine Pollution Bull. 168, 112466. doi: 10.1016/j.marpolbul.2021.112466
Song K., Jung J.-Y., Lee S. H., Park S., and Yang Y. (2022). Assessment of marine debris on hard-to-reach places using unmanned aerial vehicles and segmentation models based on a deep learning approach;. Sustainability 14, 8311. doi: 10.3390/su14148311
Sulochanan B., Veena S., Ratheesh L., Padua S., Rohit P., Kaladharan P., et al. (2019). Temporal and spatial variability of beach litter in Mangaluru, India;. Marine Pollution Bull. 149, 110541. doi: 10.1016/j.marpolbul.2019.110541
Tan M. and Le Q. (2019). “Efficientnet: Rethinking model scaling for convolutional neural networks,” in International conference on machine learning, PMLR, Long Beach, CA, USA, 9-15 June 2019. 6105–6114.
Tong J., Wang W., Xue M., Zhu Z., Han J., and Tian S. (2023). Automatic single fish detection with a commercial echosounder using YOLO v5 and its application for echosounder calibration;. Front. Marine Sci. 10, 1162064. doi: 10.3389/fmars.2023.1162064
UNEP (2021). From pollution to solution: a global assessment of marine litter and plastic pollution (Nairobi: United Nations Environment Programme). Available at: https://www.unep.org/resources/pollution-solution-global-assessment-marine-litter-and-plastic-pollution (Accessed January 15, 2025).
van Lieshout C., van Oeveren K., van Emmerik T., and Postma E. (2020). Automated river plastic monitoring using deep learning and cameras. Earth Space Sci. 7, e2019EA000960. doi: 10.1029/2019EA000960
Veerasingam S., Al-Khayat J. A., Aboobacker V. M., Hamza S., and Vethamony P. (2020). Sources, spatial distribution and characteristics of marine litter along the west coast of India;. Marine Pollution Bull. 159, 111478. doi: 10.1016/j.marpolbul.2020.111478
Veerasingam S., Chatting M., Asim F. S., Al-Khayat J., and Vethamony P. (2022). Detection and assessment of marine litter in an uninhabited island, Arabian Gulf: A case study with conventional and machine learning approaches;. Sci. Total Environ. 838, 156064. doi: 10.1016/j.scitotenv.2022.156064
Wolf M., van den Berg K., Garaba S. P., Gnann N., Sattler K., Stahl F., et al. (2020). Machine learning for aquatic plastic litter detection, classification and quantification (APLASTIC-Q);. Environ. Res. Lett. 15, 114042. doi: 10.1088/1748-9326/abbd01
Wu D., Liu J., Cordova M., Hellevik C. C., Cyvin J. B., Pinto A., et al. (2023). The PlastOPol system for marine litter monitoring by citizen scientists;. Environ. Modelling Software 169, 105784. doi: 10.1016/j.envsoft.2023.105784
Yang Y. and Wang X. (2023). Recognition of bird nests on transmission lines based on YOLOv5 and DETR using small samples;. Energy Rep. 9, 6219–6226. doi: 10.1016/j.egyr.2023.05.235
Zhang R., Li S., Ji G., Zhao X., Li J., and Pan M. (2021). Survey on deep learning-based marine object detection. J. Advanced Transportation, 5808206. doi: 10.1155/2021/5808206
Zhao Z.-Q., Zheng P., Xu S.-T., and Wu X. (2019). Object detection with deep learning: A review. IEEE Trans. Neural Networks Learn. Syst. 30, 3212–3232. doi: 10.1109/TNNLS.2018.2876865
Keywords: marine litter, plastic, machine learning, computer vision, clean coast index, Andhra
Citation: Raju MP, Veerasingam S, Suneel V, Asim FS, Khalil HA, Chatting M, Suneetha P and Vethamony P (2025) A machine learning-based detection, classification, and quantification of marine litter along the central east coast of India. Front. Mar. Sci. 12:1604055. doi: 10.3389/fmars.2025.1604055
Received: 01 April 2025; Accepted: 05 May 2025;
Published: 29 May 2025.
Edited by:
Yen-Chiang Chang, Dalian Maritime University, ChinaReviewed by:
Periyadan K Krishnakumar, National Center for Wildlife, Saudi ArabiaJayabhavani G N, Puducherry Technological University, India
Copyright © 2025 Raju, Veerasingam, Suneel, Asim, Khalil, Chatting, Suneetha and Vethamony. This is an open-access article distributed under the terms of the Creative Commons Attribution License (CC BY). The use, distribution or reproduction in other forums is permitted, provided the original author(s) and the copyright owner(s) are credited and that the original publication in this journal is cited, in accordance with accepted academic practice. No use, distribution or reproduction is permitted which does not comply with these terms.
*Correspondence: Subramanian Veerasingam, di5zdWJyYW1hbmlhbkBxdS5lZHUucWE=