 Juan Francisco Martinez-Osuna
 Viviana Piermattei
 Giovanni Coppini
 Marco Marcelli
- 1CMCC Foundation - Euro-Mediterranean Center on Climate Change, Lecce, Italy
- 2Laboratory of Experimental Oceanology and Marine Ecology, Department of Ecological and Biological Sciences, University of Tuscia, Civitavecchia, Italy
The study of climate change and its impact on coastal areas has become increasingly important in recent years and understanding how storm surges and extreme events affect water levels in transitional and coastal zones has become a crucial aspect. The main objective of this work is to develop a low-cost, easy-to-install device capable of accurately measuring sea and river water levels, along with basic meteorological variables at the ocean–atmosphere interface. The proposed device, known as InterBox: Air-Sea Interface Observing System in a Box, represents a valuable component of the monitoring capacity required to assess the impact of climate change on coastal water levels, supporting the spatial and temporal mapping of its consequences in estuarine and coastal environments. In this context, ultrasonic sensors offer several advantages: high accuracy, non-invasiveness, fast installation, low-cost, real-time data acquisition, and flexibility to interface with diverse data loggers. Moreover, monitoring atmospheric pressure, air temperature, and humidity is essential to better understand the processes driving water level variability, storm surge dynamics, and compound flooding events. These variables provide critical context for interpreting hydrological and oceanographic measurements, enhancing the accuracy of predictive models, and contributing to the development of more robust Early Warning Systems. Strategically deploying these sensors along coasts and rivers could enable improved monitoring granularity, (that is, a higher level of spatial and temporal detail in the collected data, which in turn allows for a more accurate assessment of spatiotemporal variability). This is achieved by collecting integrated water level and meteorological data at multiple locations before, during, and after extreme events. These datasets can be incorporated into open data platforms such as EMODnet Physics and integrated into digital twins of the coastal ocean, supporting both planning and emergency response strategies.
1 Introduction
Climate change is extensive, fast-moving, and escalating, and some patterns are now strongly impacting coastal areas. Human-driven climate change is already impacting numerous weather and climate extremes in every region worldwide. Coastal regions are especially vulnerable to climate change, experiencing ongoing sea level rise and extreme meteo-marine events, all of which lead to more frequent and severe coastal flooding (including compound events when storm surge happens together with river flooding) in low-lying areas as well as causing coastal erosion [e.g., (Core Writing Team, 2023)]. Coastal zones are particularly vulnerable to the influences of sea level variations due to climate variability [e.g., (Satta et al., 2017; Vousdoukas et al., 2018)] and estuaries, which are among the most productive ecosystems in the world, are highly affected by many anthropogenic pressures, including the consequences of climate change [e.g., (Dixon et al., 2023)] and accelerated inputs of terrestrial sediments [e.g., (Flowers et al., 2023)]. In fact, physical changes in global climate have been widely observed and such trends are expected to continue. The research community is focusing on risks associated with sea level rise (SLR) such as storm-related flooding that will make activities in coastal areas increasingly vulnerable, leading to loss of marine habitats and ecosystems [e.g., (Pinardi et al., 2024; Brierley and Kingsford, 2009; Bandeira et al., 2021)].
Many projects were designed to create emergency services for sea level rise and flash flooding, for example: the FLARE (Sailing towards new flood risk assessment for ships, founded by European Union) project, which was created to establish a risk-based methodology for flooding risk evaluation and management under the framework of activities of the Horizon 2020 program; the CORFU (Collaborative Research on Flood Resilience in Urban Areas, founded by European Union under the 7 research frame https://cordis.europa.eu/project/id/244047 work – FP7) project (Batica and Goubesville, 2011), which has been created to provide adequate measures for improved flood management in cities under the seventh framework program, among others are funded to help increase knowledge about flooding in coastal areas and develop new strategies to improve flood risk management; the STREAM (Strategic development of flood management, Interreg Italy-Croatia, European Regional Development Fund) project which aims to increase knowledge about floods involving both local authorities and emergency services to improve risk management and people to learn how to behave in case of flood hazards, helping to reduce the human and socio-economic losses caused by floodings. Among the many projects dedicated to early warning systems, (Smart Sea Level Sensors) developed a network of sea level rise sensors in response to Hurricane Irma in 2017. This network provided real-time data to local residents about flooding in their area. Moreover, it allowed for the validation and improvement of a numerical model to reproduce storm surges, using a high-density hyper-local network of 55 sensors to observe and record the water level along the North Georgia coast (Park et al., 2022), involving students, citizens, and local communities.
Within the UN OceanDecade, The CoastPredict Program and its Core Project PredictOnTime have underlined the importance of expanding the capacities of citizen science low-cost sensors to increase the observing capabilities in the under-sampled coastal areas, especially in the Global South.
The lack of solid data on the potential impacts of climate change results in many important questions that remain unanswered, from the molecular and biochemical level to the ecosystem level (Alasdair, 1995). This creates considerable uncertainty in the predictions about future climate changes. Trégarot et al. (2024) for their part emphasize the need for comprehensive, long-term monitoring with an integrated approach that considers multiple species, ecosystems and stress factors, such as meteo-marine variables, to better predict the impacts of climate change and other human pressures on the most vulnerable marine and coastal ecosystems.
Additionally, the dynamic interplay between coastal erosion and flood risk further complicates vulnerability, with shoreline morphology playing a critical role in flood exposure [e.g., (Pollard et al., 2019)]. Pollard et al. emphasize the importance of understanding coastal evolution to effectively assess and mitigate flood risks, particularly in regions prone to frequent storms and rising sea levels.
Floods, caused by storm surges —defined as an abnormal increase in water level generated by storms, either below or above the predicted astronomical tide and primarily driven by strong winds US National Hurricane Center - Storm Surge Overview)— significantly affect marine ecosystems due to its impact on sediment distribution and dynamics and its influence in the modification of the coastal slope. These processes are considered one of the main reasons for the regression and loss of important habitats [e.g., (Ietto et al., 2023)], such as Posidonia oceanica meadows and coralligenous species in coastal waters. Storm surges also pose serious threats to human population; recent events have shown that the sea level rise associated with high-intensity hurricanes making landfall has caused numerous fatalities along the coasts worldwide where human presence continuously increases.
Although these natural phenomena cannot be avoided, it is possible to predict them with accurate forecasts and reduce their consequences through the implementation of early warning systems, which have been proven to be an efficient tool both to monitor the event in its early stages and to expedite alerts to key users and the general population [e.g., (Kristensen et al., 2022)]. Forecasting is often done with the main approaches of exploiting past statistical evidence (i.e., statistical forecasting) and using dynamical models, which simulate in detail currents and water levels in a regional set-up [e.g., (von Storch, 2014)] however data assimilation is very important to correct the boundaries and consider the calibration processes not included in the model [e.g., (World Meteorological Organization, 2011)] and the integration of in-situ observations is crucial for the validation and optimization of the model forecast and to achieve a better approximation to reality.
There is still a considerable knowledge gap due to the lack of coastal observations, especially in developing countries, due to the inability to access user-friendly, low-cost instrumentation. Fortunately, recent technological advances have created opportunities to improve low-cost data acquisition and transmission systems [e.g., (Marcelli et al., 2021)]. Although lowcost systems have already been implemented for example to obtain water level data in rivers in a practical and precise manner [e.g., (Kabi et al., 2023)], currently, the data acquisition for sea level monitoring are mostly dedicated to sea level with reference to astronomical tide; these systems tend to be expensive and of long integration.
In this context, citizen science-based practices are playing an increasingly significant role across a wide range of environmental research areas, including assessing the impacts of climate change [e.g., (Pandeya et al., 2021)]. For these reasons, the growing availability of low-cost sensors further supports these efforts by enabling broader participation and expanding the spatial and temporal scales of data collection. Advances in affordable sensor technology and smartphone connectivity have facilitated a growing number of citizen-led environmental measurements, including precipitation, river levels, and soil moisture [e.g., (Paul and Buytaert, 2018)]. This approach can also contribute to the validation of forecasting models through coordinated volunteer efforts. In such initiatives, citizen scientists are trained to use the Sea Level Rise mobile application to collect three types of flood-related data, all of which are valuable to improve the accuracy and reliability of model outputs [e.g., (Loftis et al., 2019)]. This participatory method not only increases data density and spatial coverage, but also fosters community engagement in climate adaptation and risk reduction strategies.
Within this framework, the purpose of this paper is to evaluate the use of low-cost ultrasonic sensors for water level measurements and to present the development, deployment, testing and applications of the InterBox, a low-cost system for monitoring water levels (including ultrasonic sensors) and meteorological variables, designed to support both research, education, and citizen science initiatives. The system aims to address the need to democratize environmental observations by making data collection accessible to non-experts and promoting inclusive participation in scientific processes. This approach aligns with the objectives of the CoastPredict program by contributing to the generation of dense, real-time coastal data, which are essential for improving early warning systems and enhancing predictive capabilities.
This paper is organized as follows: Section 2 provides a brief overview of the state-ofthe-art in sea level measurement technologies. Sections 3, 4, and 5 describe the ultrasonic sensor used in this project, the calibration procedure, the data acquisition and transmission system used in the tests, and the pilot site where the implementation and tests were carried out. Section 6 presents the Inter-Box system, which integrates sea level and meteorological sensors along with a transmission and solar power unit. Section 7 shows the results and discussion, and Section 8 concludes with final remarks and perspectives for future work.
2 State of the art in water level measurement
The common method for measuring and recording water levels involves using tide gauges equipped with various sensor technologies. Recent advances in sea level measurement technology have greatly improved accuracy, reliability, and data resolution. As shown in Table 1, each sensor technology has its own advantages and limitations, and the choice of sensor depends mainly on the characteristics of the installation site and the budget and objectives of the project. Below are some traditional and emerging sensor technologies used for water level measurement.
● Float Tide Gauges: The typical tide gauge uses a float housed within a stilling well, which protects it from waves and turbulence. The float moves up and down with the changing sea level, and this movement is measured and registered either mechanically or electronically.
● Pressure Sensors: These devices are submerged in water to measure the pressure exerted by the water column above them, which is then converted into a corresponding water level measurement (in-situ Level Troll 700H data logger, Sea-Bird
● Bubbler Sensors: Measure water column pressure using a small-diameter tube submerged in the water. An air source pushes the air through the tube, and the system adjusts the air pressure until bubbles emerge. The pressure needed to generate these bubbles reflects the water column pressure, which is used to determine the water level (OTT Compact Bubbler Sensor).
● Radar Sensors: These sensors emit microwave pulses towards the water surface and measure the distance by calculating the time it takes for the pulses to return after being reflected. These devices do not make direct contact with the water (Campbell Scientific CS475 Radar).
● Acoustic Sensors: These sensors emit sound waves towards the sea surface and measure the distance by calculating the time it takes for the echoes to return. Acoustic sensors are particularly effective in environments where radar might be less reliable, such as in dense fog or precipitation (MaxSonar Water Level Sensor).
● Capacitive Cables: This emerging technology for sea level measurement detects changes in capacitance as the water height around the sensor varies. Capacitance, which depends on the dielectric constant of the water and the sensor’s geometry, changes with the water level (Ocean Sensors System Wave Staff).
● Resistive Cables: This emerging technology for sea level measurement measures the electrical resistance between two electrodes submerged in water. The resistance changes in response to the water height between the electrodes (Jowa Metritape Level Sensor).
● Optical Fiber: This innovative technology uses a submerged optical fiber cable to measure changes in water level through techniques such as Optical Time-Domain Reflectometry (OTDR). The optical fiber detects variations in temperature, pressure, and strain along its length, which can be correlated with changes in sea level [e.g., (Liu et al., 2021)].
● Satellite Altimetry: This innovative technology enables global sea level monitoring. It involves satellites equipped with altimeters that precisely measure the distance between the satellite and the sea surface (Earth.gov - About Sea Level Change: How We Measure (The Basics)).
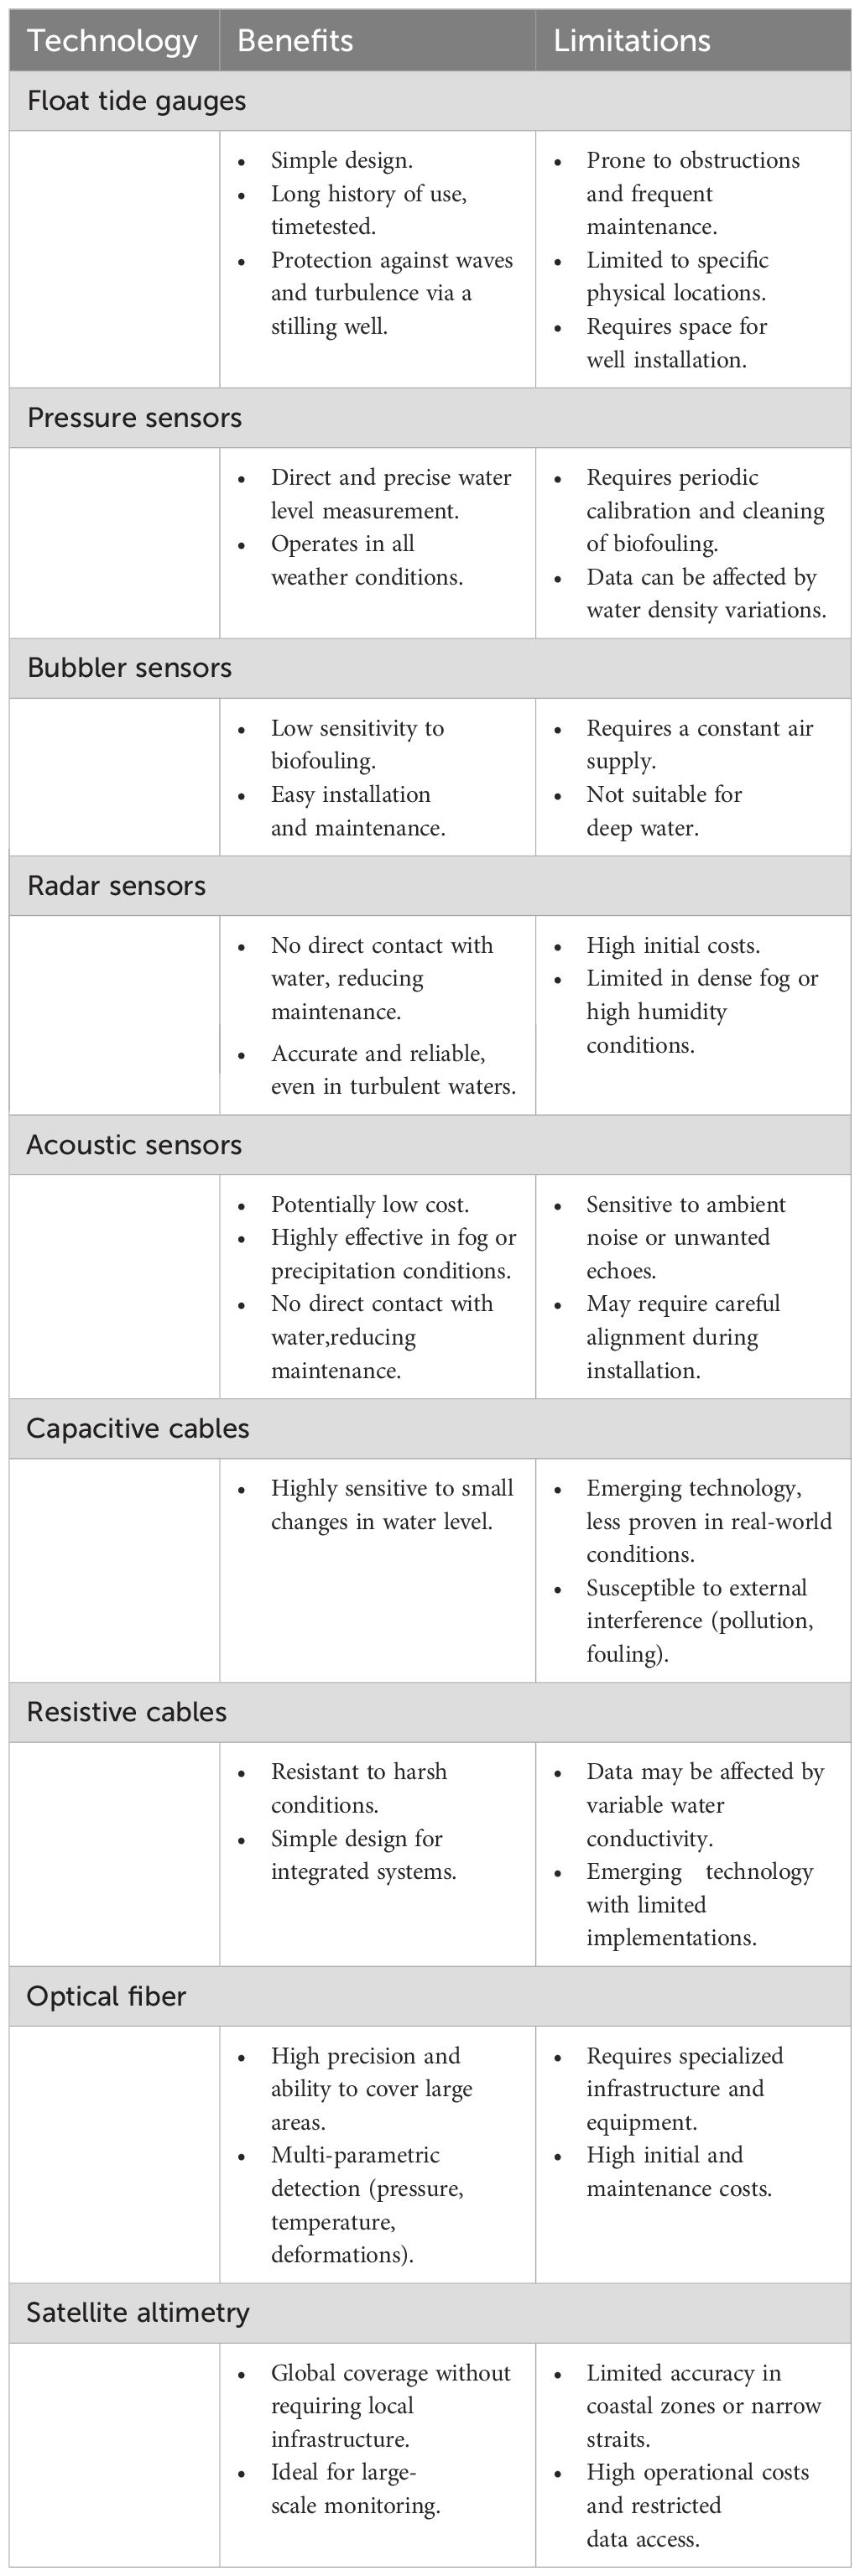
Table 1. Comparison of sea level measurement technologies: benefits and limitations.
3 Ultrasonic sensors for water level measurements
As shown in Table 2, ultrasonic sensors present both advantages and limitations for water level measurements; however, their use in monitoring sea and river levels provides precise and accurate data at a very low cost. Their compact size, low energy consumption, and minimal maintenance requirements make them an excellent choice for creating a sensor network to monitor sea and river levels, thereby increasing the granularity of the data. This capability, which is crucial for monitoring extreme events, is often limited by the sparseness of water level measurement stations [e.g., (Yang et al., 2024)].
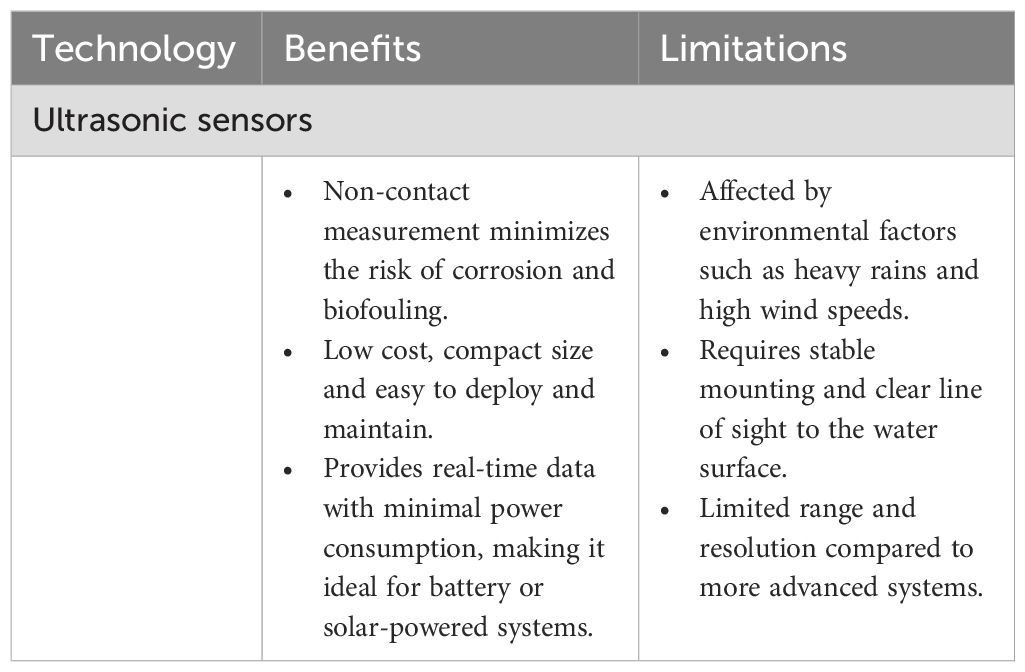
Table 2. Benefits and limitations of using ultrasonic sensors for water level monitoring.
Ultrasonic distance sensors operate on the Time-of-Flight (ToF) principle, emitting ultrasonic pulses and measuring the time it takes for these pulses to travel to an object and return to the sensor. For accurately measuring water levels in coastal and river applications—such as monitoring the effects of storm surges, compound floods and flash flooding in estuarine zones—we propose using the affordable, low-cost HY-SRF05 Precision Ultrasonic module (Figure 1) in a high spatial resolution network. This module provides precise measurements of the distance to the water surface, which can be converted into water level readings by setting an arbitrary reference point, whether at sea or along a riverbank.
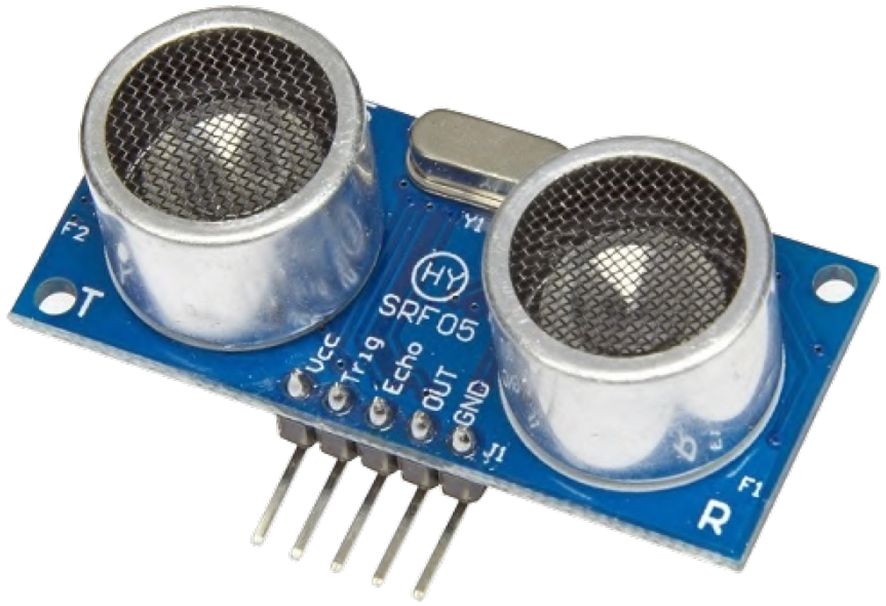
Figure 1. HY-SRF05 precision ultrasonic sensor.
3.1 HY-SRF05 precision ultrasonic module
The HY-SRF05 provides non-contact measurement ranging from 2 to 450 cm with an accuracy reaching 2 mm and includes transmitters, receivers, and control circuitry in the same board.
The Table 3 outlines the technical specification of the sensor.
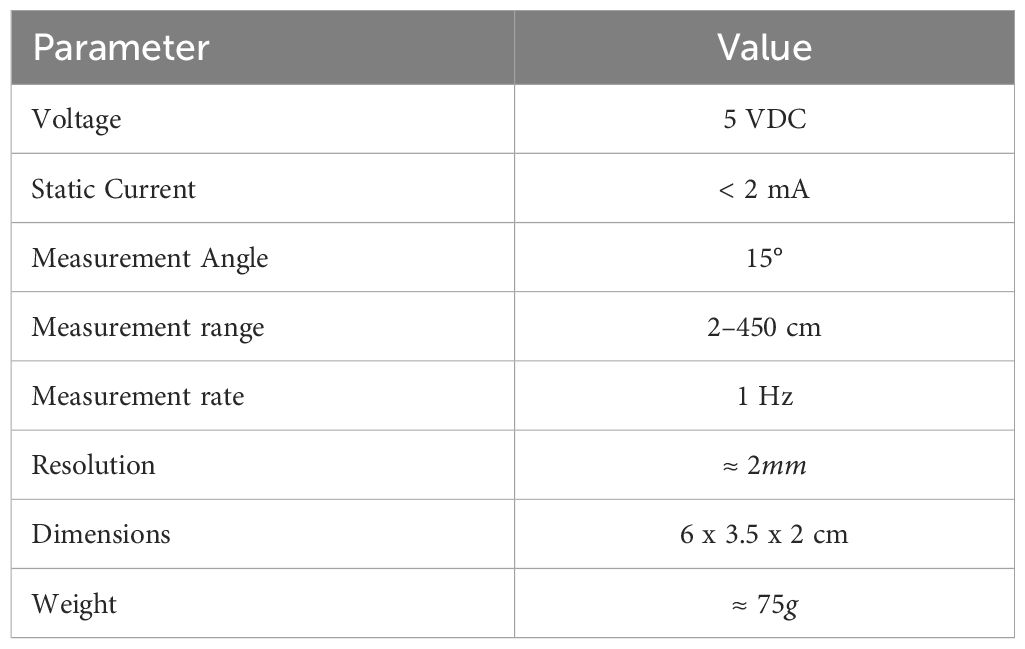
Table 3. Ultrasonic sensor technical specifications.
As shown in Figure 2, in our test the device was enclosed in a protective plastic cover and coated with epoxy resin to protect the circuitry, creating a sensor that is resistant to weather conditions. The compact dimensions (6 x 3.5 x 2cm) and lightweight (≈ 75g) of the encapsulated sensor make it easy to handle and install at remote sites.
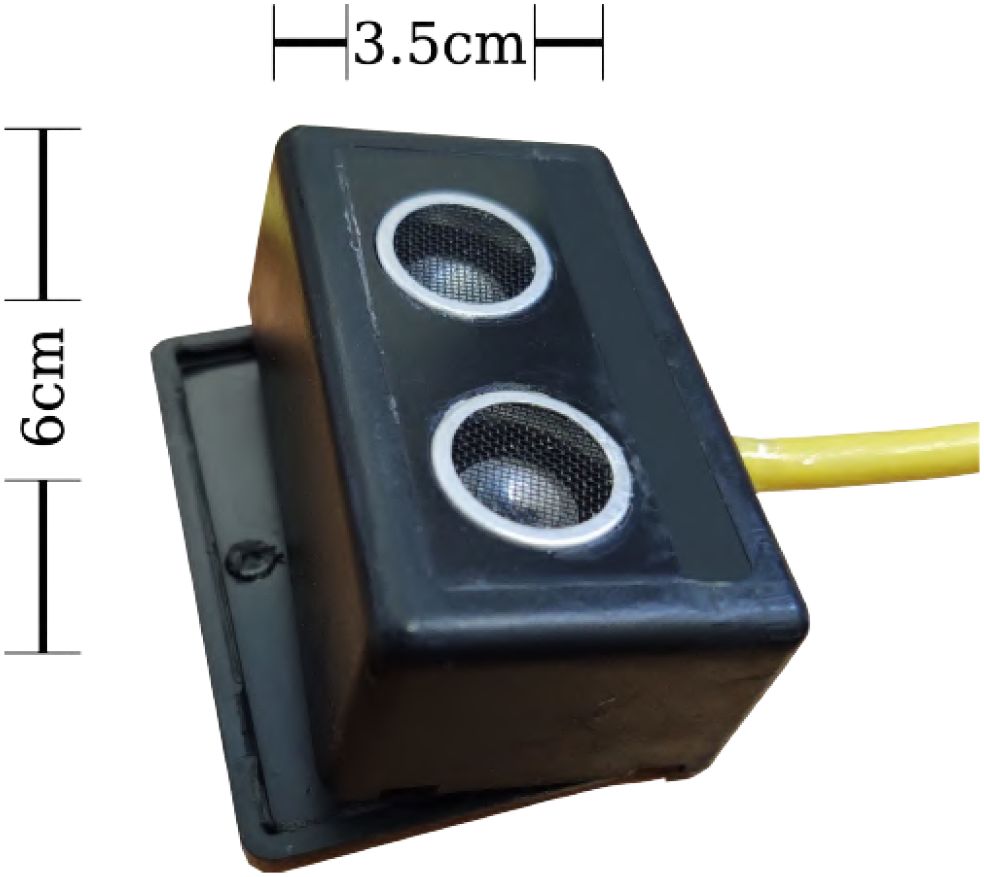
Figure 2. Weather-resistant ultrasonic sensor.
The HY-SRF05 sensor is designed to integrate seamlessly with the digital interface of the datalogger. It uses TTL-level digital pulse signals for communication through its dedicated trigger and echo pins. Figure 3 shows the timing diagram of the ultrasonic module. To initiate the measurement process, a short 10 µs pulse must be applied to the module trigger input. Once triggered, the module responds by emitting an 8-cycle burst of ultrasonic waves at 40 kHz. Afterward, it generates a pulse on the echo pin, whose duration must be measured, as it is proportional to the time it takes for the ultrasonic wave to travel to the object and back.
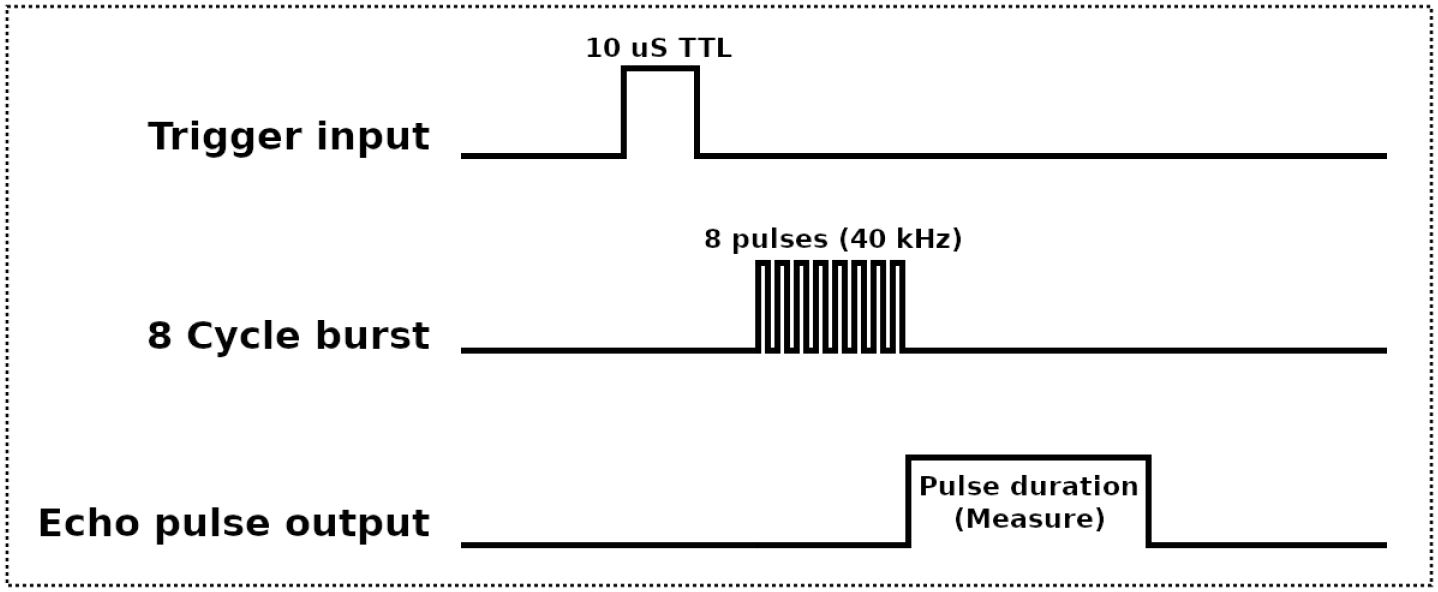
Figure 3. Sensors data transmission timing diagram.
Based on the duration of the echo pulse, the distance can be calculated using the Equation 1.
where S represents the elapsed time (in µs) for the ultrasonic pulse to travel to the target and back, and c is the speed of sound (in m/s).
Note: Divided by 2 because the sensor returns the round-trip time, which doubles the distance measurement.
Since the speed of sound depends on air temperature, it can be calculated using the Equation 2.
where T is the air temperature in degrees Celsius.
To ensure accurate compensation, a T-type thermocouple connected to a differential input channel of the datalogger was used to measure and record the air temperature. The thermocouple was placed a few centimeters away from the ultrasonic sensors to ensure precise temperature measurements.
3.2 Sensors Calibration
Two low-cost HY-SRF05 ultrasonic sensors and a medium-cost MB7369 sonar sensor were calibrated using a Campbell Scientific CR300 Datalogger for data acquisition and storage, with a Campbell Scientific CS475 radar as reference. The MB7369, known for its accuracy and precision, has been successfully used for river flood monitoring (MaxBotix https://maxbotix.com/blogs/blog/river-flood-monitoring-with-ultrasonic-sensors River Flood Monitoring with Ultrasonic Sensors) and was used in the calibration process to compare the sensors response. Calibration involved placing all sensors at the top of a ≈ 1.0m deep tank (Figure 4) and emptying and refilling the tank over an eight-hour period. Data were acquired at 0.5 Hz.
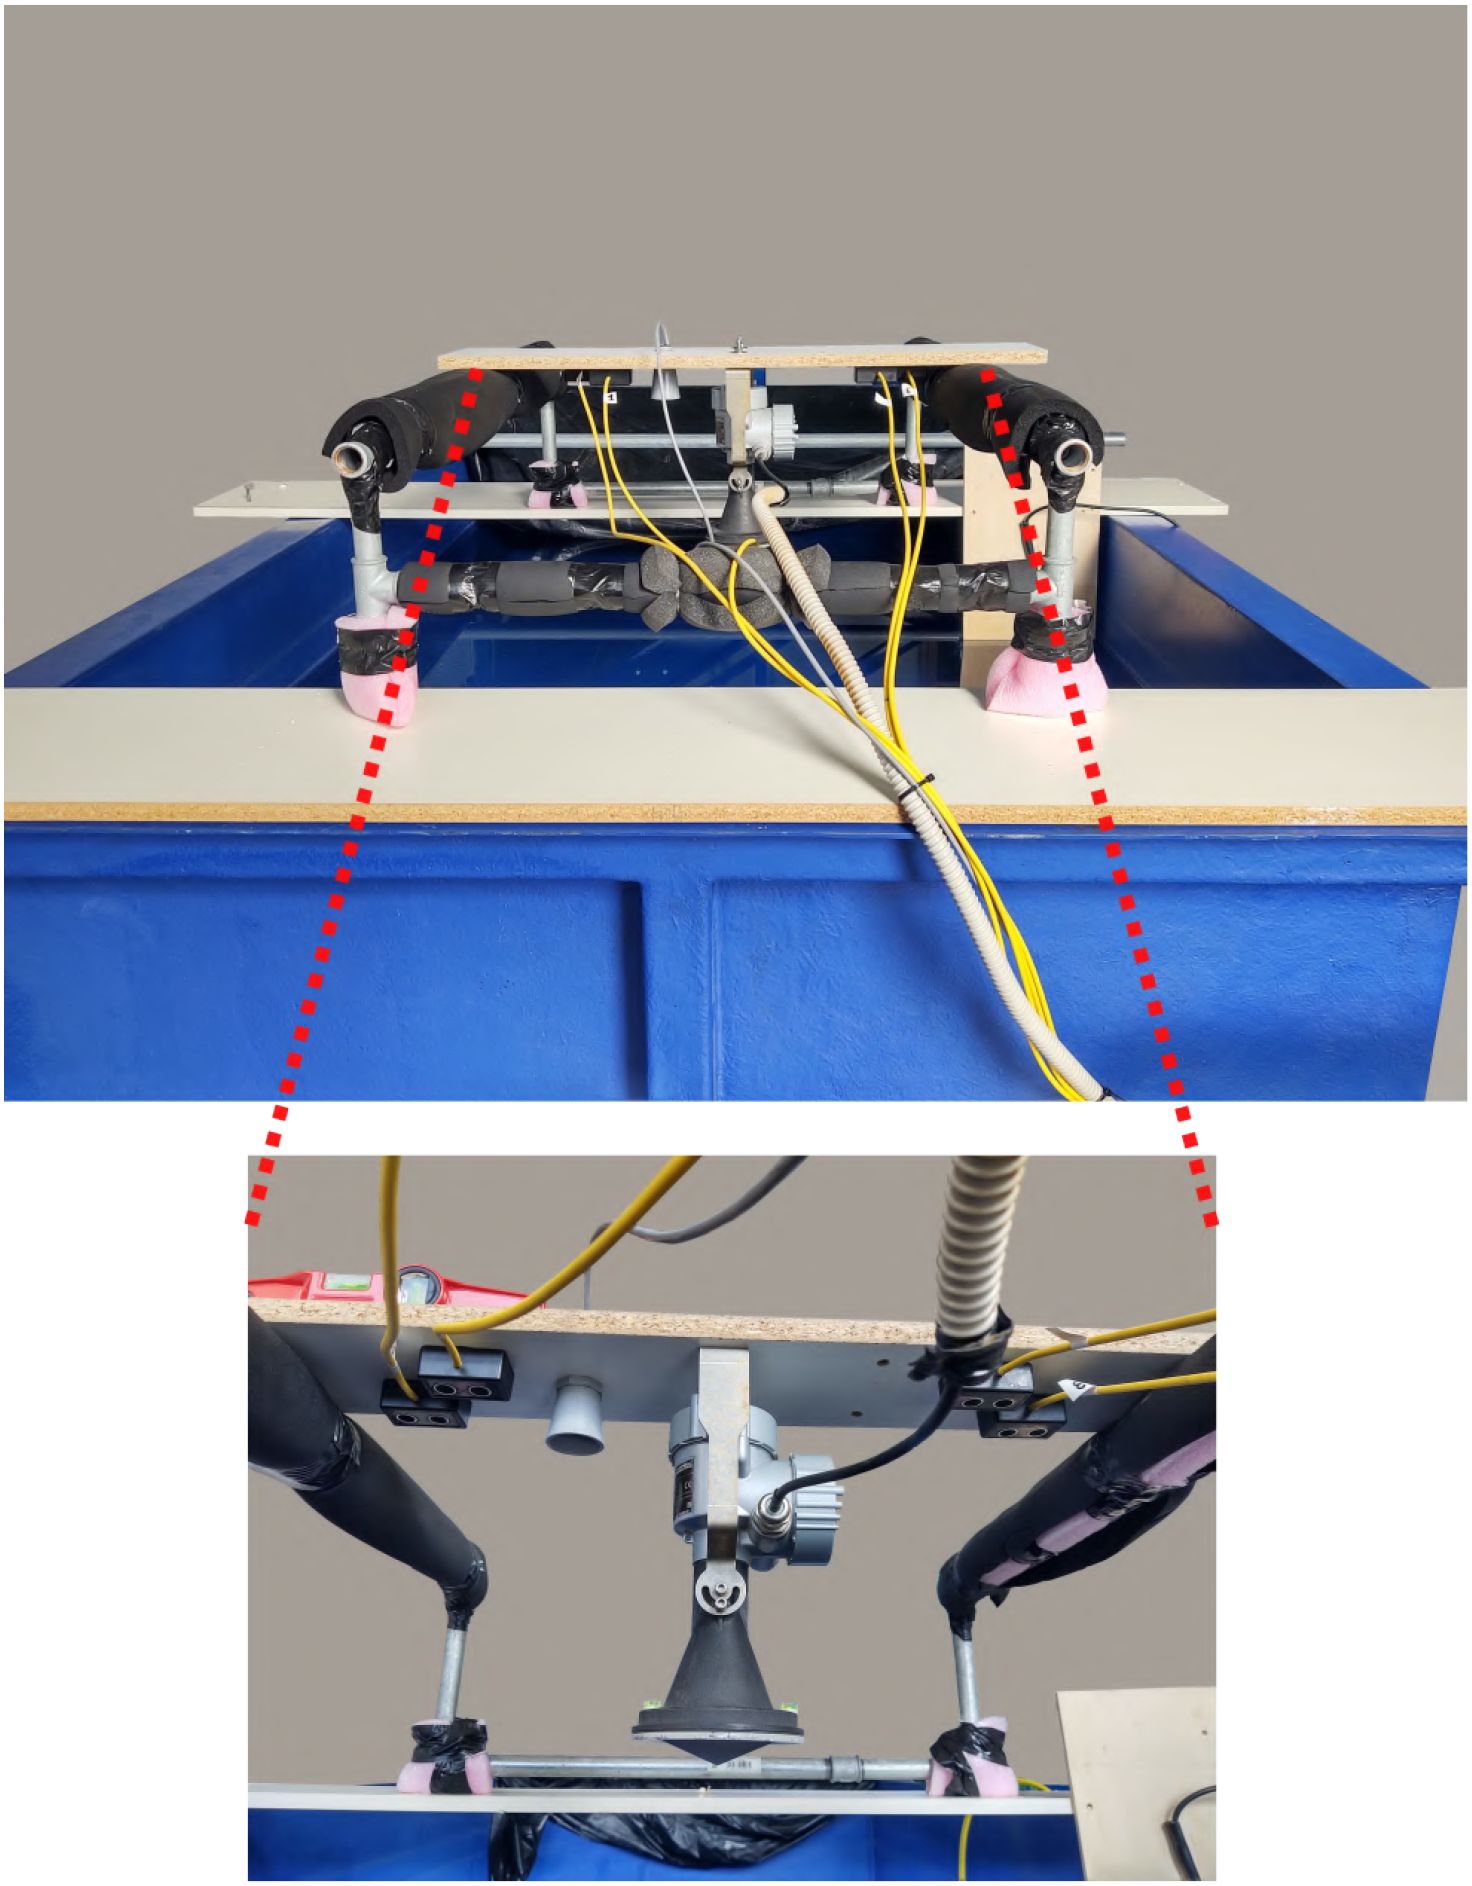
Figure 4. Sensors setup for the calibration process. The lower image shows the sensors from a bottom view.
The ±5 mm accuracy and 1 mm resolution of the CS475 radar provide detailed and accurate readings, thus enhancing the performance of the ultrasonic sensors. Consequently, we can confidently rely on the data collected from the sensors for future analysis and decision-making.
Table 4 shows a comparison of the most important specifications of all the sensors used in the calibration process.
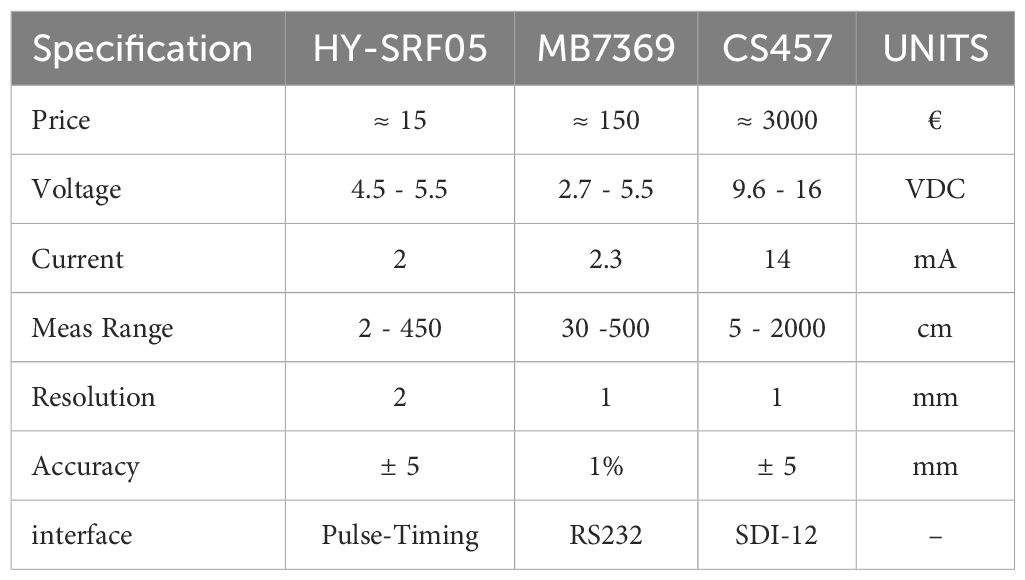
Table 4. Comparison of water level sensor specifications.
The data collected allowed us to compare the response of the sensors under controlled conditions and to establish calibration equations for each ultrasonic and sonar sensor using first-order linear regression. Figure 5 shows the calibration curves for each sensor, with the first-order calibration equations displayed in the top left of the figure and the CS475 radar response as reference. As shown in the figure, all sensors present a very similar response under the tested conditions.
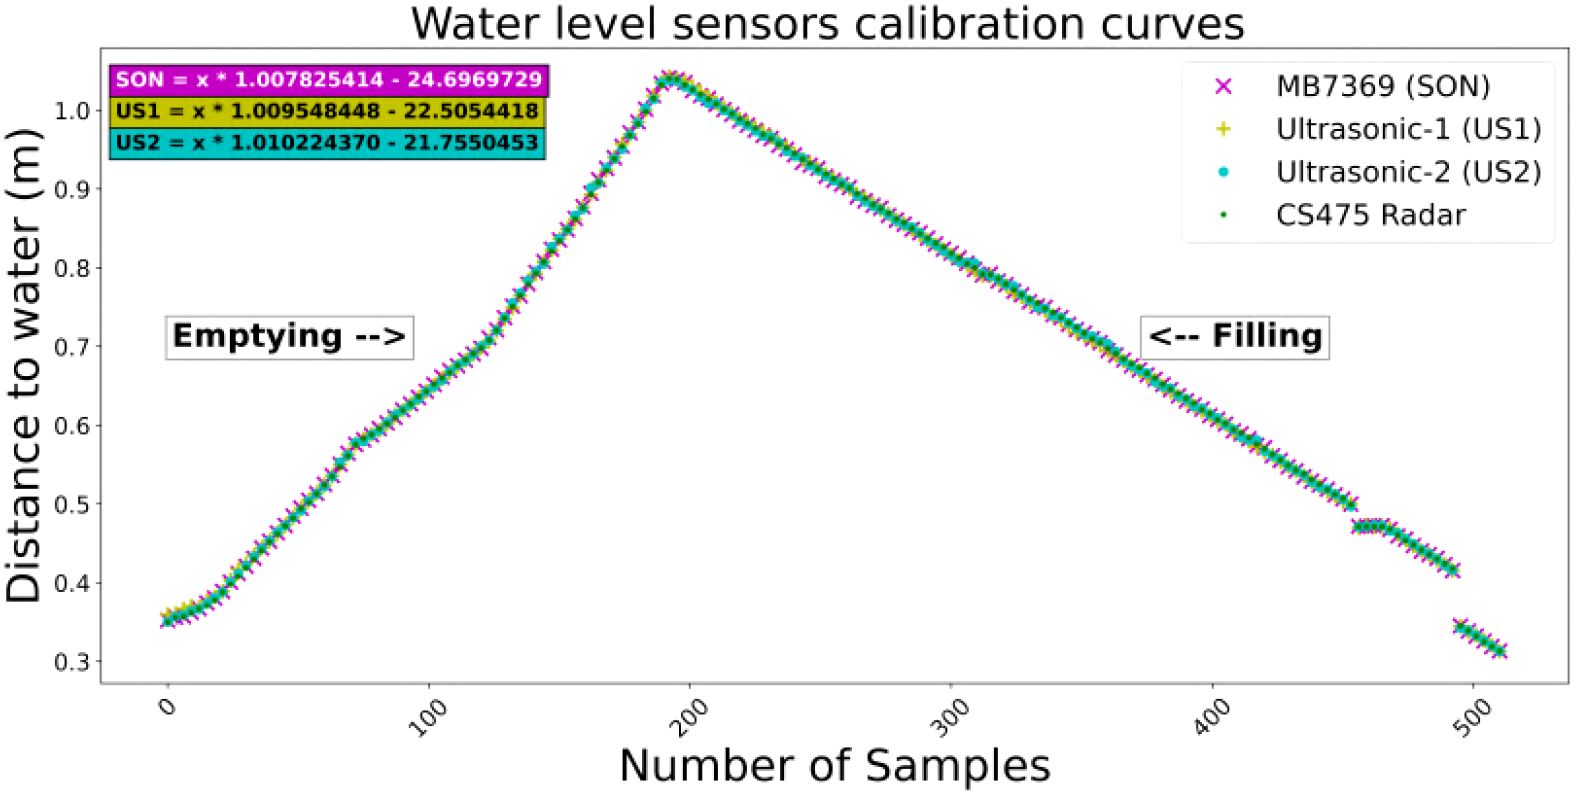
Figure 5. Sensors calibration curves. (“US1” and “US2” corresponds to the ultrasonic sensors while “SON” corresponds to the MB7369 Sonar Sensor).
4 Data acquisition and transmission system
To conduct performance tests on the sensors, a Data Acquisition System (DAQ) was integrated including a CR300 data logger (Figure 6) for recording and storing data of all sensors and a Seeeduino Grove-LoRa-E5 module (Figure 7) for transmitting data to a receiving station. An autonomous solar power supply system was also incorporated.
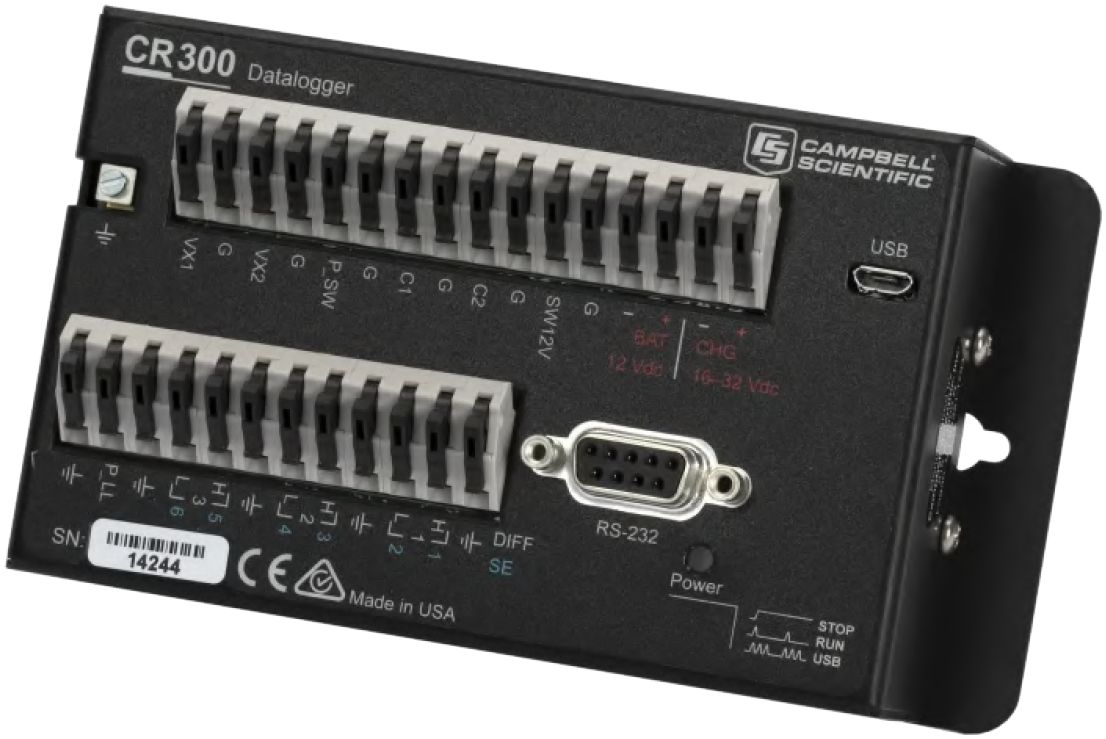
Figure 6. Campbell scientific CR300 datalogger.
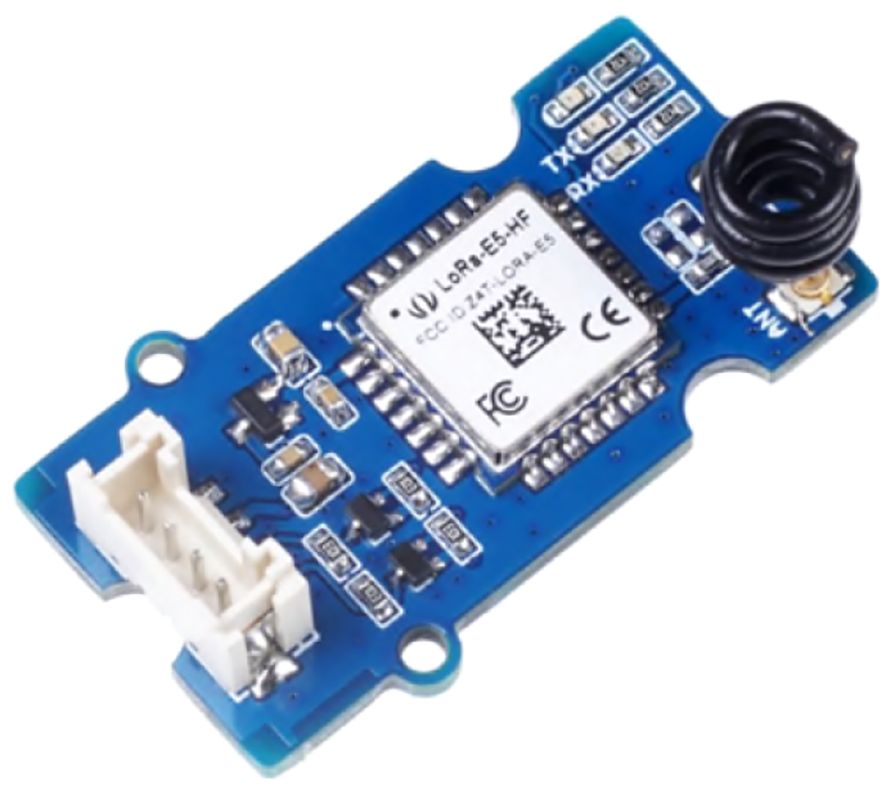
Figure 7. Grove - LoRa-E5 transceiver.
A block diagram of the DAQ is shown in Figure 8. The diagram includes illustrations of the water level sensors, the datalogger, the LoRa transmitter and the distribution of the devices in the supporting structure. The main function of the datalogger was to control the data acquisition process, record the data in internal memory, and prepare the information to be sent through the LoRa-E5 transmitter.
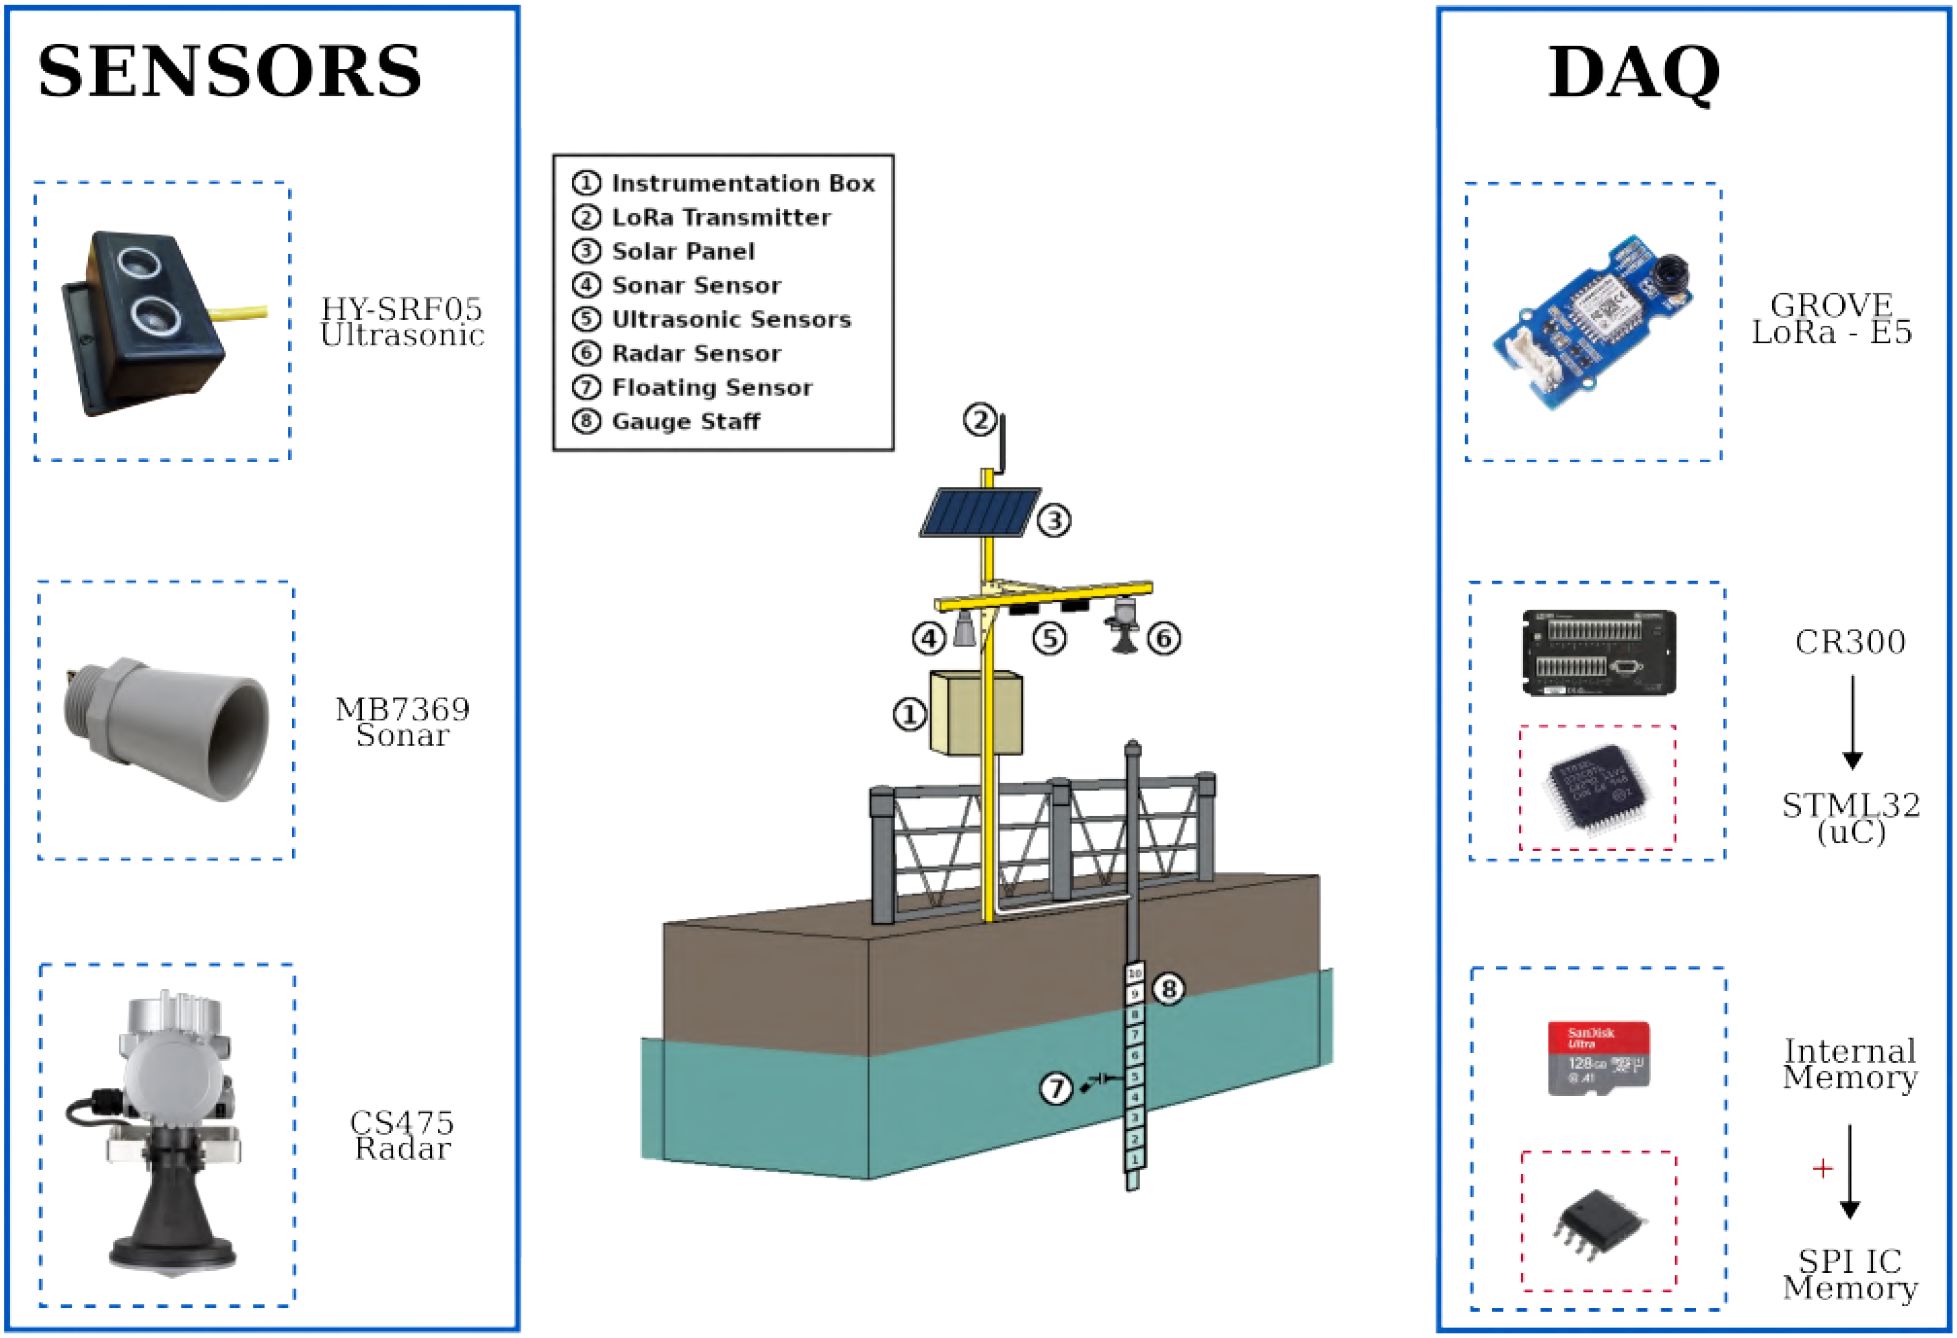
Figure 8. Block diagram of the system for installing and testing the low-cost ultrasonic sensors used for water level measurements.
4.1 Datalogger CR300
The CR300 series (Figure 6) are compact, highly integrated, multipurpose, measurement and control data loggers that offer fast communications, low power requirements, builtin USB, and excellent analog input accuracy and resolution. This datalogger is highly valued in the research field for its reliability and versatility.
Table 5 outlines some of the technical specifications of the CR300 datalogger.
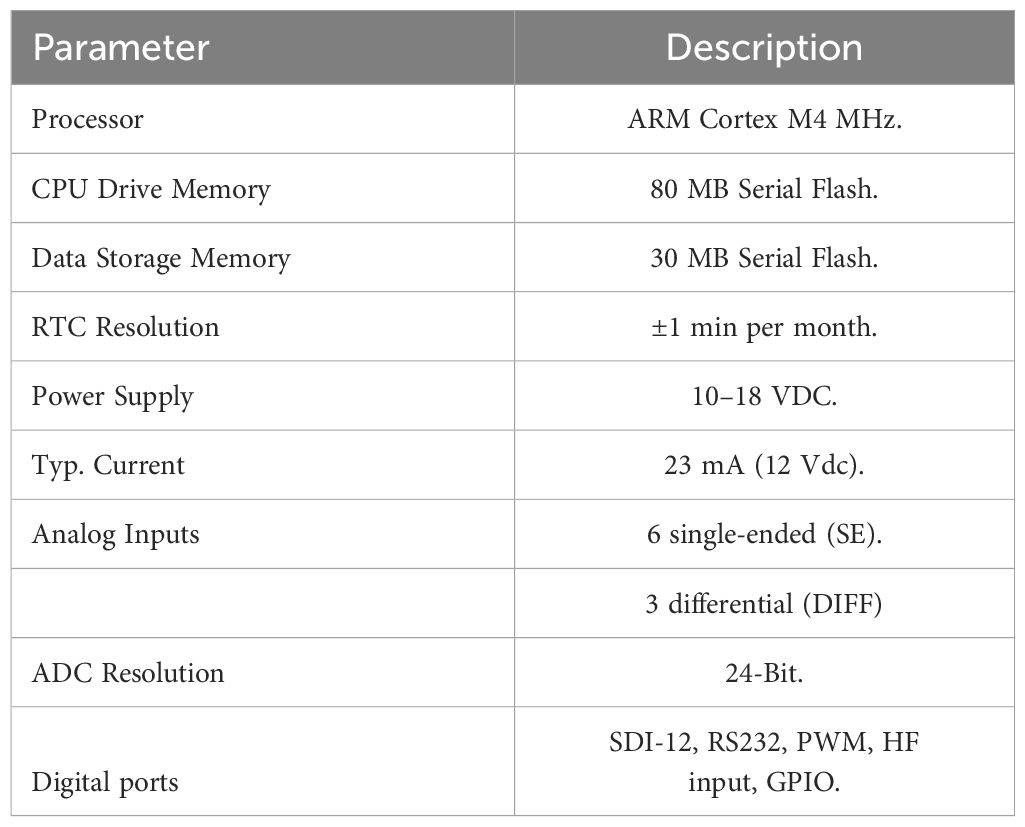
Table 5. Campbell scientific CR300 datalogger specifications.
4.2 GROVE-LoRa-E5 transceiver
LoRa technology (short for “Long Range”) was developed by Semtech Corporation (Semtech - LoRa Technology) and is designed for long-range, low-power wireless communication between devices in the Internet of Things (IoT). Operating on the unlicensed ISM (Industrial, Scientific, and Medical) bands, LoRa offers flexibility in deployment and can achieve ranges of several kilometers, depending on various factors such as environmental conditions and antenna design. LoRaWAN (Long Range Wide Area Network) is a protocol that operates on top of LoRa technology.
The Grove LoRa-E5 (Figure 7) is a wireless radio module that supports both LoRa and LoRaWAN protocols on the EU868 and US915 frequencies, as well as (G)FSK, BPSK, (G)MSK, and LoRa modulations. The device communicates using AT commands and interfaces with the datalogger via a serial port to transmit data to a receiving station.
Table 6 presents some of the technical specifications of the LoRa transceiver.
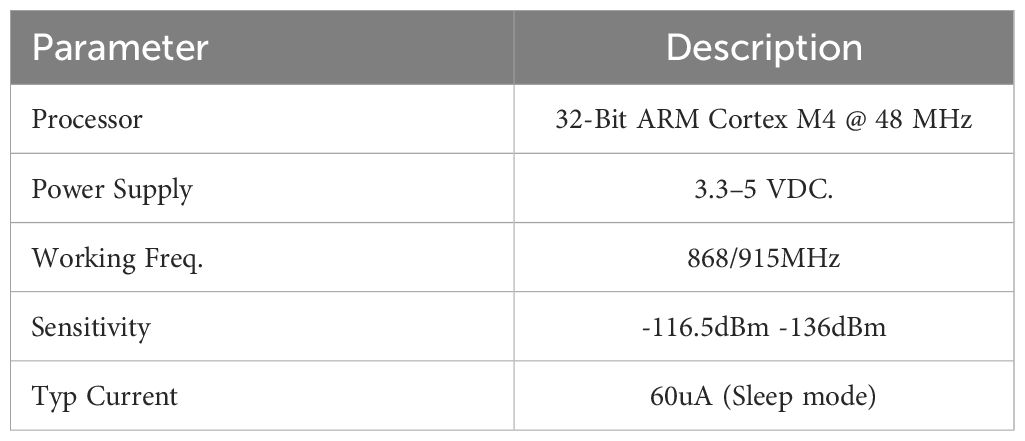
Table 6. Grove-LoRa-E5 transceiver technical specifications.
5 Pilot site
A pilot site was established at the Port of Civitavecchia, located at coordinates 42°05’40.6”N, 11°47’09.5”E in Rome, Italy. Direct measurements were conducted here to determine the distance between the level sensors and the sea surface. A tide gauge station owned by the Istituto Superiore per la Protezione e la Ricerca Ambientale (ISPRA), Italy, is located approximately 250 meters from the pilot site, allowing for comparison of the registered data with the developed system mentioned in this article. This ISPRA tide gauge consists of a floating hydrometer and a radar level transducer, providing data redundancy.
The pilot site was set up with the installation of water level sensors and the data acquisition and transmission system (Figure 9). Two low-cost ultrasonic sensors (US1 and US2), as well as sonar and radar sensors, were placed facing the sea surface. The setup followed the proposed configuration, with a CR300 data logger at its core, and data transmission facilitated by the LoRa-E5 modem. Data were acquired at a rate of 0.2 Hz, with quality control performed by first removing outliers and then calculating the median of the data over 10-minutes interval.
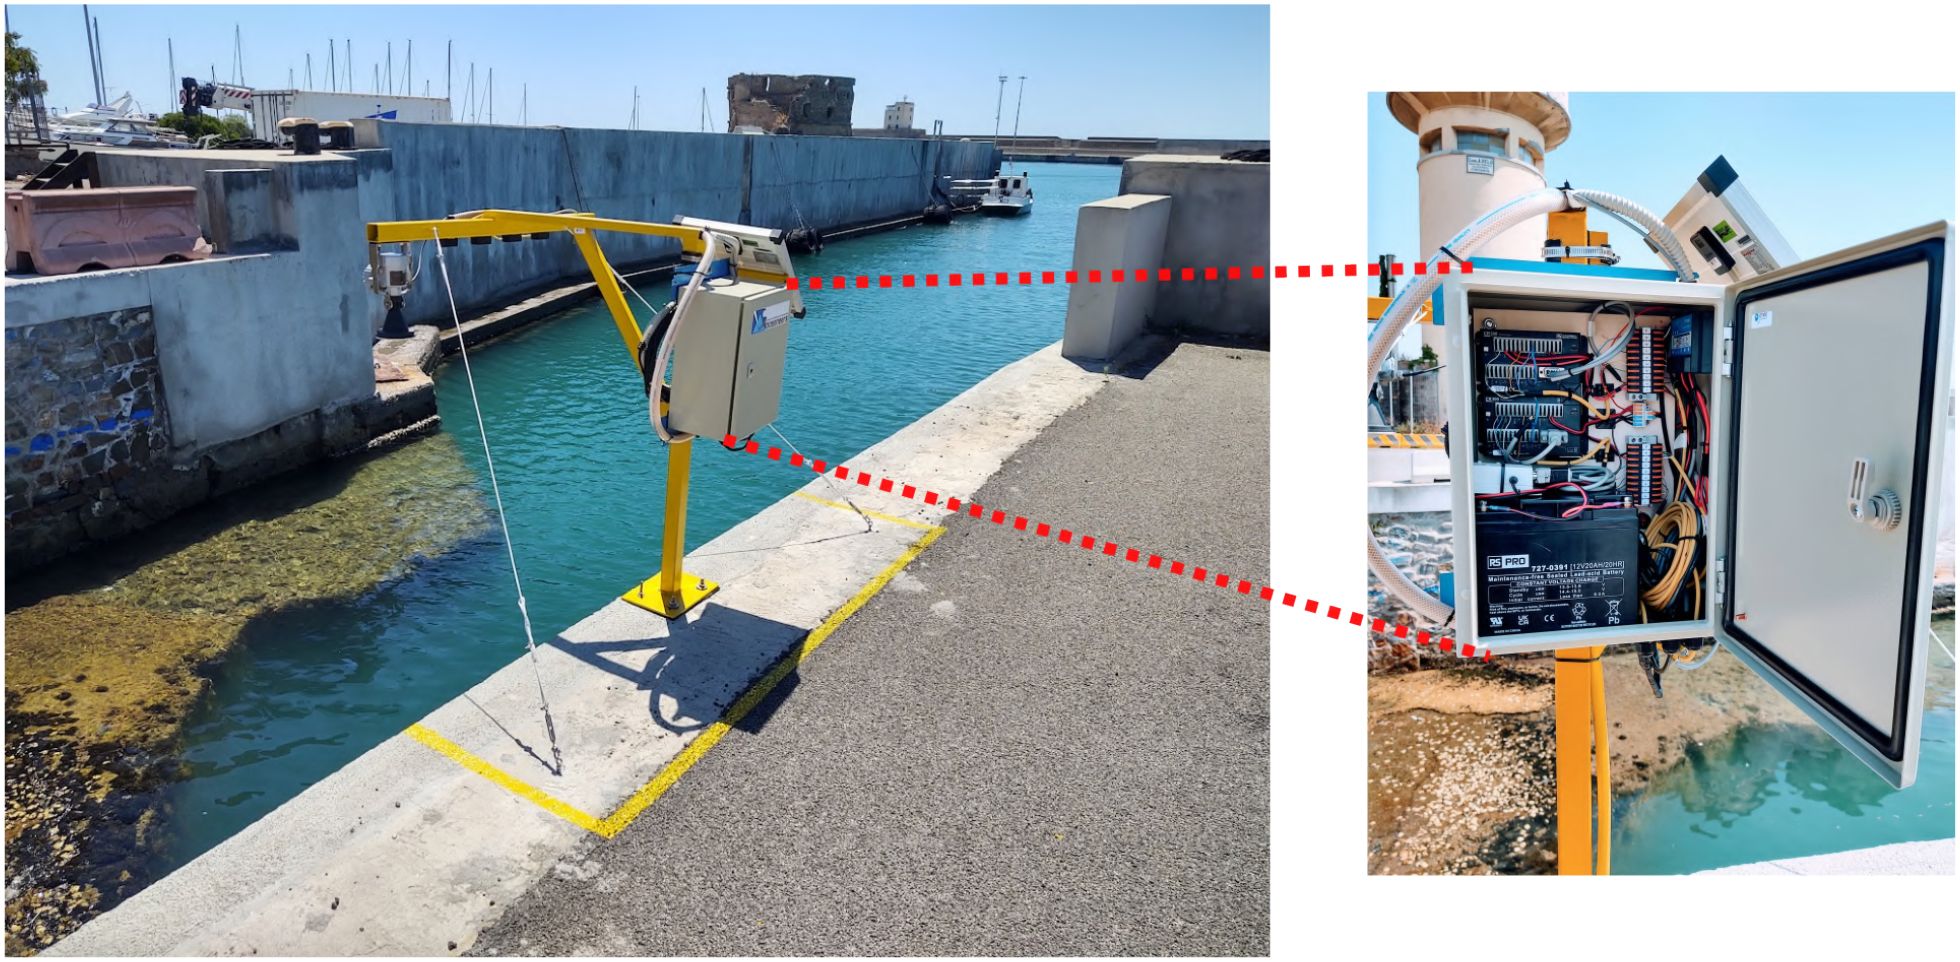
Figure 9. Data acquisition system and sensors installed in the pilot site.
A differential leveling survey was conducted between the tide gauge station at the pilot site and a benchmark approximately 300 meters away [42°05’46.378”N, 11°47’17.272”E], which is owned and managed by the Port Authority of Civitavecchia, Italy. This survey precisely established the elevation (quota) of the ultrasonic sensors relative to mean sea level, resulting in a measurement of 3.876 meters. This accurate measurement allows for direct comparison with the data from the ISPRA tide gauge.
6 InterBox: air-sea interface observing system in a box
Following the evaluation of the performance and reliability of the aforementioned low-cost ultrasonic water level sensors (see Section 7: Results), the air-sea interface observation system, referred to as InterBox (Figure 10), was designed to incorporate these sensors. This easy to install, low-cost system, whose production cost ranges from €300 to €500, depending on the selected data transmission method, includes, among other features, a datalogger, a solar power supply, and various sensors for monitoring environmental variables with high accuracy and minimal power consumption.
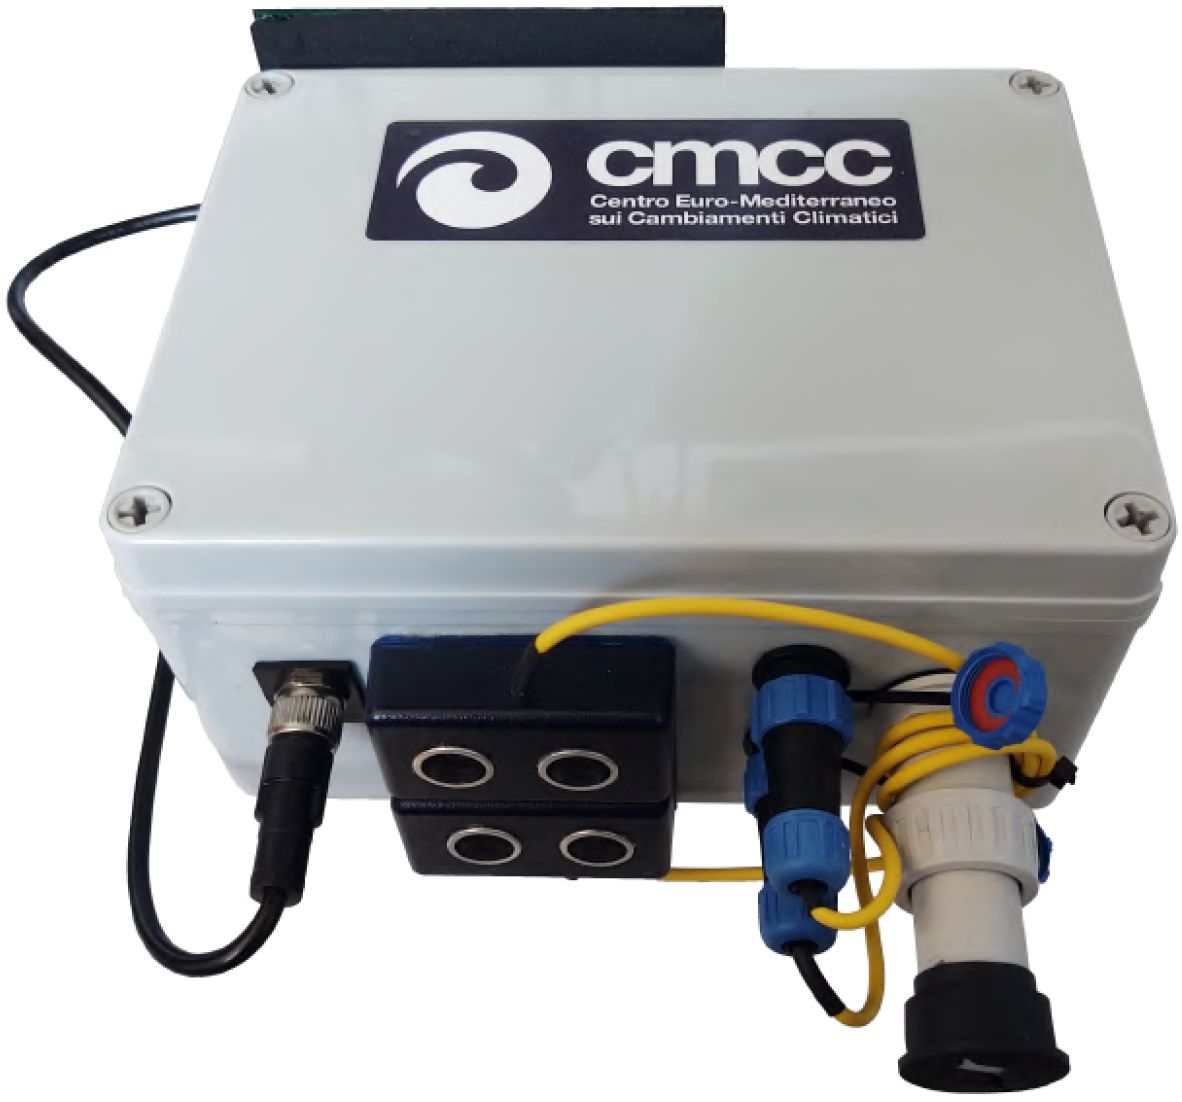
Figure 10. InterBox air-sea interface observing system in a box.
6.1 Datalogger
It consists of a main data acquisition and pre-processing board, along with several expansion boards for data storage and transmission. It also incorporates a solar-powered electrification system and various sensors to record data such as water level, barometric pressure, air temperature and relative humidity.
6.1.1 Data acquisition board
It is based on the STM32L microcontroller, which runs programs developed using the Arduino programming language. These programs manage the acquisition, storage, and transmission of data from various sensors. Additionally, the system provides communication ports for both analog and digital sensor interfaces (I2C, RS232, SPI, OneWire, etc.), a real-time clock (RTC), as well as integrated SPI memory and an external microSD card for data storage.
6.1.2 Expansion boards
The boards are interchangeable and equipped with devices for remote data transmission, allowing the selection of the most suitable transmission method based on the installation site. Options include Long Range (LoRa) radio frequency modulation technology, which enables wireless communication over long distances (≈ 10–10 km in ideal conditions) with low energy consumption, and GlobalStar satellite technology for locations where satellite transmission is the only viable option. Additionally, data transmission via Wi-Fi or cellular networks is possible where available. The boards also include an ultra-low-power GNSS receiver, useful for determining the exact geographic location of the installation site and synchronizing data within the tide gauge network, as well as expansion ports for sensor interfacing.
6.1.3 Solar power system
To power the device, a solar-powered electrification system was designed. It includes two 3.7 V, 5 Ah lithium-ion (Li-Ion) batteries, a 6 V, 3.5 W solar panel, and an MPPT charge controller to regulate charging and protect the connected devices. This system ensures an autonomy of approximately 3 days in the event of solar panel failure, and up to 6 days under prolonged cloudy conditions.
6.2 Meteorological sensors
A low-cost PTH probe was included to accurately measure barometric pressure, air temperature, and relative humidity at the ocean–atmosphere interface. These measurements provide essential insights for understanding and forecasting storm dynamics, improving early warning systems, and evaluating the broader impacts of climate change on coastal regions. By monitoring these variables, we can more effectively predict, prepare for, and mitigate the effects of extreme weather events.
6.2.1 DS18B20 temperature sensor
The DS18B20 digital thermometer (Figure 11) provides 9-bit to 12-bit resolution for Celsius temperature measurements and communicates over a 1-Wire® bus that by definition requires only one data line (and ground) for communication with a microprocessor. Each sensor is factory calibrated and has a unique 64-bit serial code, which allows multiple devices to function on the same 1-Wire bus. The data obtained from this sensor is used to compensate ultrasonic water level measurements for temperature variations, since the speed of sound, and therefore the accuracy of these measurements, depends on temperature.
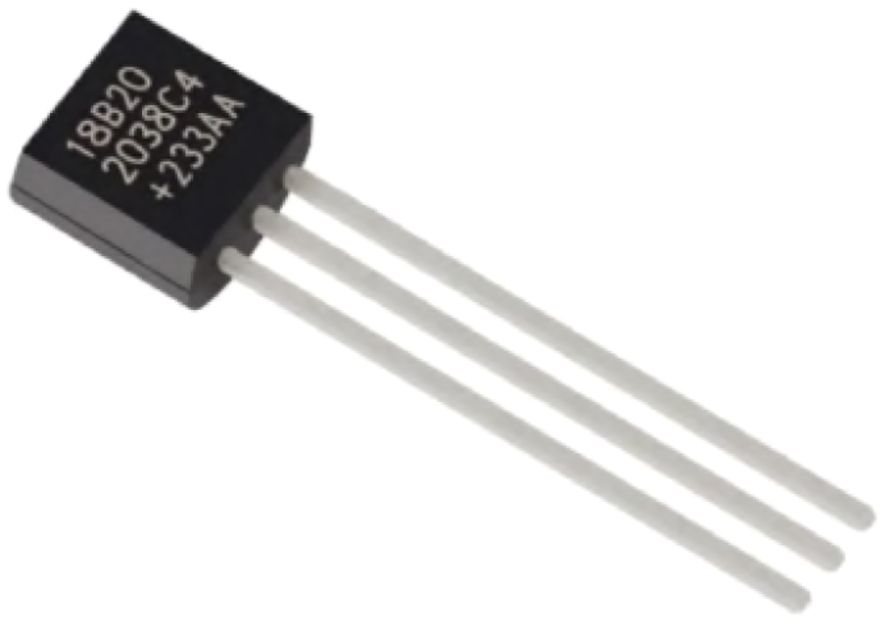
Figure 11. Dallas DS18B20 temperature sensor.
Table 7 presents some of the technical specifications of the DS18B20 temperature sensor.
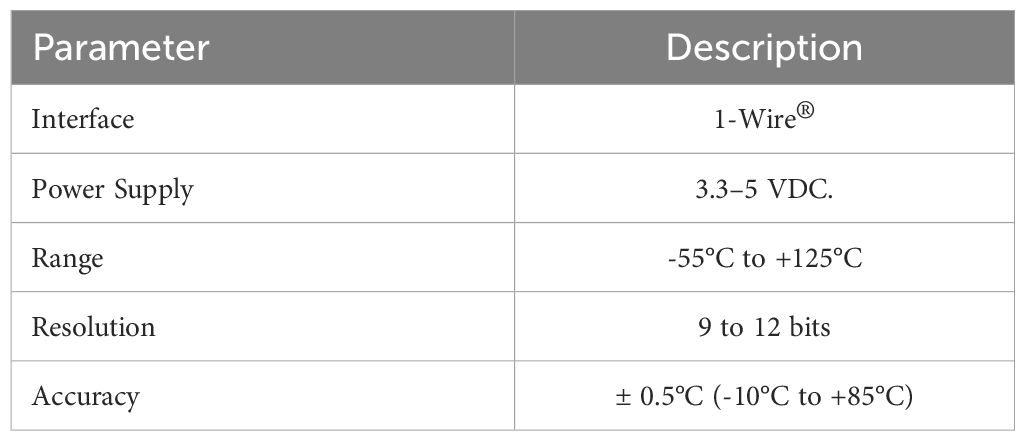
Table 7. DS18B20 temperature sensor technical specifications.
6.2.2 DHT20 relative humidity sensor
The DHT20 (Figure 12) is a digital sensor used to measure relative humidity and temperature. It features an improved MEMS capacitive humidity sensing element and a standard on-chip temperature sensor. All sensors are factory calibrated and are characterized by low power consumption, high precision and stability, fast response time, and strong resistance to electromagnetic interference.
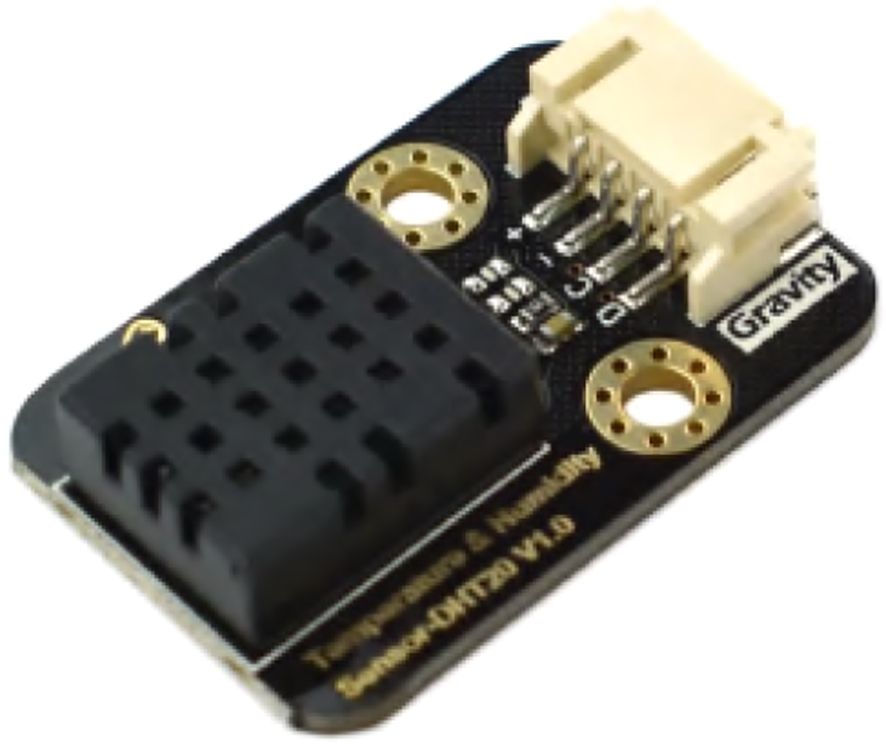
Figure 12. DHT20 relative humidity sensor.
Table 8 presents some of the technical specifications of the DHT20 Relative Humidity sensor.
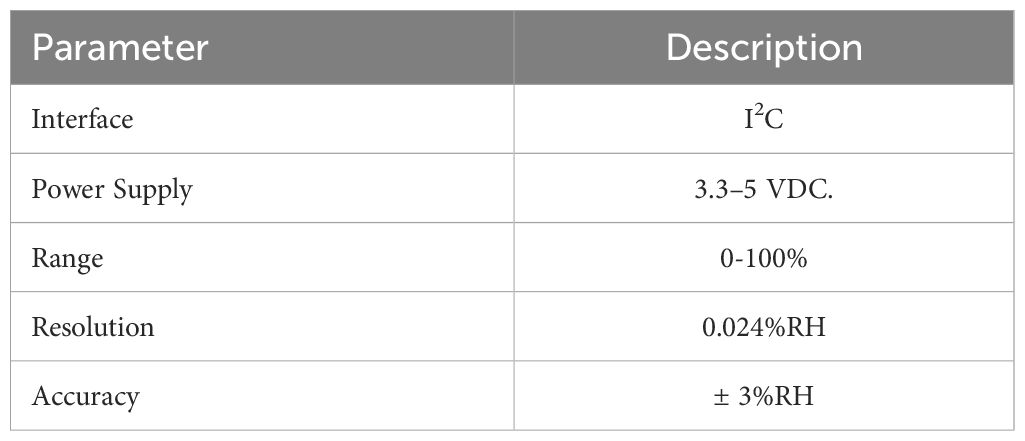
Table 8. DHT20 relative humidity sensor technical specifications.
6.2.3 MS5803-01BA barometric pressure sensor
The MS5803-01BA (Figure 13) is a new generation of high resolution altimeter sensors from TE Connectivity with SPI and I2C bus interface. The sensor module includes a high linearity pressure sensor and an ultra-low power 24-bit ΔΣ ADC with internal factory calibrated coefficients. It provides a precise digital 24 Bit pressure and temperature value and different operation modes that allow the user to optimize for conversion speed and current consumption.
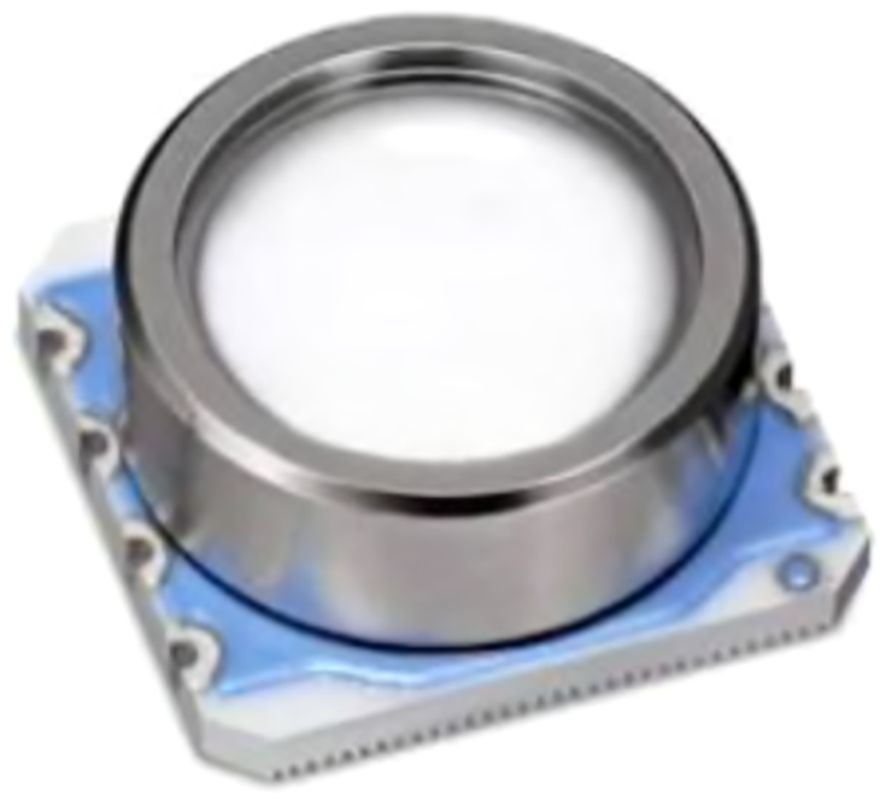
Figure 13. MS5803-01BA barometric pressure sensor.
Table 9 presents some of the technical specifications of the MS5803-01BA barometric pressure sensor.

Table 9. MS5803-01BA barometric pressure sensor technical specifications.
The accuracy and reliability of traditional tide gauges are widely recognized. However, their high costs of acquisition, installation, and maintenance prevent them from being deployed in areas with limited resources and from improving data granularity in areas that are already instrumented. The use of these systems is frequently restricted to a small number of key locations since they usually require specialized infrastructure, skilled personnel, and continuous operational support. On the other hand, the use of low-cost alternatives provides an affordable and scalable solution. The low cost, low maintenance, and ease of deployment features of the InterBox system make it an ideal solution for integration into citizen science projects or monitoring networks, enhancing data granularity to better assess climate change impacts on coastal zones.
7 Results and discussions
Sea level data were recorded at the pilot site from September to December 2023 to test the performance and response of two low-cost ultrasonic sensors, although data recording continues as of this writing.
Figures 14 and 15 show the Pearson’s correlation coefficients, with a 99% confidence interval, between the data acquired from Ultrasonic Sensor 1 (US1) and Ultrasonic Sensor 2 (US2), respectively, and the Radar reference sensor over the specified period.
![Scatter plot depicting Pearson correlation between Ultrasonic Sensor 1 and Radar Sensor readings. Points cluster along a red trend line showing a strong positive correlation. Correlation coefficient is 0.9918, with a 99 percent confidence interval of [0.9914, 0.9921].](https://www.frontiersin.org/files/Articles/1604069/fmars-12-1604069-HTML/image_m/fmars-12-1604069-g014.jpg)
Figure 14. Correlation between the US1 and the Radar reference sensor.
![Scatter plot showing the correlation between Ultrasonic Sensor 2 readings and Radar Sensor readings. Blue data points form a linear pattern, with a red trend line indicating high positive correlation. The correlation coefficient is 0.9930 with a 99% confidence interval of [0.9927, 0.9933].](https://www.frontiersin.org/files/Articles/1604069/fmars-12-1604069-HTML/image_m/fmars-12-1604069-g015.jpg)
Figure 15. Correlation between the US2 and the Radar reference sensor.
A Pearson correlation coefficient of 0.9918 and 0.9930, respectively, indicates a very strong positive linear relationship between the two data series, suggesting that the trends and responses of the sensors are well-aligned.
To validate sensor data, a comparison was made between the data obtained from the sensors at the pilot site and the data from the tide gauge station operated by the Istituto Superiore per la Protezione e la Ricerca Ambientale (ISPRA).
Figure 16 presents a four-month comparison between the data series of the Ultrasonic Sensor 1 (US1) and the ISPRA tide gauge reference. All data gaps occurred due to power interruptions, such as battery discharges or power outages at the receiving station, as well as interruptions in data transmission.
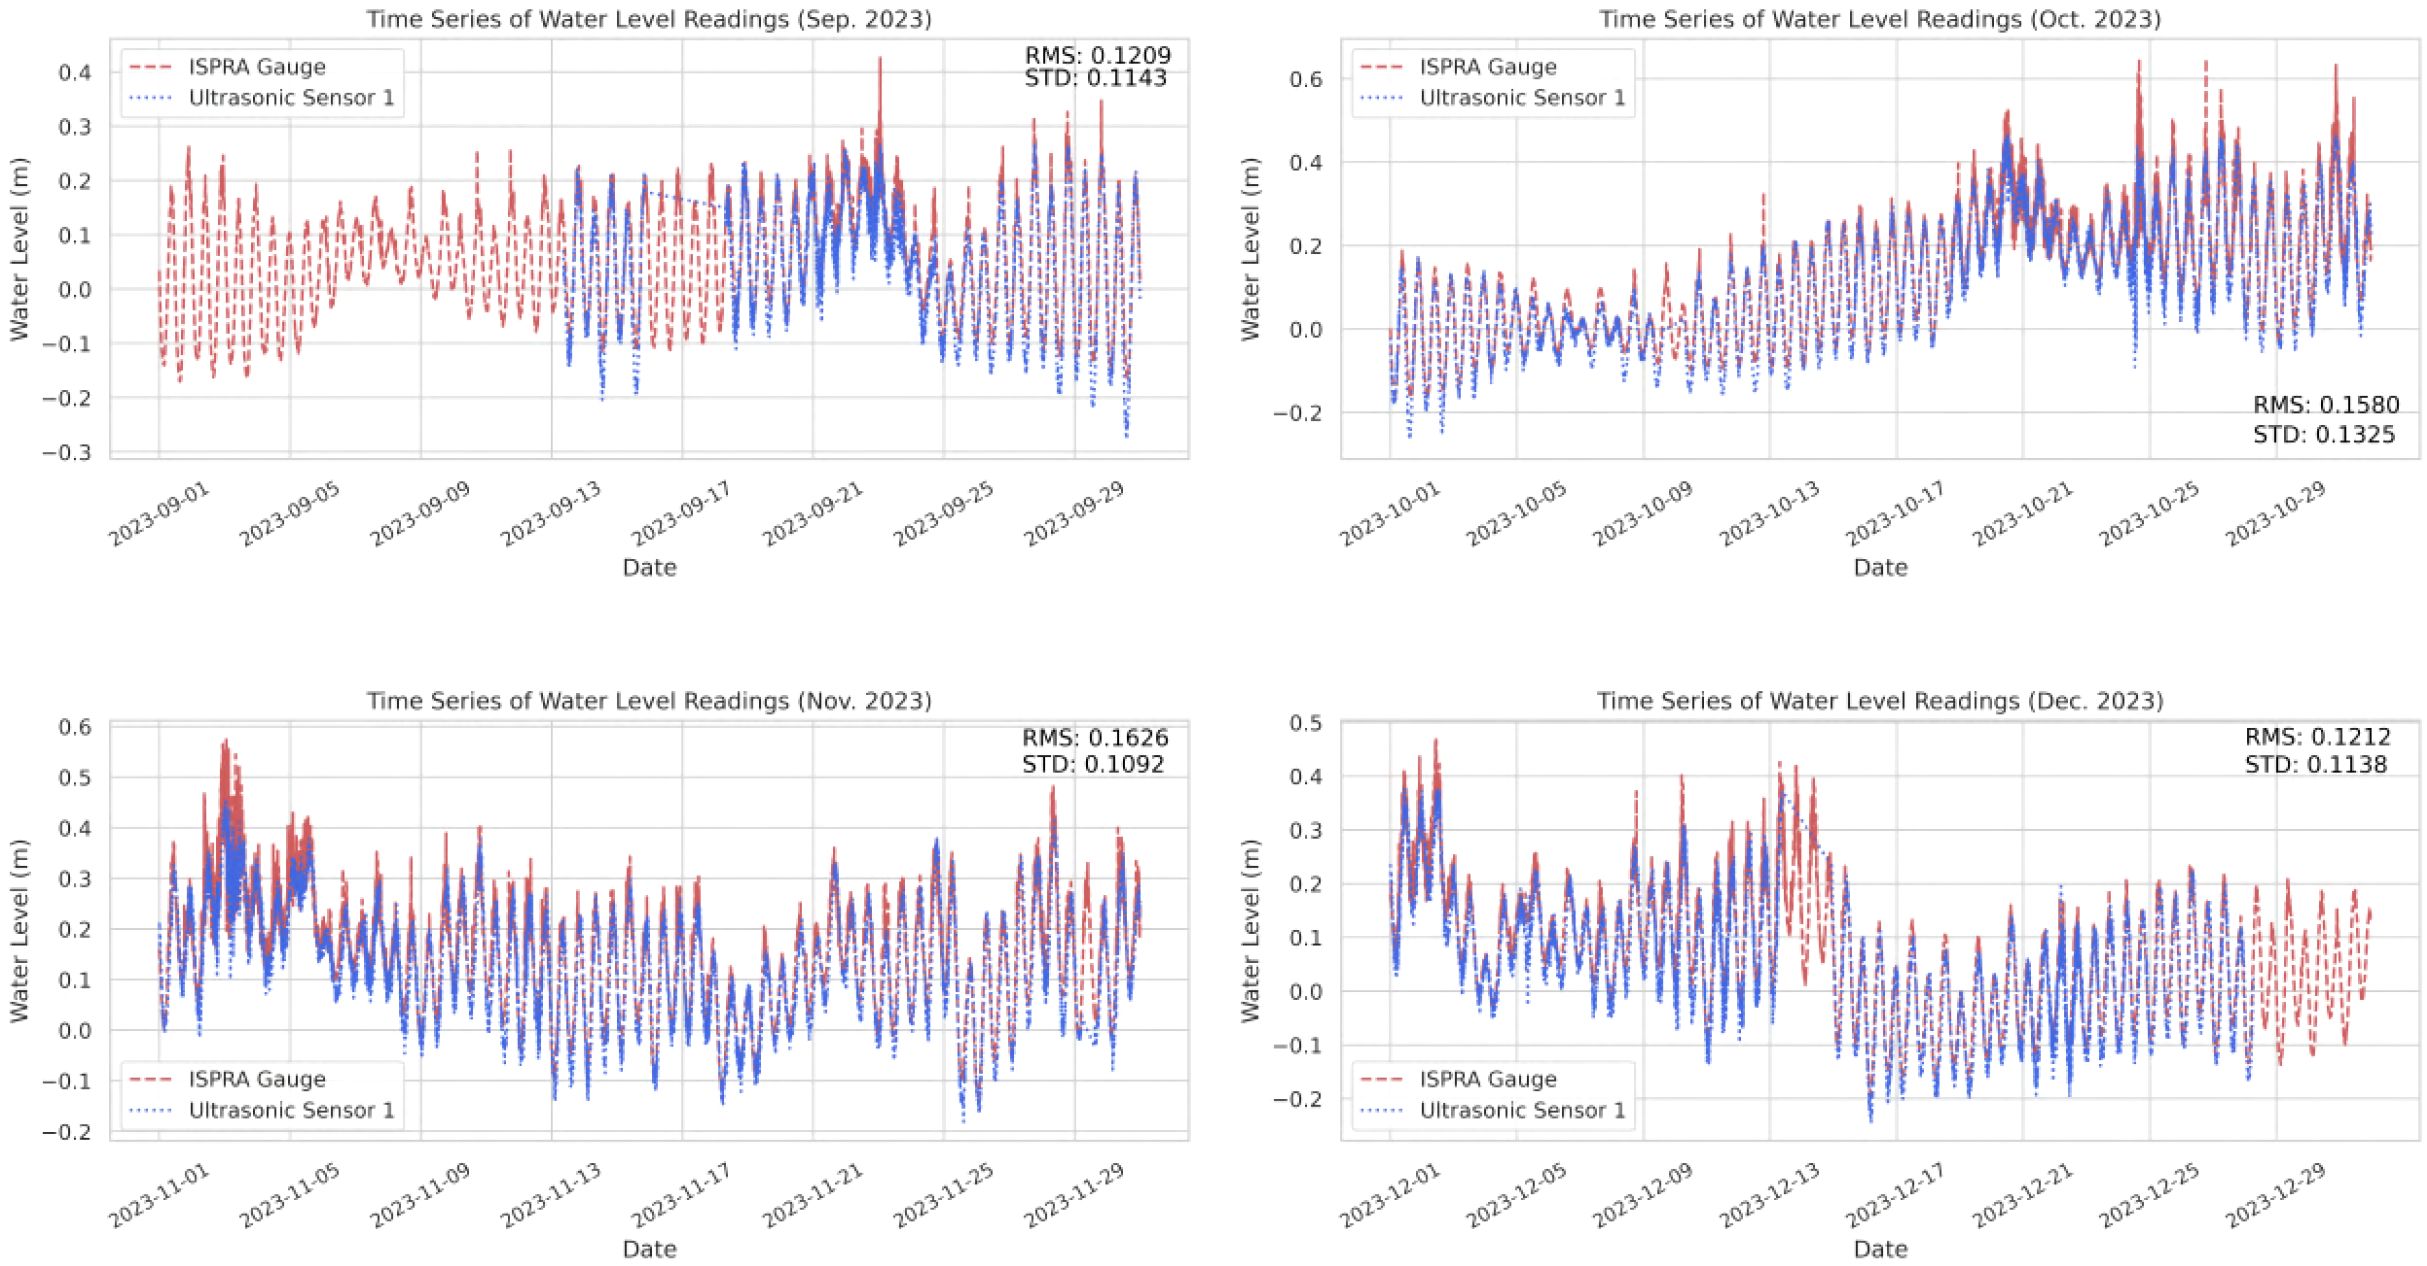
Figure 16. Monthly plots of the US1 data series from September to December 2023.
The statistical analysis over the entire period yields a mean difference (BIAS) of -0.02208, indicating that, on average, the sensor readings are slightly lower than the ISPRA readings by approximately 0.022 m (22 mm). A Root Mean Square Error (RMSE) value of 0.04567 suggests that the sensor readings typically deviate from the reference readings by about 0.045 m (45 mm). Additionally, a Mean Absolute Error (MAE) of 0.03515 indicates that, on average, the sensor readings differ from the reference readings by approximately 0.035 m (35 mm).
Figure 17 presents a four-month comparison between the data series of Ultrasonic Sensor 2 (US2) and the ISPRA tide gauge reference. All data gaps occurred due to power interruptions, such as battery discharges or power outages at the receiving station, as well as interruptions in data transmission.
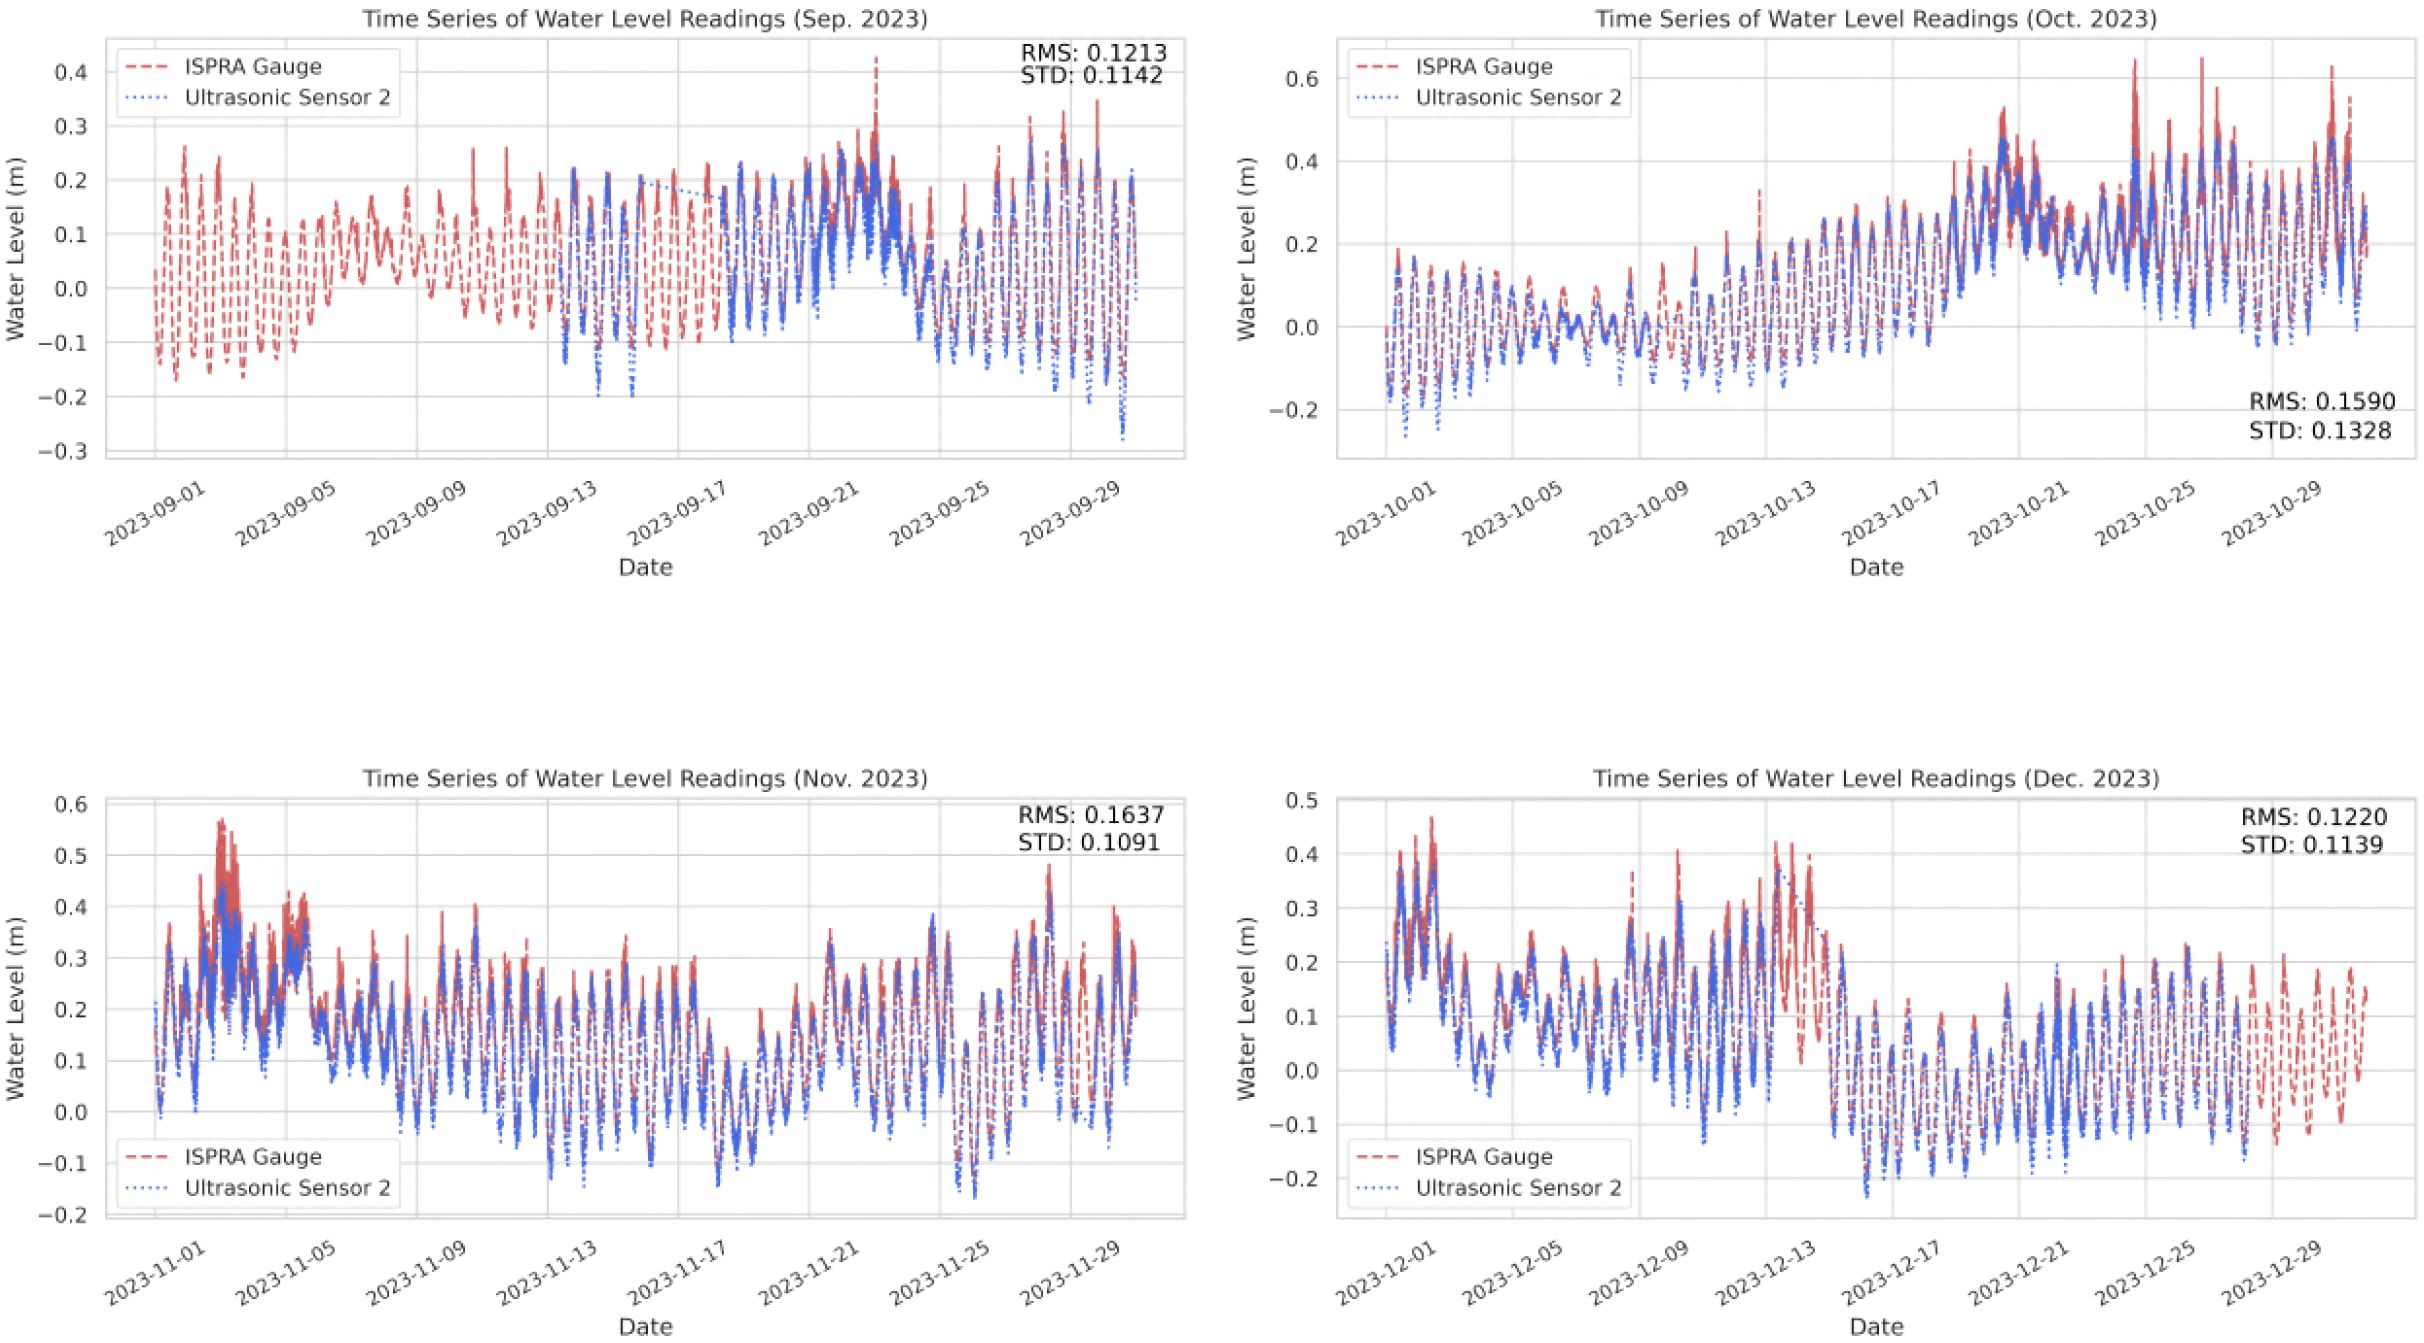
Figure 17. Monthly plots of the US2 data series from September to December 2023.
The statistical analysis over the entire period yields a mean difference (BIAS) of -0.02048, indicating that, on average, the sensor readings are slightly lower than the ISPRA readings by approximately 0.020 m (20 mm). A Root Mean Square Error (RMSE) value of 0.04460, suggests that the sensor readings typically deviate from the reference readings by about 0.044 m (44 mm). Furthermore, the mean absolute error (MAE) of 0.03448 indicates that, on average, the sensor readings differ from the reference readings by approximately 0.034 m (34 mm).
From the statistical analysis carried out between the two ultrasonic sensors (US1 and US2) and the ISPRA tide gauge station, slight differences in the centimeter range were identified. We believe that these discrepancies may be primarily due to two factors:
● Calibration differences or systematic drifts in the ultrasonic sensor.
● Differences between the measurement environments.
Our tide gauge, which integrates ultrasonic sensors, is installed in an open basin, where it is directly exposed to wind, waves, and temperature fluctuations. In contrast, the ISPRA tide gauge is located within a stilling well, which naturally dampens short term surface disturbances such as ripples and swells. These contrasting configurations and techniques likely contribute to systematic and random drifts. For example, wind and waves can introduce noise into the open basin sensor while small calibration discrepancies or the inherent characteristics of the sensor may also play a role.
Despite these differences, we consider the results to be robust enough to support the use of this technology in future sea and river level monitoring initiatives. The observed accuracy is adequate for a variety of applications, including the deployment of local monitoring networks and the implementation of early warning systems. Furthermore, thanks to its compact size and easy installation, the system can be easily deployed on platforms of opportunity, such as piers, bridges, or any structure offering a clear view of the water surface by simply mounting the sensor on a horizontal pipe (See Figure 18). This flexibility significantly reduces deployment barriers and facilitates the cost-effective expansion of observation networks.
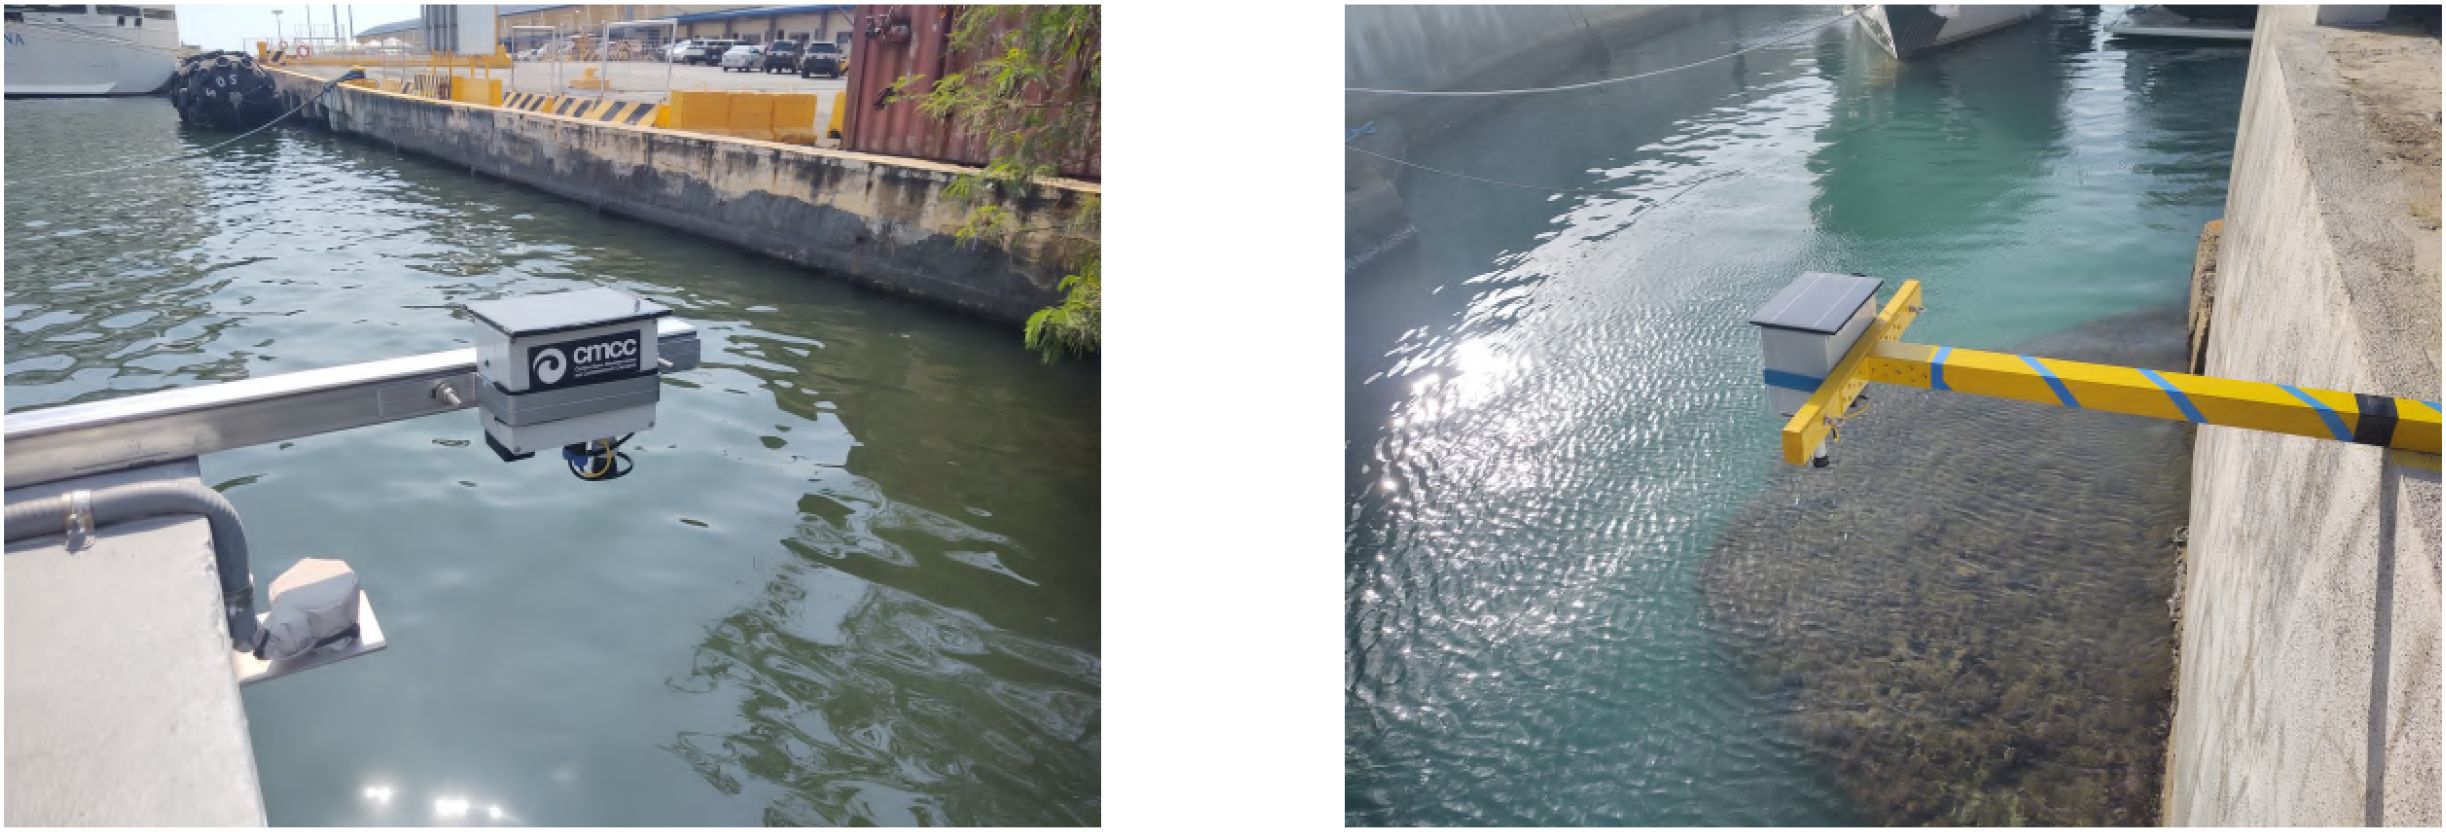
Figure 18. InterBox installed in Manila, Philippines (on the left) and Civitavecchia, Italy (on the right).
After the testing phase, the InterBox system was deployed at various sites in both Italy and the Philippines (See Figure 18) to evaluate its performance under different environmental conditions and to test various data transmission options.
These deployments were made possible with the support of the DCC-CR (Ocean Decade Collaborative Centre for Coastal Resilience; e.g (Pasqualetto et al., 2024)]. Additionally, the installations were integrated into training activities aimed at demonstrating the feasibility of large-scale sensor deployment by non-experts, involving students and local communities in the process. This participatory aligns with the core mission of the InterBox system: to make environmental monitoring more accessible, scalable, and community-driven.
Figure 19 shows a time series of barometric pressure, air temperature and humidity recorded between February 24 and March 10, 2025, in Rimini, Italy, where the InterBox system was installed and tested. The collected data are transmitted in quasi-real-time to the European Marine Observation and Data Network (EMODnet) and are freely available for download at (EMODnet Physics - Marine Data Portal).
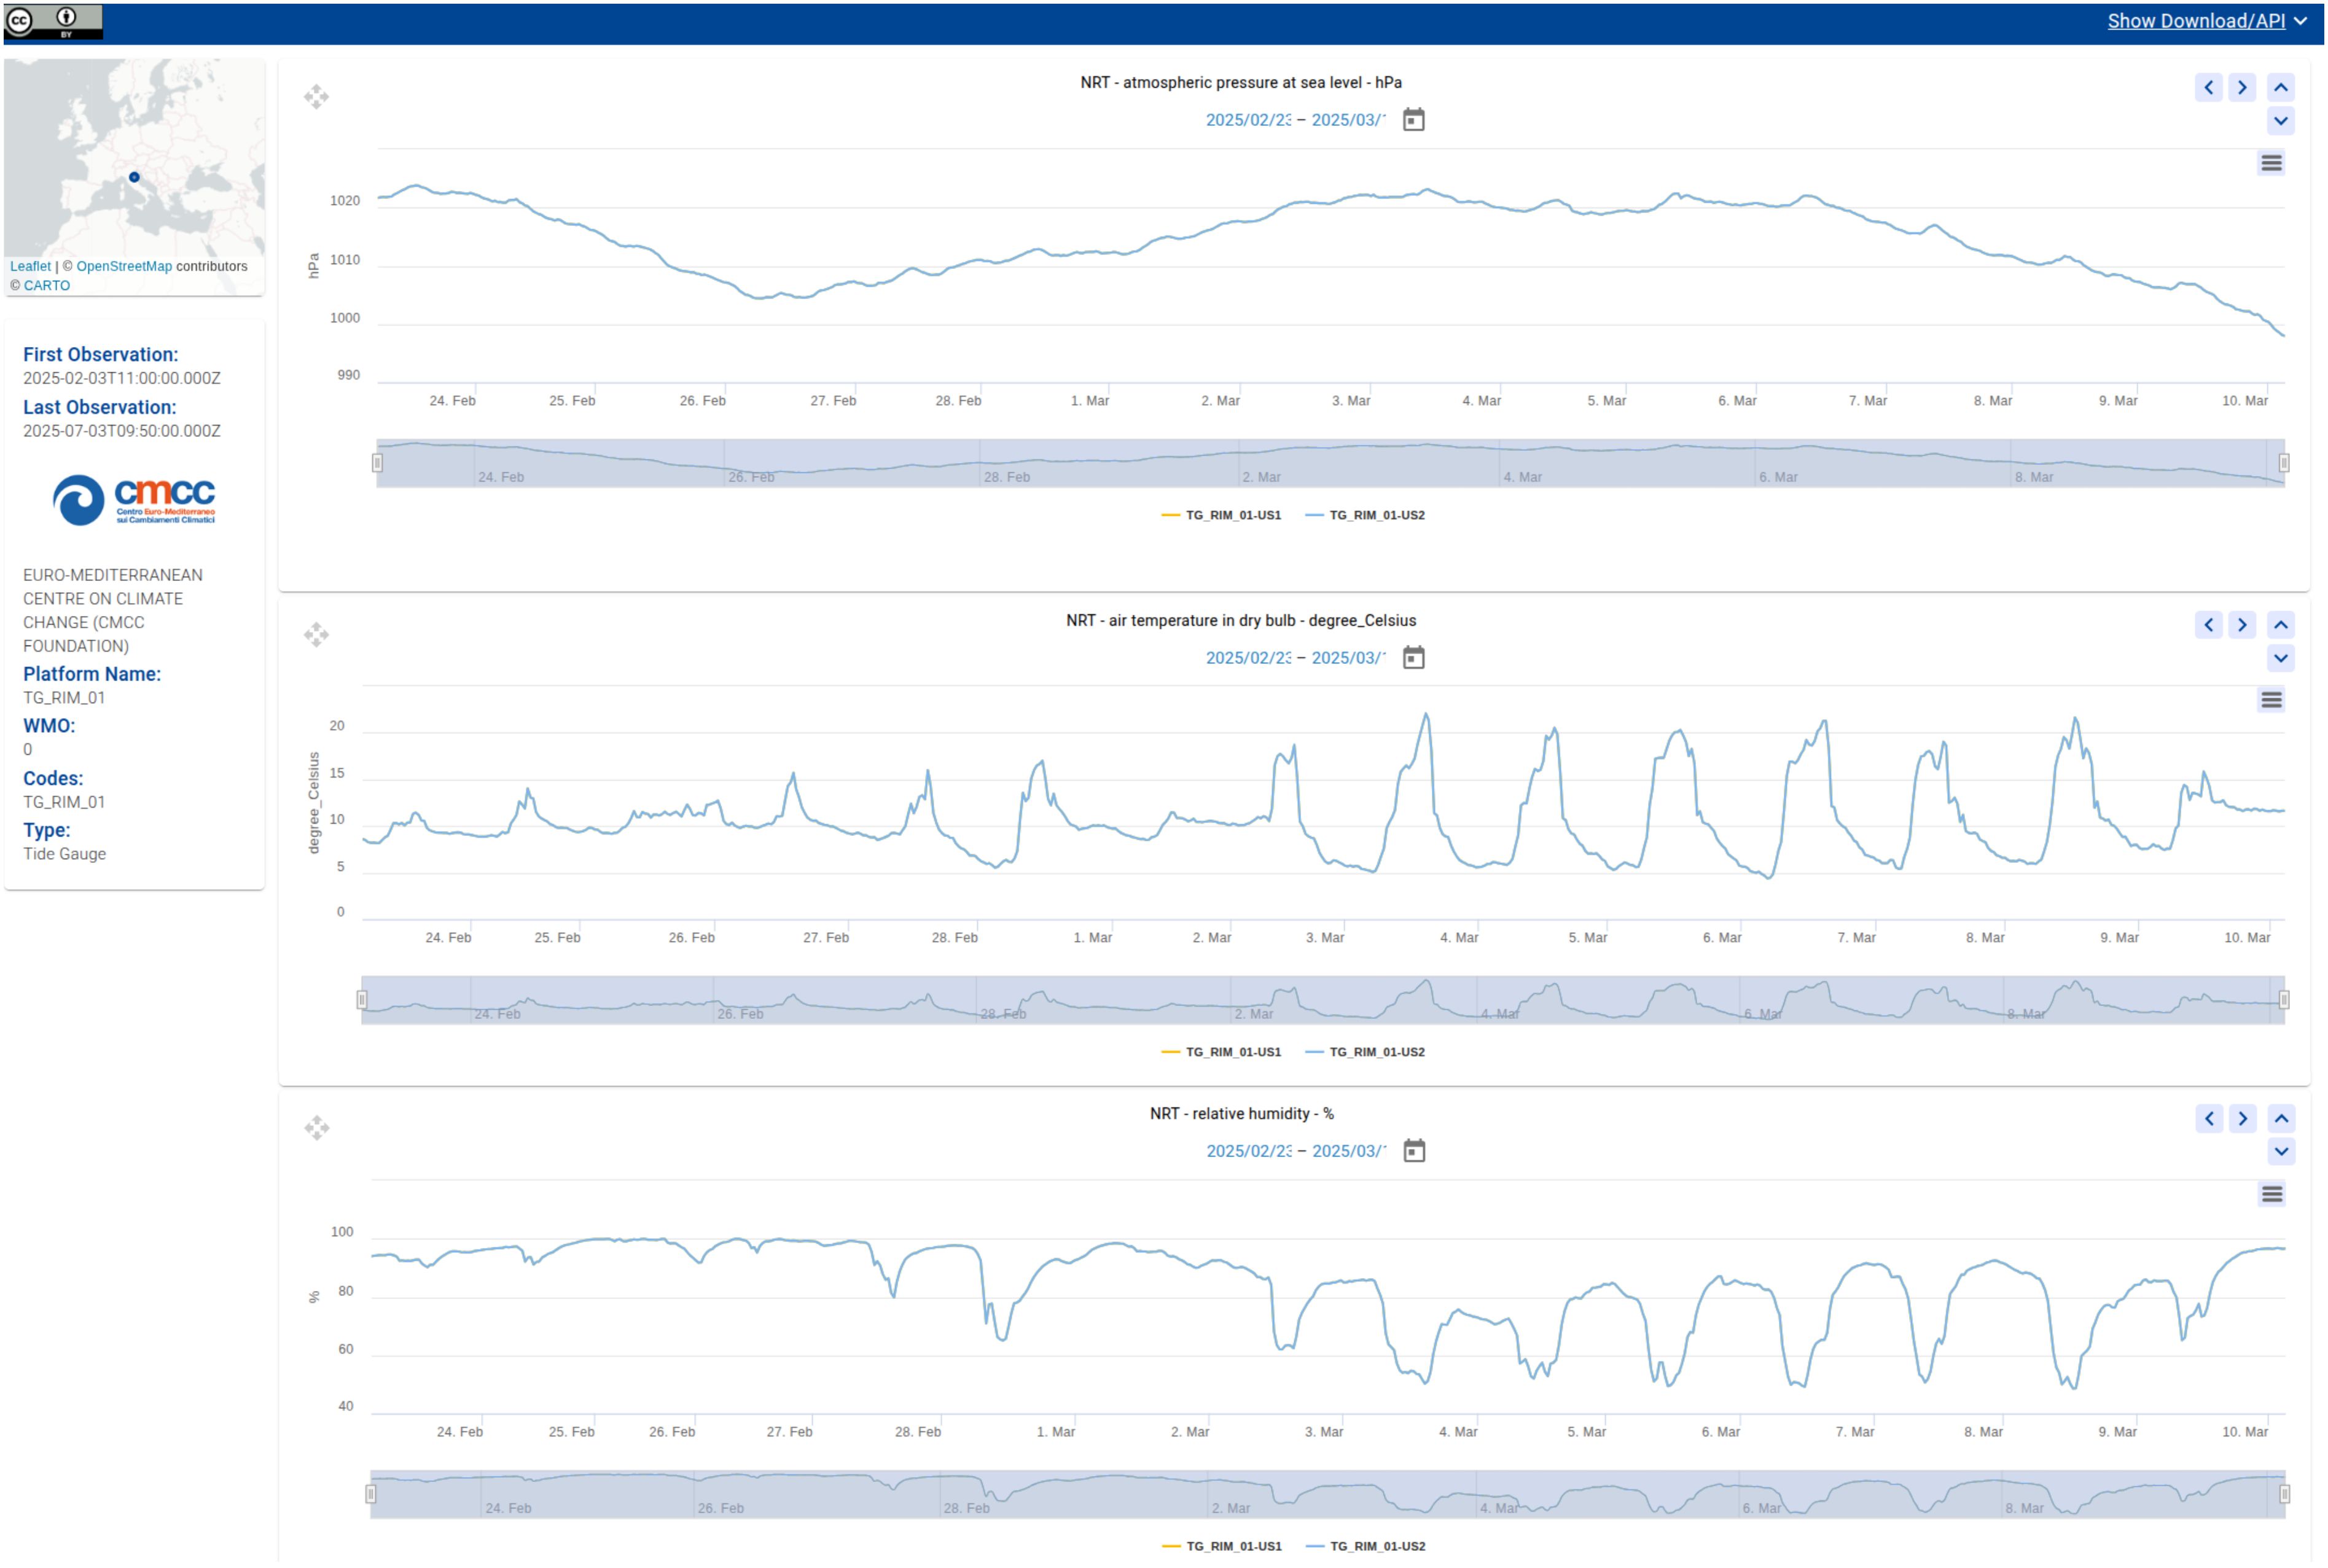
Figure 19. Time series of barometric pressure (top), air temperature (middle), and relative humidity (bottom) recorded in Rimini, Italy, from February 24 to March 10, 2025.
These data are available alongside data from the InterBox systems installed in Manila, Philippines, and Civitavecchia, Italy (Data from the latter location are shown in Figure 20. This ensures enhanced data availability, benefiting not only local communities but also a broader, global audience.
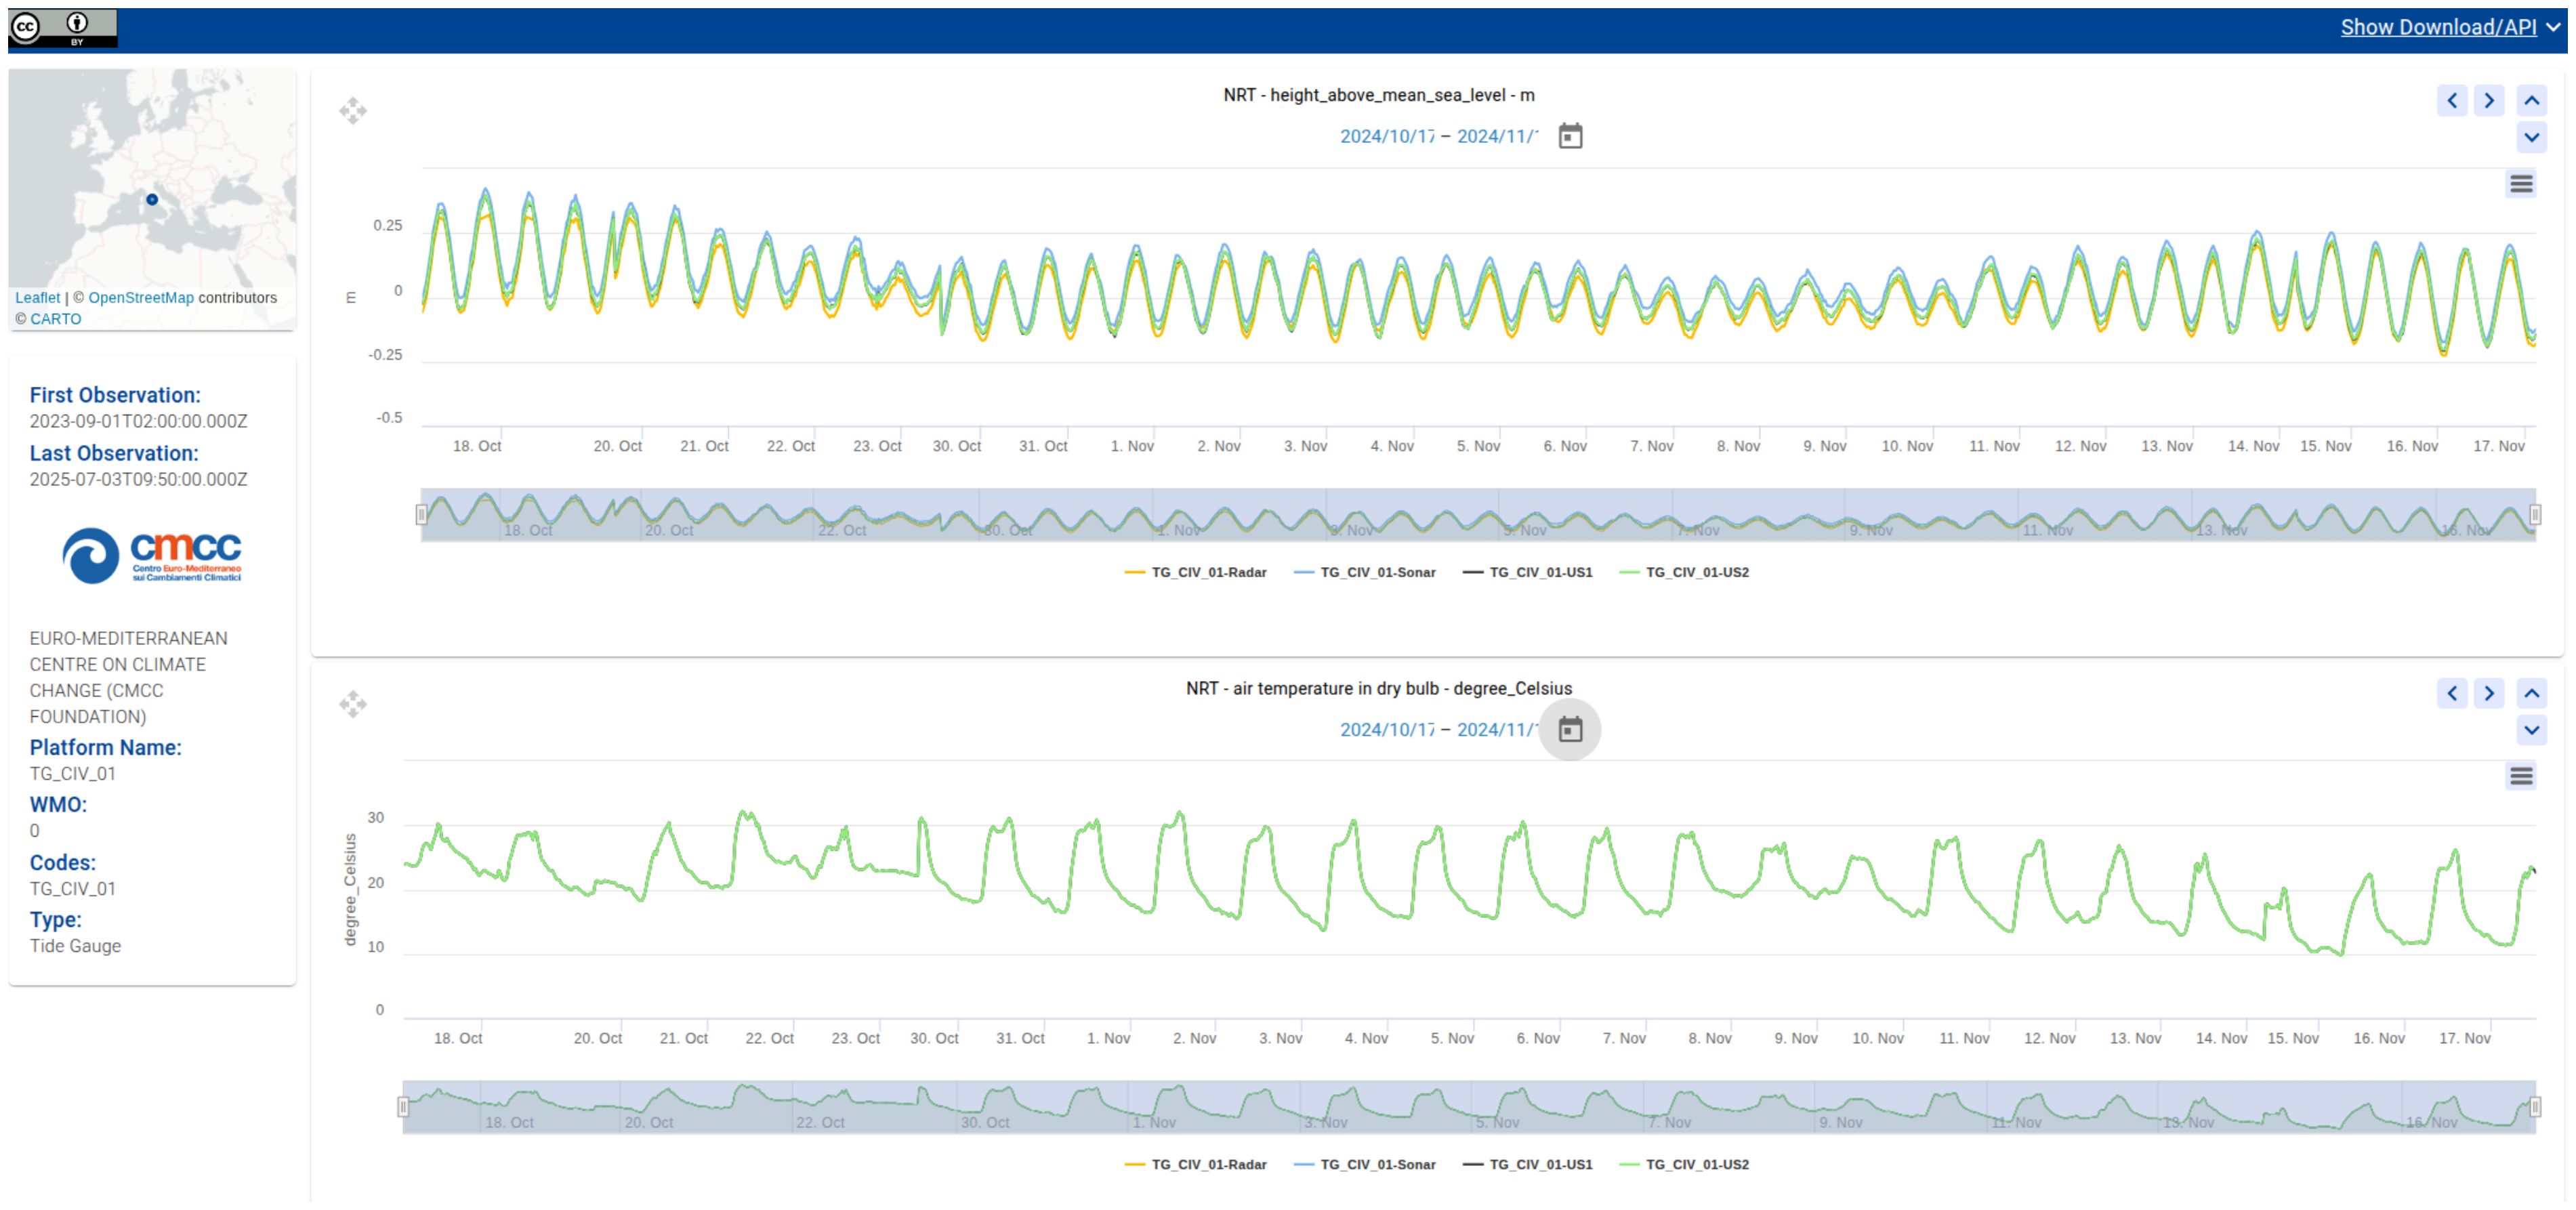
Figure 20. One-month time series of sea level data displayed on EMODnet Physics and recorded at Civitavecchia, Italy.
To ensure the reliability of the data, it is strongly recommended to perform a quality control (QC) process before uploading data to the EMODnet platform. The following basic steps are suggested as part of this QC procedure.
● Range check: Considered as outliers the values falling outside predefined physical or expected limits for each variable.
● Statistical deviation: Identify as anomalous the values that deviate more than 2 standard deviations from the mean.
● Spike detection: Sudden changes between consecutive measurements that exceed a defined threshold should be considered erroneous.
● Missing data: Identify NaN or missing values and flag them as anomalous.
It is also important to establish consistent calibration practices to ensure proper intercalibration of the instruments used by different participants. For water level measurements, a recommended first step is to periodically perform differential leveling, where feasible, between sensors and a reference point (benchmark) with known elevation, in order to detect and correct for vertical offsets. This method was applied at our pilot site (see Section 5: Pilot Site). Also, deploying reference benchmarks at each site and comparing data during overlapping deployment periods can help identify systematic biases. For atmospheric variables, cross-comparison of PTH measurements during overlapping deployments and regular calibration against high-precision reference sensors or traceable standards can help identify biases and drifts, ensuring improved data reliability. In addition, defining installation procedures, maintaining detailed metadata and applying uniform quality control routines between sites are key practices to ensure data consistency and comparability within the network.
8 Conclusions and future work
A highly affordable, low-cost ultrasonic sensor has been tested and implemented for precise water level measurements. The sensor is significantly more affordable compared to other commercial sensors commonly used for sea level measurements, and its technical specifications are broadly comparable (see Table 4). The results indicate that while there is a small systematic bias and some variability, the sensor provides measurements that are reasonably close to the reference. Additionally, the trend and performance of the ultrasonic sensors presented in this work are well-suited for integration into a low-cost sensor network, aimed to enhance data granularity while maintaining accuracy and precision. However, calibration across a broader range of water levels is recommended to achieve a more accurate response from the ultrasonic sensors within their operating limits.
An air-sea interface observation system was also designed and implemented, utilizing the ultrasonic sensors for water level measurements evaluated in this work, along with meteorological sensors to monitor key variables such as barometric pressure, air temperature, and relative humidity. This system will be integrated into prototypes of a Digital Twin of the Coastal Ocean, aiming to facilitate the development of customized applications, multi-hazard early warning systems, and robust decision-making tools and strategies, tailored to address future climate extremes.
In the context of citizen science, the use of these air–sea interface observation systems based on low-cost ultrasonic sensors is highly beneficial due to their accessibility and ease of implementation. On going projects will deploy tens of sensors in Italy and in the Global South, installation will involve Marine Protected Areas (MPA) managers, port authorities, schools students, and local authorities. The use of these sensors enables local communities to actively participate in monitoring water levels and environmental variables, generating valuable data to investigate phenomena such as flooding and seasonal variations. Moreover, their low cost facilitates the expansion of monitoring networks, promoting greater collaboration and raising awareness of sustainable water resource management.
The extension of the marine observation network with low-cost and low-maintenance systems will help to improve our understanding of extreme climatic events and address future mitigation and adaptation strategies to reduce the impact of storm surges on coastal communities and ecosystems.
Data availability statement
The datasets presented in this study can be found in online repositories. The names of the repository/repositories and accession number(s) can be found below: https://map.emodnet-physics.eu/platformpage/?platformcode=TG_CIV_01&source=cp&integrator=CMCC.
Author contributions
JM-O: Conceptualization, Investigation, Methodology, Resources, Software, Writing – review & editing. VP: Conceptualization, Project administration, Supervision, Writing – review & editing. GC: Conceptualization, Writing – review & editing. MM: Conceptualization, Funding acquisition, Investigation, Methodology, Resources, Writing – original draft.
Funding
The author(s) declare that financial support was received for the research and/or publication of this article. Funded by RENOVATE, Interreg Italy-Croatia AdriaClimPlus, Life Climax Po and The CoastPredict Program.
Acknowledgments
The authors acknowledge the Port Authority of Civitavecchia for their support and the availability for system installation, Antonio De Luca for the support in the installation and set-up of the pilot site and Benedetta Torelli for the support in the development of the water level sensors. We also thank the following projects in which CMCC is involved in sea level sensors installation: Life Climax Po, Interreg Italy-Croatia AdriaClimPlus and RENOVATE.
Conflict of interest
The authors declare that the research was conducted in the absence of any commercial or financial relationships that could be construed as a potential conflict of interest.
Generative AI statement
The author(s) declare that no Generative AI was used in the creation of this manuscript.
Publisher’s note
All claims expressed in this article are solely those of the authors and do not necessarily represent those of their affiliated organizations, or those of the publisher, the editors and the reviewers. Any product that may be evaluated in this article, or claim that may be made by its manufacturer, is not guaranteed or endorsed by the publisher.
References
Alasdair E. J. (1995). “Impact of climatic change on coral reefs, mangroves, and tropical seagrass ecosystems,” in Climate Change: Impact on Coastal Habitation, 1st Edition, vol. 10. Chapter. (Boca Raton, FL: Lewis Publishers) doi: 10.1201/9781003069935-10
Bandeira S., Amone-Mabuto M., Chitar´a-Nhandimo S., Scarlet M. P., and Rafael J. (2021). “Impact of cyclones and floods on seagrass habitats,” in Cyclones in Southern Africa. Eds. Nhamo G. and Chikodzi D.Sustainable Development Goals Series (Springer, Cham.). doi: 10.1007/978-3-030-74303-1_18
Batica J. and Goubesville P. (2011). “Collaborative research on flood resilience in urban areas: the CORFU project. pp. 3914-3920,” in 34th World Congress of the International Association for Hydro-Environment Research and Engineering: 33rd Hydrology and Water Resources Symposium and 10th Conference on Hydraulics in Water Engineering. Balance and Uncertainty: Water in a Changing World, (Brisbane, Australia: International Association for Hydro-Environment Engineering and Research (IAHR))
Brierley A. S. and Kingsford M. J. (2009). Impacts of climate change on marine organisms and ecosystems. Curr. Biol. 19, R602–R614. doi: 10.1016/j.cub.2009.05.046
Core Writing Team (2023). “IPCC, 2023: summary for policymakers,” in Climate Change 2023: Synthesis Report. Contribution of Working Groups I, II and III to the Sixth Assessment Report of the Intergovernmental Panel on Climate Change. Eds. Lee H. and Romero J. (IPCC, Geneva, Switzerland), 1–34. doi: 10.59327/ipcc/ar69789291691647.001
Dixon O., Gammal J., Clark D., Ellis J. I., and Pilditch C. A. (2023). Estimating effects of sea level rise on benthic biodiversity and ecosystem functioning in a large meso-tidal coastal lagoon. Biology 12, 105. doi: 10.3390/biology12010105
Flowers G. J. L., Needham H. R., Bulmer R. H., Lohrer A. M., and Pilditch C. A. (2023). Going under: The implications of sea-level rise and reduced light availability on intertidal primary production. Limnology Oceanography 68, 1301–1315. doi: 10.1002/lno.12347
Ietto F., Pellicone G., and Cantasano N. (2023). Silting process and loss of posidonia oceanica meadows in the tyrrhenian waters of calabria (Southern Italy). Sustainability 15, 13102. doi: 10.3390/su151713102
Kabi J. N., Maina C. W., Mharakurwa E. T., and Mathenge S. W. (2023). Low cost, LoRa based river water level data acquisition system. HardwareX. doi: 10.1016/j.ohx.2023.e00414
Kristensen N. M., Røed L. P., and Sætra Ø. (2022). A forecasting and warning system of storm surge events along the Norwegian coast. Environ. Fluid Mechanics 23, 307–329. doi: 10.1007/s10652-022-09871-4
Liu Q., Liu T., He T., Li H., Yan Z., Zhang L., et al. (2021). High resolution and large sensing range liquid level measurement using phase-sensitive optic distributed sensor. Optics Express 29, 11538–11547. doi: 10.1364/OE.412935
Loftis J. D., Mitchell M., Schatt D., Forrest D. R., Wang H. V., Mayfield D., et al. (2019). Validating an operational flood forecast model using citizen science in Hampton Roads, VA, USA. J. Mar. Sci. Eng. 7, 242. doi: 10.3390/jmse7080242
Marcelli M., Piermattei V., Gerin R., Brunetti F., Pietrosemoli E., Addo S., et al. (2021). Toward the widespread application of low-cost technologies in coastal ocean observing (Internet of Things for the Ocean). Mediterr. Mar. Sci. 22, 255–269. doi: 10.12681/mms.25060
Pandeya B., Buytaert W., and Potter C. (2021). Designing citizen science for water and ecosystem services management in data-poor regions: Challenges and opportunities. Environ. Sustainability 3, 100059. doi: 10.1016/j.crsust.2021.100059
Park K., Federico I., Di Lorenzo E., Ezer T., Cobb K. M., Pinardi N., et al. (2022). The contribution of hurricane remote ocean forcing to storm surge along the Southeastern US coast. Coast. Eng. 173, 104098. doi: 10.1016/j.coastaleng.2022.104098
Pasqualetto S., Pinardi N., Kourafalou V. H., Salvo V. S., Monroe Z. J., and Behar D. H. (2024). A dialogue on coastal cities and coastal community resilience. doi: 10.5281/zenodo.10797013
Paul J. D. and Buytaert W. (2018). “Citizen science and low-cost sensors for integrated water resources management,” in Advances in chemical pollution, environmental management and protection, vol. 3. (Amsterdam, The Netherlands: Elsevier.), 1–33. doi: 10.1016/bs.apmp.2018.07.001
Pinardi N., Kumar T. S., Alvarez-Fanjul E., Ansong J. K., Burgos A., Cabana D., et al (2024). Ocean Decade Vision 2030 White Papers - Challenge 6: Increase Community Resilience to Ocean Hazards. Vol. 51The Ocean Decade Series (Paris: UNESCO-IOC). doi: 10.25607/smm1-nq79
Pollard J. A., Spencer T., and Brooks S. M. (2019). The interactive relationship between coastal erosion and flood risk. Prog. Phys. Geography: Earth Environ. 43, 574–585. doi: 10.1177/0309133318794498
Satta A., Puddu M., Venturini S., and Giupponi C. (2017). Assessment of coastal risks to climate change related impacts at the regional scale: The case of the Mediterranean region. Int. J. Disaster Risk Reduction 24, 284–296. doi: 10.1016/j.ijdrr.2017.06.018
Trégarot E., D’Olivo J. P., Botelho A. Z., Cabrito A., Cardoso G. O., Casal G., et al. (2024). Effects of climate change on marine coastal ecosystems – A review to guide research and management. Biol. Conserv. 289, 110394. doi: 10.1016/j.biocon.2023.110394
von Storch H. (2014). Storm surges: phenomena, forecasting and scenarios of change. Proc. IUTAM 10, 356–362. doi: 10.1016/j.piutam.2014.01.030
Vousdoukas M. I., Mentaschi L., Voukouvalas E., Verlaan M., Jevrejeva S., Jackson L. P., et al. (2018). Global probabilistic projections of extreme sea levels show intensification of coastal flood hazard. Nat. Commun. 9, 2360. doi: 10.1038/s41467-018-04692-w
World Meteorological Organization (2011). Guide to storm surge forecasting (Geneva, Switzerland: World Meteorological Organization), 120. WMO-No 1076. doi: 10.25607/OBP-1514
Keywords: coastal ocean of things, ultrasonic sensors, low-cost technologies, citizen science, sea level rise, storm surge, extreme events, early warning system
Citation: Martinez-Osuna JF, Piermattei V, Coppini G and Marcelli M (2025) Low-cost water level measurement technologies for assessing the impact of climate change and storm surges in coastal areas, suitable for citizen science initiatives. Front. Mar. Sci. 12:1604069. doi: 10.3389/fmars.2025.1604069
Received: 01 April 2025; Accepted: 18 June 2025;
Published: 15 July 2025.
Edited by:
Athanasios Thomas Vafeidis, University of Kiel, GermanyReviewed by:
John Rapaglia, University of Kiel, GermanyLuca Zaggia, National Research Council (CNR), Italy
Copyright © 2025 Martinez-Osuna, Piermattei, Coppini and Marcelli. This is an open-access article distributed under the terms of the Creative Commons Attribution License (CC BY). The use, distribution or reproduction in other forums is permitted, provided the original author(s) and the copyright owner(s) are credited and that the original publication in this journal is cited, in accordance with accepted academic practice. No use, distribution or reproduction is permitted which does not comply with these terms.
*Correspondence: Juan Francisco Martinez-Osuna, anVhbi5tYXJ0aW5lekBjbWNjLml0