Abstract
Animal morphometrics are essential for understanding a species’ life history and its ecological interactions with the environment. This study investigates the maturity status and body condition of humpback whales (Megaptera novaeangliae) across understudied areas of the Northeastern Atlantic Ocean. Uncrewed Aerial Systems (UAS or drones) were used to collect photogrammetry data from humpback whales in Ireland, Norway, and Cabo Verde between 2022 and 2024. Body length and condition metrics were derived from aerial imagery and analyzed using Bayesian modeling to estimate and propagate measurement uncertainty. The resulting measurements were evaluated to infer maturity status, migratory patterns, and habitat use. Photogrammetric measurements indicated potential variability in whale body length and condition across study areas, with individuals in Cabo Verde appearing larger and in better condition. In Irish waters, body length was positively correlated with offshore habitat preference, while shorter (younger) individuals tended to inhabit nearshore waters, potentially increasing their exposure to anthropogenic pressures. Additionally, body condition improved intra-seasonally at both the population and individual levels in Irish waters. These findings demonstrate the utility of UAS photogrammetry for assessing the maturity and body condition of humpback whales across diverse habitats. The observed geographical and temporal trends in condition provide valuable insights into habitat use and underscore the importance of Ireland as a feeding ground in the Northeastern Atlantic. This study also highlights the value of UAS photogrammetry in advancing our understanding of baleen whale population ecology in understudied regions, providing relevant information for species conservation and management.
1 Introduction
Understanding morphological traits is essential for conservation strategies, physiological research, and assessments of animal health. Morphometrics, the quantitative analysis of an animal’s size and shape, provides valuable insights into species’ life histories and ecological relationships such as habitat use, resource competition, and prey availability, at both individual and population levels. Large baleen whales (Mysticeti) are classic examples of capital breeders, accumulating substantial energy reserves, primarily stored as adipose tissue (blubber), during periods of intense foraging. These reserves are relied upon during migration and reproduction, when foraging opportunities are limited or absent (Wilson and Mittermeier, 2014). Consequently, individuals experience pronounced fluctuations in body condition, the relative size of an animal’s energy reserves, and face elevated nutritional demands to meet the energetic costs of reproduction and long-distance migration (Bernier-Graveline et al., 2025; van Aswegen et al., 2024). Body condition provides valuable insights into individual fitness and population health, which is particularly relevant in the context of environmental change that threatens prey availability and alters habitat suitability (e.g., Gabriele et al., 2022). Morphometric measurements of body condition can also reflect broader ecosystem productivity and stability (e.g., Napoli et al., 2024). In addition, baleen whale morphometry can reveal important aspects of population demographics (Pallin et al., 2022), such as the proportion of juveniles and adults, through measurements of body length, which is positively correlated with age (Bierlich et al., 2023). Understanding population age structure and individual maturity status provides insights into habitat preferences and movement patterns and has important implications for conservation and management (e.g., Stepanuk et al., 2021).
Historically, baleen whales’ morphometric data were derived from whaling or stranding records, resulting in destructive, limited, and often biased datasets, as whalers tended to target larger individuals or species, while stranded animals are often sick, young, and/or weak (Ryan, 2022; Stepanuk et al., 2021). In recent decades, a variety of non-invasive techniques have been developed to measure free-ranging baleen whales and other cetaceans, including laser-metrics (Durban and Parsons, 2006), and underwater photogrammetry (Spitz et al., 2000). Among these, aerial photogrammetry has become the most widely adopted approach. This methodology relies on geometric principles and precise knowledge of camera specifications such as sensor width, focal length, image resolution, and altitude (Burnett et al., 2019; Torres and Bierlich, 2020). In the past, aerial photogrammetry required expensive and resource-intensive crewed aircraft surveys, limiting its broader application in marine mammal research (e.g., Whitehead and Payne, 1978; Perryman and Lynn, 1993). Over the last decade, Uncrewed Aircraft Systems (UAS, drones) have transformed photogrammetric data collection by providing a cost-effective, flexible, and accessible alternative to traditional crewed aerial surveys (Christiansen et al., 2016; Dawson et al., 2017; Durban et al., 2015). The widespread availability of commercial and open-source UAS platforms has expanded access to this technology, making it feasible for a broader range of researchers and institutions. This has driven continuous innovation and methodological standardization, resulting in improved data quality and expanded research opportunities (Álvarez-González et al., 2023).
UAS-based photogrammetry has been successfully applied across multiple baleen whale species and populations, to compare body condition across ocean basins and foraging habitats, revealing population-level differences in nutritional status and responses to environmental variability (Christiansen et al., 2020a; Napoli et al., 2024; Russell et al., 2024). Other studies have also used photogrammetry to assess temporal changes in body condition on feeding grounds, including seasonal fattening trends (Aoki et al., 2021; Christiansen et al., 2020b; Bierlich et al., 2022; Lemos et al., 2020; Torres et al., 2022) and the causes of unusual mortality events (Christiansen et al., 2021). This technique has been applied to estimate body length and growth to infer population age structure, supporting demographic assessments and investigations into age-specific behavior and habitat use (Bierlich et al., 2022, 2023; Pirotta et al., 2024; Stepanuk et al., 2021). Other research has focused on maternal investment, as well as migration energetic requirements (Christiansen et al., 2018, 2025; van Aswegen et al., 2024).
Humpback whales (Megaptera novaeangliae) have been the focus of numerous UAS-based photogrammetry studies worldwide, particularly in regions with large aggregations such as the Antarctic Peninsula (Bierlich et al., 2022), Australia (e.g. Russell et al., 2024), Northwestern Atlantic (Napoli et al., 2024), and Northeastern Pacific (van Aswegen et al., 2024), although research interest is growing in other less-studied areas. In Ireland, the Irish Whale and Dolphin Group (IWDG) has been collecting humpback whale photo-identification data since 1999, curating the Irish Humpback Whale Photo-identification Catalogue (IHWPC), which contains the sighting histories of 140 individuals as of October 2025. Citizen science-based reporting has documented an increase in humpback whale presence in Irish waters over the last decade, although abundance remains low (Blázquez et al., 2023). Despite this, humpback whales are regularly observed feeding in coastal waters off Ireland, and long-term photo-identification studies indicate some individuals display strong site fidelity and relatively long residency (Berrow and Whooley, 2022; Blázquez et al., in review)1. Humpback whale sightings peak during summer months in Ireland, although the species has been reported year-round, suggesting prolonged residency or even overwintering (Blázquez et al., 2024). Humpback whales in this region likely feed on small schooling fish such as sprat (Sprattus sprattus), Atlantic herring (Clupea harengus), and sandeels (Ammodytes spp.), although dietary data remain limited (Ryan et al., 2014). Photo-identification data has also documented migratory movements between Ireland and the major feeding areas in the North Atlantic, as well as the breeding grounds in Cabo Verde (Berrow et al., 2021; IWDG, unpubl. data).
The ecological significance of humpback whale presence in Irish waters remains uncertain. It is unclear whether this region functions as a stopover providing supplementary feeding opportunities during migration or as a newly established feeding ground. Additionally, the demographic structure of whales using these waters is still unknown. Because maturity and reproductive status are closely linked to energetic requirements and migratory behavior in humpback whales (Clapham, 1996; van Aswegen et al., 2024), assessing body length and condition in Irish waters is essential to better understand the ecological role of this region and to inform conservation efforts. The integration of UAS-based photogrammetric measurements with existing long-term sighting histories offers a cost-effective means to investigate maturity and body condition over time, at both population and individual levels, and to detect patterns of habitat use (Bierlich et al., 2023; Christiansen et al., 2022).
In this study, we applied UAS-based photogrammetry to assess the body condition and maturity of humpback whales in Irish coastal waters. We complemented this analysis with data collected opportunistically from whales off Norway and Cabo Verde, representing an important feeding area and an understudied breeding ground, respectively, within the Northeast Atlantic population. Our specific objectives were: 1) to estimate body length and assess maturity status of humpback whales based on photogrammetric measurements, 2) to assess body condition using different morphometric indices, 3) to evaluate variability in body size and condition across Ireland, Norway, and Cabo Verde, 4) to explore seasonal trends in body condition at the population and individual levels in Ireland, and 5) to integrate morphometric data with the existing photo-identification dataset in Irish waters to describe possible age-based differences in habitat use and movement patterns.
2 Materials and methods
2.1 Sampling protocols
Photogrammetry data was collected along the south and west coasts of Ireland in 2022, 2023 and 2024 from May to November, off the island of Boa Vista in the Cabo Verde archipelago (W Africa) between March and April 2023, and off Andenes, on the northwest coast of Norway in 2022 and 2023 from March to May (Figure 1).
Figure 1
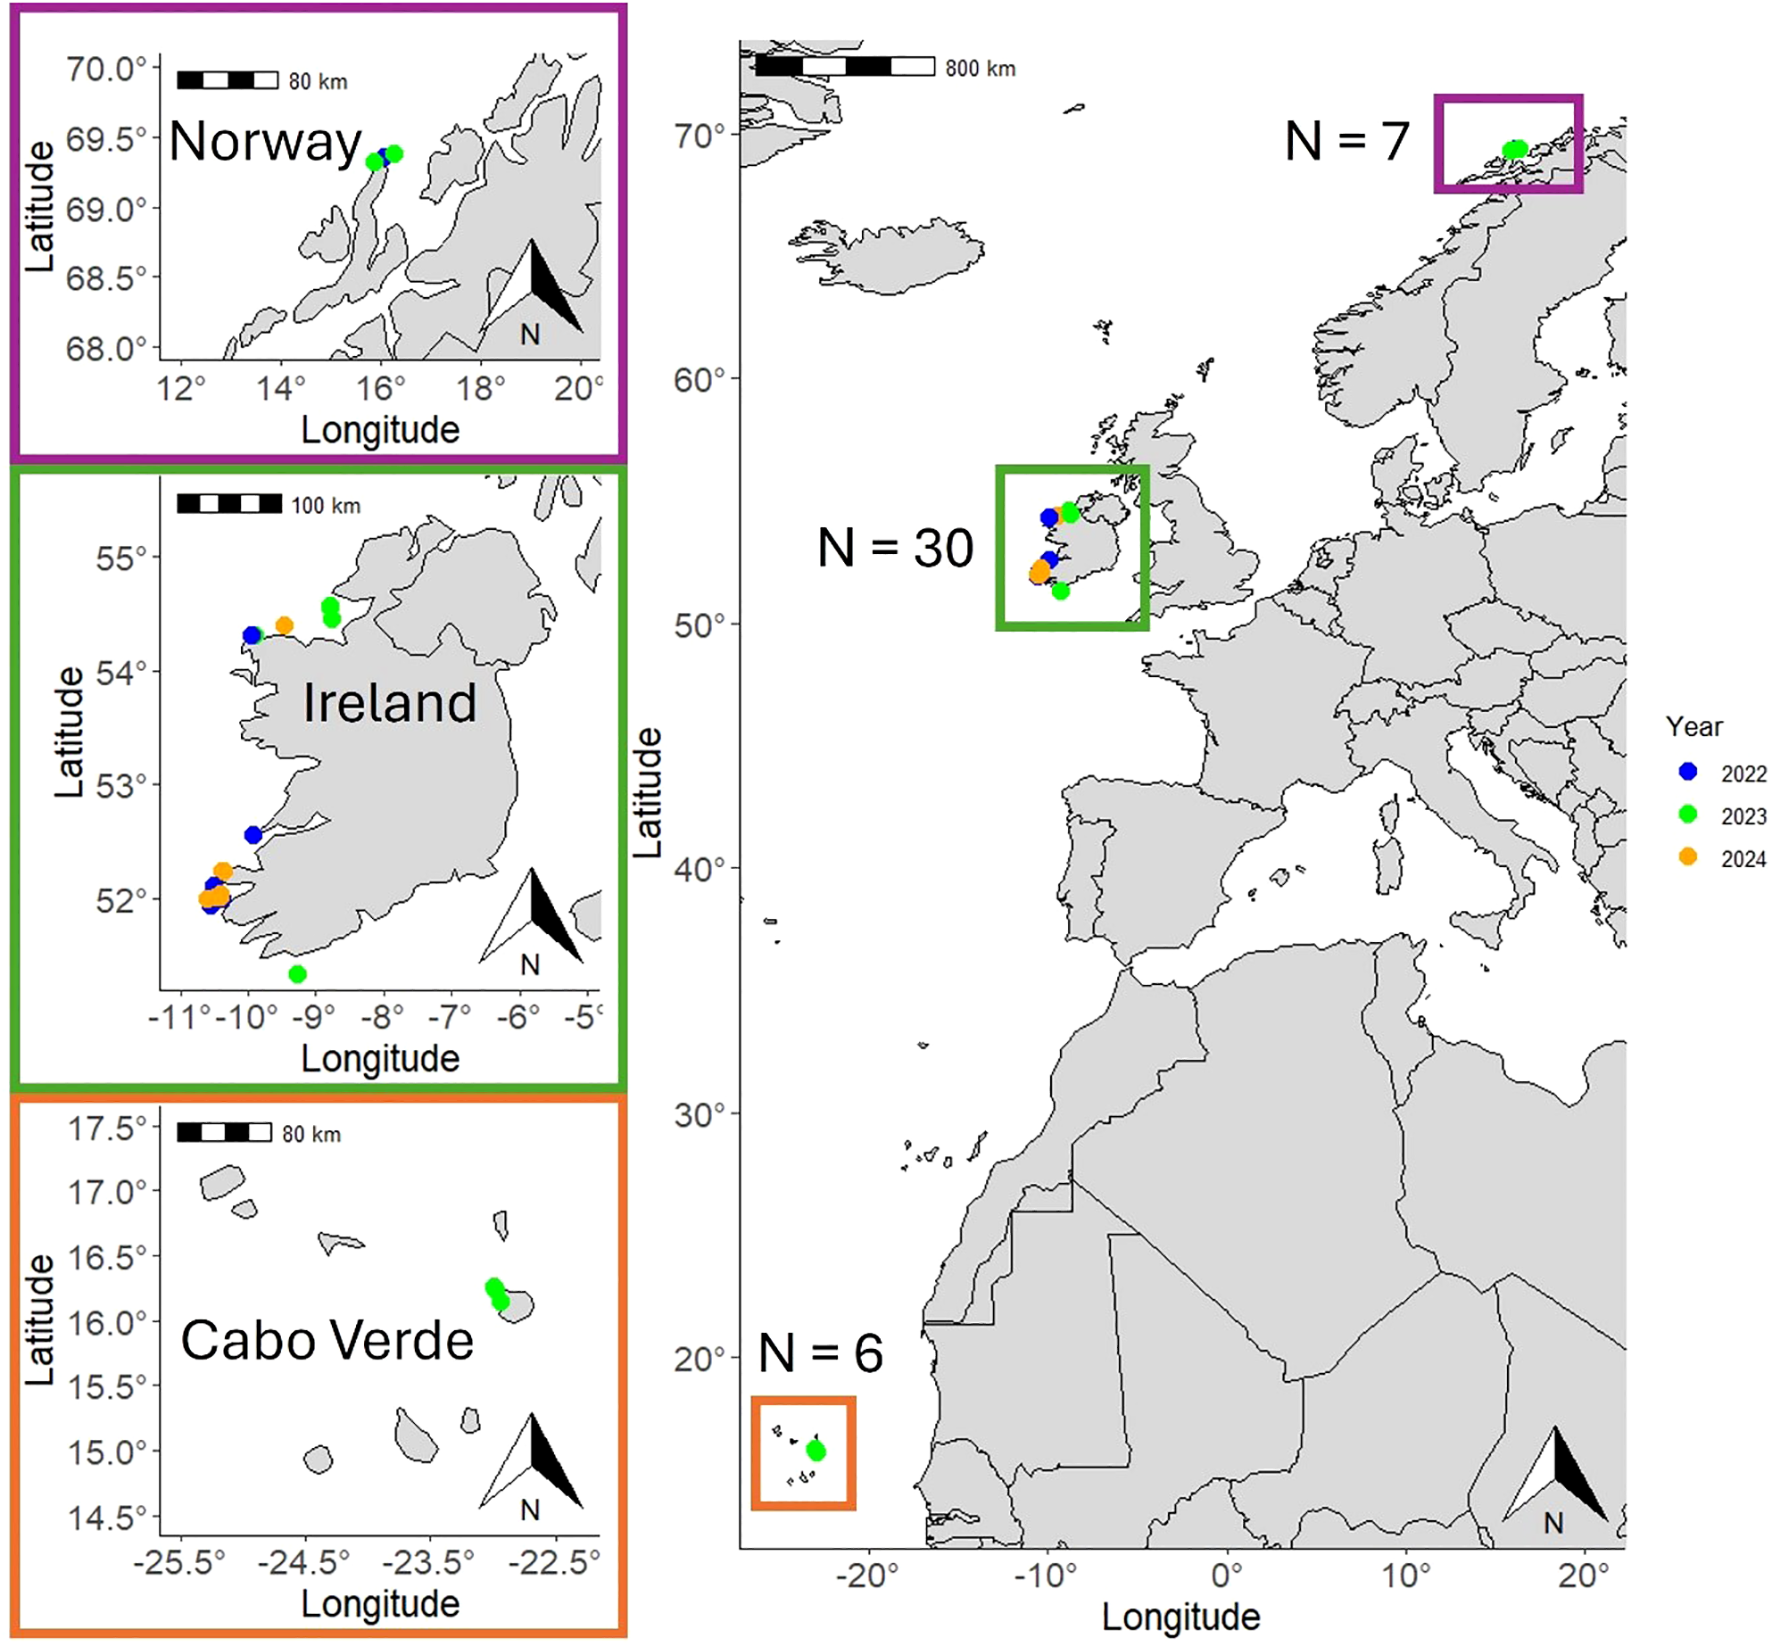
Locations where the photogrammetry data used in this study were collected in Cabo Verde, Ireland and Norway. Point colors indicate the year of collection.
In Ireland, data collection was conducted on an opportunistic basis, taking advantage of suitable weather windows, boat availability and confirmed whale presence. Data collection effort was mainly carried out by researchers but imagery suitable for photogrammetric measurements was also collected by citizen scientists following the guidelines described below. Before surveys were carried out, whale presence was usually confirmed by land-based sightings reported by observers to the Irish Whale and Dolphin Group (IWDG). Then, surveys were carried out using private rigid inflatable boats (RIBs) with members of the IWDG, local marine ecotour boats, chartered boats or fishing vessels. In Cabo Verde and Norway, data collection was carried out only by researchers, either during dedicated surveys or opportunistically onboard local whale watching boats.
In all the regions, surveys occurred when conditions were appropriate, which were defined as good visibility (>10km), low sea state (<3), and light or absent winds (<15 km/h). From the research platforms, observers scanned the area in search of evidence of humpback whales presence (e.g. blows, breaches or seabird feeding activity). When whales were detected, they were approached, at<6 kts while always keeping at least 100 meters distance from the animal(s), cruising in parallel to the animals’ movement, following established regulations and guidelines (see Marine Notice 15 of 2005). Before launching the UAS, animal behavior (inter-dive intervals, feeding activity, travelling direction and speed) was analyzed to estimate the feasibility of a successful flight. If the pilot considered whale behavior appropriate for data collection, the UAS was launched. Several UAS models were utilized (Table 1).
Table 1
| UAS model | Region | Year | Sensor width (mm) | 35 mm equivalent focal length (mm) | Crop factor | Real focal length (mm) | N |
|---|---|---|---|---|---|---|---|
| DJI Phantom 4 Pro® | IRL, NOR, CV | 2022, 2023, 2024 | 13.2 | 24 | 2.7 | 8.9 | 22 |
| DJI Mavic 2 Pro® | IRL | 2022 | 13.2 | 28 | 2.7 | 10.4 | 4 |
| DJI Mavic 2 Zoom® | IRL | 2023, 2024 | 6.16 | 24 | 5.62 | 4.3 | 7 |
| DJI Mavic Air 2S® | IRL | 2023 | 13.2 | 22 | 2.7 | 8.2 | 1 |
| DJI Mavic 3 Classic® | IRL | 2023, 2024 | 17.3 | 24 | 2 | 12 | 8 |
| DJI Mini 2® | IRL | 2023 | 6.16 | 24 | 5.62 | 4.3 | 1 |
UAS models and camera specifications utilized for recording photogrammetry data in each region and year.
N = number of independent measurements collected per UAS model. Note that real focal lengths were calculated by dividing the 35 mm equivalent focal length, as specified by the UAS manufacturer, by the crop factor derived from the sensor width. IRL, Ireland; NOR, Norway; CV, Cabo Verde.
After take-off, the UAS was flown at an altitude between 20 and 30 meters above sea level. The pilot was usually assisted by other observers to monitor the whales at the surface. Video recordings were collected at nadir angle (90°) to maximize the likelihood of obtaining high-quality images, capturing the whales at the surface with their bodies fully elongated and the edges clearly visible (Christiansen et al., 2016, 2018; Burnett et al., 2019; Bierlich et al., 2021b, 2022; Torres et al., 2022; Glarou et al., 2023; Napoli et al., 2024). When the pilot considered this was achieved, the UAS was retrieved. On a per-flight basis, video recordings of an object of known length were made at the same altitude at which the whale was filmed to account for any error in altitude provided by the built-in altimeters in the UAS (Burnett et al., 2019). Various calibration objects were used depending on the platform (Table 2): for RIBs, the distance between the stern cones was used to calibrate altitude, while for other vessels calibration was based on either the vessel length (Durban et al., 2015) or an object of known length floating on the water surface (Lemos et al., 2020). In all sampling occasions, the zeroed launch height over the sea surface was recorded for each flight and subsequently added to the barometer altitude for photogrammetry analysis. A laser altimeter or LiDAR kit (Lightware SF11/C) manufactured by Ocean Alliance (Gloucester, MA, USA) was incorporated into photogrammetry samplings to improve measurement accuracy (Bierlich et al., 2021b; Dawson et al., 2017). Not all the measurements included laser altimeter data due to occasional equipment malfunction, and additional data collected by citizen scientists without access to a laser altimeter were also incorporated into the analysis. During each survey, whales were photographed and later cross-matched with the Irish Humpback Whale Photo-identification Catalogue (IHWPC) which has been curated by the IWDG since 1999 and contained 140 individuals as of October 2024.
Table 2
| Calibration object | Type | Length (m) | N |
|---|---|---|---|
| RIB 1 | Distance stern cones | 2.00 | 19 |
| RIB 2 | Distance stern cones | 1.75 | 4 |
| RIB 3 | Distance stern cones | 1.65 | 9 |
| Boat 1 | Center line length | 10.00 | 1 |
| Boat 2 | Center line length | 5.28 | 6 |
| Boat 3 | Center line length | 9.9 | 1 |
| Box 1 | Length | 0.80 | 2 |
| Box 2 | Length | 1.30 | 1 |
Calibration objects used for UAS altitude correction and modeling of humpback whale measurements.
N = number of independent measurements collected per calibration object.
2.2 Photogrammetry data analysis
2.2.1 Image quality and data filtering
Video recordings were screened to select high-quality video clips for further analysis which required the whale to be positioned as centered as possible in the image, with the body fully elongated at the surface and the body edges clearly visible (Burnett et al., 2019; Christiansen et al., 2018). From the best video clips, two to five still images were selected and extracted per individual and flight. The selection of stills for photogrammetric analysis was based on a classification system established by previous studies (e.g., Bierlich et al., 2022; Christiansen et al., 2018; Napoli et al., 2024), which categorized images into three quality levels: 1 (high quality), 2 (medium quality), and 3 (poor quality), according to camera focus, straightness of the body, degree of body roll, body arch, body pitch, and the measurability of body length and condition. Stills assigned a score of 3 in any of these metrics were excluded from further analysis, as were those that received a score of 2 in both roll and arch, roll and pitch, or arch and pitch. Similarly, five stills of the calibration object were also extracted for each flight. Video recording examination and extraction of stills were carried out using VLC Media Player Software (version 3.0.18, VideoLAN).
2.2.2 Photogrammetry analysis and estimation of uncertainty
We used the open-source software MorphoMetrix (version 2.0; Torres and Bierlich, 2020) to measure (in pixels) the body length (distance between the rostrum and the notch of the fluke) and widths at 5% increments along the body (Figure 2), as well as the length of the calibration objects. It is well documented that the uncertainty of photogrammetric cetacean measurements based on UAS imagery depends on the specifications of the camera and altimeter used (Bierlich et al., 2021b; Burnett et al., 2019). To quantify and propagate measurement uncertainty, we applied a Bayesian modeling framework developed by Bierlich et al. (2021b) in RStudio (version 2022.12.0, R Core Team). This approach generates a posterior distribution of each length and width estimate rather than a single point value. The model was applied on a per-whale, per-flight basis, using the corresponding calibration data for each individual measurement to train the model. For each whale, between two and five images per flight were analyzed depending on image quality, as detailed in the previous section. The initial pixel-based measurements from MorphoMetrix were converted into metric units using the ground sampling distance (GSD; m/pixel), calculated with a standard formula:
Figure 2
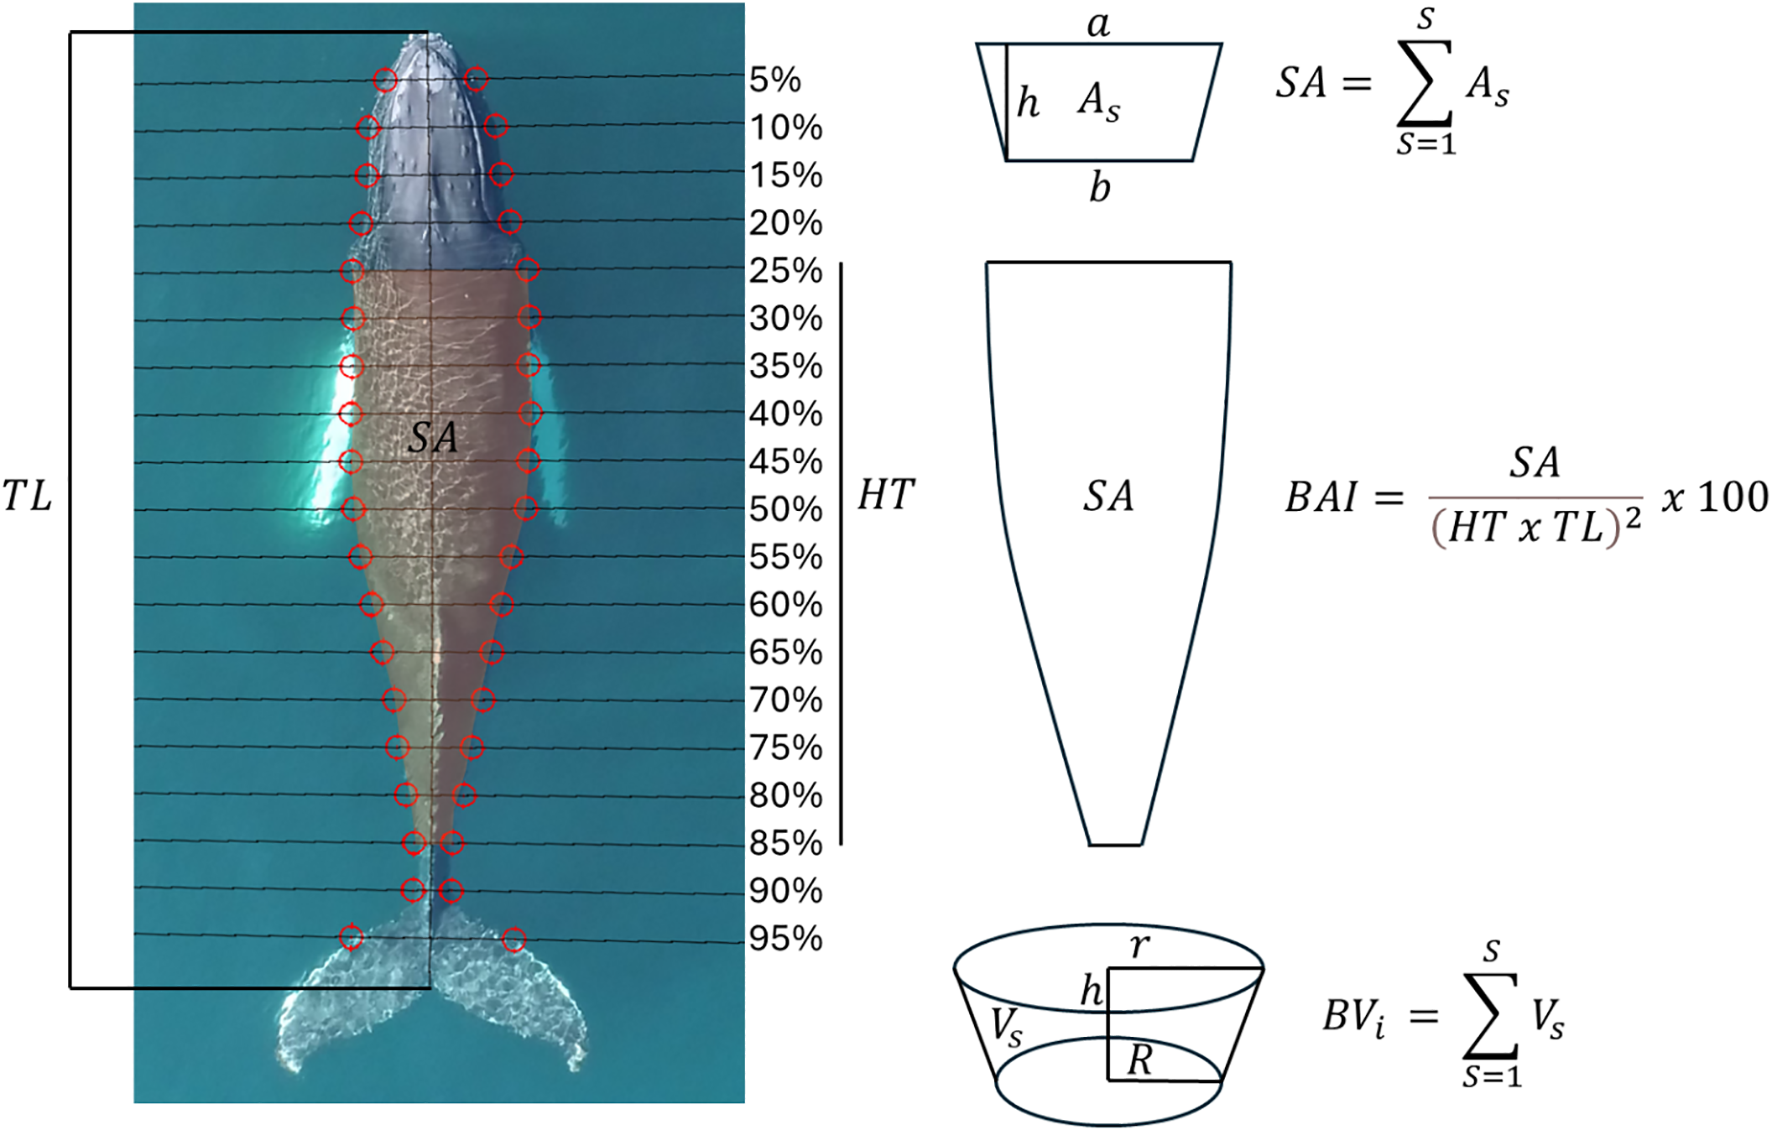
Overview of the mathematical demonstration of each body condition metric (dorsal surface area, body area index and body volume) derived from the modeling framework developed by Bierlich et al. (2021a, b). The image shows the typical MorphoMetrix output, with a humpback whale identified as HBIRL102 in the Irish Humpback Whale Photo-identification Catalogue. The image was collected on the 9th of July of 2022 in Ireland. Note the straight position of the body and the sides clearly visible. The head-tail range (HT) used in this case for the calculation of body condition metrics was 25-85%. The distance between each pair of red circles defines the length of each transversal segment, and therefore, the body width.
Where is the UAS’s altitude in meters when an image was taken, is the sensor width of the UAS’s camera in mm, is the focal length of the UAS’s camera in mm, and is the image width in pixels (Table 1).
In addition to the estimation of body length measurements and associated uncertainty, we used the model to derive estimates of whale body condition by the calculation of three different metrics, namely body area index or BAI (Burnett et al., 2019), dorsal surface area or SA (Christiansen et al., 2016) and body volume or BV (Christiansen et al., 2018).
The dorsal surface area () was computed as the sum of a series of consecutive trapezoids defined by whale body widths along the head-tail range in 5% increments. Each trapezoid area () was calculated as follows:
Where is the anterior base of the trapezoid (width ), is the posterior base (width ), and is the longitudinal distance between them (Figure 2).
The body area index (BAI) was computed using SA but instead of calculating the area of a trapezoid, a parabola was fitted between each pair of width segments at both sides of the whale’s body (see Burnett et al. (2019) for details):
Where is the head-tail range, is the total distance between the rostrum and the notch of the fluke, and is the dorsal surface area calculated by fitting parabolas at both sides of each longitudinal body segment at 5% increments (Figure 2). BAI is a standardized index of whale body condition, in which, SA is used as a surrogate for body mass and is divided by the squared portion of body length assessed. This makes BAI a unit-less whale body condition metric that is normalized for body length.
Body volume was modeled as the sum of a series of frustums (truncated cones) as in Christiansen et al. (2018). The cross-section of each truncated cone was assumed to be circular, and its volume () was calculated as:
Where is the longitudinal distance between each pair of width segments, is the radius of the anterior girth measurement of a -th frustum for an individual whale and is the radius of the posterior girth measurement of the same frustum (Figure 2). Following recent works of Christiansen et al. (2018); Glarou et al. (2023) and Napoli et al. (2024), we used body volume to derive a body condition index (BCI) using the following formula:
Where is the body volume derived by the uncertainty model for an individual whale and is the expected body volume for the same individual given by the average linear relationship between body volume and body length on the log–log scale for the entire population. Thus, BCI represents the residuals from a linear regression between the decimal logarithms of body volumes and body lengths of the population.
Both BAI and BCI are unitless indices that enable comparison of relative energetic reserves across individuals of varying sizes, providing insights into foraging success, health, and habitat quality. While BAI and BCI have been extensively compared in previous works (see Bierlich et al., 2021b), here, we apply both indices in parallel as a validation step, ensuring consistency of results in our study populations.
Following Bierlich et al. (2022), we calculated body condition metrics using the body length portion between the 25% and 85% percentile of the total length of the animal for adults and juveniles, and between 20-85% for calves (Figure 2). This was carried out so that we would only consider those parts of the body that are known to store larger amounts of adipose tissue to capture potential body condition variation across individual measurements. Cetaceans do not store energy reserves in their pectoral fins, head, or flukes (Brodie, 1975; Lockyer, 1981; Koopman et al., 2002) and therefore, the selected head-tail range aims to maximize the potential variability in the parts of the body that store larger amounts of energy.
For each morphological metric (body length, SA, BV, and BAI), we defined the estimated value as the mean of the modeled posterior distribution, and summarized uncertainty by calculating the variance, 95% highest posterior density (HPD) intervals, and the coefficient of variation (CV%) of the posterior predictive distributions, with CV% = (standard deviation/mean) × 100. We used CV% to compare measurement uncertainty associated with each altimeter, UAS model and morphometric measurement. CV% provides information on the relative width of each measurement’s posterior distribution, with a lower CV% indicating a more precise estimated measurement (Bierlich et al., 2022) and was used to quantify photogrammetric uncertainty across measurements, UAS models and altimeters.
2.2.3 Data analysis
2.2.3.1 Morphometric variability across study areas
We assigned each individual whale’s maturity status following previous works of Bierlich et al. (2021a, b, 2022) who assumed humpback whales were sexually mature if at least 50% of the posterior distribution of the modeled body length was greater than 11.73m for females and 11.20m for males, which was based on historic whaling measurements made by Chittleborough (1955a, b) in the Southern Hemisphere. As most of the whales in our dataset were of unknown sex, we used the average value of 11.47m for maturity assignment. Thus, individuals larger than 11.47m were considered as adults/matures, whereas animals below this threshold were classified as juveniles/immatures.
We evaluated if maturity status (adult ≥ 11.47m, or juvenile< 11.47m) influenced whale body condition (BAI and BCI) using linear mixed-effect models with country as a random effect in RStudio, following Napoli et al. (2024). Since maturity status was not significant, it was not considered in any further body condition analysis. Due to reduced sample sizes, particularly in Cabo Verde and Norway, a power analysis was performed using the package pwr (version 1.3-0; Champely et al., 2020) in RStudio. The analysis was based on a two-sample comparison of means between the two study areas with the highest and lowest average value of each morphological metric. The effect size was calculated using Hedges’ (Hedges, 1981), a modification of Cohen’s (Cohen, 1977) that adjusts for small and unbalanced samples. Hedges’ was computed as:
Where are the sample sizes, are the means, and are the variances of each morphological metric for the pair of study areas considered. The power analysis assumed an alpha level of 0.05 and a target power of 0.80, corresponding to an 80% probability of detecting a true effect of the estimated size. This analysis suggested low statistical power due to small and unbalanced sample sizes across all the morphological metrics. To explore the magnitude of observed differences across study areas, we followed Barlow et al. (2023) and used ANOVA models to compare each morphological metric that included modeled uncertainty (i.e., body length, surface area, body volume, and BAI). Multiple imputation methods were applied to propagate uncertainty by averaging the results of 1,000,000 replicates of the ANOVA in RStudio. For each replicate, each metric was sampled from a normal distribution parameterized by the posterior mean and variance derived from each measurement 95%HPD intervals. In addition to the overall ANOVA, we calculated pairwise contrasts between study areas to identify specific differences in morphological metric means. These included: (1) Cabo Verde vs. Ireland, (2) Norway vs. Cabo Verde, and (3) Norway vs. Ireland. These contrasts represent the differences in the estimated marginal means of each morphological metric between study areas and were summarized using posterior means and 95% HPD intervals across all replicates.
2.2.3.2 Maturity, body condition, habitat preferences and migration in Irish waters
For the data obtained in Irish waters, we examined the relationship between whale body length and age by fitting a von Bertalanffy growth model, using individual body length estimates and minimum ages, given by sighting histories contained in the IHWPC, as input data. Following previous works of Agbayani et al. (2020); Bierlich et al. (2023) and Pirotta et al. (2024), we used a Bayesian modeling framework in which minimum age was treated as lower bounds and expected ages were modeled as the observed minimum age plus an exponentially distributed offset to account for uncertainty. Body length uncertainty was propagated into the analysis as estimated standard deviation (Bierlich et al., 2023). The von Bertalanffy growth model was formulated as:
Where is the expected body length of an individual at age , is the asymptotic body length of the population, is the growth rate of the population, and is the theoretical age at which a whale is expected to have a body length of 0. Priors were parameterized as in Bierlich et al. (2023) and the model was fitted with three parallel MCMC chains of 200,000 iterations each, discarding the first 100,000 as burn-in and thinning every 200 iterations. This analysis was run in JAGS (version 4.3.1; Plummer, 2003) via the R2jags package (version 0.8-9; Su and Yajima, 2024) in RStudio.
Moreover, we explored if body length, as a proxy for age, had an influence in habitat preference by individual whales, as it has been observed in other areas that younger individuals may prefer waters closer to the shore (Stepanuk et al., 2021). We used the information provided by the IHWPC to derive the mean and maximum distance to the nearest coast at which each animal was sighted throughout their entire sighting histories. Linear regressions were fitted to assess the relationship between distance and body length, using both mean and maximum distance values as response variables. For this analysis, the only weaning calf in the Irish dataset was excluded as it was observed further from the shore than other juvenile whales in strong association with its mother, reflecting the adult’s habitat preferences instead of that of the calf. Additionally, we explored whether body length was related to migration timing by fitting two linear models. In the first, average day of the year (DOY) of the first sighting for each individual was used as the response variable, with body length as the predictor. In the second model, the earliest sighting date in each individual’s sighting history was used as the response variable, again with body length as the predictor. These two variables served as proxies for the timing of arrival to Irish waters (e.g. Ramp et al., 2015). For the first model, we excluded individuals that had been sighted in only one single year (i.e., only one interannual sighting).
Temporal variability in body condition in Ireland was also investigated. Following the methods of Bierlich et al. (2022), multiple imputation was used to propagate modeled uncertainty of BAI into the analysis by averaging 1,000,000 replicates of a linear regression model with BAI as the response variable and day of the year (DOY) as the predictor, to quantify how body condition changes over the course of the humpback whale season in Ireland at the population level. In parallel, a linear model was fitted using BCI as the response variable and DOY as the predictor to determine whether this metric showed similar seasonal trends. The multiple imputation methods described above were not applied to BCI since it does not allow measurement uncertainty to be modeled in the same way as BAI (Bierlich et al., 2021b). Finally, we also described interannual variability in these body condition metrics using common statistical descriptors (mean and standard deviation). Since sub-setting the dataset resulted in reduced sample sizes (N=6 – 10) and statistical power, no further analyses were carried out. All these analyses were computed in RStudio.
3 Results
3.1 Photogrammetry data
A total of 43 individual photogrammetric measurements of humpback whales were collected between 2022 and 2024 across three regions: Ireland (N=30), Norway (N=7), and Cabo Verde (N=6). In Ireland, measurements were collected from May to November in each year from 2022 to 2024. Norwegian data were collected between March and May of 2022 and 2023, while Cabo Verde measurements were obtained in March and April of 2023. In Ireland, the 30 measurements corresponded to 22 whales, with repeated measurements available for six individuals. This included interannual repeated measurements of three humpbacks: HBIRL47 (2023 and 2024), and HBIRL102 (2022, 2023, and 2024), and within-year repeated measurements of four individuals: HBIRL24 (03/06/2023 and 17/07/2023), HBIRL89 (17/07/2023 and 16/08/2023), HBIRL130 (14/07/2024 and 12/11/2024), and HBIRL131 (16/07/2024 and 18/09/2024). All 30 measurements from Ireland were used in the body length analysis. However, due to image quality constraints, only 22 of these measurements, corresponding to 19 individual whales, were included in the body condition analysis. Of the 35 individuals measured in all the study areas, photo-identification revealed that at least three were matched to other regions in the North Atlantic: HBIRL23 was matched between Ireland and Iceland, HBIRL47 was matched between Ireland, Scotland and Cabo Verde, and HBIRL67 was matched between Ireland and Norway.
3.2 Measurement uncertainty
The average body length uncertainty as CV% was 6.35 (standard deviation (SD) = 3.06, N=43) (Supplementary Figure S4). The average estimated uncertainty as CV% for body condition metrics was the least for BAI (CV%: mean = 1.14, SD=0.49, N=35), followed by SA (CV%: mean = 3.67, SD=1.38, N=35) and BV (CV%: mean = 5.6, SD=1.46, N=35) (Supplementary Figure S4).
Each UAS displayed variable levels of estimated measurement uncertainty for body length with Mavic Air 2S® yielding the highest CV% value, followed by Mini 2®, Mavic 2 Pro®, Mavic 2 Zoom®, Phantom 4 Pro®, and Mavic 3 Classic® (Table 3; Supplementary Figure S5).
Table 3
| UAS model | Mean CV% | SD CV% | N |
|---|---|---|---|
| Mavic Air 2S® | 10.32 | – | 1 |
| Mini 2® | 9.73 | – | 1 |
| Mavic 2 Pro® | 7.84 | 0.93 | 4 |
| Mavic 2 Zoom® | 7.26 | 3.40 | 7 |
| Phantom 4 Pro® | 5.74 | 3.29 | 22 |
| Mavic 3 Classic® | 5.69 | 2.03 | 8 |
Estimated body length uncertainty as CV% yielded by each UAS model.
Measurements incorporating a laser altimeter were consistently more precise than those relying on the corrected altitude estimates provided by UAS’s built−in barometers across all morphometric variables, except BAI (Supplementary Figure S6). For barometer−based measurements, the average CV% was 6.92 (SD = 2.00, N = 20) for body length, 4.42 (SD = 1.25, N = 20) for SA, 6.68 (SD = 1.92, N = 20) for BV, and 1.01 (SD = 0.36, N = 20) for BAI. In contrast, laser−altimeter measurements yielded lower average CV% values for body length (4.16, SD = 1.66, N = 15), SA (2.66, SD = 0.79, N = 15), and BV (4.20, SD = 1.20, N = 15), although BAI uncertainty was slightly higher at 1.31 (SD = 0.59, N = 15) (Supplementary Figure S6).
3.3 Morphometric variability across study areas
Excluding repeated measurements with wider HPD intervals, eight individuals (36%) were larger than 11.47m (Figure 3) in Ireland. Of the remaining 64%, only one weaning calf (HBIRL119) associated with its mother (HBIRL17) was measured. The individual HBIRL30 was well shorter than 11.47m despite its minimum age at sampling (8 years), as indicated by its sighting history. Despite its small size, this individual was possibly an adult since humpback whales are estimated to reach sexual maturity at ~5–7 years of age in the Northwestern Atlantic (Clapham, 1992). Two-thirds (66%) of the whales measured in Cabo Verde were larger than the maturity threshold of 11.47m (Figure 3). Two smaller individuals were a weaning calf (CV5) and a juvenile (CV3). In Norway, the 43% of the measured individuals were above the 11.47m threshold. Excluding weaning calves, body length was the largest in Cabo Verde (mean = 12.39m, SD=1.52, N=5), followed by Norway (mean = 10.72m, SD=1.51, N=7), and Ireland (mean = 10.55m, SD=1.79, N=21). These differences were significant between Ireland and Cabo Verde according to the multiple imputation analysis (Figure 4; Supplementary Figure S2) although this result must be interpreted cautiously due to small and unbalanced sample sizes available and subsequent low statistical power.
Figure 3
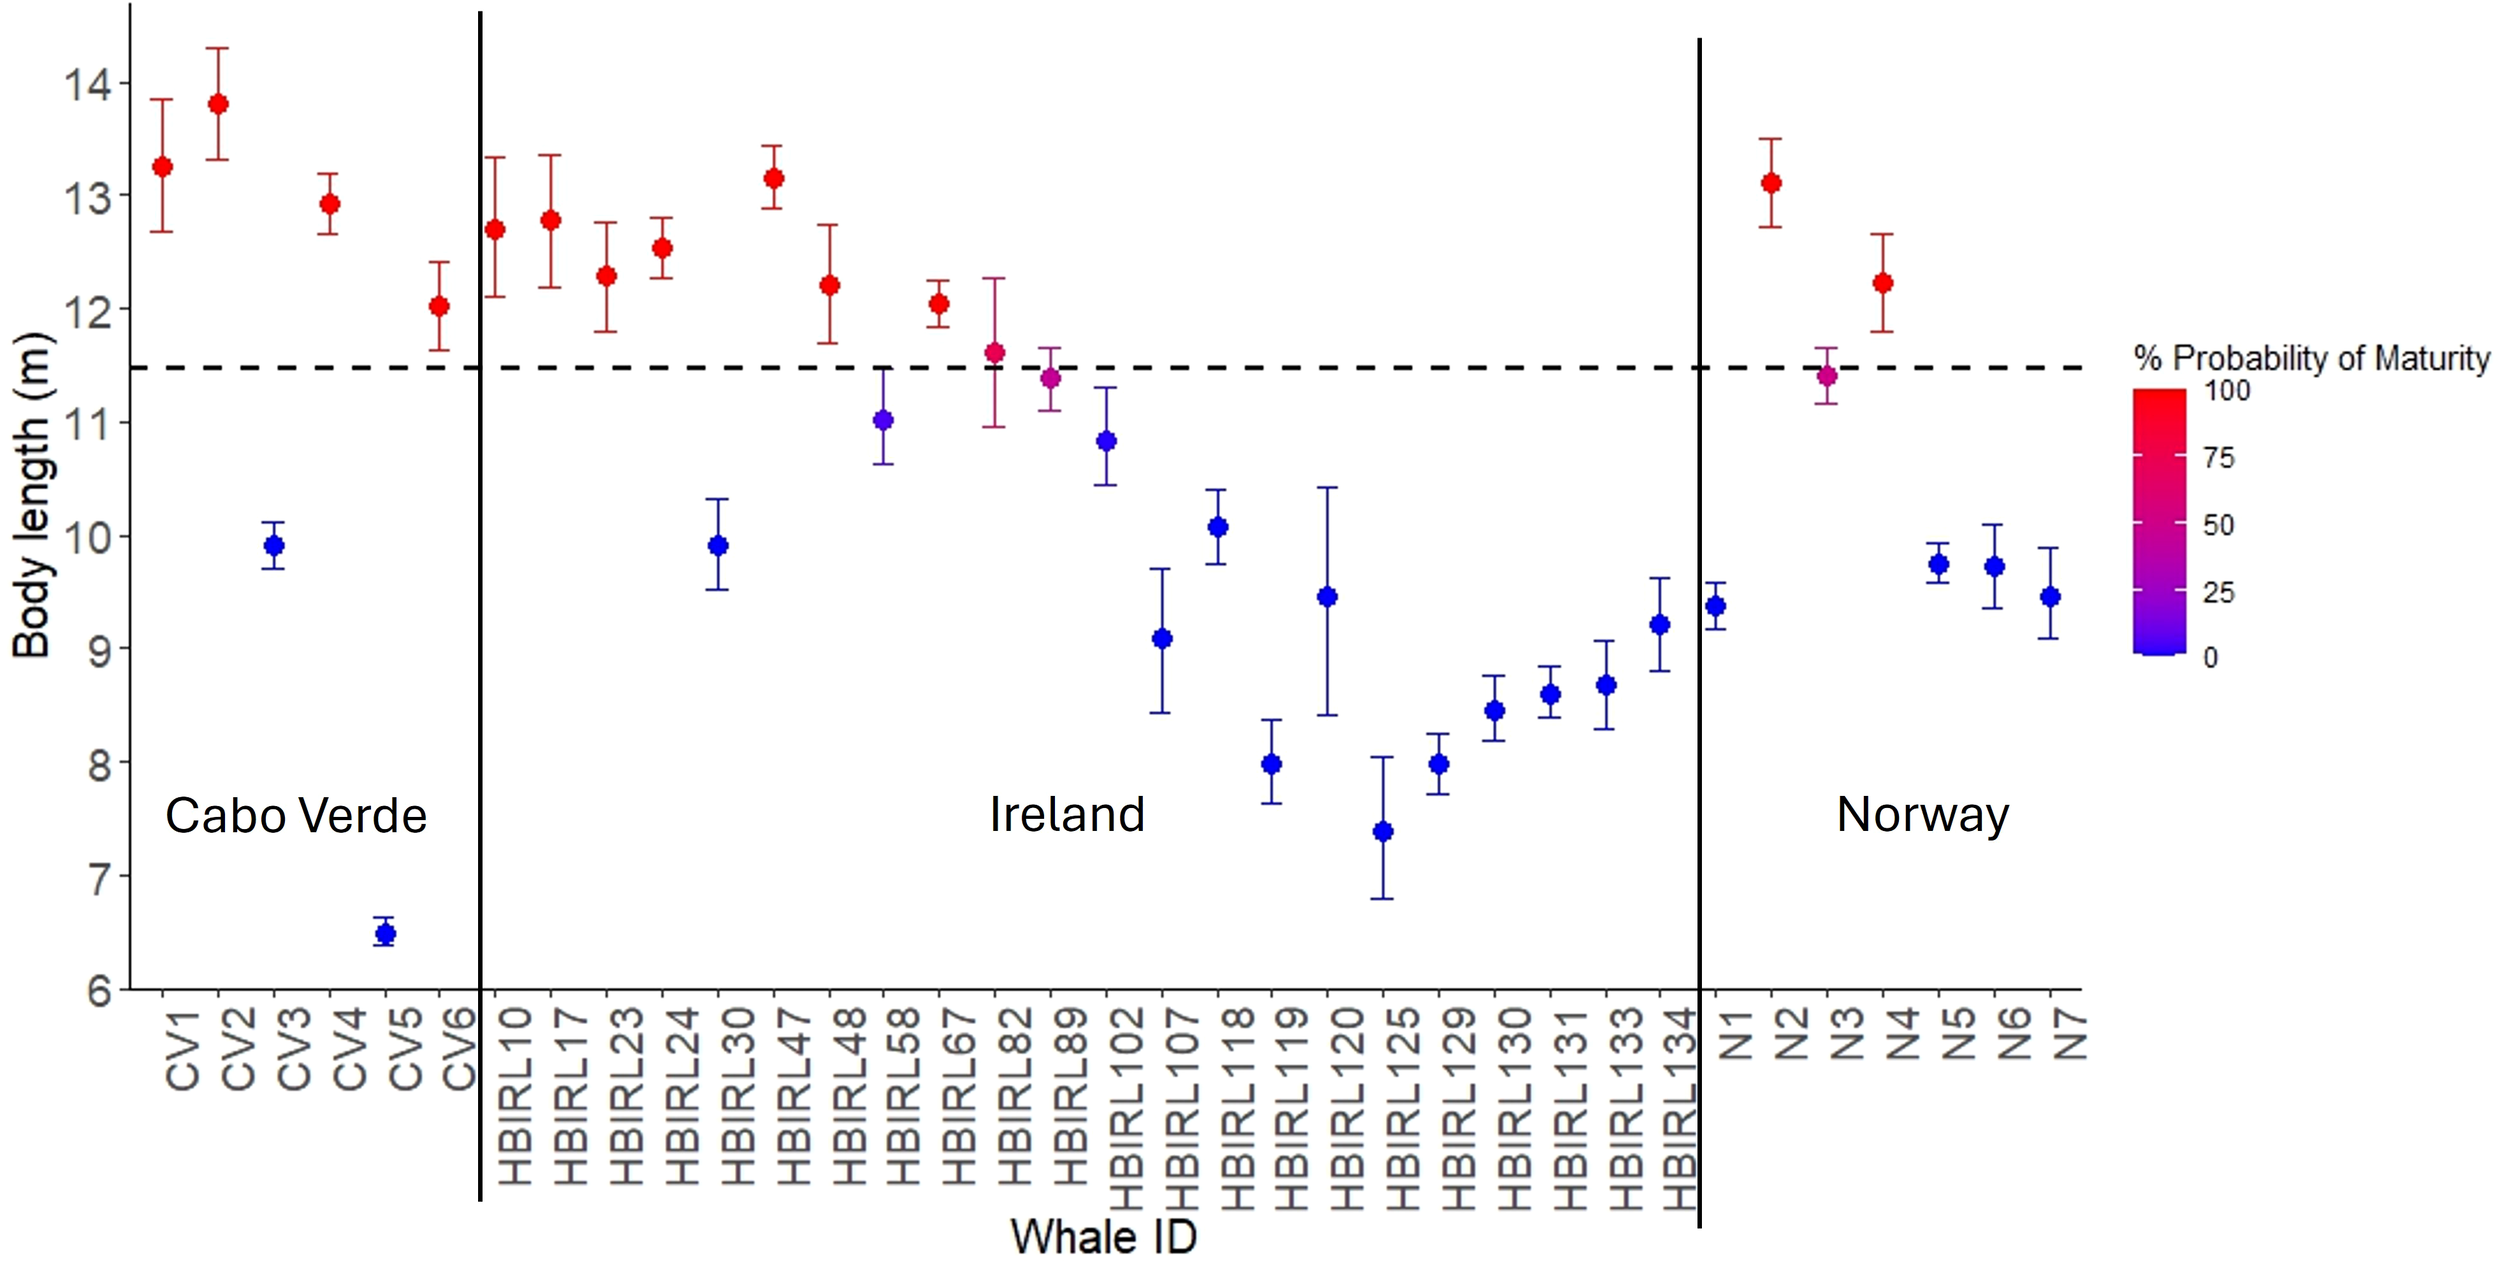
Individual humpback whale body length estimates from study areas across the Northeastern Atlantic. Error bars denote 95%HPD intervals yielded by Bayesian uncertainty models. Color indicates the probability of maturity, using 11.47 m (dashed line) as a threshold. Although some individuals were measured in multiple times in Ireland, here we only included the most precise estimates, given by the narrowest 95%HPD intervals.
Figure 4
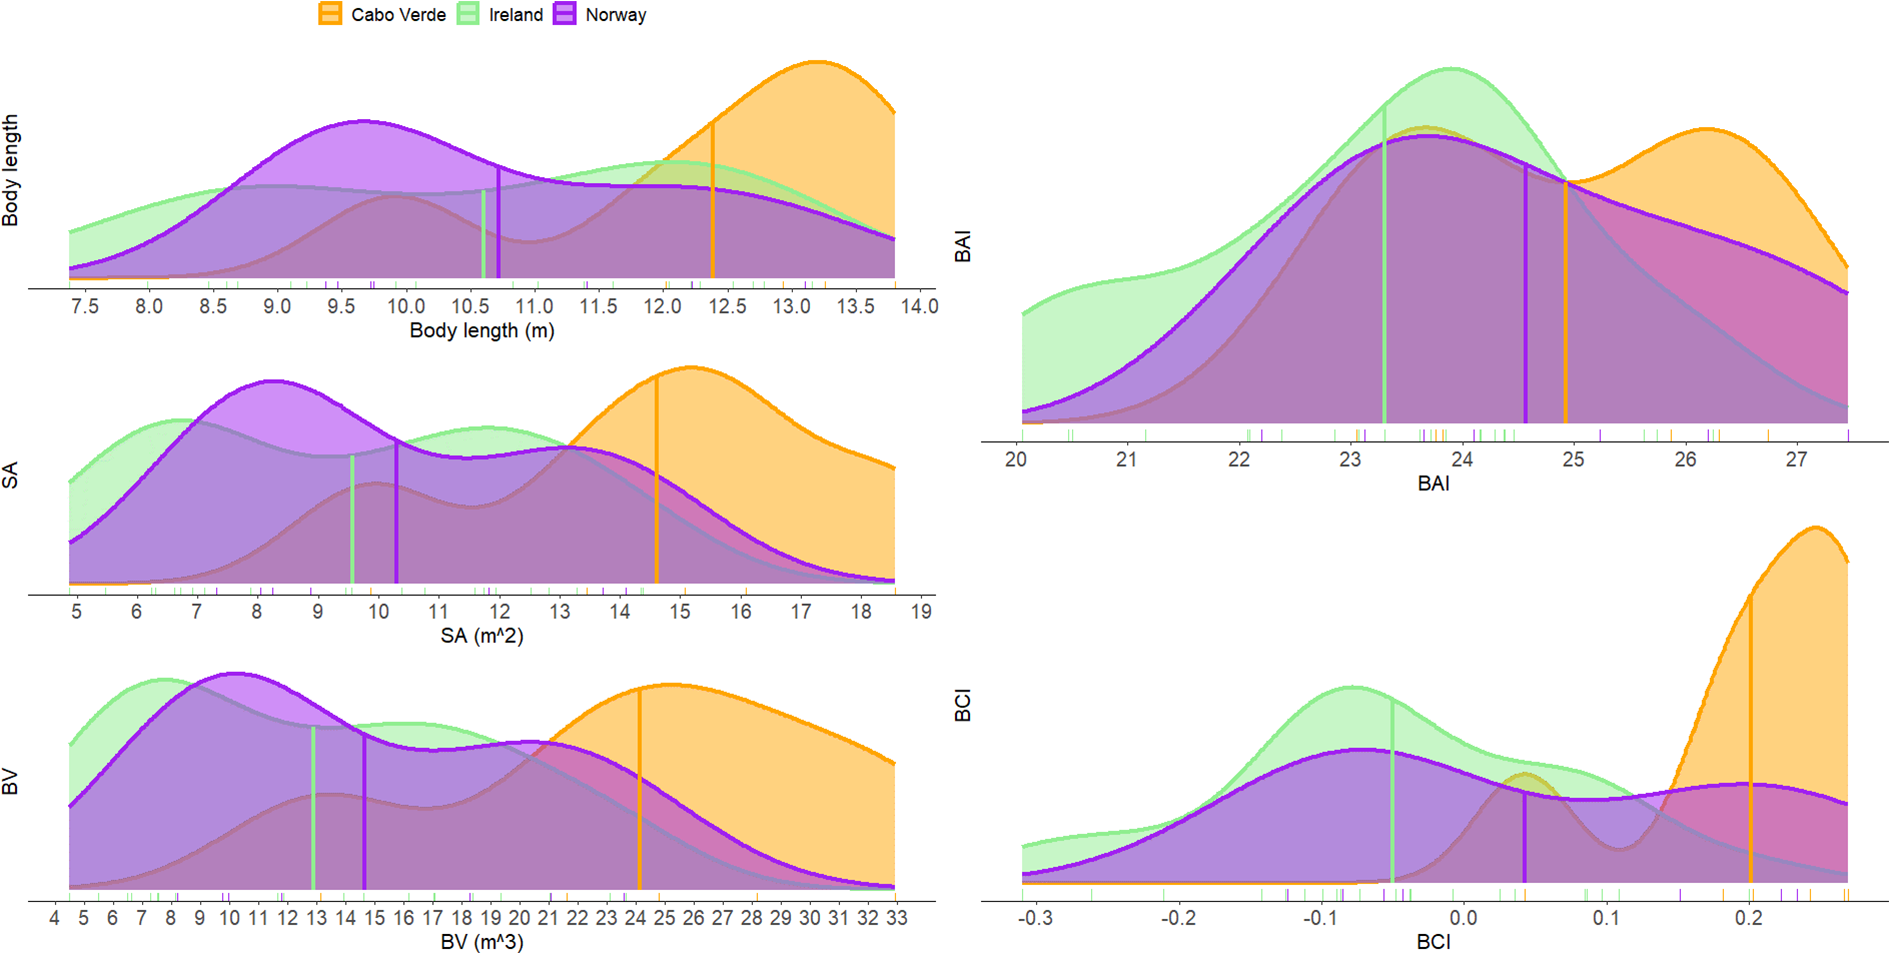
Density plots of estimated body length and condition metrics for humpback whales across three study areas: Cabo Verde (orange), Ireland (green), and Norway (purple). Metrics shown include body length, surface area (SA), body volume (BV), Body Area Index (BAI), and Body Condition Index (BCI). Weaning calves were included only in the BAI and BCI comparisons. Vertical lines represent the mean value for each region.
Body condition followed a similar pattern, with whales measured in Cabo Verde displaying the highest levels of body condition across all metrics and indices (Figure 4; Supplementary Figure S2). The average SA value for Cabo Verde was 14.61 m2 (SD=3.23, N=5), followed by Norway (mean = 10.30 m2, SD=2.84, N=7), and Ireland (mean = 9.57 m2, SD=3.07, N=21). The average BV for Cabo Verde was 24.13 m3 (SD=7.44, N=5), followed by Norway (mean = 14.68 m3, SD=6.18, N=7), and Ireland (mean = 12.93 m3, SD=6.07, N=21). Both SA and BV were significantly larger in Cabo Verde than in Norway and Ireland (Supplementary Figure S2). Cabo Verde yielded the highest BAI values with a mean of 24.92 (SD=1.56, N=6) followed by Norway (mean = 24.56, SD=1.83, N=7), and Ireland (mean = 23.30, SD=1.71, N=22). BAI was significantly higher in Cabo Verde than in Ireland (Supplementary Figure S2). The average BCI value for Cabo Verde was 0.20 (SD=0.09, N=6) followed by Norway (mean = 0.04, SD=0.15, N=7), and Ireland (mean = -0.05, SD=0.12, N=22).
3.4 Maturity, body condition, habitat preferences and migration in Irish waters
The von Bertalanffy growth curve indicated that humpback whales observed in Irish waters experience rapid increases in body length during their early years, with growth slowing after approximately 10 years of age and approaching an asymptote of = 14.22m (95% CI: 13.48 – 15.21m) at around 25–35 years of age (Figure 5A). The estimated median age of the population at the time of measurement was 9 years, with 59% of individuals older than 5 years and 41% older than 10 years (Supplementary Table S1). The median estimated age at first photo-identification (i.e., the difference between the model-derived age and the minimum known age from sighting histories) was 4.5 years (range: 0 – 16), suggesting that most whales were first included in the photo-identification catalogue while still juveniles.
Figure 5
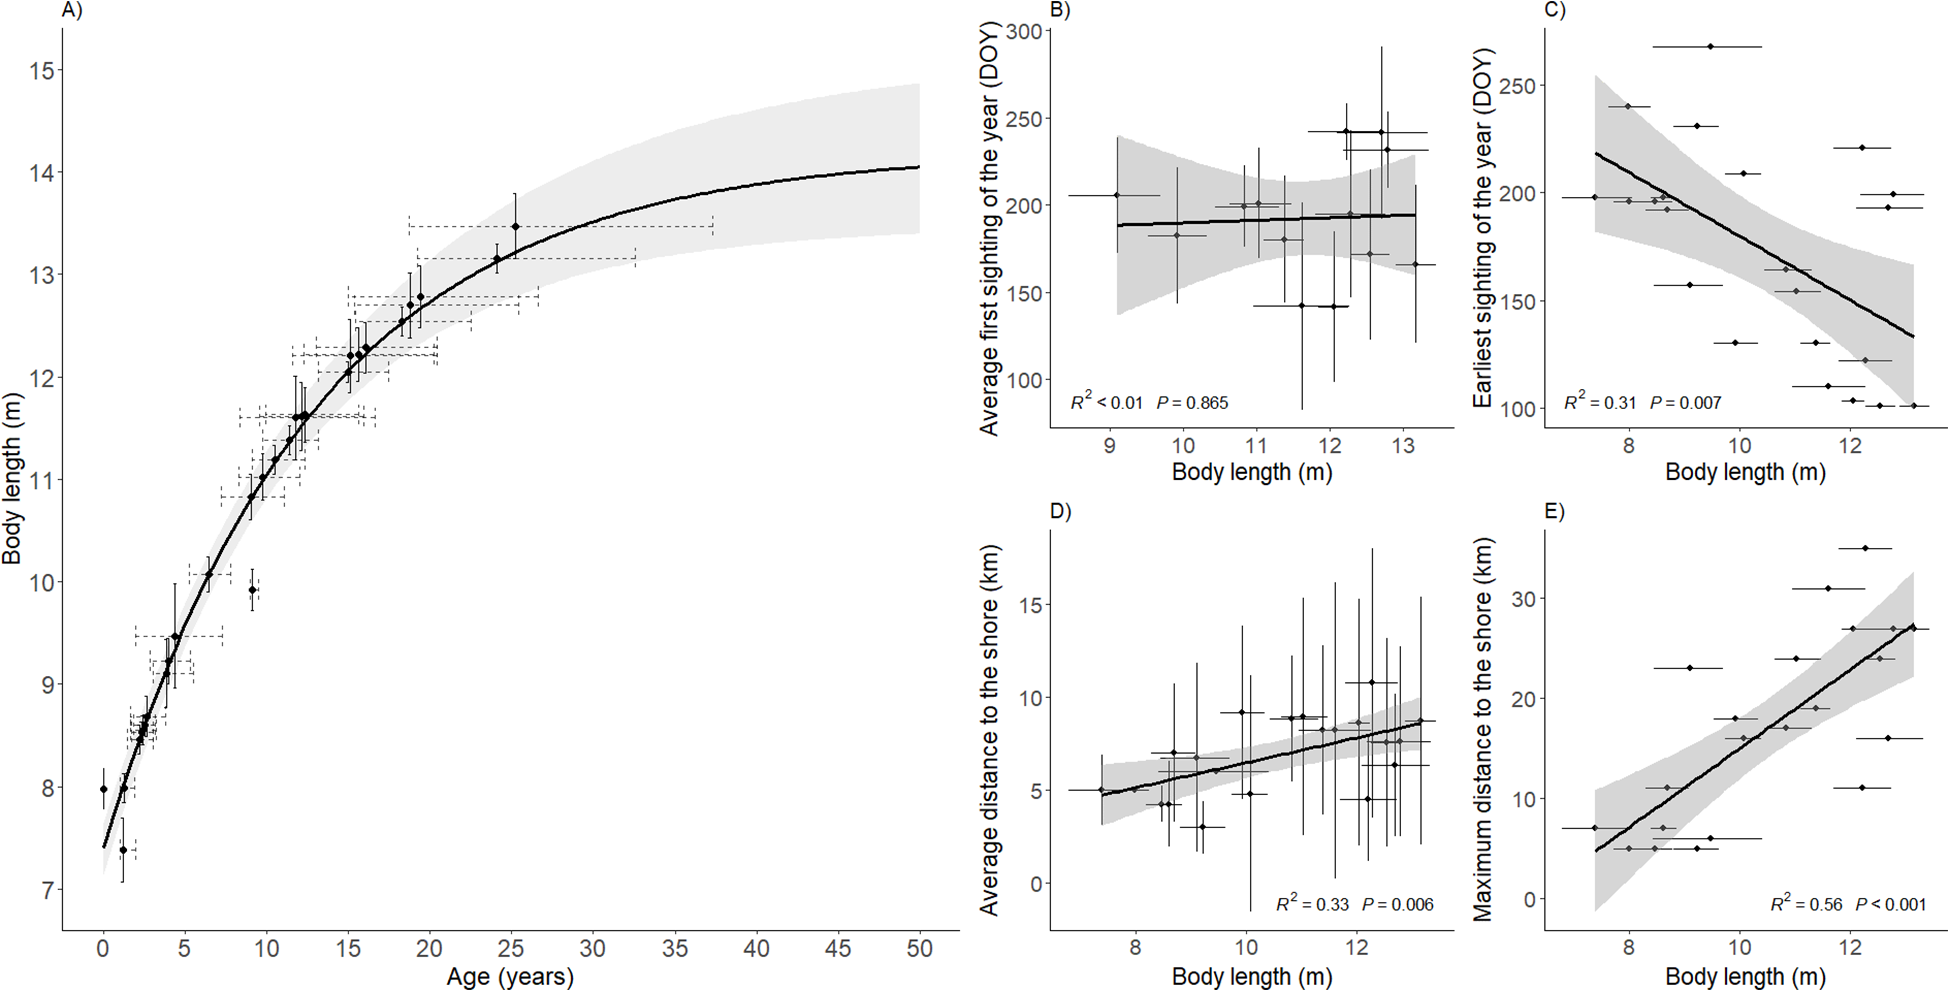
Left panel: (A) von Bertalanffy growth curve for length-at-age of humpback whales in Ireland. Points represent estimated mean length and median age. Vertical bars represent photogrammetric uncertainty (SD). Dashed horizontal lines represent uncertainty in age estimates. Right panels: Linear relationship of the estimated humpback whale body length in Ireland and their (B) average first sighting of the year, (C) earliest sighting of the year in their capture history, (D) average distance to the shore and (E) maximum distance to the shore. The minimum age was given by the number of years a whale had been in the Irish Humpback Whale Photo-identification Catalogue when the measurement was taken. The average first sighting of the year and average distance to the shore were calculated using all the sightings of each individual humpback whale sighting history in Irish waters. Horizonal error bars indicate 95% HPD intervals. Vertical error bars denote standard deviation.
Geographic information associated with each individual’s sighting history in Irish waters was used to explore possible age-related habitat preferences. Both in average and maximum terms, we observed a positive correlation between distance to the shore and body length (Figures 5D, E), indicating that shorter (younger) individuals were sighted closer to shore than longer (older) animals.
Regarding migration timing, the earliest arrival linear model displayed a negative correlation between arrival time and body length, indicating that older whales would be seen earlier in the year than younger individuals (Figure 5C).
However, this trend was not that clear when regressing the average first sighting of the year of each whale against body length (Figure 5B).
Linear models were fitted to explore the temporal variability of body condition in Ireland, using the combined data from 2022, 2023 and 2024. The multiple imputation analysis to propagate BAI estimated uncertainty into the linear model BAI ~ DOY showed that BAI increased over the course of the sampling period (May – November) in Irish waters (Figure 6A). The model BCI ~ DOY also displayed the same trend yet weaker (Figure 6B).
Figure 6
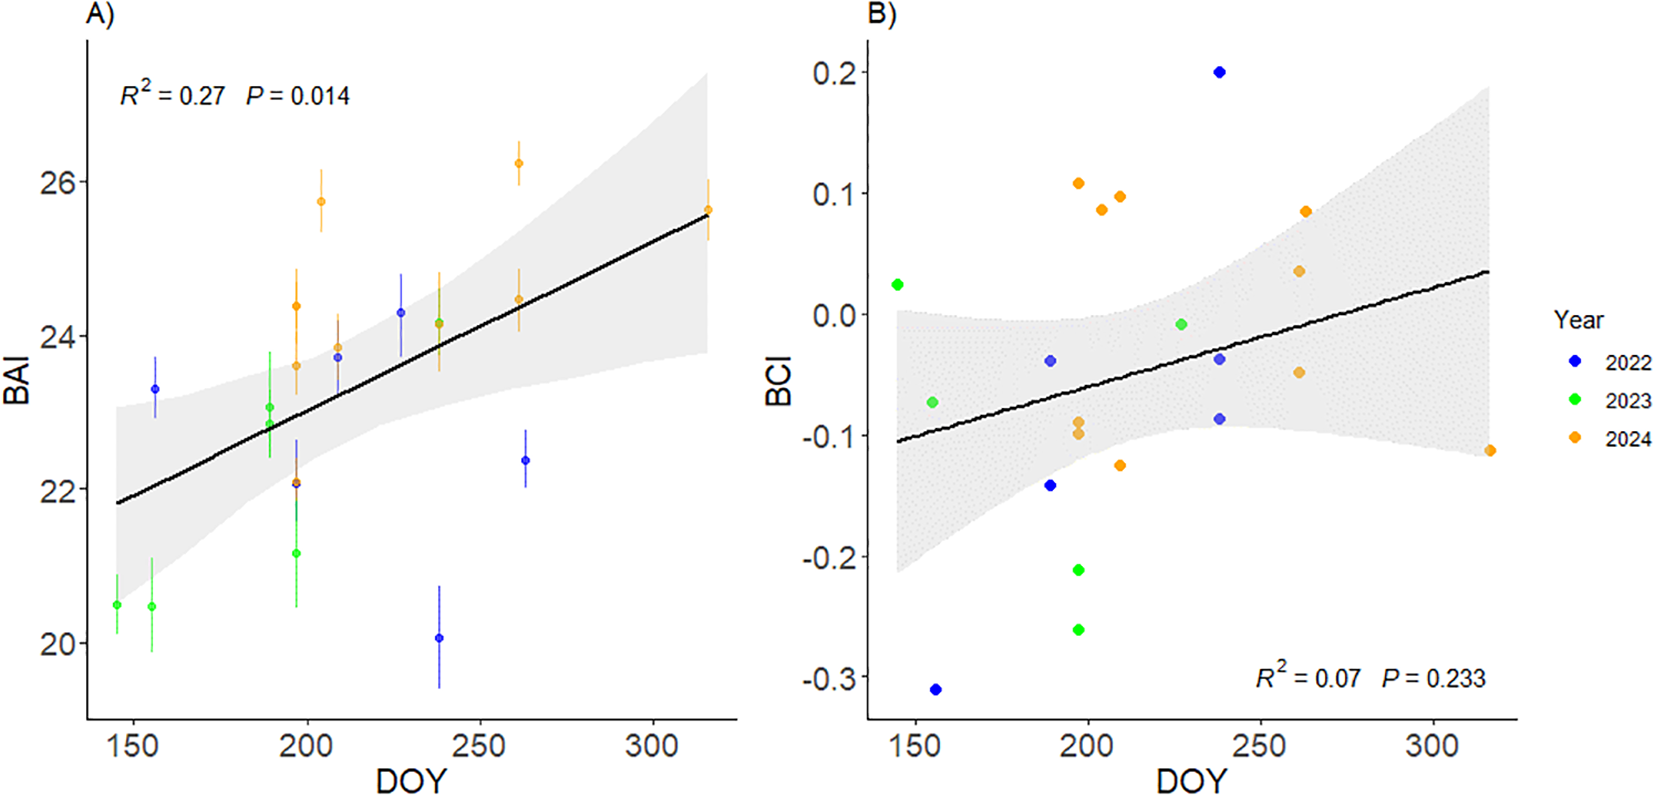
(A) BAI change over the sampling period in Ireland, including measurements from 2022, 2023 and 2024. Error bars indicate measurement uncertainty as 95%HPD intervals. (B) BCI change over the sampling period in Ireland, including measurements from 2022, 2023 and 2024.
The average BAI value was the lowest in 2023 with 22.04 (SD=1.54, N=6), followed by 2022 (mean = 22.64, SD=1.51, N=6), and 2024 (mean = 24.45, SD=1.20, N=10) (Supplementary Figure S3). BCI showed similar results with an average value of -0.10 (SD=0.11, N=6) in 2023, -0.07 (SD=0.17, N=6) in 2022 and -0.006 (SD=0.1, N=10) in 2024 (Supplementary Figure S3). Moreover, the population’s average first measurement of the year occurred 20 days later in 2024 (DOY=228; 15 August) than in 2022 (DOY=208; 27 July) and 42 days later than in 2023 (DOY=186; 5 July). Population-level yearly averages of BAI and BCI were strongly correlated with the average day of measurement in each study year (Supplementary Figure S3), suggesting that observed interannual differences in mean BAI and BCI were primarily driven by the timing of data collection within the feeding season in Irish waters (Figure 6).
Finally, we explored changes in body length and condition between measurements at the individual level. Regarding body length, we were able to model repeated measurements from six individual humpback whales in Irish waters, four of them within the same year and two across different years. The estimated body lengths demonstrated consistency across repeated measurements of the same whales, with clearly overlapping 95%HPD intervals. The widest difference between estimates was that of the individual HBIRL102 whose body length was estimated at 10.82m in July 2022 and 11.59m in August 2023, suggesting individual growth. This whale was measured again in July 2024 which yielded a body length estimate of 11.62m, almost identical to the previous year measurement (Table 4; Figure 7A).
Table 4
| Whale ID | UAS model | Altimeter | Date | Time elapsed between measurements (days) | TL (m) | 95%HPDI (m) |
|---|---|---|---|---|---|---|
| HBIRL24 | DJI Mavic Air 2S | Baro | 11/06/2023 | 36 | 12.20 | 11.52 - 12.93 |
| HBIRL24 | DJI Phantom 4 Pro | Laser | 17/07/2023 | 12.54 | 12.27 - 12.81 | |
| HBIRL47 | DJI Mavic 2 Zoom | Laser | 16/08/2023 | 347 | 13.16 | 12.89 - 13.44 |
| HBIRL47 | DJI Mavic 3 Classic | Baro | 28/07/2024 | 13.47 | 12.74 - 14.28 | |
| HBIRL89 | DJI Phantom 4 Pro | Laser | 17/07/2023 | 30 | 11.38 | 11.10 - 11.65 |
| HBIRL89 | DJI Mavic 2 Zoom | Laser | 16/08/2023 | 11.19 | 10.94 - 11.46 | |
| HBIRL102 | DJI Phantom 4 Pro | Baro | 09/07/2022 | 403/347 | 10.83 | 10.44 - 11.31 |
| HBIRL102 | DJI Mavic 2 Zoom | Laser | 16/08/2023 | 11.60 | 10.75 - 12.37 | |
| HBIRL102 | DJI Mavic 3 Classic | Baro | 28/07/2024 | 11.63 | 11.15 - 12.16 | |
| HBIRL130 | DJI Mavic 3 Classic | Baro | 16/07/2024 | 119 | 8.46 | 8.18 - 8.77 |
| HBIRL130 | DJI Mavic 3 Classic | Baro | 12/11/2024 | 8.53 | 8.30 - 8.78 | |
| HBIRL131 | DJI Mavic 3 Classic | Baro | 16/07/2024 | 64 | 8.60 | 8.39 - 8.85 |
| HBIRL131 | DJI Mavic 2 Zoom | Baro | 18/09/2024 | 8.55 | 8.29 - 8.82 |
Repeated body length measurements of humpback whales in Ireland.
TL, total length; 95%HPDI, 95% Highest Posterior Density Intervals.
Figure 7
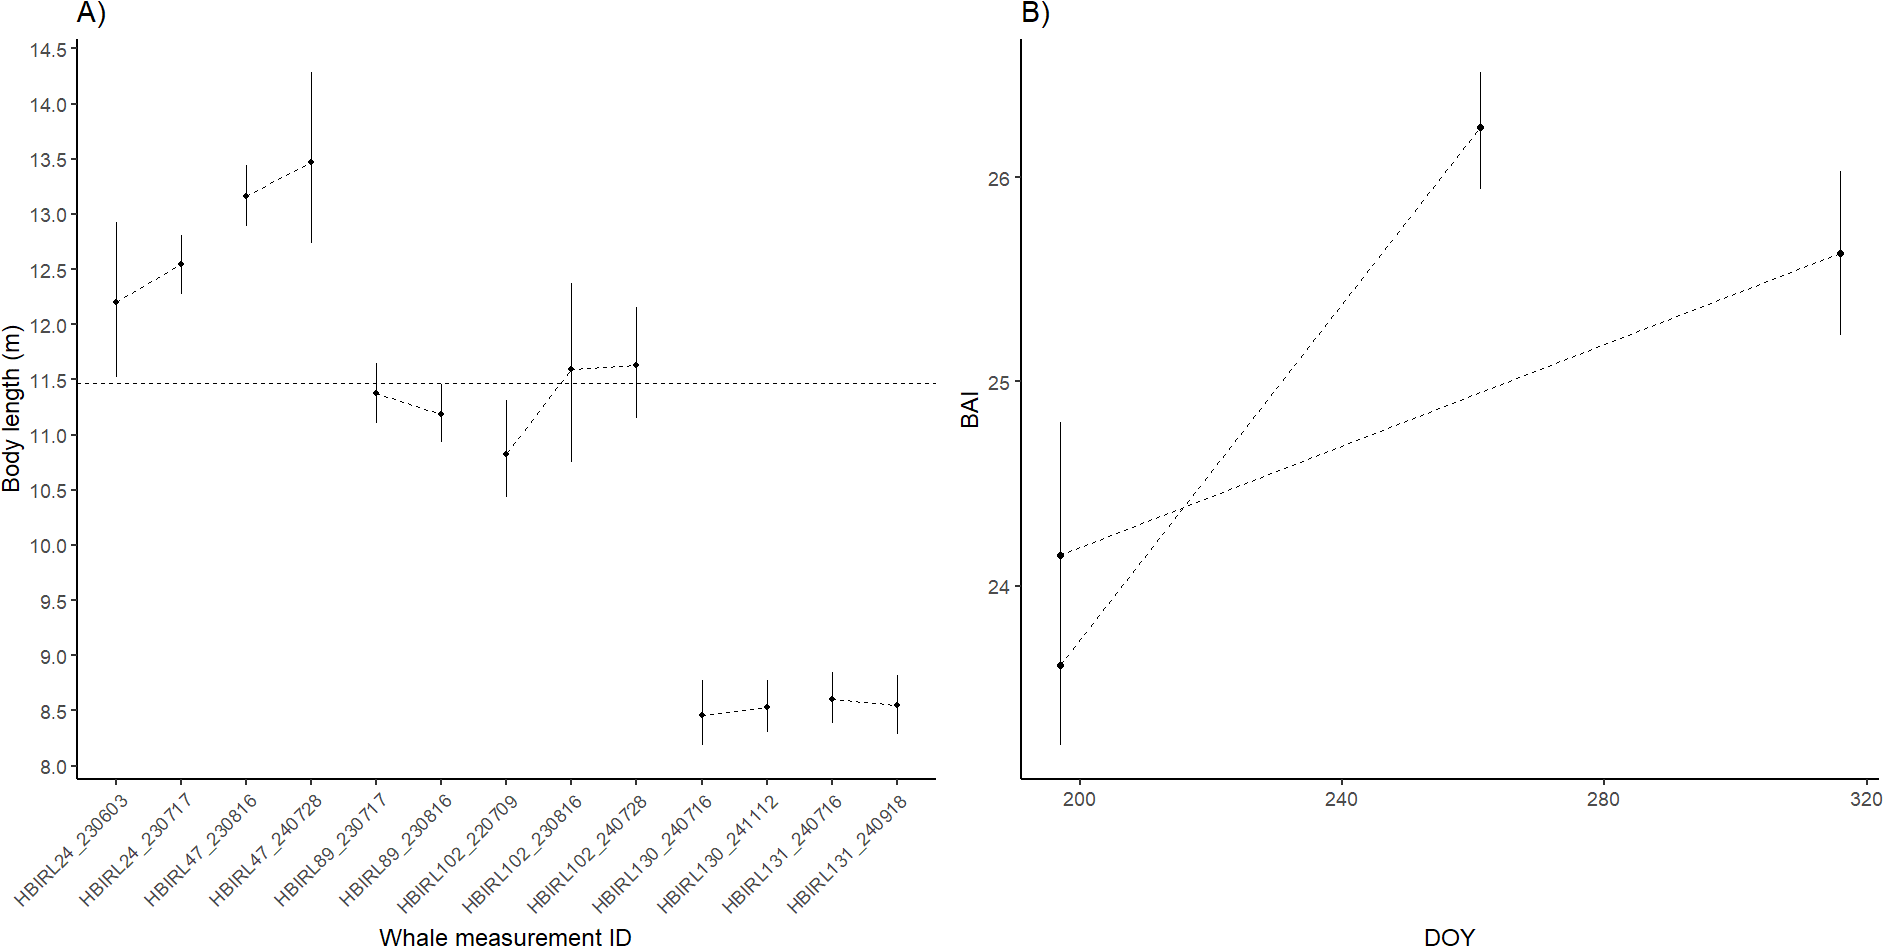
Repeated measurements of individual humpback whales in Ireland. (A) body length estimates across and within year where corresponds. Horizontal dashed line indicates the maturity threshold of maturity of 11.47 m. (B) estimated BAI within the same year. Error bars denote the modeled 95%HPD intervals. Dashed lines connect measurements of the same individual whales.
Body condition described by BAI showed notable changes throughout time. In total, we could derive two intra-seasonal high-quality repeated measurements of BAI. In both cases, the whales clearly increased their estimated BAI value after the first measurement (Figure 7B). This occurred at different rates across individuals. HBIRL130 increased its BAI in 1.48 points in 119 days (0.012 points/day). HBIRL131 increased its BAI in 2.63 points in 64 days (0.041 points/day).
4 Discussion
Our study provides new insights into the population structure and habitat use of humpback whales in the Northeast Atlantic, with a focus on Ireland. We found that body size, as a proxy for age, was strongly associated with distance from shore, suggesting that spatial habitat use in Irish coastal waters may be influenced by demographic structure. We also detected a pattern of temporal variation in arrival timing, with smaller individuals tending to appear earlier in the season. Additionally, we documented consistent increases in body condition over the course of the foraging season at both the individual and population levels across multiple years. These findings demonstrate that Irish waters function as a feeding ground capable of supporting meaningful energetic gains for humpback whales and point to a potential age-based component in how this habitat is used. In combination, our results suggest that habitat use in this region may be shaped by both the nutritional opportunities it provides and the age-related ecological strategies of individuals.
4.1 Measurement uncertainty
We followed recommendations in previous studies such as Christiansen et al. (2018); Burnett et al. (2019) or Bierlich et al. (2021a, b), including the application of image quality filtering criteria, the use of several images of each individual whale per measurement, and the incorporation of photogrammetric uncertainty associated with UAS on a per-flight basis.
Variability was observed in the estimated uncertainty (CV%) across morphometric measurements, UAS models and altimeters, as indicated in previous works (Burnett et al., 2019; Bierlich et al., 2021b; Torres et al., 2022). Moreover, the incorporation of a laser altimeter improved the estimated precision (CV%) of unit-dependent metrics, namely body length, surface area (SA), and body volume (BV) (Supplementary Figure S6). In contrast, the uncertainty of BAI estimates was unaffected by the type of altimeter used. This is primarily because BAI is a unitless, scale-invariant metric (Burnett et al., 2019), which is one of its main advantages over absolute body condition metrics like SA or BV. As a result, BAI is particularly well suited for detecting relative changes in body condition across individuals or over time, regardless of slight differences in altitude estimation or image scaling (Bierlich et al., 2021a). This also has important practical implications: when only relative measurements are needed, the use of a laser altimeter may be less critical, potentially increasing the accessibility of UAS-based morphometric approaches for researchers with limited funding or technical resources. This, in turn, can facilitate broader monitoring of whale populations and support conservation actions in understudied areas.
Repeated measurements of the same individuals can provide valuable insights into the actual uncertainty associated with estimated body size metrics. Such uncertainty may arise from factors including the specific UAS model, altimeter type, altitude calibration methods, or human-induced errors (Burnett et al., 2019). However, we observed consistent body length estimates with highly overlapping 95%HPD intervals across repeated measurements of the same individuals in Irish waters. The largest difference between body length measurements was of 0.77m for the individual identified as HBIRL102 between 2022 and 2023, suggesting individual growth. Repeated body length measurements of the same individual whales remained consistent across different UAS models, with or without laser altimeters, and using various calibration objects (Figure 7A; Table 4), which ensures the robustness of the measurements presented in this study.
In terms of body condition (BAI), our results are comparable with those provided in previous studies that applied UAS-based photogrammetric techniques to humpback whales (Bierlich et al., 2022; Ratsimbazafindranahaka et al., 2021; Russell et al., 2022, 2023, 2024; Stepanuk et al., 2021). In terms of body length, our measurements fall within the expected for the species and maturity status, however, the maximum values obtained in this study are all below 14m, far from the maximum body lengths of 15–17 m published for humpback whales (Wilson and Mittermeier, 2014). Our growth model (Figure 5A) suggested that, in Ireland, humpback whales may grow up to ~14 m (~13 – 15), which are similar values to those reported along the east coast of the US (Napoli et al., 2024; Stepanuk et al., 2021). In contrast, UAS-based photogrammetry studies like Bierlich et al. (2022) or Russell et al. (2024) did report some very large body lengths (>15m) in Antarctica and Australia, respectively, suggesting possible morphometric differences across ocean basins and/or populations. These apparent differences in body size may influence the body length at which Northeastern Atlantic humpbacks attain sexual maturity. Using a threshold of 11.47m, 36% of the individuals measured in Ireland exceeded this value and could therefore be considered mature. In contrast, the growth model suggested that 59% of Irish whales could be sexually active, assuming the generally accepted age of maturity for the species (5–7 years; Clapham, 1992). However, other studies indicate that humpback whales may mature considerably later. For instance, Gabriele et al. (2007) reported that female humpback whales off southeastern Alaska gave birth to their first calf at an average age of 11.8 years. Applying this age-based threshold to our growth model results in 36% of mature individuals in the Irish dataset, matching the proportion estimated using the 11.47m body length criterion. Future work integrating alternative age estimation methods, such as epigenetic markers (Polanowski et al., 2014; Riekkola et al., 2018), could provide a more accurate picture of age structure and maturity in Irish humpbacks, thereby improving demographic assessments in this emerging habitat.
4.2 Body condition differences across feeding and breeding grounds
We observed differences in humpback whale body condition across the areas sampled in this study, with whales measured in Cabo Verde presenting the highest body condition metrics (Figure 4; Supplementary Figure S2). However, it is important to note that the sample sizes across regions were small and unbalanced, limiting the statistical power to detect significant differences. Power analysis indicated a low probability of detecting meaningful differences given by this sample distribution, meaning that observed trends may not fully reflect real across-region variation and must be interpreted with caution.
Several studies have addressed the measurement of humpback whale body condition based on UAS photogrammetry on their breeding grounds (Christiansen et al., 2016, 2025; Russell et al., 2022, 2023, 2024; van Aswegen et al., 2024). However, these studies only used body-volume-based BCI to estimate body condition and therefore no direct comparisons can be made between those and our measurements in Cabo Verde, since the BCI calculation is dataset-specific and depends on the linear relationship of body length and body volume on the log-log scale given by the dataset utilized. To better understand if the whales observed in Cabo Verde were in optimal and “healthy” body condition for a breeding ground, further research effort in these areas would benefit from the application of directly comparable body condition indices, such as BAI.
Measurements from Cabo Verde were collected at the peak of the breeding season (March/April). On average, the humpback whales measured in this breeding ground consistently exhibited better body condition than the whales measured in Norway and Ireland. This pattern may indicate that only individuals in optimal body condition, with sufficient energy reserves, undertake the southward migration from feeding areas to breeding grounds. In contrast, others in poorer condition may remain in the feeding areas over winter (Ramm, 2020). Maintaining optimal body condition is especially important for pregnant females and nursing calves. Notably, the individuals identified as CV4 (adult female) and CV5 (nursing calf associated with CV4) showed the highest body condition metrics in the Cabo Verde dataset (Supplementary Figure S1). Christiansen et al. (2016) demonstrated that lactating females experience a significant decline in body condition throughout the breeding season. In contrast, calves generally maintain their body condition through nursing, and mother’s body condition of the mother is positively correlated with the calf’s (Christiansen et al., 2016, 2018, 2025). Similar findings have been reported by van Aswegen et al. (2024) in their study of humpback whale mother–calf pairs in Hawaii and Alaska.
In the Northeast Atlantic, humpback whales undertake one of the longest migrations within the species, covering distances of 5,000 to 9,000 km one way, and potentially facing strong energetic constraints (Kettemer et al., 2022). These constraints may be compensated, for example, by extending the feeding season (Ingman et al., 2021), accelerating migratory movements (Kettemer et al., 2022), or exploiting new or secondary feeding areas (Blázquez et al., 2023, 2024; Ramm, 2020). Therefore, it is crucial, especially for reproductive females, that feeding areas provide sufficient prey during the feeding season, minimize these constraints which may ultimately enhance their reproductive success.
Differences in body condition across different feeding grounds may indirectly reveal the ecological status of these areas and the health of their prey stocks. Offshore Norwegian waters and the Barents Sea are a well-known summer feeding ground and migration corridors for the species (Kettemer et al., 2022; Løviknes et al., 2021), especially around the islands of Jan Mayen and Bjørnøya (Bear Island). However, during the 2010s, humpback whales began to be regularly observed in a series of fjord systems along the northwest coast of mainland Norway during winter, coinciding with the Norwegian spring spawning (NSS) herring (Clupea harengus) between October and February (Costa et al., 2022; Jourdain and Vongraven, 2017; Kettemer et al., 2022; Ramm, 2020). Since then, hundreds of humpback whales feeding on this fishery have been observed in these inshore waters, with high resighting rates and residency periods exceeding three months in some cases, suggesting possible overwintering in the area (Ramm, 2021). However, telemetry studies have also shown that some individuals migrate to breeding grounds after spending time feeding in the Norwegian fjords during winter. The individuals from Norway included in this study were measured between March and May, slightly after the peak of the NSS herring season and coinciding with the end of the mating period in the North Atlantic breeding grounds (Kettemer et al., 2022; Stevick et al., 1999; Wenzel et al., 2020). The relatively high body condition measured in these individuals at this time of the year could indicate that these whales were non-breeders that overwintered in the Norwegian shores while feeding on herring. The presence of adults in this dataset also supports the idea that some mature whales do not migrate to the south during the mating season but spend winter in their feeding grounds.
Irish coastal waters have witnessed an increase in humpback whale presence in recent times. During the first decade of the 21st century, humpback whale sightings were rare, which was in line with evidence provided from local whaling records during the previous century, with only six humpbacks landed at Irish whaling stations over the first quarter of the 20th century (Ryan, 2022). However, humpback whale sightings have increased significantly since 2015 in Ireland (Blázquez et al., 2023) and more recently in Scotland (Leaper et al., 2022; O’Neil et al., 2019). Although they still occur in much smaller numbers than in other areas, high site fidelity rates and long residency times have been recorded, with some individuals consistently returning to the same areas year after year (Berrow and Whooley, 2022; Blázquez et al., in review)1.
There is also evidence that humpback whales feed on small schooling fish such as sprat in Irish waters (Fariñas-Bermejo et al., 2023; Ryan et al., 2014). However, the exact composition of humpback diet in this geographic area remains understudied and further research efforts must focus on gaining information in this regard, especially considering the commercial interest of some potential prey like herring or sprat. Overlap between whale foraging activity and fisheries may lead to conflicts and management challenges (Trites et al., 1997; Weinstein et al., 2017), including reduced feeding success in extreme cases (Guilpin et al., 2020). While direct interactions such as entanglements have received considerable attention, competition for prey remains an underrecognized but important concern (Jog et al., 2022). Understanding humpback prey preferences in Ireland is therefore critical to inform conservation efforts and protect key foraging habitats from resource depletion and disturbance. Addressing these challenges may require adaptive, area-based management strategies that integrate ecological knowledge with socio-economic and policy considerations, enabling more informed and precautionary decision-making in dynamic coastal ecosystems (Jog et al., 2022).
4.3 Age-based habitat use in Irish waters
We observed a negative correlation between the body length and the earliest first sighting of the year of each measured whale (Figure 5C). However, this trend was not yielded by the linear model with the average first sighting of the year, which produced a flat curve (Figure 5B). The former suggests that younger individuals would tend to arrive later than more mature animals. This may reflect differential migratory behaviors based on sexual maturity since many mature humpback whales would migrate to the breeding grounds in winter, returning to the feeding areas during spring and summer when the peak of humpback whale sightings occurs in Ireland (Blázquez et al., 2024). In contrast, not all the immature individuals would migrate, overwintering and feeding in colder waters (Swingle et al., 1993), and perhaps synchronizing their arrival to Irish coastal waters with the spawning of some potential prey like herring in late summer (O’Sullivan et al., 2013). The observation that younger whales appear to arrive later contrasts with migratory patterns reported in other areas, such as in Hawaii, where juveniles are generally known to arrive and depart earlier than mature individuals (Craig et al., 2003). The observed differences in migration timing based on body length (used here as a proxy for age) should be interpreted with caution. The correlation was weak when considering average arrival dates (Figure 5B), indicating high variability in the first sighting date across individual sighting histories. Importantly, the first sighting does not necessarily reflect the true date of arrival. Migration timing may also shift over time, not only as whales age, but in response to broader phenological changes driven by environmental factors such as climate change (e.g., Ingman et al., 2021; Ramp et al., 2015). Other key factors influencing humpback whale migratory patterns include sex and reproductive status, as males and females are known to exhibit migratory segregation and distinct habitat preferences (e.g., Brown et al., 1995; Craig et al., 2003). However, sex was unknown for most individuals included in this study. Together, these factors may contribute to the observed variability, particularly in the sighting histories of older whales.
We also described possible habitat preferences based on age. We observed a strong positive correlation between body length and the distance to the shore at which humpback whales were sighted (Figure 5E). This suggests that younger animals tend to be seen in more coastal areas than older humpbacks. Such behavior has been recently described by Stepanuk et al. (2021) in the New York Bight (Eastern USA) using UAS photogrammetry. This may have important implications in terms of spatial planning and marine resources management. Because young humpback whales in our study were primarily found in nearshore waters, they may be more exposed to human-sourced threats and pressures such as vessel traffic (Stepanuk et al., 2021), incidental interaction with fishing gear (Leaper et al., 2022; Read, 2008), marine tourism (Fiori et al., 2019), or offshore constructions (Bailey et al., 2014). Not many cases of dead humpback whales have been documented in Ireland (N=12 since 1893), however, all the stranded individuals recorded by the IWDG between 1992 and 2024 were juveniles (mean length = 7.64m, SD=1.40 m, Min = 6m, Max = 9m (IWDG, unpubl. data)). Considering that adult humpbacks also consistently use Irish coastal waters, the overrepresentation of young individuals in fatal strandings, highlights the vulnerability of humpback whale juveniles. Unfortunately, the exact cause of death of these stranded animals is unknown.
Vessel strikes are likely not an important threat for humpback whales’ life in Irish waters since the species occurs in small numbers (Blázquez et al., 2023), and often in areas with rather low vessel traffic density (Blázquez et al., 2024), however, incidental entanglements in fishing gear may be a potential issue which impact is not well understood in this region. One of the 12 stranded humpback whales in Irish shores had signs of entanglement (Fichefet, 2023), and a humpback whale was seen entangled in ropes in Donegal Bay (NW Ireland) in September 2023 (K. Smith, pers. comm.), although the fate of this individual is unknown. Blázquez et al. (2024) identified areas in the Irish Exclusive Economic Zone where humpback whales may be particularly exposed to fishing activity in some offshore areas of the Celtic and Irish Seas.
Despite increasing knowledge of humpback whale distribution, there is still limited information on their spatial and temporal overlap with smaller-scale coastal shellfish fisheries that use static gear such as pots. This gear type is commonly implicated in baleen whale entanglements (Johnson et al., 2005), and such risks may be heightened for juveniles, which are smaller, physically weaker, and less experienced (Cassoff et al., 2011). Notably, the mean estimated age at first sighting was 4.5 years and all the individuals that were first photo-identified and measured in the same year ranged between approximately 7 and 10m in length, with estimated ages of 1 to 6 years, corresponding to juvenile specimens (van Aswegen et al., 2024). This provides evidence that possibly most individuals enter Irish waters at a young age and may return in subsequent years as they grow. Whether they do so in the company of their mothers remains unknown, as cow–calf pairs are rarely documented in this region. While speculative, this pattern raises the possibility that juvenile humpbacks may access Irish waters independently, potentially in search of suitable and less competitive feeding opportunities. Further research, including photo-identification, photogrammetry, telemetry, and alternative aging methods, is needed to better characterize humpback whale age structure and habitat use in Irish waters, with particular attention to the vulnerability of juveniles to anthropogenic threats in coastal areas.
4.4 Intra-seasonal changes in body condition in Irish waters
Our results provide the first quantitative evidence of humpback whale feeding activity in Irish waters, with increasing body condition detected throughout the season both at the population and at the individual level. Both BAI and BCI indices follow this positive trend although it was stronger in the case of BAI (Figure 6). Average body condition was higher in 2024 compared to previous years (Supplementary Figure S3); however, this likely reflects differences in sampling dates rather than true interannual variability. The humpback whale season in Irish waters typically begins with sightings in March–April, peaks in July–August and gradually declines until a minimum is reached around January–February (Blázquez et al., 2024). In 2024, most measurements were collected later in the season (July to November; Figure 6), providing more time to the measured individuals to accumulate energy reserves. Given the positive relationship between body condition and day of the year, our results underscore the importance of aligning sampling dates across years to allow robust comparisons of inter-annual trends.
Our results add to existing evidence of high site fidelity and long residency, underscoring the importance of Irish waters for this species. Although large numbers of whales are not typically observed in the region (Blázquez et al., 2023), it may serve as an increasingly important feeding area in the Northeast Atlantic. Positioned between the Cabo Verde breeding grounds (Berrow et al., 2021) and the rich subarctic foraging areas further north, these waters may provide humpback whales with supplementary feeding opportunities to rebuild energy reserves and help mitigate the energetic costs of long migrations. Moreover, Ireland and surrounding waters may represent the final destination for some individuals. A comparable pattern has been documented in the Northeastern Pacific, where waters off California and Oregon (~34–45°N) but not farther north constitute the primary feeding area for humpbacks breeding off Central America (Rasmussen et al., 2012). Telemetry studies are needed to test these hypotheses and clarify the ecological role of Irish waters within the broader Northeast Atlantic humpback whale population.
4.5 Conclusions
Our study provides new ecological and methodological insights into humpback whale habitat use and condition in the Northeast Atlantic, with a focus on understudied regions such as Ireland and Cabo Verde. We present the first photogrammetric assessment of body size and condition for the species in these areas, thereby expanding the spatial coverage of UAS-based whale research and reinforcing the value of this approach for monitoring free-ranging baleen whales. Despite modest and uneven sample sizes, our results establish valuable baseline information that should be expanded by further research effort and demonstrate the feasibility of integrating photogrammetry with long-term photo-identification datasets.
Methodologically, our work highlights how UAS photogrammetry, coupled with rigorous data filtering, calibration, and uncertainty modeling, can yield reliable estimates of body size and condition even in remote or logistically challenging study sites. This strengthens its utility for population monitoring programs, particularly in regions where traditional survey methods are impractical.
Linking photogrammetric data with other approaches such as telemetry, stable isotope analysis, and molecular aging techniques could provide a more complete understanding of humpback whale demography, movement, and energetics. Applying similar integrated frameworks across populations will not only clarify the ecological role of Irish waters and surrounding areas but also contribute to broader efforts to assess baleen whale resilience in a rapidly changing ocean. Ultimately, these insights will inform conservation strategies aimed at safeguarding critical habitats and supporting the recovery of whale populations worldwide.
Statements
Data availability statement
The raw data supporting the conclusions of this article will be made available by the authors, without undue reservation.
Ethics statement
The requirement of ethical approval was waived by the Animal Welfare Body of the Atlantic Technological University (Dublin Road, Galway City, H91 T8NW, Ireland) for the studies involving animals because this research was considered sub-threshold under European Union (EU) Directive 2010/63/EU and was entitled to a waiver under institutional policies governing the use of animals in scientific research. The studies were conducted in accordance with the local legislation and institutional requirements.
Author contributions
MB: Conceptualization, Data curation, Formal analysis, Funding acquisition, Investigation, Methodology, Project administration, Resources, Software, Validation, Visualization, Writing – original draft, Writing – review & editing. NM: Data curation, Methodology, Resources, Supervision, Writing – review & editing. SO: Conceptualization, Data curation, Investigation, Methodology, Resources, Writing – review & editing. MH: Data curation, Methodology, Resources, Writing – review & editing. PL: Methodology, Project administration, Resources, Writing – review & editing. KF: Project administration, Resources, Writing – review & editing. PW: Resources, Supervision, Validation, Writing – review & editing. JO: Supervision, Validation, Writing – review & editing. FW: Supervision, Validation, Writing – review & editing. IO: Funding acquisition, Project administration, Resources, Supervision, Validation, Writing – review & editing. SB: Conceptualization, Funding acquisition, Investigation, Methodology, Project administration, Resources, Supervision, Validation, Writing – review & editing.
Funding
The author(s) declare financial support was received for the research and/or publication of this article. This research was financially supported by Fundación Mutua Madrileña (Madrid, Spain), the Irish Research Council of the Government of Ireland (GOIPG/2023/2754), the Marine Institute (NET/23/005 and NET/25/036), and the Irish Whale and Dolphin Group.
Acknowledgments
We are extremely grateful to all the people who contributed to the collection of the data presented in this study. We thank local observers all over the coasts of Ireland for watching and reporting humpback whale presence including but not limited to Tom Breathnach, Gemma O’Connor, Colin Barnes, John Collins, Patrick Lyne, Declan Kilgannon (Kiwi Girl Mullaghmore), and Mick Sheeran (Blasket Islands Eco Marine Tours). We especially congratulate all the people who provided their boats as research platforms for data collection, including Brendan Quinn, Gary Burrows, Sylvy Sweeney, Brendan Cottrell (Cape Clear Ferries), Seán Maguire (Fishing Adventures Ireland), Frank and Andrea Hennicke (Boa Vista Tours), Dr Terry Dawson and Helena Costa, and Whale2Sea. We thank Frances Bermingham, Muireann Berrow and Cuan Berrow for their assistance during a fieldtrip. We would also like to congratulate the staff and volunteers of BIOS Cabo Verde for their hospitality, collaboration and assistance during the fieldwork campaign in Cabo Verde especially Pablo Varona Fiestras, Anaïs Builly, and Kevin Lopes. We are very grateful to Dr Kevin C. Bierlich for his endless patience and all the advice provided for the analysis of our data, especially regarding the application of his uncertainty modeling framework. In Ireland, flights were conducted under the licenses 129/2022, 220/2023 and 072/2024 granted by the National Parks and Wildlife Service of the Government of Ireland. The UAS pilot was licensed by the Irish Aviation Authority (IRL-RP-000009538KBR). An authorization for photogrammetric data collection (N°08/DNA/2023) was granted by Ministério da Agricultura e Ambiente of the Republic of Cabo Verde. This research was financially supported by Fundación Mutua Madrileña (Madrid, Spain), the Irish Research Council of the Government of Ireland (GOIPG/2023/2754), the Marine Institute (NET/23/005), and the Irish Whale and Dolphin Group.
Conflict of interest
The authors declare that the research was conducted in the absence of any commercial or financial relationships that could be construed as a potential conflict of interest.
Generative AI statement
The author(s) declare that no Generative AI was used in the creation of this manuscript.
Any alternative text (alt text) provided alongside figures in this article has been generated by Frontiers with the support of artificial intelligence and reasonable efforts have been made to ensure accuracy, including review by the authors wherever possible. If you identify any issues, please contact us.
Publisher’s note
All claims expressed in this article are solely those of the authors and do not necessarily represent those of their affiliated organizations, or those of the publisher, the editors and the reviewers. Any product that may be evaluated in this article, or claim that may be made by its manufacturer, is not guaranteed or endorsed by the publisher.
Supplementary material
The Supplementary Material for this article can be found online at: https://www.frontiersin.org/articles/10.3389/fmars.2025.1604106/full#supplementary-material
Footnotes
1.^Blázquez, M., Whooley, P., Massett, N., O’Brien, J. M., Wenzel, F. W., O’Connor, I., et al. Humpback whale (Megaptera novaeangliae) site fidelity, residency, and movement patterns in Ireland based on citizen science data. (In review)
References
1
Agbayani S. Fortune S. M. Trites A. W. (2020). Growth and development of North Pacific gray whales (Eschrichtius robustus). J. Mammalogy101, 742–754. doi: 10.1093/jmammal/gyaa028
2
Álvarez-González M. Suarez-Bregua P. Pierce G. J. Saavedra C. (2023). Unmanned aerial vehicles (UAVs) in marine mammal research: A review of current applications and challenges. Drones7, 667. doi: 10.3390/drones7110667
3
Aoki K. Isojunno S. Bellot C. Iwata T. Kershaw J. Akiyama Y. et al . (2021). Aerial photogrammetry and tag-derived tissue density reveal patterns of lipid-store body condition of humpback whales on their feeding grounds. Proc. R. Soc. B288, 20202307. doi: 10.1098/rspb.2020.2307
4
Bailey H. Brookes K. L. Thompson P. M. (2014). Assessing environmental impacts of offshore wind farms: lessons learned and recommendations for the future. Aquat. Biosyst.10, 1–13. doi: 10.1186/2046-9063-10-8
5
Barlow D. R. Bierlich K. Oestreich W. K. Chiang G. Durban J. W. Goldbogen J. A. et al . (2023). Shaped by their environment: variation in blue whale morphology across three productive coastal ecosystems. Integr. Organismal Biol.5, obad039. doi: 10.1093/iob/obad039
6
Bernier-Graveline A. Nash S. B. Bierlich K. C. Friedlaender A. Johnston D. W. Castrillon J. et al . (2025). Drone-based photogrammetry provides estimates of the energetic cost of migration for humpback whales between Antarctica and Colombia. Mar. Mammal Sci.41, e70048. doi: 10.1111/mms.70048
7
Berrow S. D. Massett N. Whooley P. Jann B. V. Lopez-Suarez P. Stevick P. T. et al . (2021). Resightings of humpback whales (Megaptera novaeangliae) from Ireland to a known breeding ground: Cabo Verde, West Africa. Aquat. Mammals47, 63–70. doi: 10.1578/AM.47.1.2021.63
8
Berrow S. D. Whooley P. (2022). Managing a Dynamic North Sea in the light of its ecological dynamics: increasing occurrence of large baleen whales in the southern North Sea. J. Sea Res.182, 102186. doi: 10.1016/j.seares.2022.102186
9
Bierlich K. C. Hewitt J. Bird C. N. Schick R. S. Friedlaender A. Torres L. G. et al . (2021a). Comparing uncertainty associated with 1-, 2-, and 3D aerial photogrammetry-based body condition measurements of baleen whales. Front. Mar. Sci.8. doi: 10.3389/fmars.2021.749943
10
Bierlich K. C. Hewitt J. Schick R. S. Pallin L. Dale J. Friedlaender A. S. et al . (2022). Seasonal gain in body condition of foraging humpback whales along the Western Antarctic Peninsula. Front. Mar. Sci.9. doi: 10.3389/fmars.2022.1036860
11
Bierlich K. C. Kane A. Hildebrand L. Bird C. N. Fernandez Ajo A. Stewart J. D. et al . (2023). Downsized: gray whales using an alternative foraging ground have smaller morphology. Biol. Lett.19, 20230043. doi: 10.1098/rsbl.2023.0043
12
Bierlich K. C. Schick R. S. Hewitt J. Dale J. Goldbogen J. A. Friedlaender A. S. et al . (2021b). Bayesian approach for predicting photogrammetric uncertainty in morphometric measurements derived from drones. Mar. Ecol. Prog. Ser.673, 193–210. doi: 10.3354/mepS5.13814
13
Blázquez M. Massett N. Whooley P. O’Brien J. M. Wenzel F. W. O’Connor I. et al . (2023). Abundance estimates of humpback whales (Megaptera novaeangliae) in Irish coastal waters using mark-recapture and citizen science. J. Cetacean Res. Manage.24, 209–225. doi: 10.47536/jcrm.v24i1.509
14
Blázquez M. Whooley P. Massett N. Keogh H. O’Brien J. M. Wenzel F. W. et al . (2024). Distribution models of baleen whale species in the Irish Exclusive Economic Zone to inform management and conservation. Mar. Environ. Res.199, 106569. doi: 10.1016/j.marenvres.2024.106569
15
Brodie P. F. (1975). Cetacean energetics, an overview of intraspecific size variation. Ecology56, 152–161. doi: 10.2307/1935307
16
Brown M. R. Corkeron P. J. Hale P. T. Schultz K. W. Bryden M. M. (1995). Evidence for a sex-segregated migration in the humpback whale (Megaptera novaeangliae). Proc. R. Soc. London. Ser. B: Biol. Sci.259, 229–234. doi: 10.1098/rspb.1995.0034
17
Burnett J. D. Lemos L. Barlow D. Wing M. G. Chandler T. Torres L. G. (2019). Estimating morphometric attributes of baleen whales with photogrammetry from small UASs: A case study with blue and gray whales. Mar. Mammal Sci.35, 108–139. doi: 10.1111/mms.12527
18
Cassoff R. M. Moore K. M. McLellan W. A. Barco S. G. Rotstein D. S. Moore M. J. (2011). Lethal entanglement in baleen whales. Dis. Aquat. organisms96, 175–185. doi: 10.3354/dao02385
19
Champely S. Ekstrom C. Dalgaard P. Gill J. Weibelzahl S. Anandkumar A. et al . (2020). R Package “pwr”: Basic Functions for Power Analysis. R package version 1.3-0. Available online at: https://CRAN.R-project.org/package=pwr (Accessed June 2025).
20
Chittleborough R. G. (1955a). Aspects of reproduction in the male humpback whale, Megaptera nodosa (Bonnaterre). Aust. J. Mar. Freshw. Res.6, 1–29. doi: 10.1071/MF9550001
21
Chittleborough R. G. (1955b). Puberty, physical maturity, and relative growth of the female humpback whale, Megaptera nodosa (Bonnaterre), on the Western Australian Coast. Aust. J. Mar. Freshw. Res.6, 315–327. doi: 10.1071/MF9550315
22
Christiansen F. Bejder L. Burnell S. Ward R. Charlton C. (2022). Estimating the cost of growth in southern right whales from drone photogrammetry data and long-term sighting histories. Mar. Ecol. Prog. Ser.687, 173–194. doi: 10.3354/meps
23
Christiansen F. Dawson S. M. Durban J. W. Fearnbach H. Miller C. A. Bejder L. et al . (2020a). Population comparison of right whale body condition reveals poor state of the North Atlantic right whale. Mar. Ecol. Prog. Ser.640, 1–16. doi: 10.3354/meps5.13299
24
Christiansen F. Dujon A. M. Sprogis K. R. Arnould J. P. Bejder L. (2016). Noninvasive unmanned aerial vehicle provides estimates of the energetic cost of reproduction in humpback whales. Ecosphere7, e01468. doi: 10.1002/ecs5.2.1468
25
Christiansen F. Madsen P. T. Andrews-Goff V. Double M. C. How J. R. Clapham P. et al . (2025). Extreme capital breeding for giants: Effects of body size on humpback whale energy expenditure and fasting endurance. Ecol. Model.501, 110994. doi: 10.1016/j.ecolmodel.2024.110994
26
Christiansen F. Rodríguez-González F. Martínez-Aguilar S. Urbán J. Swartz S. Warick H. et al . (2021). Poor body condition associated with an unusual mortality event in gray whales. Mar. Ecol. Prog. Ser.658, 237–252. doi: 10.3354/meps5.13585
27
Christiansen F. Sprogis K. R. Gross J. Castrillon J. Warick H. A. Leunissen E. et al . (2020b). Variation in outer blubber lipid concentration does not reflect morphological body condition in humpback whales. J. Exp. Biol.223, jeb213769. doi: 10.1242/jeb.213769
28
Christiansen F. Vivier F. Charlton C. Ward R. Amerson A. Burnell S. et al . (2018). Maternal body size and condition determine calf growth rates in southern right whales. Mar. Ecol. Prog. Ser.592, 267–281. doi: 10.3354/meps5.12522
29
Clapham P. J. (1992). Age at attainment of sexual maturity in humpback whales, Megaptera novaeangliae. Can. J. Zoology70, 1470–1472. doi: 10.1139/z92-202
30
Clapham P. J. (1996). The social and reproductive biology of humpback whales: an ecological perspective. Mammal Rev.26, 27–49. doi: 10.1111/j.1365-2907.1996.tb00145.x
31
Cohen J. (1977). Statistical power analysis for the behavioral sciences ( Routledge, New York, USA).
32
Costa H. Rogan A. Zadra C. Larsen O. Rikardsen A. H. Waugh C. (2022). Blowing in the wind: Using a consumer drone for the collection of humpback whale (Megaptera novaeangliae) blow samples during the Arctic polar nights. Drones7, 15. doi: 10.3390/drones7010015
33
Craig A. S. Herman L. M. Gabriele C. M. Pack A. A. (2003). Migratory timing of humpback whales (Megaptera novaeangliae) in the central North Pacific varies with age, sex and reproductive status. Behaviour140, 981–1001. doi: 10.1163/156853903322589605
34
Dawson S. M. Bowman M. H. Leunissen E. Sirguey P. (2017). Inexpensive aerial photogrammetry for studies of whales and large marine animals. Front. Mar. Sci.4. doi: 10.3389/fmars.2017.00366
35
Durban J. W. Fearnbach H. Barrett-Lennard L. G. Perryman W. L. Leroi D. J. (2015). Photogrammetry of killer whales using a small hexacopter launched at sea. J. Unmanned Vehicle Syst.3, 131–135. doi: 10.1139/juvs-2015-0020
36
Durban J. W. Parsons K. M. (2006). Laser-metrics of free-ranging killer whales. Mar. Mammal Sci.22, 735–743. doi: 10.1111/j.1748-7692.2006.00068.x
37
Fariñas-Bermejo A. Berrow S. Gras M. O’Donnell C. Valavanis V. Wall D. Pierce G. J. . (2023). Response of cetaceans to fluctuations of pelagic fish stocks and environmental conditions within the Celtic Sea ecosystem. Frontiers in Marine Science10, 1033758. doi: 10.3389/fmars.2023.1033758
38
Fichefet J. (2023). Assessing the risk of whale entanglement in pot fisheries in Irish waters. Master thesis submitted to Ghent University for the partial fulfilment of the Master of Science in Marine Biological Resources (IMBRSea). Ghent University, Ghent, Belgiumpp50.
39
Fiori L. Martinez E. Orams M. B. Bollard B. (2019). Effects of whale-based tourism in Vava’u, Kingdom of Tonga: Behavioural responses of humpback whales to vessel and swimming tourism activities. PloS One14, e0219364. doi: 10.1371/journal.pone.0219364
40
Gabriele C. M. Amundson C. L. Neilson J. L. Straley J. M. Baker C. S. Danielson S. L. (2022). Sharp decline in humpback whale (Megaptera novaeangliae) survival and reproductive success in southeastern Alaska during and after the 2014–2016 Northeast Pacific marine heatwave. Mamm. Biol.102, 1113–1131. doi: 10.1007/s42991-021-00187-2
41
Gabriele C. M. Straley J. M. Neilson J. L. (2007). “ Age at first calving of female humpback whales in Southeastern Alaska,” in Proceedings of the Fourth Glacier Bay Science Symposium. Eds. PiattJ. F.GendeS. M. ( U.S. Geological Survey Scientific Investigations Report 2007-5047, Juneau, Alaska, USA), 159–162. October 26–28, 2004.
42
Glarou M. Gero S. Frantzis A. Brotons J. M. Vivier F. Alexiadou P. et al . (2023). Estimating body mass of sperm whales from aerial photographs. Mar. Mammal Sci.39, 251–273. doi: 10.1111/mms.12982
43
Guilpin M. Lesage V. McQuinn I. Brosset P. Doniol-Valcroze T. Jeanniard-du-Dot T. et al . (2020). Repeated vessel interactions and climate-or fishery-driven changes in prey density limit energy acquisition by foraging blue whales. Front. Mar. Sci.7. doi: 10.3389/fmars.2020.00626
44
Hedges L. V. (1981). Distribution theory for Glass’s estimator of effect size and related estimators. J. Educ. Stat6, 107–128. doi: 10.3102/10769986006002107
45
Ingman K. Hines E. Mazzini P. L. Rockwood R. C. Nur N. Jahncke J. (2021). Modeling changes in baleen whale seasonal abundance, timing of migration, and environmental variables to explain the sudden rise in entanglements in California. PloS One16, e0248557. doi: 10.1371/journal.pone.0248557
46
Jog K. Sutaria D. Diedrich A. Grech A. Marsh H. (2022). Marine mammal interactions with fisheries: review of research and management trends across commercial and small-scale fisheries. Front. Mar. Sci.9. doi: 10.3389/fmars.2022.758013
47
Johnson A. Salvador G. Kenney J. Robbins J. Kraus S. Landry S. et al . (2005). Fishing gear involved in entanglements of right and humpback whales. Mar. Mammal Sci.21, 635–645. doi: 10.1111/j.1748-7692.2005.tb01256.x
48
Jourdain E. Vongraven D. (2017). Humpback whale (Megaptera novaeangliae) and killer whale (Orcinus orca) feeding aggregations for foraging on herring (Clupea harengus) in Northern Norway. Mamm. Biol.86, 27–32. doi: 10.1016/j.mambio.2017.03.006
49
Kettemer L. E. Rikardsen A. H. Biuw M. Broms F. Mul E. Blanchet M. A. (2022). Round-trip migration and energy budget of a breeding female humpback whale in the Northeast Atlantic. PloS One17, e0268355. doi: 10.1371/journal.pone.0268355
50
Koopman H. N. Pabst D. A. Mclellan W. A. Dillaman R. M. Read A. J. (2002). Changes in blubber distribution and morphology associated with starvation in the harbor porpoise (Phocoena phocoena): evidence for regional differences in blubber structure and function. Physiol. Biochem. Zoology75, 498–512. doi: 10.1086/342799
51
Leaper R. MacLennan E. Brownlow A. Calderan S. V. Dyke K. Evans P. G. et al . (2022). Estimates of humpback and minke whale entanglements in the Scottish static pot (creel) fishery. Endangered Species Res.49, 217–232. doi: 10.3354/esr01214
52
Lemos L. S. Burnett J. D. Chandler T. E. Sumich J. L. Torres L. G. (2020). Intra-and inter-annual variation in gray whale body condition on a foraging ground. Ecosphere11, e03094. doi: 10.1002/ecs5.2.3094
53
Lockyer C. (1981). Growth and energy budgets of large baleen whales from the Southern Hemisphere. Food Agric. Organ.3, 379–487.
54
Løviknes S. Jensen K. H. Krafft B. A. Anthonypillai V. Nøttestad L. (2021). Feeding hotspots and distribution of fin and humpback whales in the Norwegian Sea from 2013 to 2018. Front. Mar. Sci.8. doi: 10.3389/fmars.2021.632720
55
Marine Notice No. 15 of 2005 . (2005). Guidelines for correct procedures when encountering whales and dolphins in Irish coastal waters ( Department of Communications, Marine and Natural Resources, Government of Ireland, Dublin, Ireland).
56
Napoli C. Hirtle N. Stepanuk J. Christiansen F. Heywood E. I. Grove T. J. et al . (2024). Drone-based photogrammetry reveals differences in humpback whale body condition and mass across North Atlantic foraging grounds. Front. Mar. Sci.11. doi: 10.3389/fmars.2024.1336455
57
O’Neil K. E. Cunningham E. G. Moore D. M. (2019). Sudden seasonal occurrence of humpback whales Megaptera novaeangliae in the Firth of Forth, Scotland and first confirmed movement between high-latitude feeding grounds and United Kingdom waters. Mar. Biodiversity Records12, 12. doi: 10.1186/s5.41200-019-0172-7
58
O’Sullivan D. O’Keefe E. Berry A. Tully O. Clarke M. (2013). An inventory of Irish herring spawning grounds ( Marine Institute, Oranmore, Co. Galway, Ireland), 38pp.
59
Pallin L. Bierlich K. C. Durban J. Fearnbach H. Savenko O. Baker C. S. et al . (2022). Demography of an ice-obligate mysticete in a region of rapid environmental change. R. Soc. Open Sci.9, 220724. doi: 10.1098/rsos.220724
60
Perryman W. L. Lynn M. S. (1993). Identification of geographic forms of common dolphin (Delphinus delphis) from aerial photogrammetry. Mar. Mammal Sci.9, 119–137. doi: 10.1111/j.1748-7692.1993.tb00438.x
61
Pirotta E. Bierlich K. C. New L. Hildebrand L. Bird C. N. Fernandez Ajó A. et al . (2024). Modeling individual growth reveals decreasing gray whale body length and correlations with ocean climate indices at multiple scales. Global Change Biol.30, e17366. doi: 10.1111/gcb.17366
62
Plummer M. (2003). “ JAGS: A program for analysis of Bayesian graphical models using Gibbs sampling,” in Proceedings of the 3rd international workshop on distributed statistical computing, (eds) HornikK.ZeileisA.The workshop was organized jointly by the Austrian Association for Statistical Computing (AASC) and the R Foundation for Statistical Computing at the Technische Universität Wien in Vienna, AustriaVienna, Austria Vol. 124. 1–10.
63
Polanowski A. M. Robbins J. Chandler D. Jarman S. N. (2014). Epigenetic estimation of age in humpback whales. Mol. Ecol. Resour.14, 976–987. doi: 10.1111/1755-0998.12247
64
Ramm T. (2020). Hungry during migration? Humpback whale movement from the Barents Sea to a feeding stopover in northern Norway revealed by photo-ID analysis. Master’s thesis, UiT Norges arktiske universitet, Tromsø, Norway.
65
Ramp C. Delarue J. Palsbøll P. J. Sears R. Hammond P. S. (2015). Adapting to a warmer ocean—seasonal shift of baleen whale movements over three decades. PloS One10, e0121374. doi: 10.1371/journal.pone.0121374
66
Rasmussen K. Calambokidis J. Steiger G. H. (2012). Distribution and migratory destinations of humpback whales off the Pacific coast of Central America during the boreal winters of 1996–2003. Mar. Mammal Sci.28, E267–E279. doi: 10.1111/j.1748-7692.2011.00529.x
67
Ratsimbazafindranahaka M. Razafimahatratra E. Mathevet R. Adam O. Huetz C. Charrier I. et al . (2021). Morphometric study of humpback whale mother-calf pairs in the Sainte Marie channel, Madagascar, using a simple drone-based photogrammetric method. Western Indian Ocean J. Mar. Sci.20, 95–107. doi: 10.4314/wiojms.v20i2.8
68
Read A. J. (2008). The looming crisis: interactions between marine mammals and fisheries. J. Mammalogy89, 541–548. doi: 10.1644/07-MAMM-S-315R1.1
69
Riekkola L. Zerbini A. N. Andrews O. Andrews-Goff V. Baker C. S. Chandler D. et al . (2018). Application of a multi-disciplinary approach to reveal population structure and Southern Ocean feeding grounds of humpback whales. Ecol. Indic.89, 455–465. doi: 10.1016/j.ecolind.2018.02.030
70
Russell G. Cagnazzi D. Colefax A. Sprogis K. R. Christiansen F. (2024). Cost of migration and migratory timing in Western Australian humpback whales. Mar. mammal Sci.40, e13074. doi: 10.1111/mms.13074
71
Russell G. Christiansen F. Colefax A. Sprogis K. R. Cagnazzi D. (2023). Comparisons of morphometrics and body condition between two breeding populations of Australian humpback whales. Wildlife Res.51, WR23026. doi: 10.1071/WR23026
72
Russell G. Colefax A. Christiansen F. Russell G. Fowler Z. Cagnazzi D. (2022). Body condition and migration timing of east Australian humpback whales. Mar. Ecol. Prog. Ser.692, 169–183. doi: 10.3354/meps5.14075
73
Ryan C. (2022). Insights into the biology and ecology of whales in Ireland 100 years ago from archived whaling data. Irish Naturalists’ J.39, 24–35.
74
Ryan C. Berrow S. D. McHugh B. O’Donnell C. Trueman C. N. O’Connor I. (2014). Prey preferences of sympatric fin (Balaenoptera physalus) and humpback (Megaptera novaeangliae) whales revealed by stable isotope mixing models. Mar. Mammal Sci.30, 242–258. doi: 10.1111/mms.12034
75
Spitz S. S. Herman L. M. Pack A. A. (2000). Measuring sizes of humpback whales (Megaptera novaeangliae) by underwater videogrammetry. Mar. Mammal Sci.16, 664–676. doi: 10.1111/j.1748-7692.2000.tb00962.x
76
Stepanuk J. E. Heywood E. I. Lopez J. F. DiGiovanni R. A. Jr. Thorne L. H. (2021). Age-specific behavior and habitat use in humpback whales: implications for vessel strike. Mar. Ecol. Prog. Ser.663, 209–222. doi: 10.3354/meps5.13638
77
Stevick P. T. Øien N. Mattila D. K. (1999). Migratory destinations of humpback whales from Norwegian and adjacent waters: Evidence for stock identity. J. Cetacean Res. Manage.1, 147–152. doi: 10.47536/jcrm.v1i2.461
78
Su Y. Yajima M. (2024). R2jags: Using R to Run ‘JAGS’. R package version 0.8-9. Available online at: https://CRAN.R-project.org/package=R2jags (Accessed September 2025).
79
Swingle W. M. Barco S. G. Pitchford T. D. Mclellan W. A. Pabst D. A. (1993). Appearance of juvenile humpback whales feeding in the nearshore waters of Virginia. Mar. Mammal Sci.9, 309–315. doi: 10.1111/j.1748-7692.1993.tb00458.x
80
Torres W. I. Bierlich K. C. (2020). MorphoMetriX: a photogrammetric measurement GUI for morphometric analysis of megafauna. J. Open Source Software5, 1825. doi: 10.21105/joss.01825
81
Torres L. G. Bird C. N. Rodríguez-González F. Christiansen F. Bejder L. Lemos L. et al . (2022). Range-wide comparison of gray whale body condition reveals contrasting sub-population health characteristics and vulnerability to environmental change. Front. Mar. Sci.9. doi: 10.3389/fmars.2022.867258
82
Trites A. W. Christensen V. Pauly D. (1997). Competition between fisheries and marine mammals for prey and primary production in the Pacific Ocean. J. Northwest Atlantic Fishery Sci.22, 173–187. doi: 10.2960/J.v22.a14
83
van Aswegen M. Szabo A. Currie J. J. Stack S. H. Evans L. Straley J. et al . (2024). Maternal investment, body condition and calf growth in humpback whales. J. Physiol551–578. doi: 10.1113/JP287379
84
Weinstein B. G. Double M. Gales N. Johnston D. W. Friedlaender A. S. (2017). Identifying overlap between humpback whale foraging grounds and the Antarctic krill fishery. Biol. Conserv.210, 184–191. doi: 10.1016/j.biocon.2017.04.014
85
Wenzel F. W. Broms F. López-Suárez P. Lopes K. Veiga N. Yeoman K. et al . (2020). Humpback whales (Megaptera novaeangliae) in the Cape Verde Islands: Migratory patterns, resightings, and abundance. Aquatic Mammals46, 21–31. doi: 10.1578/AM.46.1.2020.21
86
Whitehead H. Payne R. (1978). New techniques for assessing populations of right whales without killing them. Mammals Seas: Rep.3, 189.
87
Wilson D. E. Mittermeier R. A. (Eds.) (2014). “ Handbook of the mammals of the world,” in Sea Mammals, vol. 4 ( Lynx Edicions, Barcelona, Spain).
Summary
Keywords
humpback whale (Megaptera novaeangliae), UAS (Uncrewed Aerial Systems or drones), body length, body condition, Ireland, Cabo Verde, Norway, Northeastern Atlantic Ocean
Citation
Blázquez M, Massett N, O’Callaghan S, Hogan M, López-Suárez P, Lopes K, Whooley P, O’Brien JM, Wenzel FW, O’Connor I and Berrow SD (2025) Humpback whale (Megaptera novaeangliae) maturity and body condition in Ireland, Norway and Cabo Verde based on UAS photogrammetry data. Front. Mar. Sci. 12:1604106. doi: 10.3389/fmars.2025.1604106
Received
01 April 2025
Accepted
14 October 2025
Published
19 November 2025
Volume
12 - 2025
Edited by
Rebecca Dunlop, The University of Queensland, Australia
Reviewed by
Kc Bierlich, Oregon State University, United States
Julia Stepanuk, State of Maine Department of Marine Resources, United States
Updates
Copyright
© 2025 Blázquez, Massett, O’Callaghan, Hogan, López-Suárez, Lopes, Whooley, O’Brien, Wenzel, O’Connor and Berrow.
This is an open-access article distributed under the terms of the Creative Commons Attribution License (CC BY). The use, distribution or reproduction in other forums is permitted, provided the original author(s) and the copyright owner(s) are credited and that the original publication in this journal is cited, in accordance with accepted academic practice. No use, distribution or reproduction is permitted which does not comply with these terms.
*Correspondence: Miguel Blázquez, miguel.blazquezhervas@gmail.com
Disclaimer
All claims expressed in this article are solely those of the authors and do not necessarily represent those of their affiliated organizations, or those of the publisher, the editors and the reviewers. Any product that may be evaluated in this article or claim that may be made by its manufacturer is not guaranteed or endorsed by the publisher.