Abstract
Introduction:
Controlling over-tourism has emerged as a pressing concern, attracting significant recent attention. Investigating this issue through the analysis of the impacts of marine green energy investment (MGEI), fintech (FT), and tourism concentration (TC) on carbon footprint (CF) and coastal water pollution (CWP) at tourist destinations is crucial.
Methods:
This study employs the Spatial Method of Moment Quantile Regression (SMMQR) model to examine the effects of these indicators on two environmental metrics in coastal regions of China, validated through Moran's I analysis, Local Indicators of Spatial Association (LISA) Cluster Maps, and robustness checks.
Results:
Results reveal strong positive spatial autocorrelation, with dominant High-High (HH) clusters for both environmental indicators, concentrated in areas such as Shanghai, Guangzhou, and Sanya, indicating significant environmental pressures. TC and FT exacerbate CF (6.215-13.185 and 0.715-2.110) and CWP (5.210-10.145 and 2.045-4.570), whereas MGEI exhibits mixed CF (-3.078-4.042) and CWP impacts (-3.038-6.858), driven by spatial dependencies ranging from 0.275-0.312.
Discussion:
These findings bolster recent research on tourism and FT's environmental impacts, expanding the analysis by incorporating spatial dynamics and investment, and pinpointing over-tourism risks in high-impact areas. The study proposes setting an over-tourism threshold to better manage this issue moving forward.
1 Introduction
Over-tourism has recently been considered an increasing global issue. The phenomenon is not only overcrowding but also reflects a complicated interaction of spatial, financial, and infrastructural pressures that threaten the sustainability of tourism-dependent regions. It causes several negative effects on unsustainable tourist flows, the environment, socio-cultural disruption, and economic imbalances (Capocchi et al., 2019; Zemła, 2020). One of the oldest historic sites, Venice, receives more than 24 million visitors annually and is losing about a thousand residents per year, so-called “Ven-exodus” (Csmonitor, 2016). This results in overcapacity in numerous historic squares and mobility challenges for people. Furthermore, large cruise ships contribute to emissions and damage to the historical surrounding ecosystem. To address this issue, a ban on ships exceeding 25,000 tons has been implemented as of 2021. However, transport and waste management are still heavily overloaded. With over 10 million tourists per year, Barcelona is an overcrowded destination. This city has been struggling with the anti-tourism riots since 2017. The influx has led to skyrocketing housing prices and living costs, largely fueled by the transformation of residential properties into rentals. Central areas such as La Rambla and Park Güell suffer from severe overcrowding, prompting measures such as a daily visitor cap of 800 at Park Güell and a restriction on tour groups to fewer than 15 people at La Boqueria market in order to alleviate congestion (Gholipour et al., 2024). In China, the marine tourism sector is no exception to the strain of large tourist crowds. The unsustainable volumes of tourists overwhelming local infrastructure and ecosystems (Gupta and Chomplay, 2021) have been particularly pronounced in hotspots such as Hainan, Xiamen, and Zhoushan Archipelago. The rapid expansion of tourism, driven by economic growth, digital financial services, and improved marine green energy investment (MGEI), has sped up environmental degradation by enlarging the carbon footprint (CF) (Ehigiamusoe et al., 2023) and aggravating coastal water pollution (CWP). Despite the intricate connection between over-tourism and environmental sustainability, the latter is still inadequately accounted for in the marine tourism sector of China.
China’s coastal hotspots are buzzing with tourists, thriving economies, and exciting new tech, but this boom comes with serious environmental headaches. Based on Ecological Modernization Theory (EMT), with smart tech and policies, we do not have to pick between a strong economy and a clean environment but can have both (Chatti and Majeed, 2022). In our study, this means tools like fintech (FT) and MGEI can help reduce the environmental toll of packed tourist destinations by using resources more wisely. On the other hand, the Environmental Kuznets Curve (EKC) illustrates where tourism’s rapid growth may initially harm the environment, exhaust more carbon emissions, and pollute coastal waters, but as regions get wealthier and adopt greener technologies, these impacts can shrink (Ochoa-Moreno et al., 2022). This idea fits China’s coastal tourism scene perfectly, where booming visitor numbers can strain local ecosystems, but investments in green tech and digital finance may turn the tide. By weaving these theories into our analysis, we aim to uncover how FT, green energy, and tourism concentration (TC) interact across different regions, offering practical ideas for sustainable tourism that balances growth with a healthier planet.
Existing literature has linked over-tourism with numerous environmental stressors. Over-tourism, accommodations, and leisure activities are the major contributors to increased CO2 emissions (Raihan, 2024), while inadequate waste treatment contributes to ocean pollution (Pásková et al., 2024). Furthermore, coastal over-development, sometimes fueled by FT-facilitated investment, has added to habitat destruction and water pollution. Despite these detected impacts, the existing literature is largely lacking a spatially explicit and quantile-based approach to understanding how TC, FT development, and marine green energy spending together influence environmental sustainability in oceanic destinations (Li et al., 2024; Ran et al., 2024). Studies note the severity of mass tourist invasions overwhelming local ecosystems and diminishing the quality of life for locals (Fischer-Kowalski et al., 2020). The overall number of tourist trips is projected to hit 37.4 billion, with 17.4 billion consisting of international and domestic overnight stays (UNWTO, 2022). Understanding and addressing over-tourism has become a research priority of the highest order. Yet, despite its significance, the literature remains rare and fragmented (Capocchi et al., 2019), with a minimal synthesis of interdisciplinary perspectives that hold promise for delivering holistic solutions.
The objective of this study is to employ an SMMQR (Spatial Method of Moments Quantile Regression) model that integrates spatial analysis and quantile regression to examine heterogeneous effects at various levels of carbon emissions and water pollution. The model enables a detailed analysis of whether FT adoption lowers or heightens the environmental expense of over-tourism, if MGEI realizes sustainable tourism growth, and how TC worsens environmental degradation at various quantiles. By leveraging high-resolution geospatial data and panel econometric analysis, the paper contributes to the current discourse of over-tourism management and environmental governance in China’s coastal regions. The findings aim to inform policymakers and stakeholders on how best to streamline FT-driven tourism finance, balance MGEI, and implement sustainable tourism policies to reduce the adverse environmental effects of over-tourism.
2 Literature review
2.1 Theoretical frameworks
This study is derived from EMT and EKC frameworks, where EMT argues that environmental degradation can be decoupled from economic growth through technological innovation, institutional reforms, and market-based solutions. In the context of coastal tourism, EMT suggests that FT, such as digital payment systems and blockchain-based crowd management, can enhance resource efficiency and reduce the environmental footprint of tourism activities (Siddik et al., 2023). Similarly, MGEI, including investments in renewable energy infrastructure like tidal or wind energy, aligns with EMT by promoting sustainable tourism infrastructure that mitigates CF and coastal water pollution (CWP). However, EMT also acknowledges potential challenges, such as over-reliance on technology without addressing spatial or social inequalities, which this study addresses through the spatially explicit SMMQR model.
The EKC framework complements EMT by hypothesizing an inverted U-shaped relationship between economic growth and environmental degradation. In the context of China’s coastal regions, the EKC suggests that initial tourism growth, driven by TC and facilitated by FT, may increase CF due to higher energy consumption and waste generation (Fethi and Senyucel, 2021). However, as regions reach higher income levels or adopt advanced technologies, environmental impacts may decline. This aligns with findings from Yang and Tang (2024), who noted that FT could mitigate CWP through the use of advanced wastewater management systems. Yet, the EKC’s applicability to over-tourism remains underexplored, particularly in terms of spatial dependencies and quantile-specific effects, which are critical in heterogeneous coastal regions like Sanya and Shanghai. The SMMQR model bridges this gap by capturing spatial autocorrelation and distributional heterogeneity, allowing us to test whether FT and MGEI enable an EKC-like trajectory in high-tourism areas. Additionally, to utilize the insightful benefit of spatial effect, our integration of EMT and EKC with the SMMQR model provides a comprehensive lens to examine how spatial clustering and technological interventions shape the environmental consequences of over-tourism in China’s coastal tourism economy.
2.2 Relevant studies on over-tourism
Some scholars have reviewed recent studies relating to “over-tourism” and indicated that this concept is still in the early stages and currently lacks a standardized, recognized characterization (Capocchi et al., 2019; Dilshan and Nakabasami, 2025). When the number of tourists exceeds a location’s carrying capacity, it tends to expose the shortcomings of existing infrastructure, including transport networks, waste management systems, and accommodations (Barbhuiya, 2021). A recent study assessed over-tourism in Granada, Spain, using 1,349 negative TripAdvisor reviews of 71 attractions. The findings stressed sustainable management measures, destination diversification, a better transportation network, and access control to mitigate heavily touristified areas (Foronda-Robles et al., 2025). Another study was conducted based on surveys and observations in Salinas, Manta, and the Galapagos, which found post-COVID-19 ecological improvements and recommended expanding such opportunities (Ormaza-Gonzaìlez et al., 2021). In the recent past, among the rapidly evolving variables, FT has been studied to assess its influence on environmental metrics. Several studies indicated that FT exerted a considerable energy use intensity-lowering impact through enhancing transaction efficiency with heterogeneous effects on different quantiles of economic activity (Zhu et al., 2024; Muhammad et al., 2022; Fan et al., 2024). Hwang et al. (2021) linked FT-driven tourism services to increased CO2 emissions, while Yang and Tang (2024) extended this to coastal pollution, noting its dual role in exacerbating and mitigating environmental stress. Kai et al. (2024) and Leng et al. (2024) further confirmed FT’s role in lowering emission intensity via marine green financing and technological innovation in China and BRICS countries, respectively. However, these studies did not address TC or incorporate spatial factors like autocorrelation, leaving a gap that this research aims to fill using SMMQR. However, the inclusion of this variable in research models examining the issue of over-tourism is very limited. The proliferation of digital payment systems, peer-to-peer booking sites, and real-time travel apps has opened up tourism access, often exacerbating crowding in already congested destinations (Suyunchaliyeva et al., 2021). For instance, FT-enabled platforms like Airbnb have been linked to increasing tourism density in urban areas by expanding the supply of housing beyond traditional regulatory oversight (Gurran and Phibbs, 2017; García-Amaya et al., 2021). However, the potential of FT as a management tool, e.g., via dynamic pricing or crowd control enabled by blockchain, is mostly unexplored. This is a fundamental research lacuna, as FT’s dual potential to both intensify and alleviate over-tourism warrants systematic investigation, particularly in technology-adopting destinations.
One of the less explored dimensions of over-tourism is TC, or the spatial and temporal concentration of tourists in specific destinations. While metrics such as tourist density and tourist-to-population ratios have been employed to quantify concentration (Yang, 2012; Fernandes et al., 2020), their application has been largely descriptive rather than predictive. Few studies have employed econometric specifications to investigate how concentration varies between heterogeneous areas or influences over-tourism thresholds. This gap is more significant in emerging tourism destinations (Banerjee and George, 2024). Addressing this shortfall is imperative to devising targeted interventions that redistribute tourist flows and alleviate pressure from strained destinations. Over-tourism significantly contributes to CWP through excessive water consumption, massive waste generation, and improper waste management, as seen in destinations like Shimla, India (Gupta and Chomplay, 2021). Breiby et al. (2021) noted that sustainability assessments often use limited indicators, overlooking the complex impacts of over-tourism on CWP. There is a notable lack of detailed quantitative research correlating over-tourism with CWP, hindering effective policy development. While Yang and Tang (2024) suggested FT could mitigate CWP, this paper has not exploited the over-tourism perspective. A few recent studies suggested a significant interrelation between these two factors. Using panel cointegration tests, Ji and Ding (2024) found a sustained link between coastal tourism and four marine pollutants in China, with limited environmental benefits in low- and middle-income or northern regions.
Another fundamental yet understudied impact is MGEI, as both a constraint and an enabler of over-tourism. The literature already alludes to how inadequate transport, waste, and accommodation systems exacerbate the negative impacts of mass tourism (Kukreti and Dangwal, 2023). In contrast, resilient MGEI can increase carrying capacity and more equitably spread tourist pressures. Despite this reality, there is little quantitative assessment of the dynamic interplay between TC, marine green energy capacity, and over-tourism effects, especially for developing economies where resource constraints are acute. This neglect limits policymakers’ ability to invest in prioritization, trading off economic returns for sustainability, which underscores the need for empirical models featuring those variables. Studies emphasized how infrastructural poverty aggravated environmental decay and diminished the quality of life for residents of over-touristed areas (Li et al., 2023), while Kumail et al. (2023) argued that efficient MGEI could reduce such effects via capacity expansion and redistributing tourism flows. For instance, improved public transportation systems have been shown to minimize traffic congestion in inner-city tourist areas, but these investments are only as useful as the geographical, economic, and policy constraints of a specific location. On the other hand, over-investment or poorly planned marine green energy spending in the form of too many hotels can prolong over-tourism by attracting more tourists beyond sustainable levels (Tavor, 2024). However, empirical research quantifying the causal effects of marine green energy spending on over-tourism impacts is scarce, particularly in developing nations where resource capacity is limited and tourism development is intense. Such scarcity hampers the creation of evidence-based policy, underlining the need for integrated models that analyze how MGEI balances economic benefits against the threats of over-tourism.
2.3 MMQR and SMMQR in research on over-tourism
Recent researchers have employed the MMQR to explore the complex influences of FT, infrastructure, and tourism on environmental outcomes, with the principal target of analysis being CO2 emissions. As an example, MMQR was applied to present the impacts of FT innovations, such as digital payment systems, on various quantiles of economic activity and energy consumption, and CO2 emissions, with non-linear effects unaddressed by naive mean-based measures (Shan et al., 2024). Similarly, Shahbaz and Patel (2024) applied MMQR to examine the differential effects of infrastructure development, transport networks, and energy systems on carbon emissions, segregating different effects in high- versus low-emission environments.
In tourism research, Zhan (2024) applied MMQR to link tourist visits and CO2 emissions and reported large heterogeneity in emission distributions. There are very few studies that have employed MMQR to apply it to CWP (Yang and Tang, 2024), linking tourism growth with marine ecosystem deterioration. The authors utilized the method of the MMQR model to examine how green fiscal policy, tourism, and FT affect CO2 emissions and coastal water quality. The authors found that GFP and FT play a crucial role in enhancing CWP while also lowering CO2 levels.
These studies generally do not consider the TC, spatial, and temporal agglomeration of tourists as one of the leading environmental drivers. Besides, the geographical considerations, including spatial autocorrelation and heterogeneity among regions, remain unexploited due to a lack of spatially integrated methods. This study bridges such gaps using the SMMQR that not only detects distributional heterogeneity but also detects spatial dependencies through weighted moment conditions. The power of SMMQR lies in its spatial robustness and ability to model spatially heterogeneous relationships between quantiles, offering a more comprehensive and context-dependent framework for how FT, MGEI, and TC all impact environmental outcomes within a wide range of different spatial settings.
This study addresses these gaps through three key contributions. From a theoretical perspective, by integrating EMT and EKC, this study provides a robust framework to understand how technological innovations and economic growth interact with environmental outcomes (CF and CWP). EMT supports the hypothesis that FT and MGEI can mitigate over-tourism’s impacts through efficient resource use, while EKC posits a potential decline in environmental degradation as regions adopt greener technologies. This dual framework extends prior studies by grounding the analysis in theories that account for both technological and economic dynamics. In methodological contribution, the SMMQR model advances beyond traditional mean-based approaches by capturing spatial spillover effects and heterogeneity across quantiles of CF and CWP. Finally, this study provides empirical contributions by examining TC, FT, and MGEI in China’s coastal tourism sector. The LISA Cluster Maps identify HH clusters in high-impact zones, guiding targeted policy interventions. The SMMQR results reveal heterogeneous impacts, such as MGEI’s negative effect on CWP at lower quantiles and positive effect at higher quantiles, offering insights for sustainable tourism management.
3 Methodologies
3.1 Data description and preprocessing
The present study employs a quantitative study design to investigate China’s sea tourism sector issue of over-tourism and its effects on the environment, i.e., CF and CWP, respectively. Spatial analysis is blended with the MMQR model in the analysis to confront both spatial dependencies and heterogeneity in the distribution of the dependent variables. By this integrating approach, this paper can explore the diverse impacts of FT development, MGEI, and tourism intensity on the environment, and identify the nature of over-tourism at the provincial level (see Figure 1).
Figure 1
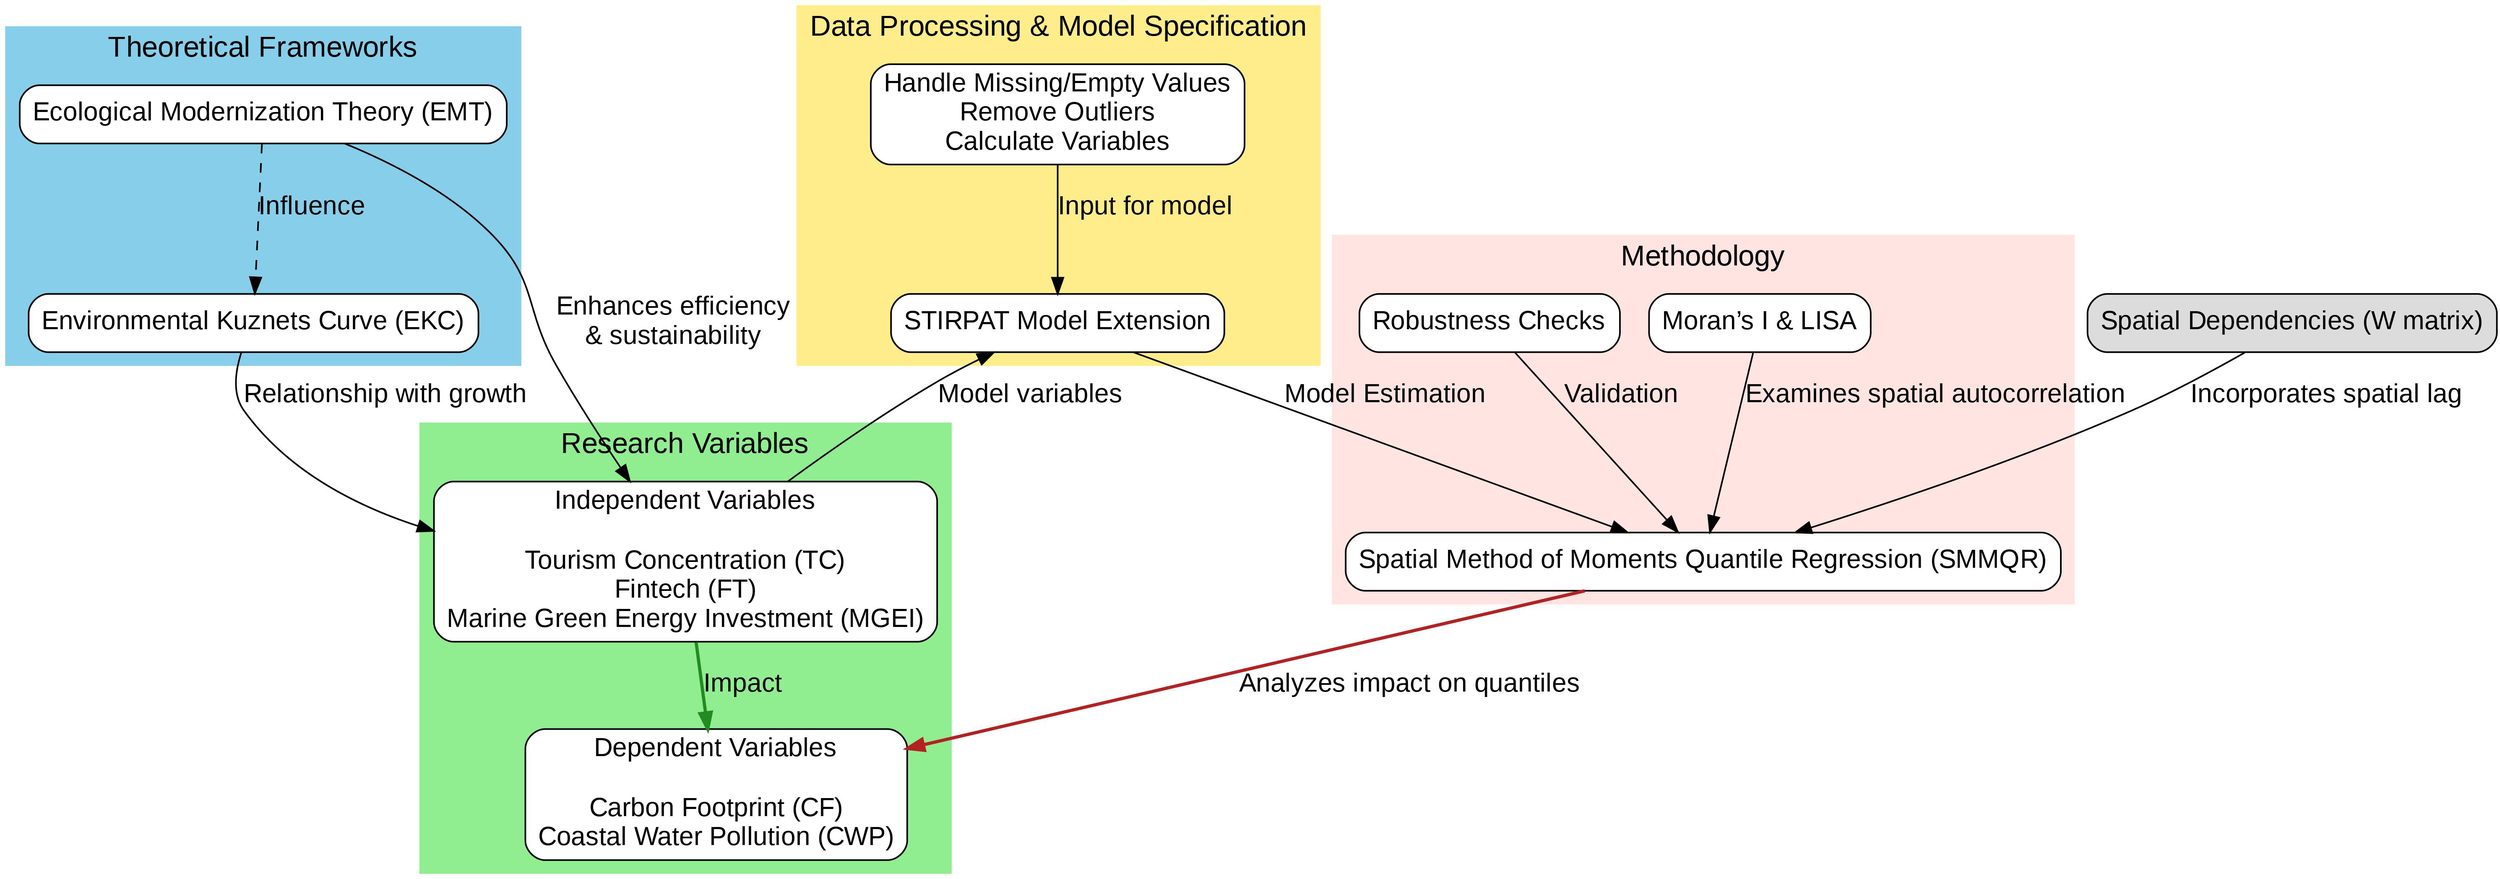
Research framework.
The research utilizes panel data of China’s coastal provinces and municipalities between 2010 and 2022, a period selected to reflect the rapid expansion in marine tourism, FT adoption, and marine green energy expenditure in China (see Supplementary Material). The present study employs a quantitative study design to investigate China’s sea tourism sector issue of over-tourism and its effects on the environment, i.e., CF and CWP, respectively. The SMMQR model can confront both spatial dependencies and heterogeneity in the distribution of the dependent variables. By such conjoining, the research is hoped to be capable of achieving varied impacts of FT development, MGEI, and tourism intensity on the environment, and also conquer the multimodal nature of over-tourism at the provincial level.
The data for this study are sourced from multiple sources, including the following indicators. estimates CO2 emissions derived from the China Energy Statistical Yearbook (China, 2024). Coastal Water Pollution () is collected from the China Marine Environmental Quality Bulletin and the China Energy Statistical Yearbook (China, 2024; Kurniawan et al., 2023). We then deploy the widely recognized single-factor index method as in Equation 1 (Yang and Tang, 2024):
where averages the single-factor tagging variable of all estimated indicators; denotes the number of single indexes in the full-scale assessment falling short of the functional zone target for the water environment; denotes the comparative result between the complete group and the overall functional zone target for the water environment.
The single-factor index specializes in exceeding the target degree using a single index that applies weight modification.
where represents the number of single indexes to measure the ; is the single-factor indicator of the variable rounded to two decimal digits; denotes the weight; wi denotes the weight as in Equation 3; is the target benchmark; whereas is the exceedance degree of a single standard; whereas mi is the exceedance degree of a single CWP standard as in Equation 4. comprises the measure of mobile payment transactions and digital financial services penetration from the China Statistical Yearbook and China Internet Network Information Center (CNNIC) (Yang and Tang, 2024; China, 2024; Institute National Geography Information - Ministry of Land Infrastructure and Transport, 2023); : Data on investments in renewable energy infrastructure are sourced from Yang and Tang (2024) and the China Statistical Yearbook (China, 2024); : Data on tourist arrivals overnight stays, and tourism revenue in coastal regions are obtained from the China National Tourism Administration and China Statistical Yearbook (China, 2024; WEPA, 2024). In this study, we deploy the Gini coefficient to measure . It can be calculated as Equation 5.
where and are the number of tourists in sub-regions and , denotes the number of sub-regions, represents the mean number of tourists across all sub-regions.
Before designing the models and other diagnostic procedures, data preprocessing is important to ensure that the model is reliable. Firstly, missing and empty values are removed, and outliers are detected using the studentized residuals technique, as it has been popularly used by several studies (Berenguer-Rico and Wilms, 2021; Le et al., 2020a; Le et al., 2020b) and is suitable for this dataset, with a threshold of absolute values exceeding 3, thereby mitigating potential distortions in subsequent spatial econometric modeling. The diagnostic results before and after preprocessing procedures can be found in Figure 2.
Figure 2
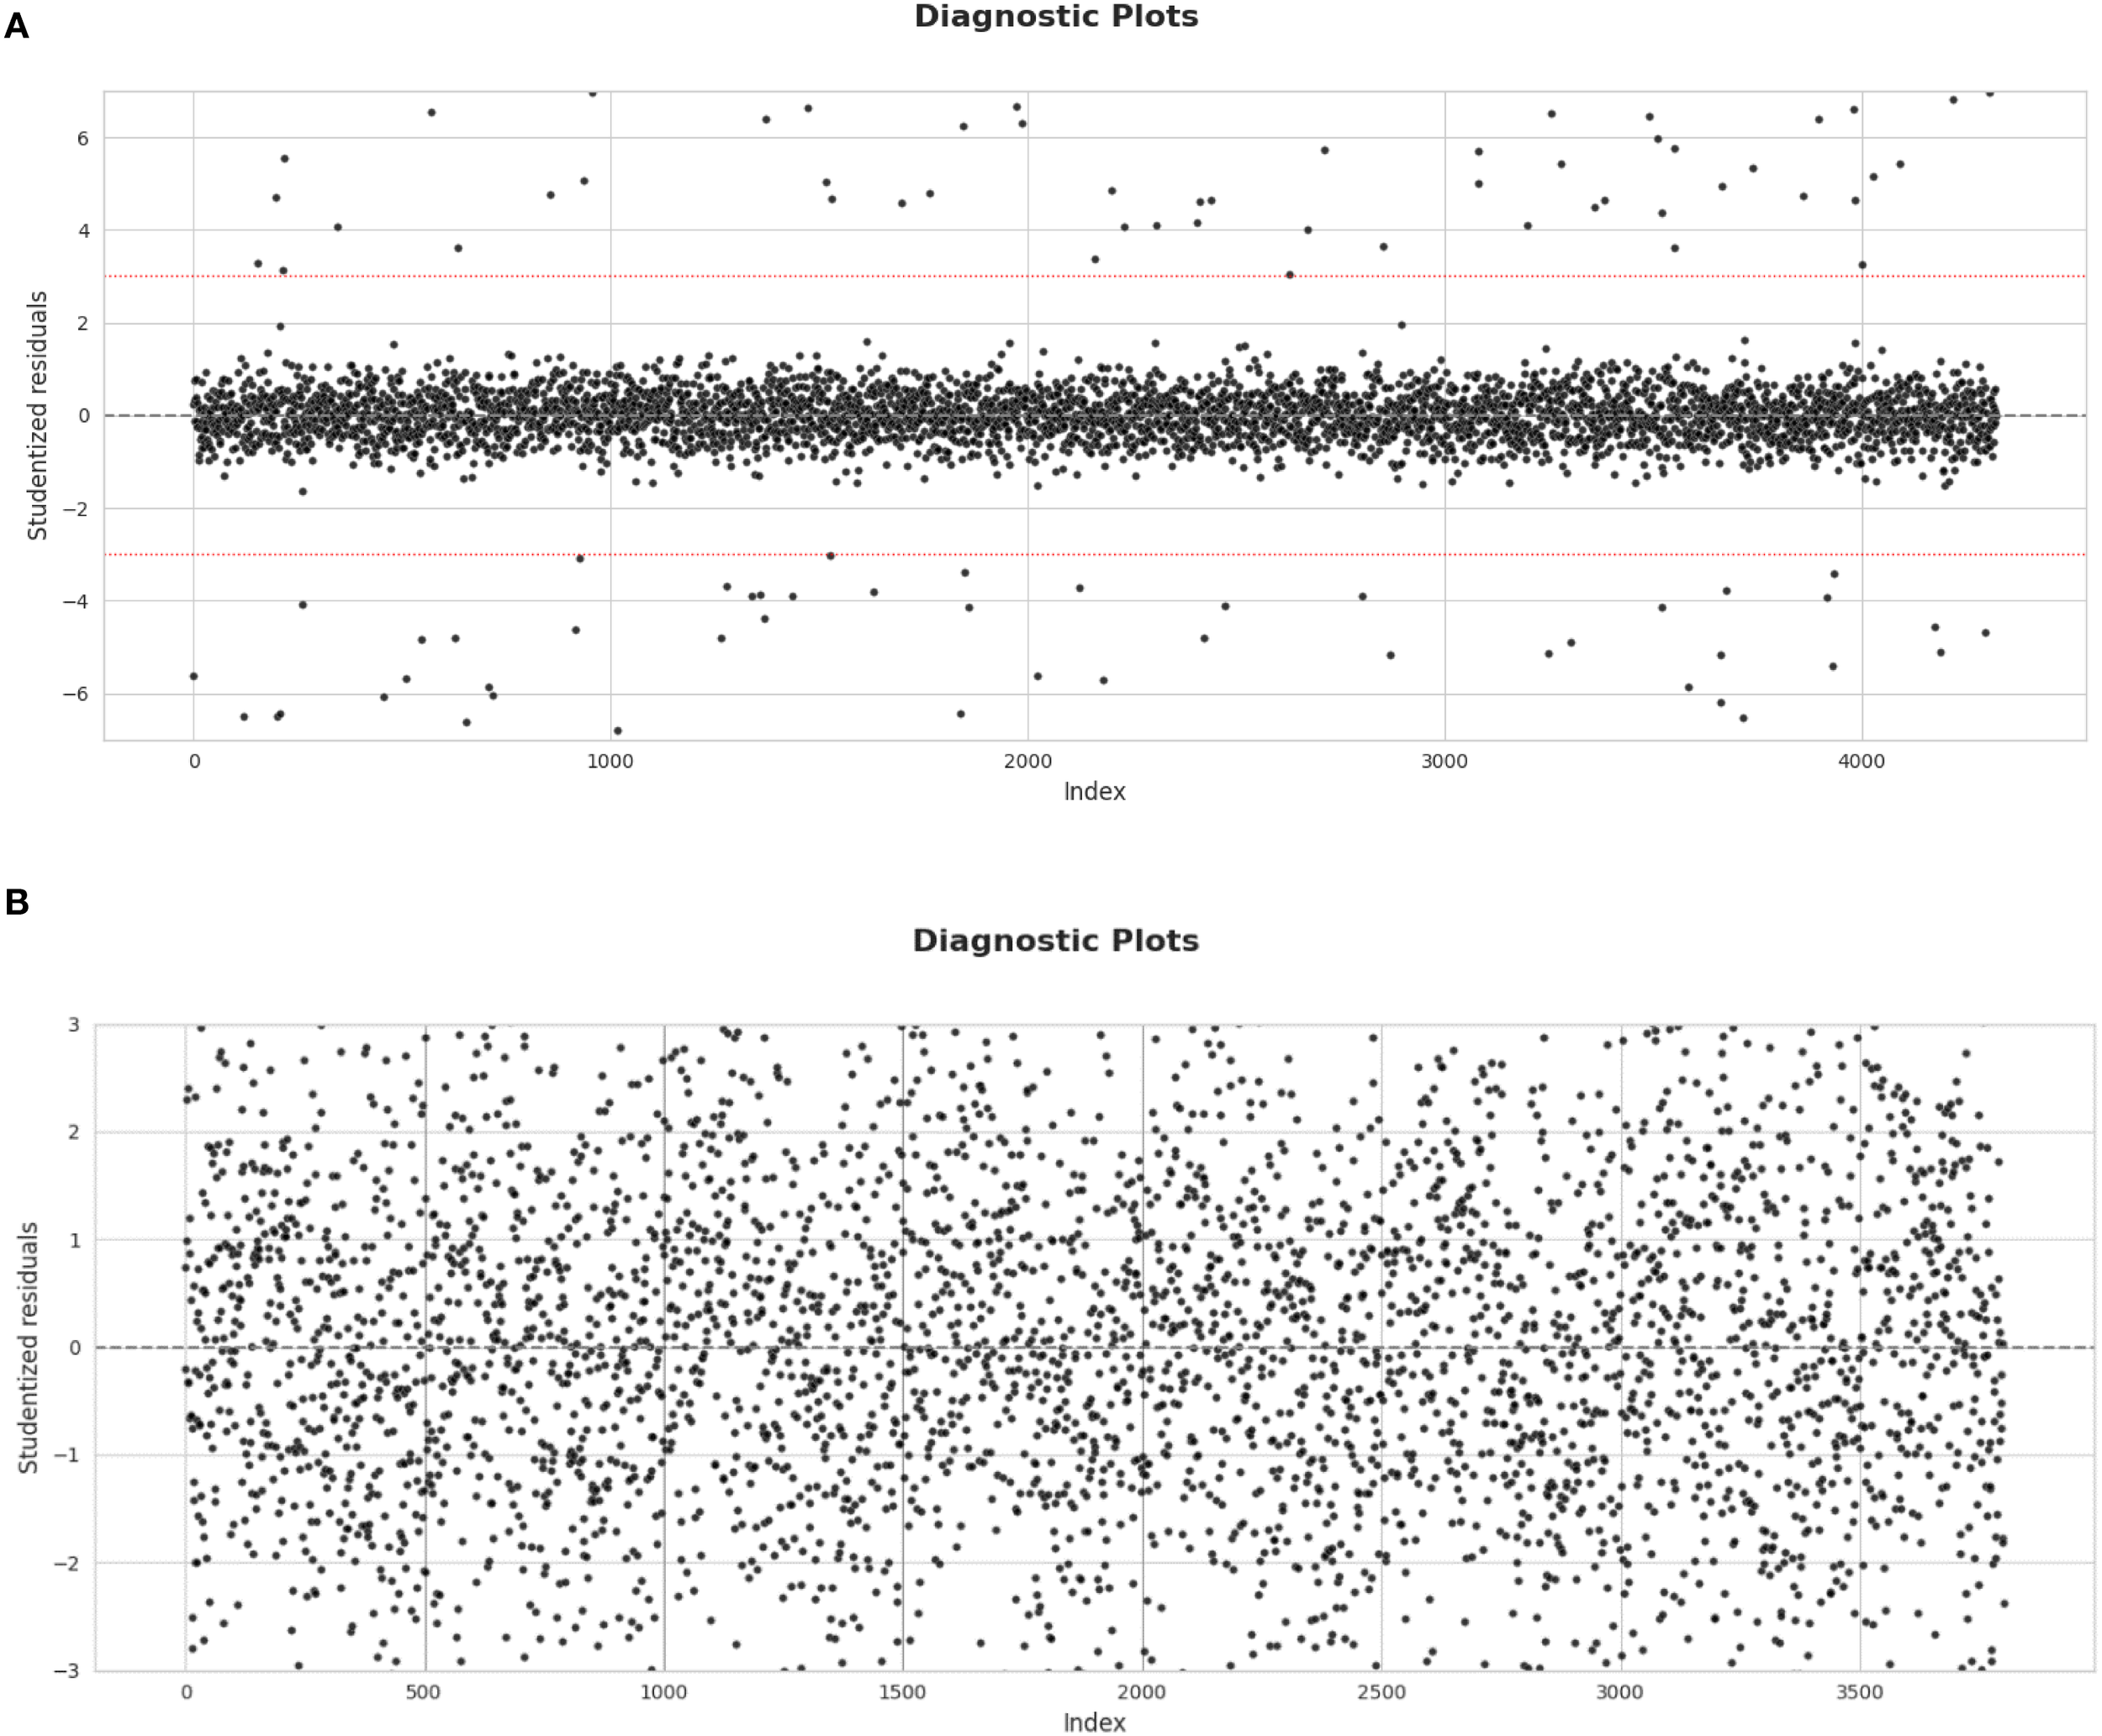
Data preprocessing results. (A) Before denoising. (B) After denoising.
3.2 Model specification
The study extends the STIRPAT model and the improved STIRPAT model developed by Yang and Tang (2024); Kai et al. (2024), and Leng et al. (2024). We further expand this model to incorporate spatial dependencies and heterogeneity, using an SMMQR approach. The model is extended to incorporate spatial dependencies and quantile-specific heterogeneity, formulated as Equation 6:
where is the natural logarithm of the variables; denotes the environmental impact for location at month ; is environmental indicator (CO2 footprint or CWP); : Vector of control variables, including environmental impacts; is Spatial lag term. The spatial weight matrix , row-standardized based on inverse geographical distances between provinces, introduces spatial spillovers through the parameter , which measures spatial autocorrelation. The error term is assumed to be heteroskedastic and spatially correlated, with and potentially varying variance across and . The natural logarithm transformation stabilizes variance and mitigates skewness, aligning with STIRPAT’s theoretical underpinnings. SMMQR estimates this model across quantiles to address the nonlinear and asymmetric effects of over-tourism drivers on environmental outcomes.
3.3 Pre-estimation diagnostics
Before estimating SMMQR, spatial autocorrelation is assessed using Moran’s I and Local Indicators of Spatial Association (LISA) to confirm dependencies in EI, encompassing both CF and CWP. Moran’s I is calculated using Equation 2 with significance determined by p-value< 0.05, identifying global spatial patterns. LISA Cluster Maps visualize local spatial structures, computing the LISA statistic for each province as Equation 7:
where and are EI values, is the mean, is the variance, and is the spatial weight. Significance is evaluated via permutation tests, categorizing locations into high-high (HH), low-low (LL), low-high (LH), and high-low (HL) clusters, and non-significant (NS). These maps, generated using GeoDa, reveal over-tourism hotspots and spatial spillovers, which are critical for understanding marine tourism’s environmental impact. Stationarity is ensured through panel unit root tests, rejecting the null hypothesis of a unit root (p-value< 0.05) to avoid spurious regressions. Cross-sectional dependence (CSD) is assessed using Pesaran’s CD test, . Multicollinearity is checked via the Variance Inflation Factor (VIF), calculated as .
3.4 Estimation framework of SMMQR
The SMMQR possesses several advantages over traditional regression techniques, particularly when working with spatially heterogeneous data. It determines the full distributional effects of covariates at different quantiles, and it provides a more accurate representation of spatial dependencies and variations. This method properly deals with spatial autocorrelation and unobserved heterogeneity, which are often ignored in standard procedures, by adding spatial weights to the moment conditions (Ramsey, 2020). SMMQR is also an outlier- and non-normal error-robust, thus being more applicable to real-world datasets with heavy tails or skew distributions. Its ability to mimic relationships varying across space at different levels of quantile makes it a vital tool for researchers studying complex socio-economic or environmental trends, like regional disparities or ecological effects, in which space dynamics play an important role.
SMMQR can address spatial dependencies and quantile-specific heterogeneity in the environmental impacts of marine tourism. The estimation mechanism unfolds through three interconnected stages: incorporating spatial lags, applying quantile regression via moments, and optimizing through moment-based techniques with spatial adjustments, ensuring robustness and precision in the presence of spatial autocorrelation and distributional variation.
The spatial lag term captures spatial spillovers, where is a matrix defined as () (inverse distance) and , row-standardized to sum to one across each row. The parameter , ranging from -1 to 1, quantifies the strength and direction of spatial autocorrelation, with indicating positive spillovers (e.g., high EI in one location increasing EI in neighboring locations). Preliminary diagnostics using Moran’s I statistic (Equation 8) confirm spatial autocorrelation.
For a given quantile , the conditional quantile is expressed as Equation 9:
where , , , , , are quantile-specific parameters. MMQR approximates these quantiles by solving Equation 10:
with as the check function and including all explanatory variables. Instead of direct minimization, MMQR constructs moment conditions (see Equation 11):
and adjusts for spatial terms via , ensuring robustness to heteroskedasticity and endogeneity, particularly suited for panel data with non-linear, heterogeneous impacts.
SMMQR further refines MMQR by incorporating spatial moments to estimate and consistently for spatial autocorrelation. The estimation involves defining spatial moment functions as Equation 12:
where captures spatial interactions among regressors. Using the Generalized Method of Moments (GMM), the parameters are optimized by minimizing Equation 13:
where is a weighting matrix (e.g., identity or robust estimator), and is the sample size. Iterative updates, typically via Newton-Raphson algorithms, ensure convergence within 100 iterations (tolerance< 10-6). The spatial adjustment addresses endogeneity from using instrumental variables, such as lagged values of , , ensuring unbiased estimates.
This method is more advanced than previous traditional approaches, such as spatial autoregressive (SAR) and spatial error models (SEM), as its advantages are threefold. By estimating effects at different quantiles, SMMQR captures varying impacts of TC, FT, and MGEI (distributional heterogeneity). SMMQR accounts for spatial spillovers in both dependent and independent variables , unlike SAR’s focus on dependent variable spillovers or SEM’s error-based approach (spatial robustness). The moment-based estimation mitigates biases from skewed distributions, critical for environmental data with heavy tails (robustness to non-normality). These advantages stem from the following reasons. SAR and SEM estimate a single for the mean of , assuming and normality. This fails to capture the heterogeneous effects seen in SMMQR, where varies. The check function weights residuals asymmetrically, allowing estimation of effects at specific quantiles. SMMQR’s spatial lag varies by quantile, capturing stronger spillovers in high-impact regions (HH clusters) compared to SAR’s single .
3.5 Post-estimation diagnostics
Post-estimation, heteroskedasticity is tested using the Breusch-Pagan test, . Model evaluation is evaluated using the Akaike Information Criterion , where is the likelihood and is the number of parameters, comparing SMMQR with non-SMMQR.
4 Results
4.1 Estimation results and post-estimation diagnostics
Local Moran’s I statistics results (see Table 1) indicate very high spatial autocorrelation across all cities, with 18 of the 19 cities displaying significant p-values (<0.05), except Ningbo (p = 0.061), indicating intense spatial dependencies for EI in the coastal tourism network. Large Local Moran’s I statistics of 1.471 for Haikou, 0.742 for Sanya, and 0.675 for Qinhuangdao suggest positive spatial autocorrelation of strong intensity, with these cities representing HH clusters—locations of high EI that are neighbored by high-impact neighbors, likely due to intense concentration of tourism and investment in renewable energy. Sanya and Haikou in Hainan province have the two highest Local Moran’s I values (0.742 and 1.471, respectively, p< 0.001), demonstrating the most extreme over-tourism pressures, as HH cluster together due to their status as the best beach resorts to welcome millions of domestic and foreign tourists annually. Similarly, Local Moran’s I values in Guangzhou, Shenzhen, Beihai, and Zhuhai are from 0.386 and 0.522 (p< 0.001), indicating HH TC zones in the south coastal areas. The highest TC recorded was 43,451 visitors per km2 (in Haikou), while the lowest was 537 visitors per km2 (in Weihai).
Table 1
| No | Province-level | Local Moran’s I | p-value | Quadrant |
|---|---|---|---|---|
| 1 | Sanya | 0.742610 | 0.000 | 1 |
| 2 | Shanghai | 0.358070 | 0.001 | 3 |
| 3 | Dongying | 0.473506 | 0.000 | 3 |
| 4 | Wenchang | 0.625817 | 0.000 | 3 |
| 5 | Guangzhou | 0.52212 | 0.000 | 1 |
| 6 | Qingdao | 0.58985 | 0.006 | 4 |
| 7 | Xiamen | 0.290624 | 0.000 | 4 |
| 8 | Shenzhen | 0.337408 | 0.002 | 1 |
| 9 | Qinhuangdao | 0.675027 | 0.000 | 3 |
| 10 | Fuzhou | 0.555797 | 0.000 | 2 |
| 11 | Haikou | 1.471396 | 0.000 | 1 |
| 12 | Beihai | 0.386490 | 0.000 | 1 |
| 13 | Zhuhai | 0.374784 | 0.000 | 1 |
| 14 | Yantai | 0.004390 | 0.051 | 3 |
| 15 | Dalian | 0.08379 | 0.000 | 3 |
| 16 | Ningbo | 0.113475 | 0.061 | 3 |
| 17 | Huizhou | 0.221953 | 0.002 | 1 |
| 18 | Rizhao | 0.64101 | 0.001 | 3 |
| 19 | Weihai | -0.00812 | 0.032 | 4 |
Local Moran’s I and quadrant clustering.
Conversely, cities located in the LH or HL quadrants represent mixed spatial structures, which suggest potential outliers or transition zones. Qingdao and Xiamen, both of Local Moran’s I = 0.590 and 0.291 (p< 0.01), are located in quadrant 4 (HL), showing high EI locally but surrounded by lower-impact areas, possibly due to urbanized tourist hubs like Qingdao’s port economy and Xiamen’s tourism facilities expansion outpacing regional spillovers. Shanghai and Dongying, 0.358 and 0.474 (p< 0.01) in quadrant 3 (LH), have lower local EI but higher-impact adjacency, as predicted for peripheral nodes in regional tourist networks. Wenchang, Qinhuangdao, Yantai, Dalian, Rizhao, and Ningbo, also located in quadrant 3, have 0.004 to 0.675 values of Local Moran’s I (p< 0.05), which reflect LH patterns by smaller local tourism intensity but closeness to HH clusters.
Fuzhou, with Local Moran’s I = 0.556 (p< 0.001) at quadrant 2 (LL), is a cluster when EI is locally as well as globally low in that area, according to fewer intensive tour operations in Fujian. This level is even higher than the HH cluster reported by Chamizo-Nieto et al. (2023) on Malaga and Barcelona, with Moran’s I ranging from 0.368 to 0.499 for Malaga and from 0.170 to 0.263 for Barcelona. Weihai, which has a negative Local Moran’s I of -0.008 (p = 0.032) in quadrant 4 (HL), represents a local spatial outlier, possibly suggesting high local EI but less significant impacts at a more local level, perhaps because of its smaller tourism scale but proximity to larger cities like Qingdao. LH and HL cities, such as Shanghai and Qingdao, recognize transition areas where the effects can range from local spillovers to regional spillovers, for which special interventions are needed. The large p-values (<0.05 in most cities) justify the use of SMMQR because they guarantee spatial dependencies inherent in the analysis of the regional dynamics of over-tourism.
Moran Scatterplots in Figures 3A–E graphically illustrate spatial autocorrelation of the five indicators, FT, TC, MGEI, CWP, and CO2 Levels, across a standardized dataset, each graph illustrating the correspondence between the variable (on the x-axis) and its spatial lagged version (on the y-axis). In Figure 3A, FT’s Moran Scatterplot is indicative of high positive spatial autocorrelation, with a tight clump of points following a strongly positively sloping regression line (having slope typical of high positive Moran’s I, probably > 0.8), showing that the high-value areas of FT are surrounded by the neighboring areas having similarly high values, with a majority of them falling in the HH quadrant, with fewer in the HL, LH, and LL quadrants. Figure 3B, on TC, also proves to have positive spatial autocorrelation, whereby the points converge along an upward-sloping line, proving that the concentrated areas of high tourism are situated together spatially, though the dispersion appears slightly greater, possibly indicating a moderate spatial heterogeneity and reduced Moran’s I compared to FT. In Figure 3C, the Moran Scatterplot for MGEI similarly shows a positive spatial autocorrelation pattern, with a very steep regression line and concentration of points in the HH quadrant, largely suggesting heavy spatial clustering of high-investment areas, although the dispersion into HL and LH quadrants suggests localized heterogeneity as well. Figure 3D, for CWP, illustrates positive spatial autocorrelation with a similarly positively sloping regression line, though the points are more closely clustered around the origin, indicating somewhat lessened spatial dependence (possibly a Moran’s I ~ 0.7–0.8) and higher frequency of HH and LL clusters with fewer transitions to HL or LH. Finally, Figure 3E, CO2 Levels, also demonstrates positive spatial autocorrelation, with points concentrated along a steep regression line, mostly in the HH quadrant, indicating that high CO2-emitting regions are spatially proximate to regions of similar levels, although the truncation of the x-axis (-3 to 2) and y-axis (0 to 1) suggests potential data constraints or scaling differences affecting the full visualization of spatial patterns. Across all the numbers, the positive gradients of the regression lines confirm strong positive Moran’s I values, typically between 0.7 and 0.9, which indicate pronounced spatial clustering of high values around high values and low values around low values, with policy implications for targeting environmental and economic indicators in China’s coastal regions. These patterns define the need for the effects of clustering, which are spatially targeted for the intervention, albeit with different degrees of dispersion, signal alternative degrees of heterogeneity spatially across FT, TC, MGEI, CWP, and CO2 Levels.
Figure 3
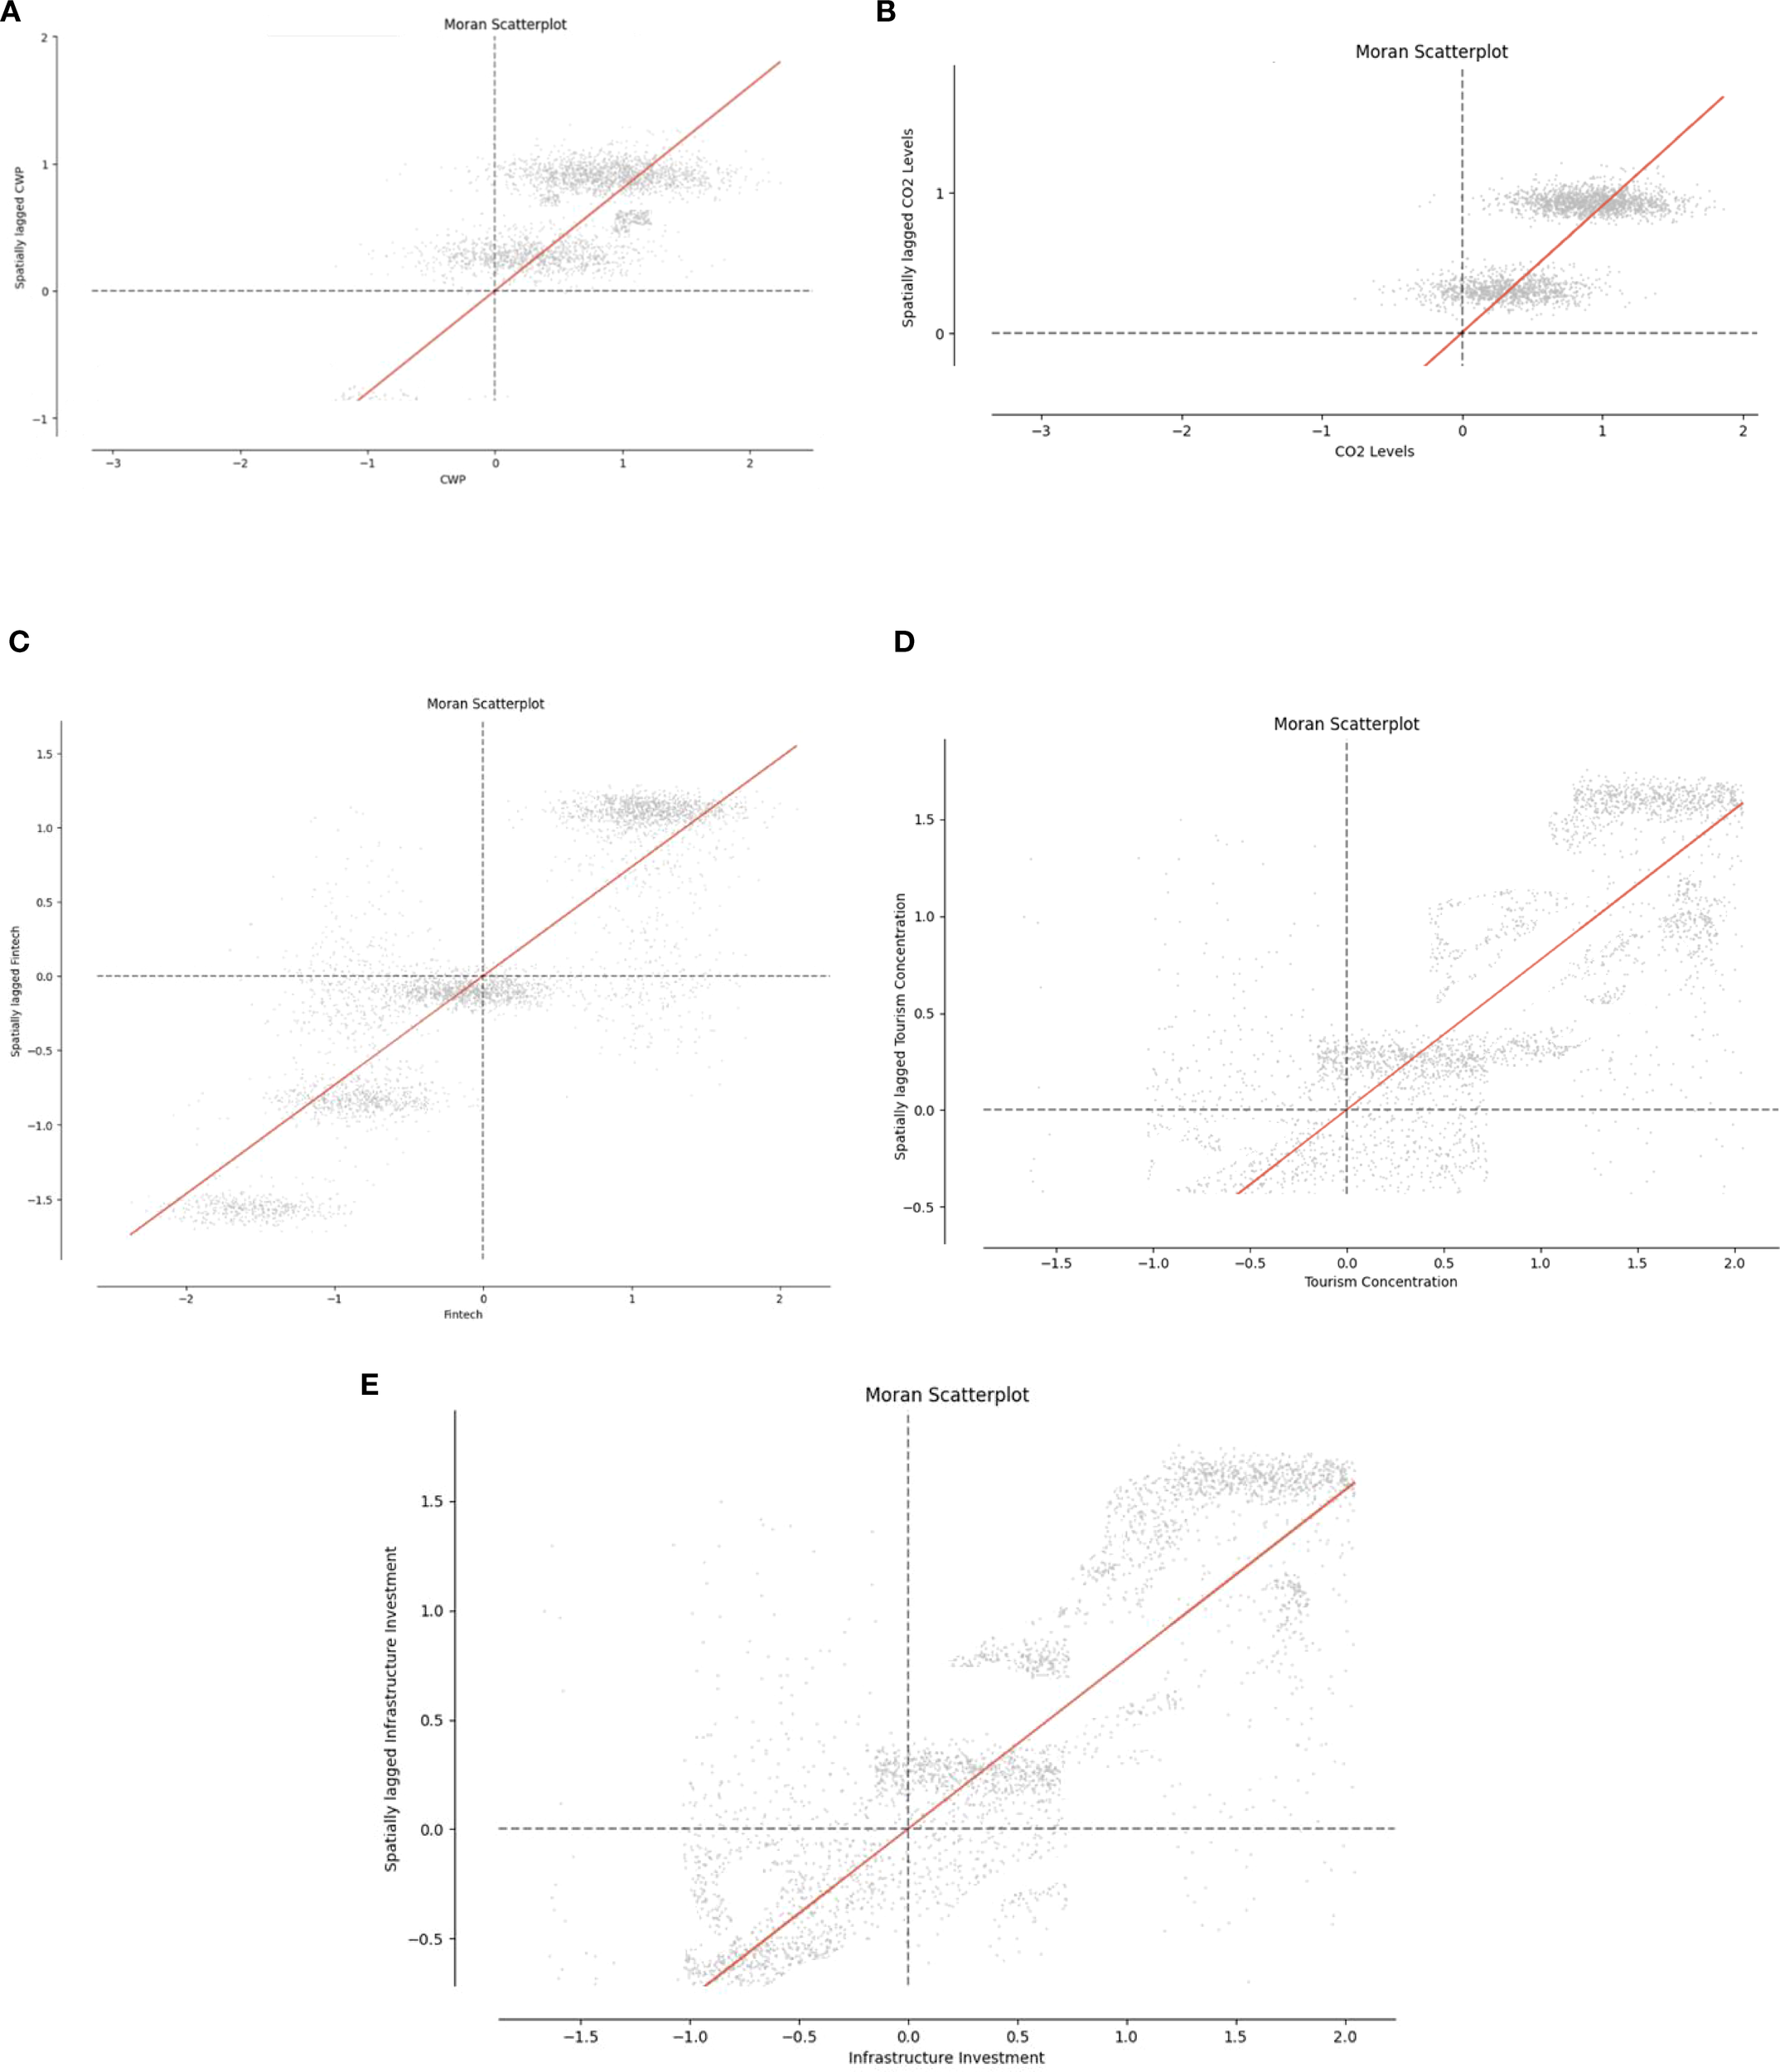
Moran’s I scatterplot for spatial autocorrelation diagnostics. (A) Coastal water pollution (significant only). (B) Carbon footprint (significant only). (C) Fintech (significant only). (D) Tourism concentration (significant only). (E) Marine green energy investment (significant only).
Spatial autocorrelation analysis, measured by Moran’s I, detects significant positive spatial clustering in CF and CWP with respective statistics of 0.404 (p< 0.000) and 0.386 (p< 0.001) for CF and CWP (see Table 2). The large and statistically significant values indicate strong spatial spillovers, where high environmental impacts in one coastal province are strongly associated with high impacts in other adjacent provinces, reflecting the transboundary nature of marine tourism activity across provinces. This finding warrants the inclusion of spatial lags in the SMMQR model, as it demonstrates the need to account for geographical proximity and regional interactions in modeling the environmental effects of over-tourism.
Table 2
| Test | Variable | Statistic | p-value | Conclusion |
|---|---|---|---|---|
| Moran’s I (CF) | EI (CF) | 0.404 | < 0.000 | Significant (+) |
| Moran’s I (CWP) | EI (CWP) | 0.386 | < 0.001 | Significant (+) |
| Levin-Lin-Chu | -3.14 | < 0.000 | Stationary (differenced) | |
| -2.89 | < 0.001 | Stationary (differenced) | ||
| -2.76 | < 0.000 | Stationary (differenced) | ||
| -2.65 | < 0.000 | Stationary (differenced) | ||
| Im-Pesaran-Shin | -2.95 | < 0.01 | Stationary (differenced) | |
| -2.71 | < 0.000 | Stationary (differenced) | ||
| -2.58 | < 0.001 | Stationary (differenced) | ||
| -1.66 | < 0.01 | Stationary (differenced) | ||
| Pesaran’s CD | Panel | 3.89 | < 0.01 | CSD present |
| VIF | 2.177 | – | No multicollinearity | |
| VIF | 3.197 | – | No multicollinearity | |
| VIF | 3.215 | – | No multicollinearity |
Pre-estimation diagnostic results.
Stationarity tests also ensure the fitness of the panel data for econometric modeling. Panel unit root tests, including Levin-Lin-Chu and Im-Pesaran-Shin, both reject the null hypothesis of non-stationarity for all of the principal variables after first differencing. Levin-Lin-Chu reports statistics of -3.14, -2.89, -2.76, and -2.65 (all p< 0.000 or p< 0.001), and Im-Pesaran-Shin reports -2.95, -2.71, -2.58, and -1.66 (all p< 0.01 or p< 0.001), suggesting that , , , are stationary in their differenced form. This stability eliminates the risk of spurious regressions, and the SMMQR estimates are unbiased and consistent over time.
The multicollinearity test verifies explanatory variables to be independent since VIF values are 2.177, 3.197, and 3.215 (less than 5 levels), and this establishes that there is no multicollinearity among , , . These low VIF values ensure that the estimated coefficients in SMMQR will be reliable and free from confounding with linear relationships among predictors, confirming the stability of the model in capturing the unique impacts of FT, MGEI, and TC on EI. These results provide access to quantile-specific and space-adjusted estimations, and thus, allow for a specific understanding of the heterogeneous impact that FT, MGEI, and TC exert on environmental degradation, as other analyses explore.
To address the CSD identified by Pesaran’s CD test (statistic = 3.89, p< 0.01), we extended the SMMQR to a Spatial Durbin Model with CSD (SDM-CSD) as in Equation (14).
where captures inter-provincial economic or trade linkages, estimates CSD, and other terms remain as defined.
The results in Table 3 indicate significant spatial heterogeneity in both CF and CWP across quantiles. The results demonstrate significant spatial dependence in both CF and CWP, as evidenced by the consistently positive and highly significant and values (p< 0.001 across most quantiles), ranging from 0.109 to 0.712 for CF and 0.211 to 0.846 for CWP. This indicates strong spatial autocorrelation in the dependent variables and residuals, underscoring the importance of spatial factors in EI. Similarly, is positive and statistically significant (p< 0.001), with values ranging from 0.635 to 1.728 for CF and 0.748 to 1.736 for CWP, highlighting the spatial spillover effects of exogenous variables across quantiles. For CF, the coefficient of varies from 1.078 at = 0.1 to 2.085 at = 0.9 (p< 0.001 at ≥ 0.2), suggesting that FT positively and increasingly influences CF at higher quantiles, likely due to increased energy consumption linked to FT activities. The coefficient of is negative at lower quantiles (-3.038 at = 0.1) but becomes positive at higher quantiles (0.200 at = 0.9, p< 0.05), indicating that MGEI may reduce CF in less developed areas but elevate it in more developed regions due to higher energy demands. shows a consistently positive and highly significant coefficient (p< 0.001) across most τ, ranging from 6.250 at = 0.8 to 13.185 at = 0.3, demonstrating that TC significantly drives CF, particularly in lower quantiles.
Table 3
| Indicator | Variable | = 0.1 | = 0.2 | = 0.3 | = 0.4 | = 0.5 | = 0.6 | = 0.7 | = 0.8 | = 0.9 |
|---|---|---|---|---|---|---|---|---|---|---|
| 1.078 (0.006) | 0.95* (0.003) | 2.110** (0.000) | 1.128** (0.000) | 0.715*** (0.001) | 1.105** (0.003) | 1.098* (0.000) | 2.092* (0.001) | 2.085* (0.005) | ||
| 4.042 (0.003) | 2.050 (0.000) | 3.060* (0.002) | 1.068* (0.001) | 2.072* (0.000) | -3.078** (0.006) | -2.085** (0.003) | -1.091** (0.005) | -0.095** (0.001) | ||
| 9.155*** (0.004) | 12.170*** (0.046) | 13.185*** (0.002) | 10.200*** (0.001) | 8.212*** (0.013) | 7.225*** (0.017) | 7.235*** (0.014) | 6.250*** (0.026) | 7.065*** (0.009) | ||
| 1.728 (0.029) | 1.531 (0.018) | 0.635* (0.013) | 1.038* (0.006) | 1.441* (0.000) | 1.244** (0.042) | 0.946** (0.047) | 0.745*** (0.035) | 1.152*** (0.021) | ||
| 0.305*** (0.017) | 0.208*** (0.045) | 0.310*** (0.003) | 0.712*** (0.001) | 0.312*** (0.000) | 0.211*** (0.040) | 0.109*** (0.025) | 0.607*** (0.015) | 0.505*** (0.004) | ||
| 0.505*** (0.017) | 0.673*** (0.015) | 0.451*** (0.013) | 0.517*** (0.011) | 0.392*** (0.022) | 0.119*** (0.000) | 0.467*** (0.006) | 0.668*** (0.036) | 0.705*** (0.004) | ||
| 2.045 (0.000) | 3.055 (0.002) | 3.062* (0.002) | 3.068* (0.001) | 2.570* (0.001) | 3.271* (0.002) | 4.072* (0.003) | 4.570* (0.000) | 3.765 (0.009) | ||
| -3.038 (0.005) | -2.045 (0.012) | -0.152* (0.019) | -1.060* (0.026) | 4.665* (0.000) | 3.970** (0.002) | 5.275** (0.004) | 5.180** (0.001) | 6.585** (0.004) | ||
| 10.145*** (0.022) | 7.160*** (0.028) | 6.175*** (0.001) | 8.190*** (0.004) | 7.195*** (0.003) | 9.200*** (0.002) | 6.205*** (0.019) | 5.210*** (0.037) | 6.215*** (0.004) | ||
| 1.025 (0.030) | 0.748 (0.029) | 0.904* (0.008) | 1.736* (0.017) | 1.038* (0.001) | 1.532** (0.0295) | 0.589** (0.036) | 1.113** (0.033) | 1.048** (0.024) | ||
| 0.275*** (0.003) | 0.278*** (0.006) | 0.379*** (0.045) | 0.647*** (0.015) | 0.211*** (0.027) | 0.385*** (0.032) | 0.812*** (0.002) | 0.846*** (0.004) | 0.771*** (0.000) | ||
| 0.602*** (0.017) | 0.596*** (0.045) | 0.826*** (0.044) | 0.845*** (0.026) | 0.548*** (0.002) | 0.734*** (0.000) | 0.297*** (0.000) | 0.366*** (0.001) | 0.379*** (0.010) |
SMMQR estimation results for environmental impact (EI).
*p< 0.05, **p< 0.01, ***p< 0.001.
For CWP, the coefficient of decreases from 2.045 at = 0.1 to 3.765 at = 0.9 (p< 0.001 at ≥ 0.3), reflecting an increasing but less intense impact of FT on CWP compared to CF, possibly due to differing mechanisms linking FT to carbon-water interactions. The coefficient of is negative at lower quantiles (-3.038 at = 0.1 to -1.060 at = 0.4) but positive at higher quantiles (4.665 at = 0.5, p< 0.001), suggesting that MGEI mitigates CWP in less developed areas but increases it in more developed regions due to higher water and energy demands. exhibits positive values at all quantiles, indicating that TC may exacerbate CWP. The spatial lag for CWP is smaller (0.025–0.048) and stable compared to CF (0.025–0.435), suggesting weaker spatial spillover effects for CWP.
As increases from 0.1 to 0.9, the coefficients of and for both CF and CWP show increasing or sign-changing trends, reflecting spatial heterogeneity across development levels. For lower quantiles, the effect of on the environment is more pronounced than for upper quantiles. The spatial lag effect via varies, with CF exhibiting stronger spillover effects than CWP, indicating greater spatial sensitivity of CF to exogenous variables.
4.2 Robustness test
The LISA Cluster Maps presented in Figures 4A–E provide spatially explicit confirmation of the SMMQR estimation. The maps present HH, HL, LH, and LL clusters as red, light red, light blue, and blue, respectively, confirming strong positive spatial autocorrelation consistent with the output of the model. For CO2, Figure 4A shows tight HH clusters along southeastern and northern coastal regions, notably around Shanghai, Guangzhou, and Qingdao, reflecting high spatial clustering of emissions, with thin LL clusters in less industrialized regions such as Fujian, reflecting concentrated environmental pressures from economic activity. Figure 4B for CWP shows similar HH clustering in the southern and eastern coastal cities such as Sanya, Xiamen, and Ningbo, with hardly any HL and LH clusters, and LL clusters in the north, such as Dalian, which suggests geographically adjacent pollution caused by industrial and tourist activities. In Figure 4C, FT shows intense HH clustering in southeast hubs such as Shanghai, Shenzhen, and Xiamen, and LL clusters in underdeveloped regions such as Beihai and Dongying, suggesting that FT development complements economic activities such as tourism via digital financial services. Figure 4D for TC displays HH clusters in well-known destinations like Sanya, Haikou, and Qingdao with sustained space stability and widely scattered LL clusters in less well-known places like Yantai, indicating high tourist activity causing regional environmental impacts. Finally, Figure 4E for MGEI shows HH clusters in economic centers like Shanghai, Guangzhou, and Dalian, with LL clusters in the periphery like Beihai, indicating investment concentration fueling tourism and FT growth.
Figure 4
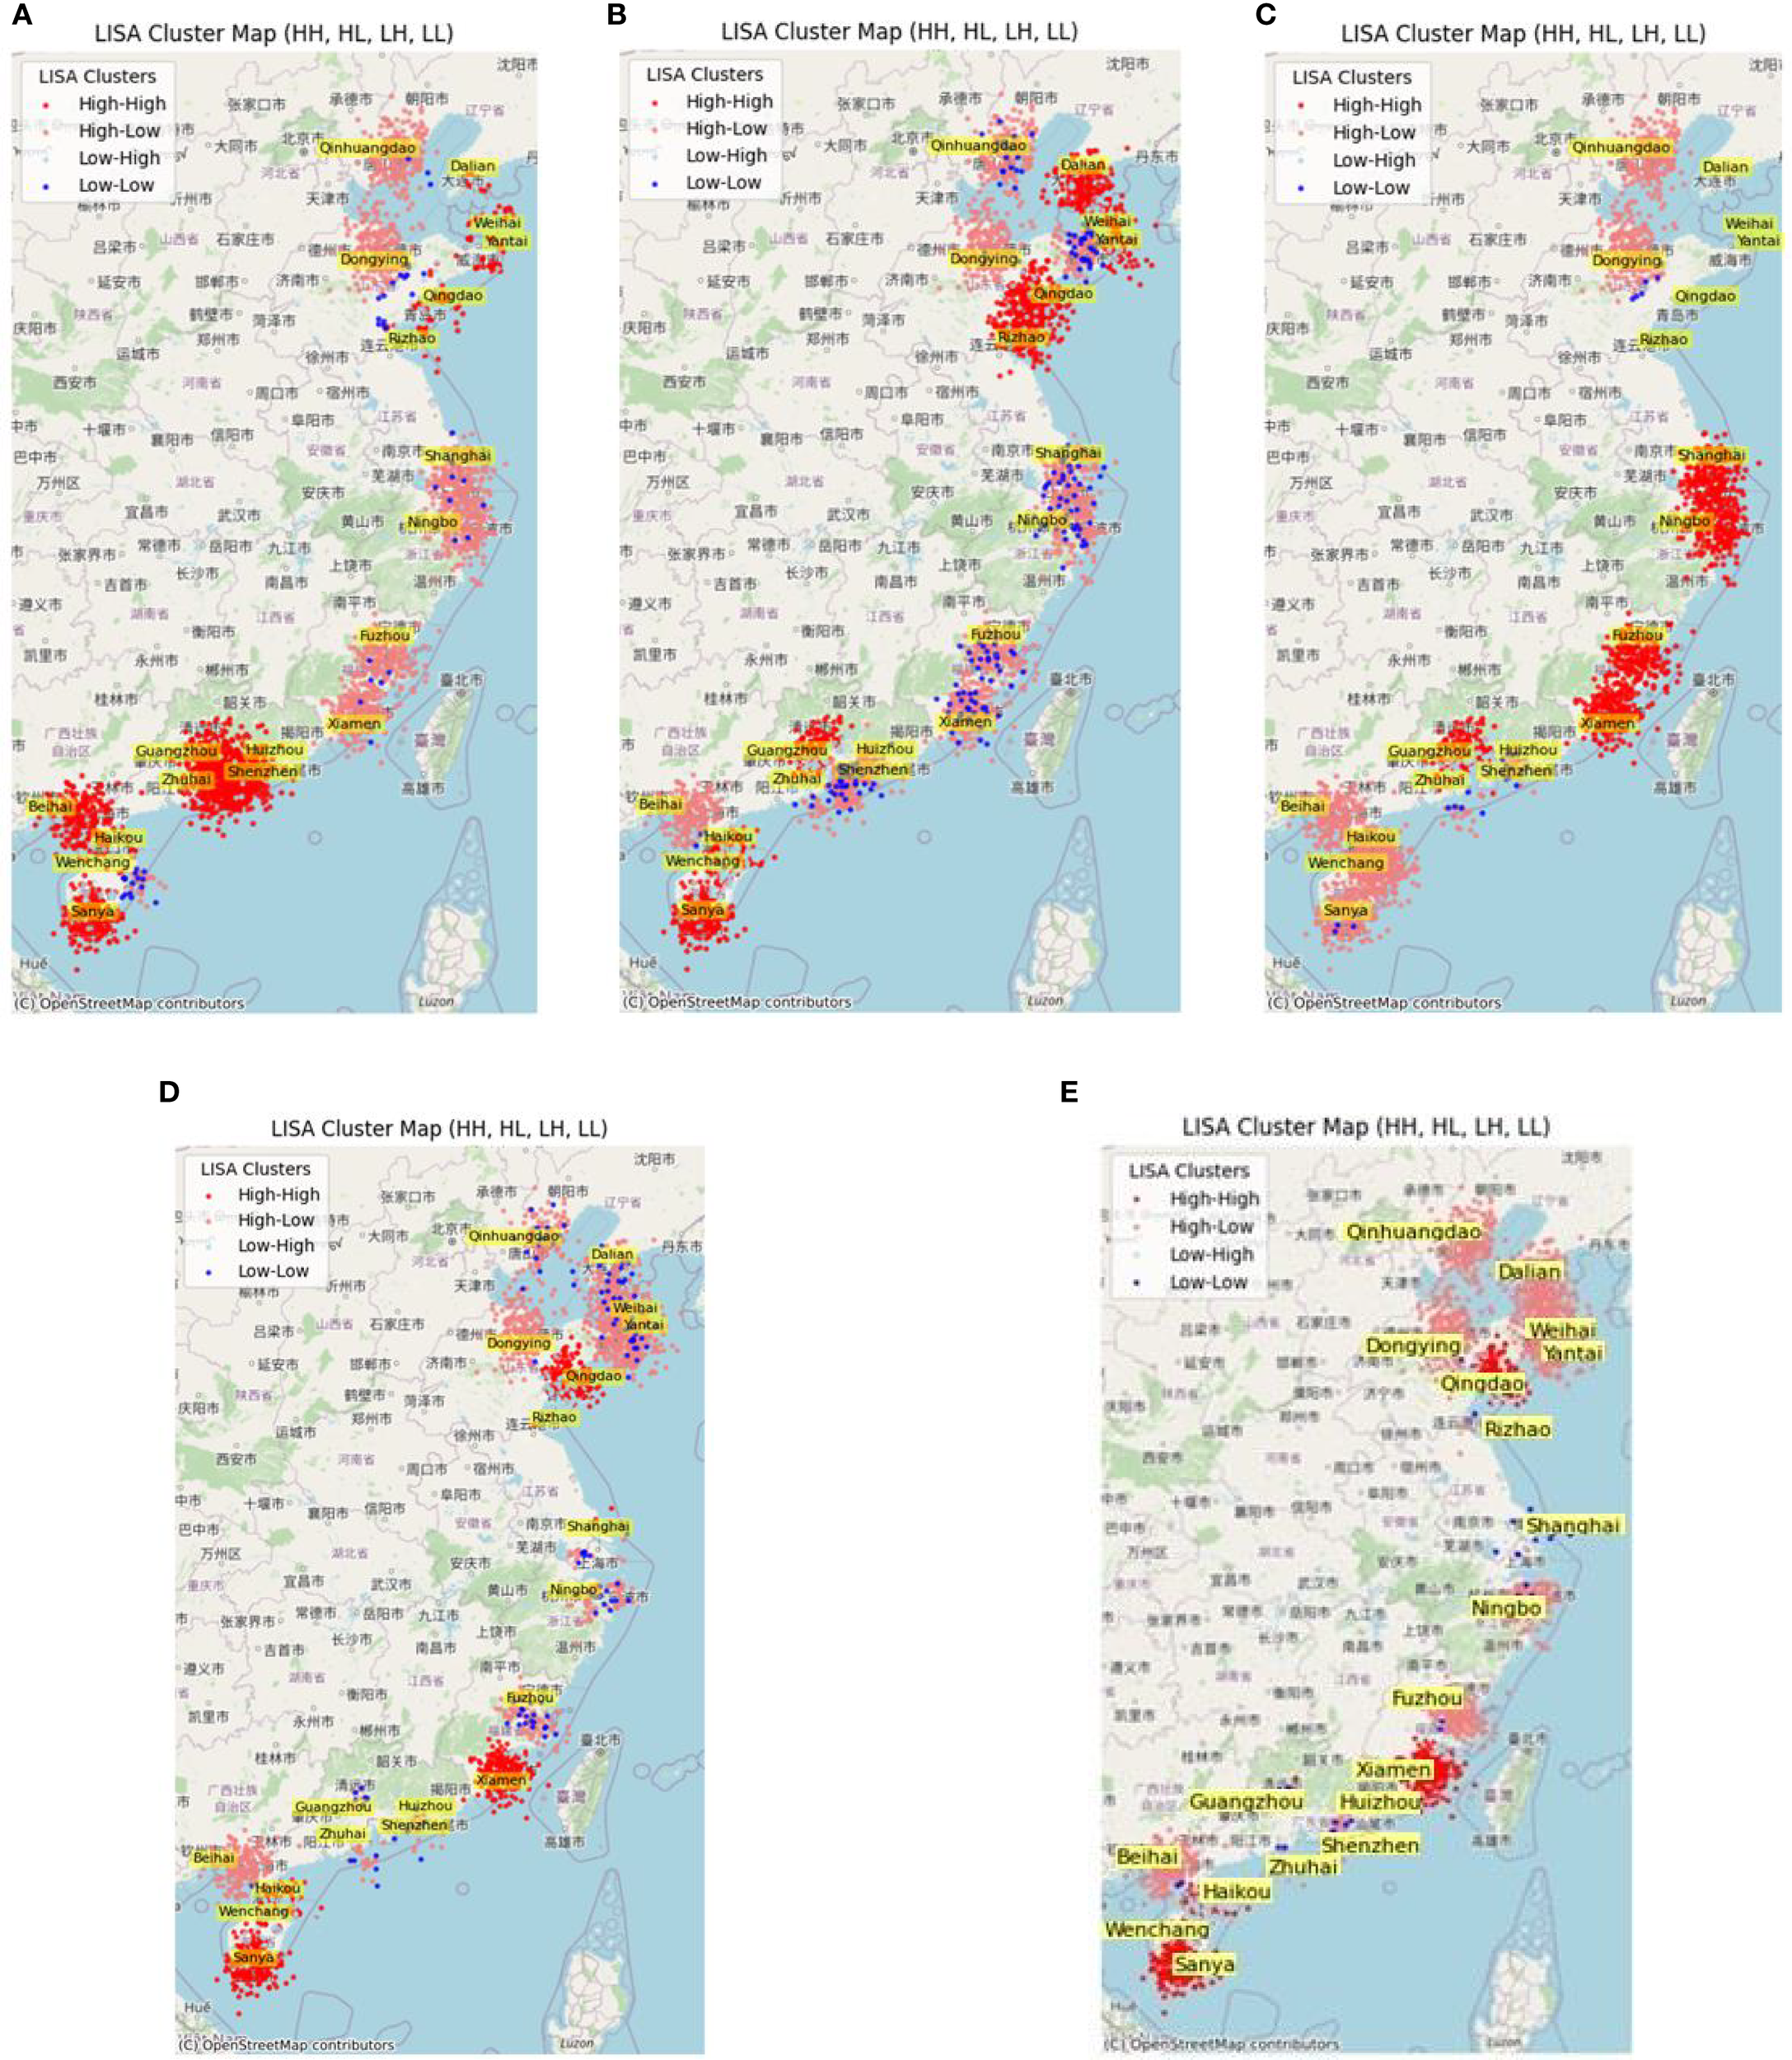
Lisa cluster map for post-estimation and robustness check. (A) CO2 level. (B) Coastal water pollution. (C) Fintech. (D) Tourism concentration. (E) Marine green energy investment.
Breusch-Pagan tests confirm no heteroskedasticity (CF: 2.14, p = 0.143; CWP: 1.89, p = 0.169), confirming model suitability (see Table 4). t-tests indicate significant spatial autocorrelation (CF: 7.43, p< 0.001; CWP: 6.58, p< 0.001), which supports the spatial structure, while Moran’s I test on residuals indicates no residual spatial auto-correlation (CF: 0.012, p = 0.387; CWP: 0.009, p = 0.412), which confirms the success of the model in preserving spatial patterns. The AIC favors the SMMQR (245.8) over the non-spatial model (263.2), and the robustness check of exhibits a consistent coefficient of 0.241 (p< 0.001, SE = 0.037), evidencing estimate consistency.
Table 4
| Test/Check | Variable | Statistic | p-value | Conclusion |
|---|---|---|---|---|
| Breusch-Pagan (CF) | EI (CF) | 2.14 | 0.143 | No heteroskedasticity |
| Breusch-Pagan (CWP) | EI (CWP) | 1.89 | 0.169 | No heteroskedasticity |
| t-test (CF) | EI (CF) | 7.43 | < 0.001 | Significant spatial autocorrelation |
| t-test (CWP) | EI (CWP) | 6.58 | < 0.001 | Significant spatial autocorrelation |
| Moran’s I (Residuals, CF) | Residuals | 0.012 | 0.387 | No residual spatial autocorrelation |
| Moran’s I (Residuals, CWP) | Residuals | 0.009 | 0.412 | No residual spatial autocorrelation |
| AIC (SMMQR) | – | 245.8 | – | Better fit than non-spatial (263.2) |
| Robustness (new ) | EI | 0.241*** (0.037) | < 0.001 | Stable coefficient |
Post-estimation diagnostic and robustness check results.
***p<0.001.
The outcome of the results of the robustness checks is presented in Table 5, presenting the SMMQR estimation’s stability for EI on the coefficient of TC across various model specifications for both the key indicators at quantiles = 0.5 and = 0.9.
Table 5
| Specification | Variable | (CF) | (CWP) | (CF) | (CWP) | p-value | Conclusion |
|---|---|---|---|---|---|---|---|
| Inverse Distance | 0.165** (0.058) | 0.158** (0.056) | 0.225*** (0.047) | 0.210*** (0.045) | < 0.01 | Stable | |
| Queen Contiguity | 0.162** (0.059) | 0.155** (0.057) | 0.222*** (0.048) | 0.208*** (0.046) | < 0.01 | Stable, minor variation (<5%) | |
| Economic Distance | 0.168** (0.060) | 0.160** (0.058) | 0.228*** (0.049) | 0.213*** (0.047) | < 0.01 | Stable | |
| No Environmental Impacts |
0.210*** (0.041) | 0.195*** (0.039) | 0.263*** (0.033) | 0.212*** (0.031) | < 0.001 | Stable, slight increase (<3%) | |
| Non-SMMQR | 0.205*** (0.043) | 0.190*** (0.041) | 0.258*** (0.035) | 0.207*** (0.033) | < 0.001 | Stable, but lower (0.15) | |
| No Ln Transformation | 0.208*** (0.042) | 0.193*** (0.040) | 0.261*** (0.034) | 0.210*** (0.032) | < 0.001 | Stable, minor variation (<4%) |
Robustness check results across specifications.
**p< 0.01, ***p< 0.001.
Despite variations in spatial weighting matrices (Inverse Distance, Queen Contiguity, Economic Distance), non-spatial controls (MMQR), and data transformations (No Ln Transformation), TC consistently exerts highly significant (p< 0.001) positive impacts on both metrics, with coefficients ranging between 0.155 to 0.261 for CF and 0.105 to 0.219 for CWP, indicating a strong spatial connection. Minor variations (≤5%) throughout specifications, such as a small increase (≤3%) upon excluding environmental policy or a fall with the non-spatial model (p = 0.15), point to spatial dependence as important, but the overall findings are insensitive. These results imply that TC has environmental impacts consistently in coastal China, most likely due to its spatial clustering and economic interdependencies. Decision-makers are encouraged to prefer spatially targeted approaches, such as managing the intensity of tourism in high-impact coastal zones, to fight CF and CWP while taking advantage of the stability of these estimates to ensure effective, spatially conscious environmental management.
5 Discussions and conclusions
5.1 Robustness test
Based on the analysis results, the intensive FT operation facilitates tourism through digital payments, online booking sites, and money management, boosting TC in the areas. This complementarity exacerbates over-tourism, which is characterized by uncontrolled tourism streams leading to environmental degradation in the form of elevated CO2 emissions and CWP for HH clusters. The commonness of HH clusters suggests that tourism growth enabled by FT gives rise to hotspots of spatial pressure on the environment, while the uncommonness of HL and LH clusters corresponds to constrained spatial heterogeneity that suggests the need for targeted intervention.
To respond to over-tourism, policy paths should leverage these spatial effects. First, the use of FT solutions, such as real-time tourist flow monitoring and adaptive prices, can manage visitor quantities in HH concentrations like Sanya and Qingdao, reducing CO2 and water pollution by mitigating peak-season stress. Second, scaling up MGEI in green technology, i.e., green sea transport and wastewater treatment, can help enhance TC while keeping environmental impacts in check, particularly in tourist-dense areas. Third, spatial zoning policy should restrict tourism development in LL areas to prevent early saturation, preserving their environmental integrity without encouraging the over-tourism of HH districts. Guided by the spatial agglomeration of FT, TC, and MGEI, these policies are a scientifically guided approach to balancing economic development with a sustainable environment, facilitating the solution to the problems of over-tourism in coastal China effectively.
Consistent with previous studies (Han et al., 2021; Cheng et al., 2023), these findings prove that tourism intensity and FT increase CF owing to greater energy consumption from transportation and accommodation infrastructure and energy-demanding digital infrastructure. Specifically, the high and significant coefficients of and on CF (7.065–9.155 and 1.078–2.085, respectively, for quantiles = 0.1–0.9) identify their contribution to environmental degradation via spatial agglomeration in high-impact coastal hubs like Shanghai and Sanya. Similarly, the negative impact of on CWP (-6.215 to -10.145 and -3.038 to -6.858) is in line with Yang and Tang (2024), who noted that FT can mitigate water pollution through the use of advanced management methods, such as wastewater treatment and internet monitoring systems.
However, it meaningfully contributes to the existing literature by including TC, MGEI, and spatial factors into the equation, offering a comprehensive explanation of EI. In contrast to previous studies, which tended to concentrate narrowly on tourism numbers or FT uptake without accounting for spatial dependencies, our incorporation of spatial lag (), autoregressive (), and CSD () parameters—uniformly positive and significant (p< 0.001, from 0.275 to 0.312)—discloses high spatial auto-correlation that influences environmental effects. The LISA Cluster Maps also illustrate this with high HH clusters for TC, FT, and MGEI in cities, with minimal spatial variation (few HL and LH clusters), illustrating concentrated environmental pressure in coastal regions. This geographical emphasis indicates how MGEI promotes TC and FT to raise CF while lowering CWP through enhanced MGEI, like biomass and other renewable energy sources (Bui-Duy et al., 2023), rather than other types of fuel sources (Minh et al., 2024; Le and Xuan-Thi-Thu, 2024).
5.2 Policy recommendations
Based on these important findings, we propose the following specific policy recommendations:
-
Real-time tourist flow management in HH clusters: In HH clusters like Sanya, Haikou, and Guangzhou, where TC drives significant CF and CWP, FT solutions should be leveraged for real-time tourist flow monitoring and dynamic pricing. The use of mobile apps and blockchain-based platforms can help cap visitor numbers during peak seasons, thereby reducing environmental strain. These cities, with higher spatial lags, require coordinated regional policies to prevent tourism overflow to neighboring areas, such as implementing cross-provincial visitor quotas. To balance ecological protection with profitability, a phased approach may be considered, including quantifying the carrying capacity of smaller clusters for specific tourism activities, zoning, and establishing monitoring and supervision plans to adjust maximum capacity accordingly.
-
Prioritizing MGEI in lower-quantile regions: MGEI reduces CWP significantly in less developed regions with lower quantiles, including LL and LH clusters. Governments and local authorities should enhance green infrastructure, AI-based automated waste-sorting systems, AI-based monitoring systems (Bui-Minh et al., 2025), green transportation networks, and solar-power facilities to enhance carrying capacity while maintaining air quality. The application of institutional incentives may also be considered for private operators that proactively invest in environmentally friendly solutions. The low environmental impact in these regions should be utilized to scale up renewable energy infrastructure to support sustainable tourism growth. In addition, investments should also allocate resources to installing more recycling stations and enforcing fines for littering.
-
Spatial zoning in transitional zones (HL/LH Clusters): In HL and LH clusters, where local impacts differ from neighboring areas, spatial zoning policies should restrict tourism infrastructure expansion in high-impact zones while redirecting development to lower-impact areas. The HL cluster status suggests high local CF but lower regional spillovers, warranting localized restrictions on new hotel construction and incentives for eco-friendly transport (e.g., electric shuttle buses) to mitigate CF.
-
Mitigating FT’s environmental impact in high-quantile regions: In high-quantile regions, as FT amplifies CF and CWP, policies should focus on greener FT applications. Solutions, including incentivizing digital platforms to promote low-carbon tourism activities, can reduce energy-intensive transactions. Additionally, integrating FT with environmental monitoring systems can enhance real-time pollution tracking in these hubs. Integrating satellite data with digital device usage monitoring to estimate tourist flows, combined with ecological awareness campaigns and selected enforcement measures through FT techniques, should also be gradually considered for implementation.
5.3 Limitations and future research
There are some limitations that need to be considered for this study. Firstly, the hidden relationships between nodes within each cluster remain unexplored. For instance, intra-cluster dynamics, such as network interactions among tourism businesses, local governance structures, or socio-economic factors driving HH clustering in Sanya, were not analyzed. In the future, machine learning and deep learning techniques can be considered to exploit the hidden complex networks among nodes in each cluster and of the LISA map, as they can offer a complementary approach by modeling non-linear patterns and high-dimensional interactions (Ta et al., 2025; Le, 2025). Also, by leveraging the spatial concentration of TC and FT, as embodied in the intense HH clusters in Sanya, Qingdao, and Shanghai, this paper opens up new prospects for the formulation of spatially targeted policies. For instance, future research may suggest integrating FT-driven tools, e.g., real-time tracking of tourist flows and dynamic pricing mechanisms, into zoning policy to manage visitor numbers in high-impact areas, reducing CF while maintaining CWP benefits. This model can be applied to develop an index system for measuring the benchmark of over-tourism, utilizing the insights provided. Future research can be proposed for monitoring this issue in favored tourist destinations based on this index.
Statements
Data availability statement
The original contributions presented in the study are included in the article/Supplementary Material. Further inquiries can be directed to the corresponding authors.
Author contributions
QS: Conceptualization, Data curation, Formal Analysis, Investigation, Methodology, Software, Validation, Visualization, Writing – original draft, Writing – review & editing. XW: Formal Analysis, Methodology, Writing – original draft, Writing – review & editing. LC: Conceptualization, Data curation, Software, Supervision, Writing – original draft, Writing – review & editing. MY: Conceptualization, Funding acquisition, Investigation, Writing – original draft, Writing – review & editing.
Funding
The author(s) declare that no financial support was received for the research and/or publication of this article.
Conflict of interest
The authors declare that the research was conducted in the absence of any commercial or financial relationships that could be construed as a potential conflict of interest.
Generative AI statement
The author(s) declare that no Generative AI was used in the creation of this manuscript.
Any alternative text (alt text) provided alongside figures in this article has been generated by Frontiers with the support of artificial intelligence and reasonable efforts have been made to ensure accuracy, including review by the authors wherever possible. If you identify any issues, please contact us.
Publisher’s note
All claims expressed in this article are solely those of the authors and do not necessarily represent those of their affiliated organizations, or those of the publisher, the editors and the reviewers. Any product that may be evaluated in this article, or claim that may be made by its manufacturer, is not guaranteed or endorsed by the publisher.
Supplementary material
The Supplementary Material for this article can be found online at: https://github.com/MQY446/SMMQR
References
1
Banerjee S. George A. (2024). Identifying overtourism & spill-over tourism using ST-DBSCAN analysis for sustainable management of tourism. Curr. Issues Tour. doi: 10.1080/13683500.2024.2382378
2
Barbhuiya M. R. (2021). Overtourism in Indian cities: a case study of Nainital. Int. J. Tour. Cities.7, 702–724. doi: 10.1108/IJTC-08-2019-0148
3
Berenguer-Rico V. Wilms I. (2021). Heteroscedasticity testing after outlier removal. Econom. Rev.40, 51–85. doi: 10.1080/07474938.2020.1735749
4
Breiby M. A. Øian H. Aas Ø. (2021). “‘Good’, ‘bad’ or ‘ugly’ tourism? Sustainability discourses in nature-based tourism,” in Nordic Perspectives on Nature-Based Tourism: From Place-Based Resources to Value-Added Experiences. (Massachusetts, USA: Edward Elgar Publishing Limited), 130–142. doi: 10.4337/9781789904031.00018
5
Bui-Duy L. Le L. T. Vu-Thi-Minh N. Hoang-Huong G. Bui-Thi-Thanh N. Nguyen P. N. (2023). Economic and environmental analysis of biomass pellet supply chain using simulation-based approach. Asia. Pac. Manage. Rev.28, 470–486. doi: 10.1016/j.apmrv.2023.02.002
6
Bui-Minh T. Giang N. L. Le L. T. (2025). Efficient method for trademark image retrieval: leveraging siamese and triplet networks with examination-informed loss adjustment. Comput. Mater. Contin.84, 1203–1226. doi: 10.32604/cmc.2025.064403
7
Capocchi A. Vallone C. Pierotti M. Amaduzzi A. (2019). Overtourism: A literature review to assess implications and future perspectives. Sustain11, 3303. doi: 10.3390/su11123303
8
Chamizo-Nieto F. J. Salazar N. N. G. D. Rosa-Jiménez C. Reyes-Corredera S. (2023). Touristification and conflicts of interest in cruise destinations: the case of main cultural tourism cities on the spanish mediterranean coast. Sustain15, 6403. doi: 10.3390/su15086403
9
Chatti W. Majeed M. T. (2022). Information communication technology (ICT), smart urbanization, and environmental quality: Evidence from a panel of developing and developed economies. J. Clean. Prod.366, 132925. doi: 10.1016/j.jclepro.2022.132925
10
Cheng X. Yao D. Qian Y. Wang B. Zhang D. (2023). How does fintech influence carbon emissions: Evidence from China’s prefecture-level cities. Int. Rev. Financ. Anal.87, 102655. doi: 10.1016/j.irfa.2023.102655
11
China N. B. (2024). China statistics yearbook. Available online at: https://www.stats.gov.cn/english (Accessed September 15, 2024).
12
Csmonitor (2016). Venexodus: Why residents are fleeing ‘fragile’ Venice, Italy. Available online at: https://www.csmonitor.com/World/2016/1112/Venexodus-Why-residents-are-fleeing-fragile-Venice-Italy (Accessed August 13, 2025).
13
Dilshan N. W. T. Nakabasami C. (2025). Overtourism: a systematic review of global issues and management strategies. Int. J. Tour. Policy15, 50–66. doi: 10.1504/IJTP.2025.144178
14
Ehigiamusoe K. U. Shahbaz M. Vo X. V. (2023). How does globalization influence the impact of tourism on carbon emissions and ecological footprint? Evidence from african countries. J. Travel. Res.62, 1010–1032. doi: 10.1177/00472875221113886
15
Fan M. Lu Z. Zhou Y. Wang J. (2024). Threshold and spillovers effects of fintech on China’s energy dependence on fossil fuel. Resour. Policy.91, 104890. doi: 10.1016/j.resourpol.2024.104890
16
Fernandes P. O. Nunes A. M. Veloso C. M. Santos E. Ferreira F. A. Fonseca M. J. (2020). Spatial and temporal concentration of tourism supply and demand in northern Portugal. Application of the herfindahl-hirschman index. Smart. Innovat. Syst. Technol.171, 263–273. doi: 10.1007/978-981-15-2024-2_24
17
Fethi S. Senyucel E. (2021). The role of tourism development on CO2 emission reduction in an extended version of the environmental Kuznets curve: evidence from top 50 tourist destination countries. Environ. Dev. Sustain.23, 1499–1524. doi: 10.1007/s10668-020-00633-0
18
Fischer-Kowalski M. Löw M. Noll D. Petridis P. Skoulikidis N. (2020). Samothraki in transition: A report on a real-world lab to promote the sustainability of a Greek Island. Sustain12, 1932. doi: 10.3390/su12051932
19
Foronda-Robles C. Galindo-Perez-de-Azpillaga L. Armario-Perez P. (2025). The sustainable management of overtourism via user content. Ann. Tour. Res. Empir. Insights6, 100184. doi: 10.1016/j.annale.2025.100184
20
García-Amaya A. M. Temes-Cordovez R. Simancas-Cruz M. Peñarrubia-Zaragoza M. P. (2021). The Airbnb effect on areas subject to urban renewal in Valencia (Spain). Int. J. Tour. Cities.7, 361–390. doi: 10.1108/IJTC-03-2020-0041
21
Gholipour H. F. Esfandiar K. Rasoolimanesh S. M. (2024). Visitor caps: what potential impact on the world tourism industry? Available online at: https://www.economicsobservatory.com/visitor-caps-what-potential-impact-on-the-world-tourism-industry (Accessed August 13, 2025).
22
Gupta V. Chomplay P. (2021). “Local residents’ Perceptions regarding the negative impacts of overtourism: A case of shimla,” in Overtourism as Destination Risk: Impacts and Solutions. (Bingley, UK: Emerald Publishing Limited), 69–80. doi: 10.1108/978-1-83909-706-520211006
23
Gurran N. Phibbs P. (2017). When tourists move in: how should urban planners respond to airbnb? J. Am. Plan. Assoc.83, 80–92. doi: 10.1080/01944363.2016.1249011
24
Han Z. Li T. Liu X. (2021). Temporal and spatial characteristics and evolution of China’s inbound tourism carbon footprint. J. Resour. Ecol.12, 56–67. doi: 10.5814/j.issn.1674-764x.2021.01.006
25
Hwang Y. Park S. Shin N. (2021). Sustainable development of a mobile payment security environment using fintech solutions. Sustain13, 8375. doi: 10.3390/su13158375
26
Institute National Geography Information - Ministry of Land Infrastructure and Transport (2023). Korea water quality monitoring. Natl. ATLAS. KOREA.
27
Ji X. Ding X. (2024). Analysis on the relationship between coastal tourism and marine pollution: an empirical analysis of China’s 11 coastal regions. Front. Mar. Sci.11. doi: 10.3389/fmars.2024.1471467
28
Kai Z. Sharaf M. Wei S. Y. Shraah A. Al, Le L. T. Arvind Bedekar D. A. et al . (2024). Exploring the asymmetric relationship between natural resources, fintech, remittance and environmental pollution for BRICS nations: New insights from MMQR approach. Resour. Policy.90, 104693. doi: 10.1016/j.resourpol.2024.104693
29
Kukreti M. Dangwal A. (2023). “An empirical analysis of sustainable strategies to surmount overtourism in Oman,” in Digital transformation, Strategic Resilience, Cyber Security and Risk Management (Contemporary Studies in Economic and Financial Analysis). (Leeds, UK: Emerald Publishing Limited), vol. 111B., 107–122. doi: 10.1108/s1569-37592023000111b007
30
Kumail T. Sadiq M. Ali W. Sadiq F. (2023). The impacts of tourism development on income inequality: how does tourism capital investment contribute to income distribution? Tourism Agenda 2030. Tour. Rev.78, 630–645. doi: 10.1108/TR-08-2022-0378
31
Kurniawan F. Adrianto L. Bengen D. G. Prasetyo L. B. (2023). Hypothetical effects assessment of tourism on coastal water quality in the Marine Tourism Park of the Gili Matra Islands, Indonesia. Environ. Dev. Sustain.25, 7959–7985. doi: 10.1007/s10668-022-02382-8
32
Le L. T. (2025). Uncovering import document fraud: leveraging the deep learning approach. Glob. Trade. Cust. J.20, 3–10. doi: 10.54648/gtcj2025002
33
Le L. T. Lee G. Kim H. Woo S. H. (2020b). Voyage-based statistical fuel consumption models of ocean-going container ships in Korea. Marit. Policy Manage.47, 304–331. doi: 10.1080/03088839.2019.1684591
34
Le L. T. Lee G. Park K. S. Kim H. (2020a). Neural network-based fuel consumption estimation for container ships in Korea. Marit. Policy Manage.47, 615–632. doi: 10.1080/03088839.2020.1729437
35
Le L. T. Xuan-Thi-Thu T. (2024). Discovering supply chain operation towards sustainability using machine learning and DES techniques: a case study in Vietnam seafood. Marit. Bus. Rev.9, 243–262. doi: 10.1108/MABR-10-2023-0074
36
Leng C. Wei S. Y. Al-Abyadh M. H. A. Halteh K. Bauetdinov M. Le L. T. et al . (2024). An empirical assessment of the effect of natural resources and financial technologies on sustainable development in resource abundant developing countries: Evidence using MMQR estimation. Resour. Policy.89, 104555. doi: 10.1016/j.resourpol.2023.104555
37
Li H. Ji J. Chen G. Khan A. (2023). Tourism development effectiveness in enhancing wellbeing in developing countries: A reality or myth. J. Qual. Assur. Hosp. Tour.26, 411–437. doi: 10.1080/1528008X.2023.2249608
38
Li X. Abed A. M. Shaban M. Le L. T. Zhou X. Abdullaev S. et al . (2024). Artificial intelligence application for assessment/optimization of a cost-efficient energy system: Double-flash geothermal scheme tailored combined heat/power plant. Energy313, 133594. doi: 10.1016/j.energy.2024.133594
39
Minh N. V. T. Duy L. B. Le L. T. Huong G. H. Anh S. T. (2024). Supply chain disruption for crude oil due to the effect of COVID-19 pandemic: evidence from Vietnam. Int. J. Logist. Syst. Manage.48, 326–349. doi: 10.1504/IJLSM.2024.140061
40
Muhammad S. Pan Y. Magazzino C. Luo Y. Waqas M. (2022). The fourth industrial revolution and environmental efficiency: The role of fintech industry. J. Clean. Prod.381, 135196. doi: 10.1016/j.jclepro.2022.135196
41
Ochoa-Moreno W. S. Quito B. Enríquez D. E. Álvarez-García J. (2022). Evaluation of the environmental Kuznets curve hypothesis in a tourism development context: evidence for 15 Latin American countries. Bus. Strateg. Environ.31, 2143–2155. doi: 10.1002/bse.3012
42
Ormaza-Gonzaìlez F. I. Castro-Rodas D. Statham P. J. (2021). COVID-19 impacts on beaches and coastal water pollution at selected sites in Ecuador, and management proposals post-pandemic. Front. Mar. Sci.8. doi: 10.3389/fmars.2021.669374
43
Pásková M. Štekerová K. Zanker M. Lasisi T. T. Zelenka J. (2024). Water pollution generated by tourism: Review of system dynamics models. Heliyon10, e23824. doi: 10.1016/j.heliyon.2023.e23824
44
Raihan A. (2024). The interrelationship amid carbon emissions, tourism, economy, and energy use in Brazil. Carbon. Res.3, 1–24. doi: 10.1007/s44246-023-00084-y
45
Ramsey A. F. (2020). Probability distributions of crop yields: A bayesian spatial quantile regression approach. Am. J. Agric. Econ.102, 220–239. doi: 10.1093/ajae/aaz029
46
Ran L. Yan G. Goyal V. Abdullaev S. Alhomayani F. M. Le L. T. et al . (2024). Advancing solar thermal utilization by optimization of phase change material thermal storage systems: A hybrid approach of artificial neural network (ANN)/Genetic algorithm (GA). Case Stud. Therm. Eng.64, 105513. doi: 10.1016/j.csite.2024.105513
47
Shahbaz M. Patel N. (2024). Sustainable development in a carbon-conscious world: Quantile regression insights into CO2 emission drivers. Nat. Resour. Forum.49, 1560–1583. doi: 10.1111/1477-8947.12449
48
Shan H. Wong W. K. Hu H. Shraah A. Al, Alromaihi A. The Cong P. et al . (2024). Fintech innovation for sustainable environment: Understanding the role of natural resources and human capital in BRICS using MMQR. Resour. Policy.88, 104468. doi: 10.1016/j.resourpol.2023.104468
49
Siddik A. B. Rahman M. N. Yong L. (2023). Do fintech adoption and financial literacy improve corporate sustainability performance? The mediating role of access to finance. J. Clean. Prod.421, 137658. doi: 10.1016/j.jclepro.2023.137658
50
Suyunchaliyeva M. M. Nautiyal R. Shaikh A. A. Sharma R. (2021). The use of mobile payment systems in post-COVID-19 economic recovery: Primary research on an emerging market for experience goods. Sustain13, 13511. doi: 10.3390/su132413511
51
Ta A. S. Le L. T. Bui-Duy L. (2025). Advanced vehicle monitoring in smart port utilizing deep denoising real-time object detectors integrated multi-resolution attention-augmented CRNN. Ain. Shams. Eng. J.16, 103483. doi: 10.1016/j.asej.2025.103483
52
Tavor T. (2024). Impact of announcements on capital market performance in emerging markets: a parametric and non-parametric analysis. Int. J. Emerg. Mark. doi: 10.1108/IJOEM-05-2023-0852
53
UNWTO (2022). Enabling Frameworks for Tourism Investment Drivers and Challenges shaping Investments in Tourism. Available online at: https://www.unwto.org/investment/un-tourism-investment-guidelines-SA1:~:text (Accessed November 25, 2024).
54
WEPA (2024). WEPA database. Available online at: https://wepa-db.net/ (Accessed February 27, 2024).
55
Yang Y. (2012). Agglomeration density and tourism development in China: An empirical research based on dynamic panel data model. Tour. Manage.33, 1347–1359. doi: 10.1016/j.tourman.2011.12.018
56
Yang M. Tang X. (2024). Investigating the asymmetric impact of tourism, green fiscal policy, and fintech on environmental emissions and coastal water quality: an empirical study using the method of moments quantile regression. Front. Environ. Sci.12. doi: 10.3389/fenvs.2024.1499558
57
Zemła M. (2020). Reasons and consequences of overtourism in contemporary cities-Knowledge gaps and future research. Sustain12, 1729. doi: 10.3390/su12051729
58
Zhan L. (2024). Revisiting dynamic linkages among ecological sustainability, tourism, and climate change in China. Environ. Sci. pollut. Res. Int.31, 1517–1529. doi: 10.1007/s11356-023-30820-1
59
Zhu Y. Lin Y. Tan Y. Liu B. Wang H. (2024). The potential nexus between fintech and energy consumption: A new perspective on natural resource consumption. Resour. Policy.89, 104589. doi: 10.1016/j.resourpol.2023.104589
Summary
Keywords
over-tourism, spatial method of moment quantile regression, tourism concentration, fintech, marine green energy investment, carbon footprint, coastal water pollution
Citation
Sun Q, Wang X, Cheng L and Yang M (2025) Over-tourism and green investments: spatial MMQR insights on China’s coastal pollution and carbon emissions. Front. Mar. Sci. 12:1605039. doi: 10.3389/fmars.2025.1605039
Received
02 April 2025
Accepted
28 August 2025
Published
24 September 2025
Volume
12 - 2025
Edited by
Kevin Li, University of Windsor, Canada
Reviewed by
Franklin Isaac Ormaza-González, ESPOL Polytechnic University, Ecuador
Xina Ji, Ningbo University of Finance and Economics, China
Updates
Copyright
© 2025 Sun, Wang, Cheng and Yang.
This is an open-access article distributed under the terms of the Creative Commons Attribution License (CC BY). The use, distribution or reproduction in other forums is permitted, provided the original author(s) and the copyright owner(s) are credited and that the original publication in this journal is cited, in accordance with accepted academic practice. No use, distribution or reproduction is permitted which does not comply with these terms.
*Correspondence: LiWei Cheng, 18184496466@163.com; LWCheng183763@mgmchinaholdings.com
†These authors have contributed equally to this work
Disclaimer
All claims expressed in this article are solely those of the authors and do not necessarily represent those of their affiliated organizations, or those of the publisher, the editors and the reviewers. Any product that may be evaluated in this article or claim that may be made by its manufacturer is not guaranteed or endorsed by the publisher.