 Zhihao Liu
 Ziyin Wu1,2*
- 1School of Oceanography, Shanghai Jiao Tong University, Shanghai, China
- 2State Key Laboratory of Submarine Geosciences & Second Institute of Oceanography, Ministry of Natural Resources, Hangzhou, China
- 3Department of Marine Sciences, Zhejiang University, Zhoushan, China
Pockmark development and slope instability are key geological processes shaping the continental slope. In this study, high-resolution multibeam data, subbottom profiles, and a reprocessed two-dimensional seismic profile were used to identify and analyze the complex geomorphic features of landslides and pockmarks in the southern South China Sea. We analyzed the morphology of a landslide and 340 surrounding pockmarks, which are distributed on both sides of the landslide and exhibit a stepped pattern. Different from the pockmark deformation only along the slope, pockmarks in the study area exhibited deformation cross the slope. Based on the feature and distribution of pockmarks relative to the landslide, it is inferred that the development of the pockmarks triggers the landslide. Within the same depth interval, gravity and shear forces acting on the pockmarks intensify progressively from the center toward the flanks. In addition, tensile fracturing of the pockmarks significantly influences cross-slope deformation. On this basis, we established a three-stage model of pockmark evolution.
1 Introduction
The area from the continental shelf to the ocean basin is an area of frequent geohazards, where the slope instability shapes different types of submarine geomorphology. Submarine pockmarks were first discovered on the Scotian Shelf, Canada (King and MacLean, 1970), as erosional features formed by the overflow of shallow fluids to the seafloor surface (Hovland et al., 2002; Xu et al., 2020). Pockmarks are distributed mainly in shallow waters, fjords, and continental slopes but also occasionally in deep-water areas (Hillman et al., 2023; Hovland et al., 2010). Pockmarks, characterized by random distribution or linear arrangement under the influence of bottom seepage, sediment transport, and downslope bottom currents (Cronin et al., 2022; Warnke et al., 2023), gradually change the topography of the seafloor over time (Pilcher and Argent, 2007; Wenau et al., 2017).
Pockmark development and slope instability are some of the geological processes that shape the continental slope. Understanding the close connection between pockmarks and slope instability in such areas is critical for assessing modern geomorphology formation and future continental slope safety (Hovland and Judd, 1988). Pockmarks with apparent spatial distribution correlation are indicative of historical sedimentary structures and geologic processes (Andresen et al., 2008; Dandapath et al., 2010; Gay et al., 2006; Spatola et al., 2025a, 2025). Fluid seepage during pockmark development can cause the strength of the lower sediment to gradually weaken; therefore, the presence and development of pockmarks can reflect the instability of the continental slope (Ismail et al., 2022, 2024; Riboulot et al., 2013, 2019; Sun et al., 2017; Sun and Leslie, 2020). Slope instability hazards such as submarine landslides cause the greatest damage to the marine environment (Normandeau et al., 2021; Zhu et al., 2019). Seismicity, sea level rise/fall, volcanic activity and gas hydrate decomposition are important factors triggering submarine landslides (Aiello, 2025; Aiello and Caccavale, 2022; Meo and Senatore, 2023; Riera et al., 2022), in which fluid activity is a key corresponding factor that influences the formation of pockmarks and landslides (Kopp et al., 2021).
Different geological conditions can lead to different stress changes, influencing pockmarks formation and development (Kilhams et al., 2011; Maestrelli et al., 2020). Landslide damage triggers changes in the sedimentary layers that can lead to destruction of pockmarked morphology. Loose sediments saturated with pore water at the tail of landslides can create overpressure and seepage condition, suggesting that changes in buried geological structures due to submarine landslides have potential impact on the formation and development of pockmarks (McAdoo et al., 2000; Micallef et al., 2022, 2018; Riera et al., 2022). Correspondingly, during pockmark development under the condition of overpressure, the overpressure condition affecting the sediments in the fluid escape channel leads to decline in the shear strength of the sediment, thereby forming a weak surface that could induce the occurrence of shallow landslides (Clare et al., 2019).
Pockmarks in the northern and western of the South China Sea (SCS) are mainly distributed in the downstream areas of canyons and sedimentary basins, and their morphological and formation mechanisms have been extensively studied (Wang et al., 2024; Wu et al., 2023; Zhu et al., 2021). The study of pockmarks in the northern SCS focuses on the identification and characterization of gas sources and fluid seepage pathways during their formation (Sun et al., 2017, 2012), while the study in the western is more concerned with the erosional modification of pockmarks by bottom current activities and its impact on the formation of transport channels (Chen et al., 2015; Li et al., 2024; Yu et al., 2021). Conversely, pockmarks in the southern SCS are relatively poorly reported. Pockmarks in this region are usually developed at the edge of carbonate platforms or around coral reefs (Liu et al., 2021). They are also closely associated with mud volcanoes that are spread out along chains and with slope stability (Warren et al., 2011). These pockmarks are controlled by deep fracture, and they show higher activity and larger morphological scales (Traynor and Sladen, 1997; Zhang et al., 2020b). Fluid seepage has facilitated carbonate dissolution, leading to pockmark morphologies that differ significantly from those in the northern and western clastic-dominated depositional areas. This study characterizes the modern seafloor geomorphology of the southern continental slope of the SCS. Integrating newly acquired multibeam bathymetry, subbottom profiler data, and a reprocessed seismic reflection profile, we report for the first time the widespread occurrence of pockmarks across this region. We further investigate the genetic relationship between slope instability and pockmark formation, analyzing distinctive deformation patterns of pockmarks in the along-slope and cross-slope direction. An evolution model of pockmark development is established, providing a mechanistic basis for understanding slope stability and potential geohazards.
2 Geological setting
The SCS is the largest sea in the western Pacific, and it comprises several Cenozoic rift basins formed under regional extensional stress (Sibuet et al., 2016; Taylor and Hayes, 1983). The southern South China Sea (SCS) is an area with dense Miocene carbonate development (Liu et al., 2021, 2022). Seamounts and deep-water areas are emerging as promising new frontiers for future oil and gas resources in the SCS (Huang et al., 2022; Qiao et al., 2024).
The study area (Figure 1A) is located at the southern part of the SCS, where the seafloor is interspersed with submarine troughs and valleys, and where islands and coral reefs are widely distributed. The southern continental margin of the SCS reflects a complex tectonic pattern, with a strong fault depression in the north that occurred prior to the rupture of the southwest subbasin, thrusting from Borneo in the south, subduction beneath Luzon in the east, and strike–slip shearing of the West Baram fault in the west (Cullen, 2010; Franke et al., 2008). The main tectonic direction of the region is aligned NE–SW. Regional structural ridges throughout the entire area provide shallow water environments for coral reef development (Steuer et al., 2014).
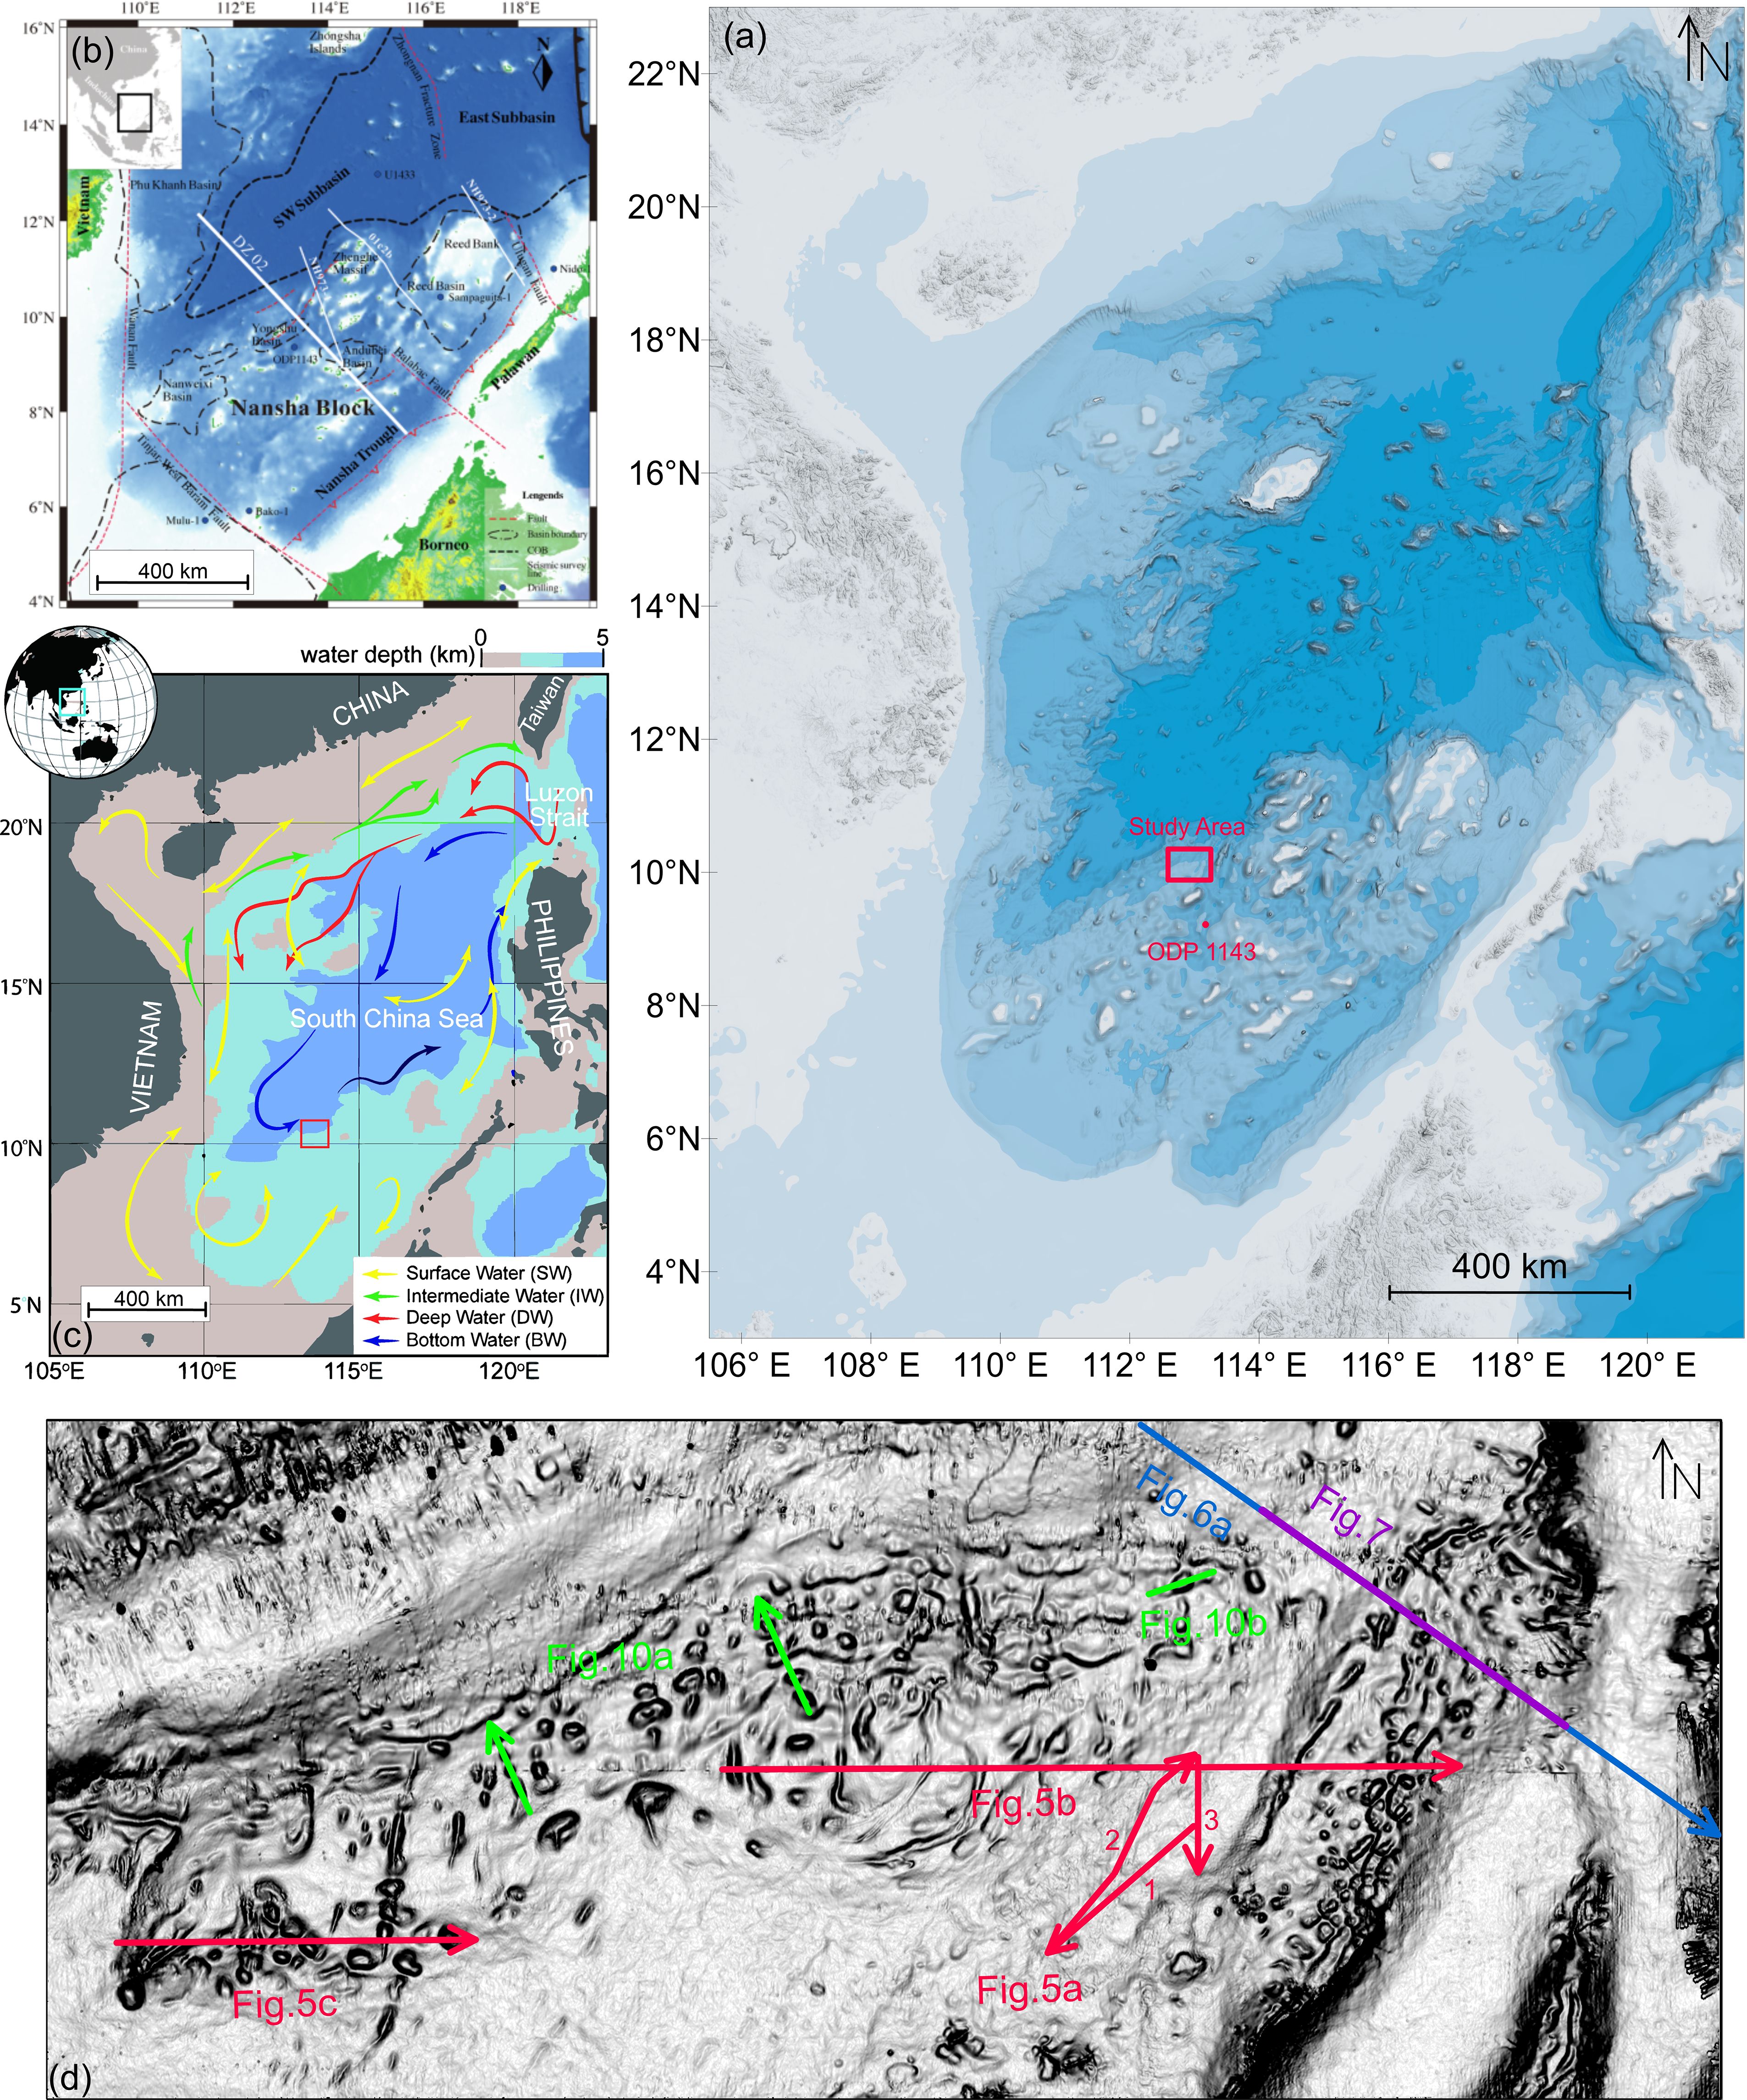
Figure 1. Regional geological background and data distribution in the study area: (a) extent of the South China Sea and location of the study area (modified from Zhang et al., 2020a, with permission from Elsevier), (b) major tectonic ruptures in the southern South China Sea (modified from Zhang et al.,2020a, with permission from Elsevier), (c) flow directions of water bodies in the South China Sea (modified from Liu et al., 2021, with permission from Elsevier), and (d) surveying data distribution in the study area (red lines: subbottom profiles, blue line: intercepted multichannel seismic profile, and green lines: pockmark profiles).
Sediment in the study area comprises mixed siliceous and calcareous mud. The result of the Ocean Drilling Program (ODP) 1143 site, which drilled during ODP Leg 184, indicated that the basement is covered by hundreds of meters of Miocene–Pleistocene carbonate sediments (Chang et al., 2022; PrellW and Blum, 2000), forming an important hydrocarbon reservoir. Chalky clay, found mainly in continental slope areas at water depth of >200 m, primarily consists of bioclastic debris dominated by foraminiferal shells (Wang and Ding, 2023). The silt content is approximately 40% and the coarse grain content (diameter: >0.063 mm) is 2%–5%. Increased input of terrestrially derived detritus since the Oligocene has led to dramatic increase in regional sedimentation rates (Liu et al., 2022). The SCS is a semi-enclosed sea with water bodies classified into four types: surface water, intermediate water, deep water, and bottom water (Figure 1C). Simulation of the flow field in the southern SCS revealed that the mixing process caused by tides and eddy currents enhances the deep circulation, and internal tides at depth below 1400 m to the northwest of the Nansha Islands increase the bottom flow velocity, which can reach 10 cm/s (Shu et al., 2016).
3 Data and method
The study area, approximately 4200 km2 with water depth of 1200–3500 m, is imaged by high-resolution multibeam bathymetric data, subbottom profile data, and a reprocessed two-dimensional (2D) multichannel seismic profile (data distribution is shown in Figure 1D). High-resolution bathymetric and subbottom data were obtained during a survey cruise conducted in 2021. Bathymetric data were acquired with a Seabeam3012, which can provide real-time full-attitude motion compensation with measurement accuracy better than 1% water depth. The bathymetric data were processed for tide correction, sound velocity correction, line editing, and CUBE filtering, to obtain a bathymetric grid with 50-m resolution. The CUBE algorithm operates through a joint uncertainty estimation approach (Calder and Mayer, 2003). It calculates both horizontal and vertical uncertainties for each sounding, then performs statistical ranking and hypothesis generation within a defined spatial neighborhood. This process produces multiple estimated depth values along with their corresponding uncertainties referred to as “hypothetical depth”. Based on these hypotheses and their associated uncertainties, the algorithm employs dynamic Kalman filtering to conduct surface fitting and remove outliers, resulting in an optimally estimated bathymetric surface (Dineng et al., 2020).
The subbottom profile data were collected using a Bathy 2010 profiler with maximum penetration depth of 200 m. The optimal penetration depth and sample resolution were improved by adjusting the receiver gain, TVG gain and receiving frequency band. We used conventional postprocessing that included automatic gain control and filtering. Information about the shallow strata of the study area was obtained by manual interpretation, providing important reference for the study of subbottom sediments and the fluid escape channel.
The multichannel seismic profile covering the study area comprises a partial section (approximately 40 km) of the DZ02 profile in the SCS. The streamer was 1487.5 m long with 12.5 m channel spacing, and the seismic source was a 1340 inch3 air-gun array. The effective record length was 12 s and the sampling interval was 2 ms. To improve the resolution of seismic data, we apply several multiple attenuation procedures and adaptive ghost-wave suppression techniques. This workflow included noise attenuation, continuation phase suppression, multiple attenuation (e.g., surface-related multiple elimination (SRME) and deep diffraction multiples attenuation technique (DIMAT), source-side deghosting (SSD), and tract editing. We applied Kirchhoff pre-stack depth migration, which is capable of better imaging the true structural geometry in cases of strong lateral velocity variations (Zhang et al., 2020a).
Accurate delineation of pockmark boundaries provides support for determining the sedimentary changes inside/outside the pockmarks and the stage of pockmark development (Fowler et al., 2008; Gafeira et al., 2018, 2012; Lecours et al., 2016). By quickly and accurately obtaining the locations and boundaries of pockmarks, we effectively reduced the work involved in preliminary geomorphological analysis. We used an edge detection algorithm to segment the threshold value of the pockmark through the slope gradient (according to the opposite slope inside and outside the pockmark, the slope gradient is the maximum value at the boundary), simplified and smoothed the extraction boundaries, and then finally obtained the characteristic factors of the pockmarks. These factors (Table 1) included the long axis of the pockmark, the short axis and depth. According to Hovland’s classification criteria, pockmarks can be divided into three categories according to the aspect ratio: circular pockmarks (aspect ratio: 1.0–1.5), elliptical pockmarks (aspect ratio: 1.5–2.0), and elongated pockmarks (aspect ratio: >2.0).
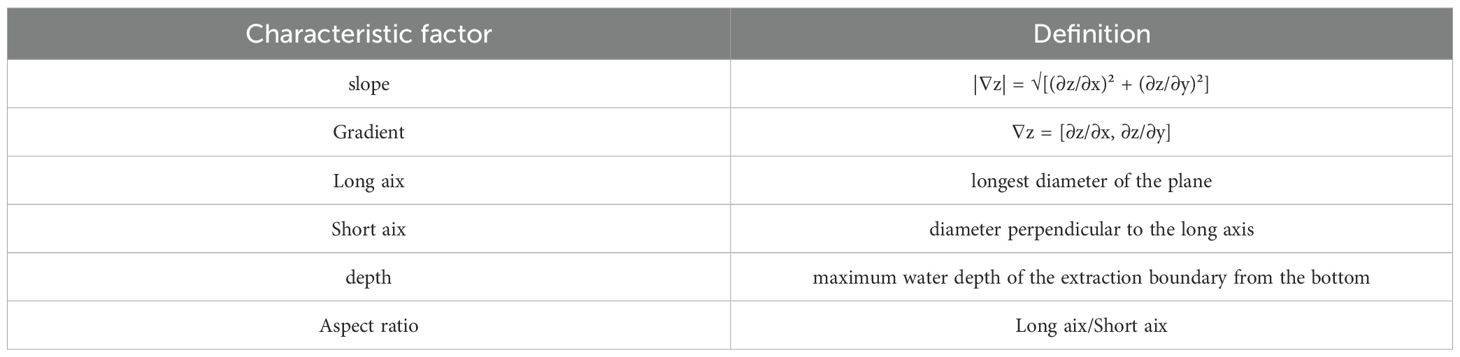
Table 1. Characteristic factors of pockmarks.
The quality of the data has been demonstrated to have a substantial impact on the study result. The multibeam bathymetry data used in this study, with a grid resolution of 50 meters, effectively captures the morphology and scale of the pockmarks within the study area and supports comprehensive geomorphological analysis. Subbottom profile data, collected using a vessel-mounted fixed system, show limited penetration in deep-water environments and provide insufficient resolution to clearly distinguish between different submarine stratigraphic units. Nonetheless, these data are still capable of identifying acoustic anomalies and revealing discontinuities within sedimentary layers. Multi-channel seismic data reveal tectonic framework of the study area and unveil buried morphological and fluid escape features, yielding valuable supplementary insights for this research.
4 Results
4.1 Morphological analysis of seafloor geomorphology
4.1.1 Morphology and characteristics of landslide
We identified typical seafloor morphological on the digital bathymetric model of the study area (Figure 2A). As shown in Figure 2, the overall and detailed features of the residual geomorphology can be clearly observed in the bathymetric map and available profiles. The study area is located on a slope adjacent to the Southwest Subbasin, which contain many depressions and a landslide.
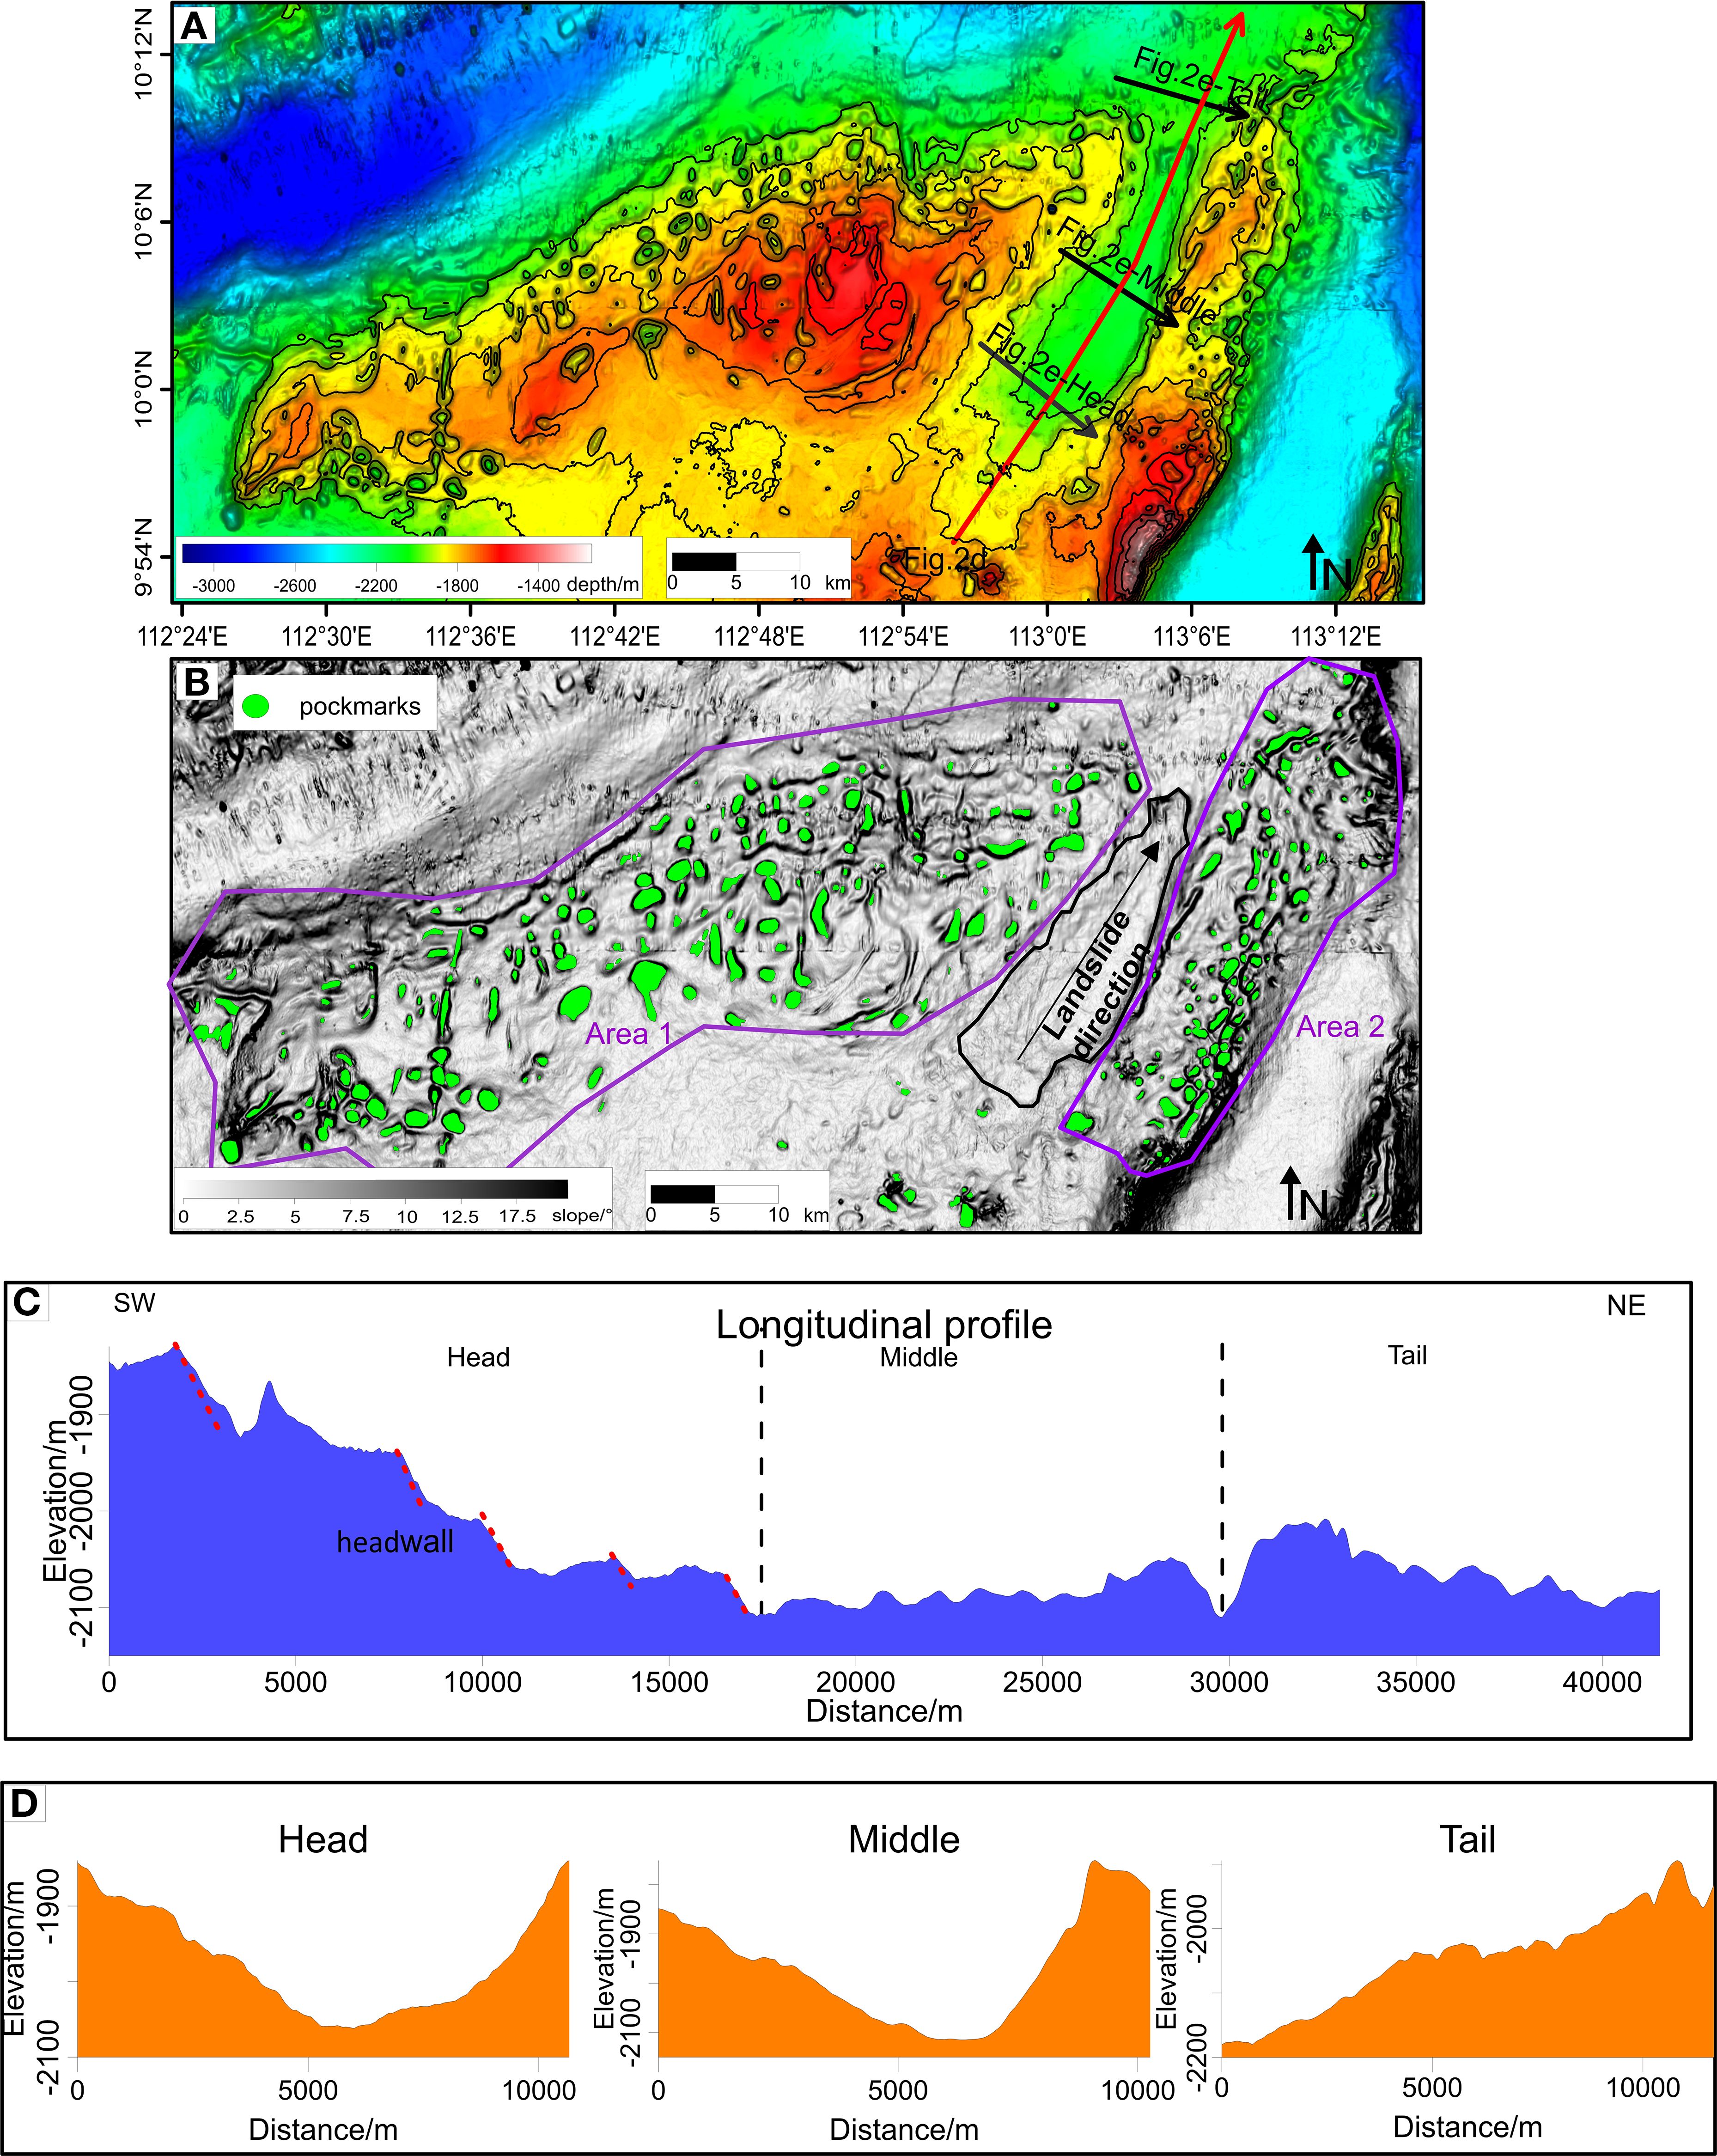
Figure 2. Modern seafloor geomorphology and characteristics of the study area: (A) bathymetry of the study area, red line show the longitudinal profile through the landslide, black show the transversal profile (B) slope map of the study area with areas of pockmarks delineated by purple lines where pockmarks are highlighted with green areas, and landslide area delineated by black lines, (C) profile of the landslide along red line in (A) and (D) transversal profiles across the head, middle, and tail areas of the landslide (corresponding to black lines in (A).
The area of the landslide is approximately 356 km2. The landslide can be divided into the head area, middle area, and tail area based on the evident morphology, which present the characteristics of a steep head, smooth middle, and debris accumulation in the tail.
We observed that the water depth at the head varies greatly from 1800 to 2100 m, and that the headwall at different water depths is clearly identifiable in the bathymetric map (marked by gray dashed lines in Figure 2A). The topographic section (Figure 2D) shows that the back edge of the landslide at the head is distributed as a cliff layer parallel to the slope, and that the slope between the layers is similar, showing an overall step-down. The sidewalls in the cross section at the head are distributed symmetrically in the form of a circular arc (Figure 2D). The middle of the landslide is an area with flat terrain, and the overall water depth is about to 2100 m. Pockmark development and slope instability are some of the geological processes that shape the continental slope. Understanding the close connection between pockmarks and slope instability in such areas is critical for assessing modern landform formation and future continental slope safety, and the depth here is greatest owing to subbottom stripping. The slope of the sidewall of the middle of is steeper on both sides, whereas the slope of the center area is gentle, constituting the collapsed valley of the landslide (Figure 2D).
At the tail of the profile (Figure 2C), sediment accumulation is formed in the flat slope area through deposition of upstream sediments, shown as sediment clusters in the topographic data. The degree of fluctuation is large and the overall water depth is greater than that at the middle of the landslide, extending vertically from the continental slope to the deep-water basin. At the tail of the landslide, the sediments are compressed and accumulated to one side (Figure 2D).
4.1.2 Morphological and distribution of pockmarks
Overall, 340 pockmarks were identified in the study area (Figure 2C). Spatially, the pockmarks are distributed in the left, right, and upstream areas of the landslide. Various statistical results about the pockmarks are shown in Figure 3. According to the statistical data, the plane diameter of the pockmarks is correlated positively with the pockmark depth (Figure 3A). The diameter of the pockmarks is concentrated in the range of 100–300 m, which categorizes them as large pockmarks according to the principle of diameter classification (Hovland, 2007). However, a correlation between pockmark depth and diameter is not obvious with increase in pockmark diameter. The long-axis rose diagram of the pockmarks, presented in Figure 3B, shows that alignment in the N–S direction is dominant. However, the long axis of the pockmarks in the study area is limited by the topography of the slope; consequently, the long axis of the pockmarks develops along different downslope directions. The distribution relationship between the number and the depth of the pockmarks is characterized as a Gaussian normal distribution, and the main depth of the pockmarks in the study area is 1700–2200 m.
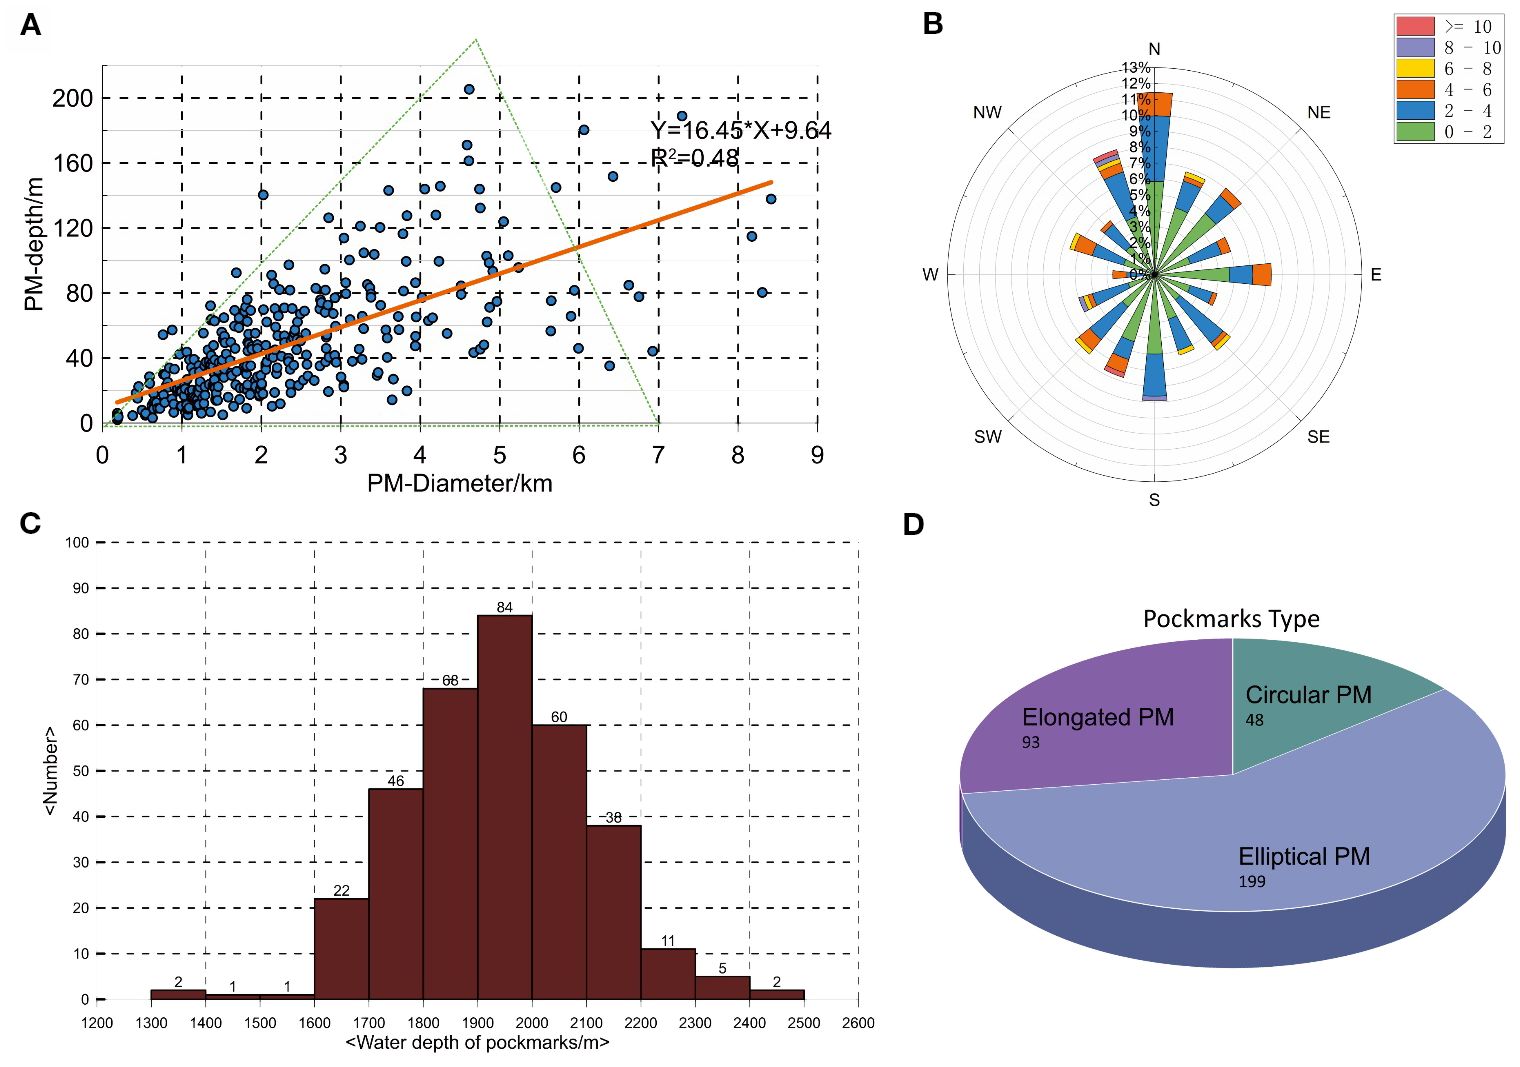
Figure 3. Statistical distribution of geomorphological attributes of pockmarks: (A) distribution relationship between the radius and the depth of pockmarks, (B) rose diagram of the distribution of the long-axis of the pockmarks, (C) histogram of the statistical distribution of the water depth and the number of pockmarks, and (D) number of pockmarks of different types. PM, pockmarks.
Pockmarks in the study area can be classified as circular pockmarks, elliptical pockmarks, or elongated pockmarks according to their plane morphology (Figure 3D). This classification is based on Hovland’s criterion for different types of pockmarks, which is defined by the long-axis/short-axis ratio (diameter in the downslope direction/diameter in the along-slope direction). Pockmark morphology in the study area is not complex, with elliptical pockmarks accounting for the largest proportion, followed by elongated pockmarks, and then circular pockmarks.
To assess the distribution and deformation of pockmarks in the two areas on both sides of the landslide (Area 1 and Area 2 in Figure 2C), separate statistics were prepared and the results are listed in Table 2.
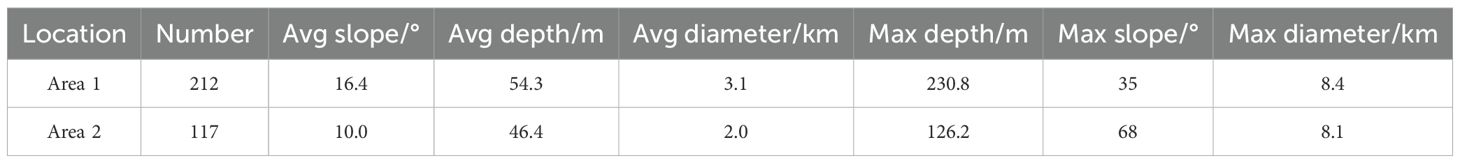
Table 2. Comparison of the pockmarks distributed in the areas on both sides of the landslide.
The number of pockmarks developed on the broad slope on the left side of the landslide (Area 1) was greater than that on the right side (Area 2), and both the area and the size of the pockmarks were larger. According to the statistics of the pockmarks listed in Table 2, the slope of pockmarks sidewall on the left side are gentle and the pockmarks are deeper, whereas the right side has flatter pockmarks but a larger slope of the sidewall. The slope of Area 1 is gentle and wide, and there is no abrupt change in water depth. A total of four distinct pockmark chains were found in the study area, with the long axis of the pockmarks aligned in two principal directions: SSW–NNE (parallel to the isobaths) and SSE–NNW (perpendicular to the isobaths) (Figure 2A).
The background of Area 2 is a steep and narrow slope extending to the deep-water basin area, with a maximum slope up to 16°. The direction of the long axis of the pockmarks in this area is the same as the slope direction, i.e., SW–NE, and the maximum long axis of the pockmarks is parallel to the isobaths. From Table 2, the maximum depth and diameter of the pockmarks in Area2 are smaller than those of the pockmarks in Area 1 owing to the restriction of the background topography. The distribution of pockmarks in the study area was influenced by the slope between the two areas on either side of the landslide.
Pockmarks in the study area display diverse distribution and developmental features. By studying and mapping the pockmarks, we found that most of them are regularly shaped and distributed on both sides of the landslide. In the upstream area, the pockmarks are few, whereas the pockmarks on both sides of the landslide densely distributed along the slope and distributed in different water depths according to the direction cross the slope. New pockmarks were not detected in the landslide tail (Figure 4).
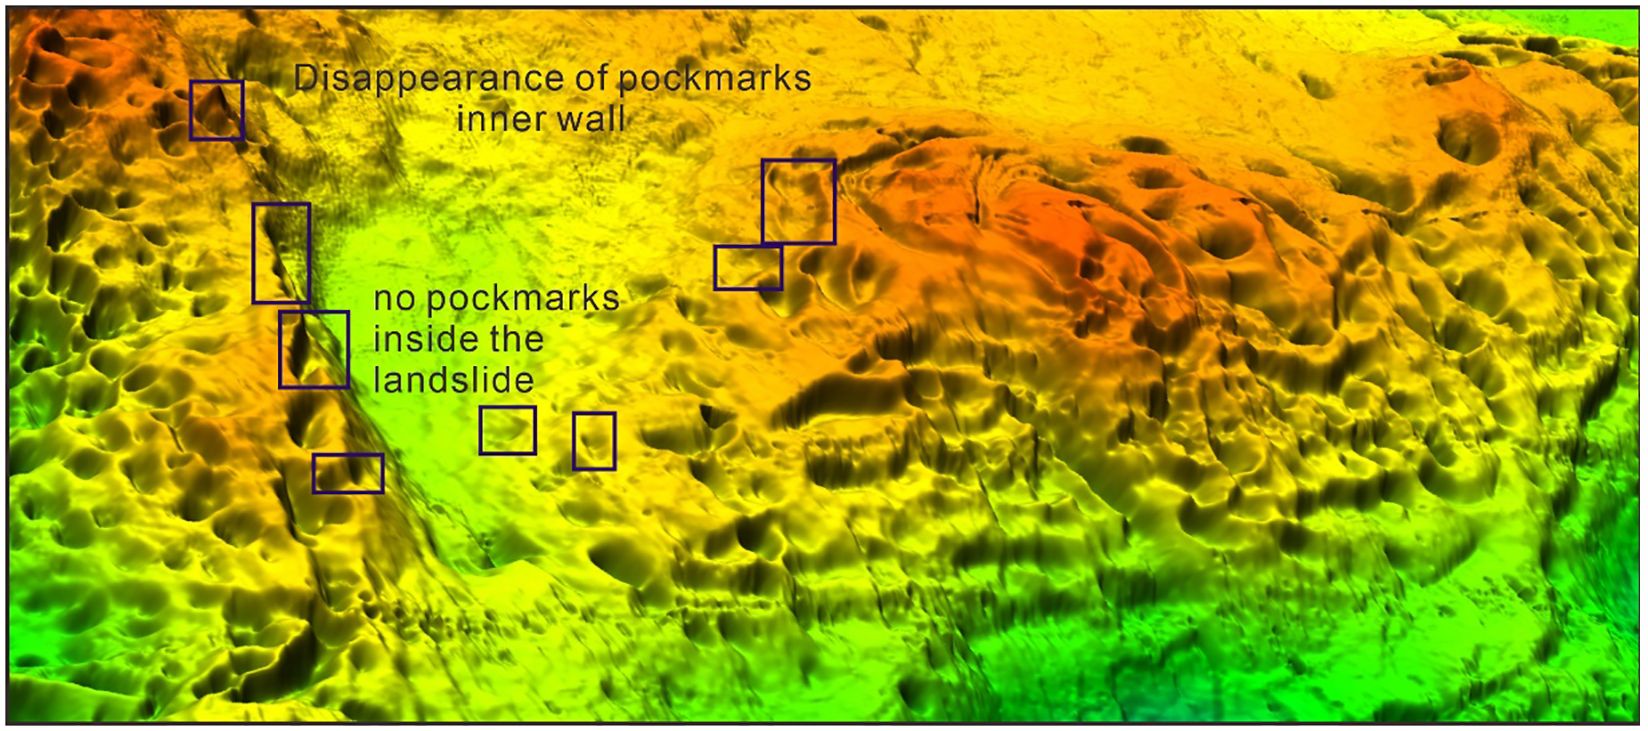
Figure 4. Three-dimensional geomorphology of the landslide and surrounding pockmarks. Black rectangles show the locations of observed pockmarks with incomplete sidewalls.
We observed a continuous distribution of pockmarks by calculating slope gradient of the study area. As shown in Figure 5A, we found corrugated strips in the study area that exhibit orderly distribution on the slopes of both sides of the landslide cross the slope. The pockmarks are regularly distributed within comparable depth intervals, forming a stepped distribution pattern, which has not been reported in previous studies (Figure 5B).
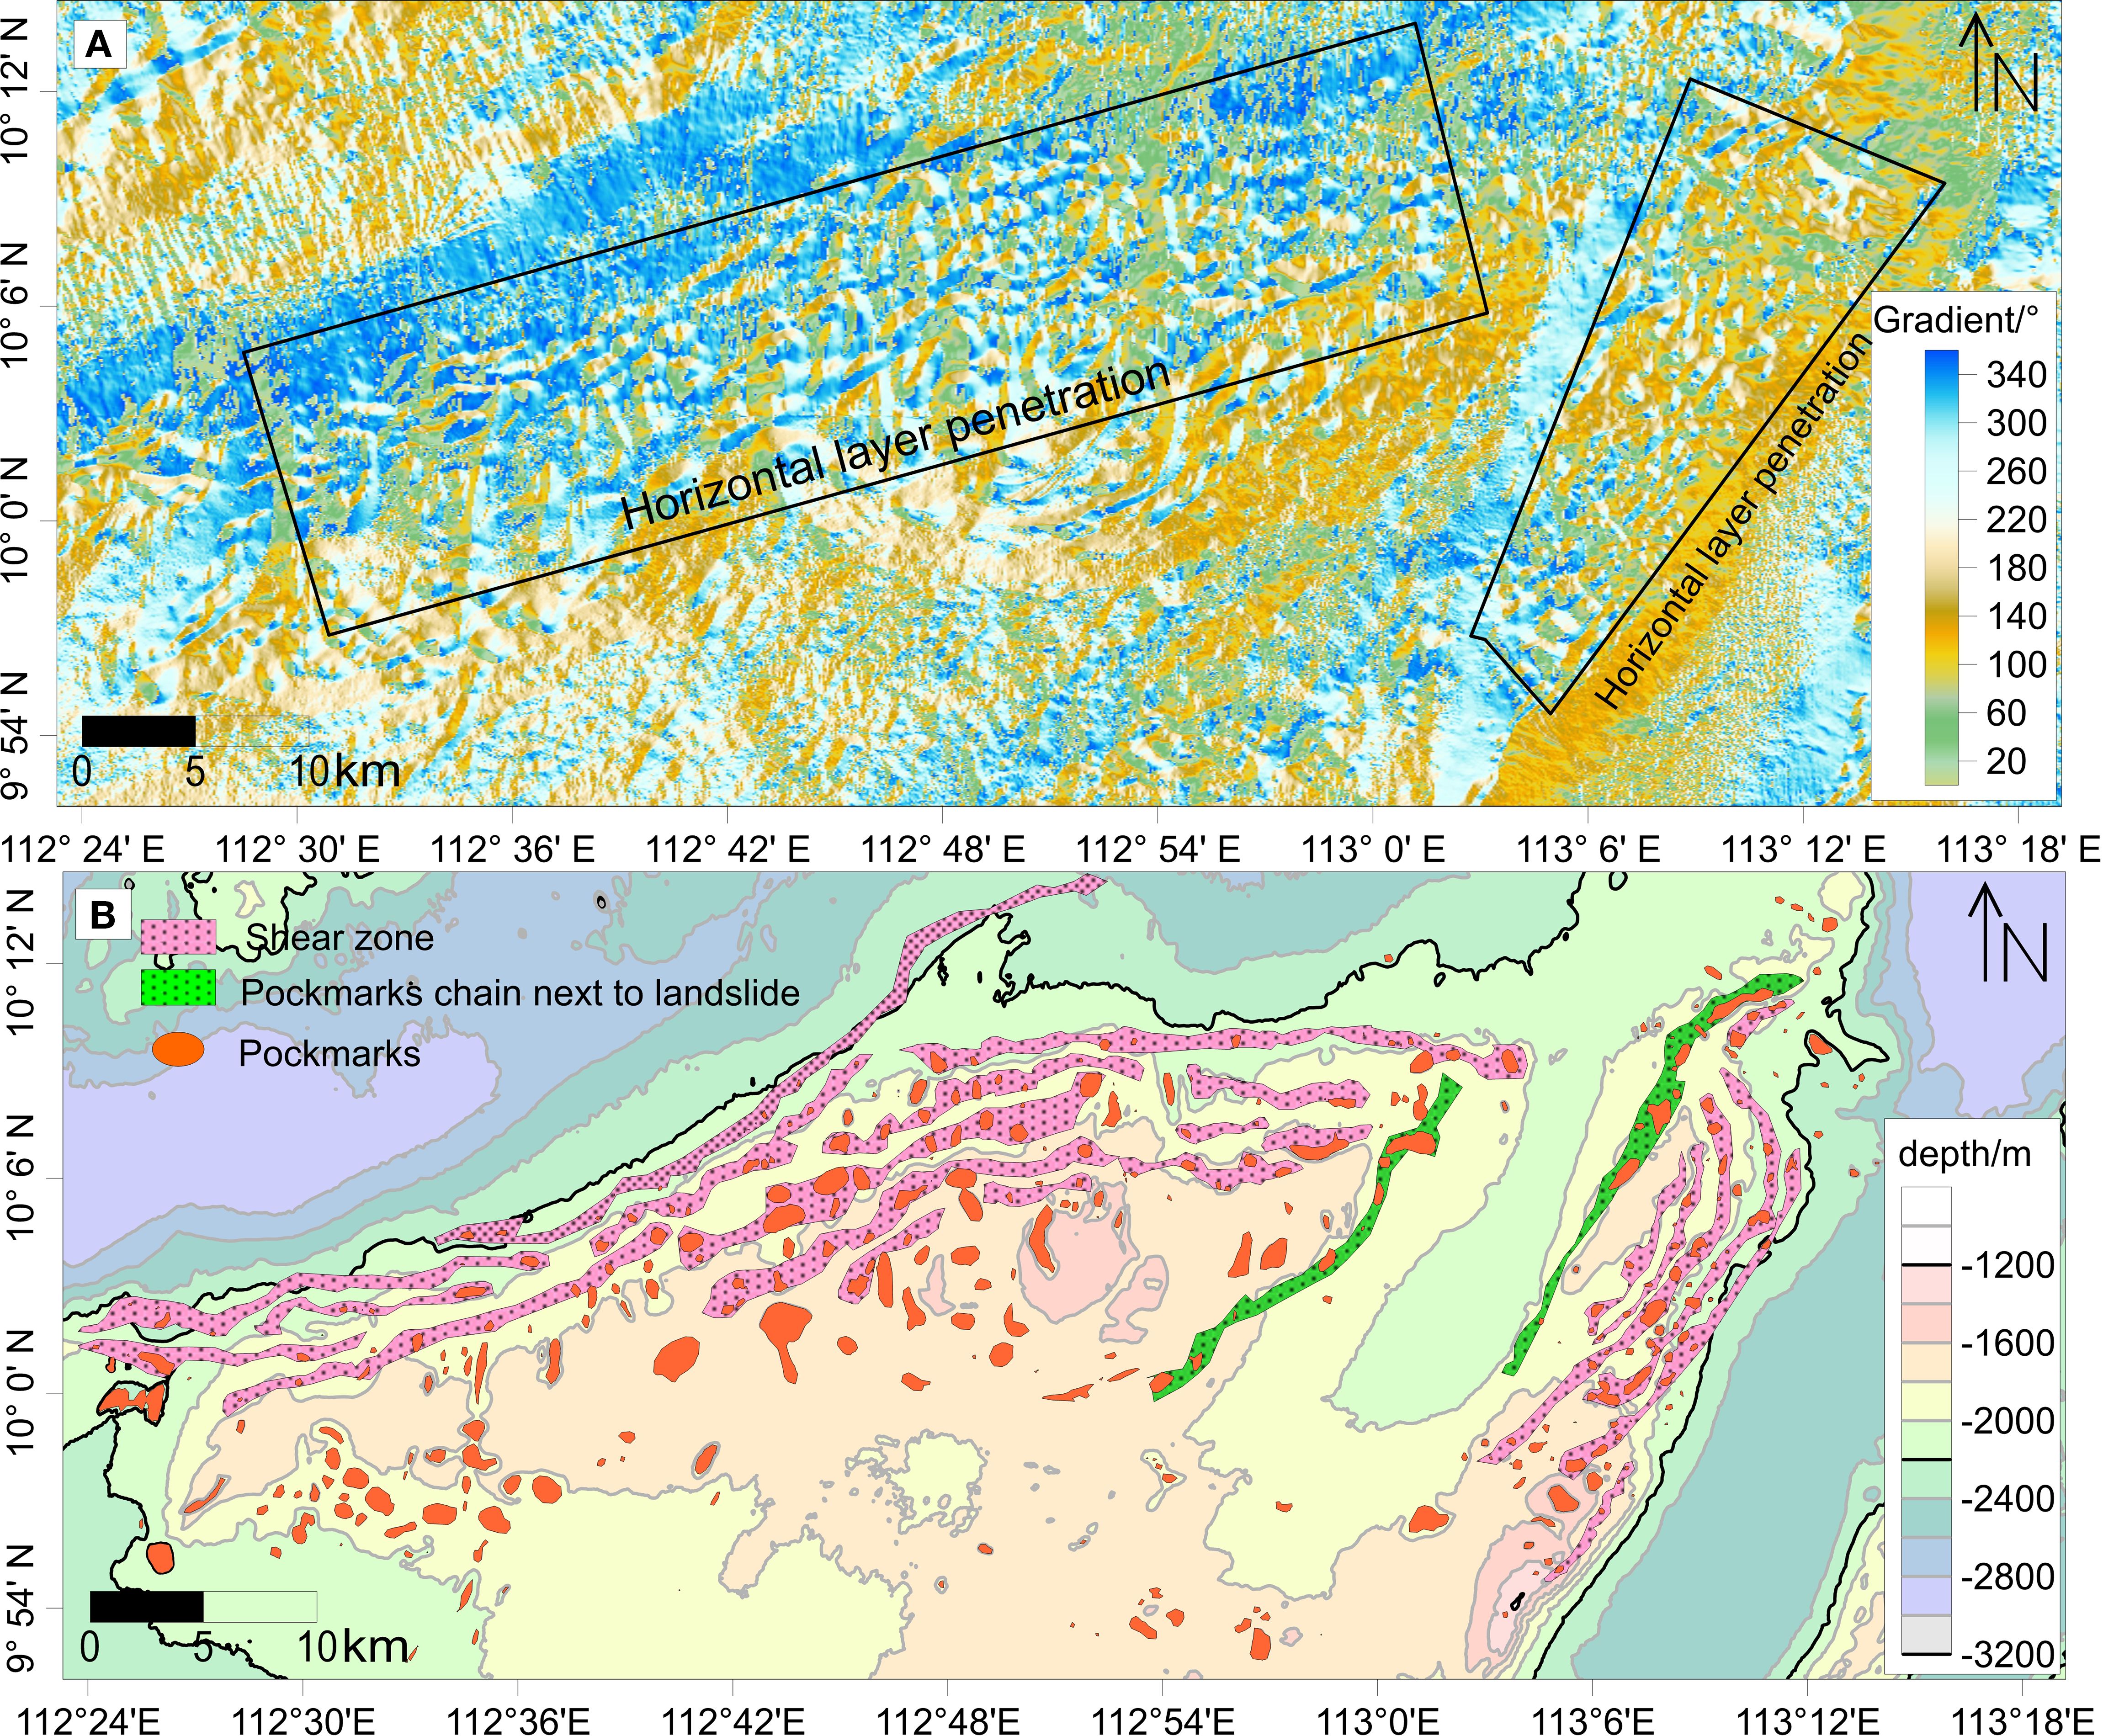
Figure 5. (A) Overall distribution of gradient and horizontal layer penetration in the study area, and (B) superimposition of continuous horizontal layer penetration sketched with a slope guide of approximately 0°, together with the distribution of pockmarks (orange areas represent pockmarks, pink areas represent interpreted shear zone).
We found that pockmark deformation in different directions. In studies of pockmark deformation along the slope, pockmarks generally display elliptical or elongated morphologies, with the ratio of their diameter along-slope to that cross-slope commonly exceeding 1.5 and sometimes reaching values as high as 20 (Cronin et al., 2022; Pilcher and Argent, 2007). In contrast, within the study area, pockmarks adjacent to landslide body show a different pattern in axial ratio: their diameter in the cross-slope direction is greater than that in the along-slope direction, leading to a more rectangular morphology. In the cross-slope direction, pockmarks exhibit deformation of steep walls and flat interiors.
4.2 Acoustic indications
4.2.1 Multi-channel seismic profile analysis
The stratigraphic tectonic and acoustic characteristics of the study area were identified and analyzed by the multichannel seismic profile data. Four distinct seismic horizons (i.e., T30, T40, T50, and T60) were identified in the seismic profile throughout the study area (Figure 6B; Figure 7), which correspond to the bottom interface of the Pliocene, late Miocene, middle Miocene, and early Miocene, respectively (Zhang et al., 2020a). In the study area, there is a fault that forms a ridge with tectonic uplift movement. The overall slope of the modern seafloor at this profile is smoother than that of the original basement, and a small number of pockmarks exist on the seafloor (Figure 7).
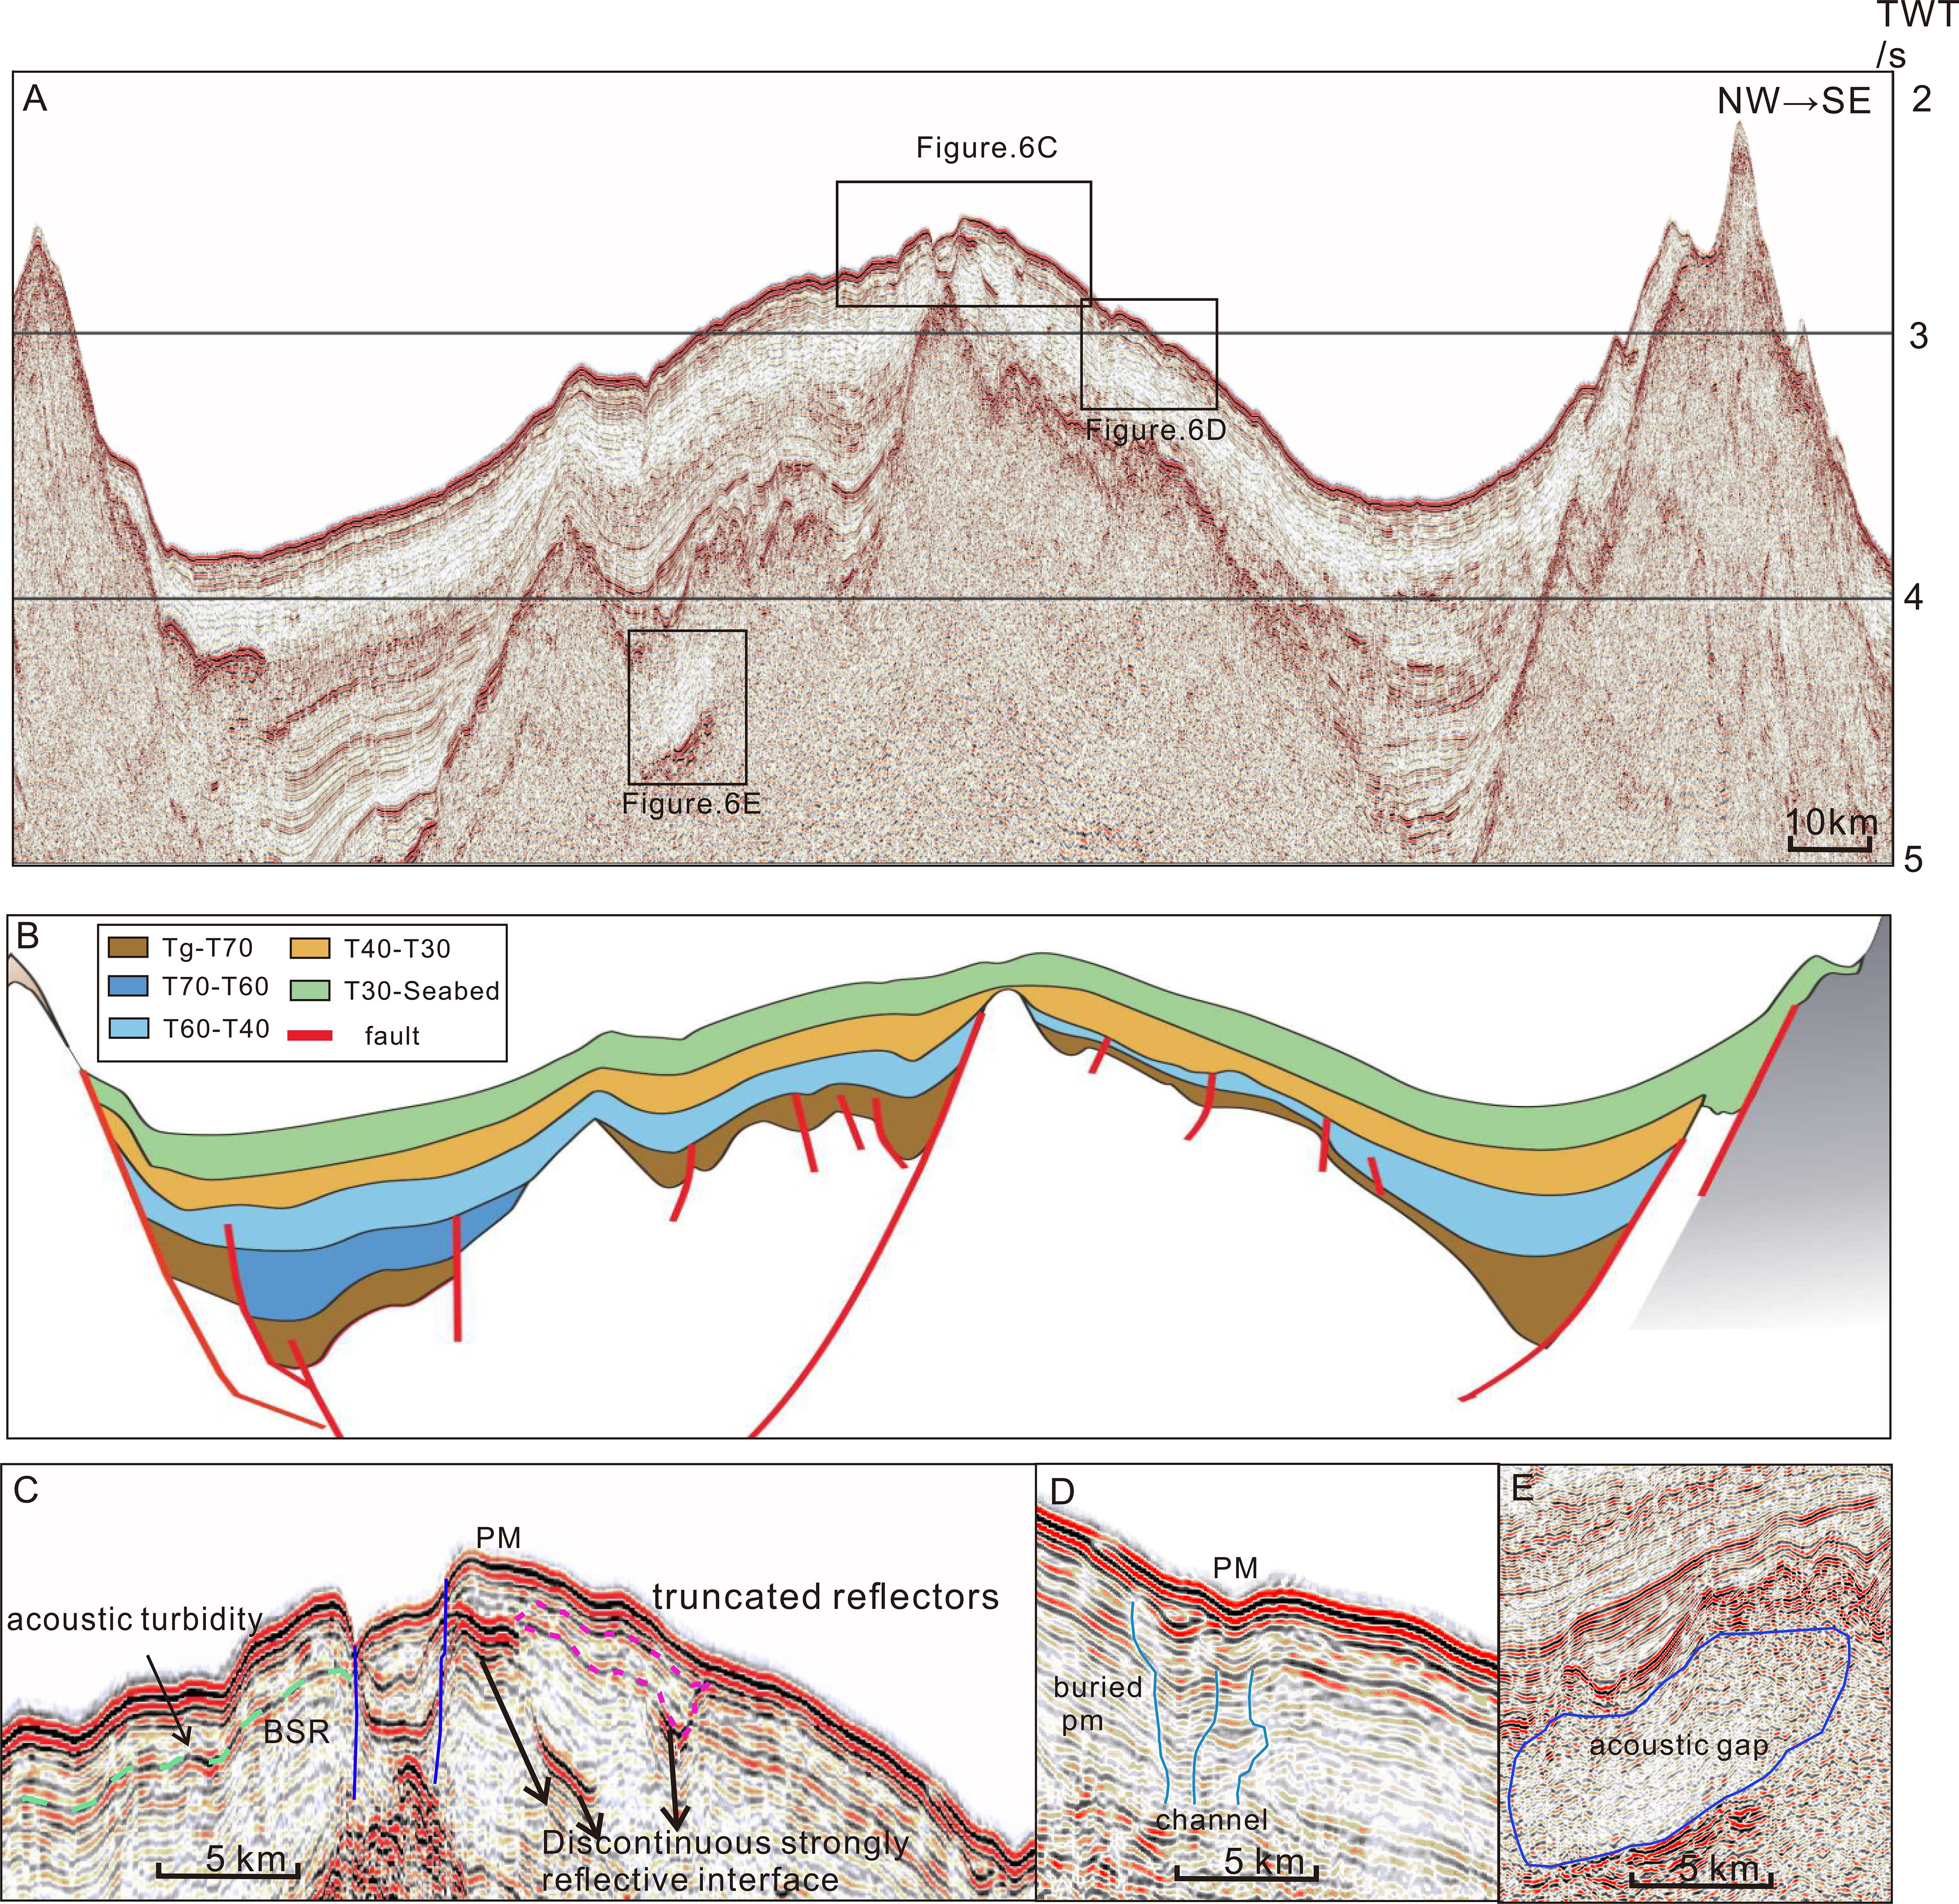
Figure 6. Multi-channel seismic profiles (locations of the profiles are shown in Figure 1D): (A) section of seismic profile DZ02 in the study area, (B) seismic profile divided into different geologic ages, (C) details of the landslide and areas on both sides, (D) pockmarks and buried pockmarks on the right side of the landslide, and (E) acoustic gap on the left side of the landslide.
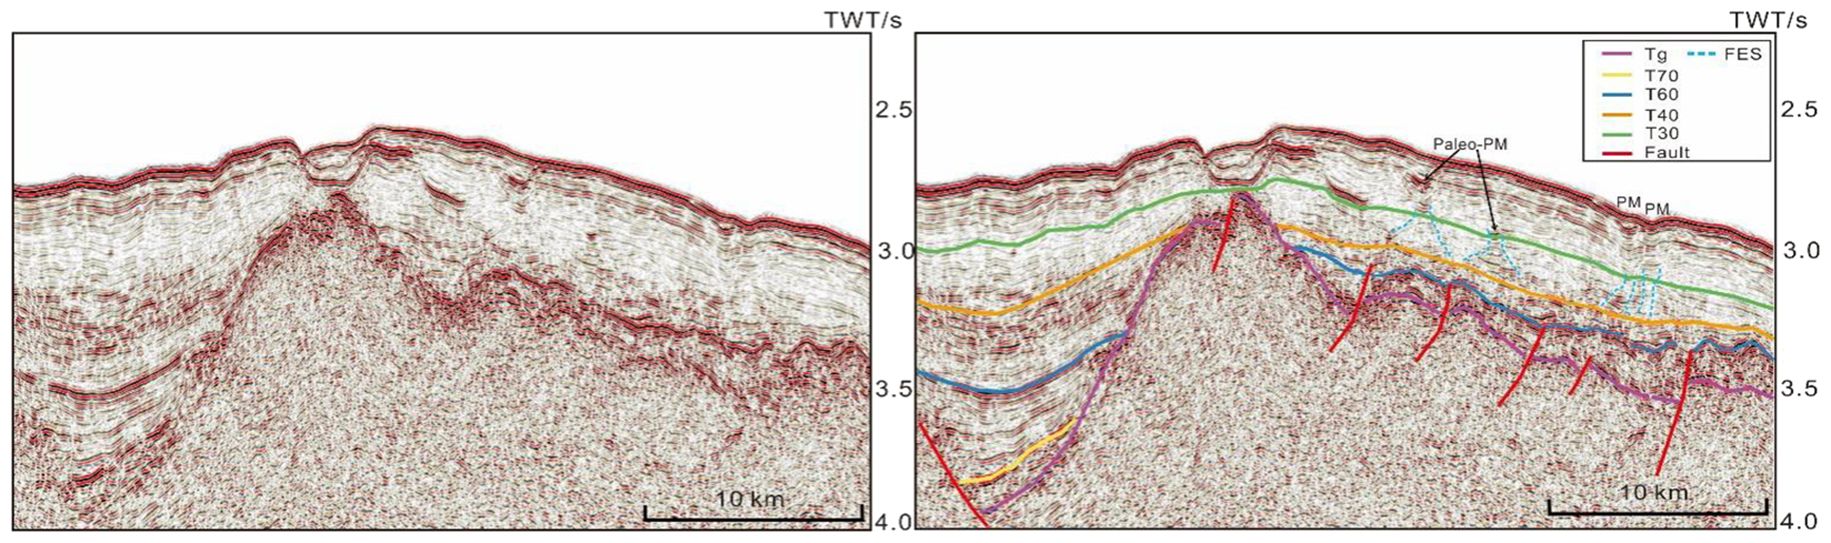
Figure 7. Section of seismic profile DZ02 that reveals downstream of the landslide (location is shown in Figure 1D).
The underlying strata on the left side of the channel have good continuity. At a depth of 100 m below the modern seafloor, a strong bottom simulation reflector (BSR) with opposite polarity similar to that of the seafloor is observed, while above it is the acoustic turbidity area with attenuation of reflection. Local accumulation of materials in the deep strata will produce abnormal characteristics in the seismic profile. A large area of an acoustic gap can be observed in the lower strata (Figure 6E), which might indicate oil/gas resources.
The channel above the main fault can be clearly observed in the seismic profiles, with faults distributed on both sides of the channel (Figure 6C). The local topography changes from the initial raised basement to a depression, and the lower strata have two layers with a strong reflection interface. The two interfaces show the opposite accumulation process, indicating that the formation of the collapsed channel here reflects a process of erosion and refilling.
A discontinuous interface under the seafloor is evident on the right of the main fault, and the acoustic reflection intensity of the interface is stronger than that of the seafloor. There is a BSR with opposite polarity under the pockmarks observed in the profile, which is divided into a discontinuous surface by faults on both sides, with deeper hydrocarbon seepage along the fault. Additionally, there are buried pockmarks within the sedimentary strata, which were buried by direct sediment fill on the modern seafloor (Figure 7).
4.2.2 Subbottom profile analysis
Figure 8A shows a continuous subbottom profile, which corresponds to the three different directions in the middle of the channel. Figure 8B shows a subbottom profile from W→E across the head of the channel, which is divided into the left side of the channel, the center of the channel, and the right side of the channel. Figure 8C shows a W→E profile of the left side of the landslide through the area with a dense distribution of pockmarks.
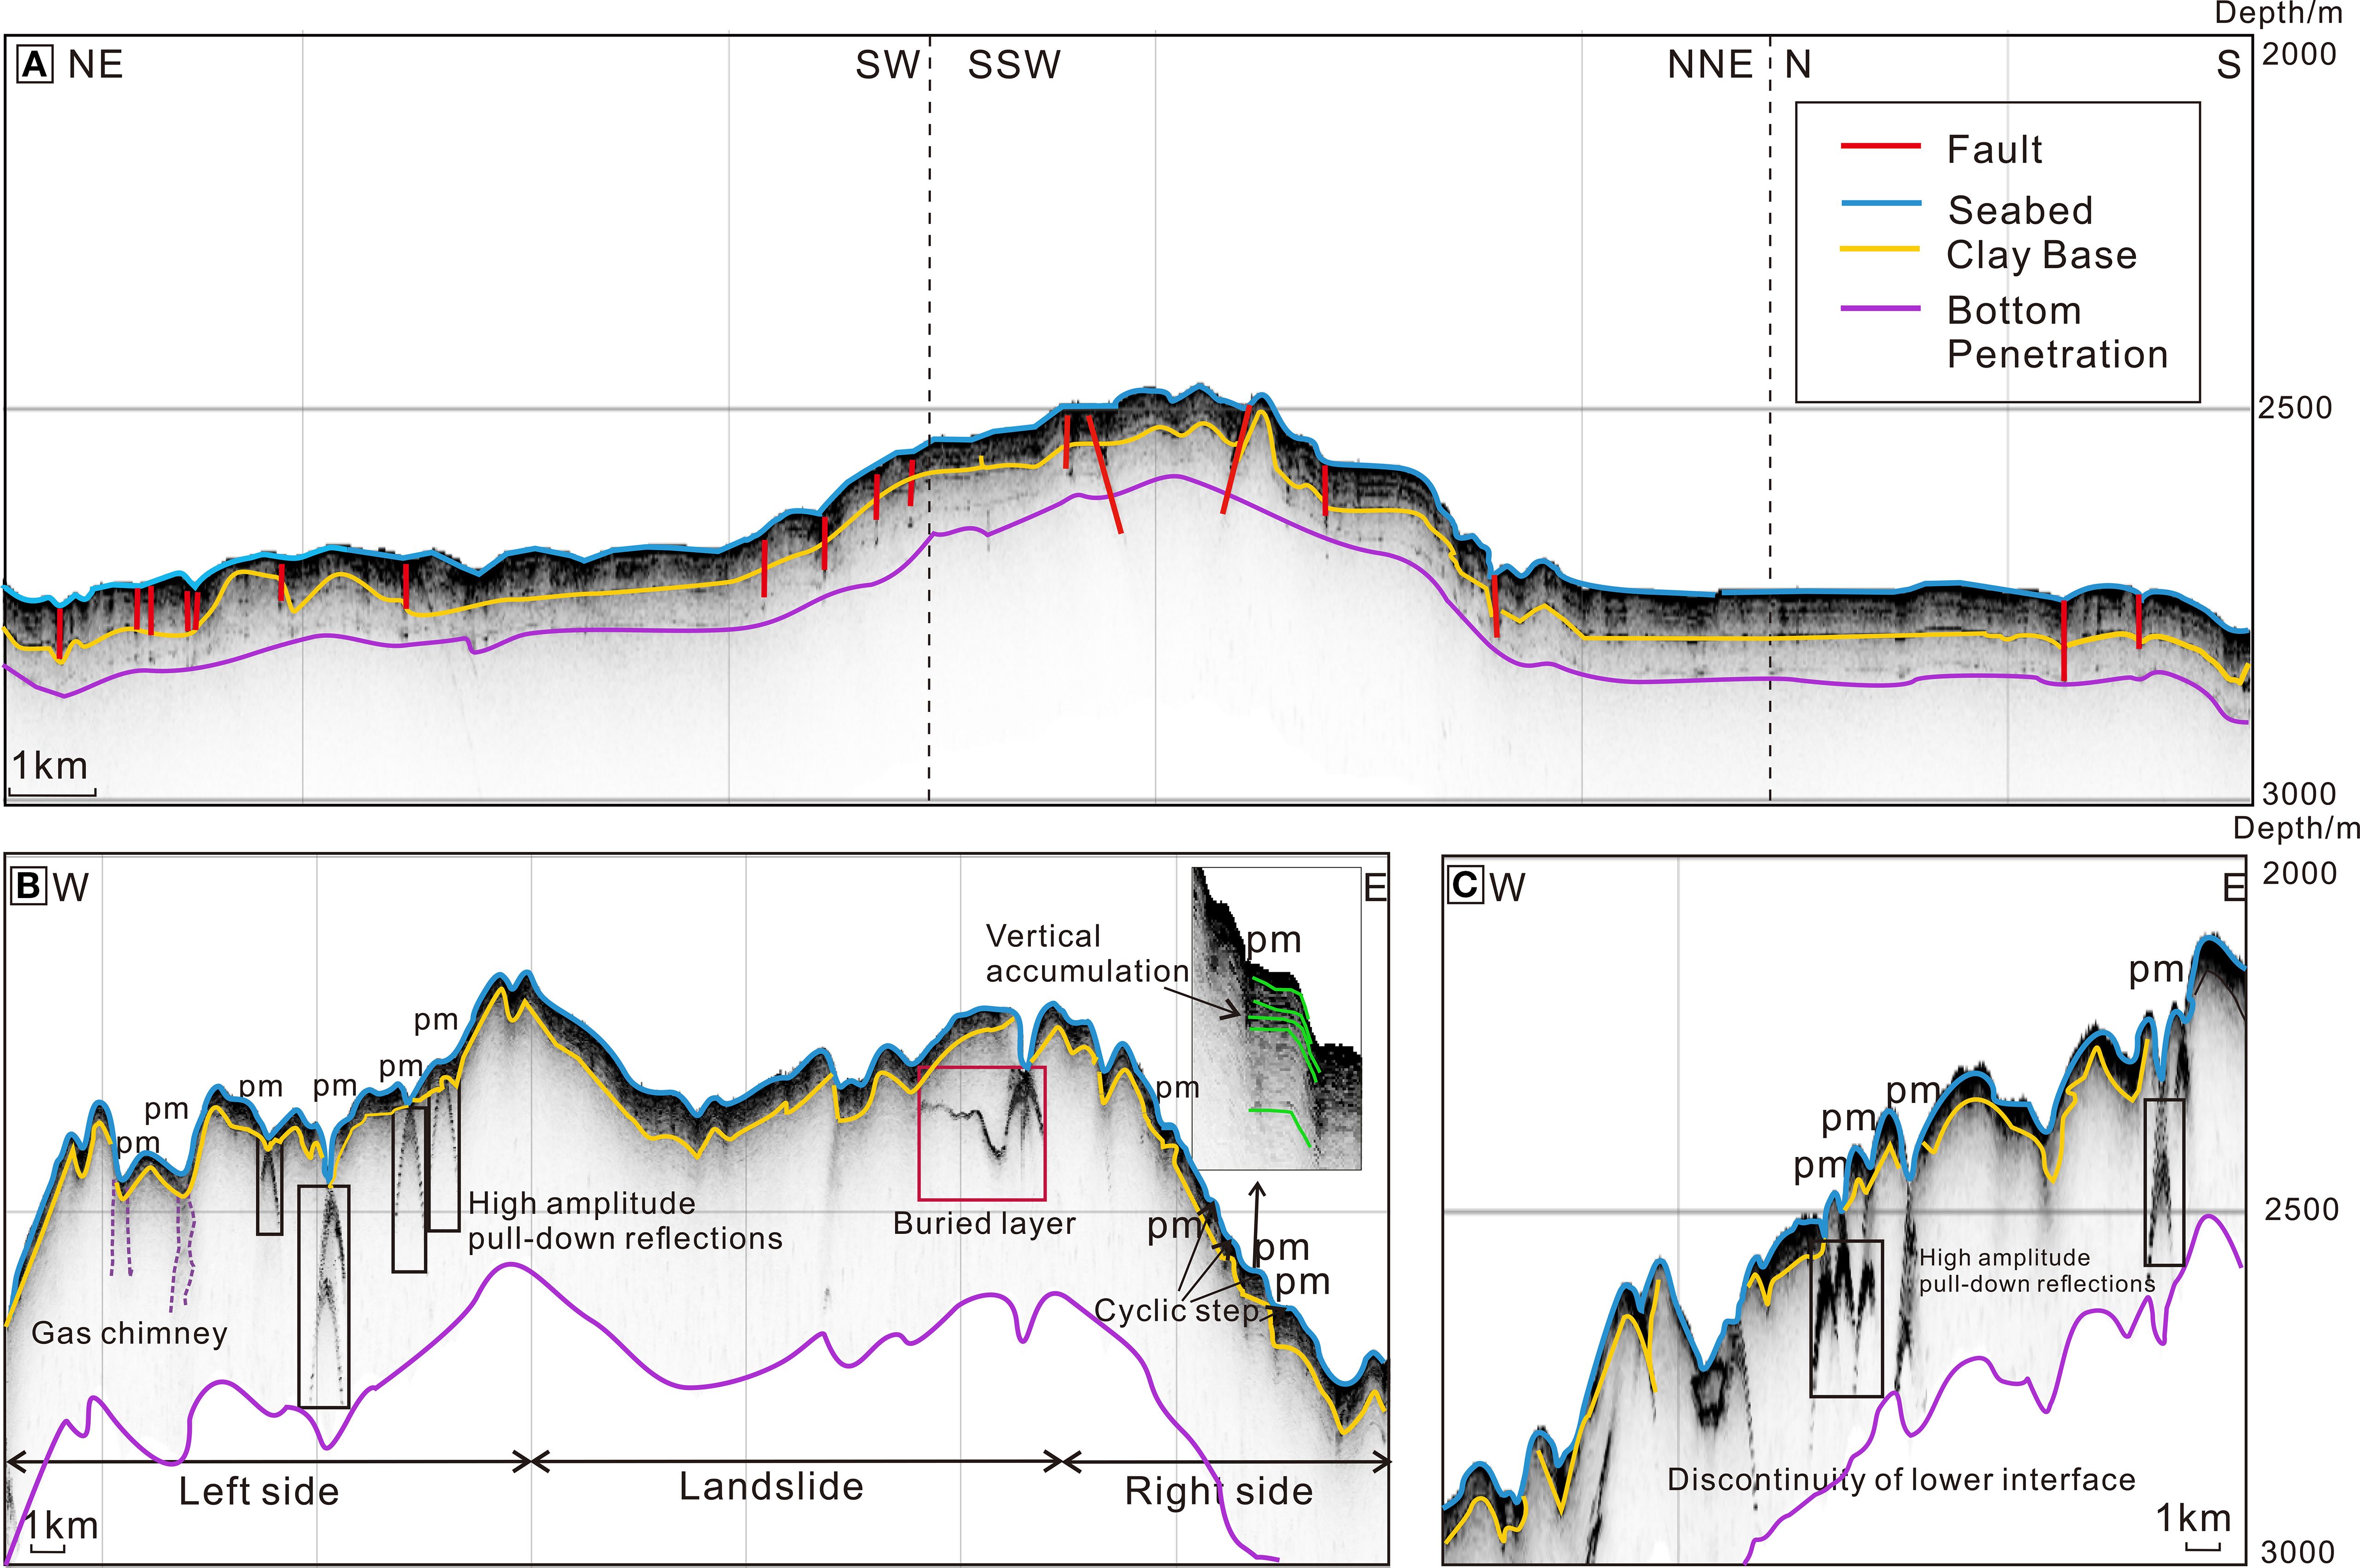
Figure 8. Subbottom profile data (locations shown in Figure 1D): (A) profile through the interior of the landslide, (B) cross section in the head of the landslide flanked by areas of pockmark development, and (C) profile through the area of pockmarks on the left side of the landslide.
The subbottom profile penetrated to depth of approximately 80 m, with continuous strong acoustic reflections on the surface (Figure 8A). By comparing and analyzing the results of ODP sediment sampling (PrellW and Blum, 2000), the stratigraphy of this region can be divided into two layers: the upper layer consists of clay and clay-mixed sediments, while the lower layer comprises a carbonate bedrock foundation. Owing to the destruction of the overlying sedimentary structure after the landslide, the exposed bedrock on the surface resulted in shallow depth of acoustic penetration. No obvious pockmarks or depressions were found on the surface inside the landslide, although several irregular faults were found in a shallow stratum, and no acoustic indications related to pockmarks were found in the profile except for the faults.
A large fracture structure across the ridge can be observed in the subbottom profile shown in Figure 8B, which is consistent with the same fracture morphology evident in the seismic profile (Figure 6A). On the right side of the fault, there exists a continuous strong reflective interface of approximately 150 m, which is a buried stratum with burial depth reaching up to 200 m. Different from the continuous reflection interface on the left side of the fault in the landslide area, the reflection is weak in the upper part of the buried strata. There is an 80-m V-shaped gully at the top of the buried strata, and below this gully is an acoustically turbid area. The buried strata in the shallow profile correspond to the seismic profile at the tail of the landslide.
The pockmarks distributed in the area correspond to the underlying sedimentary structures, and there are fluid escape structures under the pockmarks evident in the subbottom profiles. A strong acoustic reflection is clearly visible at the bottom of the pockmarks, which is an a priori condition for determining whether seafloor depressions are defined as pockmarks. The pockmark area on the left side of the landslide is an area where dense high-amplitude pull-down reflections are present, indicating that gas activity under the pockmarks remains active. A seafloor pockmark is V-shaped with steep inner walls on both sides, whereas a pockmark in the downstream area on the left side of the landslide has relatively gentle inner walls. There is an acoustic gas chimney with a vertical columnar feature under the pockmarks (Figure 8B), and the reservoir indicated by the deep acoustic gap in the seismic profile might be the source of the gas. In the downstream area on the left side of the landslide, a discontinuity in the seafloor interface is evident (Figure 8C). The cross-distributed strong reflection at the bottom of the pockmarks is connected with the seafloor surface, and the bottom of the pockmarks marks the intersection of the discontinuous strata on the left and right sides (Figure 8C).
Acoustic anomalies related to gas activity are not evident under the pockmarks in the area to the right of the landslide (Figure 8B) but faults are identifiable. The locations of the pockmarks correspond to the seafloor showing a flat, stepped topography, which is referred to as a cyclic step (Maestrelli et al., 2020). The acoustic strata deposits in the study area are vertically stacked (depicted by the green strata in Figure 8B).
5 Discussion
5.1 Pockmark formation and slope instability
5.1.1 Condition for pockmark formation
In accordance with the model of pockmark formation in carbonates with heterogeneous basement, the development of most pockmarks on carbonate basement is attributed to fluid leakage (Betzler et al., 2011; Lu et al., 2017). However, documented evidence indicates that hydrothermal activity can also fracture and dissolve carbonate sediments, a process that has been observed to lead to pockmark formation (Michaud et al., 2018). A strong acoustic reflection (Figure 8B) is clearly visible beneath the pockmarks, which is an a priori condition for determining whether seafloor depressions are defined as pockmarks. Considering the substantial acoustic blanking (suggestive of potential gas presence) observed in Figure 6E, it is proposed that the pockmarks within the study area are consistent with the fluid leakage. Pockmarks are formed by the expulsion of localized fluids through seafloor sediments, which complicates the precise determination of their timing of formation. According to the interpretation of seismic profile (Figure 7), depression at the base of the pockmark had already existed above the T30 unconformity. Analysis of sediment samples collected at the ODP station revealed that both the total sedimentation rate and carbonate content have exhibited a declining trend since the Late Miocene (PrellW and Blum, 2000). This phenomenon may be related to sediment erosion processes triggered by the formation of pockmarks. Therefore, it can be inferred that the initial development of pockmarks in this area may date back to the Late Miocene.
The formation of pockmarks is closely related to the source of fluids, seepage pathways, and overpressure conditions (Hovland and Judd, 1988). At the Tg interface, this area represents a seamount basement (Figure 7B). Magmatic upwelling led to tectonic uplift and erosion, which disrupted the original stratigraphic architecture and resulted in the development of numerous irregular faults on the paleo-seafloor. These faults also provide potential pathways for the upward migration of deep-seated fluids. The T60 interface serves as the basement for carbonate platform development (Zhang et al., 2020a). The development of carbonate provides the basement conditions necessary for pockmark formation (Sager et al., 2003; Yu et al., 2022). In seismic profiles (Figure 7), sediment uplifts are observed above the T60 interface at the base of both pockmarks and paleo-pockmarks. Fluid escape structures (FES) observed beneath pockmarks exhibit columnar characteristics with internal dome-like features in seismic profiles. These structures serve as migration pathways for deep-seated fluids, facilitating their vertical transport to the seafloor. Coral reefs upstream on the slope function as carbonate factories, and with the input of terrigenous sediments, they provide the sedimentary cover necessary for the development of pockmarks (Meng et al., 2014; Wang and Ding, 2023). The steepness on both sides of the tectonic ridge is different, resulting in increased difference in the sediment thickness between the gentle slope and the steep slope. Downstream sediment accumulation provided the conditions for the formation of overpressure. Magmatic activity can also contribute to the development of localized overpressure.
Deep gas reservoirs provided fluids for the formation of pockmarks. Active fluids were transported upward from depth through the pipe system to the seafloor and carried deep sediments to the surface. The pockmarks gradually formed under the combined effects of continuous fluid activity, basement uplift caused by fault activity, and surface sediment removal by ocean current flow (Figure 9A).
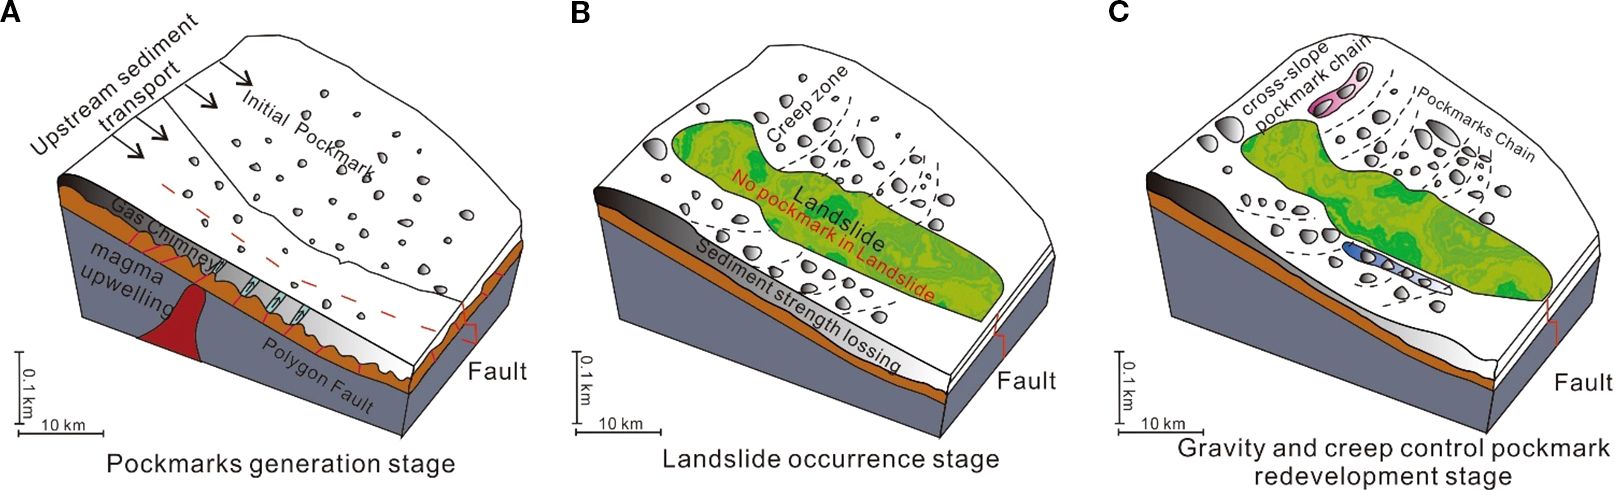
Figure 9. Evolutionary pattern of pockmarks and slope instability: (A) Pockmarks generation stage; (B) Landslide occurrence stage; (C) Gravity and creep control pockmark redevelopment stage.
5.1.2 Pockmark development as a driver of landslide occurrence
Submarine pockmarks are often associated with areas where submarine landslides occur. However, the relationship between pockmark development and landslides remains unclear (Hovland et al., 2002; McAdoo et al., 2000). Riboulot et al. (2013) demonstrated that the formation of pockmarks can induce the development of landslides. The opposite mechanism is also possible, with the formation of landslide causing the development of pockmarks (Riera et al., 2022). Therefore, the spatial relationship between pockmarks and landslides, as well as the morphological characteristics of the pockmarks, serve as critical indicators for understanding their genetic connection.
The pockmarks within the study area exhibit an average diameter of several kilometers and a mean depth that exceeds 50 meters (Table 2), which indicates that a protracted developmental process to attain their current scale. Additionally, the distribution of numerous pockmarks in the upstream region, and along both side of the landslide, These characteristics differ from those of the small pockmarks typically found at the edges of landslide deposits, which are commonly associated with landslide-induced formation mechanisms (Riera et al., 2022; Sun et al., 2012). As revealed by the three-dimensional geomorphology (Figure 4), pockmarks closer the landslide lack intact sidewalls and display shallower profiles. This suggests that the rapid landslide movement caused significant disruption to the original pockmark structures, especially near the landslide area, where the sidewalls of the remaining pockmarks have been completely eroded. Based on the above inferences, it suggests that these pockmarks likely formed prior to the landslide event.
With the development of the pockmarks, loosening of the sediments around the pockmarks attributable to shallow activity below the pockmarks further induced sedimentary weakening (Sultan et al., 2004). Physical experiments reveal that the strength at the center of the pockmark reaches critical peak at gas pressure of 20 kPa, and attains maximum volume at 30 kPa (Yan et al., 2020). With increasing pore water content within the sediment, shear failure along weak structural surfaces beneath the pockmarks accelerated, resulting in soil liquefaction that promotes landslide initiation (Chen et al., 2022). The initial interface in the study area corresponds to the seamount basement (Figure 7), with pockmarks developing predominantly at the slope. In subbottom profiles (Figure 8), we observed gas channels beneath the pockmarks, while seismic profiles indicated the potential presence of high-density gas reservoirs (Figure 6E). The findings suggest that the pockmarks in the study area likely have conditions that can cause soil strength failure due to gas pressure. We infer that the development of pockmarks in the study area may have triggered the occurrence of the landslide. Following the formation of the initial pockmarks, processes such as gas decomposition and seepage in the underlying strata increased slope instability. Once the stress accumulated beyond a critical threshold, the slope equilibrium was disrupted, and large-scale deformation was triggered by small-scale sediment movements on the slope, leading to the occurrence of landslides (Figure 9B).
5.2 Factors affecting pockmark deformation
5.2.1 Bottom current
The morphology of pockmarks is in a steady state when fluid activity beneath the pockmarks ceases, the bottom current must flow continuously over a long period to produce large-scale remodeling of pockmark morphology by erosional and depositional processes. Andresen et al. (2008) and Kilhams et al. (2011) both suggested that bottom currents can induce the erosion, remodeling, and merging pockmarks in the direction of current flow. As bottom currents flow through the pockmarks, localized seafloor undulations within the pockmarks allow for enhanced bottom erosion on their leeward side, resulting in elongation of the pockmarks in the direction of bottom current flow, thereby creating an asymmetrical and elongated feature (Ho et al., 2018). Elongated pockmarks that are eroded and consolidated under a specific pockmark spacing and the action of rapid bottom currents evolve from a pockmark chain into sediment transport channels (Yu et al., 2022, 2021).
As shown in Figure 10A, successive pockmark profiles on the slope show progressive erosion with decreasing erosion rates, and the morphology exhibits elongation along-slope, thereby longitudinally excavating the slope of the seafloor channel. Additionally, the instability might accelerate the deep-water gully to channel process. The morphology of each pockmark in the 2D profiles along the slope, shown in Figure 10A, conforms to this irregular symmetrical pattern, verifying the effect of bottom current scour.
5.2.2 Sediment creep
In the study area, we observed a stepped distribution of pockmarks, underlain by discontinuous sedimentary interfaces. Slope gradient calculations revealed that the landslide had undulating morphologies developing on both sides (Figure 5). This morphology may result from either sediment waves or creep processes (Wynn and Stow, 2002). However, subbottom profile data indicate that beneath the pockmarks exhibits vertically stacked structures with discontinuous interfaces, inconsistent with the typical characteristics of sediment waves upslope migrating (Van Asch, 1984; Wynn and Stow, 2002). The study area is located at the zone of transition from the continental slope to the deep-sea basin with large slope changes. Combined with the widespread creep phenomena observed in the landslide area (Li et al., 2016), we conclude that such stepped distribution is more likely caused by creep. Marine processes such as high sedimentation rates, earthquakes, fluid seepage, and biological activity can increase the shear stress and reduce the shear strength of sediment, resulting in the small-scale sediment instability phenomenon of creep (L'Heureux et al., 2013; Li and Moon, 2021). The creep process drives the continuous deformation of the sediment inside the pockmarks (Cronin et al., 2022; Silva et al., 1989; Van Asch, 1984).
Creep caused by slope instability is a gradual process of change in sediment accumulation, and the creep energy field goes through the stages from none to generation to release (Lee and Chough, 2001). The different location of pockmark chain can be regarded as indicators of creep energy transformation, reflecting different degrees of deformation processes under the influence of creep. At the head of pockmark chain (initial location of creep), the sediments begin to move slowly from their initial state to an extruded state owing to the superimposition of creep, whereas at the downstream end of the slope, as the slope flattens out, the sediments enter an extensional phase forming a tension zone between the creep zone. The overall profile morphology of the pockmark chain, shown in Figure 10A, is represented as slow to steep and then slow again, with slow slopes of the inner wall of the pockmarks between the creep zone at the upstream and downstream, while the inner wall slopes are larger in the midstream region, which corresponds to the process of change of the creep.
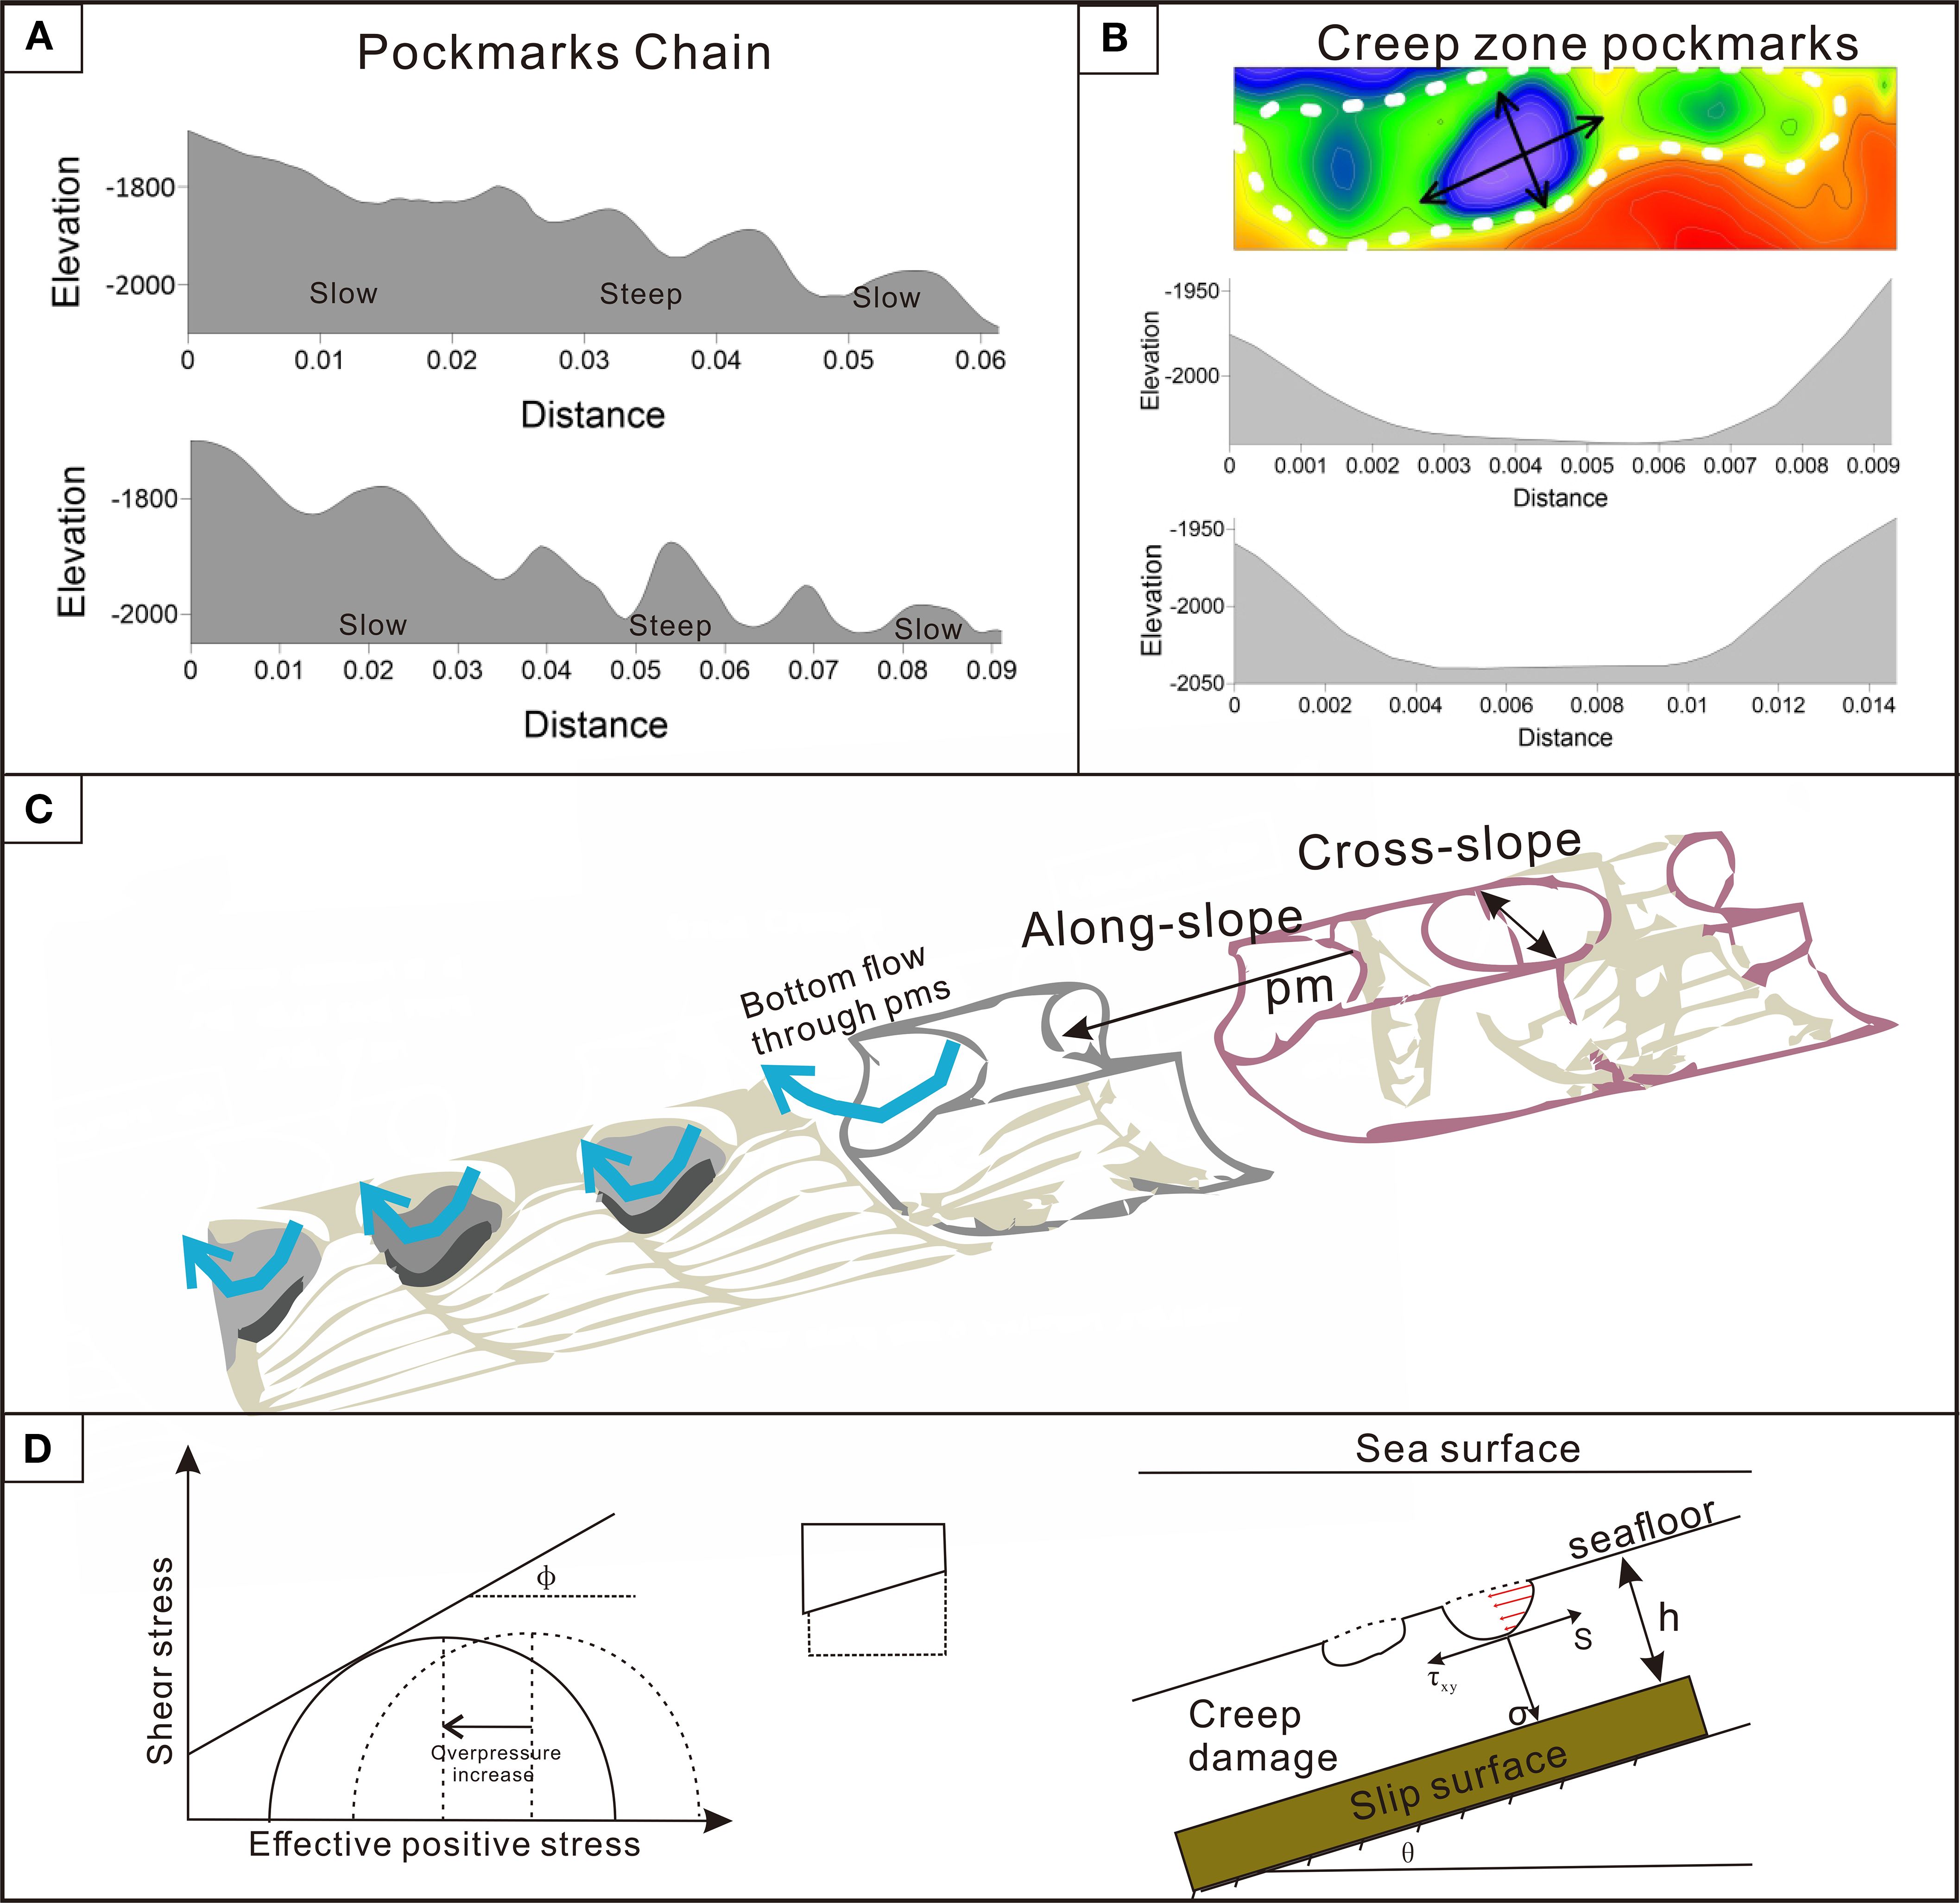
Figure 10. Along-slope and cross-slope processes of pockmark deformation: (A) profile through a pockmark chain (location shown in Figure 1D), (B) creep zone aligned with pockmarks and their long and short axes profiles, (C) along-slope and cross-slope deformation during the development of pockmarks in the direction of the slope, and (D) equilibrium analysis of pockmarks based on the Coulomb criterion and the creep effect.
We speculate that the pockmark horizontal deformation in the creep zone is the result of a combination of shear stress and pockmark tensile damage. Pore water pressure and friction play important roles in creep zones; therefore, both factors should always be considered in relation to creep in a landslide with a well-defined sliding surface (Zhang et al., 2023). Deformation in the creep zone is continuous with constant bias stress, and when the length and the width of the slope are greater than the thickness, the slope is defined as an infinite slope mode. According to the effective stress principle, shear stress is calculated to evaluate the pockmark strain, and development is analyzed considering the overpressure pore limit equilibrium caused by hydrate decomposition (Equation 1):
where is the effective normal stress of the pockmark, is the principal stress of the vertical slip surface, and is the pore pressure under the pockmark.
As shown in Figure 10D, according to the Coulomb criterion, when the effective positive stress increases to the critical value, i.e., when the formation shear strength limit is reached, internal damage of the pockmark begins to occur, for which the damage envelope of slope instability can be expressed as follows (Equation 2):
where τ is the maximum shear force to which the sediment is subjected; C is the cohesion force, which is recognized as a certain value under the same geological conditions; and friction angle φ is a constant value. Consequently, the positive stress perpendicular to the landslide surface is given as follows (Equation 3):
and the shear stress parallel to the landslide is expressed as follows (Equation 4):
where is the capacity of the sediment, which is the force of gravity per unit volume of sediment, and is the capacity of the pore water, both of which are calculated by the product of density and gravitational acceleration; H is the vertical height from the pockmark surface to the slip surface; and θ is the slope angle of the landslide surface.
On the basis of the above equations, the shear stress of parallel landslides is positively correlated with the increase in depth from the slip surface, and the shear stress generated by seafloor creep affects the development process of pockmarks along the slope in the creep zone. As shown in Figure 10D, on the weak surface between the same creep layer, the shear stress of a pockmark from the inner wall edge to the center of the pockmark gradually decreases, which in the process of creep pockmark morphology causes damage from the center to the edge of the pockmark. Thus, the damage to pockmark morphology extends outward during creep. When the shear stress exceeds the plastic deformation limit of the pockmark, the pockmark tensile damage at the outside begins to spread to the inside; consequently, pockmarks at different depths are destroyed owing to plastic deformation.
5.2.3 Fluid activity
The nature of fluids (e.g., gas vs. liquid) and their seepage rate (flux) play a critical role in controlling pockmark morphology (Andresen and Huuse, 2011). All pockmarks observed in the study area are large to giant in scale. It is generally accepted that high-velocity gaseous fluids tend to form large or composite pockmarks, often associated with intense expulsion activities and irregularly shaped margins (Marcon et al., 2014; Pilcher and Argent, 2007; Wu et al., 2023). Continuous or intermittent fluid activity can inhibit sediment accumulation within the pockmarks, thereby maintaining them in an active state. Conversely, interruption of fluid supply may lead to gradual infilling, transforming them into dormant or relict features (Hovland and Judd, 1988).
Active fluid seepage beneath pockmarks prevents deposition inside them. Sustained fluid activity not only helps maintain pockmark activity but can also suspend fine-grained sediments at the surface, thereby inhibiting deposition and even enlarging the pockmarks (Cathles et al., 2010; El-Naby et al., 2024; Ismail et al., 2024; Vaknin et al., 2024). Furthermore, fluid migration increases pore pressure and reduces effective stress, weakening the shear strength of sediments and making them more prone to shear failure (Sultan et al., 2004). These mechanisms collectively render the pockmarks in the study area more susceptible to modification by external geological processes such as landslides and creep, resultingxin the formation of complex geomorphic assemblages. However, it is regrettable that no definitive fluid escape was observed in this study, and the lack of sufficient geochemical data precluded a precise assessment of the influence of fluids on pockmark morphology.
The pockmarks continued to develop along-lope direction and evolved into pockmarks chains. Within the cross- slope direction, the pockmarks were affected by creep shear bias stress, the topography of the pockmarks became flatter, and the horizontal distribution of pockmarks became obvious and tended to develop toward cross-slope pockmark chain (Figure 9C).
6 Conclusions
Pockmarks on continental slopes are closely related to marine hazards such as slope instability. Based on topographic and geophysical data, we described the morphology and distribution of slope instability and pockmarks in the marginal slope area of the southwestern SCS. The main conclusions derived are as follows.
1. The dense pockmarks at the margin of the SCS are reported for the first time. With assistance of bathymetric data and subbottom and seismic profiles, we analyzed the plane morphology and internal structural characteristics of the pockmarks and a landslide. The pockmarks were divided into three types: circular, elliptical, and elongated pockmarks. Pockmarks distributed on both sides of the landslide exhibit a stepped arrangement and show clear signs of deformation in the cross-slope direction.
2. Late Miocene carbonate bedrock, deep-sourced gas, fluid escape structures and overpressure conditions collectively facilitated the development of pockmarks within the study area. The continued development of these pockmarks served as a driving factor in triggering landslides.
3. Following landslide events, sediment creep processes continue to influence the morphology and stability of the pockmarks. In the cross-slope direction, horizontal expansion occurred due to the combined effects of shear failure and the tensile resistance of the pockmarks. The potential for these processes to evolve into mature geomorphology such as cross-slope pockmarks chain and along-slope pockmarks chain remains uncertain.
4. A spatio-temporal model of the study area was established, comprising the pockmark generation stage, landslide occurrence stage, Gravity and creep control pockmark redevelopment stage.
This study provides a reference for elaboration of the intrinsic connection between the development of pockmarks and slope instability, which could support further study of the regional geomorphological evolution and the prevention of marine disasters. The evolution of pockmarks progressively undermines slope stability, rendering these deformation features critically important for stability assessments in offshore engineering. Pockmarks also play a significant role in transporting sediments from shallow waters to deep-sea basins: their development remobilizes surface sediments, while associated pockmark chains serve as efficient conduits for downslope sediment transport, thereby enhancing source-to-sink sediment redistribution. Moreover, methane hydrate released through pockmarks enters the marine environment and may eventually reach the atmosphere, contributing to the global carbon cycle and potentially influencing climate warming.
Data availability statement
The original contributions presented in the study are included in the article/supplementary material. Further inquiries can be directed to the corresponding author.
Author contributions
ZL: Writing – original draft, Writing – review & editing, Conceptualization, Formal Analysis, Investigation. ZW: Conceptualization, Funding acquisition, Writing – review & editing. YL: Writing – review & editing. JS: Writing – review & editing. JZ: Writing – review & editing. JZ: Writing – review & editing.
Funding
The author(s) declare financial support was received for the research and/or publication of this article. This work was supported by the National Key Research and Development Program of China (2022YFC2806600), Scientific Research Fund of the Second Institute of Oceanography, MNR (No. QNYC2403), the Oceanic Interdisciplinary Program of Shanghai JiaoTong University (SL2020ZD204 and SL2004), the National Natural Science Foundation of China (42176055 and 91858213), and the Zhejiang Provincial Natural Science Foundation of China (No. LY23D060007).
Acknowledgments
We thank James Buxton MSc, from Liwen Bianji (Edanz) (www.liwenbianji.cn/), for editing the English text of a draft of this manuscript.
Conflict of interest
The authors declare that the research was conducted in the absence of any commercial or financial relationships that could be construed as a potential conflict of interest.
Generative AI statement
The author(s) declare that no Generative AI was used in the creation of this manuscript.
Any alternative text (alt text) provided alongside figures in this article has been generated by Frontiers with the support of artificial intelligence and reasonable efforts have been made to ensure accuracy, including review by the authors wherever possible. If you identify any issues, please contact us.
Publisher’s note
All claims expressed in this article are solely those of the authors and do not necessarily represent those of their affiliated organizations, or those of the publisher, the editors and the reviewers. Any product that may be evaluated in this article, or claim that may be made by its manufacturer, is not guaranteed or endorsed by the publisher.
References
Aiello G. (2025). Submarine instability processes on the continental slope offshore of campania (Southern Italy). GeoHazards 6, 20. doi: 10.3390/geohazards6020020
Aiello G. and Caccavale M. (2022). New seismoacoustic data on shallow gas in holocene marine shelf sediments, offshore from the cilento promontory (Southern tyrrhenian sea, Italy). J. Mar. Sci Eng. 10, 1992. doi: 10.3390/jmse10121992
Andresen K. J. and Huuse M. (2011). ‘Bulls-eye’pockmarks and polygonal faulting in the Lower Congo Basin: Relative timing and implications for fluid expulsion during shallow burial. Mar. Geology 279, 111–127. doi: 10.1016/j.margeo.2010.10.016
Andresen K. J., Huuse M., and Clausen O. (2008). Morphology and distribution of Oligocene and Miocene pockmarks in the Danish North Sea–implications for bottom current activity and fluid migration. Basin Res. 20, 445–466. doi: 10.1111/j.1365-2117.2008.00362.x
Betzler C., Lindhorst S., Hübscher C., Lüdmann T., Fürstenau J., and Reijmer J. (2011). Giant pockmarks in a carbonate platform (Maldives, Indian Ocean). Mar. Geology 289, 1–16. doi: 10.1016/j.margeo.2011.09.004
Calder B. R. and Mayer L. A. (2003). Automatic processing of high-rate, high-density multibeam echosounder data. Geochemistry Geophysics Geosystems 4, 1048. doi: 10.1029/2002GC000486
Cathles L., Su Z., and Chen D. (2010). The physics of gas chimney and pockmark formation, with implications for assessment of seafloor hazards and gas sequestration. Mar. petroleum Geology 27, 82–91. doi: 10.1016/j.marpetgeo.2009.09.010
Chang S.-P., Pubellier M., Delescluse M., Qiu Y., Nirrengarten M., Mohn G., et al. (2022). Crustal architecture and evolution of the southwestern South China Sea: Implications to continental breakup. Mar. Petroleum Geology 136, 105450. doi: 10.1016/j.marpetgeo.2021.105450
Chen J., Song H., Guan Y., Yang S., Pinheiro L. M., Bai Y., et al. (2015). Morphologies, classification and genesis of pockmarks, mud volcanoes and associated fluid escape features in the northern Zhongjiannan Basin, South China Sea. Deep Sea Res. Part II: Topical Stud. Oceanography 122, 106–117. doi: 10.1016/j.dsr2.2015.11.007
Chen D., Zhang G., Dong D., Zhao M., and Wang X. (2022). Widespread fluid seepage related to buried submarine landslide deposits in the northwestern South China Sea. Geophys Res. Lett. 49, e2021GL096584. doi: 10.1029/2021GL096584
Clare M., Chaytor J., Dabson O., Gamboa D., Georgiopoulou A., Eady H., et al. (2019). A consistent global approach for the morphometric characterization of subaqueous landslides. Geological Society London Special Publications 477, 455–477. doi: 10.1144/SP477.15
Cronin B. T., Team J., and Ltd T. G. (2022). Giant pockmark-initiated deep-water slope channel complexes. Aapg Bull. 106, 829–868. doi: 10.1306/11042118179
Cullen A. B. (2010). Transverse segmentation of the Baram-Balabac Basin, NW Borneo: refining the model of Borneo's tectonic evolution. Petroleum Geosci. 16, 3–29. doi: 10.1144/1354-079309-828
Dandapath S., Chakraborty B., Karisiddaiah S. M., Menezes A., Ranade G., Fernandes W., et al. (2010). Morphology of pockmarks along the western continental margin of India: Employing multibeam bathymetry and backscatter data. Mar. Petrol. Geol. 27 (10), 2107–2117. doi: 10.1016/j.marpetgeo.2010.09.005
Dineng Z., Ziyin W., Jieqiong Z., Wang M., Liu Z., and Jiabiao L. (2020). Parameter group optimization by combining CUBE with surface filtering and its application. J. Geodesy Geoinformation Sci 3, 81. doi: 10.11947/j.JGGS.2020.0209
El-Naby A. A. A., Khalil A. E., Talaat A., and Ismail A. (2024). Gas channels and chimneys detection using post-stack seismic attributes, simian field, offshore west Nile Delta, Egypt. J. Umm Al-Qura Univ. Appl. Sci. 11, 509–527. doi: 10.1007/s43994-024-00204-3
Fowler J., Devillers R., Simms A., and Bolduc A. J. Q. (2008). Identification and characterization of seabed pockmarks in the St. Lawrence Estuary. 400, 26–28.
Franke D., Barckhausen U., Heyde I., Tingay M., and Ramli N. (2008). Seismic images of a collision zone offshore NW Sabah/Borneo. Mar. Petroleum Geology 25, 606–624. doi: 10.1016/j.marpetgeo.2007.11.004
Gafeira J., Dolan M., and Monteys X. (2018). Geomorphometric characterization of pockmarks by using a GIS-based semi-automated toolbox. Geosciences 8 (5), 154. doi: 10.3390/geosciences8050154
Gafeira J., Long D., and Diaz-Doce D. (2012). Semi-automated characterisation of seabed pockmarks in the central North Sea. Near Surface Geophysics 10, 301–312. doi: 10.3997/1873-0604.2012018
Gay A., Lopez M., Cochonat P., Séranne M., Levaché D., and Sermondadaz G. (2006). Isolated seafloor pockmarks linked to BSRs, fluid chimneys, polygonal faults and stacked Oligocene–Miocene turbiditic palaeochannels in the Lower Congo Basin. Mar. Geology 226, 25–40. doi: 10.1016/j.margeo.2005.09.018
Hillman J. I., Watson S. J., Maier K. L., Hoffmann J. J. L., Bland K. J., Warnke F., et al. (2023). The diverse morphology of pockmarks around Aotearoa New Zealand. Front. Mar. Sci 10, 2023. doi: 10.3389/fmars.2023.1235928
Ho S., Imbert P., Hovland M., Wetzel A., Blouet J.-P., and Carruthers D. (2018). Downslope-shifting pockmarks: interplay between hydrocarbon leakage, sedimentations, currents and slope’s topography. Int. J. Earth Sci. 107, 2907–2929. doi: 10.1007/s00531-018-1635-5
Hovland M., Gardner J. V., and Judd A. (2002). The significance of pockmarks to understanding fluid flow processes and geohazards. Geofluids 2, 127–136. doi: 10.1046/j.1468-8123.2002.00028.x
Hovland M. (2007). Discovery of prolific natural methane seeps at Gullfaks, northern North Sea. Geo-Marine Lett. 27 (2), 197–201. doi: 10.1007/s00367-007-0070-6
Hovland M., Heggland R., Vries M. H. D., and Tjelta T. I. (2010). Unit-pockmarks and their potential significance for predicting fluid flow. Mar. Petroleum Geology 27, 1190–1199. doi: 10.1016/j.marpetgeo.2010.02.005
Hovland M. and Judd A. G. (1988). Seabed pockmarks and seepages: impact on geology, biology and the marine environment (London: Graham & Trotman London), 293.
Huang W., Meng M., Zhang W., Shang J., Liang J., Wan Z., et al. (2022). Geological, geophysical, and geochemical characteristics of deep-routed fluid seepage and its indication of gas hydrate occurrence in the Beikang Basin, Southern South China Sea. Mar. Petroleum Geology 139, 105610. doi: 10.1016/j.marpetgeo.2022.105610
Ismail A., Ewida H. F., Nazeri S., Al-Ibiary M. G., and Zollo A. (2022). Gas channels and chimneys prediction using artificial neural networks and multi-seismic attributes, offshore West Nile Delta, Egypt. J. Petroleum Sci Eng. 208, 109349. doi: 10.1016/j.petrol.2021.109349
Ismail A., Radwan A. A., Leila M., and Eysa E. A. (2024). Integrating 3D subsurface imaging, seismic attributes, and wireline logging analyses: Implications for a high resolution detection of deep-rooted gas escape features, eastern offshore Nile Delta, Egypt. J. Afr. Earth Sci. 213, 105230. doi: 10.1016/j.jafrearsci.2024.105230
Kilhams B., McArthur A., Huuse M., Ita E., and Hartley A. (2011). Enigmatic large-scale furrows of Miocene to Pliocene age from the central North Sea: current-scoured pockmarks? Geo-Marine Lett. 31, 437–449. doi: 10.1007/s00367-011-0235-1
King L. H. and MacLean B. (1970). Pockmarks on the scotian shelf. Geological Soc. America Bull. 81, 3141–3148. doi: 10.1130/0016-7606(1970)81[3141:POTSS]2.0.CO;2
Kopp H., Chiocci F. L., Berndt C., Çağatay M. N., Ferreira T., Fortes C. J. E., et al. (2021). Marine geohazards: Safeguarding society and the Blue Economy from a hidden threat. European Marine Board IVZW. doi: 10.5281/zenodo.5591938
L'Heureux J., Vanneste M., Rise L., Brendryen J., Forsberg C., Nadim F., et al. (2013). Stability, mobility and failure mechanism for landslides at the upper continental slope off Vesterålen, Norway. Mar. Geology 346, 192–207. doi: 10.1016/j.margeo.2013.09.009
Lecours V., Dolan M. F., Micallef A., and Lucieer V. L. (2016). A review of marine geomorphometry, the quantitative study of the seafloor. Hydrology Earth System Sci. 20, 3207–3244. doi: 10.5194/hess-20-3207-2016
Lee S. and Chough S. (2001). High-resolution (2–7 kHz) acoustic and geometric characters of submarine creep deposits in the South Korea Plateau, East Sea. Sedimentology 48, 629–644. doi: 10.1046/j.1365-3091.2001.00383.x
Li W., Alves T. M., Wu S., Rebesco M., Zhao F., Mi L., et al. (2016). A giant, submarine creep zone as a precursor of large-scale slope instability offshore the Dongsha Islands (South China Sea). Earth Planetary Sci Lett. 451, 272–284. doi: 10.1016/j.epsl.2016.07.007
Li X., Guo X., Tian F., and Fang X. (2024). The effects of controlling gas escape and bottom current activity on the evolution of pockmarks in the northwest of the xisha uplift, South China sea. J. Mar. Sci Eng. 12, 1505. doi: 10.3390/jmse12091505
Li G. K. and Moon S. (2021). Topographic stress control on bedrock landslide size. Nat. Geosci. 14, 307–313. doi: 10.1038/s41561-021-00739-8
Liu S., Hernández-Molina F. J., Lei Z., Duarte D., Chen H., Wang C., et al. (2021). Fault-controlled contourite drifts in the southern South China Sea: Tectonic, oceanographic, and conceptual implications. Mar. Geology 433, 106420. doi: 10.1016/j.margeo.2021.106420
Liu S., Liang Z., Zhang B., Su H., Lei Z., and Su M. (2022). Carbonate contourite drifts in the southwest South China Sea: Sedimentary, paleoceanographic and economic implications. Front. Mar. Sci. 9, 2022. doi: 10.3389/fmars.2022.946231
Lu Y., Luan X., Lyu F., Wang B., Yang Z., Yang T., et al. (2017). Seismic evidence and formation mechanism of gas hydrates in the Zhongjiannan Basin, Western margin of the South China Sea. Mar. Petroleum Geology 84, 274–288. doi: 10.1016/j.marpetgeo.2017.04.005
Maestrelli D., Maselli V., Kneller B., Chiarella D., Scarselli N., Vannucchi P., et al. (2020). Characterisation of submarine depression trails driven by upslope migrating cyclic steps: Insights from the Ceará Basin (Brazil). Mar. Petroleum Geology 115, 104291. doi: 10.1016/j.marpetgeo.2020.104291
Marcon Y., Ondréas H., Sahling H., Bohrmann G., and Olu K. (2014). Fluid flow regimes and growth of a giant pockmark. Geology 42, 63–66. doi: 10.1130/G34801.1
McAdoo B., Pratson L., and Orange D. (2000). Submarine landslide geomorphology, US continental slope. Mar. geology 169, 103–136. doi: 10.1016/S0025-3227(00)00050-5
Meng Q.-S., Yu K.-F., Wang R., Qin Y., Wei H.-Z., and Wang X.-Z. (2014). Characteristics of rocky basin structure of Yongshu Reef in the southern South China Sea. Mar. Georesources Geotechnology 32, 307–315. doi: 10.1080/1064119X.2013.764553
Meo A. and Senatore M. R. (2023). Morphological and seismostratigraphic evidence of Quaternary mass transport deposits in the North Ionian Sea: the Taranto landslide complex (TLC). Front. Earth Sci 11. doi: 10.3389/feart.2023.1168373
Micallef A., Averes T., Hoffmann J., Crutchley G., Mountjoy J. J., Person M., et al. (2022). Multiple drivers and controls of pockmark formation across the Canterbury Margin, New Zealand. Basin Res. 34, 1374–1399. doi: 10.1111/bre.12663
Micallef A., Krastel S., and Savini A. (Eds.). (2018). Submarine geomorphology 367–387. Cham: Springer.
Michaud F., Collot J. Y., Ratzov G., Proust J. N., Dano A., Lebrun J. F., et al. (2018). A honeycomb seafloor morphology in carbonate sediment of the Carnegie Ridge (offshore Ecuador): Formation and potential geodynamic significance. Geology 46, 979–982. doi: 10.1130/G45285.1
Normandeau A., MacKillop K., Macquarrie M., Richards C., Bourgault D., Campbell D. C., et al. (2021). Submarine landslides triggered by iceberg collision with the seafloor. Nat. Geosci. 14, 599–605. doi: 10.1038/s41561-021-00767-4
PrellW L. and Blum P. (2000). Leg184summary: Exploring the Asian monsoon through drilling in the South China Sea. Proceedings of the Ocean Drilling Program, Initial Reports, 184, 1–15.
Pilcher R. and Argent J. (2007). Mega-pockmarks and linear pockmark trains on the West African continental margin. Mar. Geology 244, 15–32. doi: 10.1016/j.margeo.2007.05.002
Qiao J., Luan X., Raveendrasinghe T. D., Lu Y., Fan G., Wei X., et al. (2024). Unravelling Cenozoic carbonate platform fluid expulsion: Deciphering pockmark morphologies and genesis in the Tanintharyi shelf of the Andaman Sea as promising hydrocarbon reservoirs. Mar. Petrol. Geol. 160, 106603. doi: 10.1016/j.marpetgeo.2023.106603
Riboulot V., Cattaneo A., Sultan N., Garziglia S., Ker S., Imbert P., et al. (2013). Sea-level change and free gas occurrence influencing a submarine landslide and pockmark formation and distribution in deepwater Nigeria. Earth Planetary Sci Lett. 375, 78–91. doi: 10.1016/j.epsl.2013.05.013
Riboulot V., Imbert P., Cattaneo A., and Voisset M. (2019). Fluid escape features as relevant players in the enhancement of seafloor stability? Terra Nova. 31, 540–548. doi: 10.1111/ter.12425
Riera R., Paumard V., de Gail M., Saqab M. M., Lebrec U., Lang S. C., et al. (2022). Origin of seafloor pockmarks overlying submarine landslides: Insights from semi-automated mapping of 3D seismic horizons (North West Shelf, Australia). Mar. Petroleum Geology 136, 105453. doi: 10.1016/j.marpetgeo.2021.105453
Sager W. W., MacDonald I. R., and Hou R. (2003). Geophysical signatures of mud mounds at hydrocarbon seeps on the Louisiana continental slope, northern Gulf of Mexico. Mar. Geology 198, 97–132. doi: 10.1016/S0025-3227(03)00097-5
Shu Y., Xue H., Wang D., Chai F., Xie Q., Cai S., et al. (2016). Persistent and energetic bottom-trapped topographic Rossby waves observed in the southern South China Sea. Sci. Rep. 6, 24338. doi: 10.1038/srep24338
Sibuet J. C., Yeh Y. C., and Lee C. S. (2016). Geodynamics of the south China sea. Tectonophysics 692, 98–119. doi: 10.1016/j.tecto.2016.02.022
Silva A. J., Brandes H. G., Sadd M. H., Karamanlidis D., and Laine E. P. (1989) Experimental and analytical study of creep deformations of submarine slopes. 1530–1535. Available online at: https://digitalcommons.uri.edu/cve_facpubs/301.
Spatola D., Dahal A., Lombardo L., Casalbore D., and Chiocci F. L. (2025a). First Pockmark susceptibility map of the Italian continental margins. Mar. petroleum geology 176, 107337. doi: 10.1016/j.marpetgeo.2025.107337
Spatola D., Rovere M., Casalbore D., and Chiocci F. L. (2025b). Pockmarks of the Mediterranean region seas: a Comprehensive Geodatabase for Marine Geomorphological analysis. Sci. Data 12, 1049. doi: 10.1038/s41597-025-05369-y
Steuer S., Franke D., Meresse F., Savva D., Pubellier M., and Auxietre J.-L. (2014). Oligocene–Miocene carbonates and their role for constraining the rifting and collision history of the Dangerous Grounds, South China Sea. Mar. Petroleum Geology 58, 644–657. doi: 10.1016/j.marpetgeo.2013.12.010
Sultan N., Cochonat P., Foucher J.-P., and Mienert J. (2004). Effect of gas hydrates melting on seafloor slope instability. Mar. geology 213, 379–401. doi: 10.1016/j.margeo.2004.10.015
Sun Q., Alves T., Xie X., He J., Li W., and Ni X. (2017). Free gas accumulations in basal shear zones of mass-transport deposits (Pearl River Mouth Basin, South China Sea): An important geohazard on continental slope basins. Mar. Petroleum Geology 81, 17–32. doi: 10.1016/j.marpetgeo.2016.12.029
Sun Q. and Leslie S. (2020). Tsunamigenic potential of an incipient submarine slope failure in the northern South China Sea. Mar. Petroleum Geology 112, 104111. doi: 10.1016/j.marpetgeo.2019.104111
Sun Q., Wu S., Cartwright J., and Dong D. (2012). Shallow gas and focused fluid flow systems in the Pearl River Mouth Basin, northern South China Sea. Mar. Geology 315, 1–14. doi: 10.1016/j.margeo.2012.05.003
Taylor B. and Hayes D. E. (1983). Origin and history of the South China Sea basin. Geophysic. Monograph Series 27, 23–56. doi: 10.1029/GM027p0023
Traynor J. and Sladen C. (1997). Seepage in Vietnam—onshore and offshore examples. Mar. Petroleum Geology 14, 345–362. doi: 10.1016/S0264-8172(96)00040-2
Vaknin I., Aharonov E., Holtzman R., and Katz O. (2024). Gas seepage and pockmark formation from subsurface reservoirs: Insights from table-top experiments. J. Geophysical Research: Solid Earth 129, e2023JB028255. doi: 10.1029/2023JB028255
Van Asch T. W. (1984). Creep processes in landslides. Earth Surface Processes Landforms 9, 573–583. doi: 10.1002/esp.3290090611
Wang F. and Ding W. (2023). How did sediments disperse and accumulate in the oceanic basin, South China Sea. Mar. Petroleum Geology 147, 105979. doi: 10.1016/j.marpetgeo.2022.105979
Wang Y., Tu G., Yu J., Yan P., Ma J., Tian Z., et al. (2024). 1300-m-High gas plume from pockmarks in the north Nansha waters, South China sea. Mar. Petroleum Geology 164, 106868. doi: 10.1016/j.marpetgeo.2024.106868
Warnke F., Schwenk T., Miramontes E., Spiess V., Wenau S., Bozzano G., et al. (2023). Evolution of complex giant seafloor depressions at the northern Argentine continental margin (SW Atlantic Ocean) under the influence of a dynamic bottom current regime. Front. Earth Sci 11, 1117013. doi: 10.3389/feart.2023.1117013
Warren J. K., Cheung A., and Cartwright I. (2011). Organic geochemical, isotopic, and seismic indicators of fluid flow in pressurized growth anticlines and mud volcanoes in modern deep-water slope and rise sediments of offshore Brunei Darussalam: Implications for hydrocarbon exploration in other mud-and salt-diapir provinces. In Wood L. J. (Ed.), Shale Tectonics (Vol. 93, pp. 0). American Association of Petroleum Geologists. doi: 10.1306/13231314M933424
Wenau S., Spieß V., Pape T., and Fekete N. (2017). Controlling mechanisms of giant deep water pockmarks in the Lower Congo Basin. Mar. Petroleum Geology 83, 140–157. doi: 10.1016/j.marpetgeo.2017.02.030
Wu Z., Zhao D., Zhou J., Liu Z., Wang M., Shang J., et al. (2023). Formation mechanism of deep-sea giant pockmarks: A case study of the Reed Basin in the South China Sea. Geomorphology 433, 108726. doi: 10.1016/j.geomorph.2023.108726
Wynn R. B. and Stow D. A. (2002). Classification and characterisation of deep-water sediment waves. Mar. Geology 192, 7–22. doi: 10.1016/S0025-3227(02)00547-9
Xu C., Xu G., Xing J., Sun Z., and Wu N. (2020). Research progress of seafloor pockmarks in spatio-temporal distribution and classification. J. Ocean Univ. China 19, 69–80. doi: 10.1007/s11802-020-3878-6
Yan X., Sun H., Chen Z., Shuai F., Wei Z., and Xu Y. (2020). Physical experimental study on the formation mechanism of pockmark by aeration. Mar. Georesources Geotechnology 38, 322–331. doi: 10.1080/1064119X.2019.1571539
Yu K., Alves T. M., Li W., Li S., Li J., Zhao F., et al. (2022). The role of bottom currents on the morphological development around a drowned carbonate platform, NW South China Sea. J. Ocean Univ. China 21, 801–812. doi: 10.1007/s11802-022-5020-4
Yu K. Q., Miramontes E., Alves T. M., Li W., Liang L. L., Li S., et al. (2021). Incision of submarine channels over pockmark trains in the South China sea. Geophys Res. Lett. 48 (24). doi: 10.1029/2021GL092861
Zhang K., Guan Y., Song H., Fan W., Li H., Kuang Y., et al. (2020b). A preliminary study on morphology and genesis of giant and mega pockmarks near Andu Seamount, Nansha Region (South China Sea). Mar. Geophysical Res. 41, 2. doi: 10.1007/s11001-020-09404-y
Zhang H., He S., Liu W., Deng Y., and Hu W. (2023). Creep-to-runout transition of large landslides controlled by frictional velocity strengthening and weakening (Vajont 1963, Italy). Rock Mechanics Rock Eng. 56, 8471–8483. doi: 10.1007/s00603-023-03473-2
Zhang J., Wu Z., Shen Z., Dong C., Wang C., and Zhao Y. (2020a). Seismic evidence for the crustal deformation and kinematic evolution of the Nansha Block, South China Sea. J. Asian Earth Sci. 203, 104536. doi: 10.1016/j.jseaes.2020.104536
Zhu C., Cheng S., Li Q., Shan H., Lu J. A., Shen Z., et al. (2019). Giant submarine landslide in the South China Sea: Evidence, causes, and implications. J. Mar. Sci Eng. 7, 152. doi: 10.3390/jmse7050152
Keywords: submarine pockmarks, slope instability, landslide, southern South China Sea, deformation pattern
Citation: Liu Z, Wu Z, Liu Y, Shang J, Zhou J and Zhang J (2025) Effects of slope instability on pockmark deformation on the continental slope in the southern South China Sea. Front. Mar. Sci. 12:1605830. doi: 10.3389/fmars.2025.1605830
Received: 04 April 2025; Accepted: 16 September 2025;
Published: 02 October 2025.
Edited by:
Davide Gamboa, University of Aveiro, PortugalReviewed by:
Gemma Aiello, National Research Council (CNR), ItalyAmir Ismail, Texas A&M University Corpus Christi, United States
Copyright © 2025 Liu, Wu, Liu, Shang, Zhou and Zhang. This is an open-access article distributed under the terms of the Creative Commons Attribution License (CC BY). The use, distribution or reproduction in other forums is permitted, provided the original author(s) and the copyright owner(s) are credited and that the original publication in this journal is cited, in accordance with accepted academic practice. No use, distribution or reproduction is permitted which does not comply with these terms.
*Correspondence: Ziyin Wu, enl3dUBzaW8ub3JnLmNu