Abstract
Several marine strata have developed along the southern coastal Bohai Sea since the Late Quaternary, preserving abundant records of sedimentary evolution. This region is ideal for studying the sedimentary history of a river–sea interaction area. However, detailed sedimentological and chronological studies remain limited, mainly focusing on the estuaries of the Mihe River. In this study, 12 optically stimulated luminescence (OSL) samples were collected from the upper 20 m of a 101 m core to establish a chronological framework using quartz OSL dating. Grain-size analysis was also conducted to determine sedimentological characteristics. Results indicate that the quartz OSL ages range from >100 ka to 6.2 ± 0.4 ka, and we believe they were the minimum ages when equivalent dose (De) >ca. 250 Gy (sample DZK3-G07 and below) owing to OSL signal saturation. Our findings reveal a sedimentary hiatus between >100 ka and 19.8 ka. Holocene sediments are found above a depth of 8.4 m with an onset age of approximately 10.5 ka. A lacustrine layer (8.4–9.6 m) in core DZK3 was dated to 19.8–10.5 ka, which is much older than that of the limnetic and lagoon layers in other cores in this area. Based on sedimentary facies and dating results, no transgressive sediments were observed during marine isotope stage (MIS) 3, and T2 (Xianxian transgression) in the southern coastal Bohai Sea only occurred in MIS 5e. This sedimentary sequence pattern is consistent with global sea-level changes.
1 Introduction
During the Quaternary period, frequent sea-level fluctuations have occurred in coastal regions due to alternating glacial and interglacial periods (Yao et al., 2012; Nian et al., 2018; Xu et al., 2019; Gao et al., 2021). Due to strong land–sea interactions, the southern coastal Bohai Sea is sensitive to climate change and plays a key role in regional energy-matter exchange and environmental evolution (Yao et al., 2010; Yi et al., 2013; Shi et al., 2016).
Since the Late Pleistocene, three large-scale marine transgressions have occurred around the coastal region of the Bohai Sea: the Cangzhou (T3), Xianxian (T2), and Huanghua (T1) transgressions (Wang et al., 1986; Zhao et al., 1978). In recent decades, research has mainly focused on their distribution (Wang et al., 1986; Zhao, 1986; Liu, 2017; Yuan et al., 2024), chronology (Yi et al., 2012; Li et al., 2019; Long et al., 2022), and evolution processes (Shi et al., 2016; Liu et al., 2009; Yi et al., 2012, 2013). Wang et al. (1986) and Zhao (1986) first mapped the extent of these transgressions along the coast of the Bohai Sea using data from more than 100 cores, later modified by Liu (2017) for the southern coastal Bohai Sea through the studies on the characteristics of ostracods and isotopic-dating methods. However, the spatial patterns of the three transgressions vary across the northern, southern, and western Bohai Sea (Yuan et al., 2024).
A reliable chronology of core sediments is essential for reconstructing the evolution of coastal zones. Earlier dating framework of transgressions was mainly based on the 14C method (Long et al., 2022; Zhao and Zhang, 1985), finding that the three transgressions (from top to bottom: T1, T2, and T3) along the coast of the Bohai Sea occurred in marine isotopic stages (MIS) 1, 3, and 5, respectively (Wang et al., 1986; Zhao, 1986). However, with the development of the optically stimulated luminescence (OSL) dating method, Yi et al. (2013) suggested that quartz OSL provides more reliable ages than radiocarbon dating for pre-Holocene sediment samples in the southern coastal Bohai Sea, leading some researchers to propose that T2 may have occurred at an earlier stage, possibly during MIS 3 – 5 (Yi et al., 2013; Zhang, 2021). Using feldspar OSL dating, which overcomes the limitations of quartz signal saturation, many scholars suggested that T1, T2, and T3 occurred in MIS 1, MIS 5, and MIS 7, respectively (Long et al., 2022; Liu, 2017; Li et al., 2019). Regarding the environmental evolution process since the late Pleistocene, Yi et al. (2013) reported no major depositional discontinuities within the upper 25 m of the core sediments on the south coast of the Bohai Sea. However, other studies, using high-resolution dating methods, indicate periods of sedimentary hiatuses around the coast of the Bohai Sea correlated with glacial events (Li et al., 2004), especially during the Last Glacial Maximum (LGM, approximately 30 – 20 ka) (Chen et al., 2012; Yuan et al., 2024), highlighting the need for further investigation.
Despite these advancements, chronological data remain limited for the southern coastal Bohai Sea, restricting a detailed interpretation of its environmental evolution. In this study, a 101 m core was obtained, and 12 OSL samples were collected from the upper 20 m to establish a chronological framework using the quartz OSL method and reconstruct the sedimentary history of the southern coastal Bohai Sea since the Late Pleistocene.
2 Setting and materials
The Bohai Sea is a nearly enclosed inland sea in northern China (Figure 1a), and the southern coastal Bohai Sea is an alluvial plain formed by several regional rivers, including the Mihe, Xiaoqinghe, and Weihe Rivers (Figure 1b). These rivers originate from the Luzhong Mountain Range and flow from southwest to northeast into the Bohai Sea. Since the Late Pleistocene, under the effects of land–sea interactions, the study area has undergone a sedimentary evolution process and transformed among neritic, delta, tidal flat, and continental shelf (Xue and Ding, 2008; Gao et al., 2018). The thickness of the Quaternary strata increases from southwest to northeast, ranging from tens to hundreds of meters, and the deepest thickness can reach 360 m (Peng et al., 1992). In some areas, these Quaternary sediments mainly consist of piedmont alluvial diluvium, coastal sediments, and lacustrine sediments (Han et al., 2002).
Figure 1
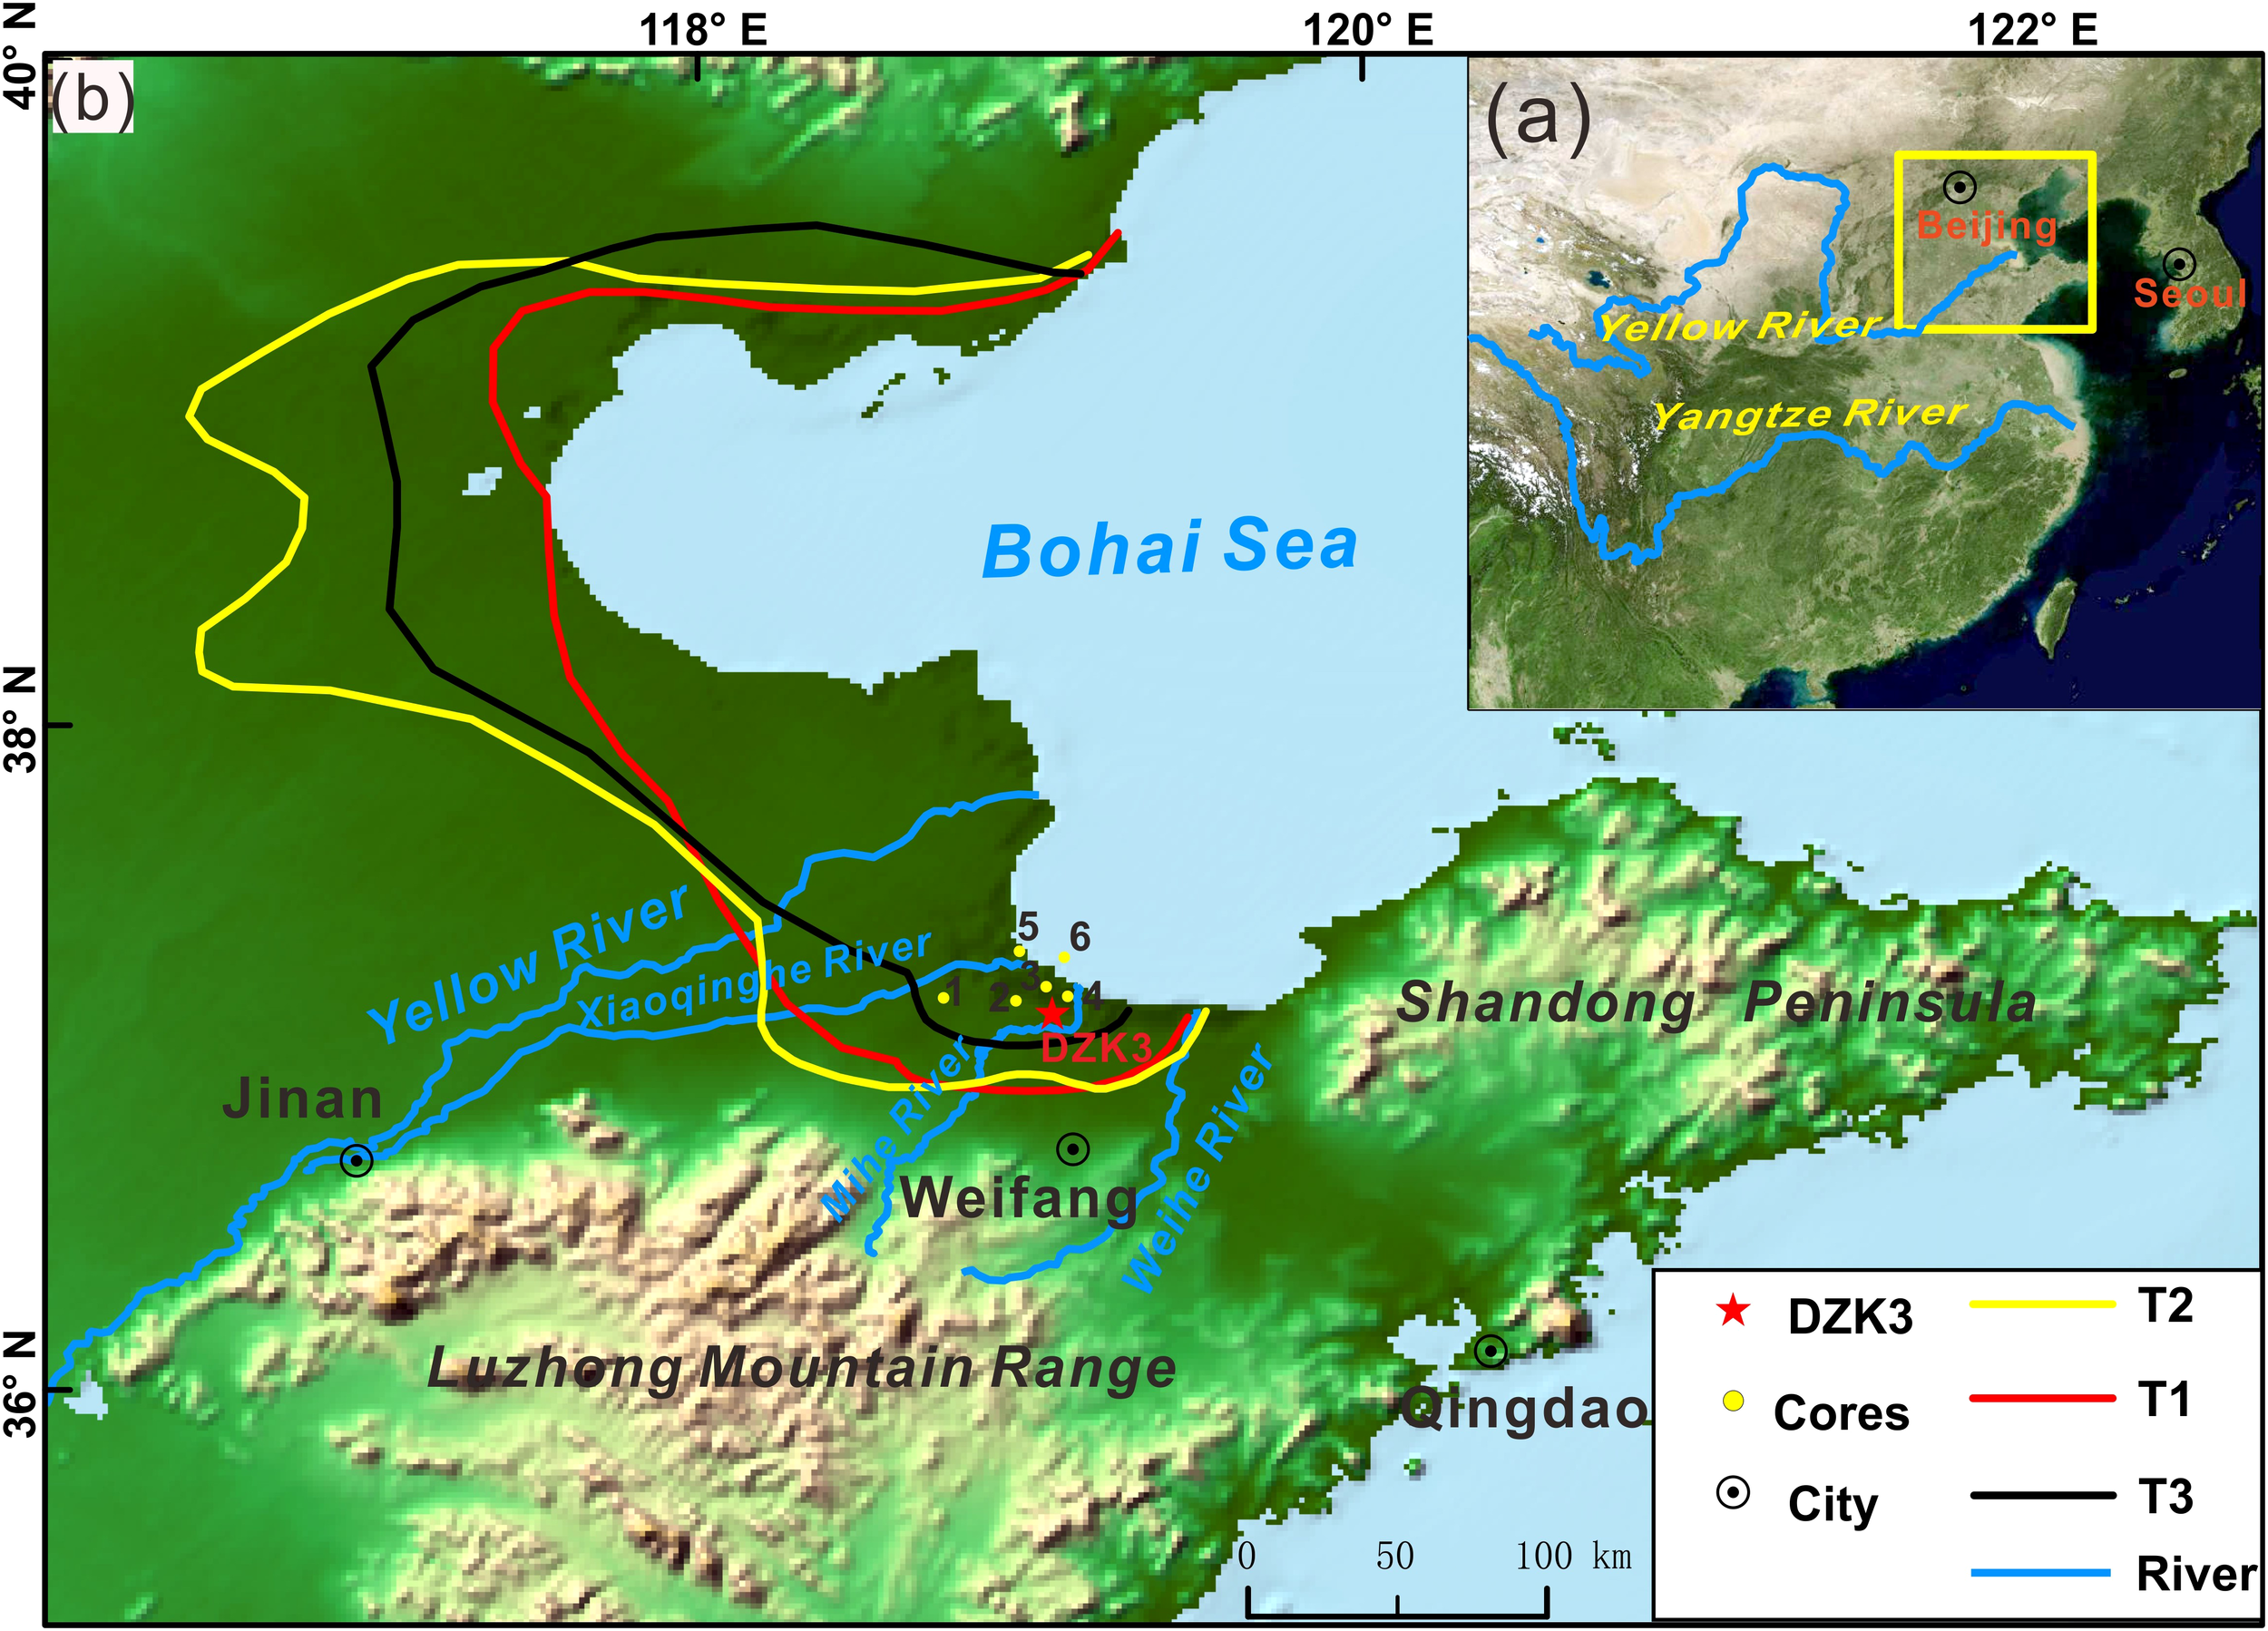
(a) Location of the study area. The yellow rectangle represents the boundary of (b). (b) Geographical settings, drainage system, and position of core DZK3. Locations of previous cores in the southern coast of Bohai Sea. 1: GK95 (Liu, 2017); 2: LZ908 (Yi et al., 2013); 3: BH2 (Yi et al., 2013); 4: DZK01 (Yuan et al., 2024); 5: GK111 (Liu, 2017); 6: BH1 (Yi et al., 2013).
A 101 m deep core, DZK3 (37°05’20’’ N, 119°04’20’’ E), was drilled on the southern coast of the Bohai Sea (altitude approximately 0 m). Based on lithological characteristics (e.g., color, grain size, and biological fossils), the upper 20 m of the core can be divided into four depositional units (Figure 2a): U1 (0 – 1.6 m), light yellow fine sand; U2 (1.6 – 8.4 m), gray fine sand with large amount of shell debris; U3 (8.4 – 9.6 m), gray-black clay, presumed to be a limnological deposit; U4 (9.6 – 20 m), light gray silt and fine sand, of which 9.6 – 11.8 m is gray clay-silt, 12.6 – 14.9 m has a small amount of shell debris, and 17.4 – 18.9 m is reddish-brown silt (For a detailed analysis of sedimental facies see Section 4.3.2).
Figure 2
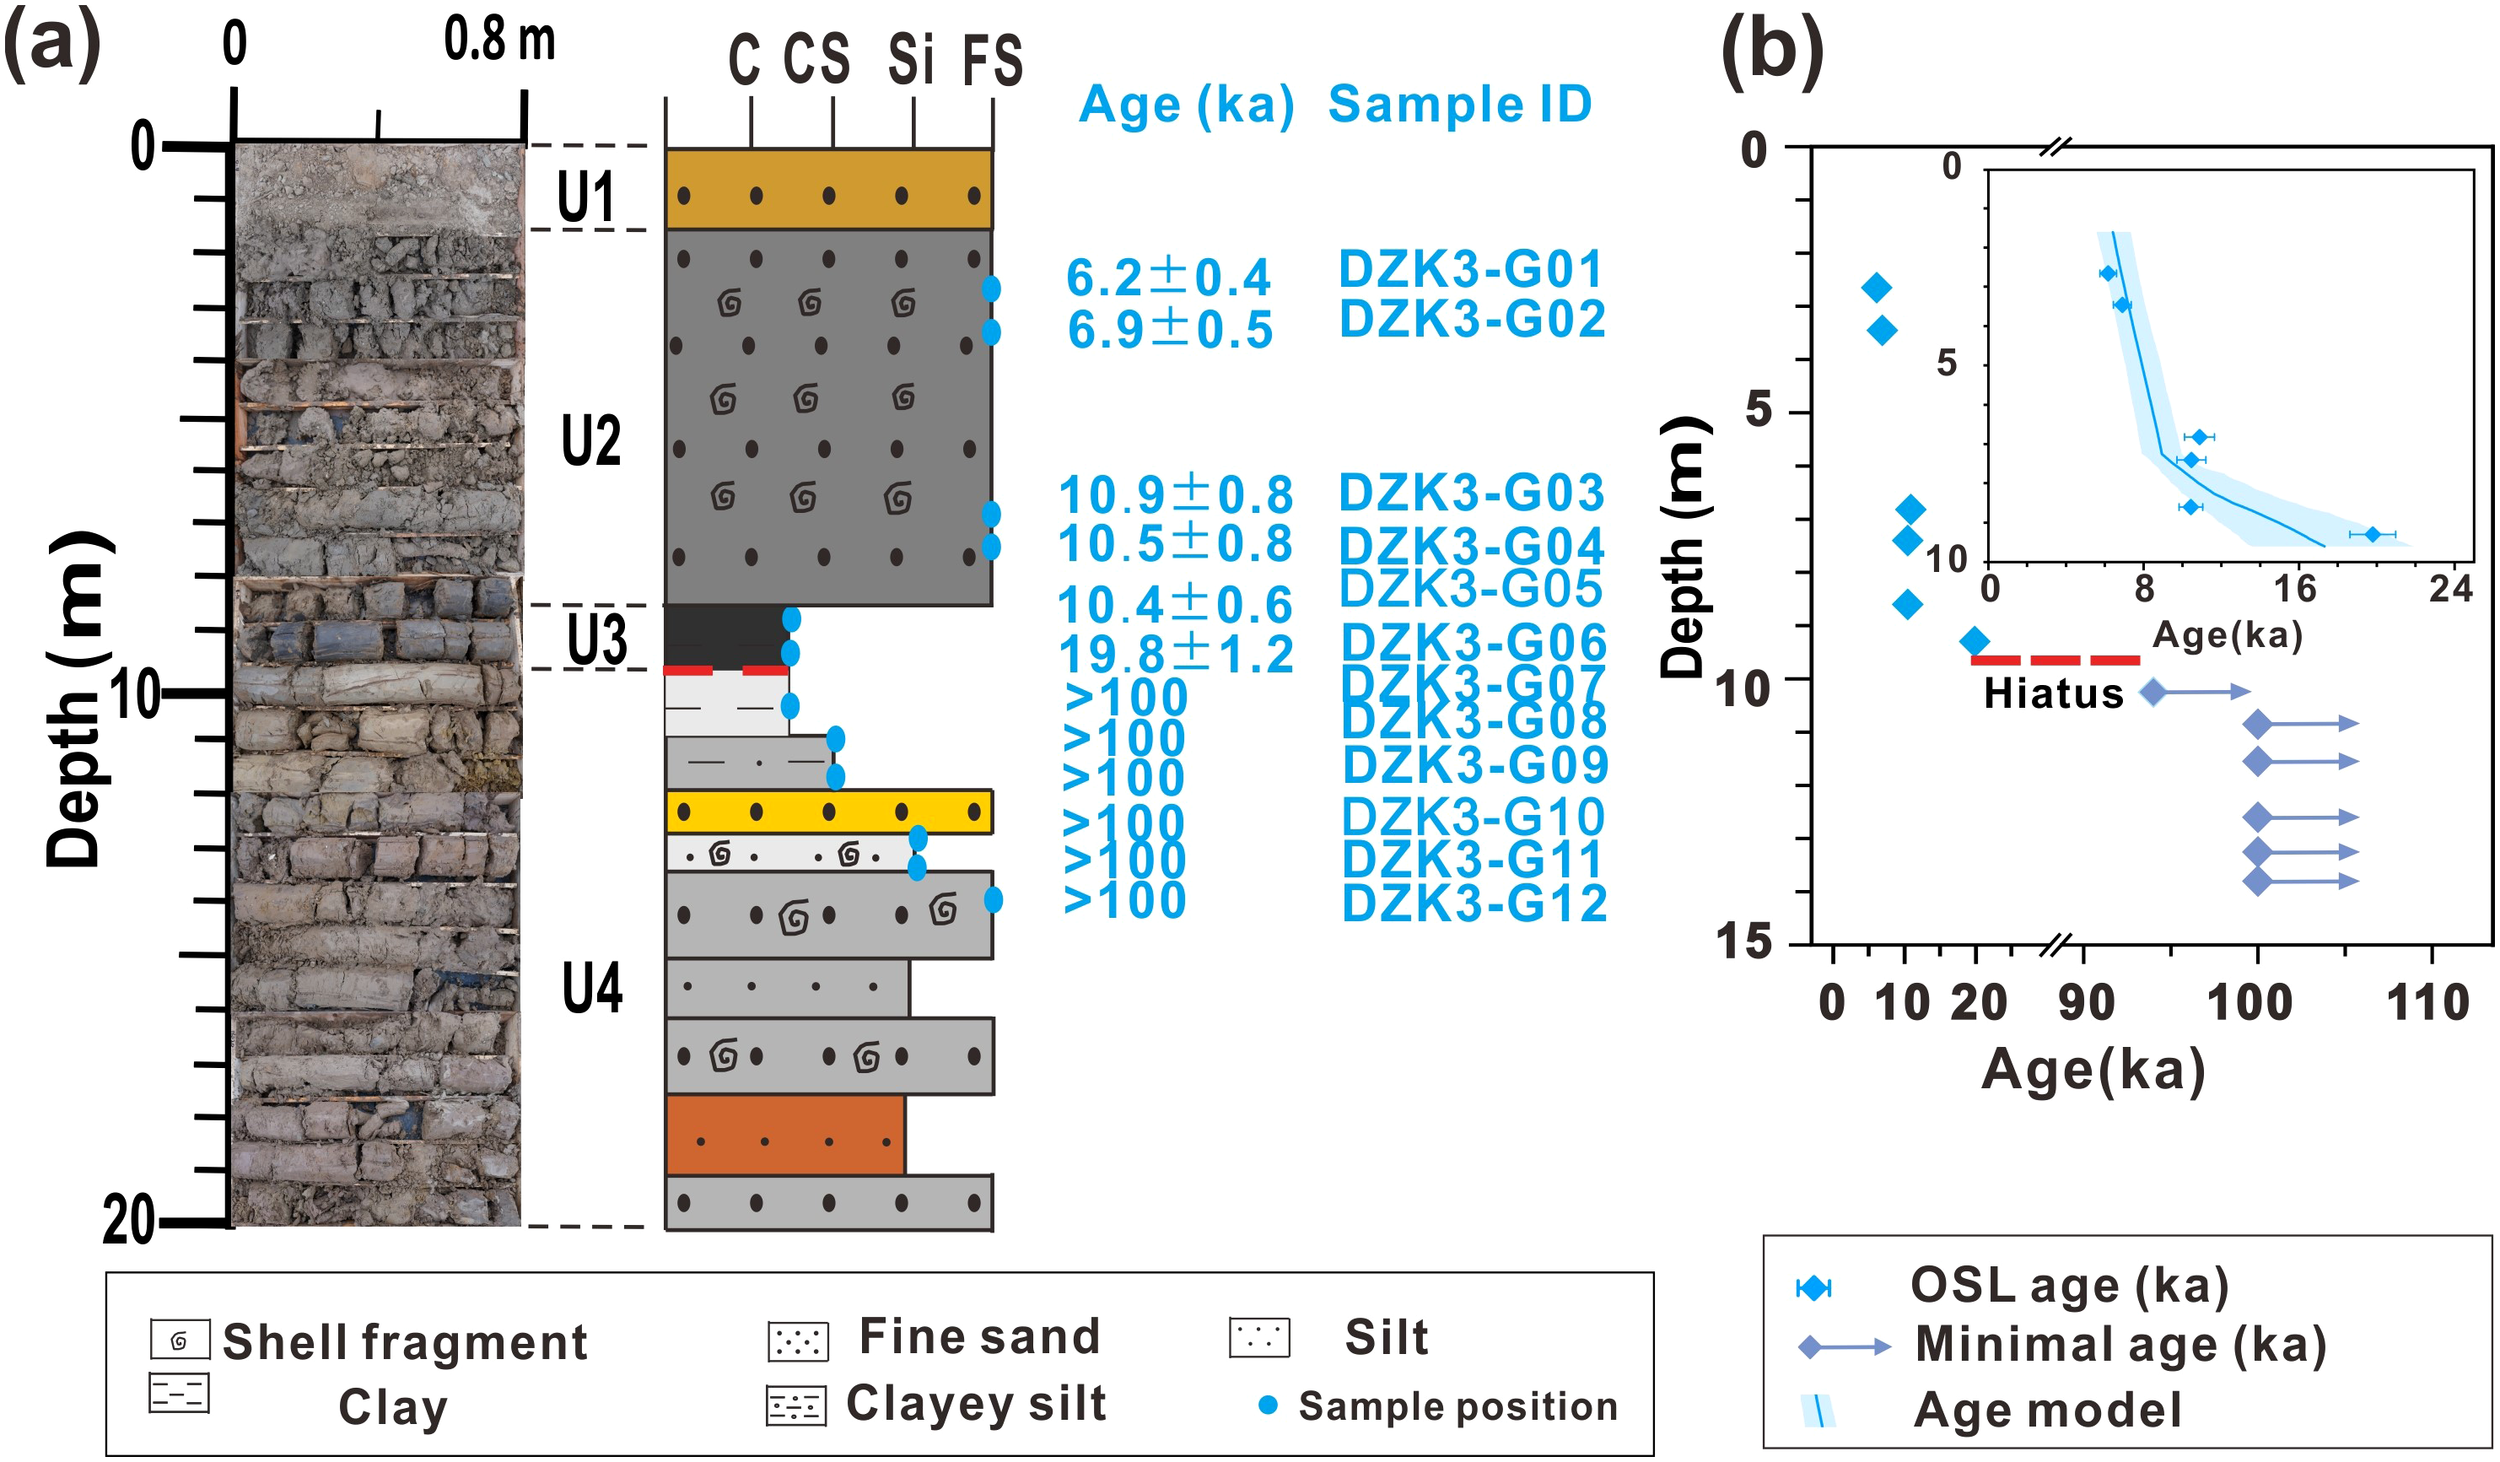
(a) The photo, lithology and OSL ages of core DZK3. (b) The age-depth model, with the inset figure of the upper 9.6 m.
To clarify the sedimentary sequence around the southern coast of the Bohai Sea, core DZK3 and six previously published cores were used to build a joint sedimentary profile from southwest to northeast (also from land to sea). The previously published cores include GK95 and GK111 (Liu, 2017), LZ908, BH1, and BH2 (Yi et al., 2013), and DZK01 (Yuan et al., 2024). The locations of these cores were marked in Figure 1b, and for detailed lithological characteristics and ages see Section 5.3.
3 Methods
3.1 OSL test methods
3.1.1 Sample preparation and equipment
Sample preparation and luminescence measurements were conducted in a dark room under dim red light. Samples were treated with hydrochloric acid (HCl, 10%) and hydrogen peroxide (H2O2, 30%) to remove carbonates and organic matter, respectively. Samples were then sieved to obtain grain size fractions of 38 – 63 µm, 63 – 150 µm, 90 – 125 µm, and 125 – 150 µm. For pure quartz extraction, the 90 – 125 µm fraction was etched with 40% hydrofluoric acid (HF) for 40 min, followed by 10% HCl for 20 min to remove fluoride precipitates. Quartz purity was verified using infrared stimulated luminescence measurements (Duller, 2003; Murray et al., 2021).
OSL measurements were performed at the Shantou University Luminescence Dating Laboratory using a Risø TL/OSL-DA-20 reader, equipped with a 90Sr/90Y beta source (source dose rate 0.0992 Gy/s). Quartz signals were stimulated using blue light (λ = 470 ± 20 nm) for 40 s at 130 °C and detected with a PDM 9107Q-AP-TTL-03 photomultiplier tube, using a 7.5 mm Hoya U - 340 detection filter. Quartz aliquots (8 mm in diameter) were mounted on 9.7 mm stainless steel discs using silicone oil as an adhesive.
3.1.2 Equivalent dose measurements
Equivalent doses (De) were determined using a combination of the single-aliquot regenerative-dose (SAR) protocol (Murray and Roberts, 1998; Murray and Wintle, 2000) and the standard growth curve (SGC) method (Lai, 2006; Lai et al., 2007; Roberts and Duller, 2004). In this SAR-SGC procedure (Lai and Ou, 2013), for each aliquot with natural dose, 4–6 aliquots (SAR aliquots) were measured using the SAR protocol with 3–4 specific regeneration doses to obtain SAR Des and then established the SGC. Additional 12–24 aliquots (SGC aliquots) were measured to obtain their LN/TN ratios. The SGC De value of an individual SGC aliquot was obtained by interpolating its LN/TN ratio into the SGC. For the construction of SGC, regeneration dose and normalized luminescence signal (LX/TX) were fitted using the following exponential plus linear equation (Equation 1) (Lai, 2006),
where X is the regeneration dose, I is the (LX/TX) TD, TD is the test dose, Imax is the normalised OSL intensity at the saturation level, D0 is the characteristic dose at which point the slope of the growth curve is equal to 1/e of the initial value, a is a constant defining the slope of the linear fitting, and b is the OSL signal intensity at the zero-dose point. The final De for each sample was calculated as the arithmetic mean of all SAR Des and SGC Des. For sample DZK5-G06 and DZK5-G07, only the SAR procedure was used to determine De due to the limited quartz grains.
The SGC De error was determined using the following procedure. During the LN/TN test, the LN/TN value and its error for each aliquot were first obtained. Subsequently, the maximum (LN/TN max) and minimum (LN/TN min) values of LN/TN were calculated. These three data points were then input into the SGC for fitting to derive the De, maximum (De max) and minimum (De min) values of De. To obtain the SGC De error, the standard error was applied (Equation 2) (Lai, 2006; Lai et al., 2007),
where σ is the standard deviation of SGC De and n is the number of SGC De points.
For a single aliquot, n is defined as 2, which corresponds to the two data points representing the maximum (De max) and minimum (De min) values of SGC De. For an individual sample, n denotes the number of valid SGC De points.
3.1.3 Dose rate measurements
Uranium and thorium concentrations were determined using inductively coupled plasma mass spectrometry, and potassium content was measured using inductively coupled plasma optical emission spectrometry. The concentrations were converted to dose rates using factors from Guérin et al. (2012). The cosmic-ray contribution was calculated based on sample altitude, geographical location, and depth, following the method of Prescott and Hutton (1994). Attenuation factors were used to calculate the beta dose rates (Brennan et al., 1991; Guérin et al., 2012). An estimated water content of 35% was used for the lacustrine layer and 30% for other lithology facies. Water content was adjusted for seasonal and historical variations, by adding an uncertainty of ± 5% (Yuan et al., 2024; 2025). Dose rates and ages were calculated using DRAC software (Durcan et al., 2015).
3.2 Bayesian age-depth model
The Bayesian age-depth model was applied to the OSL ages above 9.6 m (U2-U3) using the R package “rbacon” (Blaauw and Christen, 2011). During the calculation, samples were divided into 0.25 m thick sections. Given the evident change in sedimentation rate at the boundary between U2 and U3 (located at 8.4 m), the accumulation rates were set at 0.35 ka/m for U2 and 3.5 ka/m for U3, respectively (Figure 2b).
3.3 Grain size
A total of 14 samples (Z01–Z15, except Z13) were selected from core DZK3, next to the OSL samples, with a width of 5 cm for particle-size analysis. During the experiment, 0.3 – 0.5 g of each sample was pretreated with 30% H2O2 and 10% HCl to remove organic matter and carbonates, respectively. To ensure proper dispersion of the sediment size, the samples were added with an appropriate amount of (NaPO3)6 solution before measurement (Lu and An, 1997; Wang et al., 2024a). The particle size distribution was then analyzed using the Malvern Master sizer 3000 laser diffraction instrument, which has a measurement range of 0.24 – 4000 μm, at Shantou University.
4 Results
4.1 Pretest for the SAR procedure
Preheat plateau tests and dose recovery tests (with a given dose of 24.8 Gy, test dose 4.96 Gy) were performed on sample DZK3-G05 to determine the optimal preheat temperature and evaluate the accuracy of the SAR procedure (Murray and Wintle, 2003). Preheat temperatures of 200, 220, 240, 260, 280, and 300 °C were tested, with the corresponding preheat temperatures for test doses being 40 °C lower, and four aliquots tested for each temperature. A stable preheat plateau was observed between 200 °C and 280 °C (Figure 3a), as indicated by relatively stable De values, recovery ratio, and recuperation within the range of 0.9 – 1.1 (Figures 3b–d). Finally, a pre-heat temperature of 260 °C was applied for 10 s to measure both the natural and regenerative dose signals, while 220 °C for 10 s was used to measure the test dose signal (Wang et al., 2024b).
Figure 3
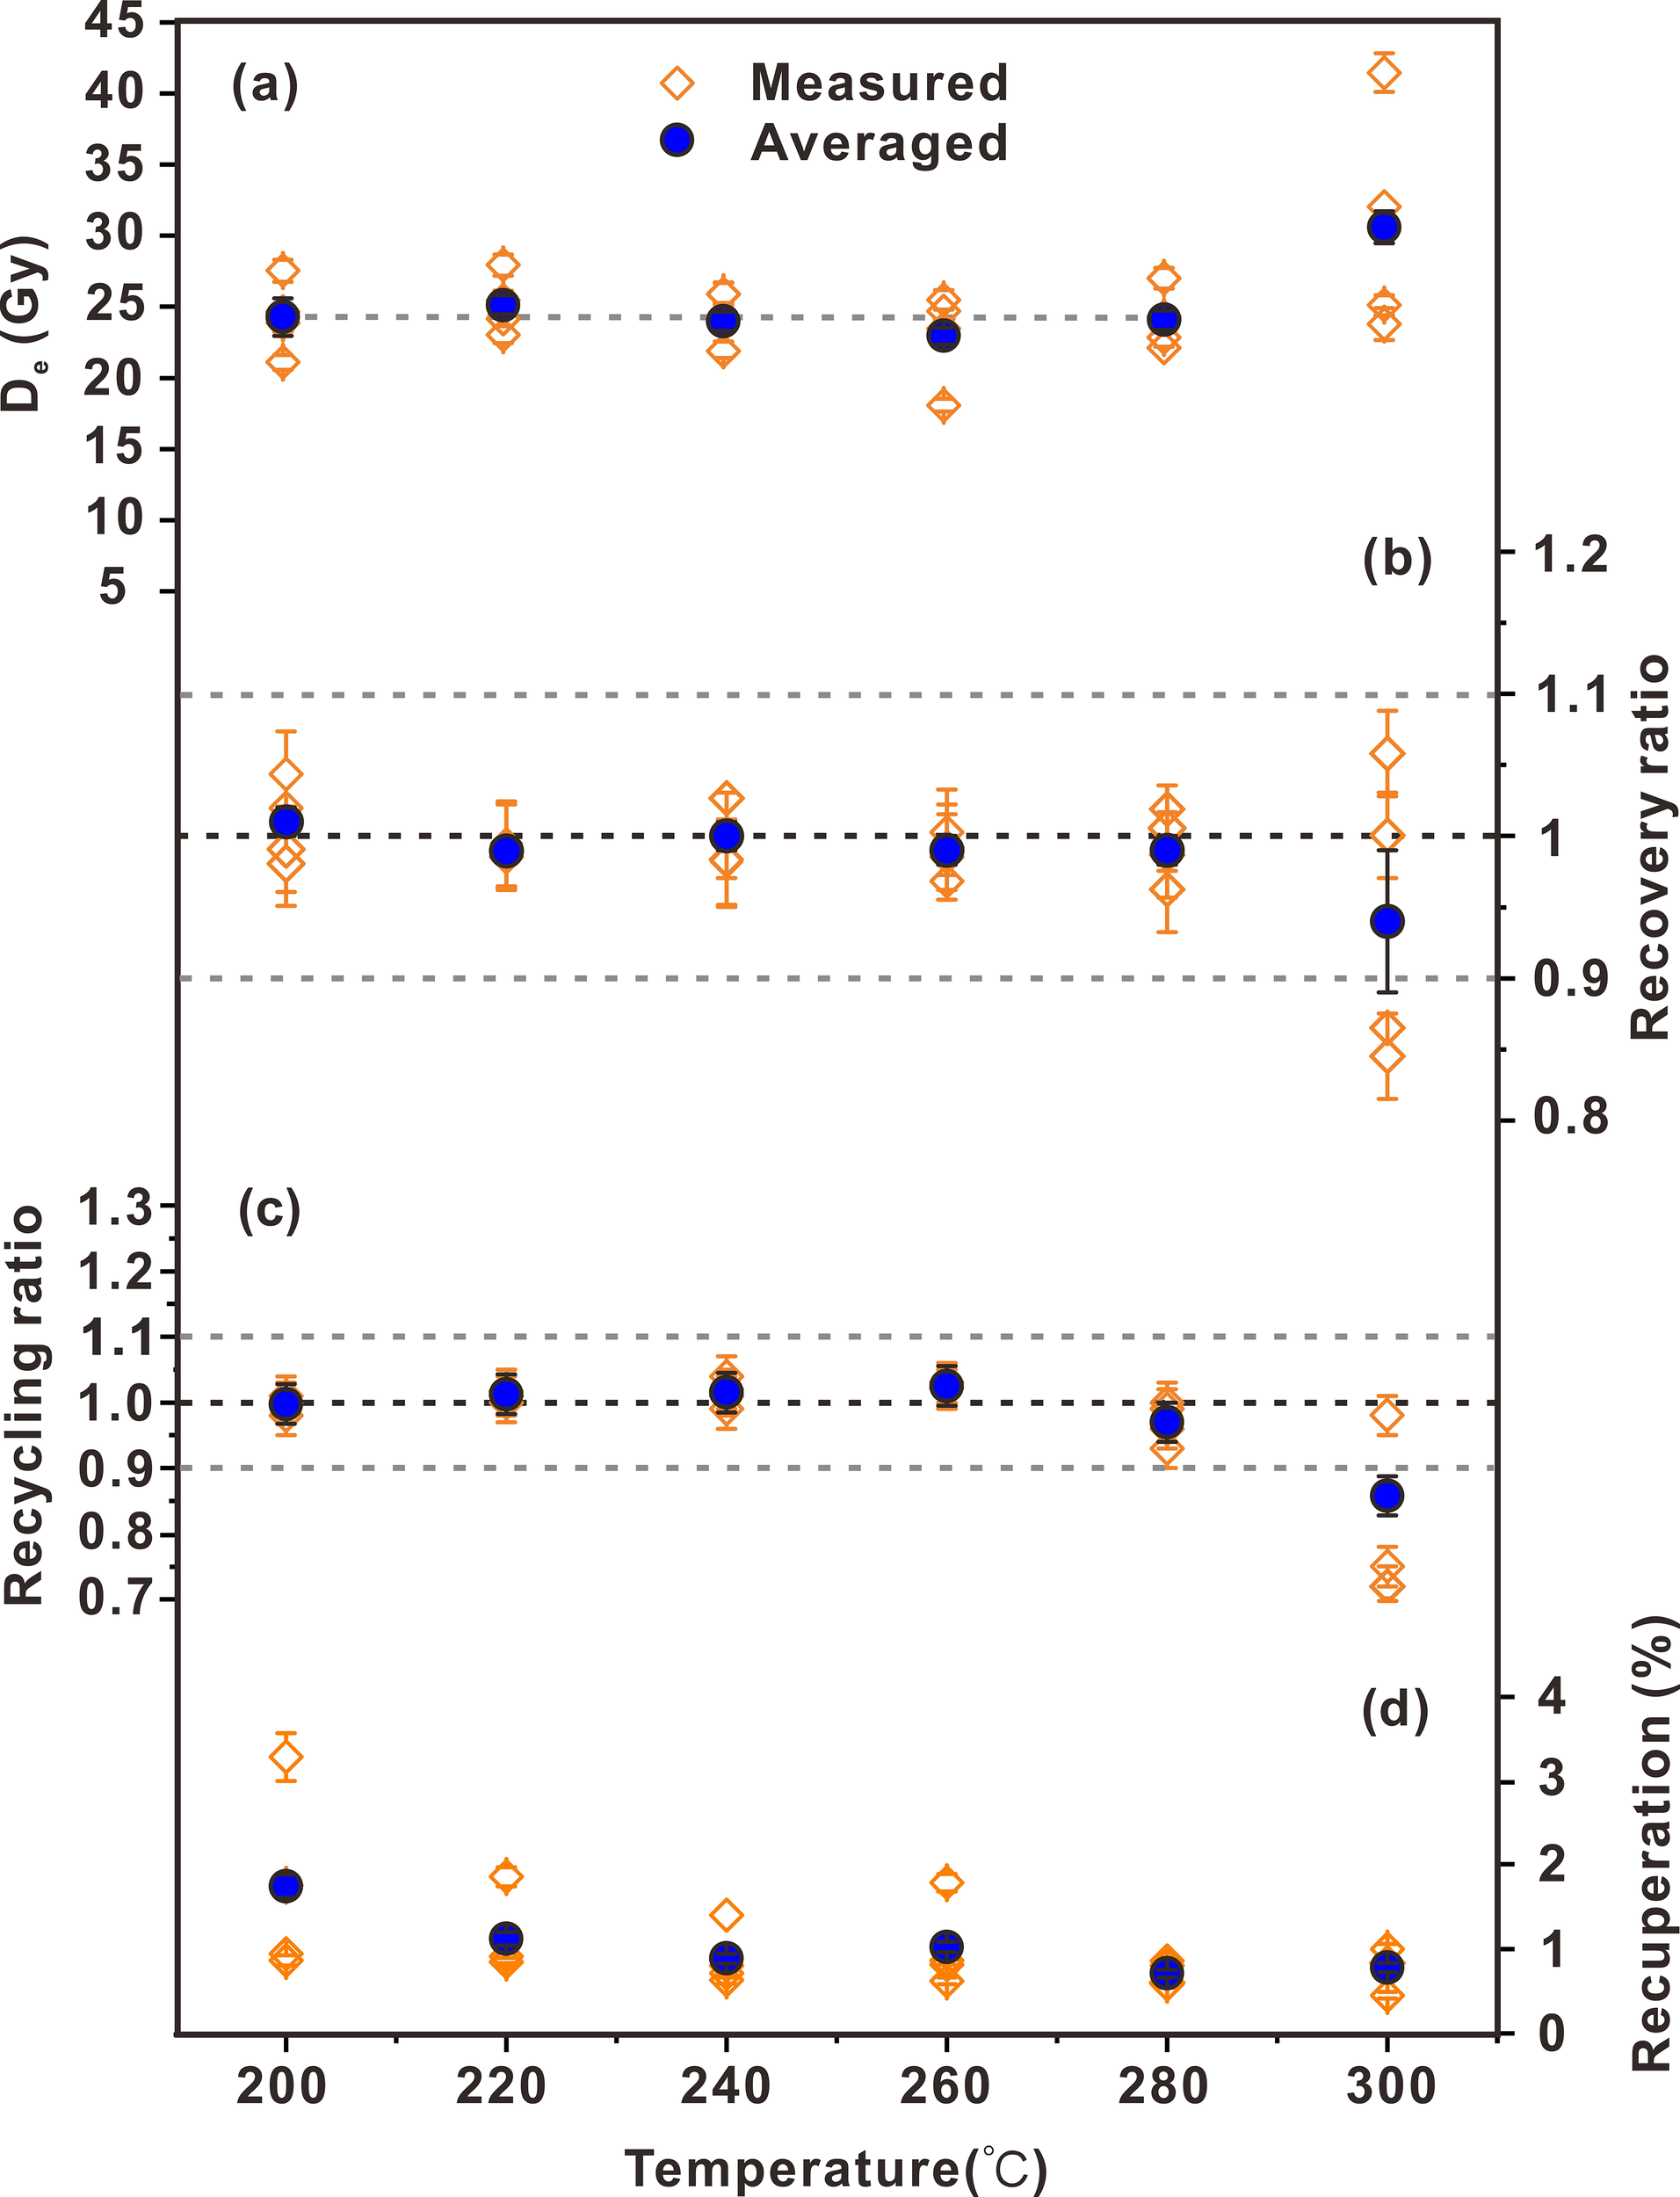
Preheat test results for sample DZK3-G05. (a) De values in preheat plateau test, at each temperature, 4 aliquots were measured to obtain corresponding values (orange) and their average values (blue), (b) Recovery ratio, (c) Recycling ratios, (d) Recuperation.
4.2 Luminescence characteristics and ages
For samples using the SAR-SGC procedure, SGC curves were clustered, and squeezed together with little deviation (the relative standard deviation for each sample at each regeneration dose <10%) (Figures 4a, b). A comparison of SAR Des and SGC Des shows good agreement, with errors within 10% for each sample (Figure 5). The representative decay and dose-response curves for samples DZK3-G02 and DZK3-G05 are presented in Figures 4a, b. The OSL signals rapidly decayed to background levels within the first 2 s of stimulation, indicating a dominance of the fast component. The dose–response curves of all samples were well-fitted using an exponential-plus-linear function (Equation 1) to establish SGC. The details of the OSL dating results are presented in Table 1.
Figure 4
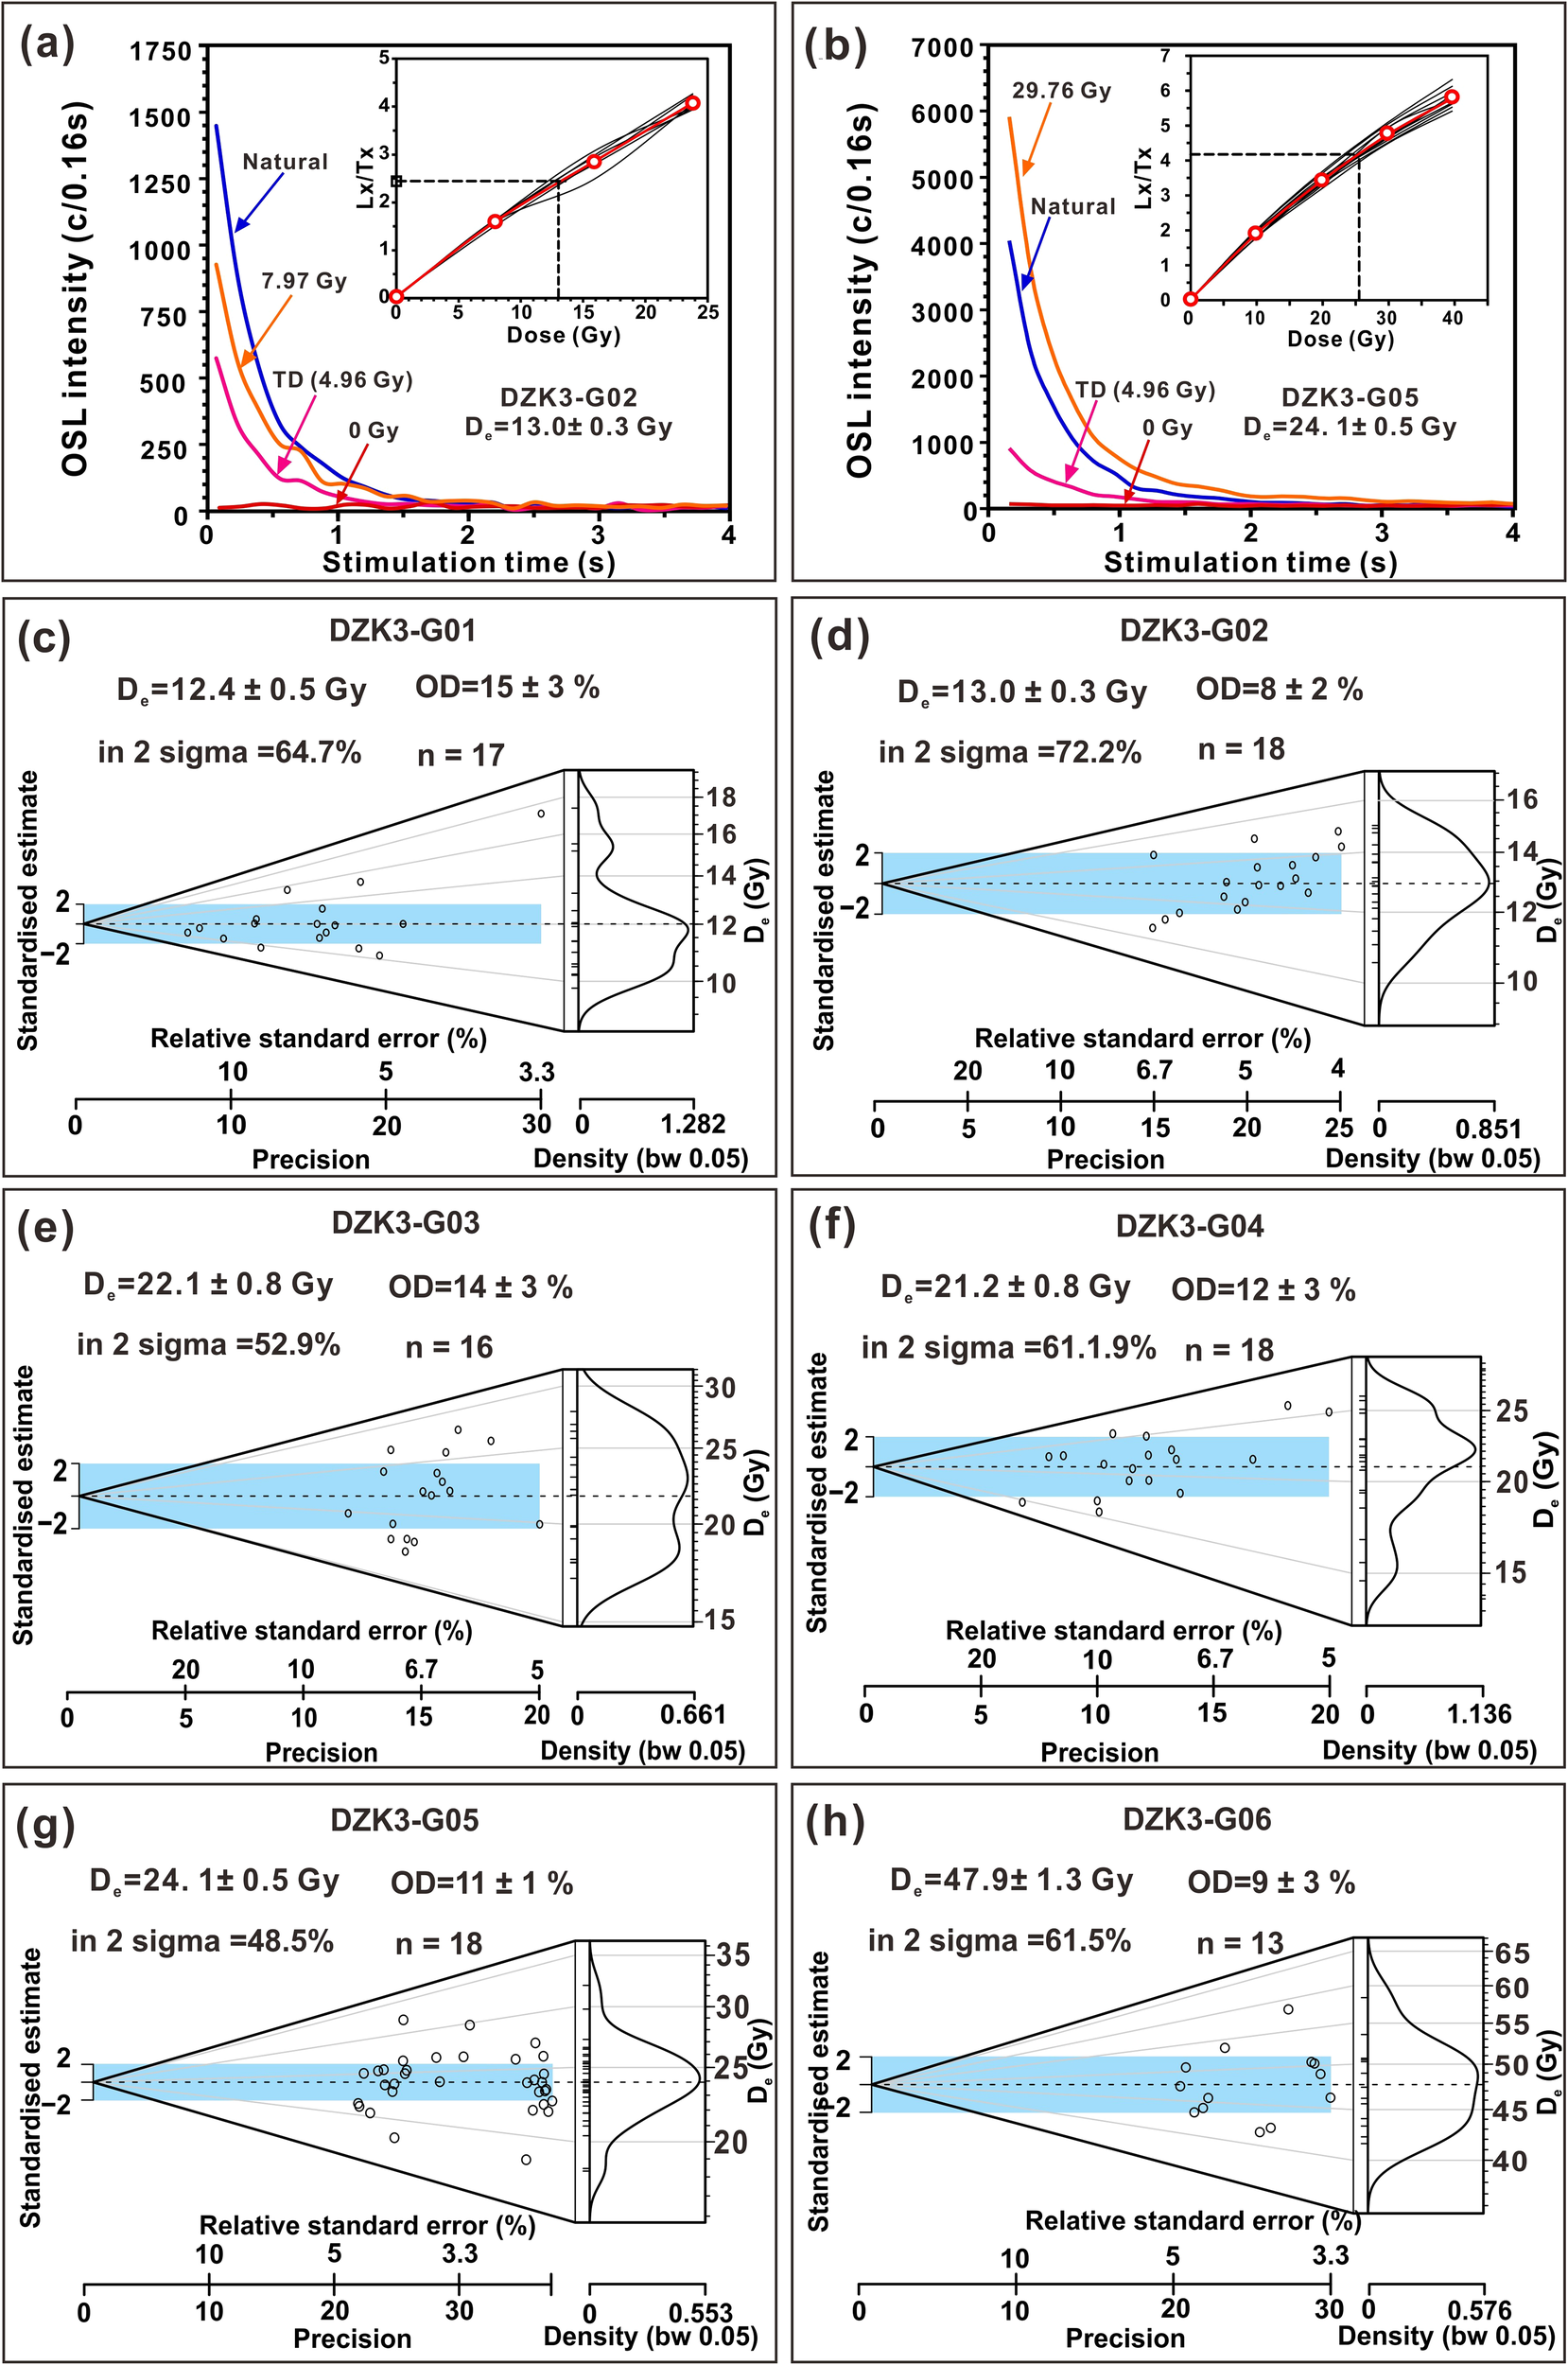
Luminescence properties curves of representative samples (a) DZK3-G02 and (b) DZK3-G05. Abanico plot of the middle-aliquot equivalent dose (De) distribution for representative samples: (c) DZK3-G01, (d) DZK3-G02, (e) DZK3-G03, (f) DZK3-G04, (g) DZK3-G05, and (h) DZK3-G06. The central age model (CAM) calculated De, over-dispersion value (OD), the percentage of estimated Des values (including those applied in SAR and SGC methods for sample DZK3-G01-G06) in two sigmas, as well as the number of aliquots analyzed for each sample (n) are presented on each figure.
Figure 5
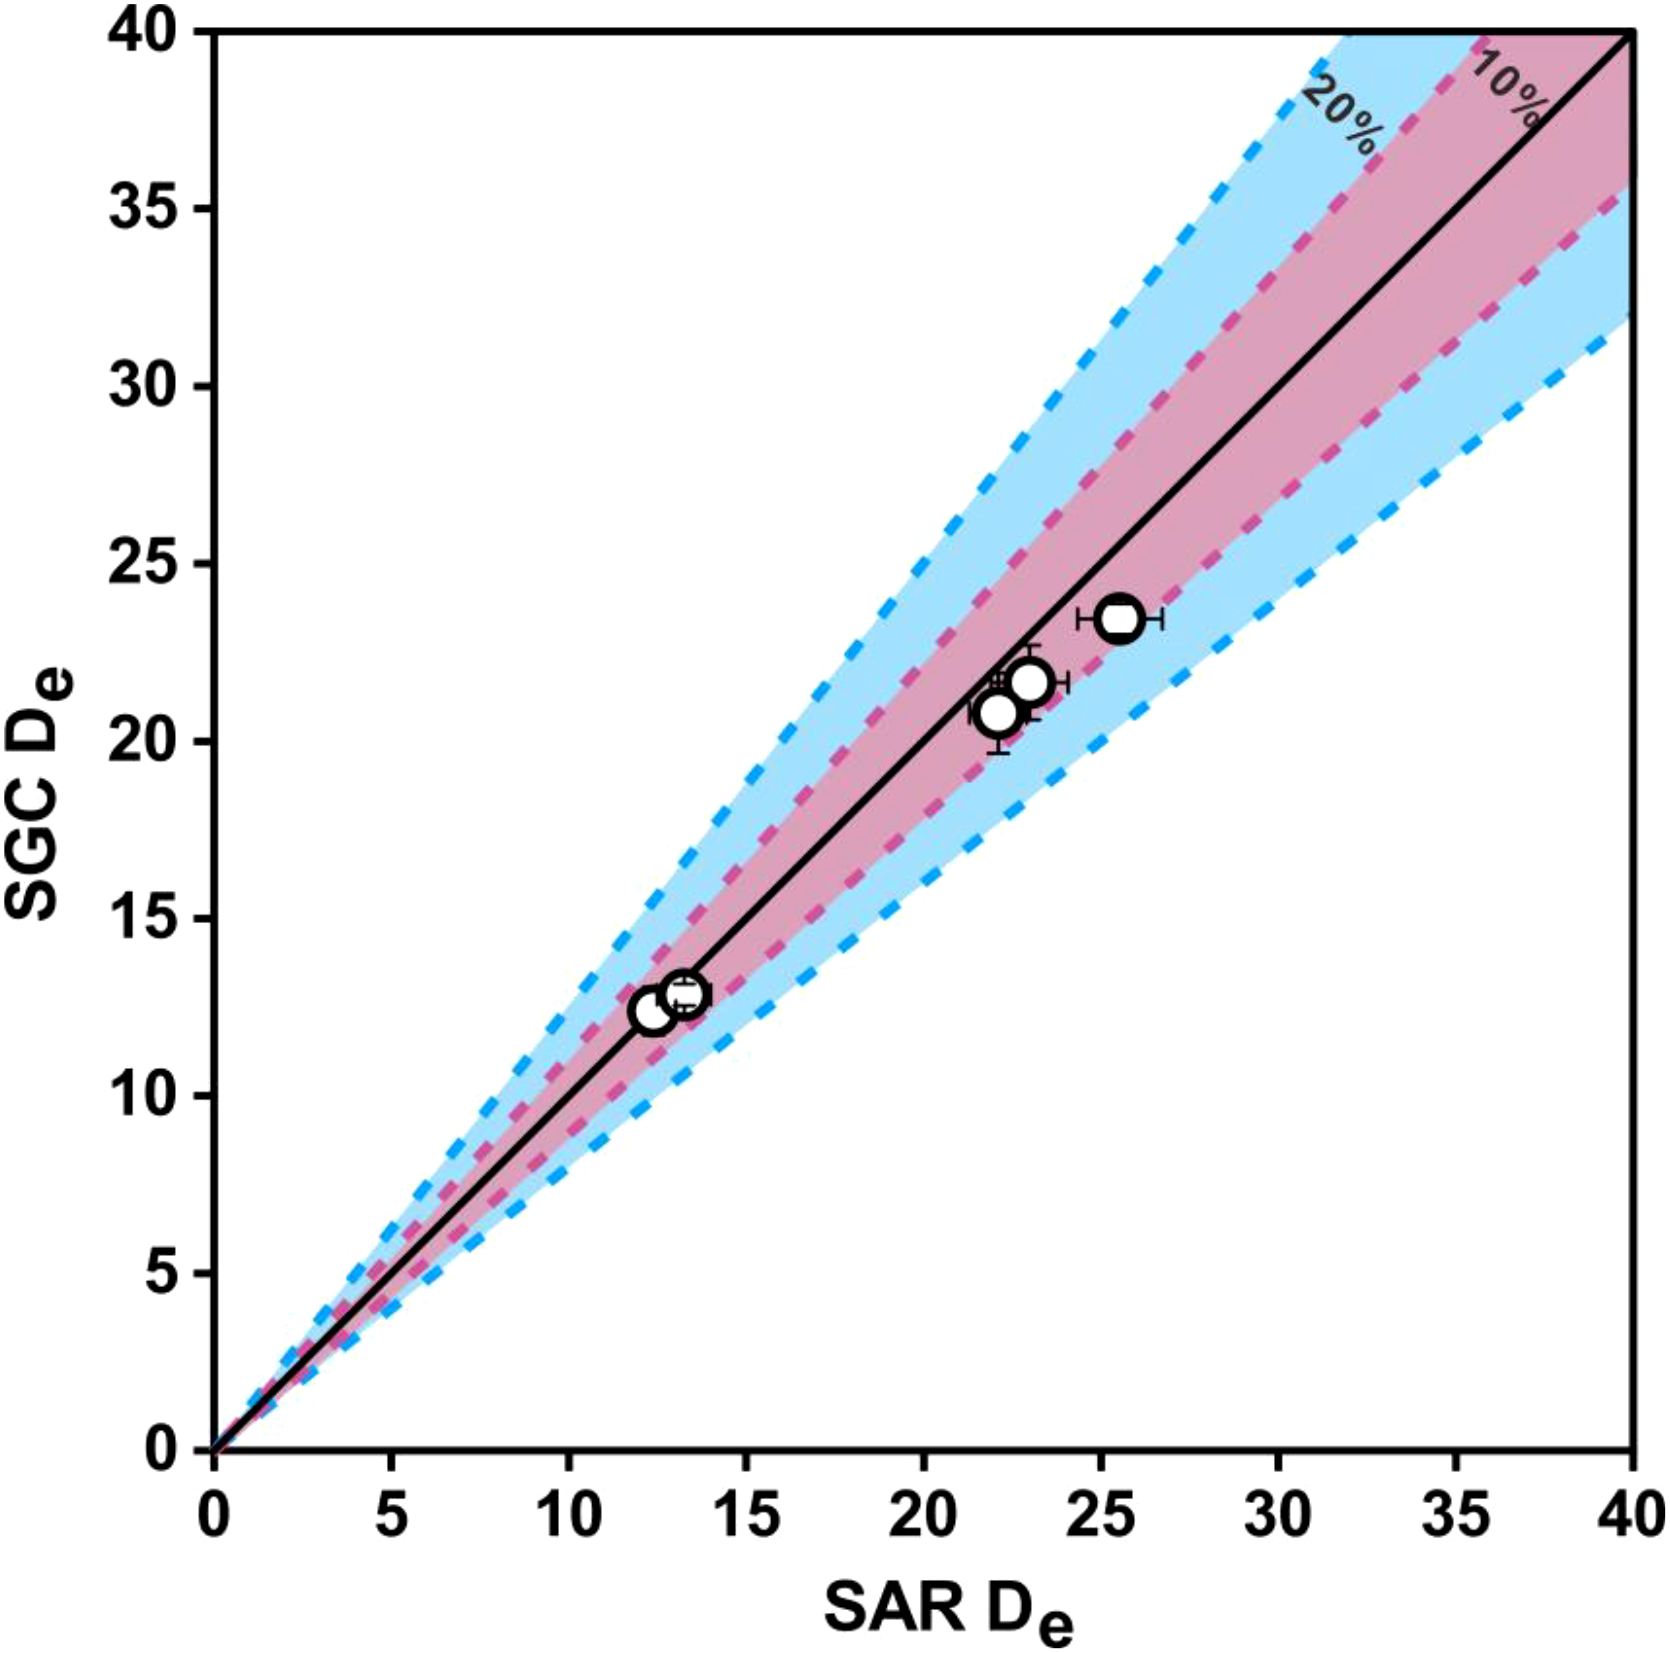
Comparison of De determined by SAR and SGC within 10% uncertainty (purple shaded area) and 20% uncertainty (blue shaded area).
Table 1
| Sample ID | Depth (m) | Grain Size (μm) | Aliquot Size (mm) | Aliquot No. | U (mg/kg) | Th (mg/kg) | K (%) | Water Content (%) | Dose rate (Gy/ka) | De (Gy) | OSL age (ka) | Overdispersion (%) |
|---|---|---|---|---|---|---|---|---|---|---|---|---|
| DZK3-G01 | 2.60-2.70 | 90-125 | 8 | 6a+12(1)b | 1.48 ± 0.07 | 8.64 ± 0.43 | 1.57 ± 0.16 | 30 ± 5 | 2.01 ± 0.11 | 12.4 ± 0.5 | 6.2 ± 0.4 | 15 ± 3 |
| DZK3-G02 | 3.40-3.50 | 90-125 | 8 | 6a+12b | 1.42 ± 0.07 | 5.46 ± 0.27 | 1.65 ± 0.17 | 30 ± 5 | 1.89 ± 0.12 | 13.0 ± 0.3 | 6.9 ± 0.5 | 8 ± 2 |
| DZK3-G03 | 6.78-6.85 | 90-125 | 8 | 6(1)a+12(1)b | 1.92 ± 0.10 | 6.94 ± 0.35 | 1.68 ± 0.17 | 30 ± 5 | 2.03 ± 0.12 | 22.1 ± 0.8 | 10.9 ± 0.8 | 14 ± 3 |
| DZK3-G04 | 7.35-7.45 | 90-125 | 8 | 6a+12b | 1.92 ± 0.10 | 7.70 ± 0.35 | 1.68 ± 0.17 | 30 ± 5 | 2.31 ± 0.12 | 21.2 ± 0.8 | 10.5 ± 0.8 | 12 ± 3 |
| DZK3-G05 | 8.55-8.65 | 90-125 | 8 | 6a+23b | 2.97 ± 0.15 | 8.23 ± 0.41 | 1.73 ± 0.17 | 30 ± 5 | 2.52 ± 0.13 | 24.1 ± 0.5 | 10.4 ± 0.6 | 11 ± 1 |
| DZK3-G06 | 9.25-9.35 | 90-125 | 8 | 13a | 3.64 ± 0.18 | 9.64 ± 0.48 | 1.77 ± 0.18 | 35 ± 5 | 2.38 ± 0.14 | 47.9 ± 1.3 | 19.8 ± 1.2 | 9 ± 3 |
| DZK3-G07 | 10.20-10.30 | 90-125 | 8 | 4a | 2.57 ± 0.13 | 10.20 ± 0.51 | 1.79 ± 0.18 | 30 ± 5 | 2.07 ± 0.13 | 253 ± 15 | >100 | |
| DZK3-G08 | 10.80-10.90 | 90-125 | 8 | 12b | 2.10 ± 0.11 | 8.74 ± 0.44 | 1.61 ± 0.16 | 30 ± 5 | 2.11 ± 0.12 | >250 | >100 | |
| DZK3-G09 | 11.50-11.60 | 90-125 | 8 | 12b | 2.07 ± 0.10 | 8.48 ± 0.42 | 1.70 ± 0.17 | 30 ± 5 | 2.12 ± 0.12 | >250 | >100 | |
| DZK3-G10 | 12.55-12.65 | 90-125 | 8 | 12b | 2.33 ± 0.12 | 9.10 ± 0.46 | 1.68 ± 0.17 | 30 ± 5 | 2.18 ± 0.12 | >250 | >100 | |
| DZK3-G11 | 13.20-13.30 | 90-125 | 8 | 12b | 2.03 ± 0.10 | 8.04 ± 0.40 | 1.67 ± 0.17 | 30 ± 5 | 2.06 ± 0.12 | >250 | >100 | |
| DZK3-G12 | 13.75-13.85 | 90-125 | 8 | 13b | 1.94 ± 0.10 | 8.41 ± 0.42 | 1.68 ± 0.17 | 30 ± 5 | 2.07 ± 0.12 | >250 | >100 |
OSL dating results from core DZK3.
*The superscript a and b indicate aliquot numbers for SAR and SGC protocol, respectively. Parenthesized figures denote the quantities of aliquots classified as outliers, which are defined as values that exceed four standard deviations (σ) from the mean De.
Moreover, the relative contributions of the fast, medium, and slow OSL components for sample DZK3-G05 were analyzed using the “numOSL” R package (Peng et al., 2013; Peng and Li, 2017). Figure 6 illustrates component proportions obtained from this analysis. The fast component dominates the initial signal decay (0 – 2 s), exhibiting rapid depletion characteristic of well-bleached quartz. Specifically, the fast component contributes approximately 64% of the initial signal (integrated within the first 0.8 s), while the medium component accounts for about 30%. Although the medium and slow components persist beyond 5 s, their relative contributions to the initial signal intensity remain minor compared to the fast component.
Figure 6
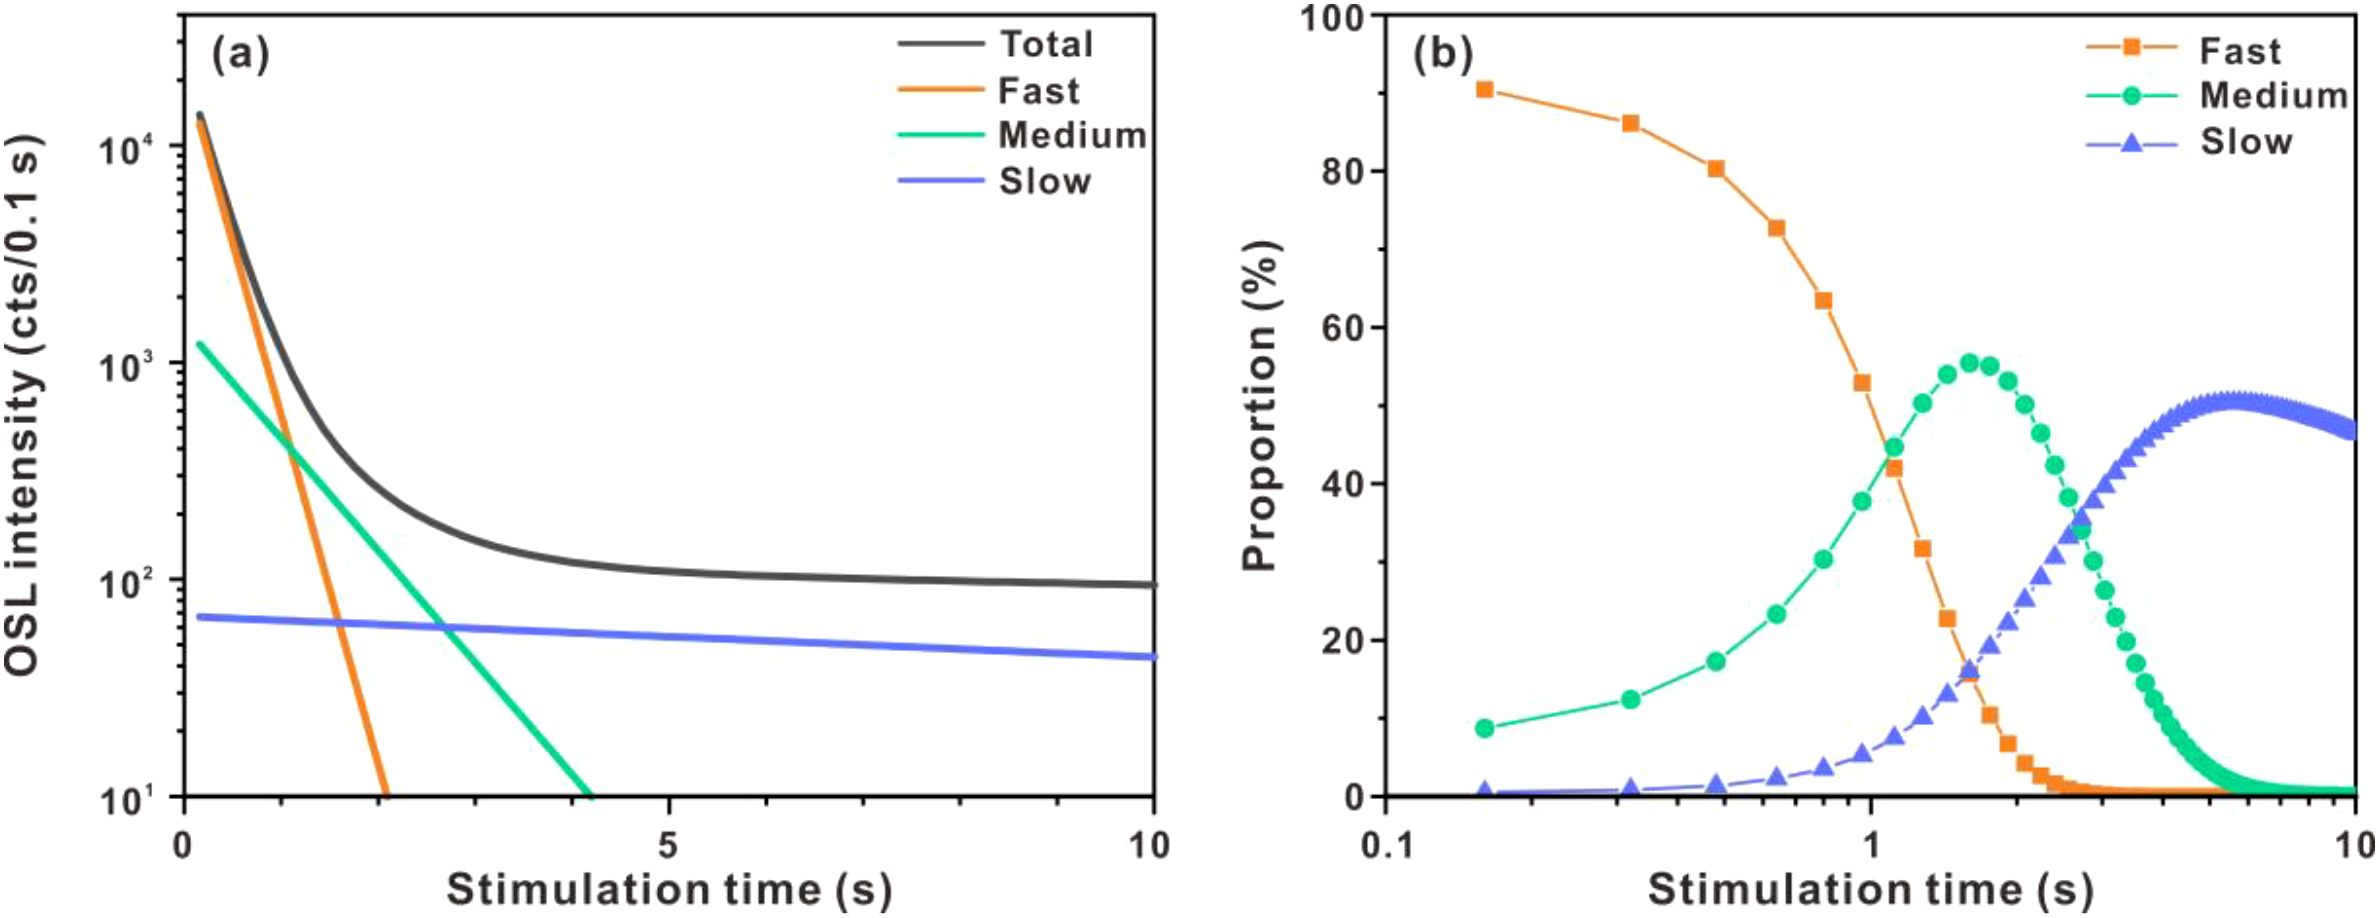
(a) Decay curves of different components and total OSL signal, and (b) Relative proportion of each component of sample DZK3-G05 over time.
For each sample, the over-dispersion (OD) value was calculated to describe the De distribution. The OD values of all samples were between 8 and 15% (Table 1). The Abanico plots (Dietze et al., 2016) of the (De) distributions for DZK3-G01 to G06 are illustrated in Figures 4c–h. The relatively low OD values represent a completely bleached history before deposition, so the central age model (CAM) (Galbraith et al., 1999) was applied to all samples in De calculation.
Samples of DZK3-G07 and below are saturated. The characteristic saturation dose (D0) of DZK3-G07 was calculated. For sample DZK5-G07, the single exponential function is [Standardized OSL (I) = 17.5378 (1- exp (- X/113.26)) + 0.18]. D0 is 113.26 Gy. SAR De is 253 Gy, exceeding 2 D0 (Wintle and Murray, 2006; Lai and Ou, 2013; Mahan et al., 2022). Lx/Tx of SGC aliquots from samples DZK3-G08 to G12 are inserted to the DZK3-G07 SGC curve and SGC De are all over 250 Gy. Consequently, OSL ages from DZK3-G07 to DZK3-G12 are considered as minimum ages.
4.3 Grain-size characteristics
4.3.1 Variations in grain size
Fourteen samples from core DZK3 were analyzed for particle size. The particle size parameters of all samples are shown in Figure 7. Fine silt dominates U2 and U4, with moderate fluctuations in mean grain size from 37.83 μm to 68.64 μm (from top to bottom in U2) and from 18.29 μm to 49.82 μm (above sample Z15 in U4). Silt dominates U3, exhibiting significant fluctuations between 24.1 μm and 26.8 μm. Sorting coefficients of all samples range between 1 and 2. Except for the Z07 sample, other samples show a positive bias, with a skewness value >0.33. The kurtosis values of samples Z01, Z02, Z03, Z10, and Z12 are wide and flat, while those of the remaining samples are narrow. The grain size parameter diagram shows that the average particle size of core DZK3 is consistent with each sedimentary unit.
Figure 7
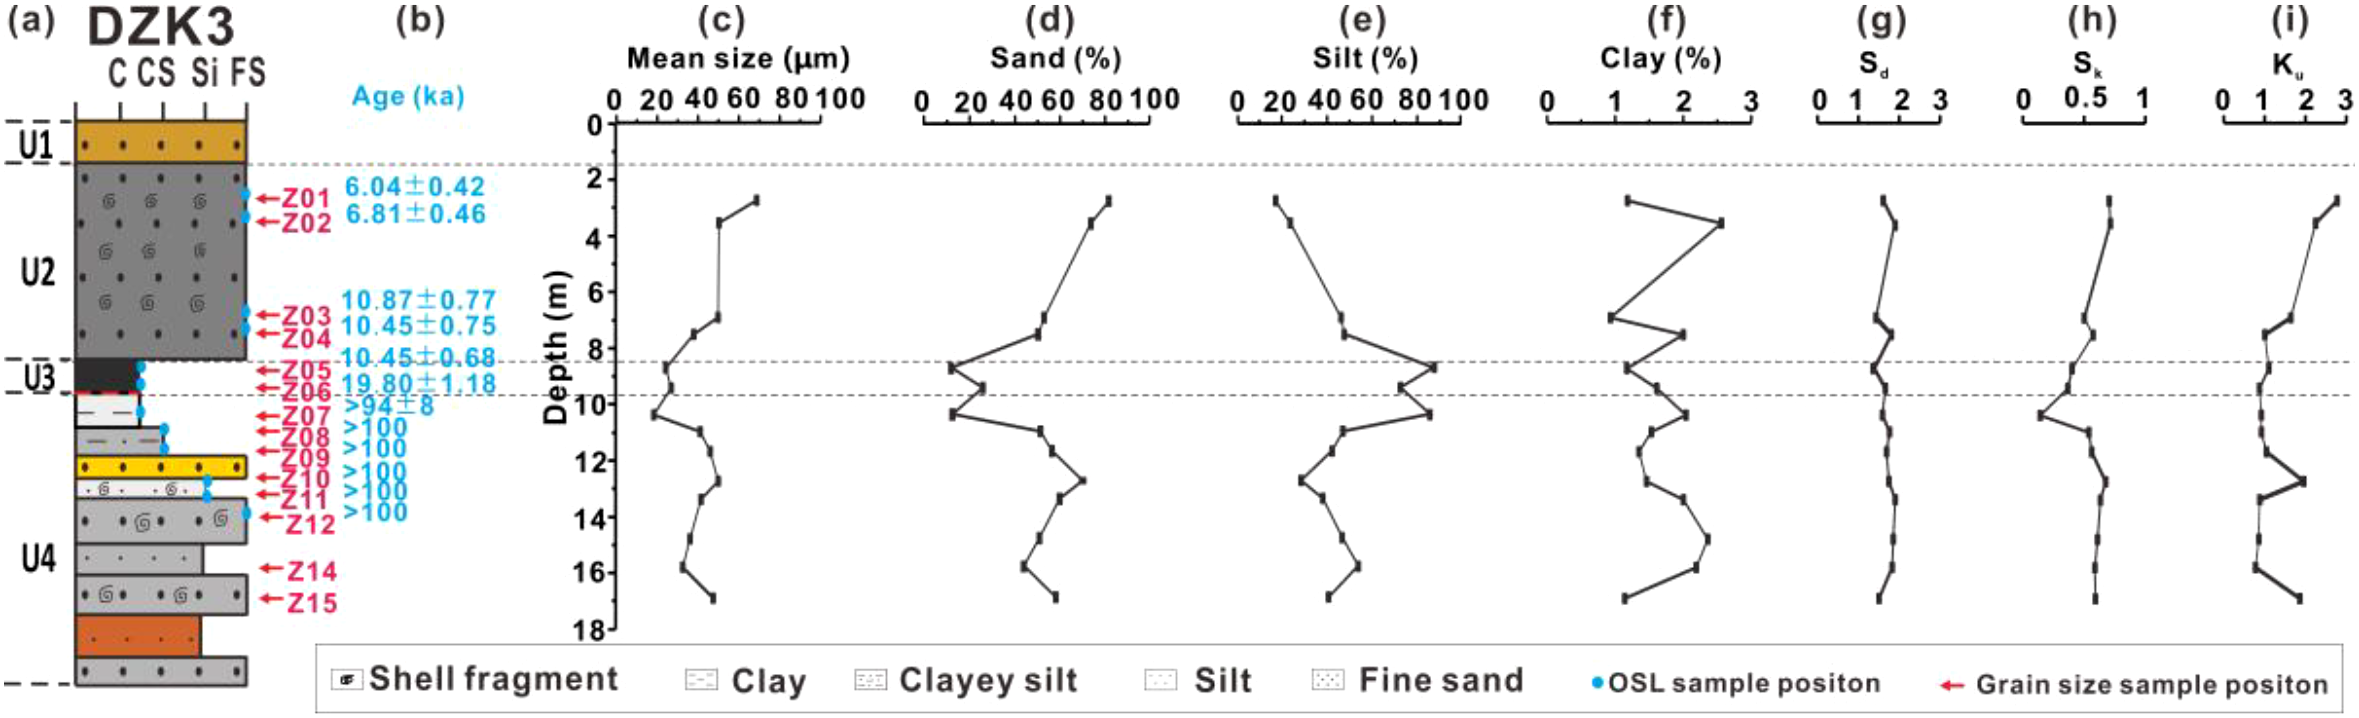
Lithology (a), chrono-stratigraphy (b) and grain size results (c–i) of core DZK3. Specifically, mean size (c); composition of sand (d), silt (e), and clay (f); sorting coefficient (g); skewness (h); kurtosis (i). In (a), the blue dots indicate the positions of OSL samples, and the red characters represent the sample ID.
4.3.2 Analysis of sedimentary environment
The particle-size frequency distribution curve and cumulative frequency curve of 14 samples are shown in Figure 8. These graphs show that the sedimentary dynamics of each unit of core DZK3 gradually weaken and then increase from top to bottom, in accordance with the sediment lithology characteristics. Based on the lithology and grain size characteristics of the sediments, U2 and U4 were identified as marine sediments and U3 as lacustrine sediment.
Figure 8
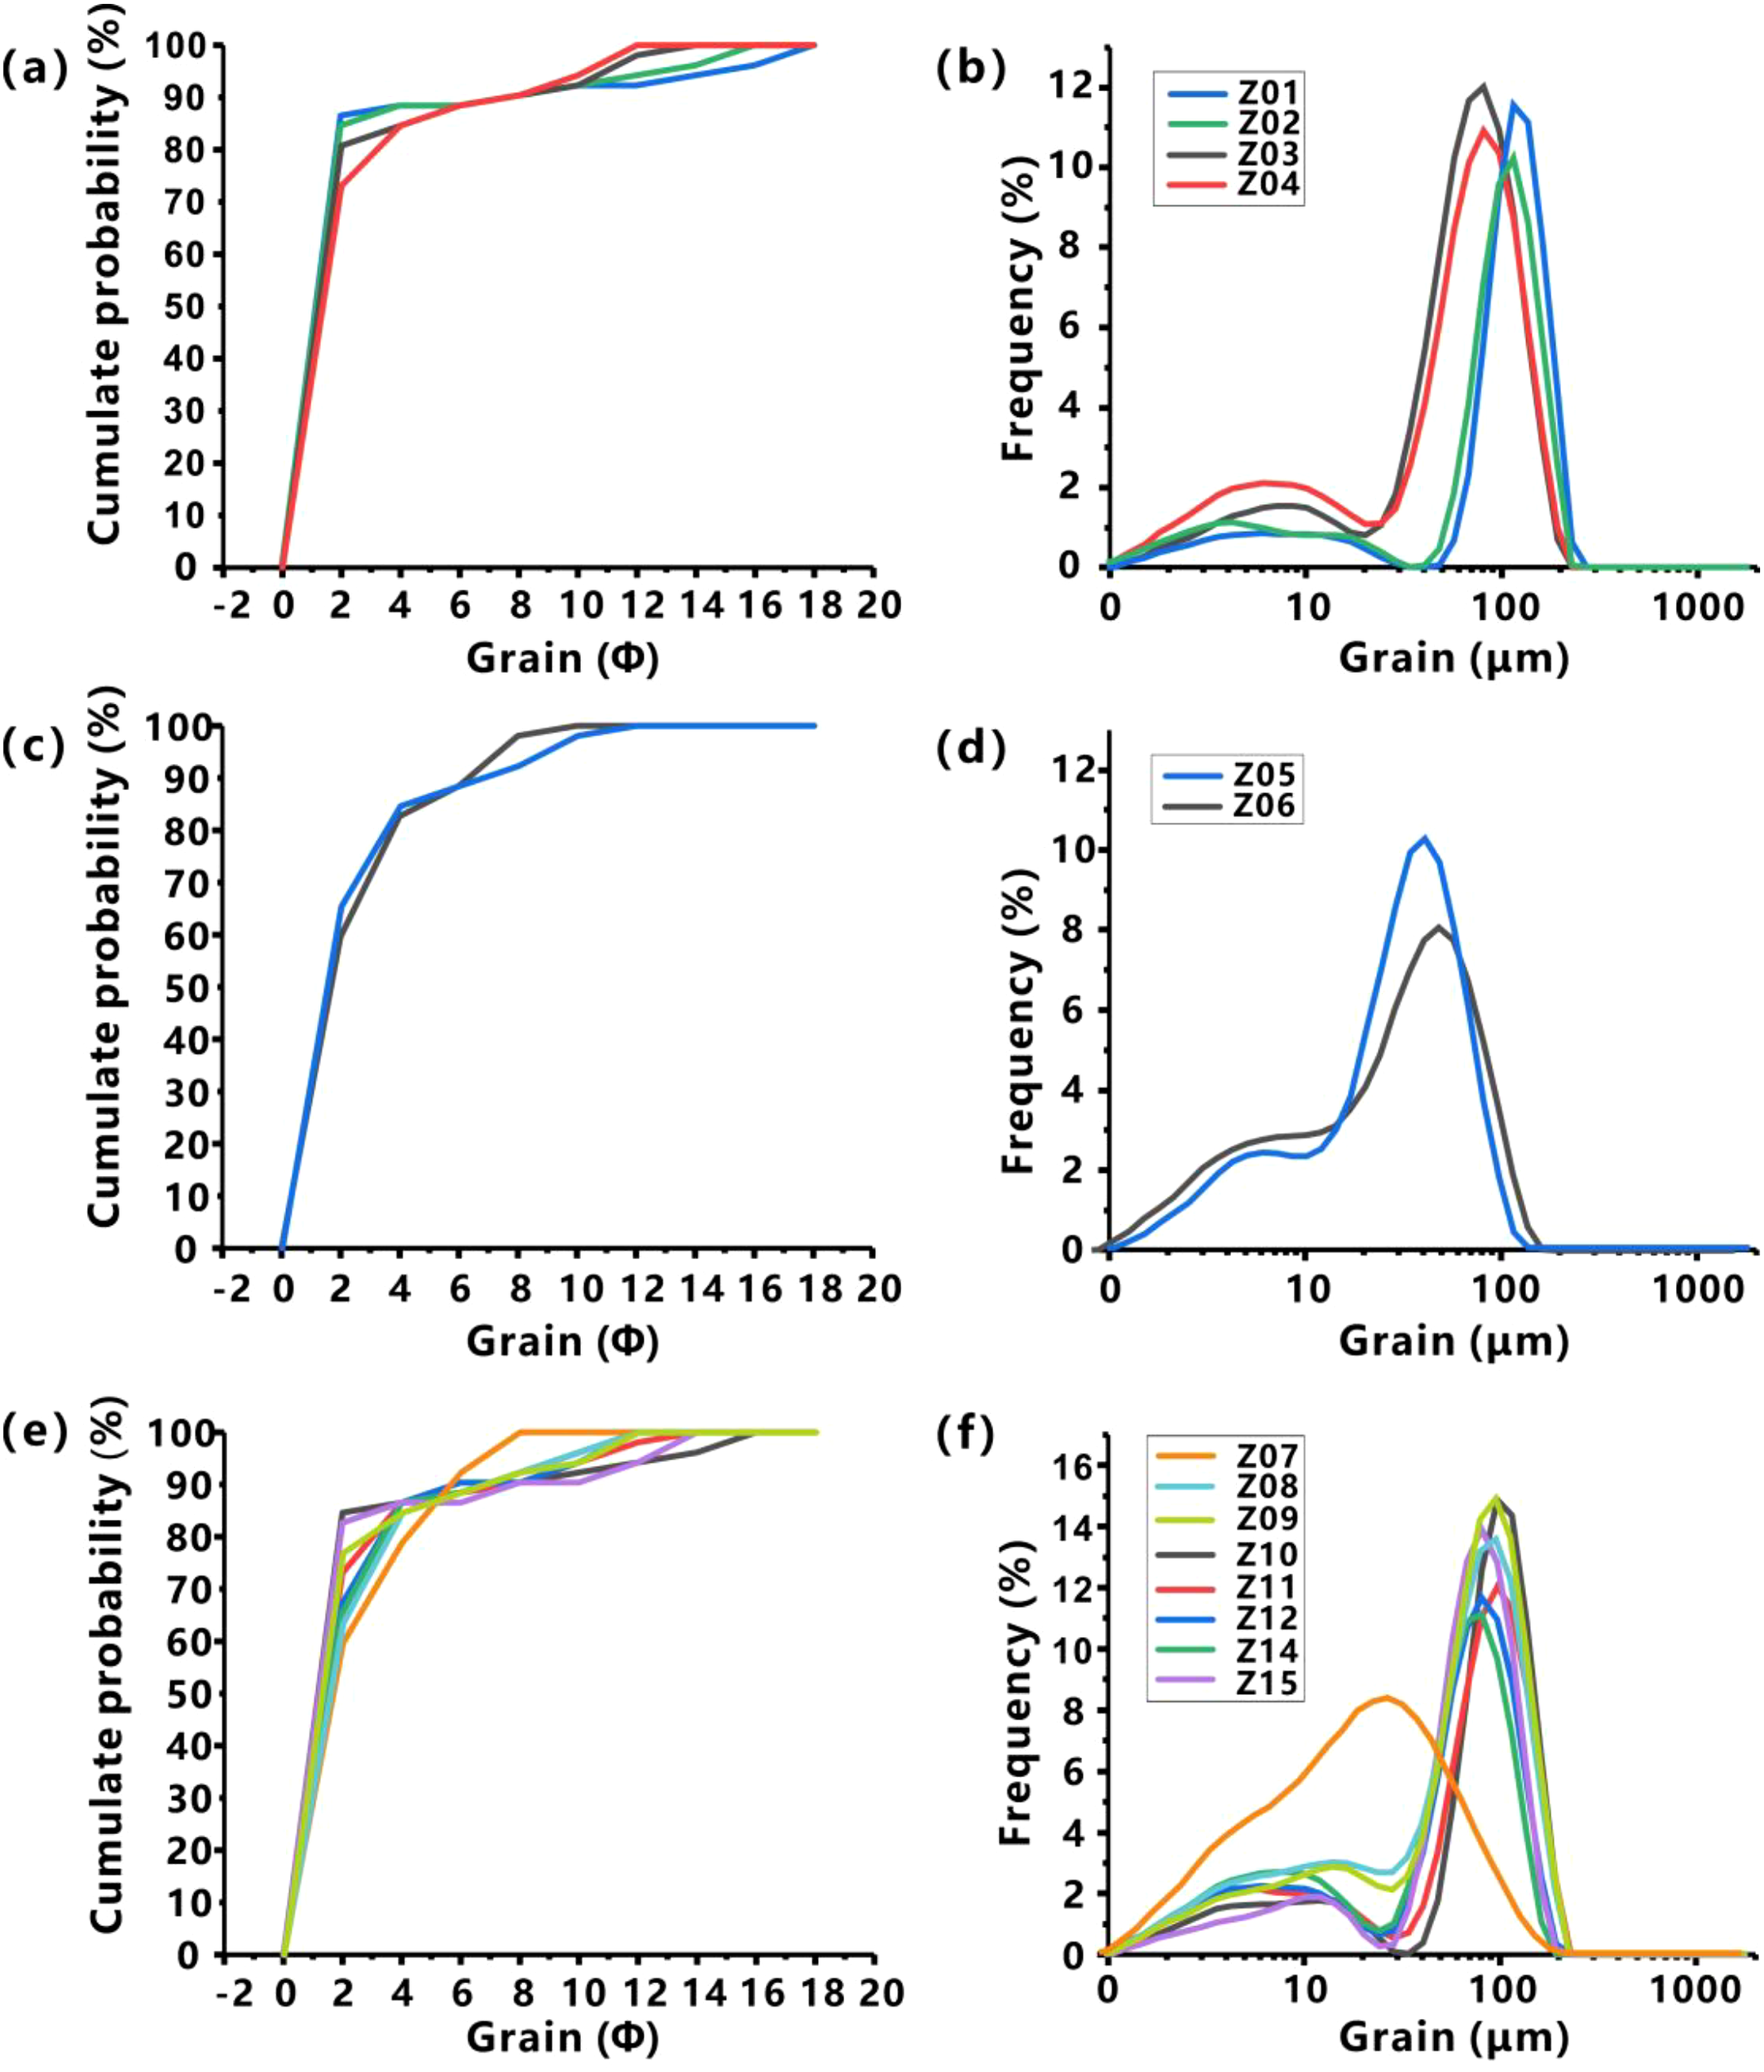
Grain size probability accumulation curves (a, c, e) and frequency distribution curves (b, d, f) of the 14 samples from U2 (a, b), U3 (c, d), and U4 (e, f) for core DZK3. The samples ID are shown in Figure 7. The curves with the same color in each unit derive from the same sample.
The probability accumulation curve of the particle size exhibits four to five segments (Figures 8a, c, e). Based on the different locations of the intercept points, the sediment processes can be classified into three types. Intercept points of 0 – 2φ, 2 – 4φ, and >4φ indicate rolling, saltation, and suspension processes, corresponding to strong, moderate, and low hydrodynamic forces, respectively. The particle size frequency distribution curve follows a bimodal pattern with distinct secondary peaks (Figures 8b, d, f).
The average particle size of U2 sediments is 51.60 μm. The probability accumulation curve shows that rolling, saltation, and suspension account for 71 – 87%, 2 – 11%, and 11 – 15% of the sediment transport processes, respectively (Figure 8a). In the grain size frequency distribution curve (Figure 8b), the main peak falls within 81.00 – 114.50 μm, with a content of 16 – 19%, and the secondary peak appears around 6 – 9 μm, indicating strong hydrodynamic action that gradually weakens from top to bottom. Due to the sediment in U2 consists of gray fine sand and contains a large amount of shell debris, this section is identified as a marine layer.
The average particle size of U3 sediments is 25.45 μm. The probability accumulation curve shows that rolling, saltation, and suspension account for approximately 60 – 65%, 19 – 24%, and 15 – 17% of the sediment transport processes, respectively (Figure 8c). In the frequency distribution curve (Figure 8d), the main peak falls within 40 – 57 μm, with a content of 8 – 11%, and the secondary peak appears at 6 μm, indicating that the hydrodynamic effect of this sedimentary unit is weak. Given its gray-black clay composition and high organic matter content, this section is determined to be lacustrine sediment.
Three representative samples, Z07 (10.35 m), Z08 (10.9 5m), and Z12 (12.70 m), were selected from the upper part of U4. The probability accumulation curve shows that rolling accounts for 59.62%, 63.46%, and 82.69% in the three samples, respectively (Figure 8e). The saltation component contents constitute 19.22%, 21.16%, and 3.85%, while the suspended component contents account for 21.16%, 15.38%, and 13.58%, respectively (Figure 8e). The particle size frequency distribution curve of Z07 exhibits a unimodal pattern, with the main peak at 28.66 μm and a content of 6 – 7% (Figure 8f). Those of other two samples exhibit both bimodal pattern, with the main peak ranging from 81.05 to 96.39 μm (content: 10 – 14%) and the secondary peak at 10.13 μm (Figure 8f). These results indicate a gradual strengthening of the dynamic environment of this unit from top to bottom. Given that the probability accumulation and frequency distribution curves of Z12 are similar to those of Z01 and contain the sedimentary characteristics of shell debris, U4 is identified as a marine layer. In addition, previous studies found that this unit was mainly influenced by marine conditions and may be related to the Huanghua transgression (Yao et al., 2014; Yi et al., 2013). Furthermore, the reddish-brown layer at a depth of 17.4 – 18.9 m can be a marker layer of T2 (Yi et al., 2013).
5 Discussion
5.1 OSL chronology for core DZK3
A chronological framework for core DZK3 was established using OSL samples and a Bacon Bayesian age–depth model based on the Bacon model (Blaauw and Christen, 2011) for the upper 9.6 m (Figure 2b, see Method 3.2). OSL ages range from >100 ka below 10.2 m to 6.2 ± 0.4 ka at 2.60 – 2.70 m. The dating results were generally consistent with the stratigraphic order (Figure 2). The OSL ages in U4 are considered as minimum ages. Sample DZK3-G07 at 10.25 m yielded an age >100 ka, while the De values of DZK3-G08 and deeper samples exceeded 250 Gy, indicating ages of at least 100 ka. Based on lithology (see Section 2), grain size results, and the chronological framework, U4 is interpreted as a transgressive environment, likely developed during MIS 5 or earlier. A long hiatus exists between U4 and U3 with an age gap between >100 ka and 19.8 ka. In U3 (8.40 – 9.60 m), OSL dating of samples DZK3-G06 and DZK3-G05 yielded ages of 19.8 ± 1.2 ka and 10.4 ± 0.6 ka, respectively. The lithology of U3 consists mainly of dark-gray organic-rich clay, indicative of a lacustrine environment. Limnetic layers, which were widely developed in the Laizhou Bay during the early Holocene, are regarded as marker layers at the lower boundary of the Holocene (Yuan et al., 2024; Tian et al., 2016; Xu et al., 2018). The chronology of DZK3 shows that the lake developed earlier than the limnetic layers observed in other cores around the area (Tian et al., 2016; Xu et al., 2018), which is closely related to the regional geomorphology (see Section 5.3). OSL ages from U2 (8.4 – 1.6 m) span from 6.2 to 10.5 ka, indicating that transgressive deposition began at approximately 10 ka. The upper 1.6 m consists of fluvial deposits, but OSL samples were not collected for this section.
The sedimentation rates for U3 and U2 were estimated using the Bayesian age–depth model. During the deglaciation period (U3), the sedimentation rate was approximately 0.12 m/ka. However, this rate increased significantly (approximately 1.5 m/ka) during the Holocene transgression. The differential sedimentation rates since deglaciation are attributed to differences in geomorphology and climatic influence.
5.2 Sedimentary hiatus
The hiatus spanning >100 ka to 19.8 ka in core DZK3 likely resulted from weakened sedimentation caused by strong weathering and enhanced downcutting erosion of rivers under dry and cold climatic conditions. Such hiatuses generally exist in coastal plains or delta areas. Previous studies have identified five sedimentary hiatuses along the coastal plain of the western Bohai Sea since the Late Quaternary, all related to cold climates. These hiatus ages are estimated as 4 – 5.5 ka, 10 – 25 ka, 25 – 29 ka, 29 – 68.5 ka, and 80 – 140 ka, respectively (Li et al., 2004). Two ages of 35.1 ± 5.3 ka (OSL, depth at 16.9 m) and 8.5 ± 0.1 ka (14C, depth at 16.7 m), obtained for core BT113 on the west coast of Bohai Bay, suggest a long depositional hiatus caused by surface exposure and desertification during MIS 3 to LGM period, when sea levels continuously decreased (Chen et al., 2012).
Based on the study of Li et al. (2004), the depositional discontinuity observed in this study (>100 to 19.8 ka) corresponds to the second, third, and fourth sedimentary hiatuses, dating to MIS 2 – 4. Paleontological studies further indicate that this hiatus occurred in a cold and dry climate, during which sea levels dropped to -120 to -80 m, causing the base level of erosion to decline and limiting sedimentation (Li et al., 2004). The hiatus may also be due to the enhancement of river downcutting caused by sea level decline. Deep river valleys commonly formed in the lower reaches of rivers and estuaries in low sea-level stages, especially during the LGM (Xu et al., 2019; Lai et al., 2025). Similar depositional discontinuities have been observed in other cores along the southern coast of the Bohai Sea. The astronomical chronology of core Lz908 indicates two slow deposits at a rate of approximately 0.02 – 0.05 m/ka, which are regarded as possible discontinuities at 16.6 m (34 ka) and 28.2 m (100 ka), corresponding to the end and beginning of T2 (Yi et al., 2012) and belonging to MIS 3 and MIS 5, respectively. A comparable depositional discontinuity, dating to 37 – 71 ka, was observed in core DZK01 between 11.85 m and 12.65 m (Yuan et al., 2024).
Similar cases of depositional discontinuities during MIS 2 – 4 have been widely reported in delta areas (Xu et al., 2022; Yim et al., 2008). For example, recent studies have found that little or no deposition occurred during ca. 38 – 14 ka in the Yangtze Delta (Gao et al., 2022; Liu et al., 2022). In the Pearl River Delta, a depositional discontinuity of 70–8 ka was identified in core P5 – 4 at 26.35 – 26.75 m (Lin et al., 2023). Additionally, core SXG06 shows discontinuous deposition between 10.55 m and 11.5 m, with an age range of117–35 ka, and the first continental layer (12.5 – 10.5 m) consists of a thin 2 m deposit, indicating weak deposition (Lin et al., 2024).
5.3 Lacustrine strata
Coastal limnetic and lagoon sediments of the Heituhu Formation are widely developed along the southern coast of Bohai Sea, with ages ranging from 3210 ± 190 to 11785 ± 160 a BP (Wang et al., 1999). These sediments were underlain by floodplain sediments of the LGM and overlain by mid-late Holocene transgression deposits (Xu et al., 2018). Marker layers of the Heituhu Formation, found at the bottom of the Holocene layer, are commonly observed in cores (Figure 9). For instance, The dark-gray organic-rich layer at 10.2 – 10.8 m in core LZ908 yielded a 14C age of 8.2 ± 0.05 cal ka BP (10.2 m) and an OSL age of 9.7 ± 0.8 ka (10.7 m) (Yi et al., 2012). The same layer in core BH1 has ages of 9.7 ± 0.8 ka (OSL) and 5.5 ± 0.07 cal ka BP (14C), and in core BH2, the ages are 5.2 ± 0.08 cal ka BP (14C) and 9.7 ± 0.8 ka (OSL) (Yi et al., 2013). These results indicate that the limnetic facies in the coastal region were early Holocene sediments. Regarding the evolution of lakes along the southern coast of the Bohai Sea, previous studies have focused on lakes in nearby regions that formed during the historical period (Guo, 1990; Zhang et al., 2004). Many of these lakes, such as Judian Lake and Biehua Lake, evolved from lagoons after transgression at 6 ka (Guo, 1990; Han et al., 2002; Zhang et al., 2003).
Figure 9
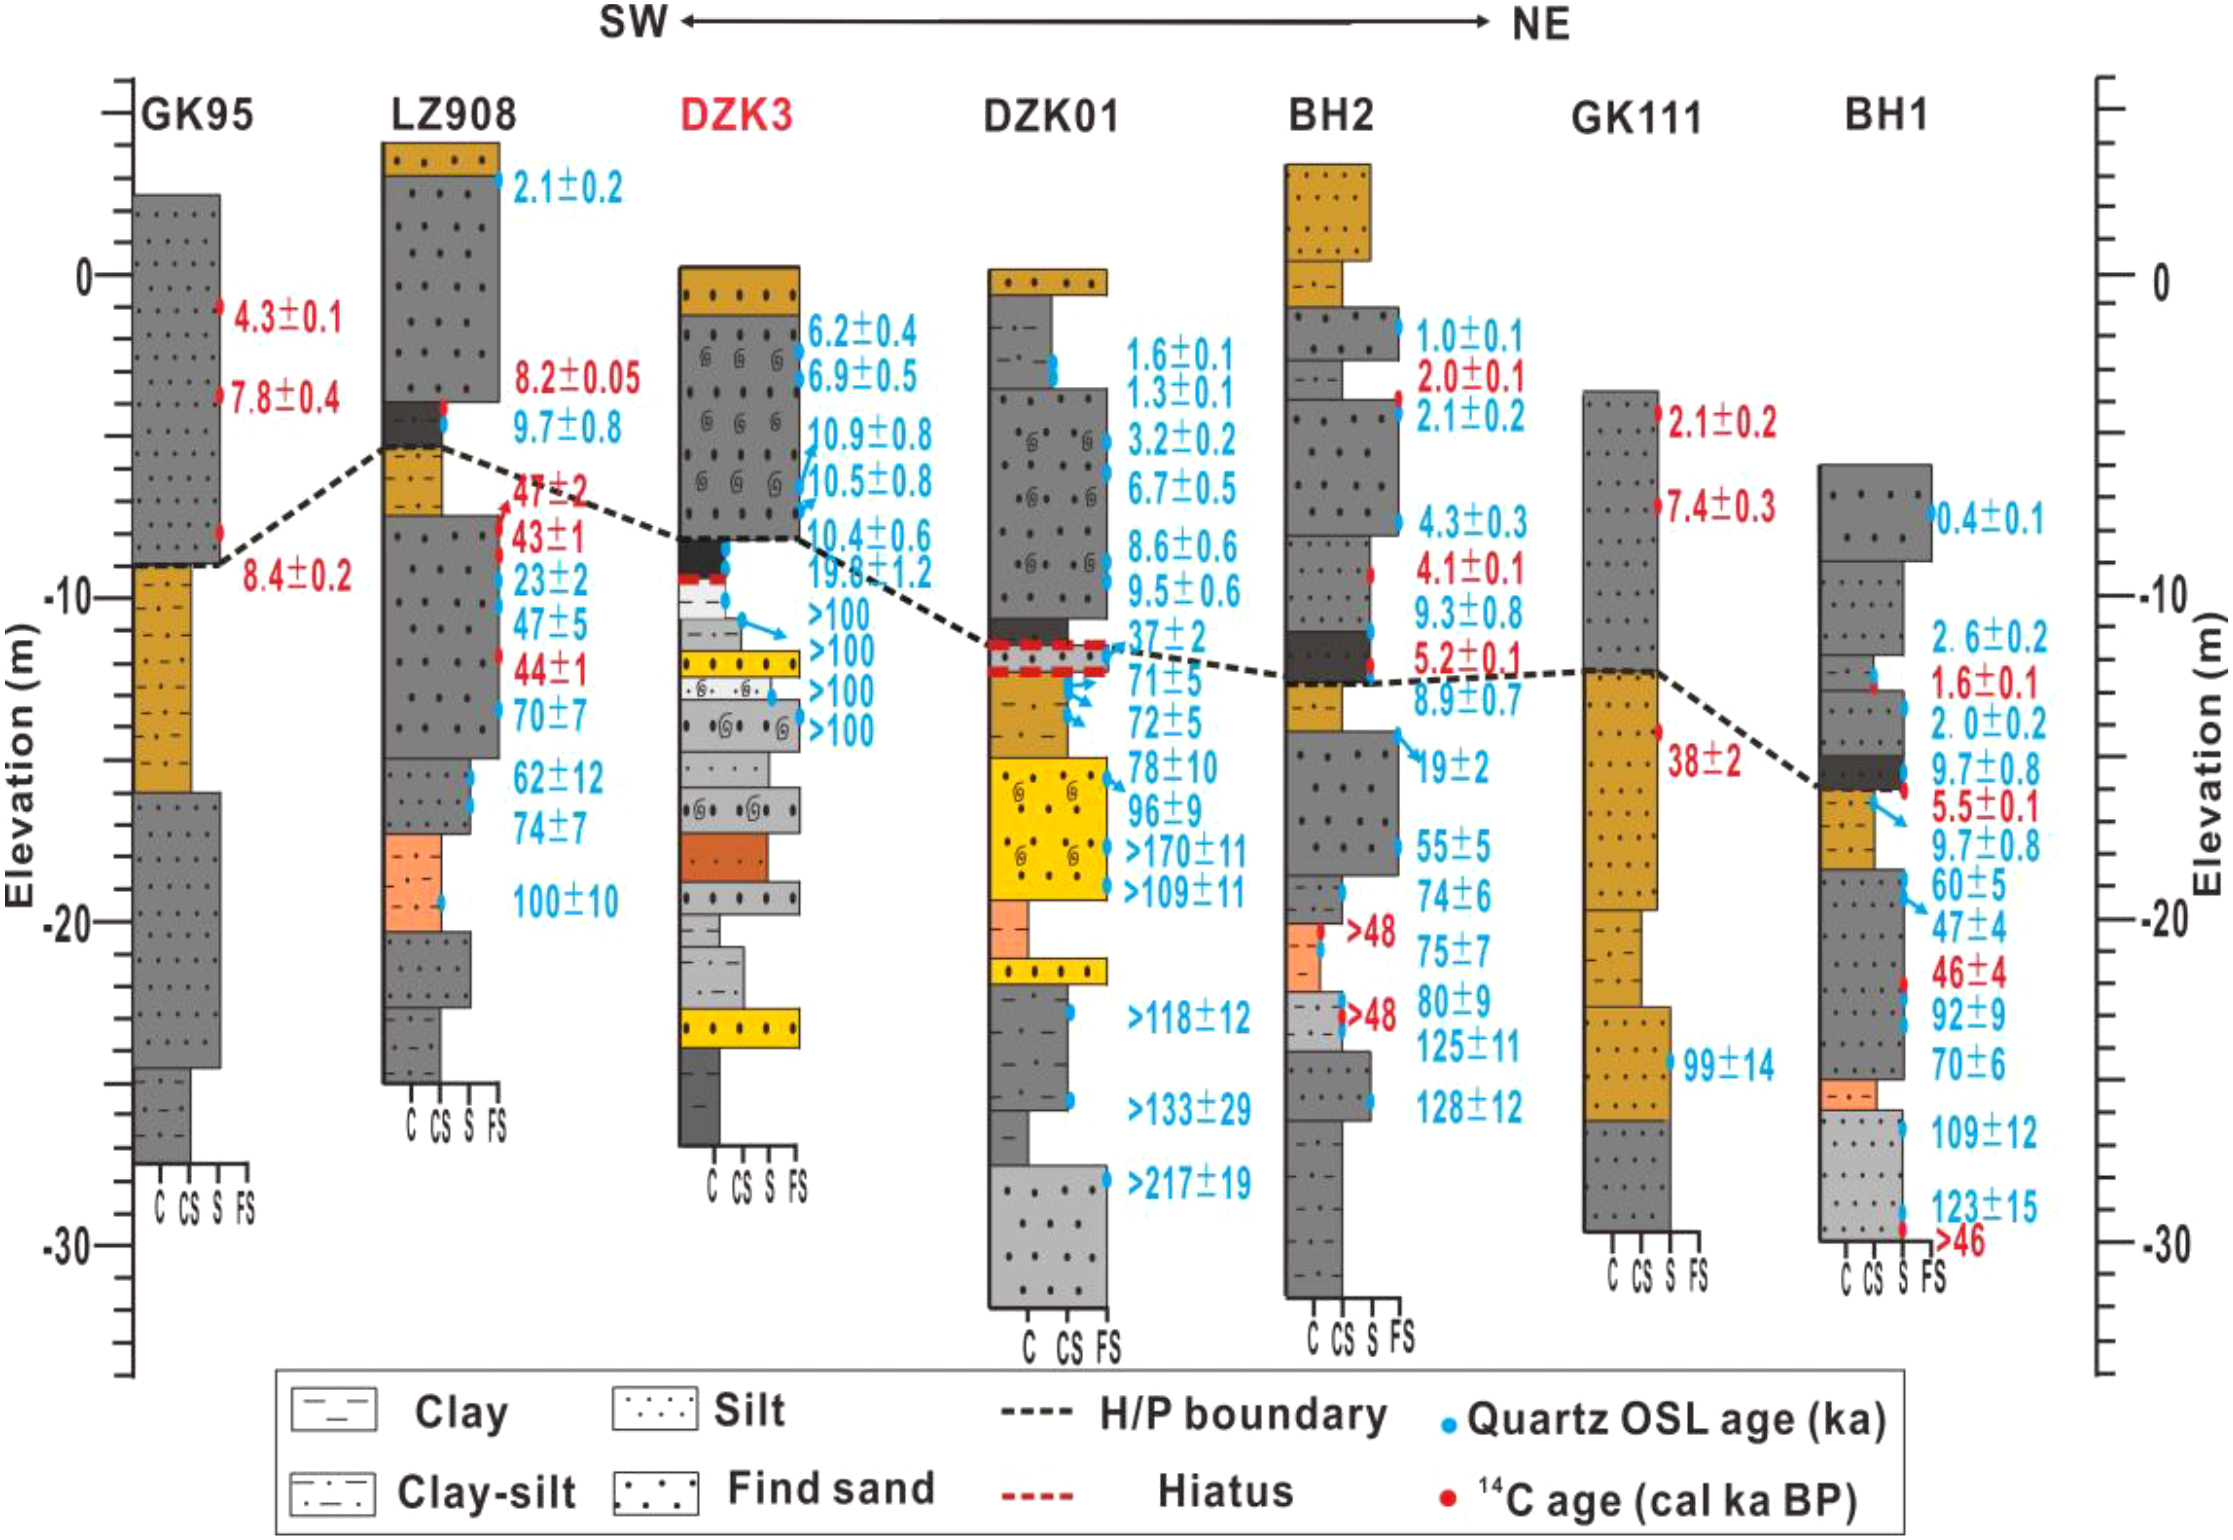
Regional stratigraphic correlation in the southern coast of Bohai Sea, including detailed information about the lithology and dating results. Locations and data sources of the sediment cores are indicated in Figure 1b. In the legend, ‘H/P boundary’ refers to the Holocene/Pleistocene boundary.
The lacustrine layer (U3, 8.4 – 9.6 m) in core DZK3 was dated to 19.8 – 10.5 ka, which is significantly older than the limnetic and lagoon layers in other cores. Additionally, there is a hiatus spanning >100–19.8 ka between the lacustrine position and the underlying layer, where there are no floodplain sediments from the LGM. This indicates that the development of this lacustrine facies layer differs from that reported in previous studies (Xu et al., 2018). Additionally, according to a 10,000-year scale climate and geomorphology model, lake development generally occurred in interfluvial depressions after the river valleys were filled (Xu et al., 2019). This time was estimated to be approximately 12 ka by geomorphological studies of the lower Yellow River plain (Wang et al., 1999; Zhao et al., 2023). Specifically, the lacustrine facies layer developed on top of the paleochannel during the Late Pleistocene to Early Holocene in north of the Luzhong Mountains (Tian et al., 2025). The 14C ages of these lacustrine layers are 9165 ± 120 a BP, 9515 ± 125 a BP, and 9650 ± 190 a BP, which are consistent with the formation age of the Heituhu Formation (Zhang, 1990; Zhang et al., 2004). However, the lacustrine facies of DZK3 in this study are not consistent with the two cases mentioned above. Therefore, their formation may be attributed to a small water storage depression and shaped by the evolution of local microtopography.
5.4 Holocene sedimentary sequence around the southern coast of the Bohai Sea
As shown in Figure 9, the Holocene stratum around the southern coast of the Bohai Sea exhibit three distinct characteristics: (1) The base of the Holocene strata is located at approximately -10 m, and the depth increases from land to sea (e.g., GK95, - 8.9 m; DZK3, - 8.4 m; DZK01, - 11.8 m; BH2, - 13 m; GK111, - 12.5 m; BH1, - 16 m); (2) The onset of Holocene deposition generally dated to approximately 9 – 10 ka (e.g., LZ908, 9.7 ± 0.8 ka; DZK3, 10.5 ± 0.8 ka; DZK01, 9.5 ± 0.6 ka; BH2, 8.9 ± 0.7 ka; BH1, 9.7 ± 0.8 ka); (3) A dark-gray, organic-rich layer (limnetic facies, Heituhu Formation) can be used as a marker for the base of the Holocene (e.g., LZ908, BH1, BH2, and DZK01) (Xu et al., 2018; Yi et al., 2013; Yuan et al., 2024).
5.5 Transgression chronology for T1 and T2
Since the Late Pleistocene, three large-scale transgressions (from top to bottom: T1, T2, and T3) have occurred along the coast of the Bohai Sea due to sea-level fluctuations. The extents of these transgressions are shown in Figure 1b (Wang et al., 1986; Yi et al., 2013; Liu, 2017; Li et al., 2019; Yuan et al., 2024). On the southern coast of the Bohai Sea, T2 has the largest range, followed by T1, and T3 has the smallest range (Yuan et al., 2024).
The earlier dating framework for the transgression layers along the coast of the Bohai Sea was primarily based on 14C method, with the three transgressions (T1, T2, and T3) occurring in MIS 1, 3, and 5, respectively (Wang et al., 1986; Zhao, 1986). The age of T1 is well established. However, because of the impact of the dating cap (Lai and Fan, 2014; Song et al., 2015) and contamination by younger carbon (Yim et al., 1990), the 14C age of T2 should be treated with caution (Zhang, 2021; Long et al., 2022). Although the theoretical upper limit can reach 50 ka, 14C ages beyond 30 – 40 ka often lead to inaccurate results (Lai and Fan, 2014; Song et al., 2015; Long et al., 2022). Additionally, 14C ages for pre-Holocene sediments may have been underestimated due to the pollution of new carbon (Yim et al., 1990). As shown in Figure 9, for core BH1, the OSL ages of T2 are 92 ± 9 ka and 123 ± 15 ka, whereas the adjacent 14C ages are 46 ± 4 cal ka BP and >46 cal ka BP. In addition, 14C-based age models suggest that the distribution extent of the MIS 3 transgression is wider than that of the MIS 5 transgression along the Bohai Sea Coast, which is not consistent with the global sea–level change pattern (Yi et al., 2013; Long et al., 2022). Therefore, the formation time of T2 in the Bohai Sea likely corresponds to MIS 5 or earlier than MIS 3, as previously reported (Long et al., 2022).
On the southern coast of the Bohai Sea, studies using OSL dating also suggest that T2 formed earlier than MIS 3. As shown in Figure 9, Yi et al. (2013) proposed that T2 on the southern coast of the Bohai Sea developed during MIS 3 – 5 based on 14C and OSL dating (e.g., cores LZ908, BH1, and BH2). Meanwhile, Liu (2017) suggested T2 corresponded to MIS 5 (core GK111, >99 ± 14 ka). For core DZK3, the OSL ages of samples DZK3-G06 and DZK3-G07 are 19.8 ± 1.2 ka and >100 ka, respectively, and there is a sedimentary hiatus between U3 and U4. Therefore, we suggest that no transgression sediments were deposited in the study area during MIS 3, which is similar to the dating results of core DZK01 (Yuan et al., 2024).
Based on the OSL dating results of core DZK01 and DZK3, T2 occurred at least in MIS 5e (115 – 130 ka), and there were no marine sediments in MIS 5a-d (71 – 115 ka). There are two reasons for this phenomenon: One possibility is that marine sediments have been eroded, but there is still a fluvial unit of MIS 4 – 2 in core DZK01, so it is unlikely; The second reason is that T2 in the southern coastal Bohai Sea only occurred in MIS 5e. However, owing to the saturation of quartz OSL ages and a lack of foraminifera identification, especially in the strata above the reddish-brown silt layer of U4, further investigation is required.
6 Conclusions
Using the quartz OSL dating method, we established the chronostratigraphy of core DZK3 from the southern coastal Bohai Sea, with ages ranging from >100 ka to 6.2 ± 0.4 ka. Additionally, we reconstructed the sedimentary evolution of the region from the LGM to the Holocene.
According to the OSL dating results, grain size analysis, and lithologic characteristics, the Holocene sediments in core DZK3 were deposited since 10.5 ± 0.8 ka at a depth of 8.4 m. A sedimentary hiatus was detected with an age gap of >100–19.8 ka. The lacustrine layer (8.4 – 9.6 m) in core DZK3 was dated to 19.8 – 10.5 ka, which is significantly older than the limnetic and lagoon layers in other cores. A comparison with published data indicates that the onset ages of the Holocene deposition are approximately 9 – 10 ka around the southern coast of the Bohai Sea, at a depth of approximately 10 m. In addition, according to the sedimentary facies and dating results, no transgressive sediments were observed during MIS 3 in the study area, and T2 in the southern coastal Bohai Sea only occurred in MIS 5e.
Statements
Data availability statement
The original contributions presented in the study are included in the article/supplementary material. Further inquiries can be directed to the corresponding author.
Author contributions
ZX: Investigation, Resources, Writing – review & editing. YH: Investigation, Resources, Writing – review & editing. BY: Writing – original draft, Investigation, Resources. ML: Investigation, Resources, Writing – review & editing. RJ: Data curation, Methodology, Writing – original draft. RT: Data curation, Writing – original draft, Methodology. BL: Data curation, Writing – review & editing, Methodology. ZZ: Resources, Investigation, Writing – review & editing. WY: Writing – original draft, Writing – review & editing, Conceptualization, Investigation, Resources, Data curation, Methodology, Funding acquisition. ZL: Writing – original draft, Writing – review & editing, Conceptualization, Supervision, Resources, Data curation, Methodology.
Funding
The author(s) declare financial support was received for the research and/or publication of this article. This research was supported by Key Laboratory of Coastal Zone Geological Environment Protection, Shandong Geology and Mineral Exploration and Mineral Exploration and Development Bureau (SYS202105), NSFC (42372213), project of the “Young Innovative Team Plan” of Shandong Province’s Colleges and Universities (2024KJH153), and Weifang Science and Technology Development Plan Soft Science Project (2024RKX059).
Acknowledgments
We thank Yantian Xu for help during field sampling, and Yuan Xu, Yunyi Fan for lab measurements. We also thank Zixuan Zhang (China University of Geosciences, Wuhan) for his assistance in OSL decay curve decomposition.
Conflict of interest
The authors declare that the research was conducted in the absence of any commercial or financial relationships that could be construed as a potential conflict of interest.
Generative AI statement
The author(s) declare that no Generative AI was used in the creation of this manuscript.
Any alternative text (alt text) provided alongside figures in this article has been generated by Frontiers with the support of artificial intelligence and reasonable efforts have been made to ensure accuracy, including review by the authors wherever possible. If you identify any issues, please contact us.
Publisher’s note
All claims expressed in this article are solely those of the authors and do not necessarily represent those of their affiliated organizations, or those of the publisher, the editors and the reviewers. Any product that may be evaluated in this article, or claim that may be made by its manufacturer, is not guaranteed or endorsed by the publisher.
References
1
Blaauw M. Christen J. (2011). Flexible paleoclimate age-depth models using an autoregressive gamma process. Bayesian Anal.6, 457–474. doi: 10.1214/ba/1339616472
2
Brennan B. J. Lyons R. G. Phillips S. W. (1991). Attenuation of alpha particle track dose for spherical grains. Int. J. Radiat. Appl. Instrum. Part D: Nucl. Tracks Radiat. Meas.18, 249–253. doi: 10.1016/1359-0189(91)90119-3
3
Chen Y. S. Wang H. Li J. F. Pei Y. D. Tian L. Z. Shang Z. W. (2012). Sedimentary environment since 35 ka and terrestrial-marine interaction revealed by borehole BT113 in the western coast of Bohai Bay, China. J. Jilin Univ. (Earth Sci. Edition)42, 344–353.
4
Dietze M. Kreutzer S. Burow C. Fuchs M. C. Fischer M. Schmidt C. (2016). The abanico plot: visualizing chronometric data with individual standard errors. Quat. Geochronol.31, 12–18. doi: 10.1016/j.quageo.2015.09.003
5
Duller G. A. T. (2003). Distinguishing quartz and feldspar in single grain luminescence measurements. Radiat. Meas.37, 161–165. doi: 10.1016/S1350-4487(02)00170-1
6
Durcan J. A. King G. E. Duller G. A. T. (2015). DRAC: dose rate and age calculator for trapped charge dating. Quat. Geochronol.28, 54–61. doi: 10.1016/j.quageo.2015.03.012
7
Galbraith R. F. Roberts R. G. Laslett G. M. Yoshida H. Olley J. M. (1999). Optical dating of single and multiple grains of quartz from Jinmium rock shelter, northern Australia: Part I, experimental design and statistical models. Archaeometry41, 339–364. doi: 10.1111/j.1475-4754.1999.tb00987.x
8
Gao M. S. Guo F. Hou G. H. Qiu J. D. Kong X. H. Liu S. et al . (2018). The evolution of sedimentary environment since late Pleistocene in Laizhou Bay, Bohai. Geology China45, 59–68.
9
Gao L. Long H. Hou Y. D. Feng Y. Y. (2022). Chronology constraints on the complex sedimentary stratigraphy of the paleo-Yangtze incised valley in China. Quaternary Sci. Rev.287, 107573. doi: 10.1016/j.quascirev.2022.107573
10
Gao L. Long H. Tamura T. Hou Y. D. Shen J. (2021). A ~130 ka terrestrial-marine interaction sedimentary history of the northern Jiangsu coastal plain in China. Mar. Geol.435, 106455. doi: 10.1016/j.margeo.2021.106455
11
Guérin G. Mercier N. Nathan R. Adamiec G. Lefrais Y. (2012). On the use of the infinite matrix assumption and associated concepts: A critical review. Radiat. Meas.47, 778–785. doi: 10.1016/j.radmeas.2012.04.004
12
Guo Y. S. (1990). On historical change of lakes in Shandong Province. Trans. Oceanology Limnology3, 15–22. doi: 10.13984/j.cnki.cn37-1141.1990.03.003
13
Han M. Zhang W. M. Li Y. H. Zhang L. N. (2002). Formation and change of ancient lake on south coast plain of Laizhou Bay. Scientia Geographica Sin.22, 430–435.
14
Lai Z. P. (2006). Testing the use of an OSL standardised growth curve (SGC) for De determination on quartz from the Chinese Loess Plateau. Radiat. Meas.41, 9–16. doi: 10.1016/j.radmeas.2005.06.031
15
Lai Z. P. Brückner H. Zöller L. Fülling A. (2007). Existence of a common growth curve for silt-sized quartz OSL of loess from different continents. Radiat. Meas.42, 1432–1440. doi: 10.1016/j.radmeas.2007.08.006
16
Lai Z. P. Fan A. C. (2014). Examining quartz OSL age underestimation for loess samples from Luochuan in the Chinese Loess Plateau. Geochronometria41, 57–64. doi: 10.2478/s13386-013-0138-1
17
Lai Z. P. Liu Y. X. Wu Z. Y. Xu Y. T. Fang Z. B. Montgomery D. R. (2025). Headward incision of large rivers in response to glacial sea-level fall. Sci. Adv11, eadr5446. doi: 10.1126/sciadv.adr5446
18
Lai Z. P. Ou X. J. (2013). Basic procedures of optically stimulated luminescence (OSL) dating. Prog. Geogr.32, 683–693.
19
Li Y. Tsukamoto S. Shang Z. W. Tamura T. (2019). Constraining the transgression history in the Bohai Coast China Since the middle Pleistocene by luminescence dating. Mar. Geol.416, 105980. doi: 10.1016/j.margeo.2019.105980
20
Li F. L. Wang H. Yan Y. Z. Zhang J. Q. Zhao C. R. Zhang Y. F. et al . (2004). The significance of the depositional hiatuses on the coastal plain of west Bohai Bay since the late Quaternary period. Geological Survey Res.27, 177–182.
21
Lin P. H. Hu X. Zhan W. Q. Chen Y. C. Ling K. Zhi B. F. et al . (2024). Luminescence and radiocarbon dating of core SXG06 from the Pearl River plain and implications for delta process. Quaternary Geochronology82, 101541. doi: 10.1016/j.quageo.2024.101541
22
Lin P. H. Song Y. J. Zhan W. Q. Tian R. N. Wang Z. B. Xu X. L. et al . (2023). Late Pleistocene to Holocene sedimentary history in the Pearl River Delta revealed by OSL and radiocarbon dating. Catena224, 106972. doi: 10.1016/j.catena.2023.106972
23
Liu Q. (2017). Study of ostracod characteristics and evolution of transgression of the late Quaternary in the Laizhou Lay, Bohai Sea. Shandong University of Science and Technology, Qindao, China.
24
Liu R. X. Nian X. M. Zhang W. G. Qiu F. Y. Wang Z. H. Lin Q. L. et al . (2022). Luminescence dating of the late Quaternary sediments in Hangzhou Bay, China. Quaternary Geochronology70, 101302. doi: 10.1016/j.quageo.2022.101302
25
Liu J. Saito Y. Wang H. Zhou L. Y. Yang Z. G. (2009). Stratigraphic development during the late Pleistocene and Holocene offshore of the Yellow River Delta, Bohai Sea. J. Asian Earth Sci.36, 318–331. doi: 10.1016/j.jseaes.2009.06.007
26
Long Z. R. Wang Z. B. Tu H. Li R. H. Wen Z. H. Wang Y. X. et al . (2022). OSL and radiocarbon dating of a core from the Bohai Sea in China and implication for Late Quaternary transgression pattern. Quat. Geochronol.70, 101308. doi: 10.1016/j.quageo.2022.101308
27
Lu H. Y. An Z. S. (1997). Experimental study on the influence of pretreatment methods on the particle size measurement of Loess sediments. Chin. Sci. Bull.42, 2535–2538.
28
Mahan S. A. Rittenour T. M. Nelson M. S. Ataee N. Brown N. DeWitt R. et al (2023). Guide for interpreting and reporting luminescence dating results. Bulletin. 135, 1480–1502. doi: 10.1130/B36404.1
29
Murray A. Arnold L. J. Buylaert J.-P. Guérin G. Qin J. Singhvi A. K. et al . (2021). Optically stimulated luminescence dating using quartz. Nat. Rev. Methods Primers1, 72. doi: 10.1038/s43586-021-00068-5
30
Murray A. S. Roberts R. G. (1998). Measurement of the equivalent dose in quartz using a regenerative-dose single-aliquot protocol. Radiat. Measurements29, 503–515. doi: 10.1016/S1350-4487(98)00044-4
31
Murray A. S. Wintle A. G. (2000). Luminescence dating of quartz using an improved single-aliquot regenerative-dose protocol. Radiat. Meas.32, 57–73. doi: 10.1016/S1350-4487(99)00253-X
32
Murray A. S. Wintle A. G. (2003). The single aliquot regenerative dose protocol: Potential for improvements in reliability. Radiat. Meas.37, 377–381. doi: 10.1016/S1350-4487(03)00053-2
33
Nian X. M. Zhang W. G. Wang Z. H. Sun Q. L. Chen Z. Y. (2018). Optical dating of Holocene sediments from the Yangtze River (Changjiang) Delta, China. Quaternary Int.467, 251–263. doi: 10.1016/j.quaint.2018.01.011
34
Peng J. Dong Z. B. Han F. Q. Long H. Liu X. J. (2013). R package numOSL: numeric routines for optically stimulated luminescence dating. Ancient TL31, 41–48. doi: 10.26034/la.atl.2013.473
35
Peng Z. C. Han Y. Zhang X. Huang B. H. Han Y. S. Meng G. L. et al . (1992). The study of the changes of sedimental environments in the Laizhou Bay area. Geological Rev.38, 360–367.
36
Peng J. Li B. (2017). Single-aliquot regenerative-dose (SAR) and standardised growth curve (SGC) equivalent dose determination in a batch model using the R package ‘numOSL’. Ancient TL35, 32–53. doi: 10.26034/la.atl.2017.516
37
Prescott J. R. Hutton J. T. (1994). Cosmic ray contributions to dose rates for luminescence and ESR dating: large depths and long-term time variations. Radiat. Meas.23, 497–500. doi: 10.1016/1350-4487(94)90086-8
38
Roberts H. M. Duller G. (2004). Standardised growth curves for optical dating of sediment using multiple-grain aliquots. Radiat. Meas.38, 241–252. doi: 10.1016/j.radmeas.2003.10.001
39
Shi X. F. Yao Z. Q. Liu Q. S. Juan Cruz L. Bai Y. Z. Liu Y. G. et al . (2016). Sedimentary architecture of the Bohai Sea China over the last 1 Ma and implications for sea-level changes. Earth Planet. Sc. Lett.451, 10–21. doi: 10.1016/j.epsl.2016.07.002
40
Song Y. Lai Z. Li Y. Chen T. Wang Y. (2015). Comparison between luminescence and radiocarbon dating of late Quaternary loess from the Ili Basin in Central Asia. Quaternary Geochronology30, 405–410. doi: 10.1016/j.quageo.2015.01.012
41
Tian L. Z. Tao Y. B. Jiang X. Y. Chen Y. S. Shi P. X. Shang Z. W. (2016). Reconstruction of the Holocene relative sea level change for the south coast of Laizhou Bay. Geological Bull. China35, 1679–1691.
42
Tian R. N. Yan B. P. He C. G. Yuan W. T. Lin P. H. Song Y. J. et al (2025). Paleolakes in the lower Yellow River plain since the last deglaciation: age, distribution, and mechanism. Catena259, 109315. doi: 10.1016/j.catena.2025.109315
43
Wang Q. Li F. L. Li Y. D. Gao X. L. (1986). Shoreline changes in west-southern coast plain of the Bohai Sea since 150 Ka. In QinY. S.ZhaoS. (eds.) Late Quaternary Sea-Level Changes, China Ocean Press, Beijing, 62–71.
44
Wang S. N. Miao X. D. Hui Z. C. Yong Z. J. Shi T. Y. (2024a). A pollen-based reconstruction of middle to late Holocene precipitation dynamics in Anyang archaeological area, Central Plain, China. Quat. Int.696, 25–37. doi: 10.1016/j.quaint.2024.05.014
45
Wang S. N. Miao X. D. Shi T. Y. (2024b). Flood events in the lower reaches of the Yellow River: OSL and radiocarbon dating on the Anshang site. Quat. Int.694, 13–25. doi: 10.1016/j.radmeas.2005.11.001
46
Wang S. J. Zhang C. J. Liu H. K. Ding M. S. (1999). Advances on the quaternary geological study in Shandong Province. Shandong Land Resour.15, 3–10.
47
Wintle A. G. Murray A. S. (2006). A review of quartz optically stimulated luminescence characteristics and their relevance in single-aliquot regeneration dating protocols. Radiat. Meas.41, 369–391. doi: 10.1016/j.radmeas.2005.11.001
48
Xu Y. T. Lai Z. P. Li C. A. (2019). Sea-level change as the driver for lake formation in theYangtze Plain–A review. Global Planet. Change181, 102980. doi: 10.1016/j.gloplacha.2019.102980
49
Xu J. G. Xu H. Zhang T. Zhang Z. Qi X. F. Ji W. L. (2018). Stratigraphic characteristics, age and indicated Holocene coastal variation of Heituhu Formation in Laizhou Bay coastal area, Shandong Peninsula. Acta Geoscientica Sin.39, 133–143.
50
Xu X. L. Zhong J. M. Huang X. M. Li H. W. Ding Z. J. Lai Z. P. (2022). Age comparison by luminescence using quartz and feldspar on core HPQK01 from the Pearl River Delta in China. Quat. Geochronol.71, 101320. doi: 10.1016/j.quageo.2022.101320
51
Xue C. T. Ding D. (2008). Weihe River-Mihe River Delta in south coast of Bohai Sea, China: Sedimentary sequence and architecture. Sci. Geographica Sin.28, 672–676.
52
Yao Z. Q. Guo Z. T. Xiao G. Q. Wang Q. Shi X. F. Wang X. Y. (2012). Sedimentary history of the western Bohai Coastal Plain since the late Pliocene: implications on tectonic, climatic and sea-level changes. J. Asian Earth Sci.54-55, 192–202. doi: 10.1016/j.jseaes.2012.04.013
53
Yao Z. Q. Xiao G. Q. Wu H. B. Liu W. G. Chen Y. K. (2010). Plio-Pleistocene vegetation changes in the North China Plain: magnetostratigraphy, oxygen and carbon isotopic composition of pedogenic carbonates. Palaeogeography Palaeoclimatology Palaeoecol.297, 502–510. doi: 10.1016/j.palaeo.2010.09.003
54
Yao J. Yu H. J. Xu X. Y. Yi L. Chen G. Q. Su Q. (2014). Paleoenvironmental changes during the late Quaternary as inferred from foraminifera assemblages in Laizhou Bay. Acta Oceanol. Sin.33, 10–18. doi: 10.1007/s13131-014-0536-0
55
Yi L. Lai Z. P. Yu H. J. Xu X. Y. Su Q. Yao J. et al . (2013). Chronologies of sedimentary changes in the south Bohai Sea, China: constraints from luminescence and radiocarbon dating. Boreas42, 184–267. doi: 10.1111/j.1502-3885.2012.00271.x
56
Yi L. Yu H. J. Ortiz J. D. Xu X. Y. Chen S. L. Ge J. Y. et al . (2012). Late Quaternary linkage of sedimentary records to three astronomical rhythms and the Asian monsoon, inferred from a coastal borehole in the south Bohai Sea. Palaeogeography Palaeoclimatology Palaeoecol.2012, 101–117. doi: 10.1016/j.palaeo.2012.02.020
57
Yim W. W.-S. Hilgers A. Huang G. Radtke U. (2008). Stratigraphy and optically stimulated luminescence dating of subaerially exposed Quaternary deposits from two shallow bays in Hong Kong, China. Quaternary Int.183, 23–39. doi: 10.1016/j.quaint.2007.07.004
58
Yim W. W.-S. Ivanovich M. Yu K.-F. (1990). Young age bias of radiocarbon dates in pre- Holocene marine deposits of Hong Kong and implications for Pleistocene stratigraphy. Geo-Mar. Lett.10, 165–172. doi: 10.1007/BF02085932
59
Yuan W. T. Jiang L. F. Jiang R. L. Tian R. N. Ding Z. J. Lai Z. P. (2024). Chronology of core sediments from the south coastal Bohai Sea of eastern Asia and its implications for sedimentary history. Quaternary Geochronology82, 101539. doi: 10.1016/j.quageo.2024.101539
60
Yuan W. T. Liu B. H. Wu Z. Y. Wang Y. K. Sun Z. B. Zhou X. J. et al . (2025). Luminescence dating of core sediments from Jining of Shandong Province in the lower Yellow River Plain and its geomorphological implications. Palaeogeography Palaeoclimatology Palaeoecol.675, 113042. doi: 10.1016/j.palaeo.2025.113042
61
Zhang Z. L. (1990). A preliminary study of the Yellow River’s paleo channels in North Shandong Plain. Acta Geographica Sin.45, 457–466.
62
Zhang X. (2021). Chronology and Sedimentary Environment Change in the Coastal-Shelf Areas of Eastern China since 200 Ka. China University of Geosciences, Wuhan, China.
63
Zhang W. Y. Han M. Li Y. H. (2003). A preliminary study on the extinction causes of the ancient lakes in the southern plain of Laizhou Bay, Shandong Province. J. Palaeogeogr.5, 224–231.
64
Zhang Z. L. Nie X. X. Bian X. C. (2004). Envirommental change of lakes on Xiaoqinghe River drainage, Shandong Province. J. Paleogelgraphy15, 226–233.
65
Zhao S. L. (1986). Transgression and coastal changes in Bohai Sea and its vicinities since the late Pleistocene. In QinY. S.ZhaoS. (eds.) Late Quaternary Sea-Level Changes, China Ocean Press, Beijing, 53–62.
66
Zhao S. P. Xie K. J. Song R. Z. Chang C. Zhang Y. Ma Q. Q. et al . (2023). Analysis of sedimentary environment characteristics and evolution process of Holocene paleolake in Zhengzhou area: an example of Xingze ancient lake. Mineral Resour. Geology37, 95–107.
67
Zhao S. L. Yang G. F. Cang S. X. (1978). On the marine stratigraphy and coastlines of the western coast of the Gulf of Bohai. Oceanologica Limnologia Sin.9, 15–25.
68
Zhao S. L. Zhang H. C. (1985). Sea level change of the Bohai Sea region since 200 ka YS. Mar. Sci.9, 10–14.
Summary
Keywords
quartz OSL dating, core sediments, sedimentation since MIS 5, Eastern Asian quartz OSL dating, Eastern Asian marginal sea
Citation
Xu Z, Han Y, Yan B, Li M, Jiang R, Tian R, Liu B, Zhu Z, Yuan W and Lai Z (2025) Luminescence dating of core sediments from the southern coastal Bohai Sea, China, and its implications for transgression history during the Late Quaternary. Front. Mar. Sci. 12:1606184. doi: 10.3389/fmars.2025.1606184
Received
04 April 2025
Accepted
20 August 2025
Published
05 September 2025
Volume
12 - 2025
Edited by
Jorge Sanjurjo-Sanchez, University of A Coruña, Spain
Reviewed by
Ana Luísa Rodrigues, Universidade de Lisboa, Portugal
Alicia Medialdea, National Research Center on Human Evolution, Spain
Updates
Copyright
© 2025 Xu, Han, Yan, Li, Jiang, Tian, Liu, Zhu, Yuan and Lai.
This is an open-access article distributed under the terms of the Creative Commons Attribution License (CC BY). The use, distribution or reproduction in other forums is permitted, provided the original author(s) and the copyright owner(s) are credited and that the original publication in this journal is cited, in accordance with accepted academic practice. No use, distribution or reproduction is permitted which does not comply with these terms.
*Correspondence: Weitao Yuan, yuwet@163.com
Disclaimer
All claims expressed in this article are solely those of the authors and do not necessarily represent those of their affiliated organizations, or those of the publisher, the editors and the reviewers. Any product that may be evaluated in this article or claim that may be made by its manufacturer is not guaranteed or endorsed by the publisher.