Abstract
Coastal cetaceans confront intensifying anthropogenic pressures, yet quantifying historical habitat loss remains methodologically challenging in data-scarce regions where shifting baseline syndrome obscures conservation targets. Using the critically endangered Chinese white dolphin (Sousa chinensis) as a sentinel species, we synthesized occurrences from historical documents (n = 3944) and local ecological knowledge (LEK, n = 252) to reconstruct its historical distribution shifts in southeast China; and used a two-stage analytical framework to disentangle natural versus anthropogenic drivers of observed range contractions. Maxent models with seven natural variables identified baseline suitable habitats (AUC = 0.918) that congruent with the reconstructed historical range. Generalized linear model analyses demonstrated significant effects of all five anthropogenic disturbances to the recent range contraction of S. chinensis (P < 0.05), with mariculture exerted the strongest negative effect (β = -1.358), followed by inshore fishing intensity (β = -1.231), terrestrial stressors (β = -0.754), coastal reclamation intensity (β = -0.522), and shipping activities (β = -0.257). We propose three risk-adaptive governance actions: (1) Artificial Intelligence-driven integration of multi-source ecological data with coordinated monitoring networks for coastal cetaceans to bridge data gaps and enable evidence-based governance at regional scales; (2) mitigate risks from ghost gear entanglement, coastal and estuarine maritime engineering, and vessel collisions through targeted technological interventions and adaptive marine spatial planning frameworks; (3) implement ecosystem-based management approaches to reconcile biodiversity conservation with coastal urbanization. This historical ecology-spatial planning nexus provides a transferable framework for conserving data-limited coastal megafauna amid cumulative anthropogenic impacts.
1 Introduction
To date, human activities have caused population declines, range contractions and even local extinctions across terrestrial and marine fauna (McCauley et al., 2015; Wan et al., 2019; Pacifici et al., 2020; Chen et al., 2024). Coastal zones are biodiversity hotspots but suffer severe anthropogenic disturbances (Bohorquez et al., 2021; Pereira et al., 2024). Of nearly 90 cetacean species worldwide, around 60% that inhabit coastal habitats face severe anthropogenic threats (Di Marco and Santini, 2015; Wan et al., 2019; Braulik et al., 2023). Specifically, land reclamation, construction of embankments and harbors, and rapidly expanding mariculture have directly caused habitat loss, functional degradation and decreased connectivity for coastal cetaceans (Karczmarski et al., 2017; Wang et al., 2017; Huang et al., 2022; Bath et al., 2023). Fisheries and shipping activities directly impact cetaceans (e.g., entanglement, collisions and acoustic masking) (Braulik et al., 2023; Nisi et al., 2024; Temple et al., 2024), and destroy their habitats (e.g., overfishing, trawling, electrofishing and piscicide use) (Lin et al., 2021; Wang et al., 2021; Zhang et al., 2023). Quantifying stressor-specific impacts on cetacean populations is therefore critical for targeted conservation management. However, persistent knowledge gaps in habitat selection ecology and methodological limitations in identifying anthropogenic drivers of range contraction pose significant challenges (McClenachan et al., 2012; Turvey et al., 2015a).
The Chinese white dolphin (Sousa chinensis), also known as Indo-Pacific humpback dolphin, is a small cetacean inhabiting shallow coastal waters (< 30 m) across the eastern Indian Ocean and western Pacific Ocean (Jefferson and Smith, 2016; Zhao et al., 2021). The S. chinensis was once presumed to maintain a continuous distribution across southeast China’s coastal ecosystems (Huang et al., 1978; Wang et al., 2012; Wu et al., 2014), but has undergone significant range contraction in recent decades (Wang et al., 2015; Jefferson and Smith, 2016; Wang et al., 2016a, 2017). Current surveys indicate only eight regular populations persist within this historic range, collectively representing approximately 80% of the species’ global population (Chen et al., 2010; Zeng et al., 2020; Tang et al., 2021; Araújo‐Wang et al., 2022; Lin et al., 2022c, 2024, 2024). Unfortunately, the lack of systematic historical survey over the past few decades hinders our understanding of its distribution shifts.
In China, S. chinensis has been found to prefer waters shallower than 30 m and within 20 km of coastlines or estuaries, with 10 - 30 ‰ salinity and sea surface temperature of 20 - 29°C (Jefferson, 2000; Jefferson and Smith, 2016; Huang et al., 2019; Chen et al., 2020). However, habitat selection mechanisms remain poorly resolved due to three interrelated factors: (1) spatially constrained investigations yielding inconsistent criteria across localized populations (Chen et al., 2016b; Huang et al., 2019; Chen et al., 2020; Wu et al., 2021); (2) contemporary range contractions decoupling observed distributions from the species’ historical realized niche (Pang et al., 2022; Anselmetto et al., 2025); and (3) heterogeneous anthropogenic pressures driving population-specific adaptations. Empirical evidence demonstrates non-linear responses to coastal modifications, including seaward habitat displacement from artificial shorelines in Xiamen Bay (Wang et al., 2017), altered spatial use patterns near offshore infrastructure in Pearl River Estuary (Piwetz et al., 2021; Wang et al., 2022), and distribution shift under intensive vessel activities in Sanniang Bay (Lin et al., 2022b). These factors have fundamentally constrained habitat model generalizability. Crucially, the constraining effects from suboptimal natural conditions and cumulative anthropogenic pressures on the species’ distribution remain unquantified and indistinguishable at biologically meaningful spatial scales, presenting a critical barrier to evidence-based conservation planning.
In this context, expanding the data sources and using them judiciously based on reliability are essential for accurately understanding species’ historical ranges (McClenachan et al., 2012; Turvey et al., 2015a). Local ecological knowledge (LEK) provides a crucial complementary data source for cetacean conservation (Turvey et al., 2012; Wu et al., 2014; Aswani et al., 2018; Lin et al., 2019), linking historical baselines with observations across broad spatiotemporal scales, an approach increasingly adopted due to its cost-effectiveness and scalability in coastal ecosystems (Turvey et al., 2015b; Noble et al., 2020). Compared to local scales, studies on regional scales while incorporating historical occurrences offer a global perspective on species’ habitat selection and distribution (Yan et al., 2022). On this basis, detecting potential distribution shifts and determining their relationships with key anthropogenic activities during the same period, can offer valuable insights for conservation prioritization.
Here, the historical distribution of S. chinensis was reconstructed using literature and LEK to detect distribution shrinkage in southeast China over the past three decades. To distinguish the effects of anthropogenic disturbances on the S. chinensis absence in a specific area from unsuitable natural conditions, we developed a two-stage analytical framework. First, we defined the maximum extent of suitable areas under natural conditions as the ‘baseline suitable habitat’, and simulated it using Maxent, a widely recommended species distribution model (SDM) (Elith et al., 2010), incorporating only natural variables, and examined habitat selections of S. chinensis. Second, we divided the baseline suitable habitats into presence areas overlapping with the representative ranges of S. chinensis, and pseudo-absence areas of S. chinensis outside the representative ranges. We then developed five indices to quantify the effects of inshore fishing intensity, mariculture, shipping activities, coastal reclamation intensity and terrestrial stressors over the past three decades, and used generalized linear models (GLMs) to determine the associations between distribution shrinkage (pseudo-absence areas) and anthropogenic disturbances. We aim to answer: (1) How has the distribution range of S. chinensis in southeast China changed over the past three decades? (2) What habitat conditions does S. chinensis prefer, and how are its potential habitats distributed? (3) How do the five anthropogenic disturbances individually contribute to distribution shrinkage, and what are their relative impacts?
2 Materials and methods
2.1 Study area
This study area including the waters 50 km offshore of Fujian, Guangdong, and Guangxi provinces, as well as Hainan and Taiwan Islands, to encompass the known distribution range of S. chinensis in China (Yong et al., 2023). The precise coordinates of this region are 17.71 - 27.23° N, 107.97 - 122.49° E. This area has a coastline of approximately 17,216 km, and comprises 33 bays, over 100 estuaries with width more than 200 m. Currently, there are eight regular populations of S. chinensis (population size >10) and a few scattered individuals in the study area (Figure 1; Appendix 1, Supplementary Table S1).
Figure 1

The distribution range and population sizes of known S. chinensis in coastal waters along southeast China. The gray areas indicate provinces with current S. chinensis existence, XMB, ST, PRE, LZB, SC, SNB, SWH and WTW indicate the local population in Xiamen Bay, Shantou waters, Pearl River Estuary, Leizhou Bay, Shatian-Chaotan waters, Sanniang Bay, and the waters off southwest Hainan and western Taiwan, respectively. The red stars indicate small numbers of individuals scattered in Ningde waters (ND), Quanzhou Bay (QZB) and Dongshan Bay (DSB).
2.2 Historical occurrences of S. chinensis
Historical records were digitized from maps that extracted from documents including academic dissertations, journal papers, monographs, scientific reports and conference papers published since 1950 (Wang, 1965; Huang et al., 1978; Jefferson, 2000; Liu and Huang, 2000; Yang and Deng, 2006; Chen et al., 2009, 2010; Wang, 2011; Hung, 2012; Wu, 2013; Wu et al., 2014; Chen et al., 2016a; Wang et al., 2017; Huang et al., 2018; Bao et al., 2019; Li et al., 2019; Liu et al., 2020, 2021; Peng et al., 2020; Zeng, 2021; Guo et al., 2022). For records with only toponyms, we determined the latitude and longitude coordinates on the map using ArcGIS Pro 3.0 (ESRI), based on our knowledge of the area and S. chinensis.
The interview survey was conducted in coastal communities outside the current distribution range of S. chinensis, covering 49 coastal villages or harbors in Fujian, Guangdong, and Hainan provinces from March 2010 to November 2011. Each interviewee was informed about the interview purpose and that all data were anonymous before interview started. After obtaining consent, interviewees reporting S. chinensis sightings were further asked to describe key morphological traits (body color, dorsal fin, long beak) and identify S. chinensis from a set of photographs of related dolphin species, which was to verify identification accuracy. Maps were provided to enable interviewers to indicate their fishing areas and the locations where S. chinensis had been sighted. All descriptions by the interviewee were elicited without any prompts to ensure the validity of their responses and reduce recall bias. We evaluated the reliability of reported sightings by cross-referencing interviewee’s description with established ecological knowledge of S. chinensis. The questionnaire included interviewees’ fishing experience, the time and location of last sighting of S. chinensis, and the number of individuals observed per sighting. Each questionnaire took 10–15 minutes to complete. A total of 540 valid questionnaires were obtained, of which 297 provided sighting information about S. chinensis, yielding 252 sighting records after cross-referencing. The historical occurrences from interviews were categorized into two datasets: (1) the sightings caught by interviewees after 2009, and (2) sightings before 2009 but never observed again.
The occurrences from documents and interviews were classified based on location precision: Accuracy-1, explicit latitude and longitude available (e.g., digitized from maps); Accuracy-2, noted with place names from documents; Accuracy-3, digitized on the map based on S. chinensis sighting locations provided by interviewees. This dataset was used in three primary applications: (1) all occurrences were used to reconstruct the historical distribution of S. chinensis during before 1990, 1990–2009 and 2010-2022. To clearly illustrate the distribution pattern, we developed a 5 km × 5 km grid layer over the study area, and then overlapped it with all historical occurrences. Grids containing at least one occurrence were used to represent historical distribution of S. chinensis during the three periods. In detail, all the occurrences from documents during 1990–2022 were assumed stable unless disappearances have been documented, and together with occurrences during 2010–2022 from questionnaires, were used to infer current distribution (during 2010-2022) of S. chinensis by overlapping with grids. The current distribution and the grids overlapped with historical occurrences from documents or sightings caught before 2010 (or 1990) but S. chinensis was never observed again were used as the distribution during before 2010 (or 1990). If a grid contained occurrences from multiple periods, it was classified into the last period. (2) Data with Accuracy-1 were used to simulate the baseline suitable habitats in 1990 and develop 95% minimum convex polygon (MCP). (3) Occurrences with Accuracy-2 and 3 were used to validate the habitats outside the current distribution range (Table 1; Figure 2).
Table 1
| Occurrences during | Data sources | From documents | From questionnaires | |
|---|---|---|---|---|
| Accuracy* | 1 | 2 | 3 | |
| before 1990 | Number of occurrences | 0 | 0 | 36 |
| Used in | Reconstruct those distribution remained before 1990 but loss after 1990; validating the baseline suitable habitat | |||
| 1990-2009 | Number of occurrences | 1787 | 34 | 163 |
| Used in | Reconstruction of current distribution; Maxent simulations; Developing 95% minimum convex polygon (MCP) |
Reconstruct those distribution remained during 1990–2009 but loss in current; validating the baseline suitable habitat | Reconstruct those distribution remained during 1990–2009 but loss in current; validating the baseline suitable habitat | |
| 2010-2022 | Number of occurrences | 2123 | 0 | 53 |
| Used in | Reconstruction of current distribution; Maxent simulations; Developing 95% MCP |
Reconstruct current distribution | ||
Data sources and uses of S. chinensis historical occurrences.
*Accuracy-1, explicit latitude and longitude available (e.g., digitized from maps); Accuracy-2, noted with place names from documents; Accuracy-3, digitized on the map based on S. chinensis sighting locations provided by interviewees.
Figure 2
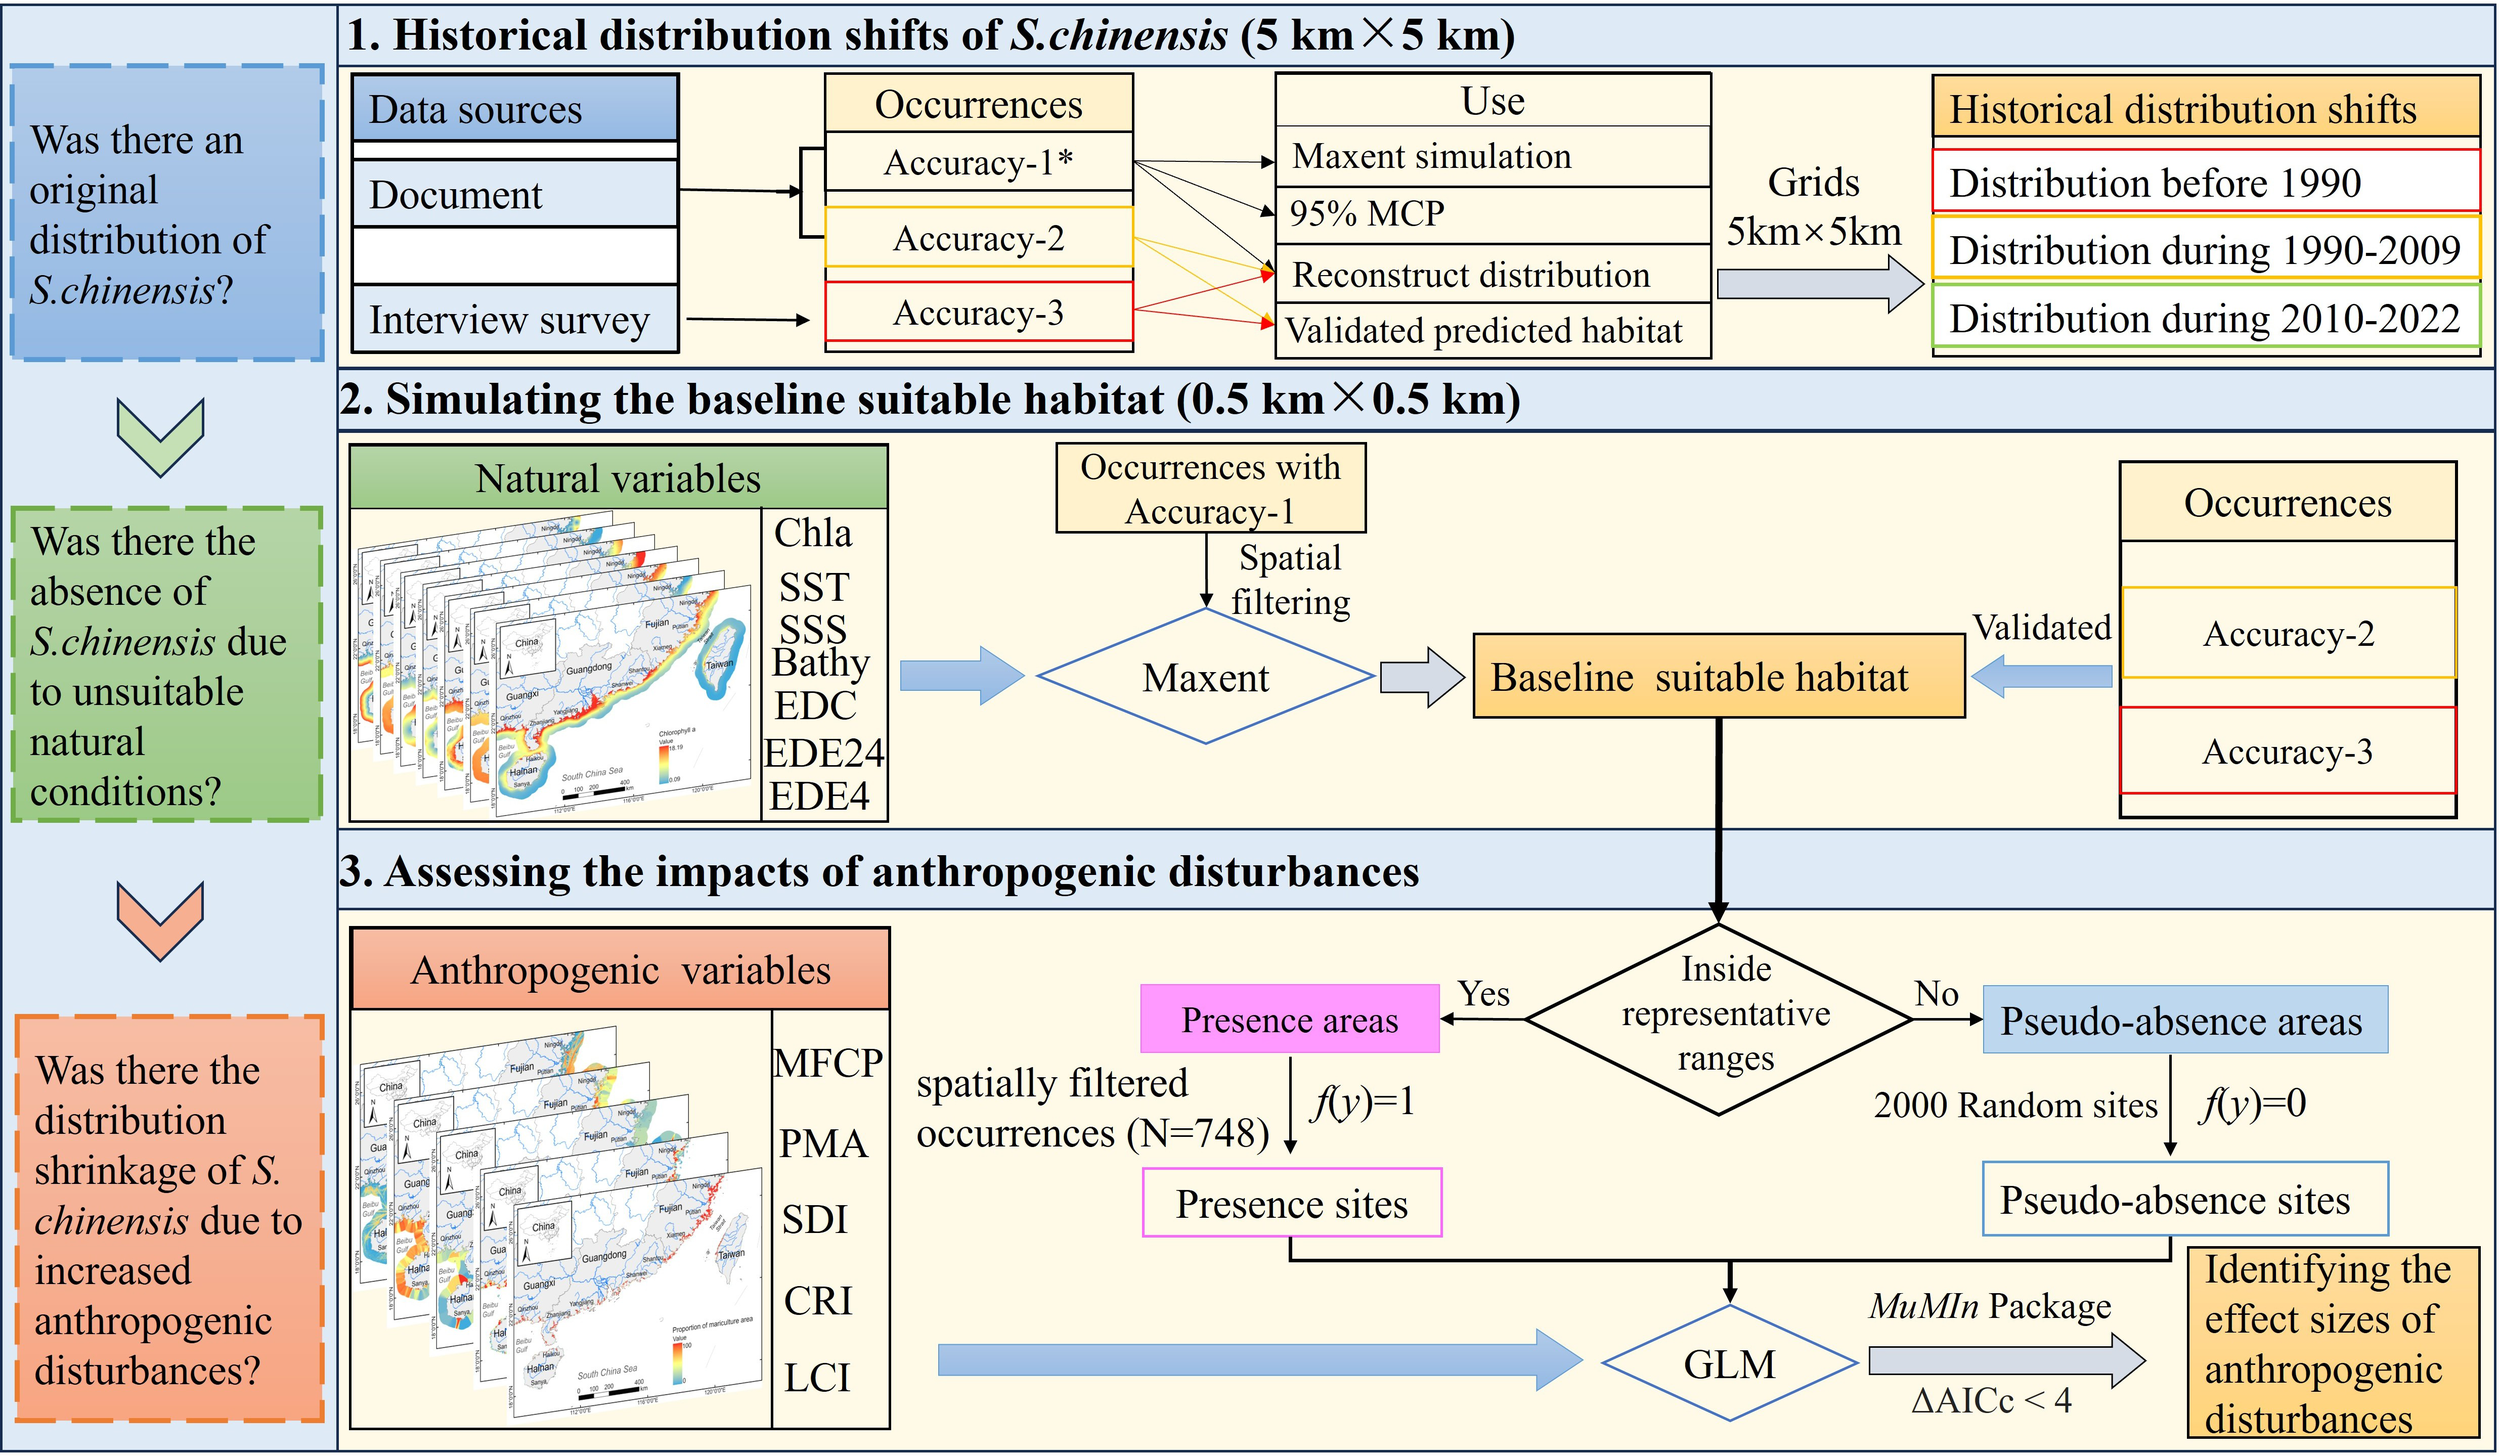
The framework and flowchart showed key steps used to explore historical distribution shifts, baseline suitable habitat, and impacts of anthropogenic disturbances on S. chinensis distribution. *Accuracy-1, explicit latitude and longitude available (e.g., digitized from maps); Accuracy-2, noted with place names from documents; Accuracy-3, digitized on the map based on S. chinensis sighting locations provided by interviewees.
2.3 Simulating baseline suitable habitat
Here, we defined baseline suitable habitat as the maximum extent of suitable areas under natural conditions, thus corresponding to the fundamental niche (Kearney and Porter, 2004). Seven natural variables were used to represent habitat configurations of S. chinensis (Table 2).
Table 2
| Natural variables (Abbreviation, Units) | Original resolution (km) | Notes | Sources |
|---|---|---|---|
| Chlorophyll a (Chla, mg/m³) | 4 | Average for 2002-2022 | http://oceancolor.gsfc.nasa.gov/cgi/l3 |
| Sea surface temperature (SST, °C) | 4 | Average for 2002-2022 | http://oceancolor.gsfc.nasa.gov/cgi/l3 |
| Sea surface salinity (SSS, ‰) | 5 | Average for 2000-2020 | https://bio-oracle.org/ |
| Bathymetry (Bathy, m) | 0.5 | stable | https://www.gebco.net/ |
| Euclidean distance to coastline (EDC, km) | 0.5 | 1990 | Calculated based on the coastlines in 1990 (Unpublished manuscript) |
| Euclidean distance to estuary of 200–400 m (EDE24, km) | 0.5 | 1990-2020 | https://www.google.com/earth |
| Euclidean distance to estuary > 400 m (EDE4, km) | 0.5 | 1990-2020 | https://www.google.com/earth |
Natural variables used for simulating baseline suitable habitat.
Chlorophyll a (Chla) serves as a proxy for primary productivity in aquatic ecosystems, reflecting potential food availability for S. chinensis (Bao et al., 2019; Lin et al., 2020). We obtained annual mean sea surface Chla concentrations and sea surface temperature (SST) data (4 km resolution) for 2002–2022 from the National Aeronautics and Space Administration (NASA) OceanColor Database (https://oceancolor.gsfc.nasa.gov/). Near-continental SST grids with anomalous values were replaced by the average of adjacent grids. Sea surface salinity (SSS) data (5 km resolution) for the 2000s and 2010s were downloaded from Bio-ORACLE’s global dataset (Assis et al., 2024).
To evaluate potential impacts on Chla, SST and SSS from climate change, we conducted trend analysis using linear fits to check if any significant changes happen during the past decades. Our results revealed no significant temporal changes in Chla across most of the study area, while SST showed a nonsignificant warming trend (Appendix 4, Supplementary Figure S1). Consequently, we derived long-term mean values for Chla and SST (2002-2022) as static environmental variables respectively. SSS data, representing decadal averages (2000s and 2010s), were aggregated to align temporally with the Chla/SST baseline, and also was calculated the average values. Our approach of using the mean values for those dynamic oceanographic variables can also eliminate the interannual fluctuations.
Bathymetry (hereafter, Bathy) data were downloaded from the General Bathymetric Chart of the Oceans (https://www.gebco.net/), with a spatial resolution of approximately 500 m. Considering that habitat in 1990 likely approximated baseline suitable habitats, a 50 km offshore buffer was generated using coastline in 1990, developed based on 30 m resolution Landsat images (Unpublished manuscript), and served as a spatial mask for extracting natural variables and cover occurrences since 1990. Euclidean distance to coastline (EDC) has been proven to be an important indicator of S. chinensis habitat (Wu et al., 2017; Chen et al., 2020). We calculated the EDC in ArcGIS Pro 3.0 using the Euclidean Distance Tool and the coastline in 1990. The distance to estuaries is an important factor influencing S. chinensis habitat selection (Chen et al., 2016b). Numerous narrow estuaries (< 200 m width) along the study area exhibit spatial congruence with coastal proximity metrics (EDC) at regional scales. Given the heightened susceptibility of these fluvial features to anthropogenic geomorphic alterations, EDC was prioritized in our analytical framework as a stable spatial proxy. We than extracted the locations of estuaries with widths ≥ 200 m using Google Remote Sensed imagery with a 4 m spatial resolution (https://www.google.com/earth). To further assess the influences of estuary sizes, we classified estuaries into two categories based on width: 200–400 m and > 400 m. We then calculated the Euclidean distance to estuaries of 200–400 m (EDE24) and estuaries > 400 m (EDE4) respectively.
All variables were prepared using ArcGIS Pro 3.0 and resampled to a 500 m resolution. Pearson correlation coefficient (r) among the seven natural variables were calculated, and for each pair with high correlation (|r| > 0.75) (Kumar and Stohlgren, 2009; Kramer-Schadt et al., 2013), retained the variable most ecologically important for S. chinensis (Appendix 5, Supplementary Figure S2). All seven variables were ultimately retained for habitat simulations.
Maxent (version 3.4.4) was employed to simulate suitable habitats for S. chinensis (Phillips et al., 2006) due to its ability to generate robust projections with varying sample sizes, and its capacity to incorporate correlated variables (Wisz et al., 2008; Elith et al., 2011). To eliminate sampling bias caused by inhomogeneous survey effort (Phillips and Dudík, 2008; Kumar and Stohlgren, 2009; Kramer-Schadt et al., 2013), a spatial filtering method was applied to remove duplicate presence records within the same 2 km × 2 km grid (Appendix 3, Supplementary Table S3). To simulate the baseline suitable habitat and mitigate potential niche truncation when modeling distributions affected by anthropogenic range contractions (Pang et al., 2022), we tried two handling methods: (1) we firstly constructed models with samplings incorporating documented occurrences and questionnaire-derived occurrences (Accuracy-1, 2 and 3). However, this method introduced bias in local areas, e.g., failing to capture key areas like Sanya waters. In fact, prediction bias can arise from integrating datasets of heterogeneous accuracy levels, a process that may exacerbate geographic sampling bias due to uneven record counts (Elith et al., 2011; Bao et al., 2019). As an alternative, we exclusively employed post-1990 Accuracy-1 occurrences as model inputs. This approach resulted in only a marginal prediction divergence (1.2%) compared to models incorporating questionnaire-derived occurrences, while ensuring data quality control throughout the analytical framework. (2) we strategically adjusted the regularization multiplier to 1.5 to prevent overfitting (Elith et al., 2010, Merow et al., 2013). Only the hinge feature was used in Maxent to generate smooth models, improving model performance without significantly increasing model complexity. Cross validate was selected to run the model 10 times (Phillips and Dudík, 2008; Elith et al., 2010). Overall model performance was evaluated by Area Under the Curve (AUC). A random prediction model should have an AUC value of 0.5, while a perfect prediction model should have an AUC value of 1, and thus an AUC > 0.75 can be considered an effective model (Phillips et al., 2006). In addition, maximizing the sum of sensitivity and specificity (Max SSS) threshold selection method was used to classify predicted habitats into suitable or unsuitable habitats (Liu et al., 2013).
The baseline suitable habitat predicted by Maxent was validated by overlapping it with historical occurrences from documents and questionnaires (Accuracy-2 and 3), and counted the percentage of occurrences as predicted habitats (Figure 2).
2.4 Assessing the impacts of anthropogenic disturbances
To assess the impacts of five anthropogenic disturbances on distribution shrinkage of S. chinensis, we developed five indices to quantify anthropogenic disturbances in the study area (Table 3).
Table 3
| Anthropogenic variables (Abbreviation, Units) | Original resolution (km) | Notes | Sources |
|---|---|---|---|
| Marine fishery Capture production (MFCP, ton/km) | County/District | 1990s, 2020s | Supplementary Table S2 |
| Proportion of mariculture area (PMA, %) | 0.03 | 2022 | http://www.geodoi.ac.cn |
| Shipping density index (SDI) | ~0.5 | 2015-2021 | https://datacatalog.worldbank.org/ |
| Land conversion index (LCI) | 0.03 | 2019 | https://zenodo.org/record/5210928#.Y8Sqz5hBzb1 |
| Coastal reclamation index (CRI) | 5 | 1990-2020 | Unpublished manuscript |
Anthropogenic variables used for quantifying the association between distribution shrinkage and anthropogenic disturbances.
2.4.1 Marine fishery capture production
Although inshore fisheries affect S. chinensis distribution by reducing prey availability and increasing bycatch risk (Jefferson, 2000; Pan et al., 2016; Brownell Jr et al., 2019; Wu et al., 2022), explicit data are unavailable for the study area. We therefore employed marine fishing capture production for coastal cities as an alternative, assuming the intensity of a city’s inshore fisheries correlates with its fishery production per kilometer of coastline. Capture production of marine fishing for 117 coastal cities in southeast China was collected from a set of yearbooks (listed in Appendix 2, Supplementary Table S2), and used to calculate the average of capture production for two periods, 1990s (1988-1997) and 2020s (2016-2021). To quantify the average intensity of inshore fishery over the past three decades, we developed an index, MFCP, using the average of capture production in 1990s and 2020s divided by each city’s coastline length. The MFCPs were assumed to be the same within a 5 km buffer to the city’s coastline, and then decrease with increasing distance to the coast, following an Inverse Distance Weight (IDW) (Appendix 6, Supplementary Figure S3)
2.4.2 Percentage of mariculture area
We obtained the coastal mariculture distribution dataset of China in 2022 with a 30 m spatial resolution from the Global Change Research Data Publishing & Repository (GCRDPR), which primarily depicts cage aquaculture and raft cultivation areas distributed in bays and nearshore waters (Yin et al., 2023). Given continuous mariculture expansion, we only used the data in 2022 to represent mariculture’s cumulative impact on S. chinensis distribution during 1990-2022 (Yin et al., 2023). Finally, we calculated the percentage of mariculture area (PMA) within each 1 km × 1 km grid of the study area.
2.4.3 Shipping density index
To quantify the impact of vessel traffic (e.g., collision and underwater noise) (Wang et al., 2016b; Ko et al., 2022), we downloaded a global shipping density dataset from the World Bank official website. The dataset counts the total number of Automatic Identification System (AIS) positions received per hour in each 0.005° × 0.005° (approximately 500 m × 500 m in our study area) grid from January 2015 to February 2021, including commercial, fishing, and passenger, as well as leisure ships, therefore the density is analogous to the general intensity of shipping activities. Finally, to improve data processing efficiency, we normalized AIS data to a 0–1 scale, and developed a shipping density index (SDI) to assess the impact of shipping activities on S. chinensis distribution.
2.4.4 Coastal reclamation index
The coastal and estuarine reclamation projects, including dyke construction and harbor development, have strong disturbance on S. chinensis and irreversibly occupied their habitats (Karczmarski et al., 2017; Wang et al., 2017; Huang et al., 2022). A 5 km resolution dataset quantified the coastal reclamation intensity (0-1) from 1990 to 2020 in southeast China, using the yearly reclamation area dividing by the average length of coastlines in 1990 and 2020 within each 5 km × 5 km grid (Unpublished manuscript). We developed the coastal reclamation index (CRI), using the coastal reclamation intensity, to indicate the impact of coastal reclamation activities on S. chinensis distribution. For areas outside the dataset, the CRI values were assigned as “0”.
2.4.5 Land conversion index
In addition to reclamation, we also developed an index to quantify any terrestrial stressors, such as the artificialization of coastlines and terrestrial pollution accompanied with the urbanization of coastal areas. A 30 m resolution land cover dataset (2019) spanning coastal zones within 1 km of coastlines was acquired from Yang and Huang (2021) to quantify cumulative anthropogenic impacts from coastal development, where terrestrial development activities most intensively interact with marine ecosystems. The original land types were reclassified into artificial land-use (assigned as “1”, including Cropland, Impervious), and natural land (assigned as “0”, including Forest, Shrub, Grassland, Barren and Wetland). We then calculated the proportion of artificial land-use area within each 1 km × 1 km grid. Finally, we developed a land conversion index (LCI) surface for the waters in our study areas using IDW interpolation in ArcGIS Pro 3.0.
2.4.6 Model development
We delineated representative ranges after 2010 for each S. chinensis regular population. Specifically, (1) post-2010 occurrences with Accuracy-1 were selected and spatially filtered using a 2 km × 2 km grid layer to minimize the effects of spatial autocorrelation; (2) the filtered occurrences (n = 781) were used to calculate Minimum Convex Polygon (MCP), using Home range tool and selecting Fixed Mean percentage calculation method; (3) the representative range of S. chinensis was obtained after the land area in 1990 in the MCP layer was removed (Rodgers et al., 2016). We then divided baseline suitable habitats into presence areas, which overlapped with representative ranges (Parra, 2006), and pseudo-absence areas, which indicated distribution shrinkage during the past three decades. The distribution shrinkage was further validated by overlapping grids with sightings reported by interviewees before 2009 but disappeared in subsequent years. Next, we selected spatially filtered occurrences that intersected the presence areas and assigned a presence value “1” for each site (n = 748). To account for potential spatial autocorrelation and mitigate sampling bias, we generated 2000 random sites in pseudo-absence areas (i.e., area of distribution shrinkage) and ensured the minimal distance between any two sites to be larger than 2 km. Each pseudo-absence sites was assigned an absence value of “0” (Barbet-Massin et al., 2012). All presence sites and pseudo-absence sites were combined into a sample dataset for analysis.
GLMs were developed to explore the impact of anthropogenic disturbances on S. chinensis distribution. All five anthropogenic variables were resampled to a 500 m resolution extracted using spatial masks aligned to the same extent as the natural variables. We then used the 2748 samples to extract the values of the five anthropogenic disturbance indices (MFCP, PMA, SDI, LCI and CRI), and used them as predictor variables. Presence (value = 1) and absence (value = 0) of S. chinensis for all sample points were set as response variables in the following model.
Here, y indicates presence (value = 1) and absence (value = 0) of S. chinensis, x indicates the predictor variables.
To eliminate multicollinearity, we examined Variance Inflation Factor (VIF) of all predictor variables using the car package (John and Weisberg, 2019) in R (v4.2.1) (R Core Team, 2022). All five predictors had a VIF < 2, indicating limited multicollinearity (Dormann et al., 2013), and thus all were remained in the GLMs. In order to make each predictor variable comparable across the models recommended next, we standardized all predictor variables to have a mean of zero and a standard deviation of 0.5 prior to parameter estimation (Grueber et al., 2011). To further streamline the model, the MuMIn package (Version 1.48.4) was used to run the GLMs as model iterations (Barton, 2024). The top sub-models were selected using the Akaike information criterion corrected (AICc) for sample size, which included sub-models with the difference in AICc relative to the best model < 4, as this threshold balances the complexity and explanatory power while accounting for the relative importance of multiple predictor variables (Burnham and Anderson, 2002). No variables were removed during the model selection process. Finally, sub-models were averaged to derive the final model (Figure 2).
3 Results
3.1 Historical distribution shifts
The historical distribution grids showed that S. chinensis were widely distributed (474 grids) in coastal waters along southeast China before 1990. During 1990-2009, S. chinensis disappeared from Putian waters, resulting a total of 469 grids in this period. During 2010-2022, distribution grids of S. chinensis shrank to 351 (Figure 3).
Figure 3
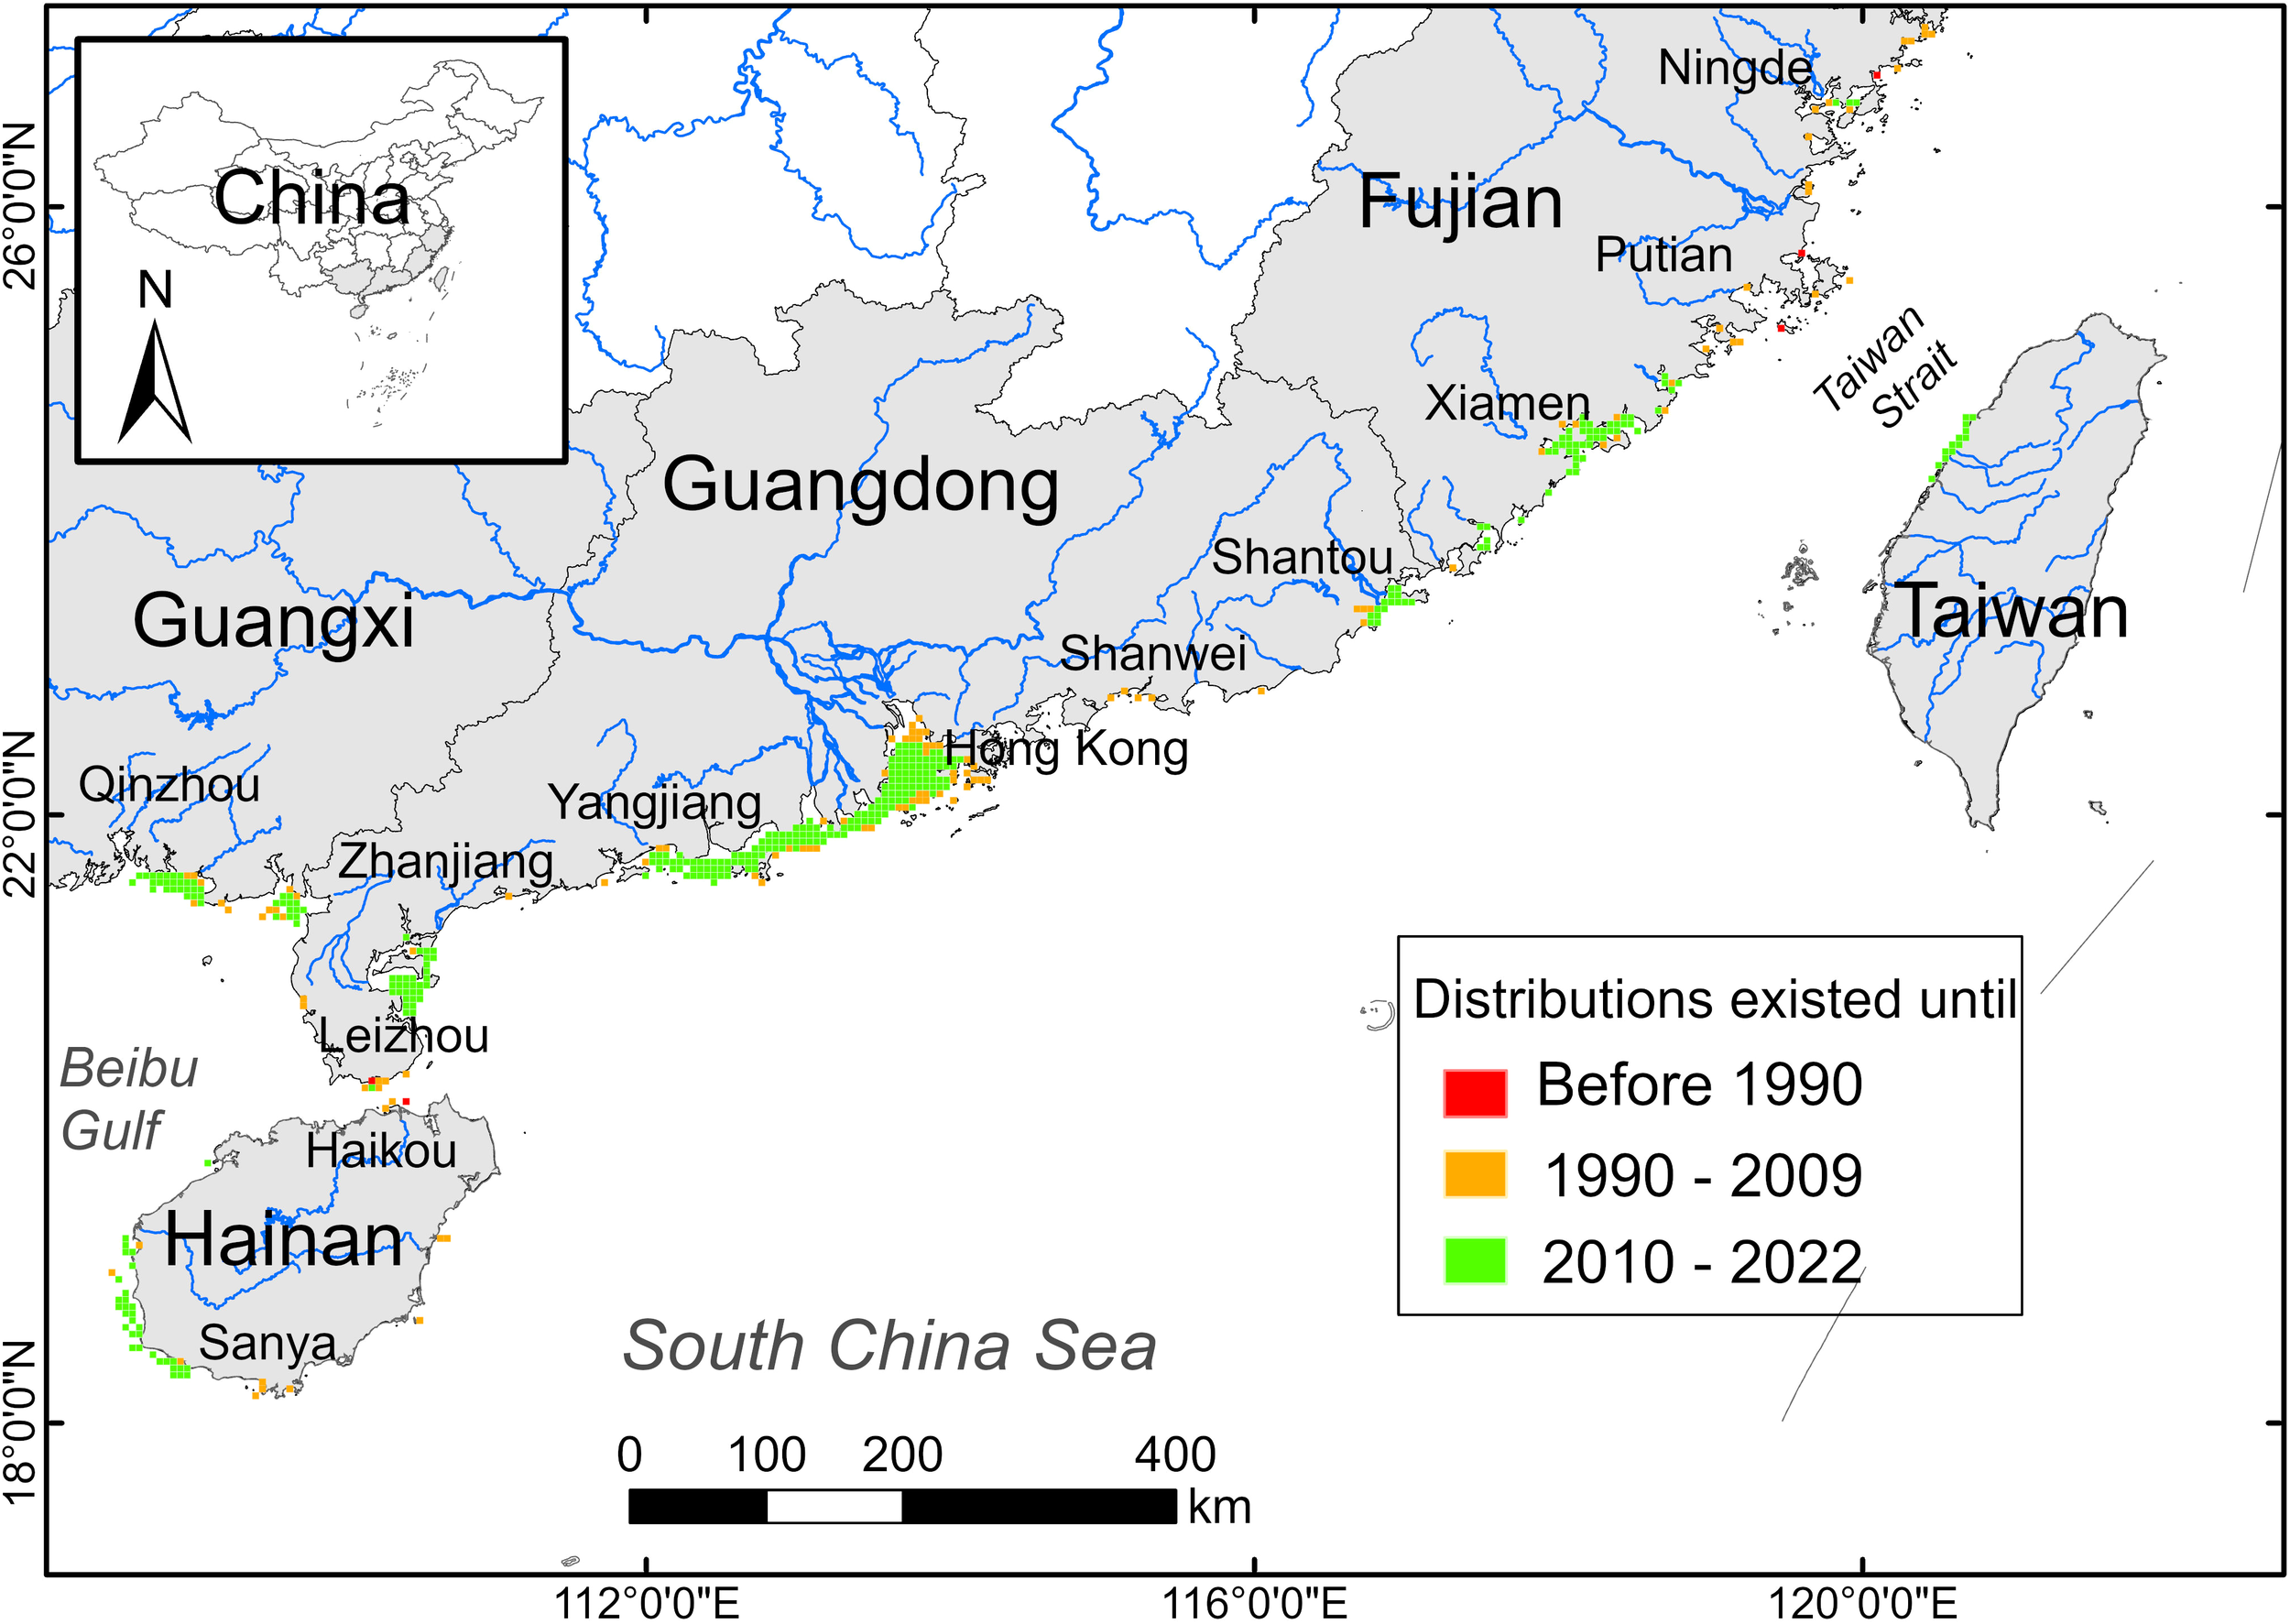
The distribution shifts of S. chinensis in coastal waters along southeast China showed by 5 km × 5 km grids.
3.2 Baseline suitable habitats
All models had an AUC > 0.9, indicating good performance of those models. Suitable habitats of S. chinensis under natural conditions showed a relatively continuous distribution pattern across Fujian, Guangdong and Guangxi provinces, but were only found in the coastal waters of Haikou, western Hainan Island, and western Taiwan Island. However, only 167 of 286 (58.4%) occurrences (Accuracy-2 and 3) were located in predicted suitable habitat, indicating potential underestimation of suitable habitat in the waters north of Ningde, Putian, from Xiamen to Shantou, Shanwei, from Yangjiang to Zhanjiang, as well as southern Leizhou Peninsula and southeastern Hainan Island. In addition, all the 56 grids contained S. chinensis sightings reported by interviewees before 2009 but not afterward fell outside the current distribution boundary delineated by representative ranges, with 23 grids in Fujian, 21 in Guangdong and 12 in Hainan. Notably, only 60.7% (n = 34) of these were situated within baseline suitable habitat (15 grids in coastal waters of Fujian and 4 grids in Shanwei waters), suggesting that the population may have disappeared despite suitable natural conditions; while 39.3% (n = 22) occupied environmentally unsuitable zones, suggesting the spatial extent of habitat contraction has surpassed model projections (Figure 4).
Figure 4
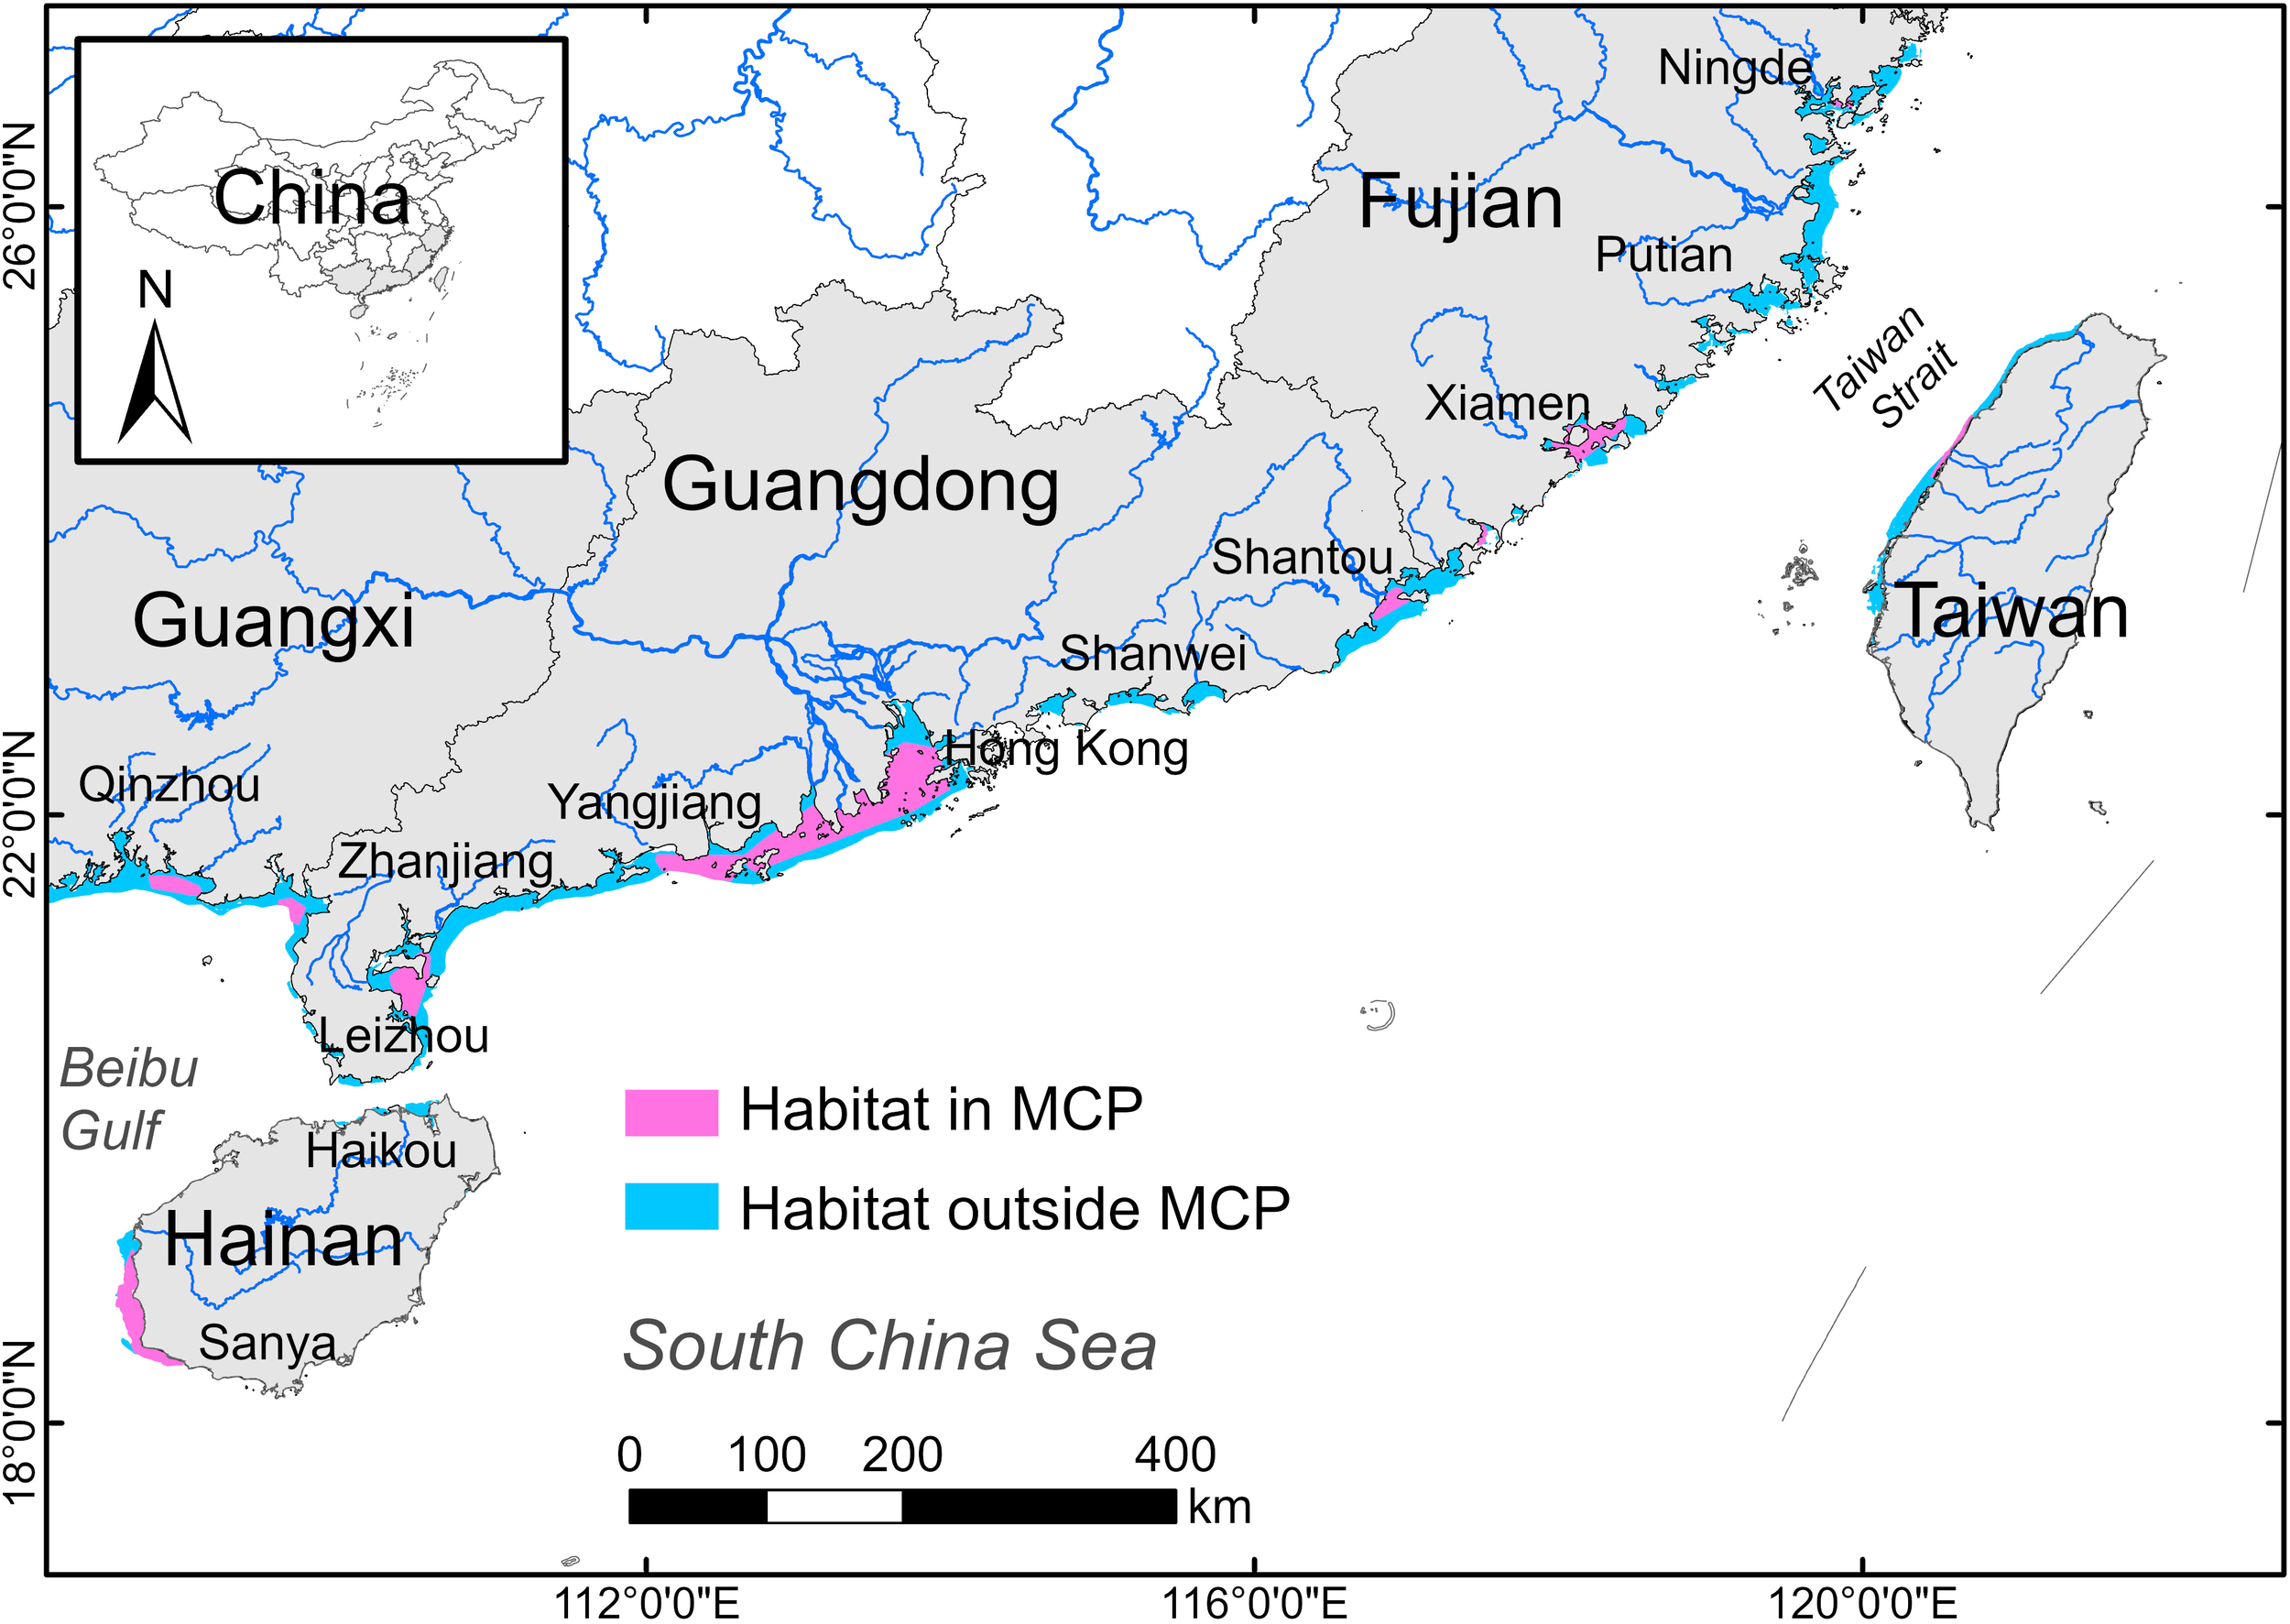
Baseline suitable habitat of S. chinensis in coastal waters along southeast China. Pink color represents areas where predicted suitable habitat overlaps with MCP, and blue color represents suitable habitat outside MCP.
3.3 Influences of natural variables on S. chinensis distribution
Among the natural variables, Chla exhibited the highest permutation importance (56.9%), followed by EDE4 (11.8%), Bathy (11%), SSS (8.9%), and EDC (8.1%). EDE24 and SST had the lowest permutation importance (< 5%). The probability of S. chinensis presence increased with Chla but decreased when Chla exceeds 7 mg/m³. S. chinensis was most prevalent in waters up to 10 km offshore and 40 km from estuaries, with depth < 30 m. The probability of S. chinensis presence increased with SSS within the range of 12 to 20‰. The S. chinensis adapted well when SSS varied between 18‰ and 34‰, and SST remained between 20°C and 27°C (Figure 5).
Figure 5
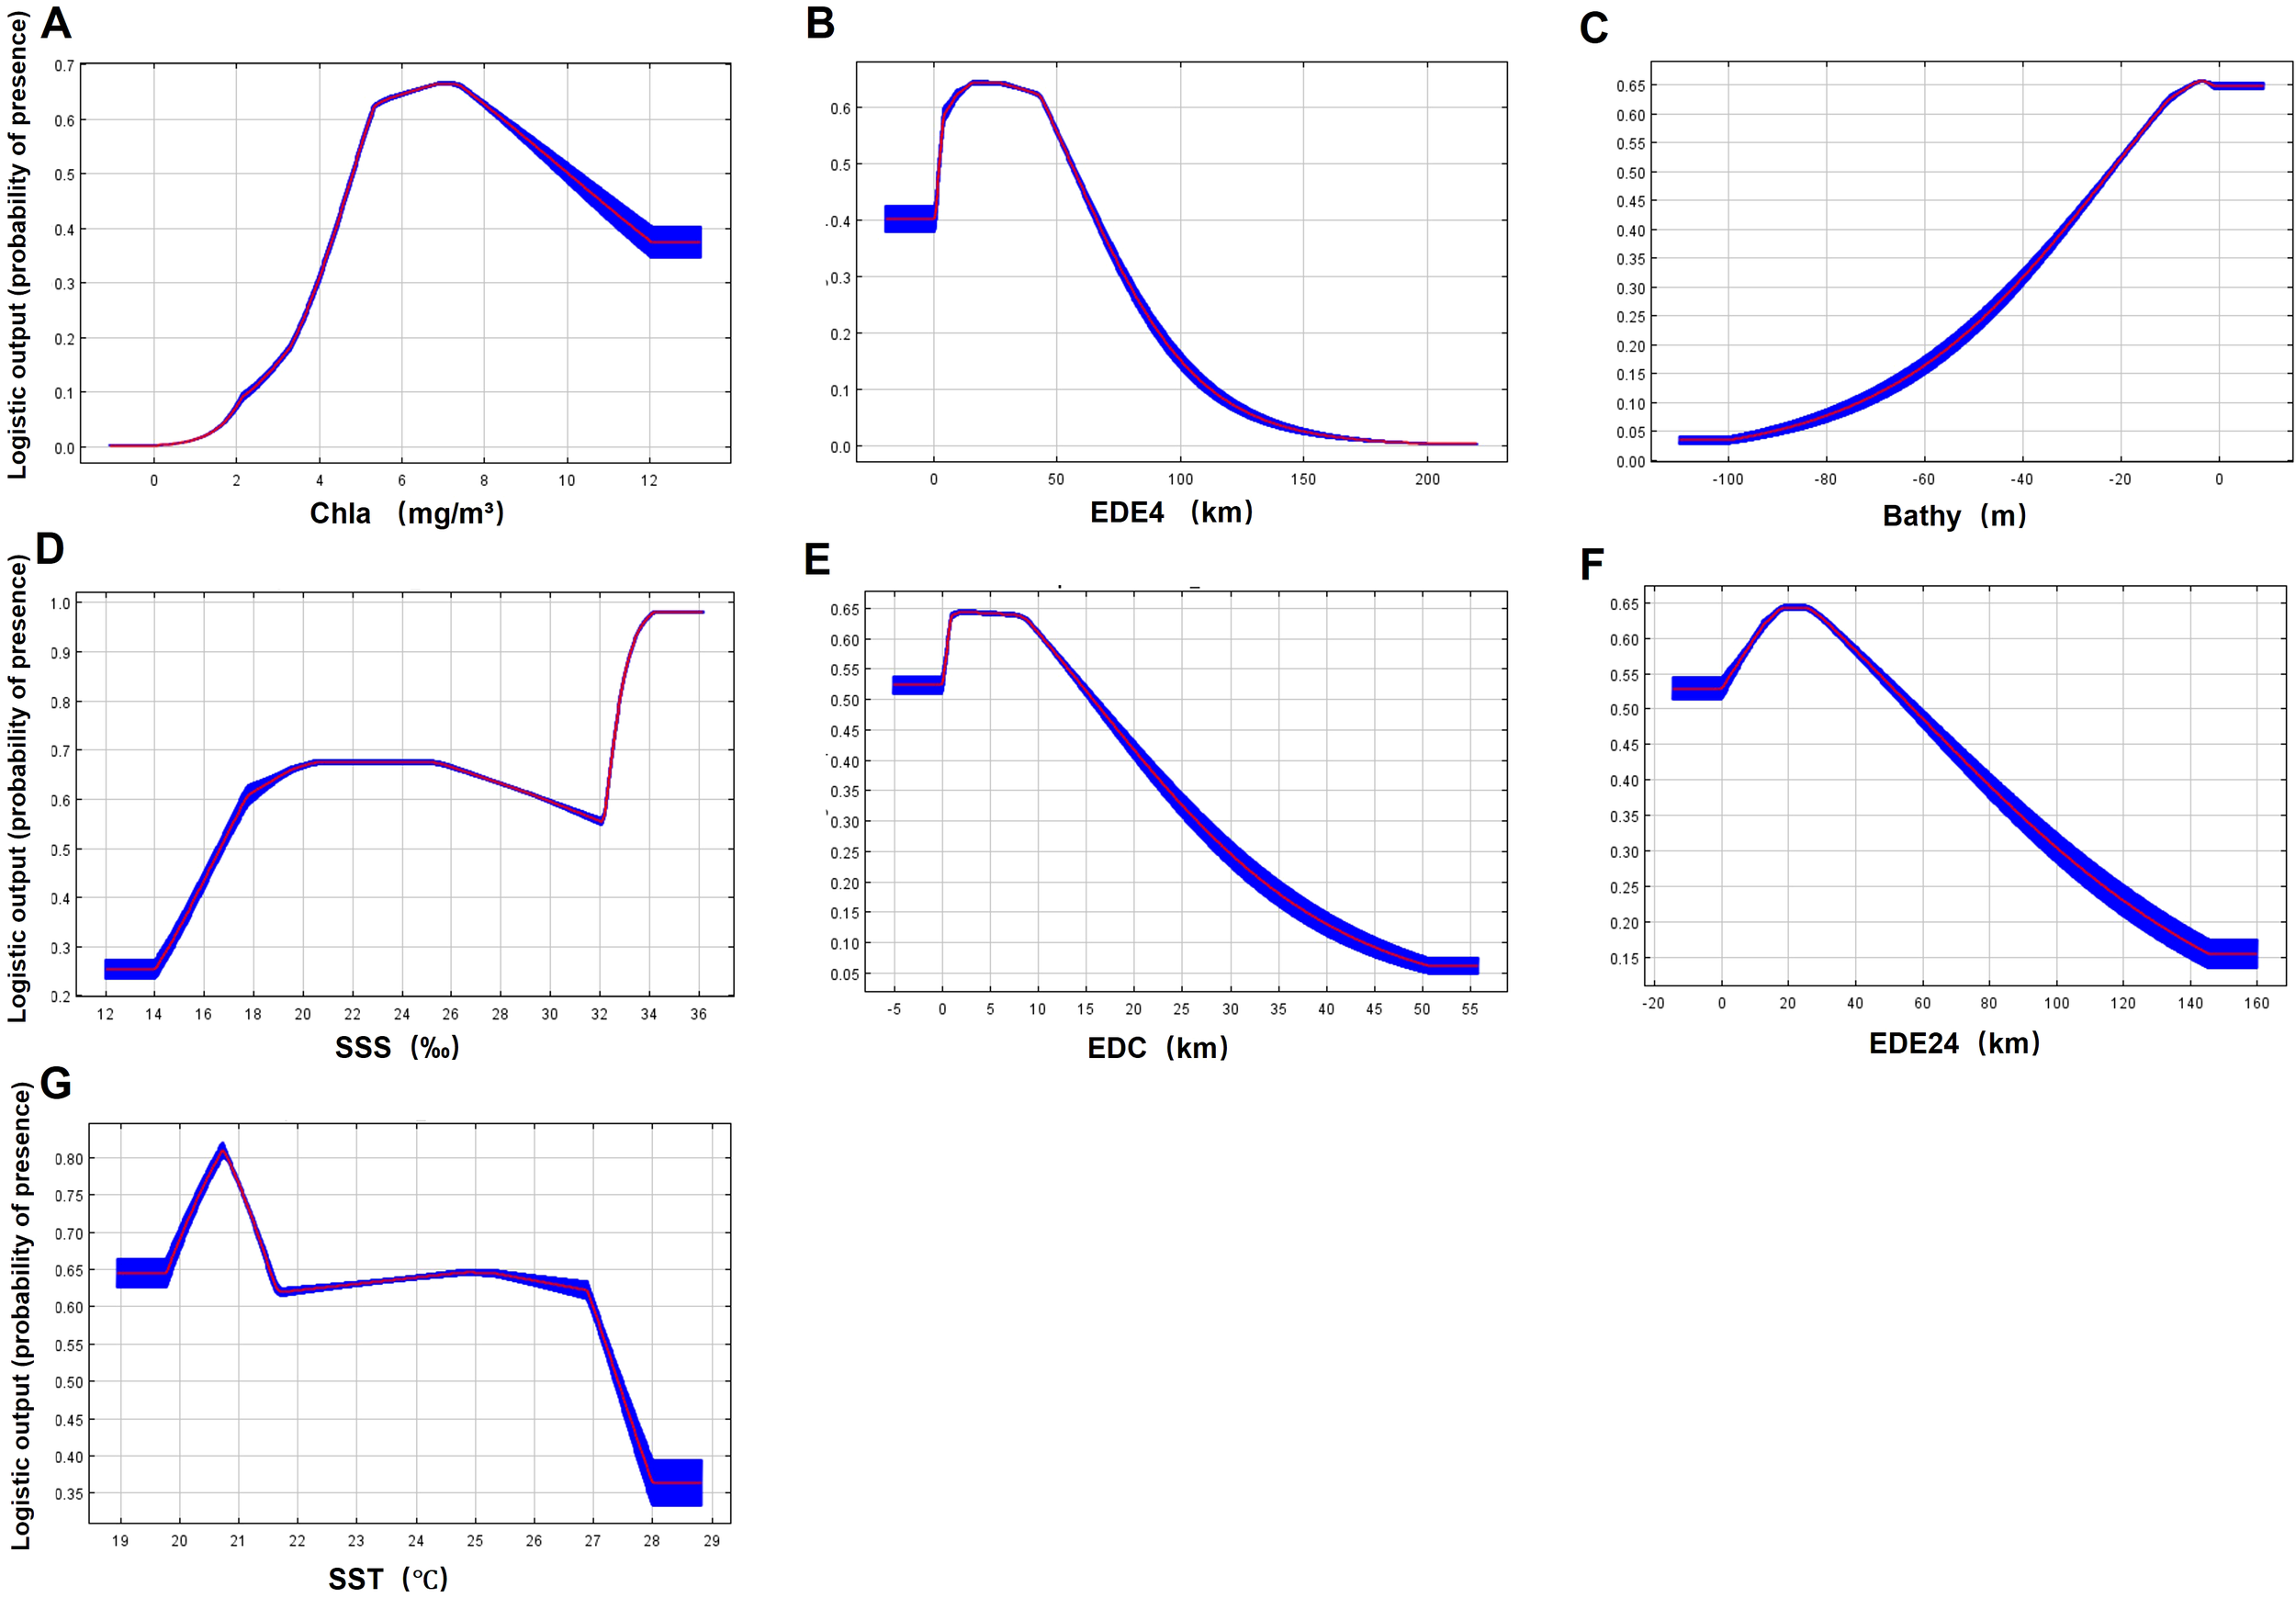
Response curves depicting the probability of S. chinensis presence to natural variables in coastal waters along southeast China. From (A–G) are the response curve of Chlorophyll a (Chla), Euclidean distance to estuaries with river mouth widths > 400 m (EDE4), Bathymetry (Bathy), sea surface salinity (SSS), Euclidean distance to coastline (EDC), Euclidean distance to estuaries with river mouth widths between 200 to 400 m (EDE24), and sea surface temperature (SST) respectively.
3.4 Associations between anthropogenic disturbances and S. chinensis presence
A single candidate model was retained based on the AICc criterion (ΔAICc < 4), with an Akaike weight of 0.953, indicating robust model support. All five anthropogenic disturbances demonstrated statistically significant negative effects on the current distribution of S. chinensis in suitable habitats. The standardized regression coefficients revealed a clear impact hierarchy: PMA exerted the greatest effect (β = - 1.358 ± 0.150), followed by MFCP (β = - 1.231 ± 0.135), LCI (β = - 0.754 ± 0.091), CRI (β = - 0.522 ± 0.127), and SDI (β = -0.257 ± 0.092) (Figure 6).
Figure 6
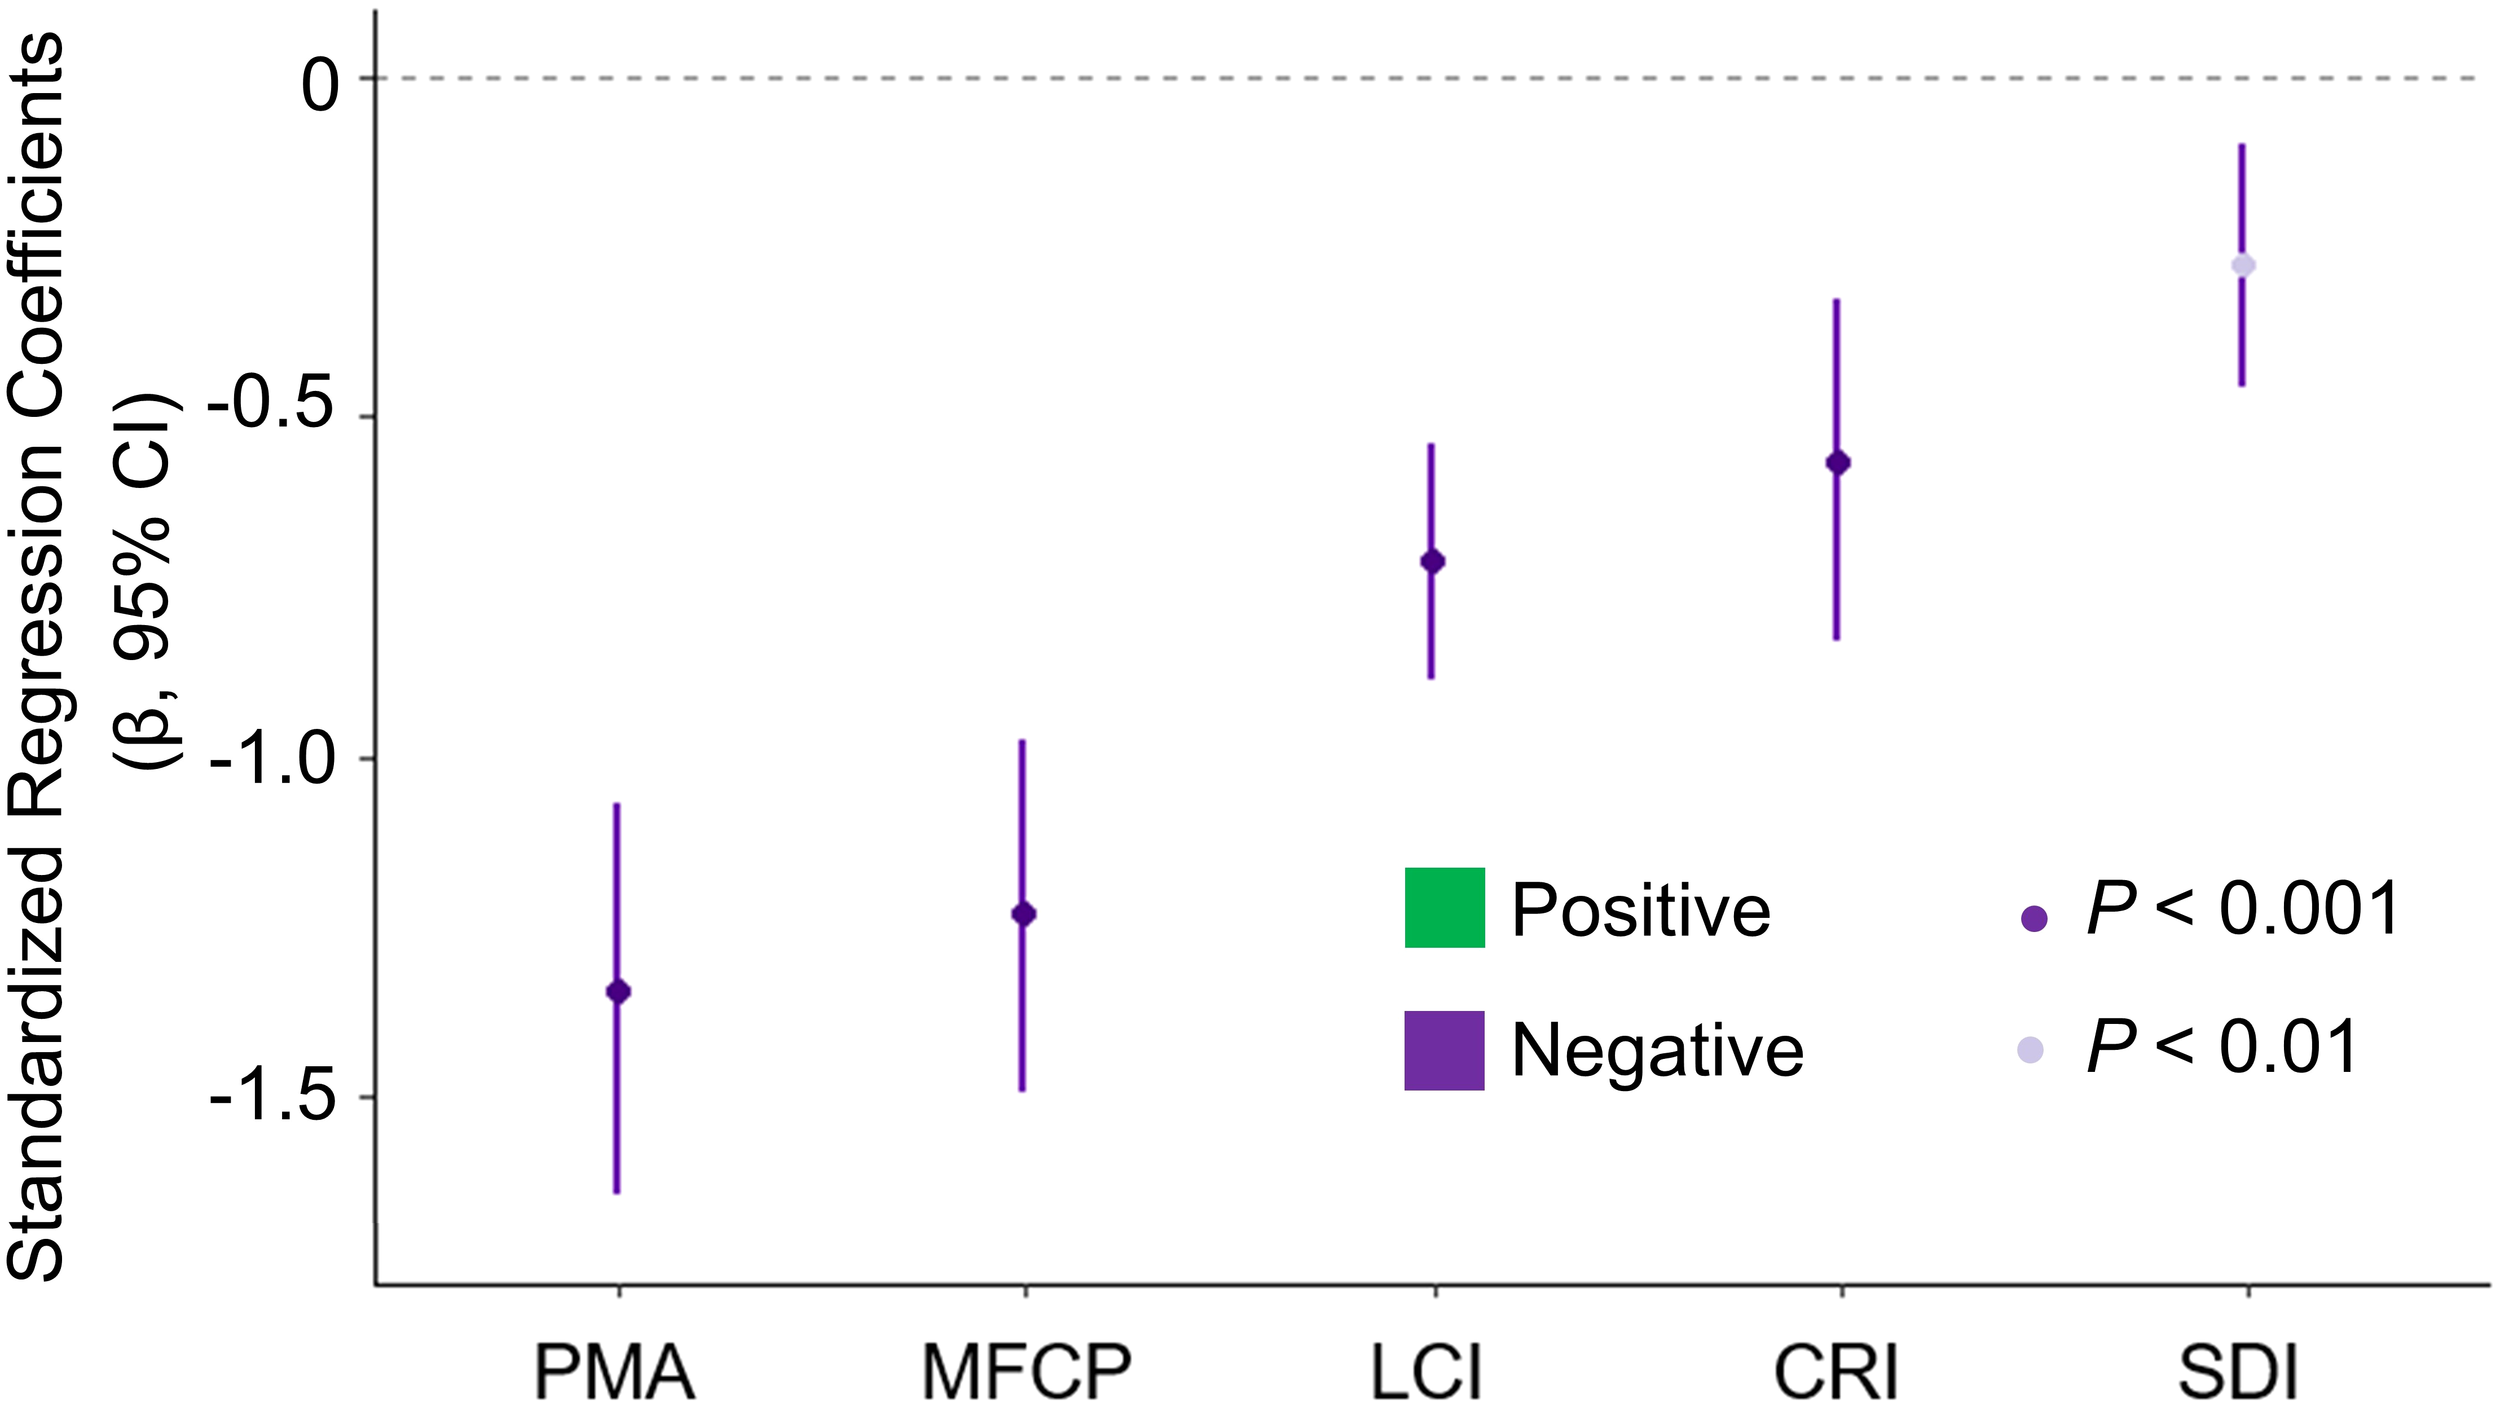
Forest plot of standardized regression coefficients (95% CI) for five anthropogenic variables. PMA, Percentage of mariculture area; MFCP, Marine fishery capture production; LCI, Land conversion index; CRI, Coastal reclamation index; and SDI, Shipping density index.
4 Discussion
4.1 Distribution shrinkage of S. chinensis in southeast China
Understanding distribution shrinkage and its driving factors is critical for conservation management of threatened species but is constrained by scarce historical survey data. In this study, we reconstructed the historical distribution of S. chinensis in southeast China by integrating LEK from questionnaires combined with SDM. The reconstructed distributions revealed that, outside current presence areas, S. chinensis may have disappeared from northern Ningde, Putian waters, Shanwei, Yangjiang to Zhanjiang, southwestern Leizhou Peninsula, and Haikou waters since 1990, despite suitable natural conditions, suggesting that increased anthropogenic disturbances contributed to habitat loss in these regions.
The distribution of baseline suitable habitat predicted by Maxent indicated a high connectivity among regular populations in the absence of anthropogenic disturbances. Previous IUCN assessments of S. chinensis suggested a continuous potential distribution range along the Chinese coast while acknowledging a possible distribution gap (Jefferson and Smith, 2016). Our SDM predictions address this distribution gap and offer new insights into distribution dynamics of S. chinensis. Notably, spatial heterogeneity was observed in the primary environmental constraints of unsuitable regions. Deeper waters and lower Chla restricted the suitable habitat between Putian and Ningde, while lower Chla limited the continuous distribution of suitable habitat between Xiamen and Shantou. In addition, habitat discontinuities between Shantou and eastern Hong Kong, as well as between Haikou and western Hainan Island were primarily constrained by larger EDE4, while the southeastern waters of Hainan Island were restricted by low Chla (Appendix 7, Supplementary Figure S4).
Our findings potentially underestimated the range of baseline suitable habitat. For instance, 41.6% (119 of 286) historical occurrence records (Accuracy-2 and 3) were located outside predicted suitable habitats, which may be partially explained by temporally truncated ecological niches resulting from historical distributional contraction (Pang et al., 2022). Additionally, occurrences along eastern Hainan Island overlapped with the IUCN-suggested range but not with predicted habitats. This inconsistency likely stems from two mechanisms: (1) the existence of a potential narrow migratory corridor for S. chinensis along eastern Hainan Island requires further investigation; and (2) the recognition of two distinct ecotypes of S. chinensis may exclude eastern Hainan waters from predicted suitable habitats due to ecological differentiation (Lin et al., 2022a), thereby causing a mismatch with historical occurrence records.
4.2 Habitat selections of S. chinensis in southeast China
Among natural variables, Chla was the most important variable affecting S. chinensis distribution in southeast China, similar to previous localized findings (Huang et al., 2018; Bao et al., 2019; Chen et al., 2020; Wu et al., 2021), due to its association with prey availability for S. chinensis (Wu et al., 2017; Lin et al., 2023). Higher probability of S. chinensis presence associated with Chla of 4–12 mg/m³, along with a peak at 7 mg/m³. This pattern reflects the ecological constraints of estuarine habitats where elevated Chla levels (>7 mg/m³) predominantly occur within 3 km of river mouths and heightened exposure to anthropogenic stressors. Additionally, sustained Chla elevation signaled escalating harmful algal bloom proliferation, and 10 mg/m³ can be a threshold for formal eutrophication (Chen et al., 2014). These blooms drive hypoxic conditions through microbial degradation of senescent biomass, consequently inducing distribution shifts of food sources (Guo et al., 2022). We also found that the probability of S. chinensis presence decreased as distances to the coast and estuary increased, confirming the coastal resident of this species (Jefferson and Smith, 2016). In fact, smaller EDC values were associated with higher Chla (r = -0.61), lower Bathy (r = -0.49), which are also characteristics of waters with higher fish densities (Zhou et al., 2016; Lin et al., 2023). In addition, S. chinensis is not strictly confined to estuarine habitats, for instance, a population inhabits deep waters with low Chla and high SSS along southwest Hainan (Li et al., 2016; Lin et al., 2022a), which may partly explain why eastern waters of Hainan were not predicted as suitable habitat by our Maxent model. Additionally, larger estuaries (> 400 m) had higher importance than smaller estuaries (200–400 m) in this study, probably due to their higher fish densities (Zhou et al., 2016; Wu et al., 2023). Meanwhile, the limited trophic pooling effect of small estuaries and the adaptability to larger variation of salinity may have contributed to non-estuarine ecotype of S. chinensis population in southwest Hainan (Lin et al., 2022a). The contribution of SST to S. chinensis distribution was limited in this study.
4.3 Distribution shrinkage driven by anthropogenic disturbances
The fishery industry including mariculture and fishing negatively associated with S. chinensis presence in suitable habitat, due to competition for space and food resources, as well as increased health risks and mortality for S. chinensis (Lin et al., 2021). Our findings indicate that mariculture exerts the most significant adverse impact on the distribution shrinkage of S. chinensis. The mariculture area along the Chinese coast increased dramatically by 6,191.78 km2 during 1990 to 2022 (Yin et al., 2023). Notably, over 80% of mariculture was located in shallow waters < 20 m, and more than 90% of mariculture was distributed within 20 km offshore over the past three decades (Liu et al., 2023). This spatial pattern indicates a highly overlap with S. chinensis habitats that directly caused habitat loss, and other risks including entanglement, entrapment, behavioral modification and pesticide poisoning (Bath et al., 2023). Despite this, the negative effects of mariculture could still be underestimated because our dataset, which was developed using remote sensing data, did not account for stick and rack culturing methods commonly used for oysters—one of the most significant mariculture species along China’s coast (Yin et al., 2023; Yu et al., 2023). The maximum fishing intensity in China occurred within 30 km offshore (Geng et al., 2023), and overfishing had caused a drastic decline in coastal fish stocks since the 1990s (Liang and Pauly, 2017; Ding et al., 2021). The MFCP in this study reflects the intensity of regional fishery development and the associated entanglement risk to S. chinensis. In fact, small-scale fisheries have a greater global impact on small cetaceans than large-scale fisheries. It is estimated that approximately 22% of small cetacean populations globally are at risk of extinction due to the threats posed by small-scale fisheries (Temple et al., 2024). Field surveys revealed high spatial density of fixed and drifting gillnets in estuaries, which effectively exclude S. chinensis from their habitats in the estuaries. Furthermore, the negative impact of MFCP may still be underestimated due to insufficient data on small-scale fisheries and unreported incidents of illegal fishing methods such as electrofishing and piscicide use (Thomas et al., 2019; Zhang et al., 2023). Therefore, mariculture and inshore fisheries were likely the primary disturbances that have removed S. chinensis from the study area, given the continues distributions of this species in southeast China 30 years ago (Wang et al., 2012; Wu et al., 2014). For instance, the distribution shrinkage validation showed that all 15 grids disappearing in Fujian coast post-2010 were located in high PMA waters, whereas the 4 grids disappearing in Shanwei were located in high MFCP waters.
Previous localized-scale studies demonstrated S. chinensis behavioral adaptations to reclamation pressures, such as artificial shoreline avoidance, displacement from construction zones, and shifts in core habitat use (Wang et al., 2017; Karczmarski et al., 2017; Huang et al., 2022). Our regional-scale analysis revealed significant negative effects of both LCI and CRI on S. chinensis distribution. Collectively, this multi-scale evidence demonstrates that cumulative anthropogenic modifications across terrestrial and marine coastal zones, as well as other terrestrial stressors like pollution, have been a primary driver of S. chinensis range contraction over the past three decades. Notably, LCI/CRI effect sizes were lower than those of fisheries, reflecting different intrinsic mechanisms. Compared to large-scale habitat exclusion by fisheries, the coastal urbanization and reclamation predominantly caused habitat encroachment at the periphery of the S. chinensis representative habitats. On the other hand, LCI/CRI impacts exhibit temporal decoupling, with ecological consequences lagging behind disturbance initiation, a critical consideration routinely neglected in conservation planning. The delayed response, exemplified by cumulative pollution and irreversible alterations to biogeochemical cycling (Lin and Yu, 2018), coastal hydrology, sediment dynamics, poses distinctive management challenges (Huang et al., 2022). Such anthropogenic modifications not only permanently alter benthic topography and disrupt hydrological connectivity but also initiate cascading degradation of essential habitat features in long term. Absent science-informed regulatory frameworks, synergistic alterations across physical environments—including sediment geomorphology shifts, toxicant bioaccumulation, and resultant trophic cascade disruptions—may collectively exceed critical ecological resilience thresholds and result irreversible habitat collapse (Huang et al., 2022).
The present study documents significant distributional avoidance of S. chinensis in areas with intense shipping activities, aligning with localized findings from Sanniang Bay (Lin et al., 2022b). Paradoxically, persistent populations coexist with dense shipping in major estuarine systems (e.g., Pearl River Estuary, Xiamen Bay) (Guo et al., 2022; Zhang et al., 2025). Unlike spatial exclusion caused by mariculture, fishing or reclamation, shipping impacts manifest through two primary pathways: (1) acute mortality from vessel collisions and chronic physiological stress from underwater noise pollution (Li et al., 2018; Yuen et al., 2025); (2) bioenergetic constraints through reduced foraging efficiency that diminishes population fitness (Lin et al., 2021). However, these chronic stressors may drive population declines that ultimately manifest as detectable range contractions only after multidecadal latency (e.g., >30 years) —a temporal scale exceeding that of most observational studies (Jefferson et al., 2023). Furthermore, estuaries with dense shipping channels often incidentally create ephemeral refugia or corridors by excluding competing anthropogenic activities (e.g., mariculture, fishing), where temporarily enhanced prey availability partially offsets shipping-derived ecological costs (Zhang et al., 2025). This dual framework delineates the nonlinear, temporally mediated interactions between acute shipping impacts (direct mortality, behavioral disruption) and persistent anthropogenic pressures (habitat degradation from coastal development).
4.4 Limitations and prospects
The shrinkage of S. chinensis distribution was detected by LEK. However, questionnaires may be limited by the availability of experienced interviewees (McMillan et al., 2019). Second, predicted baseline habitat for S. chinensis, and thus the distribution shrinkage, may still be underestimated due to niche truncation caused by early anthropogenic disturbances. Third, quantifying anthropogenic disturbances remains challenging, especially the inshore fishing—a major threat to coastal cetaceans, due to insufficient data. Low resolution MFCP data limits the capacity for fine-scale interpretation of localized areas and cross-regional comparability, while potentially diminishing its relative importance rankings in GLM. Continued decline of remnant populations under persistent anthropogenic disturbances (Appendix 1, Supplementary Table S1) may drive future distribution shrinkage, but this demographic process beyond the scope of our current framework. Crucially, prey availability dynamics fundamentally influence S. chinensis distribution (Lin et al., 2021; Guo et al., 2022; Lin et al., 2023), the absence of spatially explicit, time-series data on prey biomass across our study domain precluded quantification of this driver.
Future research should focus on three interconnected priorities to address coastal cetacean conservation under climate change: (1) unraveling synergistic interactions among climate change, prey dynamics, and anthropogenic stressors in shaping population resilience and distribution; (2) advancing mechanistic models to quantify climate-mediated habitat shifts, such as those driven by ocean acidification, sea-level rise, and prey biogeography changes (Lawlor et al., 2024), and their cascading impacts on cetacean behavioral plasticity and demographic responses (Pirotta et al., 2018; Celine et al., 2021); and (3) designing dynamic marine protected areas (MPAs) that account for spatiotemporal mismatches between prey availability and cetacean habitat use. Simultaneously, high-resolution local-scale fisheries data should be integrated to address compounding threats to coastal cetacean population dynamics arising from overfishing and cumulative stressors in nearshore mariculture. Given the projected compounding effects of future climate change and intensified anthropogenic disturbances, coupled with the current severe deficiency in MPAs coverage across China’s coastal waters (Bohorquez et al., 2021; Huang et al., 2022), future efforts can prioritize developing resilient MPA networks using Artificial Intelligence (AI)-enabled decision-support tools to evaluate cost-benefit trade-offs of conservation actions; and fostering interdisciplinary frameworks that leverage AI for data integration, predictive modeling, and adaptive management (Luo et al., 2024). These strategies will bridge theoretical-practical gaps, enhance understanding of cetacean distribution dynamics, and support adaptive conservation strategies for coastal marine megafauna, including S. chinensis.
5 Conclusion
This study enhances our understanding of S. chinensis distribution shifts and their driving factors over the past three decades, providing valuable insights and a transferable methodological framework for current and future conservation efforts targeting this species and other coastal cetaceans. Our historical data revealed the distribution shrinkage of S. chinensis in southeast China. Our two-stage analytical framework distinguishes between anthropogenically induced range contractions and distribution gaps shaped by naturally unsuitable conditions. Our findings indicated that all five anthropogenic disturbances significantly related to the absence of S. chinensis in baseline suitable habitats, with the strongest effect of mariculture, followed by fishing, terrestrial stressors, coastal reclamation intensity and shipping activities. Additionally, the small sizes of local populations may also contribute to the distribution shrinkage since 1990. However, the fate of the remain populations is not optimistic, due to rapid urbanization in larger estuaries.
To address escalating threats to coastal cetaceans under global change (Lawlor et al., 2024), a multi-tiered conservation framework integrating risk-based approaches (Carlucci et al., 2021) and regional-scale strategies is urgently needed. First, adopt a unified regional management model: synthesize systematic monitoring, stranding data, and citizen science through AI-driven data fusion to establish a holistic population census, manage all populations as a single conservation unit, and implement ecological red lines of habitats to mitigate cumulative anthropogenic impacts at regional scales. Concurrently, identify ecological risk thresholds for all S. chinensis populations and establish proactive governance frameworks with dynamic monitoring systems that track population health by individual injury rates, reproductive success, and mortality indices at local areas. We therefore recommended that systemic field surveys should be conducted in coastal waters to identify and protect any remaining populations. Second, prioritize conservation actions for S. chinensis through integrated strategies combining innovative technologies and adaptive marine spatial planning: eliminate mariculture and inshore fishing in critical estuarine zones and remove underwater ghost fishing gear (e.g., fixed nets, gillnets); promote biodegradable fishing gear to reduce entanglement risks; pursue adaptive, long-term marine spatial planning to mitigate irreversible impacts from coastal and estuarine maritime engineering (e.g., reclamation, sea-crossing bridges) and terrestrial pressures; enforce vessel speed limits based on S. chinensis reaction speeds and mandate propeller guards for speedboats to minimize collision risks. All measures must be coordinated regionally and implemented immediately in high-risk areas, such as Ningde waters, Quanzhou bay and Dongshan bay in Fujian Province, where sporadic individuals face imminent extinction threats (Wu et al., 2014). Finally, given that future climate change may further intensify the conflict between urban expansion and biodiversity conservation, we recommend establishing regional-scale MPAs and implementing ecosystem-based management to safeguard ecological corridor connectivity across adjacent coastal and upstream regions. This dual approach aims to protect potential climate refuge while maximizing conservation efficacy and socioeconomic co-benefits. These conservation strategies align with the marine conservation objectives outlined in the Kunming-Montreal Global Biodiversity Framework.
Statements
Data availability statement
The original contributions presented in the study are included in the article/Supplementary Material. Further inquiries can be directed to the corresponding authors.
Ethics statement
Ethical approval was not required for the study involving animals in accordance with the local legislation and institutional requirements because Animal ethical experiments were not involved in this study.
Author contributions
LY: Data curation, Writing – original draft, Visualization, Validation, Software, Methodology. XL: Data curation, Software, Writing – review & editing, Validation. QZ: Writing – review & editing, Validation. LZ: Validation, Writing – review & editing. YZ: Validation, Resources, Project administration, Funding acquisition, Writing – review & editing, Methodology. XW: Writing – review & editing, Validation, Project administration, Methodology, Resources, Funding acquisition.
Funding
The author(s) declare that financial support was received for the research and/or publication of this article. This work was financially supported by the National Key R&D Programme of China (No. 2022YFF0802204, 2022YFF0802202), the Scientific Research Foundation of the Third Institute of Oceanography, Chinese Ministry of Natural Resources (No. 2023020).
Acknowledgments
We greatfully acknowledge each members of Marine Endangered Species Research Group for their help in promoting this study.
Conflict of interest
The authors declare that the research was conducted in the absence of any commercial or financial relationships that could be construed as a potential conflict of interest.
Generative AI statement
The author(s) declare that no Generative AI was used in the creation of this manuscript.
Publisher’s note
All claims expressed in this article are solely those of the authors and do not necessarily represent those of their affiliated organizations, or those of the publisher, the editors and the reviewers. Any product that may be evaluated in this article, or claim that may be made by its manufacturer, is not guaranteed or endorsed by the publisher.
Supplementary material
The Supplementary Material for this article can be found online at: https://www.frontiersin.org/articles/10.3389/fmars.2025.1607234/full#supplementary-material
References
1
Anselmetto N. Morresi D. Barbarino S. Loglisci N. Betts M. G. Garbarino M. (2025). Species distribution models built with local species data perform better for current time, but suffer from niche truncation. Agric. For. Meteorology362, 110361. doi: 10.1016/j.agrformet.2024.110361
2
Araújo-Wang C. Wang J. Y. Draghici A. M. Ross P. S. Bonner S. J. (2022). New abundance and survival estimates for the critically endangered Taiwanese white dolphin indicate no signs of recovery. Aquat. Conservation: Mar. Freshw. Ecosyst.32, 1341–1350. doi: 10.1002/aqc.3831
3
Assis J. Bejarano S. J. F. Salazar V. W. Schepers L. Gouvea L. Fragkopoulou E. et al . (2024). Bio-ORACLE v3.0. Pushing marine data layers to the CMIP6 Earth System Models of climate change research. Global Ecology and Biogeography33(4), e13813. doi: 10.1111/geb.13813
4
Aswani S. Lemahieu A. Sauer W. H. H. (2018). Global trends of local ecological knowledge and future implications. PloS One13, e0195440. doi: 10.1371/journal.pone.0195440
5
Bao M. Wang X. Liu W. Chen H. L. Li Y. Wu F. et al . (2019). Habitat protection actions for coastal delphinids in a disturbed environment with explicit information gaps. Ocean Coast. Manage.169, 147–156. doi: 10.1016/j.ocecoaman.2018.12.017
6
Barbet-Massin M. Jiguet F. Albert C. H. Thuiller W. (2012). Selecting pseudo-absences for species distribution models: how, where and how many? Methods Ecol. Evol.3, 327–338. doi: 10.1111/j.2041-210X.2011.00172.x
7
Barton K. (2024). Multi-Model Inference. R package version 1.48.4. doi: 10.32614/CRAN.package.MuMIn
8
Bath G. E. Price C. A. Riley K. L. Morris J. A. (2023). A global review of protected species interactions with marine aquaculture. Rev. Aquaculture15, 1686–1719. doi: 10.1111/raq.12811
9
Bohorquez J. J. Xue G. Frankstone T. Grima M. M. Kleinhaus K. Zhao Y. et al . (2021). China’s little-known efforts to protect its marine ecosystems safeguard some habitats but omit others. Sci. Adv.7 (46), eabj1569. doi: 10.1126/sciadv.abj1569
10
Braulik G. T. Taylor B. L. Minton G. Notarbartolo di Sciara G. Collins T. Rojas-Bracho L. et al . (2023). Red-list status and extinction risk of the world’s whales, dolphins, and porpoises. Conserv. Biol.37 (5), e14090. doi: 10.1111/cobi.14090
11
Brownell R. L. Jr. Reeves R. R. Read A. J. Smith B. D. Thomas P. O. Ralls K. et al . (2019). Bycatch in gillnet fisheries threatens Critically Endangered small cetaceans and other aquatic megafauna. Endangered Species Res.40, 285–296. doi: 10.3354/esr00994
12
Burnham K. P. Anderson D. R. (2002). Model selection and multi-model inference: a practical Information-theoretic approach. (New York: Springer).
13
Carlucci R. Manea E. Ricci P. Cipriano G. Fanizza C. Maglietta R. et al . (2021). Managing multiple pressures for cetaceans’ conservation with an Ecosystem-Based Marine Spatial Planning approach. J. Environ. Manage.287, 112240. doi: 10.1016/j.jenvman.2021.112240
14
Celine V. W. Towers J. R. Bosker T. (2021). Impacts of climate change on cetacean distribution, habitat and migration. Climate Change Ecol.1, 100009. doi: 10.1016/j.ecochg.2021.100009
15
Chen B. Y. Hong Z. Hao X. Q. Gao H. L. (2020). Environmental models for predicting habitat of the Indo-Pacific humpback dolphins in Fujian, China. Aquat. Conservation-Marine Freshw. Ecosyst.30, 787–793. doi: 10.1002/aqc.3279
16
Chen T. Hung S. K. Qiu Y. Jia X. Jefferson T. A. (2010). Distribution, abundance, and individual movements of Indo-Pacific humpback dolphins (Sousa chinensis) in the Pearl River Estuary, China. Mammalia74, 117–125. doi: 10.1515/mamm.2010.024
17
Chen M. Song Y. Qin D. (2016b). “Modeling potential distribution of Indo-Pacific humpback dolphins (Sousa chinensis) in the Beibu Gulf, China”. doi: 10.7287/PEERJ.PREPRINTS.2101V1
18
Chen X. Wang X. Chen Y. (2014). Temporal variation analysis on remote sensing parameters of water quality in red tide water. Remote Sens. Inf.29, 88–93. doi: 10.3969/j.issn.1000-3177.2014.03.016
19
Chen J. Wang H. Zhang L. Jeppesen E. Xie P. (2024). A new window for conservation biogeography. Innovation Geosci.2 (1), 100052. doi: 10.59717/j.xinn-geo.2024.100052
20
Chen B. Xu X. Jefferson T. A. Olson P. A. Qin Q. Zhang H. et al . (2016a).“Conservation status of the indo-pacific humpback dolphin (Sousa chinensis) in the northern beibu gulf, China,” in Advances in Marine Biology73, 119–139. doi: 10.1016/bs.amb.2015.10.001
21
Chen B. Zheng D. Yang G. Xu X. Zhou K. (2009). Distribution and conservation of the Indo-Pacific humpback dolphin in China. Integr. zoology4, 240–247. doi: 10.1111/j.1749-4877.2009.00160.x
22
Di Marco M. Santini L. (2015). Human pressures predict species’ geographic range size better than biological traits. Global Change Biol.21, 2169–2178. doi: 10.1111/gcb.12834
23
Ding Q. Shan X. Jin X. Gorfine H. (2021). A multidimensional analysis of marine capture fisheries in China’s coastal provinces. Fisheries Sci.87, 297–309. doi: 10.1007/s12562-021-01514-9
24
Dormann C. Elith J. Bacher S. Buchmann C. Carl G. Carré G. et al . (2013). Collinearity: A review of methods to deal with it and a simulation study evaluating their performance. Ecography36, 27–46. doi: 10.1111/j.1600-0587.2012.07348.x
25
Elith J. Kearney M. Phillips S. (2010). The art of modelling range-shifting species. Methods Ecol. Evol.1, 330–342. doi: 10.1111/j.2041-210X.2010.00036.x
26
Elith J. Phillips S. J. Hastie T. Dudik M. Chee Y. E. Yates C. J. (2011). A statistical explanation of MaxEnt for ecologists. Diversity Distributions17, 43–57. doi: 10.1111/j.1472-4642.2010.00725.x
27
Geng R. Liu X. Lv X. Hu X. (2023). Spatial-temporal variation of marine fishing activities responding to policy and social events in China. J. Environ. Manage.348, 119321. doi: 10.1016/j.jenvman.2023.119321
28
Grueber C. E. Nakagawa S. Laws R. J. Jamieson I. G. (2011). Multimodel inference in ecology and evolution: challenges and solutions. J. Evolutionary Biol.24, 699–711. doi: 10.1111/j.1420-9101.2010.02210.x
29
Guo L. Luo D. Yu R.-Q. Zeng C. Huang N. Wang H. et al . (2022). Habitat decline of the largest known Indo-Pacific humpback dolphin (Sousa chinensis) population in poorly protected areas associated with the hypoxic zone. Front. Mar. Sci.9. doi: 10.3389/fmars.2022.1048959
30
Huang S. L. Peng C. W. Chen M. Wang X. Y. Jefferson T. A. Xu Y. H. et al . (2019). Habitat configuration for an obligate shallow-water delphinid: The Indo-Pacific humpback dolphin, Sousa chinensis, in the Beibu Gulf (Gulf of Tonkin). Aquat. Conservation-Marine Freshw. Ecosyst.29, 472–485. doi: 10.1002/aqc.3000
31
Huang S. L. Wang X. Y. Wu H. P. Peng C. W. Jefferson T. A. (2022). Habitat protection planning for Indo-Pacific humpback dolphins (Sousa chinensis) in deteriorating environments: Knowledge gaps and recommendations for action. Aquat. Conservation: Mar. Freshw. Ecosyst.32, 171–185. doi: 10.1002/aqc.3740
32
Huang S. L. Wang C. C. Yao C. J. (2018). Habitat protection actions for the Indo-Pacific humpback dolphin: Baseline gaps, scopes, and resolutions for the Taiwanese subspecies. Aquat. Conservation-Marine Freshw. Ecosyst.28, 733–743. doi: 10.1002/aqc.2875
33
Huang W. Wen Y. Tang Z. (1978). Preliminary survey and research on sousa chinensis. J. Fudan Univ. (Natural Science)01, 105–110.
34
Hung S. K. (2012). Monitoring of marine mammals in Hong Kong waters (2011-12). (Hong Kong: The Agriculture, Fisheries and Conservation Departmentof the Hong Kong SAR Government).
35
Jefferson T. A. (2000). Population biology of the Indo-Pacific hump-backed dolphin in Hong Kong waters. Wildlife Monogr.144, 1–65.
36
Jefferson T. A. Becker E. A. Huang S. L. (2023). Influences of natural and anthropogenic habitat variables on Indo-Pacific humpback dolphins Sousa chinensis in Hong Kong. Endangered Species Res.51, 143–160. doi: 10.3354/esr01249
37
Jefferson T. A. Smith B. D. (2016). Chapter one - re-assessment of the conservation status of the indo-pacific humpback dolphin (Sousa chinensis) using the IUCN red list criteria. Advances in Marine Biology73, 1–26. doi: 10.1016/bs.amb.2015.04.002
38
John F. Weisberg S. (2019). An R companion to applied regression. doi: 10.32614/CRAN.package.car
39
Karczmarski L. Huang S. L. Wong W. H. Chang W. L. Chan S. C. Y. Keith M. (2017). Distribution of a coastal delphinid under the impact of long-term habitat loss: indo-pacific humpback dolphins off Taiwan’s west coast. Estuaries Coasts40, 594–603. doi: 10.1007/s12237-016-0146-5
40
Kearney M. Porter W. (2004). Mapping the fundamental niche: Physiology, climate, and the distribution of a nocturnal lizard. Ecology85, 3119–3131. doi: 10.1890/03-0820
41
Ko B. C. W. Ho H. H. N. Martelli P. Churgin S. M. Fernando N. Lee F. K. et al . (2022). An Indo-Pacific humpback dolphin (Sousa chinensis) severely injured by vessel collision: live rescue at sea, clinical care, and postmortem examination using a virtopsy-integrated approach. BMC Veterinary Res.18, 9. doi: 10.1186/s12917-022-03511-1
42
Kramer-SChadt S. Niedballa J. Pilgrim J. D. Schröder B. Lindenborn J. Reinfelder V. et al . (2013). The importance of correcting for sampling bias in MaxEnt species distribution models. Diversity Distributions19, 1366–1379. doi: 10.1111/ddi.12096
43
Kumar S. Stohlgren T. (2009). Maxent modeling for predicting suitable habitat for threatened and endangered tree Canacomyrica monticola in New Caledonia. J. Ecol. Natural Environ.1, 94–98.
44
Lawlor J. A. Comte L. Grenouillet G. Lenoir J. Baecher J. A. Bandara R. M. W. J. et al . (2024). Mechanisms, detection and impacts of species redistributions under climate change. Nat. Rev. Earth Environ.5, 351–368. doi: 10.1038/s43017-024-00527-z
45
Li S. Lin M. Xu X. Xing L. Zhang P. Gozlan R. E. et al . (2016). First record of the Indo-Pacific humpback dolphins (Sousa chinensis) southwest of Hainan Island, China. Mar. Biodiversity Records9, 1–6. doi: 10.1186/s41200-016-0005-x
46
Li S. H. Liu M. M. Dong L. J. Dong J. C. Wang D. (2018). Potential impacts of shipping noise on Indo-Pacific humpback dolphins and implications for regulation and mitigation: a review. Integr. Zoology13, 495–506. doi: 10.1111/1749-4877.12304
47
Li M. Wang X. X. Hung S. K. Xu Y. W. Chen T. (2019). Indo-Pacific humpback dolphins (Sousa chinensis) in the Moyang River Estuary: The western part of the world’s largest population of humpback dolphins. Aquat. Conservation-Marine Freshw. Ecosyst.29, 798–808. doi: 10.1002/aqc.3055
48
Liang C. Pauly D. (2017). Fisheries impacts on China’s coastal ecosystems: Unmasking a pervasive ‘fishing down’ effect. PloS One12, e0173296. doi: 10.1371/journal.pone.0173296
49
Lin M. L. Caruso F. Liu M. M. Lek S. Li K. Gozlan R. E. et al . (2020). Food risk trade-off in the Indo-Pacific humpback dolphin: An exploratory case study. Aquat. Conservation-Marine Freshw. Ecosyst.30, 860–867. doi: 10.1002/aqc.3280
50
Lin W. Chen S. Liu B. Zheng R. Serres A. Lin M. et al . (2024a). Survival and population size of the Indo-Pacific humpback dolphins off the eastern Leizhou Peninsula. Mar. Mammal Science. doi: 10.1111/mms.13156
51
Lin Z. L. Gao M. H. Yu X. G. Zhu Q. Yu Z. G. Wang X. Y. (2023). Modeling suitable habitats of indo-pacific humpback dolphins (Sousa chinensis) in a highly urbanized bay. Aquat. Mammals49, 148–159. doi: 10.1578/am.49.2.2023.148
52
Lin W. Karczmarski L. Zhou R. Mo Y. Guo L. Yiu S. K. F. et al . (2021). Prey decline leads to diet shift in the largest population of Indo-Pacific humpback dolphins? Integr. zoology16, 548–574. doi: 10.1111/1749-4877.12548
53
Lin M. Liu M. Dong L. Caruso F. Li S. (2022a). Modeling intraspecific variation in habitat utilization of the Indo-Pacific humpback dolphin using self-organizing map. Ecol. Indic.144, 109466. doi: 10.1016/j.ecolind.2022.109466
54
Lin M. Xing L. Fang L. Huang S.-L. Yao C.-J. Turvey S. T. et al . (2019). Can local ecological knowledge provide meaningful information on coastal cetacean diversity? A case study from the northern South China Sea. Ocean Coast. Manage.172, 117–127. doi: 10.1016/j.ocecoaman.2019.02.004
55
Lin Q. Yu S. (2018). Losses of natural coastal wetlands by land conversion and ecological degradation in the urbanizing Chinese coast. Sci. Rep.8, 15046. doi: 10.1038/s41598-018-33406-x
56
Lin W. Z. Zheng R. Q. Liu B. S. Chen S. L. Lin M. L. Liu M. M. et al . (2022c). Low survivals and rapid demographic decline of a threatened estuarine delphinid. Front. Mar. Sci.9. doi: 10.3389/fmars.2022.782680
57
Lin W. Zheng R. Liu B. Chen S. Lin M. Serres A. et al . (2022b). Ranging pattern development of a declining delphinid population: A potential cascade effect of vessel activities. J. Environ. Manage.330, 117120. doi: 10.1016/j.jenvman.2022.117120
58
Lin W. Zheng R. Xu S. Li S. (2024b). Indo-Pacific humpback dolphins face extirpation in Shantou waters. Regional Stud. Mar. Sci.77, 103641. doi: 10.1016/j.rsma.2024.103641
59
Liu W. Huang Z. (2000). Distribution and abundance of Chinese white dolphin (Sousa chinensis) in Xiamen. Acta Oceanologica Sin.22, 95–101.
60
Liu C. White M. Newell G. (2013). Selecting thresholds for the prediction of species occurrence with presence-only data. Journal of Biogeography46, 778–789. doi: 10.2307/23463638
61
Liu M. M. Lin M. L. Dong L. J. Xue T. F. Zhang P. J. Tang X. M. et al . (2020). Group sizes of indo-pacific humpback dolphins in waters southwest of hainan island, China: insights into rare records of large groups. Aquat. Mammals46, 259–265. doi: 10.1578/Am.46.3.2020.259
62
Liu M. Lin M. Tang X. Dong L. Zhang P. Lusseau D. et al . (2021). Group size of indo-pacific humpback dolphins (Sousa chinensis): an examination of methodological and biogeographical variances. Front. Mar. Sci.8. doi: 10.3389/fmars.2021.655595
63
Liu Y. Wang Z. Yang X. Wang S. Liu X. Liu B. et al . (2023). Changes in the spatial distribution of mariculture in China over the past 20 years. J. Geographical Sci.33, 2377–2399. doi: 10.1007/s11442-023-2181-z
64
Luo M. Yang W. Bai L. Zhang L. Huang J.-W. Cao Y. et al . (2024). Artificial intelligence for life sciences: A comprehensive guide and future trends. Innovation Life2, 100105. doi: 10.59717/j.xinn-life.2024.100105
65
McCauley D. J. Pinsky M. L. Palumbi S. R. Estes J. A. Joyce F. H. Warner R. R. (2015). Marine defaunation: Animal loss in the global ocean. Science347, 1255641. doi: 10.1126/science.1255641
66
McClenachan L. Ferretti F. Baum J. K. (2012). From archives to conservation: why historical data are needed to set baselines for marine animals and ecosystems. Conserv. Lett.5, 349–359. doi: 10.1111/j.1755-263X.2012.00253.x
67
McMillan S. E. Wong T. C. Hau B. C. H. Bonebrake T. C. (2019). Fish farmers highlight opportunities and warnings for urban carnivore conservation. Conserv. Sci. Pract.1, e79. doi: 10.1111/csp2.79
68
Merow C. Smith M. J. Silander J. A. (2013). A practical guide to MaxEnt for modeling species' distributions: what it does, and why inputs and settings matter. Ecography36 (10), 1058–1069. doi: 10.1111/j.1600-0587.2013.07872.x
69
Nisi A. C. Welch H. Brodie S. Leiphardt C. Rhodes R. Hazen E. L. et al . (2024). Ship collision risk threatens whales across the world’s oceans. Science386, 870–875. doi: 10.1126/science.adp1950
70
Noble M. M. Harasti D. Fulton C. J. Doran B. (2020). Identifying spatial conservation priorities using Traditional and Local Ecological Knowledge of iconic marine species and ecosystem threats. Biol. Conserv.249, 108709. doi: 10.1016/j.biocon.2020.108709
71
Pacifici M. Rondinini C. Rhodes J. R. Burbidge A. A. Cristiano A. Watson J. E. M. et al . (2020). Global correlates of range contractions and expansions in terrestrial mammals. Nat. Commun.11, 9. doi: 10.1038/s41467-020-16684-w
72
Pan C. W. Chen M. H. Chou L. S. Lin H. J. (2016). The trophic significance of the indo-pacific humpback dolphin, sousa chinensis, in western Taiwan. PloS One11, e0165283. doi: 10.1371/journal.pone.0165283
73
Pang S. E. H. Zeng Y. De Alban J. D. T. Webb E. L. (2022). Occurrence–habitat mismatching and niche truncation when modelling distributions affected by anthropogenic range contractions. Diversity Distributions28, 1327–1343. doi: 10.1111/ddi.13544
74
Parra G. J. (2006). Resource partitioning in sympatric delphinids: space use and habitat preferences of Australian snubfin and Indo-Pacific humpback dolphins. J. Anim. Ecol.75, 862–874. doi: 10.1111/j.1365-2656.2006.01104.x
75
Peng C. W. Wu H. P. Wang X. Y. Zhu Q. Jefferson T. A. Wang C. C. et al . (2020). Abundance and residency dynamics of the Indo-Pacific humpback dolphin, Sousa chinensis, in the Dafengjiang River Estuary, China. Mar. Mammal Sci.36, 623–637. doi: 10.1111/mms.12663
76
Pereira H. M. Martins I. S. Rosa I. M. D. Kim H. Leadley P. Popp A. et al . (2024). Global trends and scenarios for terrestrial biodiversity and ecosystem services from 1900 to 2050. Science384, 458–465. doi: 10.1126/science.adn3441
77
Phillips S. J. Anderson R. P. Schapire R. E. (2006). Maximum entropy modeling of species geographic distributions. Ecol. Model.190, 231–259. doi: 10.1016/j.ecolmodel.2005.03.026
78
Phillips S. J. Dudík M. (2008). Modeling of species distributions with Maxent: new extensions and a comprehensive evaluation. Ecography31, 161–175. doi: 10.1111/j.0906-7590.2008.5203.x
79
Pirotta E. Booth C. G. Costa D. P. Fleishman E. Kraus S. D. Lusseau D. et al . (2018). Understanding the population consequences of disturbance. Ecol. Evol.8, 9934–9946. doi: 10.1002/ece3.4458
80
Piwetz S. Jefferson T. A. Wursig B. (2021). Effects of coastal construction on indo-pacific humpback dolphin (Sousa chinensis) behavior and habitat-use off hong kong. Front. Mar. Sci.8. doi: 10.3389/fmars.2021.572535
81
R Core Team (2022). R: A Language and Environment for Statistical Computing. Vienna: R Foundation for Statistical Computing. https://www.R-project.org/.
82
Rodgers A. R. Kie J. G. Wright D. Beyer H. L. Carr A. P. (2016). “HRT: home range tools for arcGIS”. Version 2.0. Canada: Ontario Ministry of Natural Resources and Forestry, Centre for Northern Forest Ecosystem Research.
83
Tang X. Lin W. Karczmarski L. Lin M. Chan S. C. Y. Liu M. et al . (2021). Photo-identification comparison of four Indo-Pacific humpback dolphin populations off southeast China. Integr. zoology16, 586–593. doi: 10.1111/1749-4877.12537
84
Temple A. J. Langner U. Berumen M. L. (2024). Management and research efforts are failing dolphins, porpoises, and other toothed whales. Sci. Rep.14. doi: 10.1038/s41598-024-57811-7
85
Thomas P. Gulland F. Reeves R. R. Kreb D. Ding W. Smith B. et al . (2019). A review of electrofishing as a potential threat to freshwater cetaceans. Endangered Species Res.39, 207–220. doi: 10.3354/esr00962
86
Turvey S. T. Crees J. J. Di Fonzo M. M. I. (2015a). Historical data as a baseline for conservation: reconstructing long-term faunal extinction dynamics in Late Imperial–modern China. Proc. R. Soc. B: Biol. Sci.282, 20151299. doi: 10.1098/rspb.2015.1299
87
Turvey S. T. Risley C. L. Barrett L. A. Yujiang H. Ding W. (2012). River dolphins can act as population trend indicators in degraded freshwater systems. PloS One7, e37902. doi: 10.1371/journal.pone.0037902
88
Turvey S. T. Trung C. T. Quyet V. D. Nhu H. V. Thoai D. V. Tuan V. C. A. et al . (2015b). Interview-based sighting histories can inform regional conservation prioritization for highly threatened cryptic species. J. Appl. Ecol.52, 422–433. doi: 10.1111/1365-2664.12382
89
Wan X. Jiang G. Yan C. He F. Wen R. Gu J. et al . (2019). Historical records reveal the distinctive associations of human disturbance and extreme climate change with local extinction of mammals. Proc. Natl. Acad. Sci. U.S.A.116, 19001–19008. doi: 10.1073/pnas.1818019116
90
Wang W. (1965). Preliminary observation on the living habits of Chinese white dolphin in Xiamen Harbor. Fujian Fisheries Meeting News, 16–21.
91
Wang P. (2011). Chinese cetaceans (Beijing: Chemical Industry Press).
92
Wang X. Chen T. Li M. Wang Y. (2022). Long-term changes in habitat use of Indo-Pacific humpback dolphins (Sousa chinensis) in response to anthropogenic coastline shift in Lingding Bay of Pearl River Estuary, China. Acta Ecologica Sin.42, 2962–2973. doi: 10.5846/stxb202101070066
93
Wang Z. Leung K. M. Y. Sung Y.-H. Dudgeon D. Qiu J.-W. (2021). Recovery of tropical marine benthos after a trawl ban demonstrates linkage between abiotic and biotic changes. Commun. Biol.4, 1–8. doi: 10.1038/s42003-021-01732-y
94
Wang X. Miao X. Wu F. Yan C. Liu W. Zhu Q. (2012). Investigation on the distribution of Sousa chinensis in the coastal waters between Xiamen and the Pearl River Estuary. J. Oceanography Taiwan Strait31, 225–230. doi: 10.3969/JSSN1000-8160.2012.02.011
95
Wang X. Wu F. Ding X. Zhu Q. (2016b). Record of an Indo-Pacific humpback dolphin (Sousa chinensis) without its upper rostrum in Xiamen Bay, Fujian Province, China. New Z. J. Zoology43, 299–306. doi: 10.1080/03014223.2016.1155997
96
Wang X. Wu F. Turvey S. T. Rosso M. Tao C. Ding X. et al . (2015). Social organization and distribution patterns inform conservation management of a threatened Indo-Pacific humpback dolphin population. J. Mammalogy96, 964–971. doi: 10.1093/jmammal/gyv097
97
Wang X. Y. Wu F. X. Zhu Q. Huang S. L. (2017). Long-term changes in the distribution and core habitat use of a coastal delphinid in response to anthropogenic coastal alterations. Aquat. Conservation-Marine Freshw. Ecosyst.27, 643–652. doi: 10.1002/aqc.2720
98
Wang J. Yang Y. Yang F. Li Y. Li L. Lin D. et al . (2016a). A framework for the assessment of the spatial and temporal patterns of threatened coastal delphinids. Sci. Rep.6, 1–16. doi: 10.1038/srep19883
99
Wisz M. S. Hijmans R. J. Li J. Peterson A. T. Graham C. H. Guisan A. (2008). Effects of sample size on the performance of species distribution models. Diversity Distributions14, 763–773. doi: 10.1111/j.1472-4642.2008.00482.x
100
Wu F. (2013). Investigations on Distribution and Population Size of Chinese White Dolphin (Sousa chinensis) along the Coastal Waters of Fujian Province,people’s Republic of China (Weihai: Master, Shandong University).
101
Wu H. P. Jefferson T. A. Peng C. W. Liao Y. Y. Huang H. Lin M. L. et al . (2017). Distribution and habitat characteristics of the indo-pacific humpback dolphin (Sousa chinensis) in the northern beibu gulf, China. Aquat. Mammals43, 219–228. doi: 10.1578/Am.43.2.2017.219
102
Wu H. Li Q. Wang C. Wu Q. Peng C. Jefferson T. A. et al . (2022). Bycatch mitigation requires livelihood solutions, not just fishing bans: A case study of the trammel-net fishery in the northern Beibu Gulf, China. Mar. Policy139, 105018. doi: 10.1016/j.marpol.2022.105018
103
Wu C. W. Liu J. Jiang H. P. Meng X. Y. Chen B. Y. (2021). Suitable habitat predition for the Indo-Pacific Humpback Dolphin in Guangdong, China. North-Western J. Zoology17, 129–133.
104
Wu F. X. Wang X. Y. Ding X. H. Miao X. Zhu Q. (2014). Distribution Pattern of Indo-Pacific Humpback Dolphins (Sousa chinensis) along Coastal Waters of Fujian Province, China. Aquat. Mammals40, 341–349. doi: 10.1578/Am.40.4.2014.341
105
Wu W. Zhai F. Liu Z. Liu C. Gu Y. Li P. (2023). The spatial and seasonal variability of nutrient status in the seaward rivers of China shaped by the human activities. Ecol. Indic.157, 111223. doi: 10.1016/j.ecolind.2023.111223
106
Yan C. He F. He J. Zhang Z. (2022). The relationship between local and regional extinction rates depends on species distribution patterns. Ecography2022 (2), 1–10. doi: 10.1111/ecog.05828
107
Yang B. Deng C. (2006). Chinese white dolphins along the coast of Beibu Gulf. China Fisheries10), 70–72.
108
Yang J. Huang X. (2021). The 30 m annual land cover dataset and its dynamics in China from 1990 to 2019. Earth System Sci. Data13, 3907–3925. doi: 10.5194/essd-13-3907-2021
109
Yin Y. Zhang Y. Hu Z. Xu Y. Wang J. Wang C. et al . (2023). Quadrennial series dataset of coastal aquaculture distribution of China based on landsat images, (1990-2022). Digital J. Global Change Data Repository7, 215–224. doi: 10.3974/geodp.2023.02.10
110
Yong L. Zhang Y. Zhao L. Zeng Q. Lin L. Gao M. et al . (2023). Research advances on the ecology of Sousa chinensis. Biodiversity Sci.31, 145–160. doi: 10.17520/biods.2022670
111
Yu S. Hou X. Huan C. Mu Y. (2023). Comments on the oyster aquaculture industry in China: 1985–2020. Thalassas: Int. J. Mar. Sci.39, 875–882. doi: 10.1007/s41208-023-00558-1
112
Yuen N. L. Leung F. Chau K. T. Hung S. K. Lee S. Y. Tai A. P. K. (2025). Examining environmental factors behind the declining occurrence of dolphins in Hong Kong waters using multivariate statistical methods. Mar. pollut. Bull.213, 117655. doi: 10.1016/j.marpolbul.2025.117655
113
Zeng Q. (2021). Studies on the spatial use, communityDynamics, and reproductive ecology of indo-pacific humpback dolphins (Sousa chinensis) in jiangmen waters (Weihai: Doctor Shandong University).
114
Zeng Q. H. Lin W. Z. Dai Y. F. Zhong M. D. Wang X. Y. Zhu Q. (2020). Modeling demographic parameters of an edge-of-range population of Indo-Pacific humpback dolphin in Xiamen Bay, China. Regional Stud. Mar. Sci.40, 101462. doi: 10.1016/j.rsma.2020.101462
115
Zhang Y. Zeng Q. Turvey S. T. Zhao L. Yong L. Lu X. et al . (2025). Rapid habitat fragmentation and niche shifting of an estuarine dolphin driven by coastal urbanization. Global Ecol. Conserv.58, e03448. doi: 10.1016/j.gecco.2025.e03448
116
Zhang H. Zhong X. XIong Y. Wu X. (2023). Big data analysis of coastal illegal fishing from the perspective of compensation of ecological and environmental damage. Chin. J. Appl. Ecol.34, 2827–2834. doi: 10.13287/j.1001-9332.202310.032
117
Zhao L. Sakornwimon W. Lin W. Zhang P. Chantra R. Dai Y. et al . (2021). Early divergence and differential population histories of the Indo-Pacific humpback dolphin in the Pacific and Indian Oceans. Integr. zoology16, 612–625. doi: 10.1111/1749-4877.12527
118
Zhou L. Zeng L. Fu D. Xu P. Zeng S. Tang Q. et al . (2016). Fish density increases from the upper to lower parts of the Pearl River Delta, China, and is influenced by tide, chlorophyll-a, water transparency, and water depth. Aquat. Ecol.50, 59–74. doi: 10.1007/s10452-015-9549-9
Summary
Keywords
coastal cetaceans, local ecological knowledge, historical habitat loss, anthropogenic stressors, inshore fishery, mariculture, conservation
Citation
Yong L, Lu X, Zeng Q, Zhao L, Zhang Y and Wang X (2025) Decoding anthropogenic risk through historical baselines: a conservation prioritization framework for Chinese white dolphin in anthropogenic seascapes. Front. Mar. Sci. 12:1607234. doi: 10.3389/fmars.2025.1607234
Received
07 April 2025
Accepted
13 June 2025
Published
03 July 2025
Volume
12 - 2025
Edited by
Peijun Zhang, Chinese Academy of Sciences (CAS), China
Reviewed by
Zhigang Mei, Chinese Academy of Sciences (CAS), China
Wenjia Hu, State Oceanic Administration, China
Tao Chen, Chinese Academy of Fishery Sciences (CAFS), China
Updates
Copyright
© 2025 Yong, Lu, Zeng, Zhao, Zhang and Wang.
This is an open-access article distributed under the terms of the Creative Commons Attribution License (CC BY). The use, distribution or reproduction in other forums is permitted, provided the original author(s) and the copyright owner(s) are credited and that the original publication in this journal is cited, in accordance with accepted academic practice. No use, distribution or reproduction is permitted which does not comply with these terms.
*Correspondence: Yuke Zhang, zhangyuke@tio.org.cn; Xianyan Wang, wangxianyan@tio.org.cn
†These authors have contributed equally to this work
Disclaimer
All claims expressed in this article are solely those of the authors and do not necessarily represent those of their affiliated organizations, or those of the publisher, the editors and the reviewers. Any product that may be evaluated in this article or claim that may be made by its manufacturer is not guaranteed or endorsed by the publisher.