Abstract
With global warming, the freshwater content in the Arctic Ocean has been steadily accumulating since the 21st century, which causes notable alterations in the export of freshwater from the Arctic Ocean. This paper presents a comparative analysis of the variations in liquid freshwater transport (FWT) through Fram Strait and Davis Strait, the primary export pathways of the Arctic freshwater, spanning from 1980 to 2023. We also use reanalysis data, combined with atmospheric and sea ice data, to explore the impact of atmospheric circulation anomaly and the distribution of freshwater content in the Arctic Ocean on FWT in the straits. The research findings reveal that over the past four decades, the FWT through the straits has not exhibited the anticipated continuous growth. Instead, we observed distinct temporal shifts in regional freshwater export patterns: The FWT in Fram Strait experienced significant increase prior to the 21st century (trend of 10.14 mSv/10yr during 1980-2000), whereas the FWT in Davis Strait showed acceleration after 2000 (trend of 13.69 mSv/10yr). There are significant interannual variations in the FWT in both straits, which are linked to the intensity of Atlantic inflow in the straits. Large scale circulation has a direct impact on FWT in straits, but there are significant regional differences. In the positive phase of the Arctic Oscillation (North Atlantic Oscillation) and the negative phase of the Dipole Anomaly, the cyclonic circulation anomaly in the Arctic Ocean favors enhanced surface outflow on both sides of Greenland. This, coupled with the storage of freshwater content in the margin of Greenland, leads to an intensification of the freshwater export through the Davis Strait. The FWT through the Fram Strait remains uncertain due to conflicting trends of increased outflow and decreased freshwater content. It can be determined that the FWT in Fram Strait is related to the upstream FWC, buffered by the accumulation of freshwater in northern Greenland. Furthermore, the ongoing Atlantic inflow warming against the backdrop of the Atlantic Multidecadal Oscillation phase transition results in sea ice melting in the Arctic Ocean in the long term, thereby increasing the freshwater content on both sides of Greenland and tending to boost the freshwater export through the straits.
1 Introduction
The freshwater (FW) export from the Arctic Ocean is closely related to the evolution of ocean water masses and circulation in the Arctic Ocean, as well as changes in sea ice. The high-latitude FW entering the North Atlantic is not only an important factor for water exchange between the Arctic Ocean and the North Atlantic (Aagaard and Carmack, 1989), but also has a significant impact on the properties of water masses in the subpolar North Atlantic (Haine et al., 2015), especially on the oceanic convection in the Labrador Sea, which is an important physical process driving the Atlantic Meridional Overturning Circulation (AMOC) and affecting global climate.
Recently, great transitions have taken place in the Arctic FW system. Especially since the International Polar Year (2007-2008), the observed data have increased significantly, and long-term observations of changes of FW in the Canadian Arctic Archipelago (CAA) and the Nordic Sea have been obtained (Haine et al., 2015). Due to the response to global warming, the decline of the Arctic sea ice has led to the freshening of the Arctic, which leads to the larger reserves of FW in the Arctic Ocean (Li and Fedorov, 2021). As the largest FW reservoir in the Arctic Ocean, the freshwater content (FWC) in Beaufort Gyre increased by about 25% in the first 10 years of the 21st century compared with 1980-2000 (Proshutinsky et al., 2019). The continuous increase of FW reserves in the Arctic Ocean may bring out significant release of FW, which has prompted the Arctic freshwater transport (FWT) to receive great attention in the past decades (McPhee et al., 2009; Rabe et al., 2014; Haine et al., 2015). According to the results of sporadic observations and combined models in the 20th century, the total FWT in the Arctic Ocean is mainly determined by the liquid FWT (35%) in the CAA, the sea ice (25%) and the liquid FWT (26%) in the Fram Strait (Serreze et al., 2006). Since the 21st century, the transport intensity and route of FW are changing (Haine et al., 2015).
The western Fram Strait is an important pathway for FWT, exporting liquid FW and sea ice from the central Arctic. In 1989, for the first time, researchers gave the average value of FW export of Fram Strait as 37mSv (1 mSv=10–3 Sv=103 m³/s) through hydraulic observation, and the reference salinity was 34.8 (Aagaard and Carmack, 1989). During the period from 1998 to 2011, further research showed that the southward average FWT from 10.6° W to 4° E in the Fram Strait was 100 ± 23 mSv, and due to the increased contribution of Pacific inflow, a maximum FW flux of 124 mSv was observed in the summer of 2011, with no obvious trend characteristics throughout the entire period (Rabe et al., 2013). With the joint establishment of the Arctic Outflow Observatory by the Norwegian Polar Institute and Alfred Wegener Institute, scholars have for the first time provided a continuous observation sequence of FWT on a decadal scale in the Fram Strait. Research has shown that the annual average southbound FWT of the East Greenland Current remains stable at 66 mSv from 1997 to 2008 (de Steur et al., 2009). With the further maintenance of the observation system, the timeseries of FWT in the Fram Strait has been extended. Scholars have observed that the FW export from the Fram Strait has significant interannual variation characteristics, and its seasonal cycle is related to the sea level pressure (SLP) across Fram Strait (de Steur et al., 2018). There was a significant positive FWT anomaly between 2010–2015 and 2003-2009. After 2016, the FWT has significantly decreased (de Steur et al., 2018; Karpouzoglou et al., 2022).
The most important pathway for liquid FW export from the Arctic Ocean is via the CAA (Haine et al., 2015). It is difficult to uniformly assess the FWT through the CAA, results of a single strait in the CAA cannot represent the total FWT of the western pathway. The Davis Strait, located in the south of Baffin Bay, almost contains all the FW export from the CAA (Serreze et al., 2006; Carmack et al., 2016), so the FWT through Davis Strait can provide another measurement method for the FWT on the west side of Greenland. From 2004 to 2010, the average net southward FWT in Davis Strait was 93 ± 6 mSv (Curry et al., 2014). Compared with the results from 1987 to 1990 (Cuny et al., 2005), the net southward FWT in the central deep-water area decreased by 26% (from 142 mSv to 105 mSv). However, the results of model simulation show that since 2000, the sea level decline in the subpolar North Atlantic has led to a significant increase in the FWT through the Davis Strait, and even an extreme output event occurred in 2015-2017 (Wang et al., 2022). Other reference data are shown in Table 1.
Table 1
| Section | FWT (mSv) | Period | References | Notes |
|---|---|---|---|---|
| Fram Strait |
65 | 1948-2002 | Karcher et al. (2005) | Model Result |
| 37 | / | Aagaard and Carmack (1989) | Sref=34.9 | |
| 63-95 | 1997,1998 | Meredith et al. (2001) | / | |
| 78 | 1990s | Karcher et al. (2005) | / | |
| 80 | 1998, 2004, 2005 | Rabe et al. (2009) | / | |
| 100 | 1998-2011 | Rabe et al. (2013) | / | |
| 66 | 1997-2008 | de Steur et al. (2009) | / | |
| 60 | 2003-2009 |
de Steur et al. (2018)
Karpouzoglou et al. (2022) |
Arctic Outflow Observatory | |
| 75 | 2009-2015 | |||
| 57 | 2015-2019 | |||
| 66 | 2003-2019 | |||
| Canadian Arctic Archipelago | 88-111 | 1998-2000 | Prinsenberg and Hamilton (2005) | Lancaster Sound |
| 32 | 1998-2011 | Peterson et al. (2012) | Lancaster Sound | |
| 123 | 1968-2007 | Wekerle et al. (2013) | / | |
| 32 | 2003-2006 | Münchow (2016) | Nares Strait | |
| 54 | 2007-2009 | |||
| Davis Strait |
92 | 1987-1990 | Cuny et al. (2005) | / |
| 101 | 1980-2000 | Serreze et al. (2006) | / | |
| 116 | 2004-2005 | Curry et al. (2011) | Davis Strait Observing System | |
| 93 | 2004-2010 | Curry et al. (2014) |
Average estimates of liquid FWT computed with respect to a reference salinity of 34.80.
FWT, freshwater transport.
Large scale circulation is an important factor that affects the ocean circulation in the Arctic Ocean, and then affects FW export. The two primary characteristics of the Arctic Ocean upper ocean circulation are the remarkable anticyclone circulation in the Canadian Basin where the FW reservoir is located under the control of the Beaufort High, and the Transpolar Drift that transports FW from the Siberian continental shelf to the Fram Strait (Rudels et al., 2012; Bertosio et al., 2022) (Figure 1A). During the cyclonic circulation anomaly, the reduced SLP over the central Arctic Ocean drives surface divergence. This increases the FWC near the ocean margins and enhances FW export of the Arctic via FW pathways. On the contrary, anticyclonic circulation anomalies, typically associated with a strong Beaufort High, elevate the central Arctic SLP. This promotes surface convergence and freshwater convergence, thereby increasing freshwater storage within the Arctic Ocean and reducing southward FWT (Proshutinsky et al., 2015; Cornish et al., 2020). The stronger Beaufort high can strengthen the anticyclone circulation, strengthen Ekman convergence and increase FW reserves; the weaker Beaufort high will lead to the relaxation of the anticyclone circulation, thus allowing FW to be released from the Beaufort Gyre (Timmermans and Toole, 2023). Model based studies have shown that the interannual variability of FWT in Fram Strait is strongly influenced by these two Arctic circulations (Proshutinsky and Johnson, 1997; Karcher et al., 2005; Jahn et al., 2010). The FW export from the Canadian Arctic Archipelago is predominantly governed by the pressure gradient between the Beaufort Gyre and the northern Baffin Bay (Prinsenberg and Hamilton, 2005; Wekerle et al., 2013; Wang et al., 2017), whereas high-frequency variations are wind-driven (Peterson et al., 2012). Furthermore, there exists a correlation between large-scale circulation patterns, specifically the North Atlantic Oscillation, and the transmission through the CAA (Jahn et al., 2009). The influence of sea ice cover results in differing effects of surface stress on FW export across various straits within the CAA (Grivault et al., 2018). The melting of sea ice closely impacts the Arctic water component within the FW composition of Davis Strait (Azetsu-Scott et al., 2012).
Figure 1
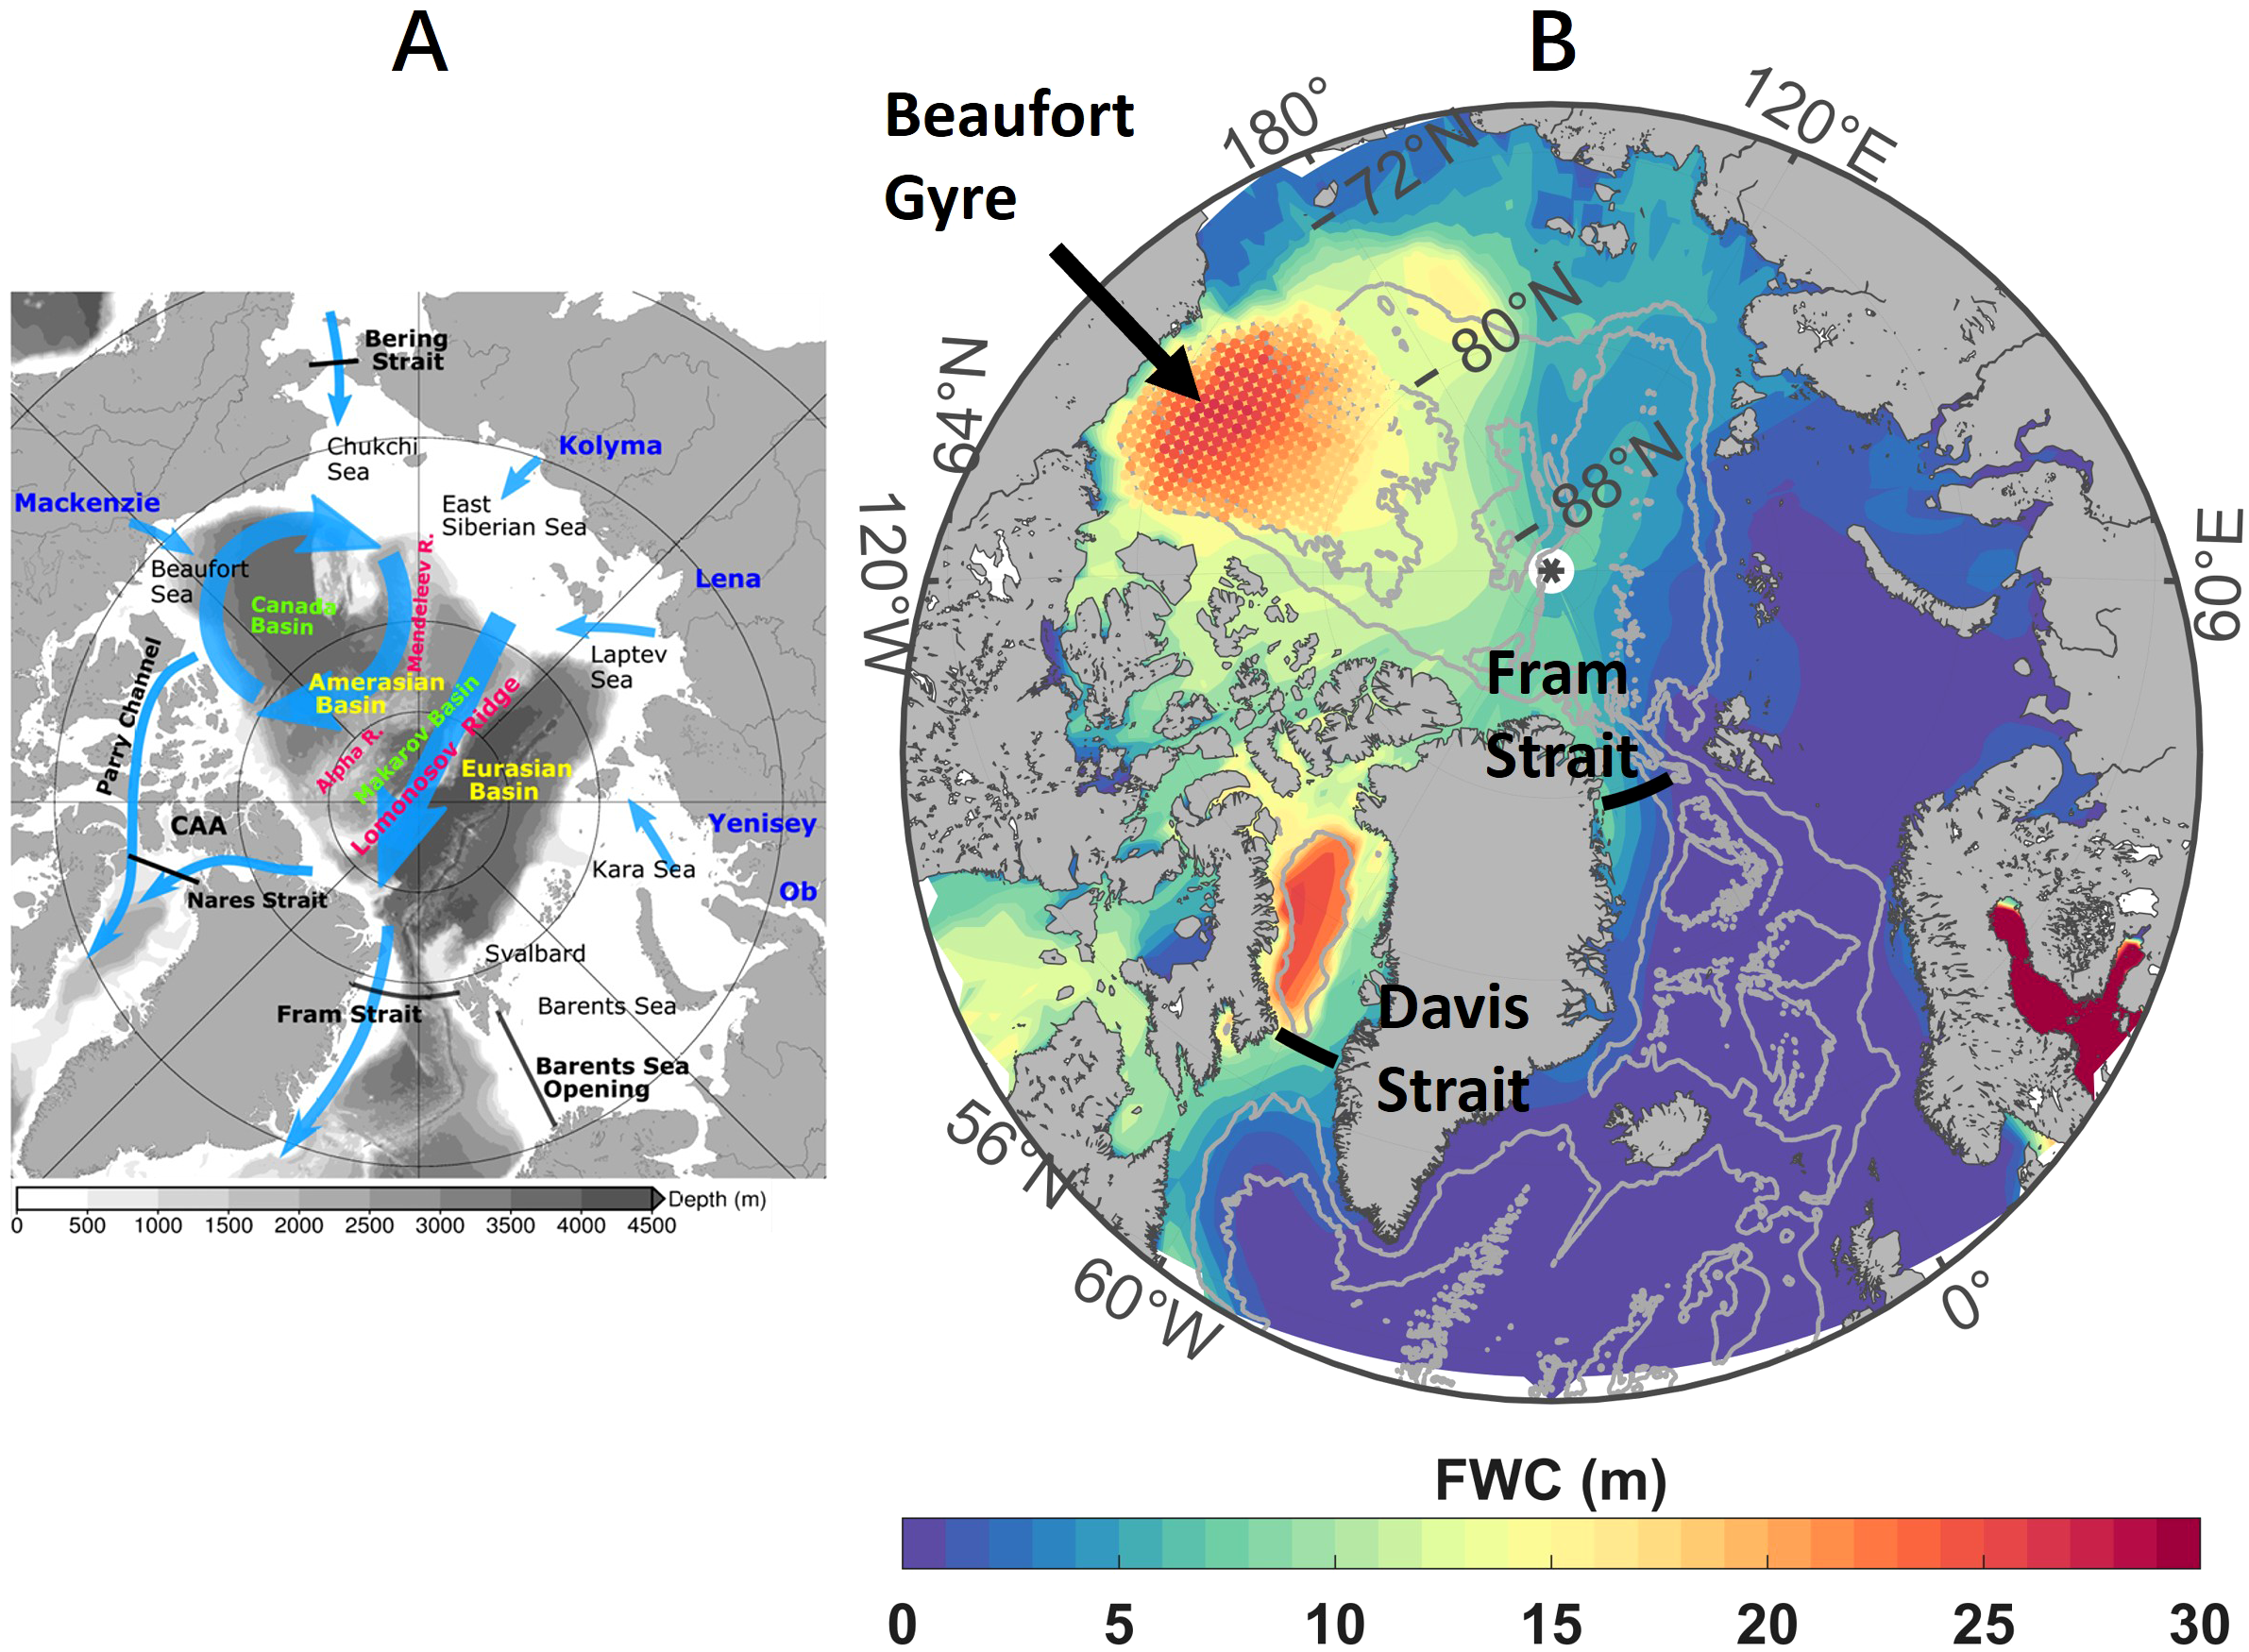
(A) Schematic of Arctic upper ocean circulation (blue arrows), extracted from (Wang et al., 2021), licensed CC BY 4.0. (B) The climatological FWC calculated by reanalysis data in the Arctic Ocean (shaded map), FWC observed by Beaufort Gyre Exploration Project (BGEP) (scatter plot) and location of Fram Strait and Davis Strait (black line). The gray contours show the 1000 and 3000 m isobaths. FWC, freshwater content.
While recent observational advances have significantly improved understanding of liquid FWT variability in Arctic gateways, long-term FWT of the critical path in eastern and western Greenland still needs continuous attention. The mechanisms governing the different FW export regimes need to be further investigated and supported by extended data records., and the impacts causing the different FW export from both sides of Greenland deserve detailed study. In this paper, we calculated the liquid FWT estimates of the main strait sections since 1980 based on the reanalysis data, and supplemented the lack of continuity of existing observation data and nonuniform reference planes. In order to compare the variation of FWT on the two pathways, the same reference salinity was used in this study to calculate the southward FWT through the straits. According to the results, the long-term trend and interannual variation of liquid FWT are given, and the main factors affecting the FWT through the two straits are discussed.
2 Data and methods
2.1 Data
This study utilizes multiple atmospheric and oceanic reanalysis datasets to quantify liquid FWT and investigate associated atmospheric drivers across the two major Arctic outflow gateways: Fram Strait and Davis Strait. The distribution of research area and data is shown in Figure 1B.
The reanalysis freshwater content of Beaufort Gyre Exploration Project (BGEP) was used to characterize the FWC of Beaufort gyre, which is calculated by CTD, XCTD and UCTD profiles collected from July to October every year (McPhee et al., 2009).
The monthly average reanalysis salinity of the EN4 quality controlled ocean data provided by the Met Office Hadley Centre (Good et al., 2013) has a good performance in assessing the interannual variation of salinity in the North Atlantic (Holliday et al., 2020). In this paper, the monthly mean salinity of EN.4.2.2 from 1980 to 2023 is selected (Download on February 26th, 2025) to calculate the FWC of the Arctic Ocean and FWT in straits. The calculation results from different datasets were compared on a basic level, and it was found that the combination of SODA and EN4 had a stronger ability to characterize FWT variations. (See Supplementary Tables 1, 2).
This paper compute FWT with the monthly average velocity data from SODA (Simple Ocean Data Assimilation, version 3.15.2, download on February 27th, 2025) spanning from 1980 to 2023 (Carton et al., 2018) and salinity from EN4.2.2. The reanalysis velocity is accessible via Ocean Climate Lab. To calculate the data we need, the salinity is interpolated in the vertical direction according to the velocity grid.
We also use sea ice motion and sea ice concentration (SIC) from 1980 to 2023, which are provided by the National Snow and Ice Data Center (NSIDC), to analyze the changes in surface circulation and sea ice under the background of atmospheric circulation anomalies. This dataset utilizes passive microwave brightness temperature and integrates two inversion algorithms, NASA Team and NASA Bootstrap, to provide a continuous variation sequence of sea ice (Peng et al., 2013). The SIC integrates data from multiple sensors including SSMR, SSM/I, and SSMI/S. The sea ice drift field is assimilated from multiple satellite remote sensing data including AVHRR, 0SMMR, and SSM/I, as well as measured data from the International Arctic Buoy Program (IABP) (Meier and Ivanoff, 2017).
The Arctic Oscillation (AO) index and North Atlantic Oscillation (NAO) index are derived from Climate Prediction Center, while the Dipole Anomaly (DA) index is obtained through empirical orthogonal function decomposition based on monthly SLP derived from ERA5 monthly mean data on single levels (Hersbach et al., 2023) by following the approach of Wu et al. (2006) (see Supplementary Figure 1). Data can be downloaded from Climate Data Store for free. The Atlantic Multi-decadal Oscillation (AMO) Index Data is provided by the Climate Analysis Section, NCAR, Boulder, USA (Trenberth and Shea, 2006) and can be retrieved from https://climatedataguide.ucar.edu/climate-data/atlantic-multi-decadal-oscillation-amo (Accessed on March 13th,2025).
2.2 Methods
This study calculated the liquid freshwater transport (FWT) and freshwater content (FWC)
where Sref is the reference salinity, zr is the depth of Sref, z0 is the ocean surface, s and v are the salinity and horizontal velocity normal to the section of the grid points. We use southward velocity to calculate FWT, so the value of which is consistent with FW export (positive south). FWT refers to the volume transport of pure water per unit of water column (Equation 1); FWC refers to the amount of pure water that can be extracted from a unit of water column (Equation 2). The reference salinity often selects the average salinity of the study area (Aagaard and Carmack, 1989), and some scholars have also used the average salinity of 34.9 in the North European Sea in the calculation of FWT through the Fram Strait (de Steur et al., 2009, 2018). Different reference salinities often have little effect on the variation characteristics of FWT. This study mainly focuses on the variation characteristics of liquid freshwater export through freshwater channels, so positive FWT is equal to FW export. In order to unify the standard, 34.8 psu was selected as the reference salinity following Proshutinsky et al. (2009).
The FWT can be decomposed into time-mean and time-varying components (Jahn et al., 2010). The time-varying components consists of (1) anomalies in velocity with V; (2) anomalies in salinity with S; and (3) their coupled variations (de Steur et al., 2018). The various components of FWT can be represented by the following equation
where brackets ⟨ ⟩ represent the time-mean and primed variables ‘ the temporal anomalies.
In addition, this paper also uses wavelet analysis and Composite analysis to carry out processing on FWT.
3 Results
3.1 Seasonal cycle and temporal trends
This study quantifies FWT variability in Fram and Davis Strait, beginning with an analysis of seasonal cycles and the distinct contribution of velocity (V) and salinity (S) anomalies (Equation 3) via Reynolds decomposition (Figure 2). The mean seasonal cycle of FWT in both Fram Strait and Davis Strait exhibits consistent phasing, characterized by minima in spring (May in Fram Strait; April in Davis Strait) and maxima in autumn (November in Fram Strait; October in Davis Strait). This seasonality is primarily governed by FWT~S anomalies. In Fram Strait, the maximum contribution of FWT~S can reach 20 mSv, which is more than twice the maximum FWT~V and in the Davis Strait is even greater, reaching up to 28 mSv. Seasonal variations of FWT~S aligns with sea ice dynamics: the sea ice area and volume in the Arctic Ocean are at their minimum in September and at their maximum from November to March of the following year (Li and Fedorov, 2021), suggesting meltwater is related to salinity-driven export. The sea ice melt water in the Arctic Ocean will reach the straits in a few months, thus increasing the FW in the straits.
Figure 2
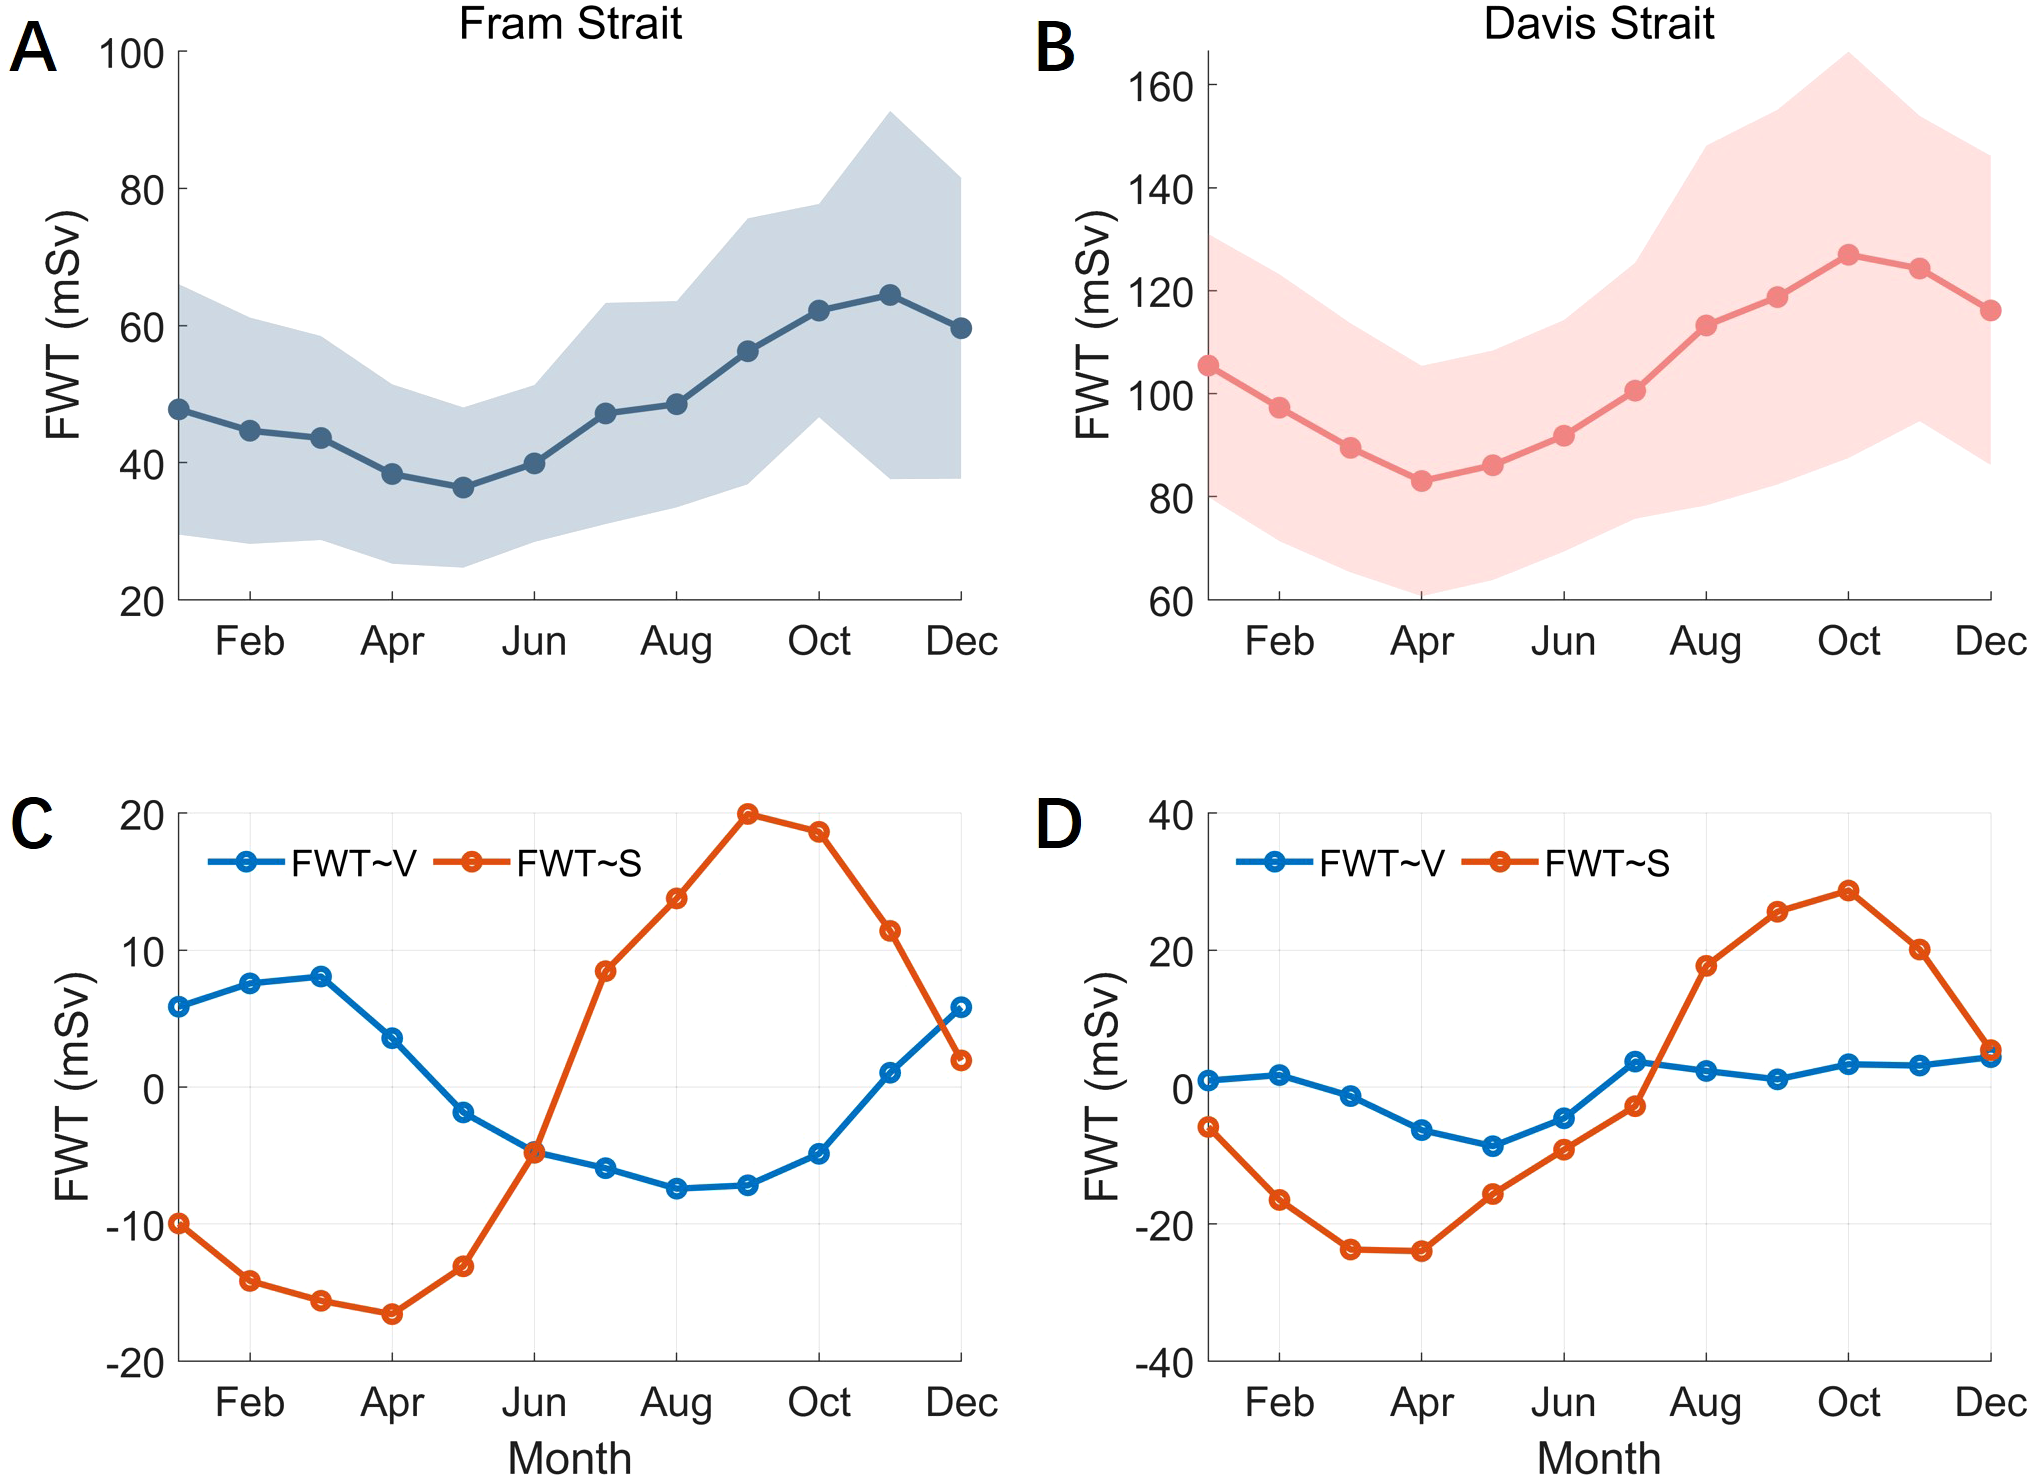
Mean seasonal cycle of FWT in Fram Strait (A) and Davis Strait (B), the filling area is standard deviation. The contribution of Velocity and Salinity in FWT anomaly in Fram Strait (C) and Davis Strait (D). FWT, freshwater transport.
The yearly FWT and time-varying components in the straits are shown in Figure 3, with the black line indicating the linear fitting results obtained around the year 2000. Simultaneously, this paper presents the long-term trend table of FWT and their time-varying components across the straits (Table 2). Since 1980, the annual FWT through Fram Strait and Davis Strait has increased at rates of 3.13 mSv/decade and 4.33 mSv/decade, respectively. These trends are statistically insignificant (p>0.05) and substantially smaller than interannual variability, represented by standard deviations of 10.68 mSv (Fram) and 19.52 mSv (Davis). In fact, the weak upward trends over the past 43 years are related to significant differences in trends around 2000. The FWT in the Fram Strait increased significantly from 1980 to 2000, about 10.14 mSv/10yr, while FWT in the Davis Strait has increased significantly since 2000, about 13.69 mSv/10yr. In the corresponding time period, the trends of FWT between the two straits are not significant. The significant difference between the FWT during two time periods weakens the trends of long-term changes in the straits.
Figure 3
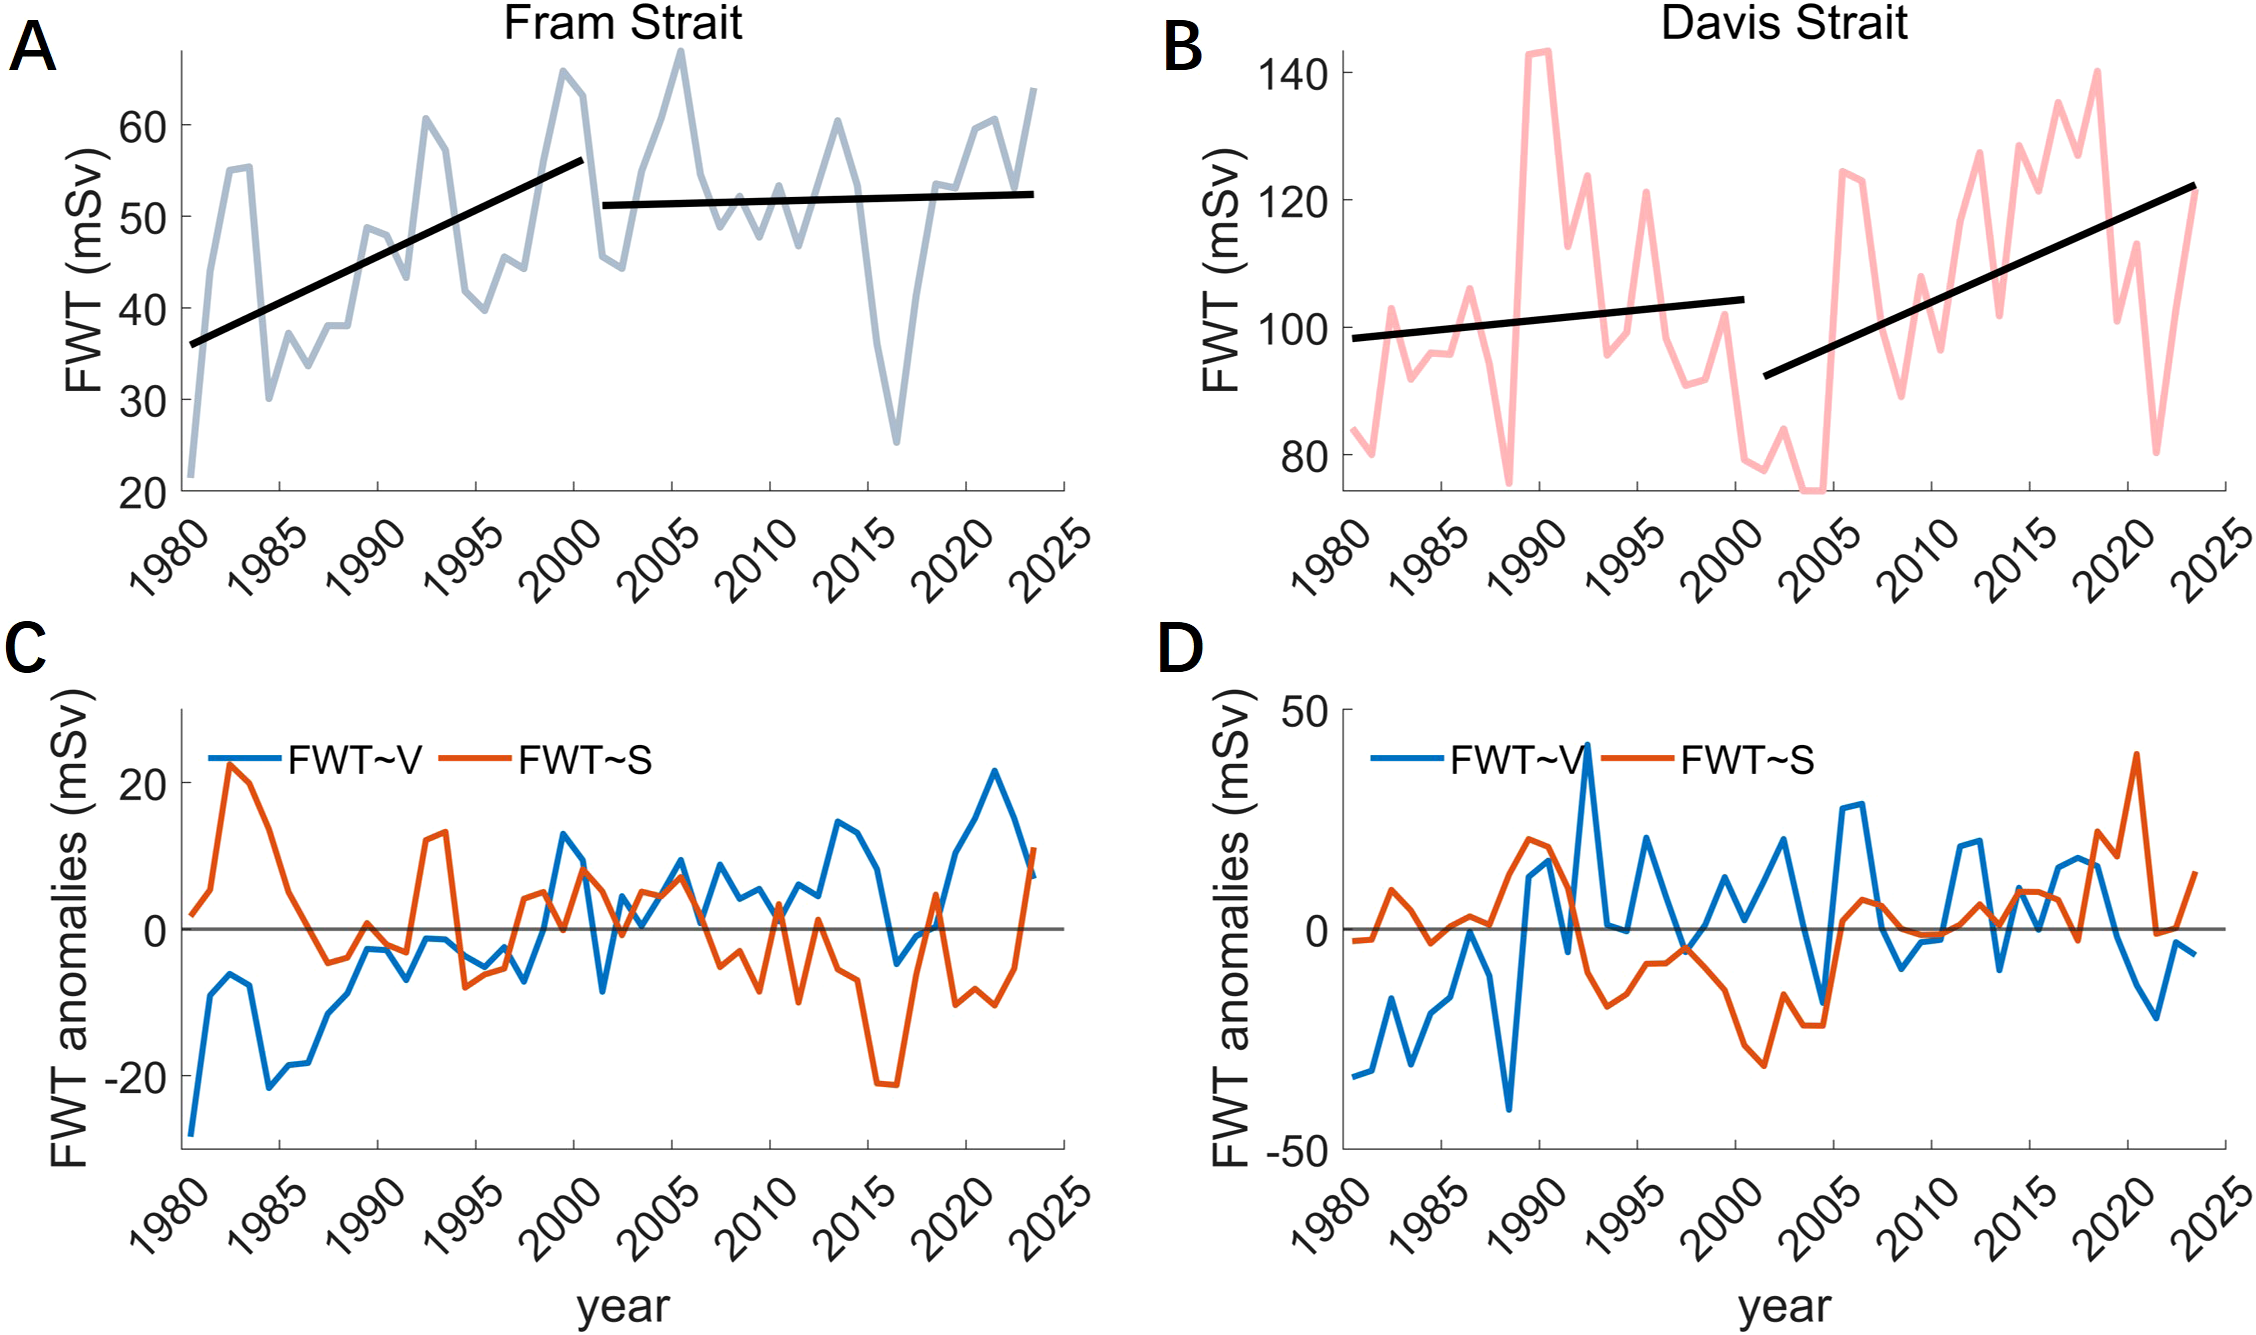
Yearly FWT through Fram Strait (A) and its time-varying components in velocity and salinity (C). The same as (B, D) but for FWT in Davis Strait. Black lines are linear trends. FWT, freshwater transport.
Table 2
| Section/Basin | Components | 1980-2000 | 2001-2023 | 1980-2023 |
|---|---|---|---|---|
| Fram Strait | FWT | 10.14 | 0.55 | 3.13 |
| FWT~V | 11.82 | 5.04 | 6.38 | |
| FWT~S | -4.62 | -4.52 | -3.58 | |
| Davis Strait | FWT | 3.07 | 13.69 | 4.33 |
| FWT~V | 20.66 | -6.84 | 4.27 | |
| FWT~S | -10.3 | 15.32 | 2.34 | |
| Canada Basin | FWC | -0.65 | 1.07 | 0.41 |
| Eurasian Basin | FWC | -0.88 | -0.21 | -0.45 |
Contrasting trends of FWT, time-varying components of FWT in straits and the trend of FWC in the Arctic Ocean basins during 1980 to 2023 (units: FWC, m/10yr; FWT or FWT anomalies, mSv/10yr).
FWT, freshwater transport; FWC, freshwater content.
Although there are obvious differences in the contributions of V and S on the seasonal scale of FWT, the FWT~V and FWT~S on the interannual variation scale are equivalent, usually exceeding ±20 mSv (Fram Strait) and ±30 mSv (Davis Strait). The growth trend of FWT in Fram Strait is mainly related to the contribution of velocity anomaly (Karpouzoglou et al., 2024), especially the trend of FWT~V components from 1980 to 2000 is 11.8mSv/10yr, but the contribution of salinity is a negative trend. Large anomalies in FWT are typically associated with salinity anomalies, with FWT~S in 2016 reaching up to 23 mSv (22 mSv). In 1982, despite the negative FWT component in velocity, the FWT still exhibited a positive anomaly (6 mSv) due to a significant positive anomaly from the salinity component (22 mSv). The upward trend of FWT from 2000 to 2023 in Davis Strait is mainly related to the contribution of salinity anomalies, especially the trend of FWT~S component since 2000 is 15.3 mSv/10yr, while the contribution of trend in V is reflected before 2000, which is 20.7 mSv/10yr. This indicates that the contribution of velocity and salinity anomalies to FWT in Davis Strait are equally important.
Changes of temperature and salinity structure in the strait section is the basis of determining FW export. The decadal evolution of thermohaline properties in the Arctic gateways are shown in Figure 4. The main water masses in the Fram Strait are divided into low-temperature and low salinity polar water (PW; θ<0°C, S<34.8) and the high temperature and high salinity Atlantic Water (AW; θ>0°C) that enters the Arctic Ocean northward. According to the T-S diagram (Figures 4A, C), Polar and Atlantic Waters in the Fram Strait exhibited negligible long-term salinity changes but persistent warming since 2000. The intensity of the Atlantic inflow can affect FW export by affecting the intensity of polar water. The extreme low anomaly of FWT in 2016 is the result of the significant strengthening of the Atlantic water: the high-temperature water mass at 4°C can reach the position of 5°E (Figure 4C), which greatly compresses the salinity of PW so that the FWT~S decreased. The Davis Strait has similar water mass structure to the Fram Strait, which can be divided into the outflow of Arctic Water (AW: θ ≤ 2°C, S ≤ 33.7) and Transitional Water (TrW: θ>2°C, S>33.7) and the inflow of West Greenland Irminger Water (WGIW: θ>2°C, S>34.1) and West Greenland Shelf Water (WGSW; θ<7°C, S<34.1), while the transitional water is mainly the product of local adjustment and mixing of Atlantic water entering Baffin Bay and Arctic water flowing out of Baffin Bay. For a long time, the Davis Strait water mass has shown characteristics of warming and weakening, with the most significant warming occurring in the 2010s (Figures 4B, D). The FWT through the Davis Strait saw several unusually high peaks in 1990s, reaching approximately 143mSv (Cuny et al., 2005). In the process of continuous warming at the end of the 20th century, the abnormal weakening of the Atlantic inflow led to surface freshening, which resulted in a significant FWT~S.
Figure 4
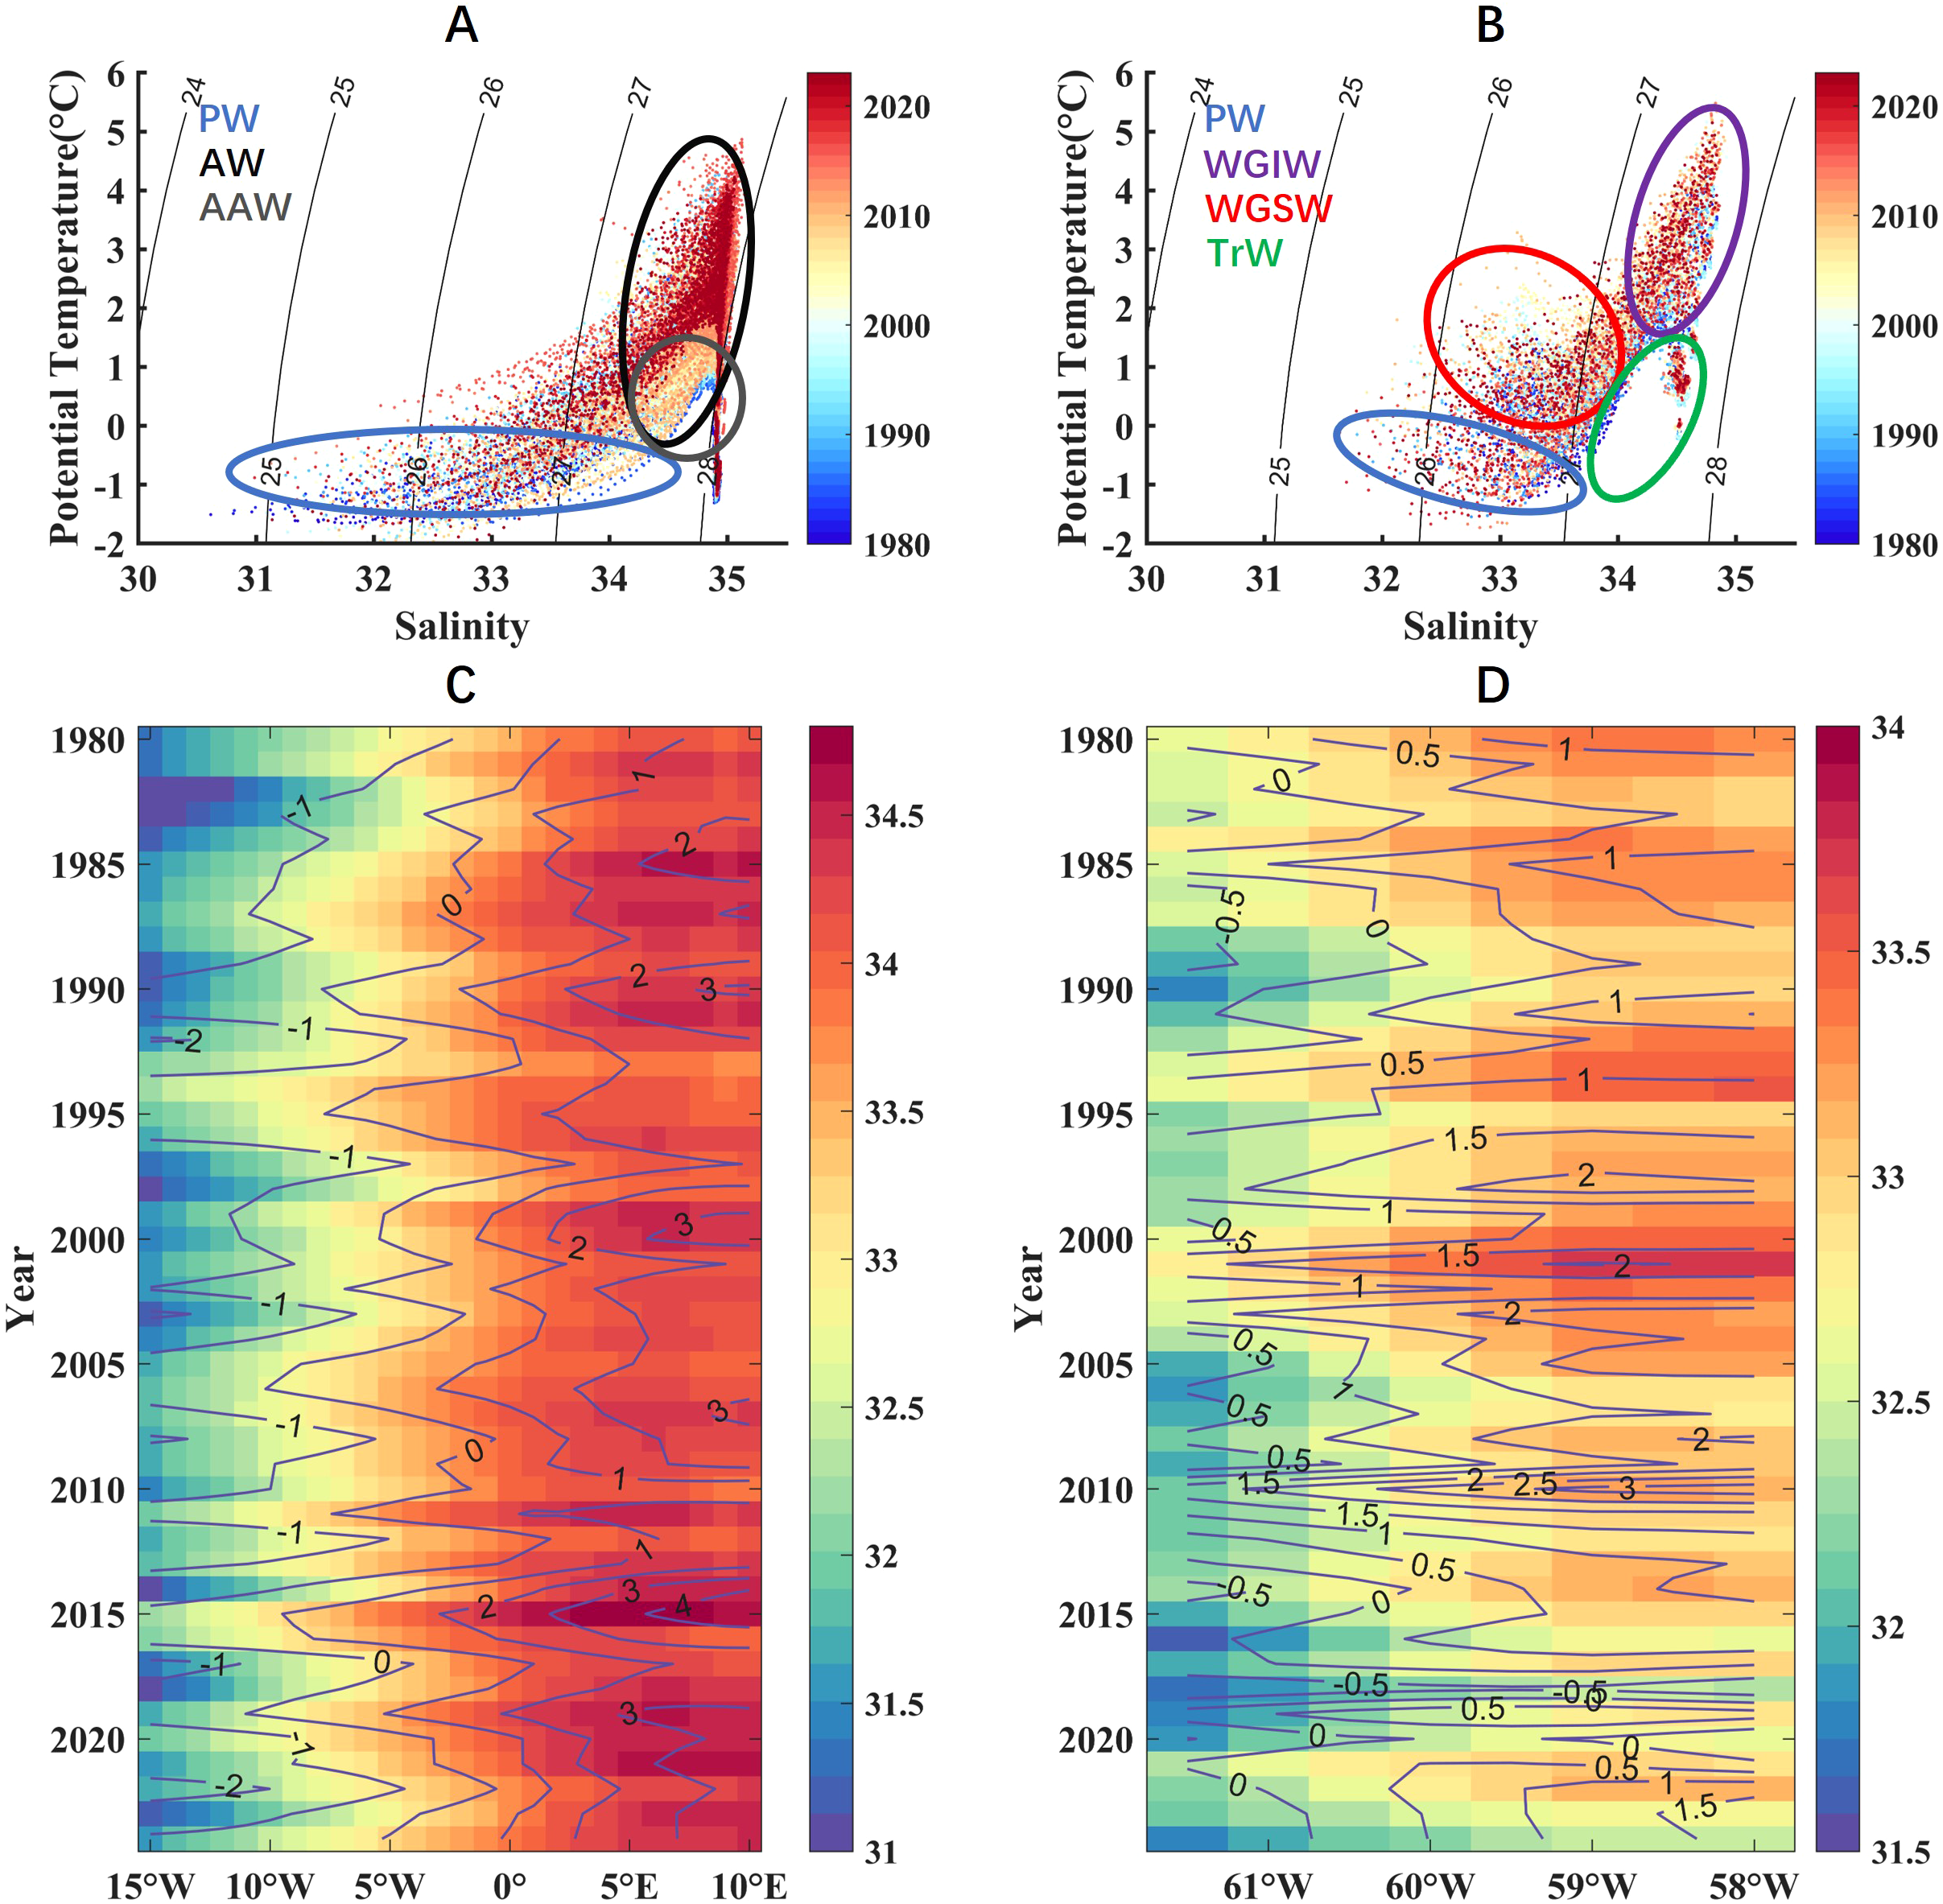
Decadal evolution of thermohaline properties in the Arctic gateways. Temperature-salinity diagrams in Fram Strait (A) and Davis Strait (B). Hovmöller Diagram of Salinity (color shading) and Potential Temperature (contour line) in Fram Strait (C) and Davis Strait (D) during 1980 to 2024.
3.2 Interannual variability characteristics
According to the above analysis, we found that under the background of the continuous accumulation of FW, the FWT in straits did not show the expected continuous increase trend, but the annual variation characteristics in both straits were significant. In order to avoid the impact of the monthly average anomaly and seasonal cycle on the assessment of interannual change, we conducted Savitsky-Golay filter on the monthly anomaly of FWT for many years, which filtered out the seasonal change and high-frequency change characteristics within 18 months (Figure 5). The mean FWT of filtered timeseries in Davis Strait is about 104 mSv, which is almost twice the size of that in Fram Strait (49 mSv). From 1980 to 2000, the FWT in Fram Strait showed an upward trend, however, the largest before actually occurred in the autumn of 1992 (September to November), about 70 mSv, and the largest in the early 1980s was about 65 mSv. There was no significant numerical change in FWT on decadal scale. Since the 21st century, the interannual variability of FWT in Fram Strait has become more pronounced. Firstly, it increased from a low value for a short time (2000-2006), followed by a low value (49 mSv) in 2007-2011, a high value in 2012-2015, and a significant decline in FWT after 2015 (Bertosio et al., 2022; Karpouzoglou et al., 2022). Since 2018, the FWT of the Fram Strait has increased, and with significant seasonal changes, the maximum FWT in September 2023 can reach 73 mSv (the maximum monthly FWT is 135 mSv). The significant interannual variation of FWT in Davis Strait mainly occurred before 2000. Compared with the 1990s, the FWT in the Davis Strait significantly weakened in the first decade of the early 21st century (Cuny et al., 2005; Curry et al., 2014), which decreased from 173 mSv to about 95 mSv (the average of 93 mSv from 2004 to 2010 in Curry’s research results). This is mainly related to the changes in cross section velocity and water mass area, where the Arctic water transported to the Labrador Sea has significantly decreased (Curry et al., 2014). The timeseries of FWT components in the above also proves this point. In the 1990s, the contribution of velocity and salinity to FWT were both large positive values, and at the beginning of the 21st century, they were both small values. Compared with the Fram Strait, the FWT in the Davis Strait has a greater interannual variation. In the 1990s, around 2007 and 2017, the FWT in the Davis Strait were 70 mSv, 33 mSv and 50 mSv higher than the overall average (about 104 mSv), which is equal to or even more than the maximum FWT difference of 35 mSv in the Fram Strait. The significant increase of FWT in 2017 may be related to salinity changes caused by the Arctic atmospheric forcing and sea ice changes (Wang et al., 2022).
Figure 5
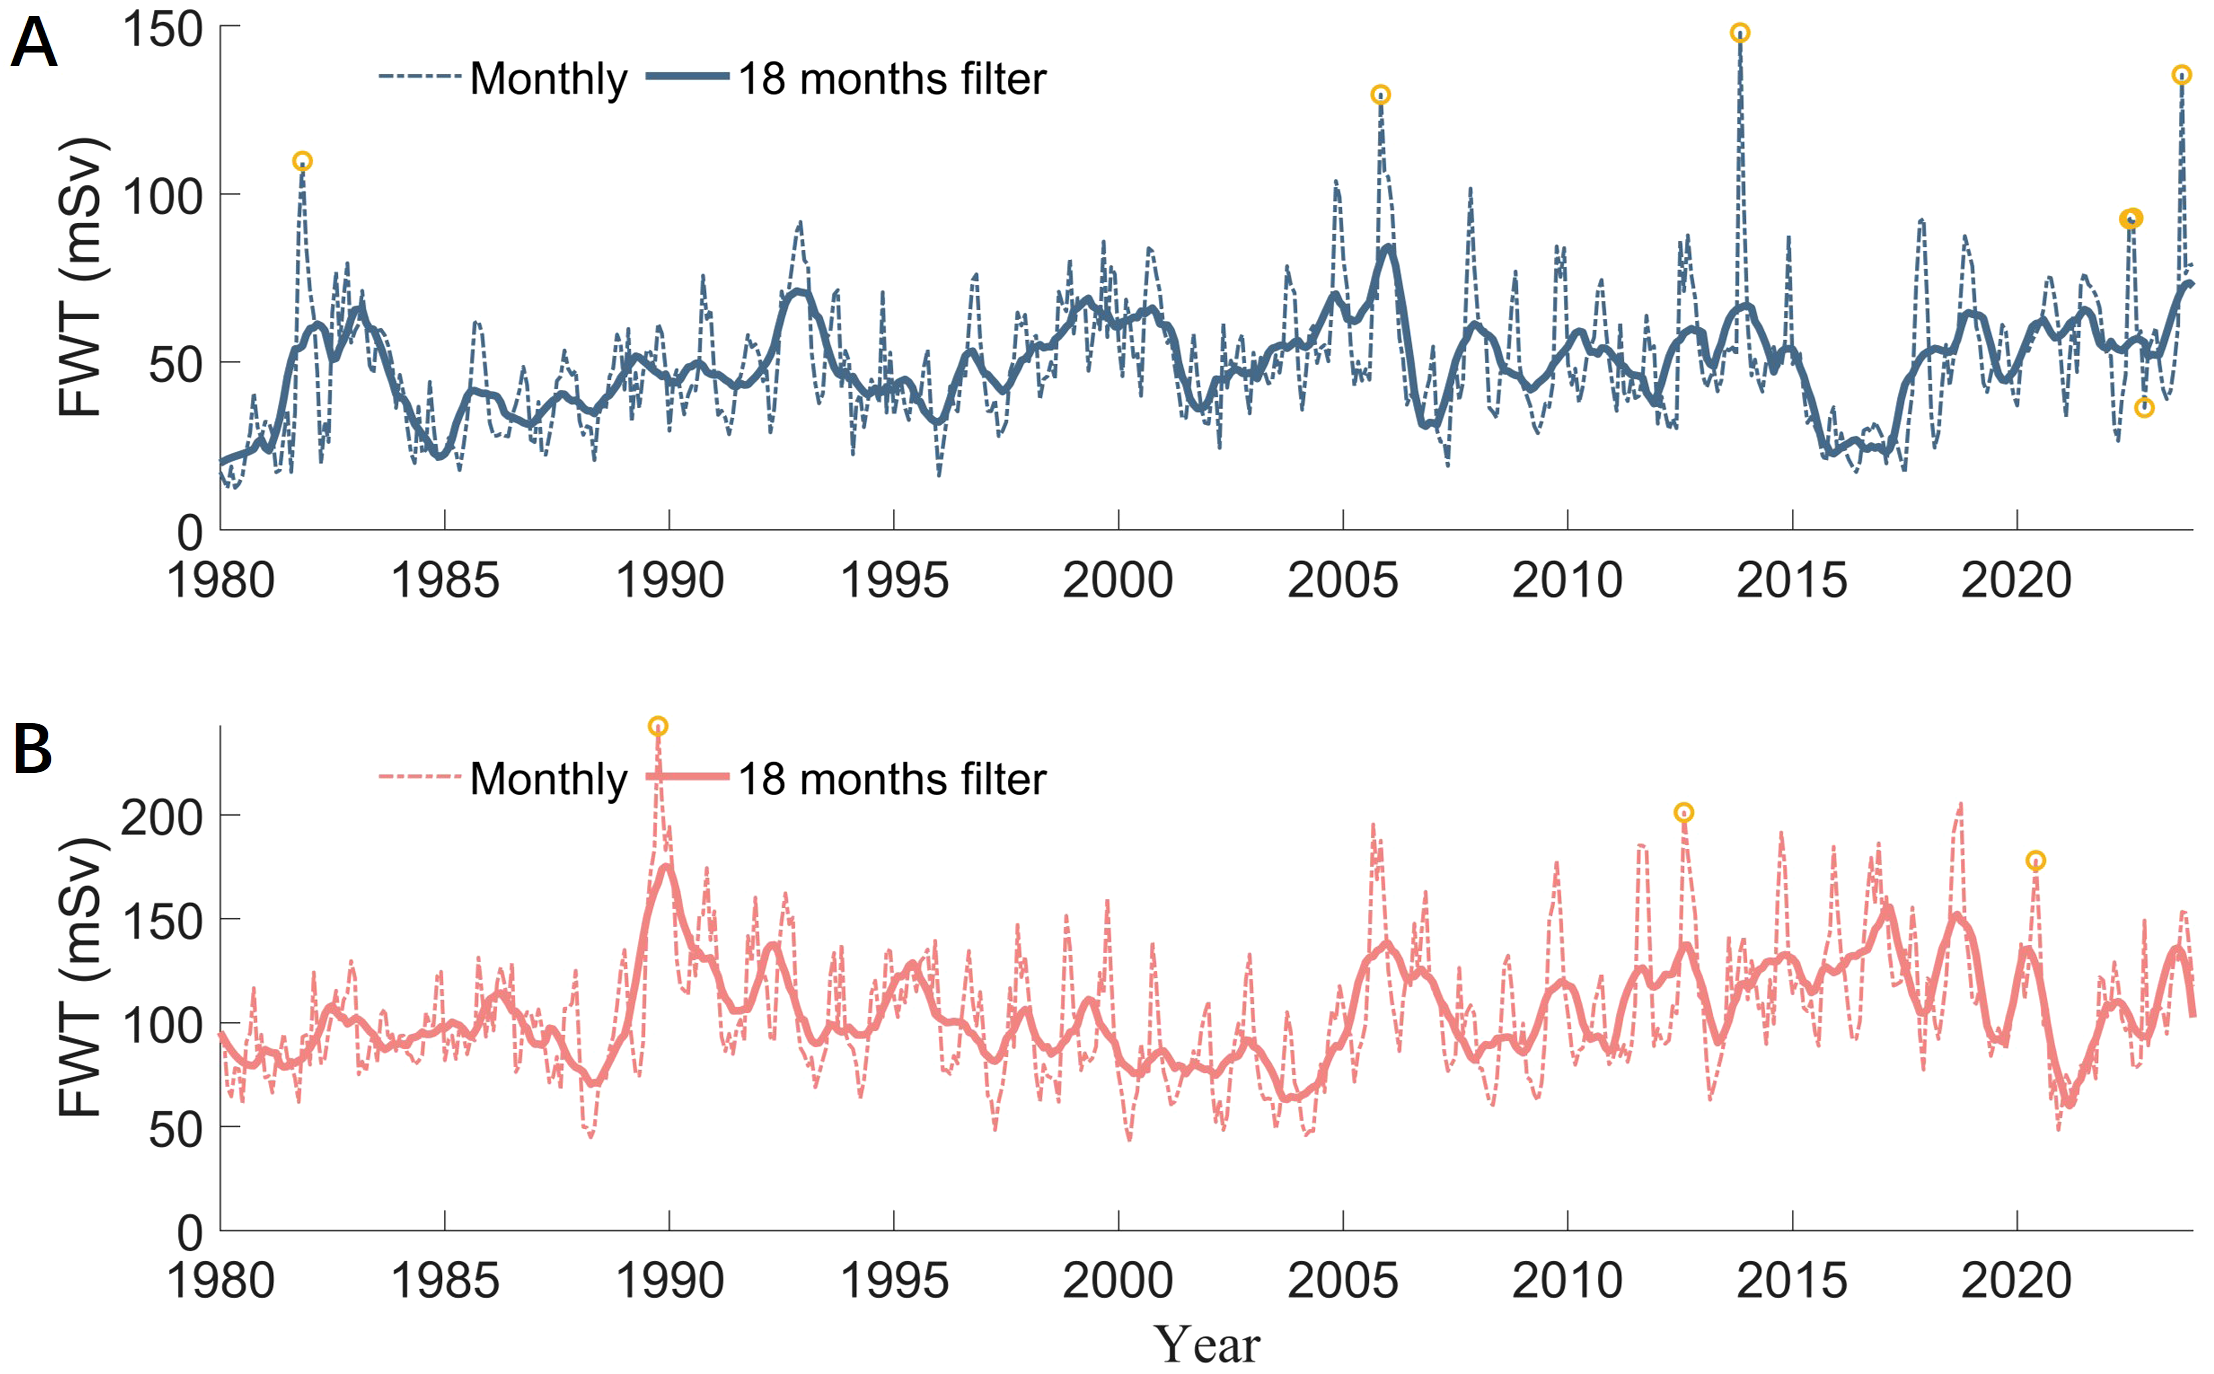
Monthly FWT (dotted line) and low-pass filtered timeseries of FWT (solid line) in Fram Strait (A) and Davis Strait (B), the yellow circles are extreme residual values after fitting.
In this paper, wavelet analysis is carried out on the filtered FWT without seasonal variation (Figure 6), and the results show that the interannual variation period of FWT through two straits are different. The FWT in Fram Strait maintains a significant annual change cycle of 4–8 years for a long time, and the annual change cycle of less than 4 years before the 21st century is also significant. Throughout the entire period, the significant period of interannual variation in Fram Strait has increased, with a main characteristic of around 8 years since the 21st century. The global wavelet spectrum results indicate that the most significant interannual variation periods in the Fram Strait are 8 years and 6 years. The FWT in Davis Strait has similar interannual changes (about 6 years) with the FWT in Fram Strait, which is the most significant in 1985-1995. This low-frequency oscillation cycle triggered anomalous FW discharge, serving as a primary driver of the North Atlantic’s interdecadal salinity variations during 1980-2000, similar to the Great Salinity Anomaly of the 1970s (Dickson et al., 1988). Since 2000, the interannual variation period in FWT from the Davis Strait has diminished, with the primary cycle of variation being reduced to under 2 years. According to the global wavelet spectrum, the most significant period of FWT in Davis Strait is about 6 years and 3 years.
Figure 6
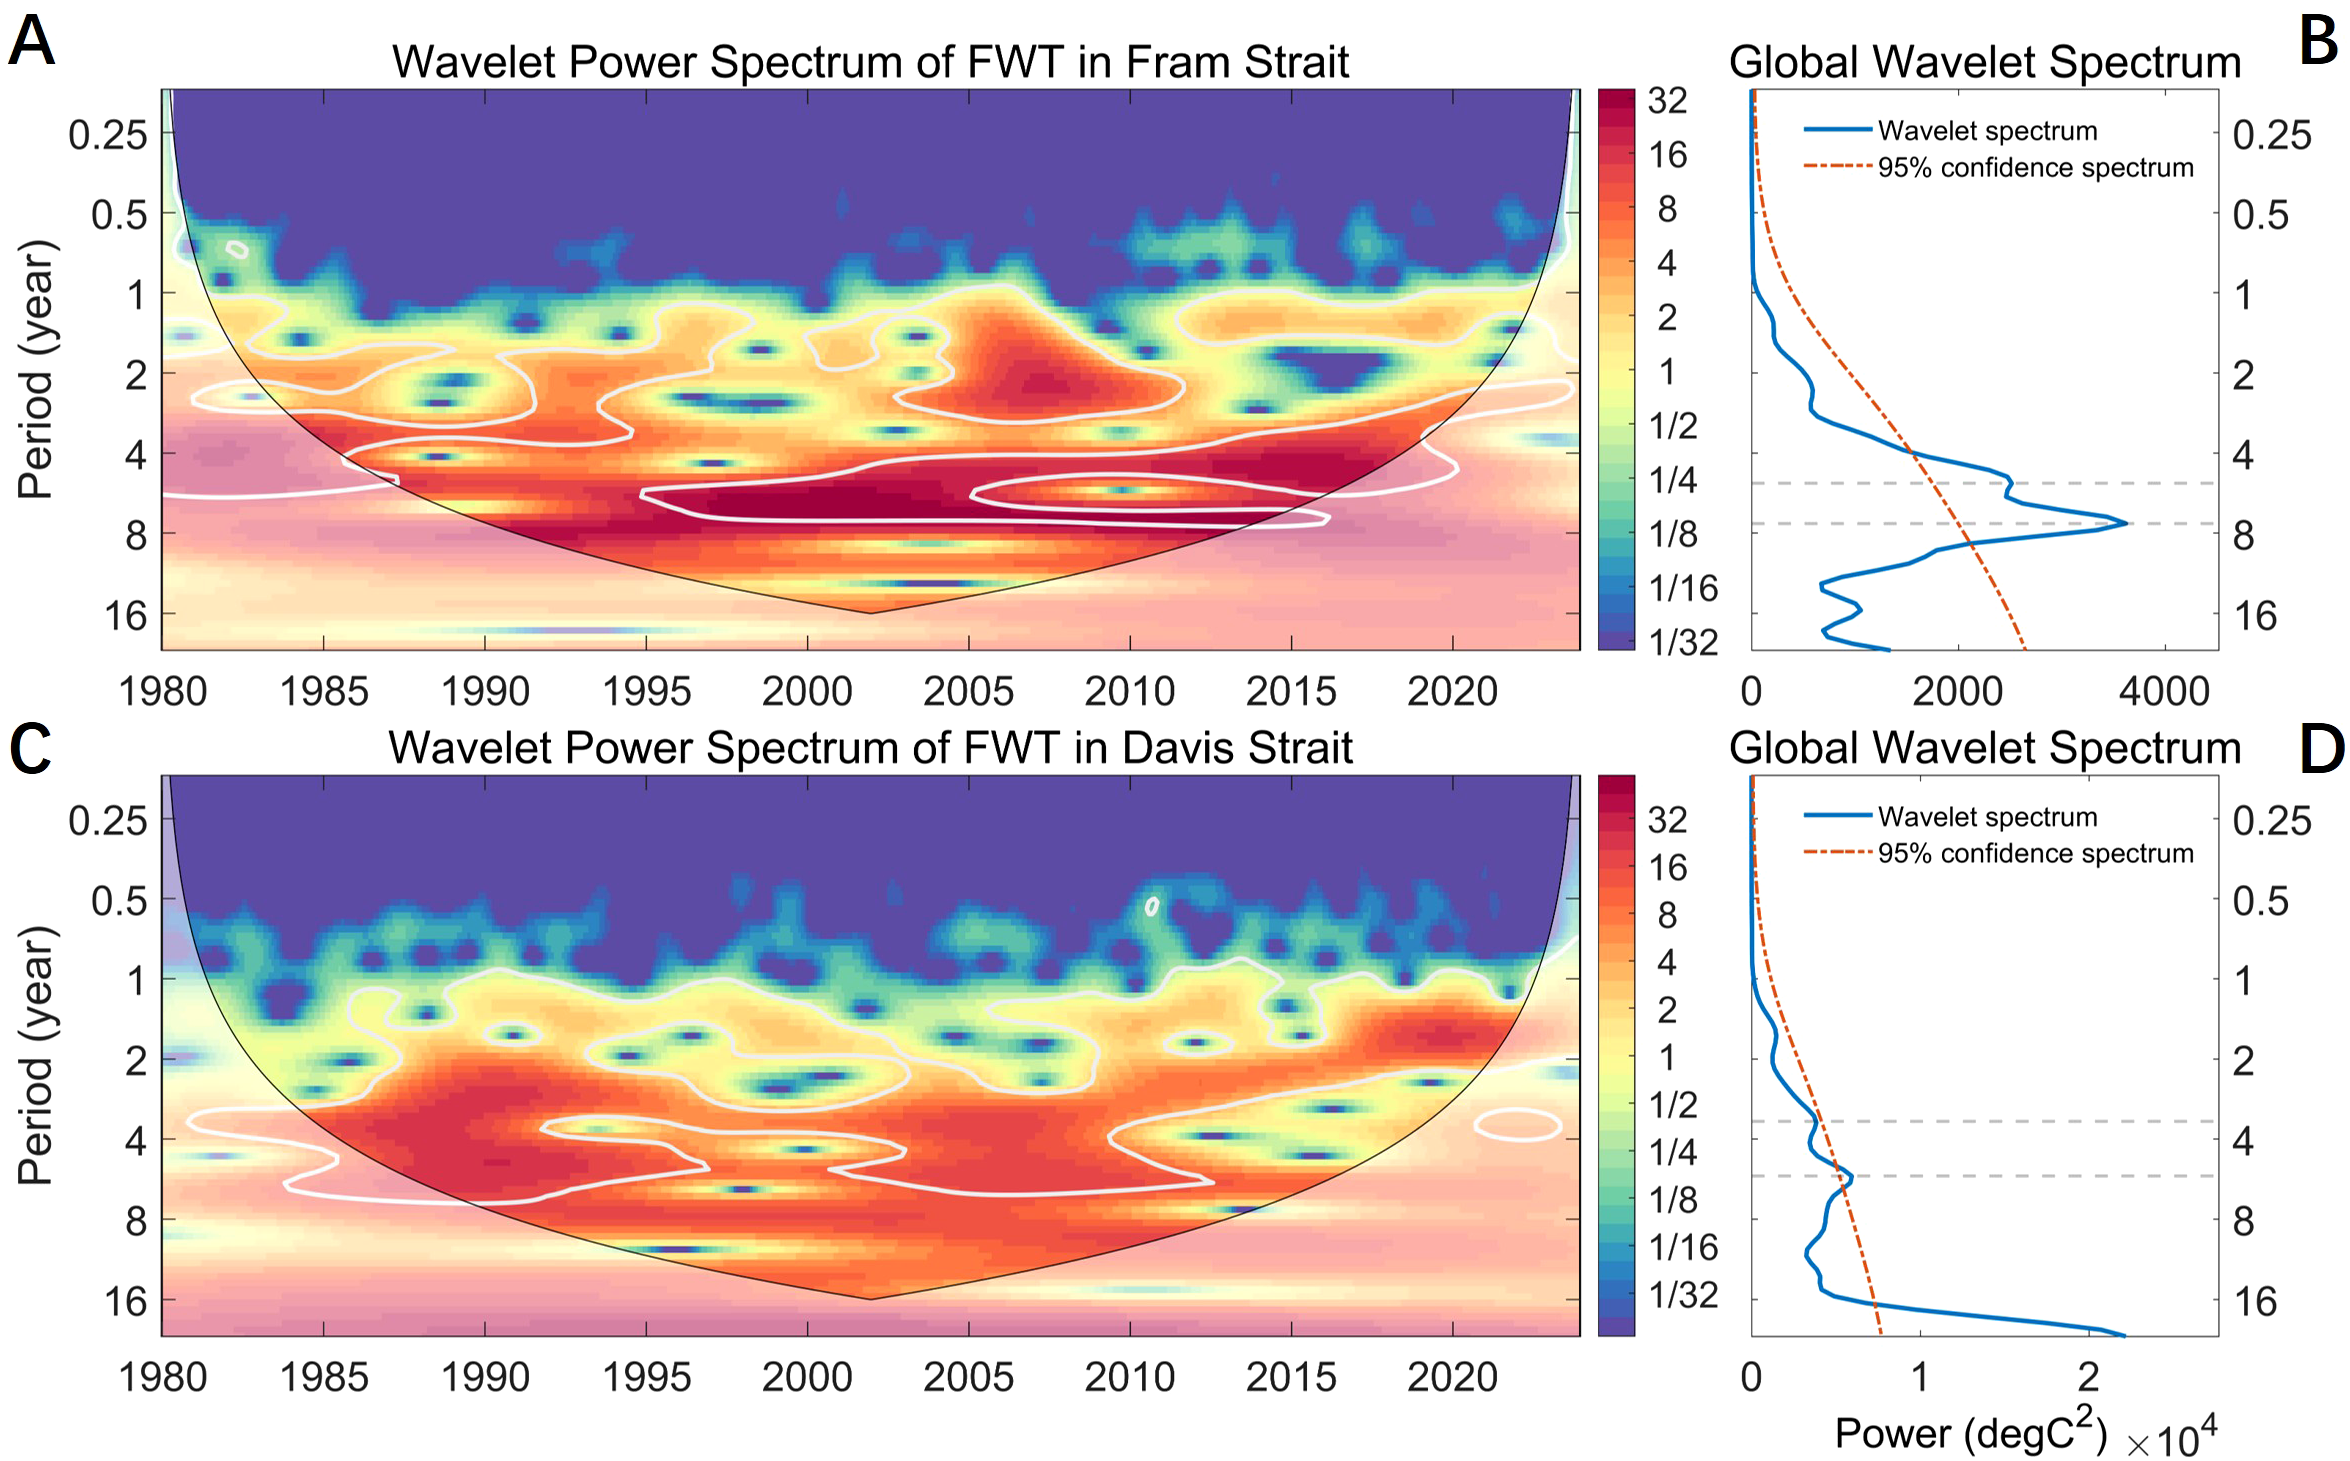
Wavelet analysis of FWT in the straits. Wavelet power spectrum of FWT in Fram Strait (A) and Davis Strait (C), the area enclosed by the white line indicates a pass in the significance test at the 0.05 level. Global wavelet spectrum of FWT in Fram Strait (B) and Fram Strait (D). FWT, freshwater transport.
4 Discussion
4.1 Impact of large-scale circulation on release of FW
The redistribution of FW in the Arctic Ocean caused by large-scale circulation anomaly is an important reason for the difference of FWT changes in the straits. We examine how atmospheric circulation alters the Arctic Ocean surface currents, freshwater pathways, and advective processes. For composite analysis, we define extreme phase years based on standardized climate indices (AO, NAO, DA, AMO): the years with indices greater than one standard deviation are selected as positive phase periods and the years with indices less than one standard deviation are selected as negative phase periods (Figure 7). The distribution of FWC anomaly (minus climatology) in the Arctic Ocean in different phase periods and the sea ice drift field anomaly (minus climatology) and sea ice concentration distribution in the corresponding period are respectively plotted.
Figure 7
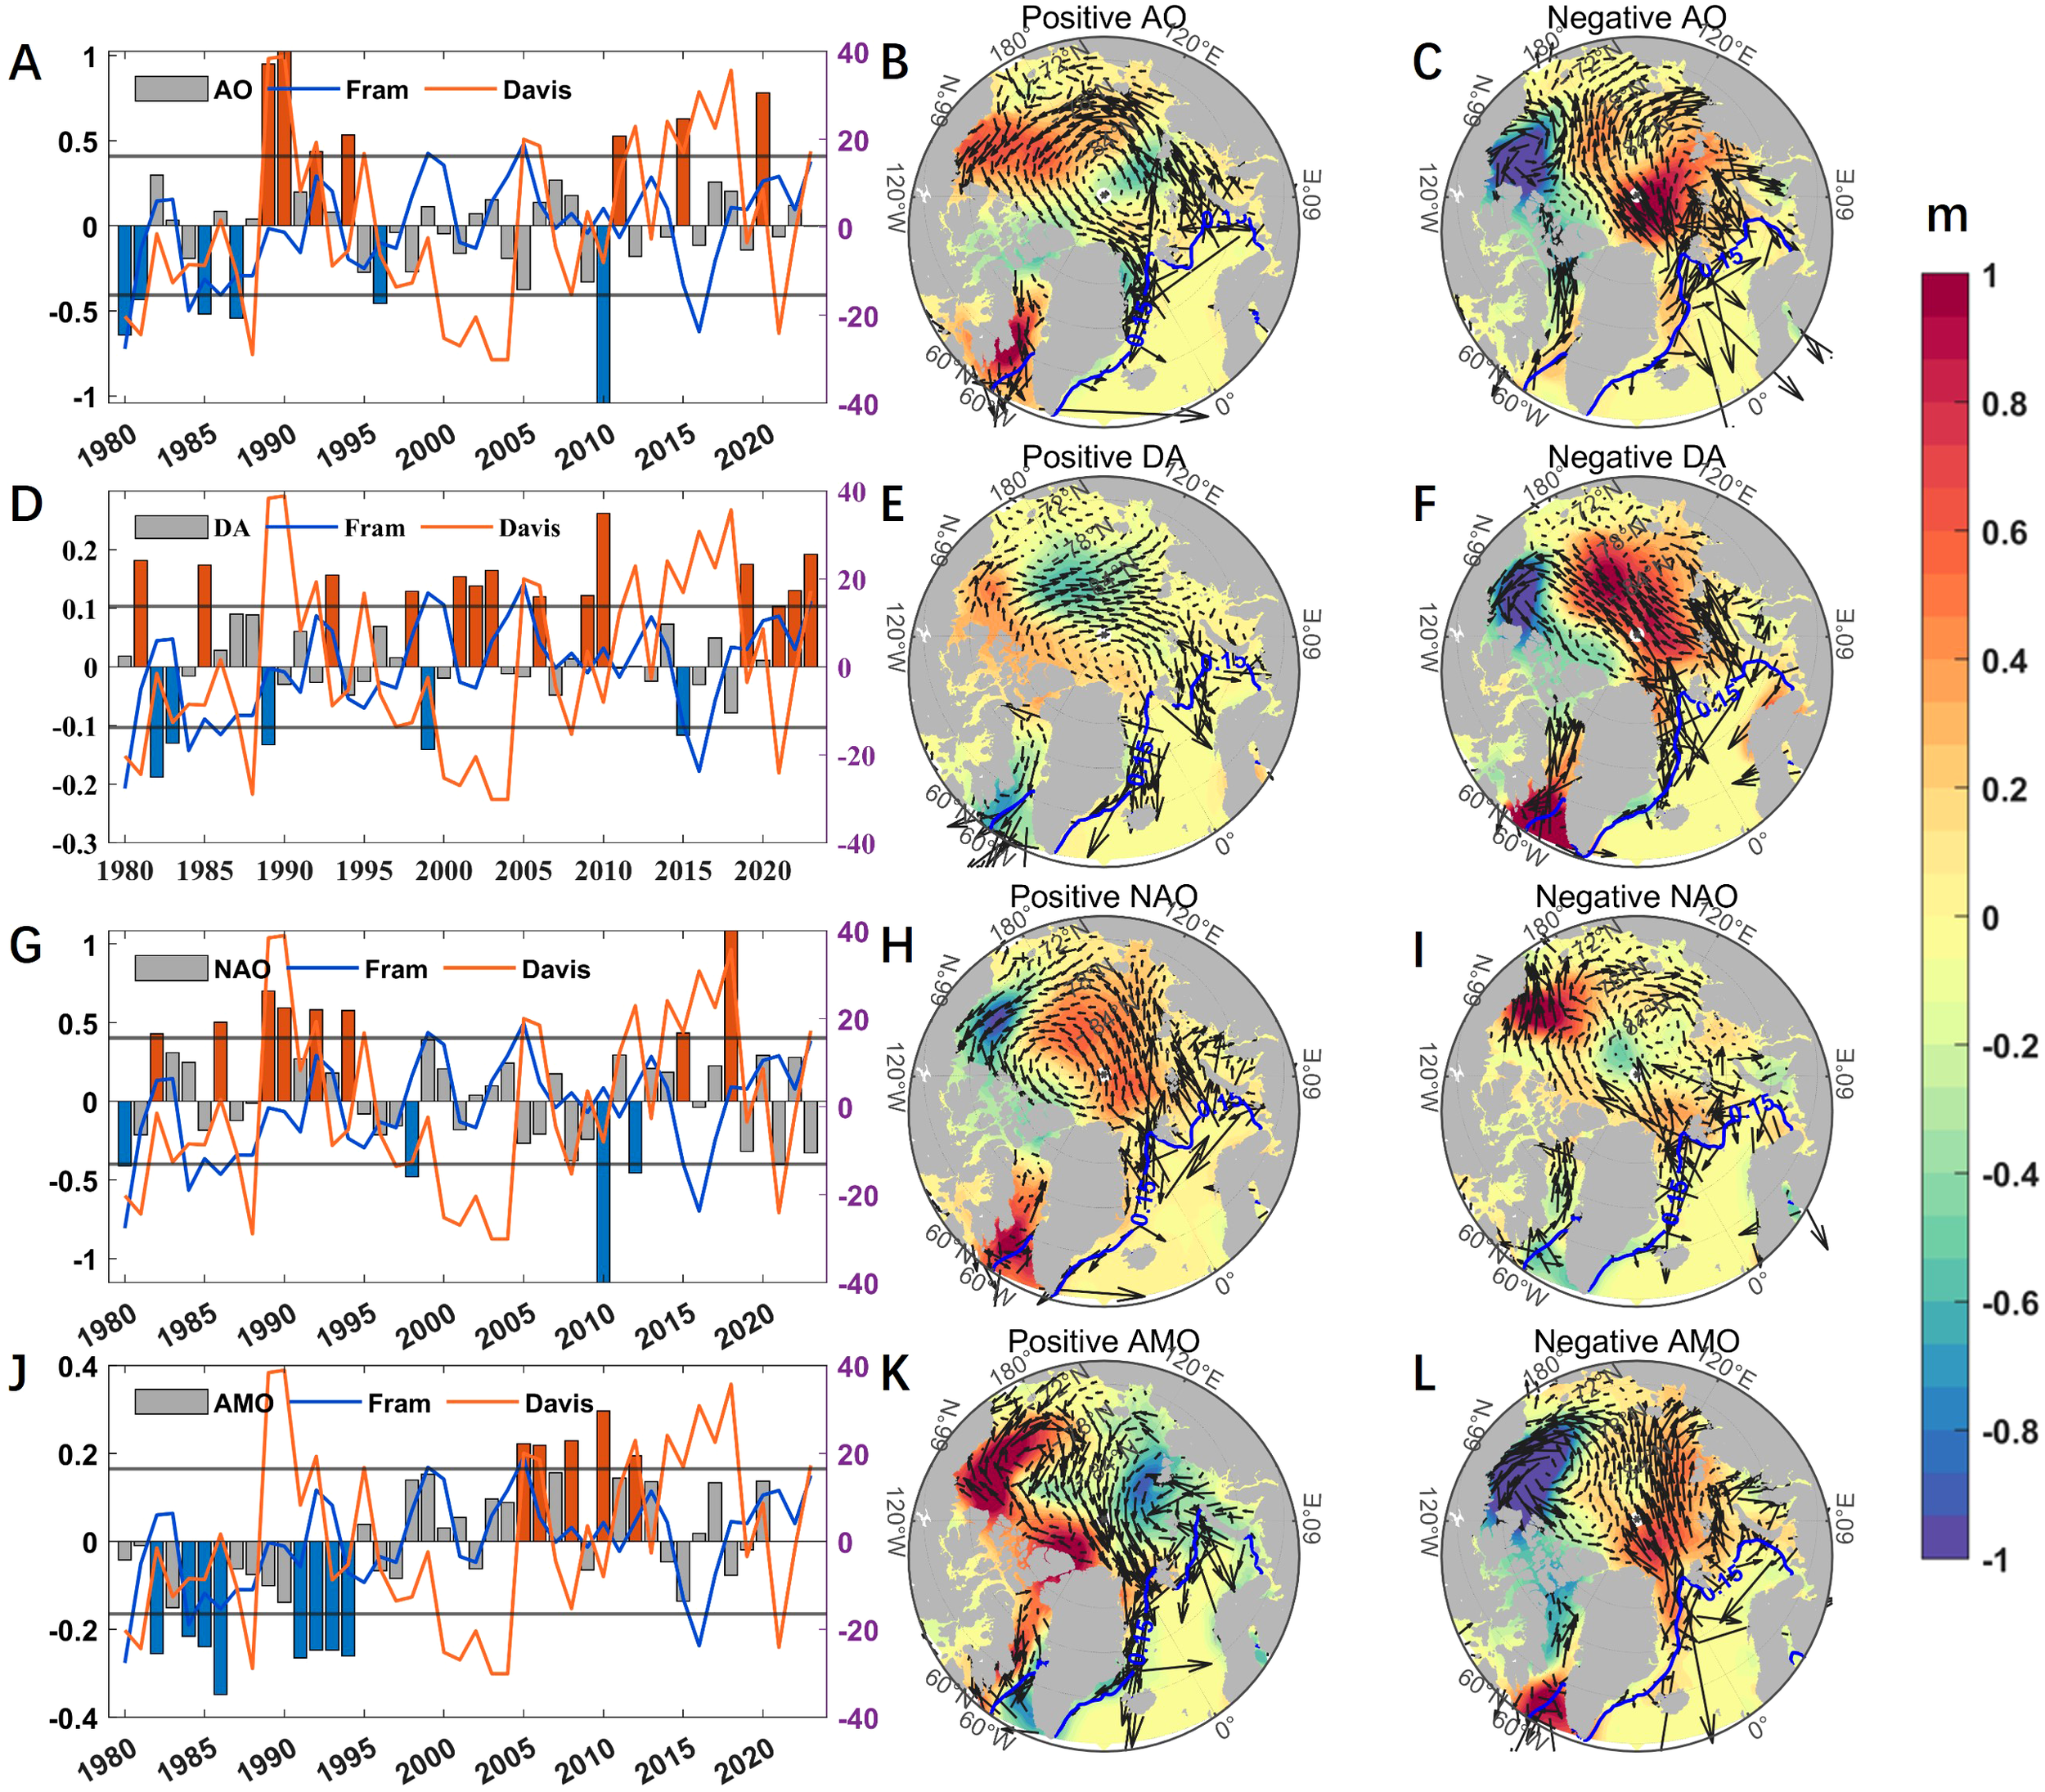
Composite analysis of FWC (shaded map), sea-ice motion (black vector) and SIC (blue contour) in the Arctic Ocean and some subpolar North Atlantic during different periods. (A, D, G, J) are atmospheric index timeseries (bar graph) and FWT anomaly (line chart) in straits, (B, E, H, K) are periods with positive AO, DA, NAO, AMO and (C, F, I, L) are periods with negative AO, DA, NAO, AMO. FWC, freshwater content; SIC, sea ice concentration.
The surface circulation of the Arctic Ocean is affected by the change of atmospheric circulation, which changes the current pattern (Morison et al., 2012; Haine et al., 2015). Since FW predominantly resides in the surface mixed layer, its storage and distribution are strongly influenced by atmospheric circulation (Haine et al., 2015). The positive AO phase (Figure 7B) generated a central Arctic low-pressure system, which induced cyclonic anomaly of surface currents (Morison et al., 2012). Affected by this, the path of the Transpolar Drift deflected to the Canadian basin, and could cross the Lomonosov Ridge, cross the East Siberian Sea, and enter the Canadian basin (Steele and Boyd, 1998). The cyclonic circulation anomaly caused the FW divergence in the Canadian Basin, which led to the increase of FWC content in the northern CAA, and then increased the FWC in Baffin Bay. The cyclonic circulation anomaly preferentially exports Canadian Basin runoff through the CAA, effectively preventing its transport to eastern Greenland (Dodd et al., 2009). The combined effects of anomalous southward current and elevated FWC promote intensified FWT via Davis Strait. Meanwhile, the Transpolar Drift changes the direction of Pacific water, thus reducing its contribution to the FW of the Fram Strait (Dodd et al., 2012), and the FWC at the Fram Strait shows a negative anomaly. According to anomalies in sea ice drift, during the positive AO phase, the drift on both eastern and western sides of Greenland are notably intensified. The negative FWC anomaly near the East Greenland Current introduces suppression of FWT in Fram Strait. Collectively, the positive AO phase enhances FWT through the Arctic gateways, especially which in the Davis Strait. Additionally, the positive anomaly of FWC in Baffin Bay favored the increase of FWT in Davis Strait. On the contrary, it tends to restrain the outflow of water from both sides of Greenland in the negative phase of AO (Figure 7C). The anticyclone circulation makes the surface converge, and the FWC content in the central area of the Arctic increases, so the FWC content in the strait section decreases. At the same time, the surface flow of the strait cross-section shows a northward anomaly, weakening FWT in the straits. It is worth mentioning that the anomaly of FWC in the Canadian Basin, especially in the Beaufort Gyre, caused by the negative AO should be positive in theory. Affected by the enhancement of Beaufort high since the 21st century (Tao and Du, 2021), the above synthesized AO negative phase periods are all low FWC values, resulting in the negative anomaly of FWC in Beaufort Gyre in the AO negative phase period. This result shows that the influence of AO on FWC in the Canadian Basin is mainly outside the Beaufort Gyre, in which the change of FWC is more significantly affected by the Beaufort high (Wang et al., 2021; Wang and Danilov, 2022; Polyakov et al., 2023; Karpouzoglou et al., 2024). Meanwhile, systematic errors in reanalysis data may also result in imperfections in the distribution of FWC.
According to the analysis above, the interannual cycle of 3–6 years revealed by above wavelet analysis is related to large-scale circulation anomalies. The NAO’s influence on FWT through both straits exhibits similar patterns to the AO (Figures 7H, I), with positive phases enhancing surface FWT while negative phases produce complex responses. As the second mode of EOF analysis of SLP in the Arctic Ocean, DA shows the reverse characteristics of the high pressure in northern Canada and the low pressure in northern Siberia. The effect of DA on FWT is opposite to that of AO. During the DA positive phase (Figure 7E), the anticyclone circulation anomaly enhances sea ice export through Fram Strait (Watanabe et al., 2006) while concurrently inducing freshwater retention in the northern Greenland, creating a buffer zone for freshwater redistribution. The buffer zone regulates time of FW export through the Arctic gateways under different wind conditions (Wang et al., 2024), leading to a weak correlation between the DA and FWT in Fram Strait. The negative anomaly of FWC in Baffin Bay is accompanied by the weak anomaly of the surface circulation, which weakens the FW export from Davis Strait.
Compared with Davis Strait, the FWT in Fram Strait is more affected by the low-frequency variation of the Arctic circulation. AMO index achieved phase transition from negative to positive during 1980 to 2023. During the AMO’s positive phase, sustained Atlantic inflow warming enhanced the Arctic sea ice melt, driving a pronounced rise in FWC in the Fram Strait and western Davis Strait (Figure 7K). Along with the strengthening of southward flow, it is conducive to the FW export on both sides of Greenland. It is worth mentioning that North Atlantic inflow warming has induced freshwater salinization along Davis Strait’s eastern boundary. With the maintenance of the North Atlantic warm phase, the output of sea ice area in Baffin Bay has shown a decreasing trend in recent years (since 2009) (Bi et al., 2019), while the FWT in Davis Strait has increased significantly after 2010. Meanwhile, the strongest warming of the Atlantic inflow occurred in 2010 and has been continuously freshening since then (Figure 4D). The temperature and salinity structure of the Davis Strait have an interesting feature: In the years following abnormal high temperatures, the desalination anomaly on the west side of the strait is significant. The warm, saline West Greenland Current entering Baffin Bay suppresses short-term freshwater export from Davis Strait, but increase the melting of sea ice in Baffin Bay on the low-frequency scale, freshening the west strait. In addition, the distribution of sea ice concentration (green line in Figure 7) shows that there are certain differences in Eastern Greenland and Baffin Bay during different phases of the large-scale circulation. Under projected global warming, declining sea ice cover will amplify atmosphere-ocean momentum transfer, intensifying surface circulation (Giles et al., 2012). This enhanced circulation will modify freshwater distribution patterns and ultimately increase the Arctic FW export.
To further understand the response of FWT to large-scale climate indices, Figure 8 provides the correlation coefficient of FWT lagged behind the atmospheric index. Consistent with the above conclusions, AO has a synchronous correlation with FWT of the straits, and has a more significant relationship with FWT in Davis Strait. In terms of the composition of FWT, the impact of AO is more pronounced on FWT~V in the Fram Strait and more significant on FWT~S in the Davis Strait (see also in Supplementary Table 3). This corresponds to the above results. The enhancement of surface current in straits during the positive AO period is confirmed, while the change of FWC in Fram Strait is not linear and consistent. DA has a synchronous negative correlation with FWT in Davis Strait (with a correlation -0.36). The pattern of Greenland and CAA high pressure and Eurasian low pressure makes surface FW converge along the CAA coast and cannot enter Baffin Bay through CAA. The largest positive correlation of DA leading FWT in Fram Strait for two years (with a correlation 0.37) reflects the buffering effect of North Pole on FWT in Fram Strait (Karpouzoglou et al., 2024). AMO has a longer time scale of influence on the FWT in straits. The long-term warming is beneficial to the FWT~V in the Fram Strait and inhibits its FWT~S, which is due to the Recirculated Atlantic Water is an important part of the outflow of the Fram Strait, and its warming and salinization will inhibit the FWT~S. When AMO leads 6–8 years, the correlation between it with FWT~S in the Davis Strait changes from negative to positive and becomes significant. This may be related to the warming of the Atlantic inflow, which leads to the melting of sea ice in Baffin Bay, thus increasing the FWT~S.
Figure 8
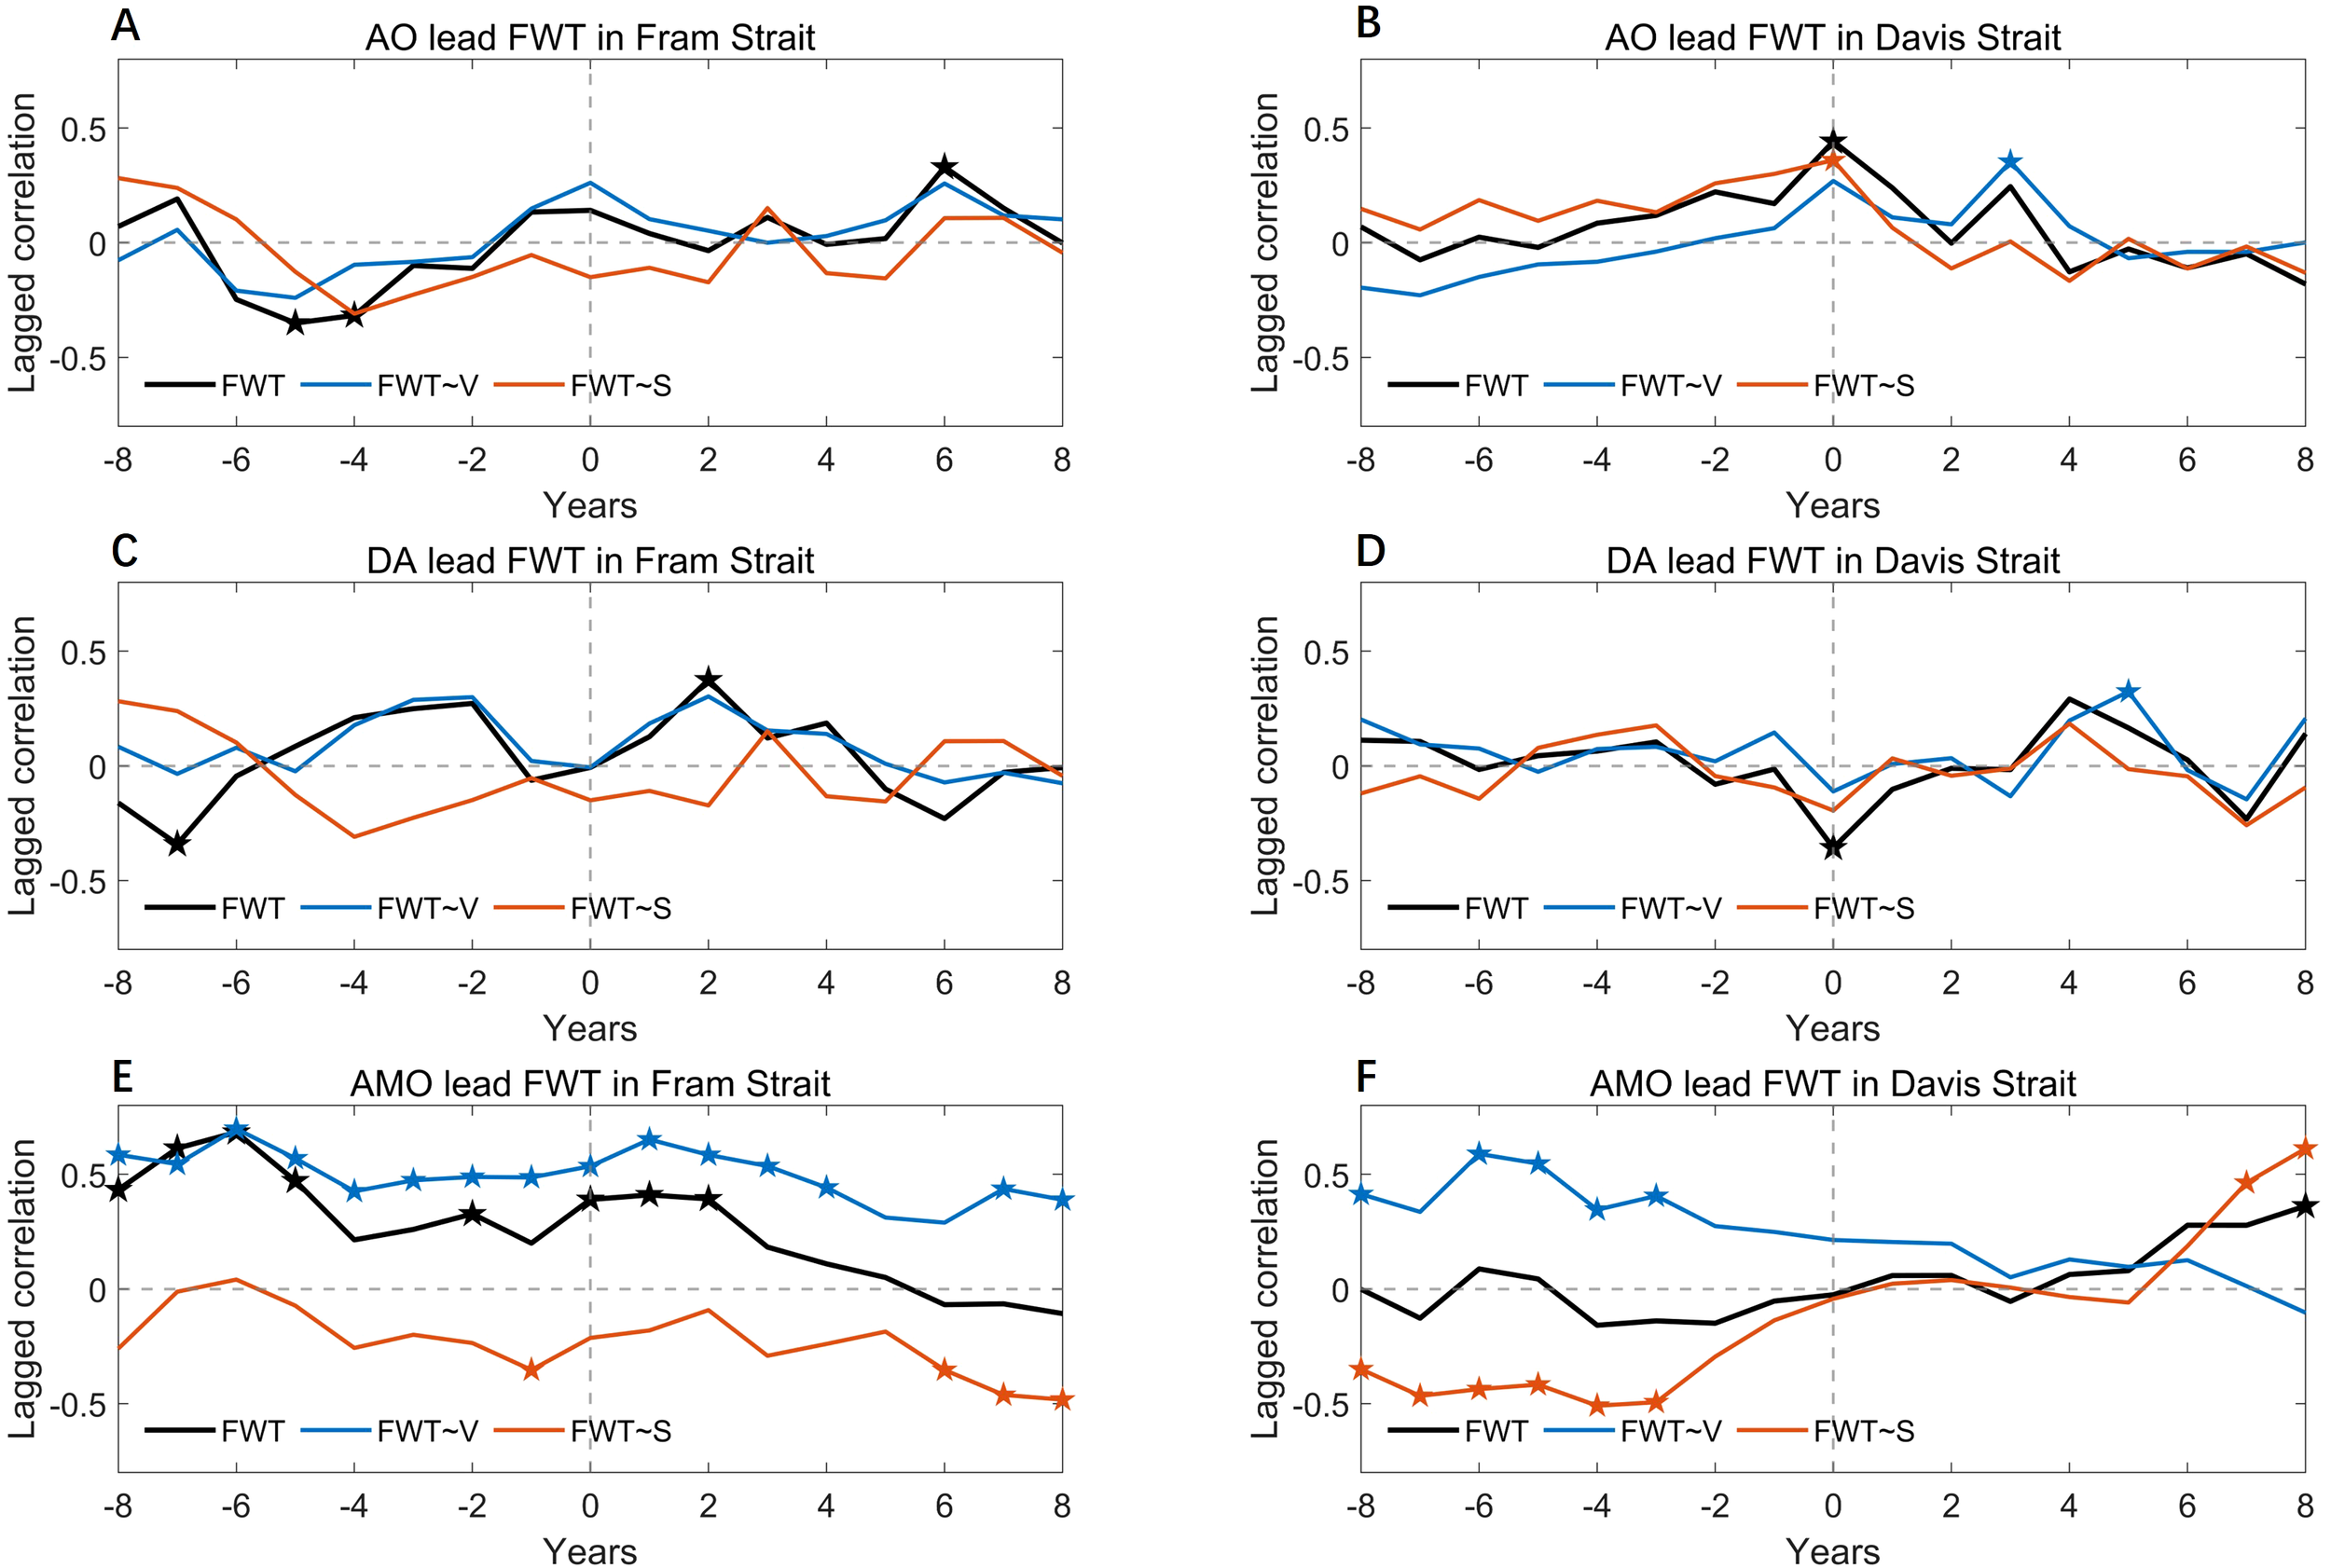
Lagged correlations between large-scale climate indices and FWT components through Arctic gateways. Fram Strait response to (A) AO, (C) DA, and (E) AMO. Davis Strait response to (B) AO, (D) DA, and (F) AMO. The black, blue, and red lines represent total FWT, velocity-driven component (FWT~V), and salinity-driven component (FWT~S), respectively. Asterisks denote statistically significant correlations (p<0.05). FWT, freshwater transport.
4.2 Connection between FWT and Arctic FW reservoir
In this section, this paper will provide evidence that the change of FWT components in straits respond to the change of FWC in the Arctic Ocean basins. The Beaufort Gyre located in the Canadian Basin is the main FW reservoir in the Arctic Ocean. The FWC of the Canadian Basin calculated from reanalysis data (blue line in Figure 9) is basically consistent with the long-term and interannual changes of the FWC from BGEP (yellow line in Figure 9). The correlation between the annual average timeseries from 2003 to 2023 is as high as 0.92 (99% confidence). The EN4 reanalysis salinity data is very representative in depicting the changes of FWC in the Arctic Ocean. According to the results of BGEP, the Beaufort Gyre has accumulated about 6400 km³ of FW in the 16 years from 2003 to 2018 (Proshutinsky et al., 2019), and the FW volume has declined in recent years.
Figure 9
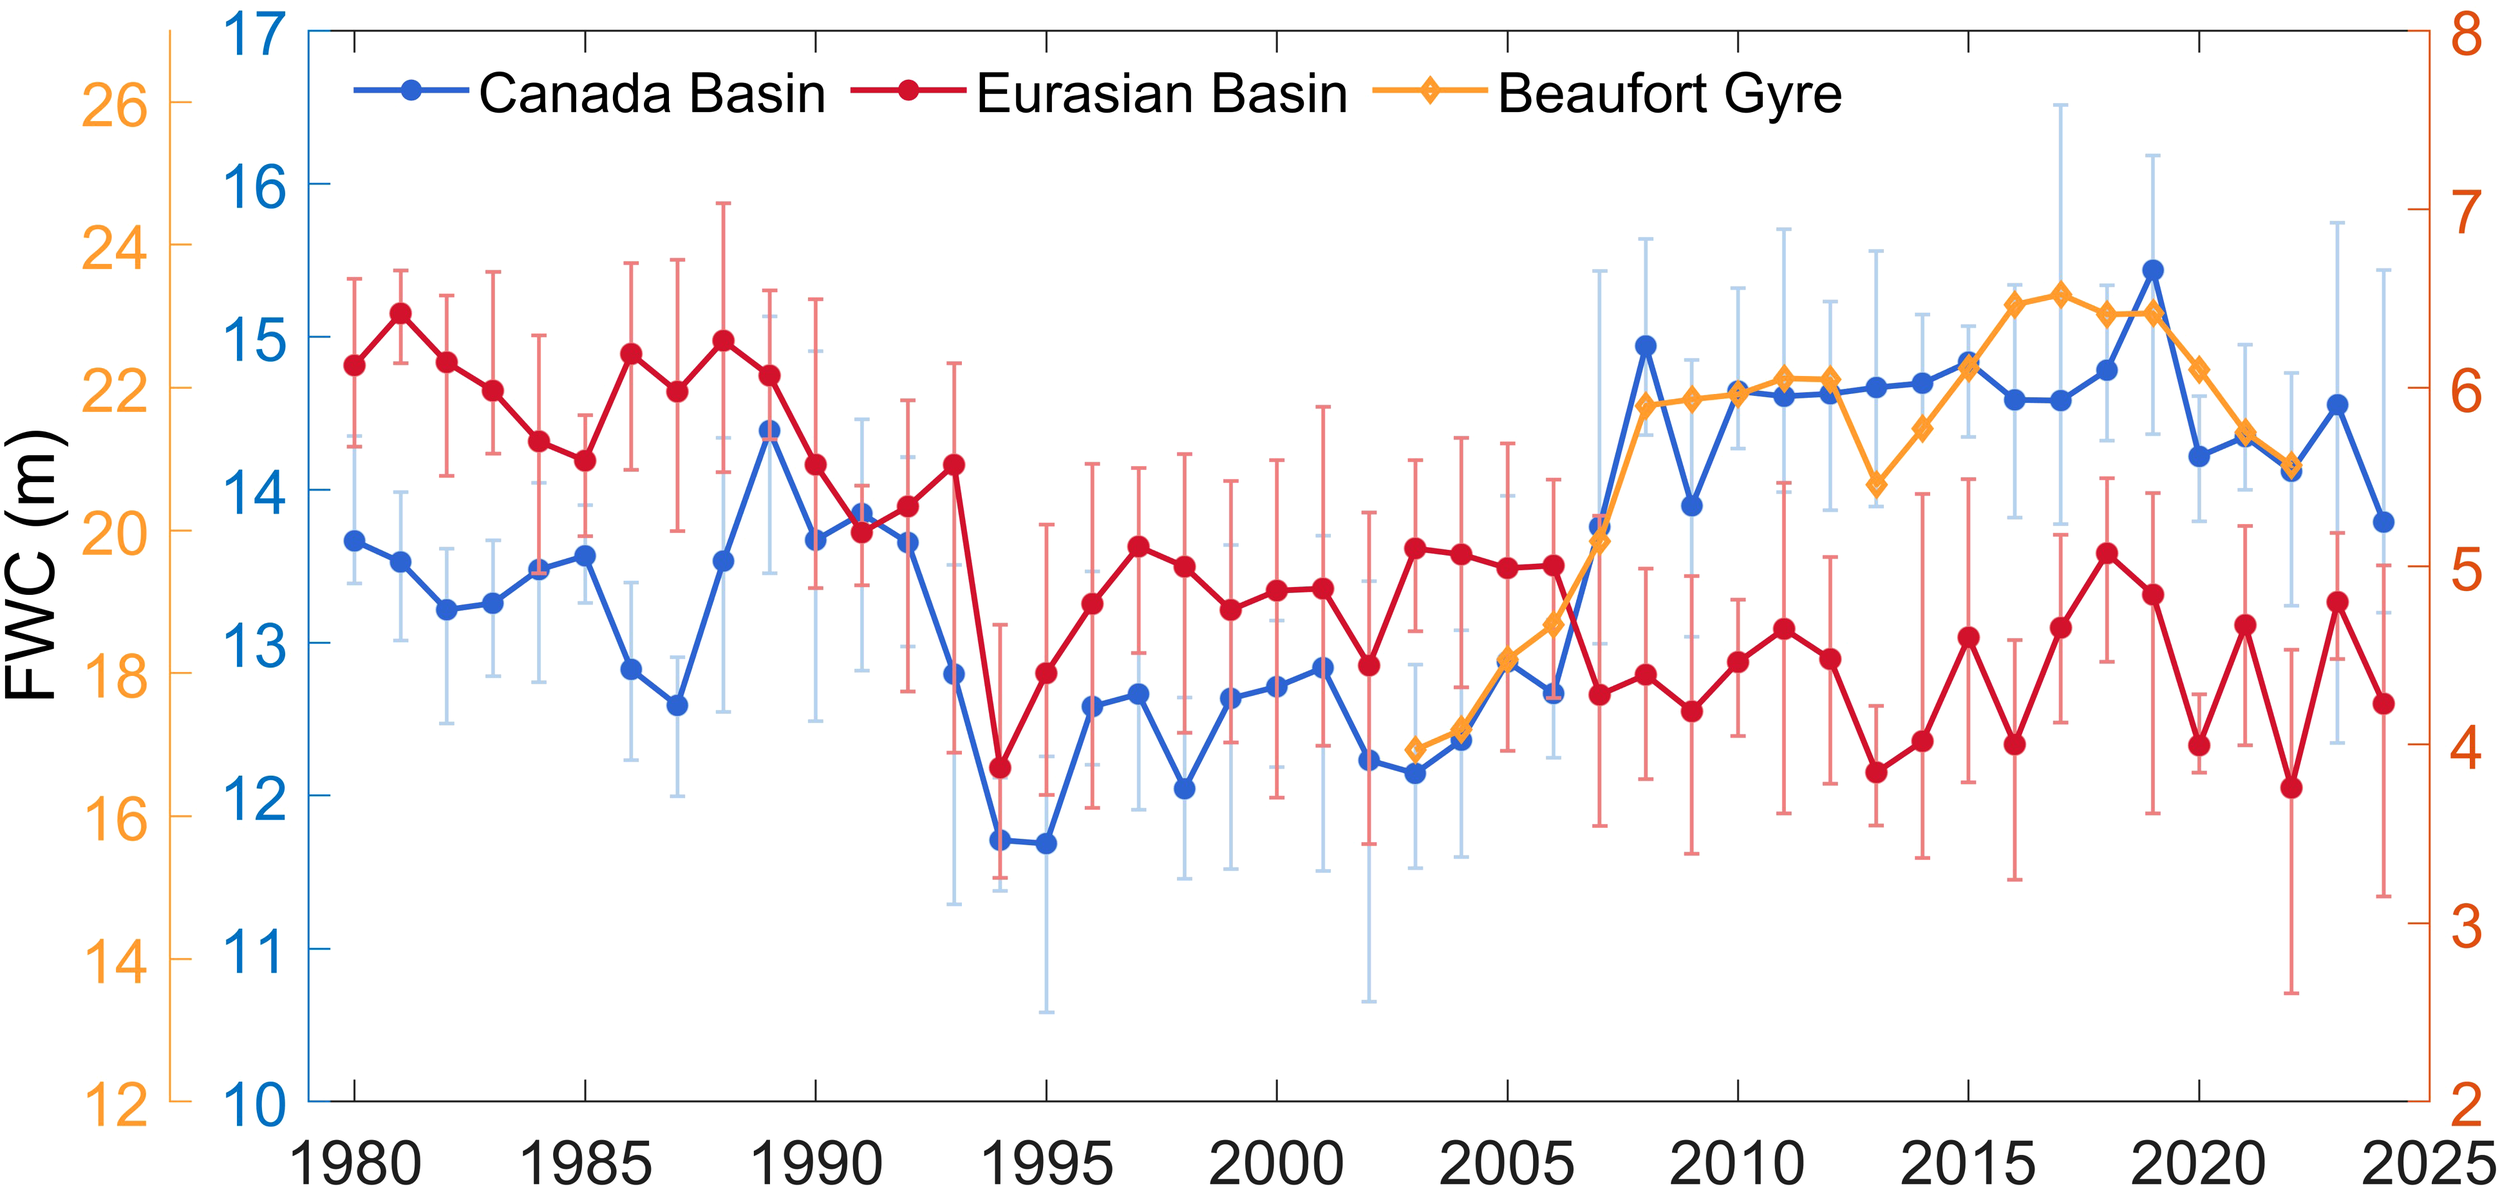
Yearly FWC in the Arctic Ocean basins. The blue line is the average FWC in the Canadian basin, the red line is the average FWC in the Eurasian basin, the yellow line is the observation of the FWC in Beaufort Gyre from Beaufort Gyre Exploration Project, and the error bars are seasonal variations. FWC, freshwater content.
The reanalysis data reveal distinct regional differences in Arctic FWC evolution (1980-present), particularly in the long-term variations between the Canadian and Eurasian Basins. From 1980 to 2000, both the FWC in the Canadian Basin and Eurasian Basin showed a downward trend, with the FWC in the Eurasian Basin showing a more significant trend of -0.88 m/10yr compared to the FWC in the Canadian Basin showing a trend of -0.65 m/10yr (Table 2). Regional differences have become more pronounced since the 21st century: the FWC in the Canadian Basin exhibits a significant increase trend (1.07 m/10yr), while the FWC in the Eurasian Basin shows statistically insignificant changes (-0.21 m/10yr). Long-term trends reveal a distinct tri-phase FWC evolution in the Canadian Basin characterized by sequential accumulation, release, and re-accumulation processes. The combined effect of the two influences has significantly increased the FW reserves of the Canadian Basin and reduced the FW reserves of the Eurasian Basin (Wang et al., 2019).
Table 3 provides the correlation coefficient between the annual average FWC of the basins and the annual average FWT in straits and their different components, where CB refers to the Canadian basin and EB refers to the Eurasian basin. There exist a weak negative correlation between the Fram Strait’s FWT and the FWC in EB from 1980 to 2023, with a coefficient of only -0.24, which is associated with the opposing of the S and V components in the Fram Strait. The S component of the Fram Strait FWT has long been closely correlated with the FWC of EB (correlation coefficient>0.5) (Karpouzoglou et al., 2024), while the V component is negatively correlated with the FWC of EB (correlation coefficient is -0.69). The background of FW accumulation in the Eurasian basin is that the core of the Arctic Ocean high pressure anomaly is to the east. Under this condition, the current in Fram Strait, which located on the south side of the high pressure, presents a northward flow anomaly, making the FWT~V and FWT~S respond to the FW in the Eurasian basin in the opposite direction. Due to the redistribution of freshwater in the Arctic Ocean, it has also exhibited an inverse relationship with the FWC in Beaufort Gyre (Karpouzoglou et al., 2022), the correlation coefficient between FWT in Fram Strait and FWC in CB since 2000 is -0.22. Furthermore, since the 21st century, the minimum FWC values observed in EB in 2007 and 2013 correspond to the minimum FWT~S in Fram Strait in 2009 and 2015, respectively, sharing similar interannual variation characteristics. The FW export through the Davis Strait is closely related to changes in the FWC of CB (0.41, 99% confidence level), which indicate Davis Strait is main pathway of release of FW in Beaufort Gyre (Zhang et al., 2021). Notably, the salinity variation component of the FWT has been highly correlated with the FWC of the Canadian Basin throughout the study period, with a correlation coefficient exceeding 0.6. This aligns with the changes in FWC observed in the Canadian Basin and Baffin Bay under the influence of atmospheric circulation. It is noteworthy that the relationship between the FW export of these two straits and the FWC changes in the respective basins has intensified since the 21st century, evidenced by an increase in the correlation coefficients during this period. In general, the continuous accumulation FWC in the Canadian Basin and Eurasian Basin are conducive to FWT~S in Davis Strait and Fram Strait downstream, respectively.
Table 3
| Section | Components | 1980-2000 | 2001-2020 | 1980-2020 | |||
|---|---|---|---|---|---|---|---|
| CB | EB | CB | EB | CB | EB | ||
| Fram Strait |
FWT | -0.1 | -0.23 | -0.22 | 0.27 | 0.01 | -0.24 |
| FWT~V | -0.29 | -0.49 | 0.24 | -0.37 | 0.31 | -0.69 | |
| FWT~S | 0.29 | 0.42 | -0.52 | 0.54 | -0.34 | 0.56 | |
| Davis Strait |
FWT | 0.23 | -0.18 | 0.52 | -0.18 | 0.41 | -0.19 |
| FWT~V | -0.22 | -0.55 | -0.20 | 0.24 | -0.05 | -0.39 | |
| FWT~S | 0.67 | 0.58 | 0.66 | -0.33 | 0.61 | 0.04 | |
Correlation between freshwater content in the Canadian and Eurasian basin and FWT through Fram Strait and Davis Strait.
The numbers in bold indicate success to pass significance test at the 0.05 level. FWT, freshwater transport.
5 Summary
Based on the EN4 reanalysis salinity and SOAD velocity, this study determined the variation characteristics of FWT in Fram Strait and Davis Strait from 1980 to 2023. Combined with the atmospheric data and the changes of FW in the Arctic FW reservoir, the impact of large-scale circulation and the distribution of FW in the Arctic Ocean on FWT in the straits are determined.
The FWT in Fram Strait and Davis Strait have different long-term variation characteristics. From 1980 to 2000, the FWT in Fram Strait increased at a mean rate of 10.1 mSv/10yr. In recent years, the FWT in Fram Strait has shown significant interannual variation characteristics. On the contrary, the FWT in Davis Strait show a significant interannual variability before 2000, and increased significantly after 2000, about 13.7mSv/10yr. On the seasonal scale, the variation of salinity has a greater impact on the anomaly of FWT than its velocity changes. On the interannual and long-term scales, the contribution of salinity and velocity to the anomaly of FWT is equivalent. The variation of velocity mainly determines the long-term trend of FWT in the two straits, while the variation of salinity is related to the significant interannual variation of FWT in the two straits. Especially for Davis Strait, the contribution of salinity to FWT after 2000 is 20.7 mSv/10yr, and the effects of salinity anomaly and velocity anomaly are very important. In a word, under the background of the rapid disappearance of sea ice, the FW export from the Arctic Ocean has not shown a corresponding sustained growth trend for a long time. However, due to the increase of FW sources in the Arctic Ocean, the FWT through the main FW paths on both sides of Greenland have also increased since the 21st century, accompanied by significant interannual variations. The interannual variations of FWT are related to the temperature and salt structure in the straits. The significant FWT low anomaly in the Fram Strait in 2016 was due to the westward expansion of the North Atlantic inflow, which suppressed the salinity of the western Polar Water; The high anomaly of FWT in Davis Strait in the 1990s was due to the weakening of Atlantic water. The interannual variation cycle of Fram Strait’s FWT is longer than that in Davis Strait, with low-frequency variation characteristics of more than 8 years, while the FWT in Davis Strait is mainly a relatively high-frequency variation of 3–6 years.
The FWT in Fram Strait and Davis Strait are jointly regulated by Arctic freshwater content (FWC) redistribution and large-scale atmospheric circulation anomalies. During the positive phases of the AO and the NAO, anomalous cyclone circulation in the Arctic Ocean leads to the divergence of FW in the central Arctic region, subsequently resulting in an increase in FW at the margins of Greenland. Concurrently, the southward surface outflow from the Greenland margins has intensified, thereby amplifying the FWT through the two straits. The DA exhibits opposing effects on FWT compared to AO, with anticyclonic circulation during its positive phase promoting the convergence of FW in the north Greenland while buffering FW release within two years. The AMO has underwent a phase transition from 1980 to 2023. During the AMO positive phase, the sustained warming of the North Atlantic inflow led to decreasing the FWT~S in the straits. After several years of continuous warming, the FW in the Davis Strait will increase in turn, which may be related to the melting of sea ice. With the warming of the West Greenland Current, the internal of Baffin Bay tends to become fresher, which in turn is beneficial to the FWT in the Davis Strait. Under the background of the above atmospheric circulation, the long-term and interannual changes of FW export from the straits are inseparable from the changes of FWC in the Arctic Ocean basins. The Fram Strait FWT is affected by the FWC of the Eurasian Basin, which is mainly related to the contribution of salinity to FWT, with a coefficient of 0.56. The FWT in Davis Strait is mainly affected by the change of FWC in the Canadian Basin, and the relationship between both has been closer since the 21st century, and the coefficient is about 0.52. In general, atmospheric circulation in the Arctic Ocean has a direct driving effect on FWT in freshwater pathways. The continuous increase of FW in the Arctic Ocean, especially the continuous increase in the FW reservoir, has increased the intensity and importance of FW export from Davis Strait. The change of FW export from Fram Strait can be comparable to that from Davis Strait, and its change mechanism still needs further observation and research.
Due to the systematic differences of individual models, there is an uncertainty in the results of this paper. The EN4 dataset has strengthened our confidence in the performance of changes in the overall FWC of the Arctic Ocean, so it is of positive significance to understand the upper stratification structure of the Arctic Ocean. In order to fully understand the characteristics and mechanism of the changes of liquid FW in the Arctic Ocean, further observation and analysis are still needed.
Statements
Data availability statement
The raw data supporting the conclusions of this article will be made available by the authors, without undue reservation.
Author contributions
JZ: Conceptualization, Data curation, Methodology, Validation, Visualization, Writing – original draft, Writing – review & editing. LD: Conceptualization, Funding acquisition, Resources, Supervision, Writing – review & editing.
Funding
The author(s) declare that financial support was received for the research and/or publication of this article. This work was supported by the National Natural Science Foundation of China (Grants No. 42230405, 41976217, and 41576020) and the Global Change Research Program of China (No. 2015CB953902).
Conflict of interest
The authors declare that the research was conducted in the absence of any commercial or financial relationships that could be construed as a potential conflict of interest.
Generative AI statement
The author(s) declare that no Generative AI was used in the creation of this manuscript.
Publisher’s note
All claims expressed in this article are solely those of the authors and do not necessarily represent those of their affiliated organizations, or those of the publisher, the editors and the reviewers. Any product that may be evaluated in this article, or claim that may be made by its manufacturer, is not guaranteed or endorsed by the publisher.
Supplementary material
The Supplementary Material for this article can be found online at: https://www.frontiersin.org/articles/10.3389/fmars.2025.1608187/full#supplementary-material
References
1
Aagaard K. Carmack E. C. (1989). The role of sea ice and other fresh water in the Arctic circulation. J. Geophysical Research: Oceans94, 14485–14498. doi: 10.1029/JC094iC10p14485
2
Azetsu-Scott K. Petrie B. Yeats P. Lee C. (2012). Composition and fluxes of freshwater through Davis Strait using multiple chemical tracers. J. Geophysical Research: Oceans117. doi: 10.1029/2012jc008172
3
Bertosio C. Provost C. Athanase M. Sennéchael N. Garric G. Lellouche J. M. et al . (2022). Changes in freshwater distribution and pathways in the Arctic Ocean since 2007 in the Mercator Ocean global operational system. J. Geophysical Research: Oceans127, e2021JC017701. doi: 10.1029/2021jc017701
4
Bi H. Zhang Z. Wang Y. Xu X. Liang Y. Huang J. et al . (2019). Baffin Bay sea ice inflow and outflow: 1978–1979 to 2016–2017. Cryosphere13, 1025–1042. doi: 10.5194/tc-13-1025-2019
5
Carmack E. C. Yamamoto-Kawai M. Haine T. W. N. Bacon S. Bluhm B. A. Lique C. et al . (2016). Freshwater and its role in the Arctic Marine System: Sources, disposition, storage, export, and physical and biogeochemical consequences in the Arctic and global oceans. J. Geophysical Research: Biogeosciences121, 675–717. doi: 10.1002/2015jg003140
6
Carton J. A. Chepurin G. A. Chen L. (2018). SODA3: A new ocean climate reanalysis. J. Climate31, 6967–6983. doi: 10.1175/jcli-d-18-0149.1
7
Cornish S. B. Kostov Y. Johnson H. L. Lique C. (2020). Response of arctic freshwater to the arctic oscillation in coupled climate models. J. Climate33, 2533–2555. doi: 10.1175/jcli-d-19-0685.1
8
Cuny J. Rhines P. B. Ron K. (2005). Davis Strait volume, freshwater and heat fluxes. Deep Sea Res. Part I: Oceanographic Res. Papers52, 519–542. doi: 10.1016/j.dsr.2004.10.006
9
Curry B. Lee C. M. Petrie B. (2011). Volume, freshwater, and heat fluxes through davis strait 2004–05*. J. Phys. Oceanography41, 429–436. doi: 10.1175/2010jpo4536.1
10
Curry B. Lee C. M. Petrie B. Moritz R. E. Kwok R. (2014). Multiyear volume, liquid freshwater, and sea ice transports through Davis strait 2004–10*. J. Phys. Oceanography44, 1244–1266. doi: 10.1175/jpo-d-13-0177.1
11
de Steur L. Hansen E. Gerdes R. Karcher M. Fahrbach E. Holfort J. (2009). Freshwater fluxes in the East Greenland Current: A decade of observations. Geophysical Res. Lett.36, L23611. doi: 10.1029/2009gl041278
12
de Steur L. Peralta-Ferriz C. Pavlova O. (2018). Freshwater export in the east Greenland current freshens the North Atlantic. Geophysical Res. Lett.45, 13,359–13,366. doi: 10.1029/2018gl080207
13
Dickson R. R. Meincke J. Malmberg S.-A. Lee J. (1988). The “great salinity anomaly” in the Northern North Atlantic 1968–1982. Prog. Oceanography20, 103–151. doi: 10.1016/0079-6611(88)90049-3
14
Dodd P. A. Heywood K. J. Meredith M. P. Naveira-Garabato A. C. Marca A. D. Falkner K. K. (2009). Sources and fate of freshwater exported in the East Greenland Current. Geophysical Res. Lett.36, L19608. doi: 10.1029/2009gl039663
15
Dodd P. A. Rabe B. Hansen E. Falck E. Mackensen A. Rohling E. et al . (2012). The freshwater composition of the Fram Strait outflow derived from a decade of tracer measurements. J. Geophysical Research: Oceans117, C11005. doi: 10.1029/2012jc008011
16
Giles K. A. Laxon S. W. Ridout A. L. Wingham D. J. Bacon S. (2012). Western Arctic Ocean freshwater storage increased by wind-driven spin-up of the Beaufort Gyre. Nat. Geosci.5, 194–197. doi: 10.1038/ngeo1379
17
Good S. A. Martin M. J. Rayner N. A. (2013). EN4: Quality controlled ocean temperature and salinity profiles and monthly objective analyses with uncertainty estimates. J. Geophysical Research: Oceans118, 6704–6716. doi: 10.1002/2013jc009067
18
Grivault N. Hu X. Myers P. G. (2018). Impact of the surface stress on the volume and freshwater transport through the Canadian arctic archipelago from a high-resolution numerical simulation. J. Geophysical Research: Oceans123, 9038–9060. doi: 10.1029/2018jc013984
19
Haine T. W. N. Curry B. Gerdes R. Hansen E. Karcher M. Lee C. et al . (2015). Arctic freshwater export: Status, mechanisms, and prospects. Global Planetary Change125, 13–35. doi: 10.1016/j.gloplacha.2014.11.013
20
Hersbach H. Bell B. Berrisford P. Biavati G. Horányi A. Muñoz Sabater J. et al . (2023). ERA5 monthly averaged data on single levels from 1940 to present. Copernicus Climate Change Service (C3S) Climate Data Store (CDS). doi: 10.24381/cds.f17050d7
21
Holliday N. P. Bersch M. Berx B. Chafik L. Cunningham S. Florindo-Lopez C. et al . (2020). Ocean circulation causes the largest freshening event for 120 years in eastern subpolar North Atlantic. Nat. Commun.11, 585. doi: 10.1038/s41467-020-14474-y
22
Jahn A. Tremblay B. Mysak L. A. Newton R. (2009). Effect of the large-scale atmospheric circulation on the variability of the Arctic Ocean freshwater export. Climate Dynamics34, 201–222. doi: 10.1007/s00382-009-0558-z
23
Jahn A. Tremblay L. B. Newton R. Holland M. M. Mysak L. A. Dmitrenko I. A. (2010). A tracer study of the Arctic Ocean’s liquid freshwater export variability. J. Geophysical Research: Oceans115, C07015. doi: 10.1029/2009jc005873
24
Karcher M. Gerdes R. Kauker F. Köberle C. Yashayaev I. (2005). Arctic Ocean change heralds North Atlantic freshening. Geophysical Res. Lett.32, L21606. doi: 10.1029/2005gl023861
25
Karpouzoglou T. De Steur L. Smedsrud L. H. Karcher M. Sumata H. (2024). Three forcing mechanisms of freshwater transport in fram strait. J. Geophysical Research: Oceans129, e2024JC020930. doi: 10.1029/2024jc020930
26
Karpouzoglou T. de Steur L. Smedsrud L. H. Sumata H. (2022). Observed changes in the arctic freshwater outflow in fram strait. J. Geophysical Research: Oceans127, e2021JC018122. doi: 10.1029/2021jc018122
27
Li H. Fedorov A. V. (2021). Persistent freshening of the Arctic Ocean and changes in the North Atlantic salinity caused by Arctic sea ice decline. Climate Dynamics57, 2995–3013. doi: 10.1007/s00382-021-05850-5
28
McPhee M. G. Proshutinsky A. Morison J. H. Steele M. Alkire M. B. (2009). Rapid change in freshwater content of the Arctic Ocean. Geophysical Res. Lett.36, L10602. doi: 10.1029/2009gl037525
29
Meier W. N. Ivanoff A. (2017). Intercalibration of AMSR2 NASA team 2 algorithm sea ice concentrations with AMSR-E slow rotation data. IEEE J. Selected Topics Appl. Earth Observations Remote Sens.10, 3923–3933. doi: 10.1109/jstars.2017.2719624
30
Meredith M. Heywood K. Dennis P. Goldson L. White R. Fahrbach E. et al . (2001). Freshwater fluxes through the Western Fram Strait. Geophysical Res. Lett.28, 1615–1618. doi: 10.1029/2000gl011992
31
Morison J. Kwok R. Peralta-Ferriz C. Alkire M. Rigor I. Andersen R. et al . (2012). Changing Arctic Ocean freshwater pathways. Nature481, 66–70. doi: 10.1038/nature10705
32
Münchow A. (2016). Volume and freshwater flux observations from nares strait to the west of Greenland at daily time scales from 2003 to 2009. J. Phys. Oceanography46, 141–157. doi: 10.1175/jpo-d-15-0093.1
33
Peng G. Meier W. N. Scott D. J. Savoie M. H. (2013). A long-term and reproducible passive microwave sea ice concentration data record for climate studies and monitoring. Earth System Sci. Data5, 311–318. doi: 10.5194/essd-5-311-2013
34
Peterson I. Hamilton J. Prinsenberg S. Pettipas R. (2012). Wind-forcing of volume transport through Lancaster Sound. J. Geophysical Research: Oceans117, C11018. doi: 10.1029/2012jc008140
35
Polyakov I. V. Ingvaldsen R. B. Pnyushkov A. V. Bhatt U. S. Francis J. A. Janout M. et al . (2023). Fluctuating Atlantic inflows modulate Arctic atlantification. Science381, 972–979. doi: 10.1126/science.adh5158
36
Prinsenberg S. J. Hamilton J. (2005). Monitoring the volume, freshwater and heat fluxes passing through Lancaster sound in the Canadian arctic archipelago. Atmosphere-Ocean43, 1–22. doi: 10.3137/ao.430101
37
Proshutinsky A. Dukhovskoy D. Timmermans M. L. Krishfield R. Bamber J. L. (2015). Arctic circulation regimes. Philos. Trans. A Math Phys. Eng. Sci.373, 20140160. doi: 10.1098/rsta.2014.0160
38
Proshutinsky A. Y. Johnson M. A. (1997). Two circulation regimes of the windmestion Arctic Ocean. J. Geophysical Research: Oceans102, 12493–12514. doi: 10.1029/97jc00738
39
Proshutinsky A. Krishfield R. Timmermans M. L. Toole J. Carmack E. McLaughlin F. et al . (2009). Beaufort Gyre freshwater reservoir: State and variability from observations. J. Geophysical Research: Oceans114, C00A10. doi: 10.1029/2008jc005104
40
Proshutinsky A. Krishfield R. Toole J. M. Timmermans M. L. Williams W. Zimmermann S. et al . (2019). Analysis of the beaufort gyre freshwater content in 2003-2018. J. Geophysical Research: Oceans124, 9658–9689. doi: 10.1029/2019JC015281
41
Rabe B. Dodd P. A. Hansen E. Falck E. Schauer U. Mackensen A. et al . (2013). Liquid export of Arctic freshwater components through the Fram Strait 1998–2011. Ocean Sci.9, 91–109. doi: 10.5194/os-9-91-2013
42
Rabe B. Karcher M. Kauker F. Schauer U. Toole J. M. Krishfield R. A. et al . (2014). Arctic Ocean basin liquid freshwater storage trend 1992–2012. Geophysical Res. Lett.41, 961–968. doi: 10.1002/2013gl058121
43
Rabe B. Schauer U. Mackensen A. Karcher M. Hansen E. Beszczynska-Möller A. (2009). Freshwater components and transports in the Fram Strait – recent observations and changes since the late 1990s. Ocean Sci.5, 219–233. doi: 10.5194/os-5-219-2009
44
Rudels B. Korhonen M. Budéus G. Beszczynska-Möller A. Schauer U. Nummelin A. et al . (2012). The East Greenland Current and its impacts on the Nordic Seas: observed trends in the past decade. ICES J. Mar. Sci.69, 841–851. doi: 10.1093/icesjms/fss079
45
Serreze M. C. Barrett A. P. Slater A. G. Woodgate R. A. Aagaard K. Lammers R. B. et al . (2006). The large-scale freshwater cycle of the Arctic. J. Geophysical Research: Oceans111, C11010. doi: 10.1029/2005jc003424
46
Steele M. Boyd T. (1998). Retreat of the cold halocline layer in the Arctic Ocean. J. Geophysical Research: Oceans103, 10419–10435. doi: 10.1029/98jc00580
47
Tao S. Du L. (2021). Influence of atmospheric momentum input on Beaufort Gyre long term changes under the Arctic sea ice retreat. Haiyang Xuebao43, 100–113. doi: 10.12284/hyxb2021123
48
Timmermans M. L. Toole J. M. (2023). The arctic ocean’s beaufort gyre. Ann. Rev. Mar. Sci.15, 223–248. doi: 10.1146/annurev-marine-032122-012034
49
Trenberth K. E. Shea D. J. (2006). Atlantic hurricanes and natural variability in 2005. Geophysical Res. Lett.33, L12704. doi: 10.1029/2006gl026894
50
Wang Q. Danilov S. (2022). A synthesis of the upper Arctic Ocean circulation during 2000–2019: understanding the roles of wind forcing and sea ice decline. Front. Mar. Sci.9, 863204. doi: 10.3389/fmars.2022.863204
51
Wang Q. Danilov S. Jung T. (2024). Arctic freshwater anomaly transiting to the North Atlantic delayed within a buffer zone. Nat. Geosci.17, 1218–1221. doi: 10.1038/s41561-024-01592-1
52
Wang Q. Danilov S. Sidorenko D. Wang X. (2021). Circulation pathways and exports of arctic river runoff influenced by atmospheric circulation regimes. Front. Mar. Sci.8. doi: 10.3389/fmars.2021.707593
53
Wang Z. Hamilton J. Su J. (2017). Variations in freshwater pathways from the Arctic Ocean into the North Atlantic Ocean. Prog. Oceanography155, 54–73. doi: 10.1016/j.pocean.2017.05.012
54
Wang Q. Shu Q. Danilov S. Sidorenko D. (2022). An extreme event of enhanced Arctic Ocean export west of Greenland caused by the pronounced dynamic sea level drop in the North Atlantic subpolar gyre in the mid-to-late 2010s. Environ. Res. Lett.17. doi: 10.1088/1748-9326/ac5562
55
Wang Q. Wekerle C. Danilov S. Sidorenko D. Koldunov N. Sein D. et al . (2019). Recent sea ice decline did not significantly increase the total liquid freshwater content of the Arctic Ocean. J. Climate32, 15–32. doi: 10.1175/jcli-d-18-0237.1
56
Watanabe E. Wang J. Sumi A. Hasumi H. (2006). Arctic dipole anomaly and its contribution to sea ice export from the Arctic Ocean in the 20th century. Geophysical Res. Lett.33, L23703. doi: 10.1029/2006gl028112
57
Wekerle C. Wang Q. Danilov S. Jung T. Schröter J. (2013). The Canadian Arctic Archipelago throughflow in a multiresolution global model: Model assessment and the driving mechanism of interannual variability. J. Geophysical Research: Oceans118, 4525–4541. doi: 10.1002/jgrc.20330
58
Wu B. Wang J. Walsh J. E. (2006). Dipole anomaly in the winter arctic atmosphere and its association with sea ice motion. J. Climate19, 210–225. doi: 10.1175/JCLI3619.1
59
Zhang J. Weijer W. Steele M. Cheng W. Verma T. Veneziani M. (2021). Labrador Sea freshening linked to Beaufort Gyre freshwater release. Nat. Commun.12, 1229. doi: 10.1038/s41467-021-21470-3
Summary
Keywords
freshwater transport, freshwater content, Arctic Ocean, Arctic Oscillation, freshwater reservoir
Citation
Zhang J and Du L (2025) Freshwater transport variation through Fram and Davis Strait influenced by atmospheric circulation. Front. Mar. Sci. 12:1608187. doi: 10.3389/fmars.2025.1608187
Received
08 April 2025
Accepted
14 July 2025
Published
04 August 2025
Volume
12 - 2025
Edited by
Qi Shu, Ministry of Natural Resources, China
Reviewed by
Yu Zhang, Shanghai Ocean University, China
Shizhu Wang, Ministry of Natural Resources, China
Updates
Copyright
© 2025 Zhang and Du.
This is an open-access article distributed under the terms of the Creative Commons Attribution License (CC BY). The use, distribution or reproduction in other forums is permitted, provided the original author(s) and the copyright owner(s) are credited and that the original publication in this journal is cited, in accordance with accepted academic practice. No use, distribution or reproduction is permitted which does not comply with these terms.
*Correspondence: Ling Du, duling@ouc.edu.cn
Disclaimer
All claims expressed in this article are solely those of the authors and do not necessarily represent those of their affiliated organizations, or those of the publisher, the editors and the reviewers. Any product that may be evaluated in this article or claim that may be made by its manufacturer is not guaranteed or endorsed by the publisher.