Abstract
The 21st Century Maritime Silk Road (MSR) is a key component of China’s Belt and Road Initiative (BRI), launched in 2013 to enhance global connectivity and foster economic cooperation. By promoting infrastructure development, trade facilitation, and cultural exchange, the MSR seeks to strengthen maritime connectivity, boost regional economic integration, and create new growth opportunities for participating countries. The MSR policy has a positive promoting effect on the economic construction and port development of China’s coastal ports. This study established a difference-in-difference model (DID) to explore the impact of MSR policies on SO2 emissions from coastal and inland ports in China. We searched for panel data from 34 coastal and inland ports in China from 2008 to 2023, and based on this panel data, established a DID model for regression analysis. The regression analysis results indicate that the implementation of MSR policy has a significant positive impact on SO2 emissions from coastal and inland ports in China. Some control variables, such as the total amount of imported goods and domestic emission control area (DECA) policies, also have a significant negative impact on SO2 emissions, while the number of berths, population, and total amount of exported goods have a significant positive impact on SO2 emissions. Based on the regression results of the model, we have proposed some suggestions for port operators and relevant governments to better adapt to MSR policies, promote economic development and environmental protection of ports.
1 Introduction
In September and October 2013, China proposed the joint construction of the Silk Road Economic Belt and the 21st-Century Maritime Silk Road (MSR), also known as the Belt and Road Initiative, during his visits to Central and Southeast Asian countries. The MSR has established the China Indian Ocean Africa Mediterranean Blue Economic Corridor, the China Oceania South Pacific Blue Economic Corridor, and the Arctic Ocean Blue Economic Corridor. Through the “the Belt and Road” initiative, countries along the Belt and Road can promote policy coherence at different levels, improve infrastructure connectivity, and strengthen trade relations (Xie et al., 2023). The MSR aims to revive and expand the ancient maritime trade routes that historically linked China with Southeast Asia, South Asia, the Middle East, Africa, and Europe. In March 2015, China released the “Vision and Actions for Promoting the Co construction of the Silk Road Economic Belt and the 21st-Century Maritime Silk Road”, outlining Shanghai, Zhejiang, Hainan, Guangdong, and Fujian. In addition, the positioning of coastal cities has also been clarified. The initiative focuses on modernizing port facilities, improving shipping logistics, and fostering sustainable maritime practices, while also addressing challenges such as environmental protection and geopolitical tensions. As a cornerstone of China’s global economic strategy, the MSR represents a significant effort to reshape international trade networks and promote shared prosperity in the 21st century.
Since the proposal of the MSR initiative, the shipping, ports, and trade of countries and regions along the route have all developed together under the initiative. In recent years, China and South Korea have each accounted for more than one-third of the world’s total shipbuilding orders, alternately ranking first in the world. In 2024, China’s shipbuilding completion reached 48.18 million deadweight tons, accounting for 55.7% of the global total. The newly received order volume is 113.05 million deadweight tons, accounting for 74.1% of the global total (Ministry of Industry and Information Technology of the People’s Republic of China, 2025). Under the influence of the MSR policy, China’s shipping industry has flourished, with more and more ships being delivered, becoming the backbone of maritime silk. However, with development of the shipping industry, pollutants such as SO2 emitted by ships pose a serious challenge to the air quality of port cities and surrounding areas.
SO2, as a major atmospheric pollutant, not only poses a threat to human health but also causes environmental problems such as acid rain. In response to ship emissions pollution, the International Maritime Organization (IMO) has formulated a global sulfur limit order, requiring that the sulfur content of ship fuel oil must not exceed 0.5% worldwide from 2020 (Xiao et al., 2022). As a member state of the IMO, China actively fulfills its international obligations by implementing stricter policies for ship emission control and establishing Emission Control Areas (ECAs) in coastal and inland ports. The implementation of MSR policy has had a profound impact on SO2 emissions from coastal and inland ports in China. On the one hand, MSR promotes the growth of port throughput, which may lead to an increase in ship emissions; On the other hand, MSR has promoted the construction of green ports, facilitated the application of clean energy and emission reduction technologies, and helped to reduce the level of SO2 emissions in port areas. Therefore, scientifically evaluating the impact of MSR policies on SO2 emissions from coastal and inland ports in China is of great significance for formulating effective emission reduction measures and promoting green and sustainable development of the shipping industry.
The main purpose of this study is to explore the impact of MSR policy on SO2 emissions from coastal ports in China using the difference-in-difference (DID) model and provide relevant recommendations.
2 Literature review
As an important part of “the Belt and Road” initiative, the MSR has promoted economic exchanges and trade cooperation with countries along the route, and greatly promoted the development of the shipping industry. Most existing researches on MSR focuses on the economic impact of MSR policies on cities along the route, as well as their effects on port size and investment. In some existing researches, the impact of MSR on urban development mainly includes economic development and urban expansion, urban investment, development of urban logistics industry, and environmental protection. In terms of economic development and urban expansion, MSR has played a positive role in promoting urban expansion and development, with population, port connectivity, and Chinese investment playing important roles (Li et al., 2024). Under the initiative of MSR, China’s investment in marine and coastal areas is rapidly increasing, which can revitalize the local economy by providing new employment opportunities and income for local residents (Song and Fabinyi, 2022). In terms of investment, the MSR initiative is promoting cooperation and win-win outcomes among countries in various aspects, and facilitating investment between countries. Transportation infrastructure has become the main battlefield for investment (Chen and Guo, 2020). In terms of the development of the logistics industry, Xu et al. (2023) indicated that the proposal of MSR has promoted the logistics development of coastal provinces, and the turnover rate of goods has shown an upward trend. Liang and Liu (2020) conducted empirical analysis on countries along the MSR and found that improving the interconnectivity of port infrastructure can enhance logistics performance and economic growth. In addition to economic research, in terms of environmental protection, Xin and Wang (2022) found that the “the Belt and Road” initiative significantly promoted the reduction of carbon intensity of countries along the route.
Ports are an important component of MSR, the development of ports will have a positive impact on urban development. Liu et al. (2022) used Xiamen Port as an example, and the research conclusion proved that the development of Xiamen Port has made significant contributions to the regional GDP of Xiamen City. Investment in ports along the MSR should adopt corresponding and more targeted investment plans based on the actual resilience of each port (Lin and Liu, 2023). The investment in port environment and facilities is of practical significance as they have a significant positive impact on port competitiveness (Peng and Zhang, 2024). According to their respective roles, ports can be divided into four categories: international hub ports, regional hub ports, node ports, and regional gateway ports (Wang et al., 2021). The focus of the port system is gradually shifting from Europe to Asia (Zhang et al., 2023). The operational efficiency of ports, like the cargo throughput of ports, is an important indicator for evaluating whether a port has strong comprehensive strength (Wang and Ahn, 2021). Weak economic connections between ports and hinterlands can affect the operational efficiency of ports, thereby affecting the cooperation effectiveness of MSR (Huang et al., 2021). The safety of maritime routes is the key to the sustainable development of the 21st century MSR, and ports are the foundation of maritime route safety (Chang, 2018; Chang and Khan, 2019). Jiang et al. (2022) proposed a new security assessment method to address the issues of incomplete and ambiguous risk data, as well as operational and environmental uncertainties encountered in the risk analysis process of ports along the MSR.
The DID model is a common method for policy evaluation and a popular approach for studying treatment effects. Some studies have used the DID research method to explore the impact of relevant policies on the environment. Yao et al. (2022) evaluated the impact of the emissions trading system on China’s SO2 emissions using a DID model based on panel data from 285 cities in China from 2004 to 2018. Air pollution intensive industries are an important source of SO2 emissions (Zhou et al., 2023a). Guo et al. (2022) explored the effectiveness of corporate environmental governance under low-carbon pilot policies based on the DID model. The result found that these policies significantly increased the SO2 emissions of enterprises due to the backlog of investment in SO2 emission control. Meng et al. (2024) validated based on the DID model that pollutant reduction policies help Chinese manufacturing enterprises effectively reduce SO2 emission intensity. Chen et al. (2023) confirmed using the DID model that national ecological industrial demonstration parks can help reduce urban SO2 and CO2 emissions. Some studies have explored the impact of China’s ECA policy on SO2 and particulate matter emissions based on the DID model (Wan et al., 2019, 2021). Zhang et al. (2024a) measured the carbon emissions of 39 major ports in China and explored and confirmed the positive impact of port intelligence on port carbon emission efficiency using the generalized DID method. In addition to using the DID method to study the impact of policies on port pollutant emissions, Huang et al. (2025) investigated the effect of MSR policies on port operational efficiency, while Zhou et al. (2023b) studied the impact of port integration on port operational efficiency.
The main academic contribution of this study is to explore the impact of the MSR policy on SO2 emissions from various coastal ports in China using a DID model research method. In terms of reality recommendations, based on the regression results of the model, recommendations are provided to relevant governments and ports to enable ports to seize the opportunity of the MSR, continuously improve their own level and emission reduction capabilities, and achieve dual development of ports and urban hinterlands.
3 Data and methods
3.1 Data source
We selected 34 coastal and inland ports in China as the research objects and studied their sulfur dioxide emissions as the dependent variable. These 34 ports include ports affected by MSR policies (located in Shanghai, Zhejiang, Fujian, Guangdong, and Hainan) and ports not affected by policies. The MSR policy has been implemented since 2013, and the sample selection should include data from at least 5 years before and after. The time range of this study is from 2008 to 2023. Due to the incomplete release of statistical data for 2024, we have decided to use the time range of the model from 2008 to 2023.
The distribution of ports studied in this article is shown in the Figure 1.
Figure 1
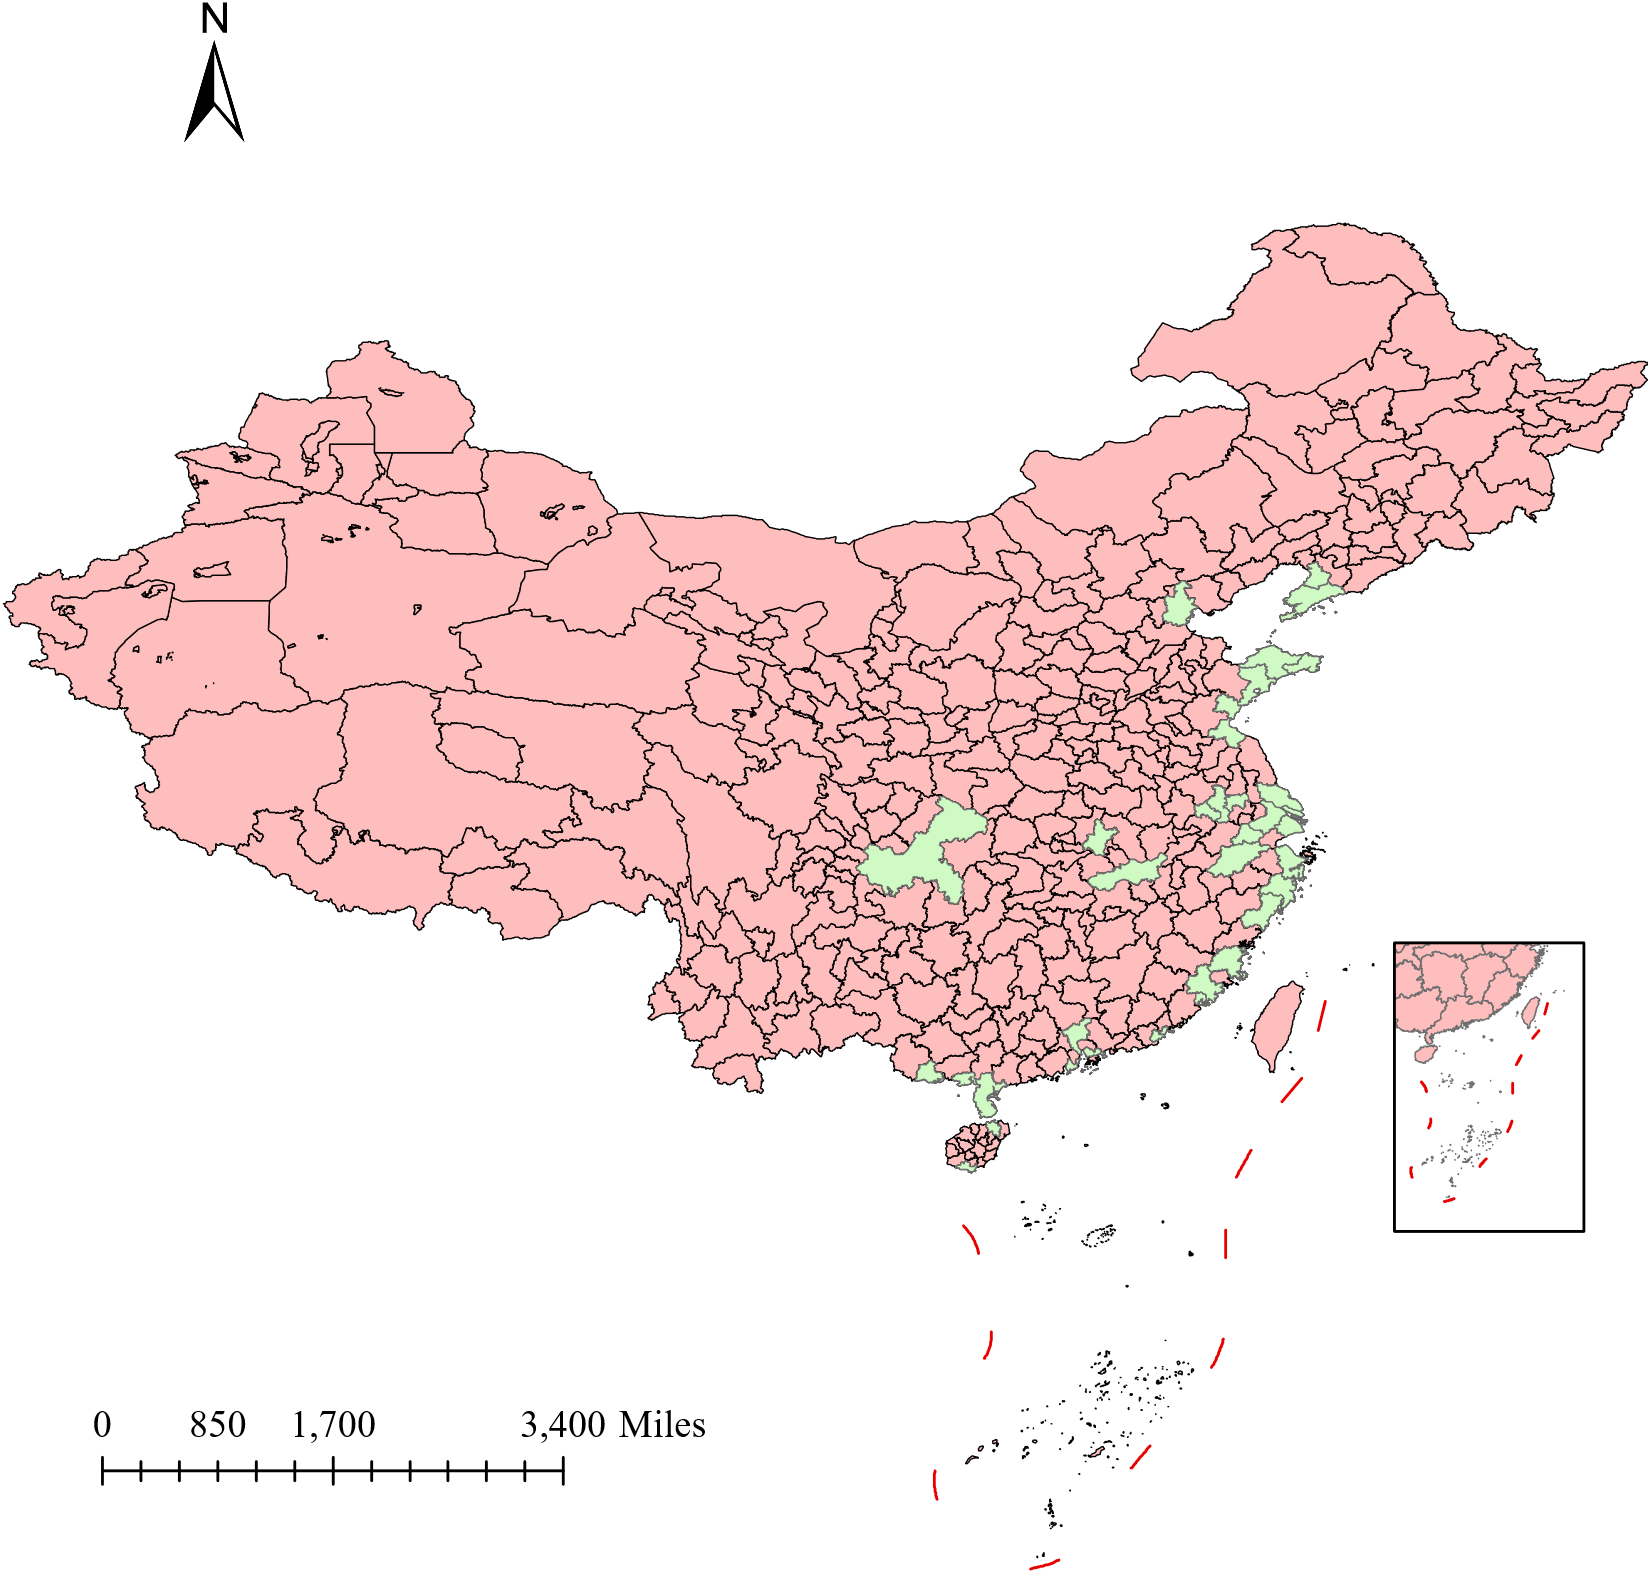
The distribution of 34 ports in this study.
Among these ports, 15 ports as the treatment group and 19 ports as the control group. The MSR includes Shanghai, Fujian, Guangdong, Zhejiang, and Hainan. Therefore, the ports of these five provinces and cities are used as the treatment group for this study, and the ports of other provinces and cities are used as the control group to establish a difference in differences model. The Chinese ports used as treatment and control groups are shown in the Table 1.
Table 1
| Treatment group | Control group | ||
|---|---|---|---|
| Shanghai | Shanghai Port | Liaoning | Dalian Port |
| Zhejiang | Hangzhou Port | Yingkou Port | |
| Huzhou Port | Shandong | Qingdao Port | |
| Wenzhou Port | Weihai Port | ||
| Taizhou Port | Yantai Port | ||
| Ningbo-Zhoushan Port | Rizhao Port | ||
| Fujian | Xiamen Port | Tianjin | Tianjin Port |
| Fuzhou Port | Hebei | Qinhuangdao Port | |
| Quanzhou Port | Guangxi | Fangchenggang Port | |
| Guangdong | Guangzhou Port | Beihai Port | |
| Shenzhen Port | Jiangsu | Nanjing Port | |
| Zhuhai Port | Nantong Port | ||
| Shantou Port | Suzhou Port | ||
| Zhanjiang Port | Zhenjiang Port | ||
| Hainan | Haikou Port | Lianyungang Port | |
| Anhui | Ma’anshan Port | ||
| Chongqing | Chongqing Port | ||
| Hubei | Wuhan Port | ||
| Jiangxi | Jiujiang Port | ||
The ports of treatment and control groups in this study.
We select some control variables to control for the influence of other factors on the dependent variable. Research has shown that port cargo throughput (Zhang et al., 2022), economic development scale (Yan et al., 2022), port infrastructure construction (Cheng et al., 2019; Nguyen et al., 2021), population size (Chang et al., 2009; Zhang et al., 2015), and port foreign trade development (He and Huang, 2022; Ünal et al., 2023; Wang and Li, 2024) have a certain impact on port pollutant emissions. There are differences in port size, economic development level, and industrial structure among different ports. We use port cargo throughput and number of berths to represent the differences in port size among different ports. We choose population GDP Exploring the impact of economic development differences in cities with different ports on port sulfur emissions based on town residents’ consumption expenditures and total social retail sales. We explore the impact of industrial structure on port sulfur emissions using the ratio of total industrial output to GDP. Reflecting the impact of port foreign trade on port sulfur emissions through variables such as total import and export goods and foreign direct investment (FDI) (Xin and Wang, 2022). In addition, considering that the implementation of domestic emission control area (DECA) policies will also have an impact on port sulfur emissions, we have included DECA as a control variable in the model. Considering that with technological advancements in port operations, ships and ports may adopt new emission control technologies to reduce atmospheric pollutant emissions. We use the shore power coverage rate of the port as a control variable to study its impact on SO2 emissions. In addition, the COVID-19 also occurred within the time frame of our study. Considering the possible impact of this unpredictable time on the results, we add the control variable of COVID-19 epidemic.
Therefore, we selected the port cargo throughput, GDP, the number of berths, population, total import and export goods, town residents’ consumption expenditure, FDI, the ratio of total industrial output to GDP, DECA, shore pawer coverage rate, COVID-19, and total social retail sales are used as control variables to establish the model in this study. We obtained statistical data from 2008 to 2023 through the statistical yearbooks and port yearbooks of various provinces and cities. We integrate data from different sources to build a complete dataset, providing a unified data source for subsequent analysis. We identify and handle outliers that may affect the analysis results, and use appropriate methods to correct or eliminate them. We use methods such as exponential smoothing to supplement missing data for some years. When conducting data statistics on the total import and export volume of goods and foreign direct investment in the region, due to the inconsistency of measurement units in various provinces and cities, this article uniformly converts them into US dollars. In the conversion process, the average exchange rate of US dollars to RMB over the years is used for conversion.
3.2 Evaluation model
The DID method is a popular approach for exploring the “processing effects”. The usage scenario of difference-in-difference is that in panel data, individuals can be divided into two categories, namely the “treatment group” affected by policy shocks and the “control group” not affected by policies. The focus is on policy shocks and whether they have been impacted by policies, achieved through the introduction of dummy variables. Set the pre shock to 0 and 1, and the control shock to 0 and 1. we utilized the DID model because it can isolate changes in outcomes over time across samples that were and weren’t influenced by the policies, as well as control systematic disparities between the treatment and control groups. The DID model can eliminate any biases that may come from trends brought on by additional factors and it can effectively avoid the endogenous issues that frequently occur. The suggested DID model can be defined as Equation 1 (Wan et al., 2019):
where the SO2 value is the interpreted variable, and the subscripts stands for the ports and for year, respectively. stands for a set of control variables. The data utilized in this study were collected statistically from 2008 to 2023. The parameters of DID model are shown in the Table 2.
Table 2
| Interpretation | Before MSR implementation () | After MSR implementation () | Difference |
|---|---|---|---|
| Ports within the MSR treatment group, () | |||
| Ports not within the MSR control group, (0) | |||
| DID estimation |
DID model parameters.
In this study, ports within the MSR boundary were considered as the treatment group, while ports outside the MSR boundary were considered as the control group. We further divided the treatment group and the control group into the treatment group and the control group before and after the implementation of the MSR policy. Distinguish these four samples by setting virtual variables and . is a grouping dummy variable (dummy variable of the region). represents the city ports within the MSR designated area, and represents the city ports outside the MSR designated area. is the dummy variable of policy implementation (the dummy variable of time). represents the stage before the implementation of the MSR policy (2008–2012 in this study), and represents the period after the implementation of the MSR policy (2013–2023 in this study). is the interaction term between the grouping dummy variable and the policy implementation dummy variable. The coefficient is the DID project, representing the net benefits of policy implementation.
3.3 Variables and descriptive statistics
We provide a statistical description of all sample ports, as shown in the Table 3. From the table, it can be seen that the maximum port cargo throughput is 1,323.70 million tons, which is the port cargo throughput of Ningbo-Zhoushan Port in 2023. Ningbo-Zhoushan Port has been ranked first in the world in terms of cargo throughput for 16 consecutive years. The maximum number of berths is 1,244.00, which is the total number of berths in Chongqing Port in 2011. The maximum GDP is 4,721.87 billion yuan, which is the regional GDP of Shanghai in 2023. At the same time, the consumption expenditure of town residents, FDI, and the total retail sales of consumer goods in Shanghai are also the highest values among all samples. The regional gross domestic product has a significant positive impact on port cargo throughput. The impact of economic factors on port container throughput is more significant than factors such as port operations (Zhou and Shu, 2024). The maximum total import value of goods is 385.29 billion US dollars, which is the total import value of Shanghai Port in 2021, while the maximum export value of goods is 327.92 billion US dollars, which is the total export value of Shenzhen Port in 2022. In 2022, the highest proportion of Shenzhen’s main exported goods will be automatic data processing equipment and its components. Shenzhen’s export trade volume has ranked first in the country for 31 consecutive years, and in recent years, exports of electric manned vehicles, lithium batteries, and solar cells have grown rapidly. The maximum population is 34.16 million people, which is the population of Chongqing in 2019. The maximum ratio of industrial output value to GDP comes from data in Qingdao in 2010. From 2012 to 2016, the industrialization level of Qingdao has entered the post industrialization era, which may be related to the imperfect industrial structure of Qingdao at that time (Wang and Ren, 2018). The maximum SO2 emissions are 572,700.00 tons, which is the SO2 emissions of Chongqing Port in 2010. As China begins to increase its efforts in environmental regulation, SO2 emissions are also showing a decreasing trend year by year. By 2023, the SO2 emissions from Chongqing Port will be 38,817 tons.
Table 3
| Variable | Mean | Std. dev | Min | Max |
|---|---|---|---|---|
| Cargo throughput | 23,514.79 | 20,842.88 | 596.00 | 132,370.00 |
| The number of berths | 250.24 | 268.95 | 14.00 | 1,244.00 |
| GDP | 7,038.38 | 7,588.86 | 212.18 | 47,218.66 |
| Total amount of imported goods | 336.76 | 590.49 | 2.16 | 3,852.90 |
| Total amount of exported goods | 455.64 | 665.38 | 2.64 | 3,279.18 |
| Population | 732.83 | 639.53 | 84.76 | 3,416.29 |
| Town residents’ consumption expenditure | 25,516.28 | 9,927.48 | 8,203.76 | 54,919.00 |
| FDI | 32.03 | 41.65 | 0.20 | 240.87 |
| Total industrial output value/GDP | 1.61 | 0.60 | 0.20 | 3.59 |
| Total retail sales of consumer goods in society | 10,002.92 | 9,469.56 | 236.47 | 49,192.68 |
| SO2 emissions | 51,827.06 | 84,029.27 | 22.23 | 782,000.00 |
Descriptive statistics of all samples.
The descriptive statistics of the treatment group’s data are shown in the Table 4. The minimum cargo throughput of the treatment group port is 28.06 million tons, which is the cargo throughput of Shantou Port in 2008. Compared with other ports in Guangdong Province, Shantou Port has a lower cargo throughput and relatively fewer berths. Shantou Port is the hub port of the Pearl River Delta port group. The maximum number of berths is 1238, which is the number of berths in Shanghai Port in 2015, and the minimum value is 32, which is the number of berths in Haikou Port in 2013. The number of port berths is closely related to the port’s cargo throughput (Zhang, 2014). The number of berths in Haikou Port is relatively small compared to other ports in the treatment group, with a total of no more than 100. The maximum population is 28.25 million, which is the total population of Shenzhen in 2023. In 2023, the total population of Shenzhen will increase significantly, with an increase of about 10 million compared to the previous year. The numerous employment opportunities in Shenzhen have attracted a large population. The maximum SO2 emission is 446,100.00 tons, which is the emission data of Shanghai Port in 2008. China implemented the ECA policies on January 1, 2016, requiring ships to use fuel in accordance with sulfur content restrictions when entering coastal and inland emission control areas. The implementation of ECA policies has also effectively reduced SO2 emissions to a certain extent. Taking Shanghai Port as an example, the SO2 emissions in 2015 were 170,800 tons, and in 2016 they were 74,200.00 tons, indicating a significant decrease in SO2 emissions. And since the implementation of the ship emission control zone policy in 2016, SO2 emissions have also shown a decreasing trend year by year.
Table 4
| Variable | Mean | Std. dev | Min | Max |
|---|---|---|---|---|
| Cargo throughput | 23,957.76 | 26,037.66 | 2,806.50 | 132,370.00 |
| The number of berths | 324.43 | 304.23 | 32.00 | 1,238.00 |
| GDP | 8,434.12 | 9,021.22 | 439.83 | 47,218.66 |
| Total amount of imported goods | 471.26 | 776.64 | 6.87 | 3,852.90 |
| Total amount of exported goods | 661.63 | 821.49 | 7.90 | 3,279.18 |
| Population | 764.41 | 546.70 | 148.11 | 2,825.28 |
| Town residents’ consumption expenditure | 28,864.39 | 10,667.95 | 9,583.40 | 54,919.00 |
| FDI | 35.72 | 48.74 | 0.28 | 240.87 |
| Total industrial output value/GDP | 1.45 | 0.51 | 0.30 | 2.80 |
| Total retail sales of consumer goods in society | 11,158.11 | 10,452.79 | 305.41 | 49,192.68 |
| SO2 emissions | 37,594.29 | 57,958.53 | 22.23 | 446,100.00 |
Descriptive statistics of treatment group samples.
The descriptive statistics of the control group’s data are shown in the Table 5. The maximum cargo throughput is 68,367 tons, which is the data for Qingdao Port in 2023. The minimum value is 596 tons, which is the data from Jiujiang Port in 2008. The difference between the maximum and minimum port cargo throughput of the control group should be smaller than that of the treatment group. The maximum GDP is 3014.50 billion yuan, which is the regional GDP of Chongqing in 2023.
Table 5
| Variable | Mean | Std. dev | Min | Max |
|---|---|---|---|---|
| Cargo throughput | 23,165.08 | 15,604.07 | 596.00 | 68,367.00 |
| The number of berths | 191.67 | 220.96 | 14.00 | 1,244.00 |
| GDP | 5,936.48 | 6,021.06 | 212.18 | 30,145.79 |
| Total amount of imported goods | 230.58 | 351.37 | 2.16 | 1,620.74 |
| Total amount of exported goods | 293.02 | 448.28 | 2.64 | 2,305.78 |
| Population | 707.89 | 704.13 | 84.76 | 3,416.29 |
| Town residents’ consumption expenditure | 22,873.03 | 8,423.90 | 8,203.76 | 50,656.00 |
| FDI | 29.12 | 34.86 | 0.20 | 211.34 |
| Total industrial output value/GDP | 1.74 | 0.64 | 0.20 | 3.59 |
| Total retail sales of consumer goods in society | 9,090.93 | 8,522.10 | 236.47 | 44,519.39 |
| SO2 emissions | 63,063.47 | 98,574.54 | 2,430.00 | 782,000.00 |
Descriptive statistics of control group samples.
4 Results
4.1 Model results
We conducted the DID regression, and the regression results are shown in the table. We set 2013 as the year of policy implementation, and all ports prior to 2013 were not affected by policies related to the MSR. To mitigate the potential influence of outliers on our empirical results, we apply winsorization to the key continuous variables in our analysis. Winsorization involves trimming the extreme values of a distribution by replacing observations below the p-th percentile with the value at the p-th percentile and observations above the (100−p)-th percentile with the value at the (100−p)-th percentile. In this study, we winsorize the top and bottom 1% of the distributions of our dependent and control variables to reduce the impact of extreme observations while preserving the overall structure of the data. This approach ensures that our estimates are not unduly influenced by outliers, which could otherwise distort the regression coefficients and lead to misleading inferences. By incorporating winsorized variables into our DID framework, we enhance the robustness of our findings and provide a more reliable assessment of the treatment effects. The DID model regression results is shown in the Table 6.
Table 6
| Variables | Coefficient | SD | z | P>z | [95% conf. interval] | |
|---|---|---|---|---|---|---|
| Lower bound | Upper bound | |||||
| DID | 18,184.45 | 6,311.03 | 2.88 | 0.004 | 5,815.04 | 30,553.85 |
| Cargo throughput | 0.09 | 0.21 | 0.44 | 0.658 | −0.33 | 0.52 |
| The number of berths | 128.04 | 21.52 | 5.95 | 0.000 | 85.85 | 170.23 |
| GDP | 2.15 | 1.56 | 1.38 | 0.167 | −0.90 | 5.22 |
| Total amount of imported goods | −25.44 | 12.74 | −2.00 | 0.046 | −50.41 | −0.46 |
| Total amount of exported goods | 16.65 | 9.03 | 1.84 | 0.065 | −1.05 | 34.36 |
| Population | 117.97 | 11.52 | 10.24 | 0.000 | 95.39 | 140.56 |
| Town residents’ consumption expenditure | −1.41 | 0.37 | −3.8 | 0.000 | −2.15 | −0.68 |
| FDI | 840.27 | 97.61 | 8.61 | 0.000 | 648.97 | 1,031.57 |
| Total industrial output value/GDP | 2,438.66 | 4,572.48 | 0.53 | 0.594 | −6,523.25 | 11,400.57 |
| DECA | −13,932.30 | 5,512.95 | −2.53 | 0.011 | −24,737.40 | −3,127.06 |
| Shore power coverage rate | −122,215.26 | 15,286.76 | 1.45 | 0.146 | −7,746.25 | 52,176.76 |
| Total retail sales of consumer goods in society | −37.08 | 3.50 | −10.58 | 0.000 | −43.95 | −30.21 |
| COVID-19 | −14,398.60 | 5,397.72 | −2.67 | 0.008 | −2,4977.90 | −3,819.21 |
| Cons_ | 36,974.76 | 16,730.37 | 2.21 | 0.027 | 4,183.84 | 69,765.68 |
The regression results of DID model.
The regression results of the DID model show that the implementation of MSR policy has a significant positive impact on the SO2 emissions of ports, and the implementation of MSR policy significantly promotes the increase of SO2 emissions. Port cargo throughput, GDP, the ratio of total industrial output to GDP and shore power coverage have no significant impact on SO2 emissions. Among the variables that have a significant impact, the number of berths, total export goods, population, and FDI have a significant positive effect on SO2 emissions and a significant promoting effect on SO2 emissions. The total amount of imported goods, town residents’ consumption expenditure, DECA, COVID-19, and total retail sales of consumer goods have a significant negative impact on SO2 emissions and have a suppressive effect on SO2 emissions. And the impact of MSR policy is relatively high compared to other control variables, indicating that the scale of increase in SO2 emissions by MSR policy is also relatively high.
4.2 Robustness test
We also conducted robustness tests on the regression results of the model. We conducted robustness tests on the regression results of this study using shortened sample size and placebo testing. The robustness test method for shortening the sample period mainly involves re screening the panel data of this study, selecting data from 2010 to 2017 for DID model regression, and comparing the regression results with the original model. The regression results of shortening the sample period are shown in the Table 7.
Table 7
| Variables | Coefficient | SD | z | P>z | [95% conf. interval] | |
|---|---|---|---|---|---|---|
| Lower bound | Upper bound | |||||
| DID | 11,605.11 | 6,617.29 | 1.75 | 0.079 | −1,364.54 | 24,574.77 |
| Cargo throughput | 0.43 | 0.33 | 1.30 | 0.195 | −0.22 | 1.08 |
| The number of berths | 59.95 | 27.34 | 2.19 | 0.028 | 6.36 | 113.55 |
| GDP | 1.07 | 3.79 | 0.28 | 0.778 | −6.36 | 8.50 |
| Total amount of imported goods | −34.62 | 19.83 | −1.75 | 0.081 | −73.50 | 4.24 |
| Total amount of exported goods | 28.85 | 16.21 | 1.78 | 0.075 | −2.92 | 60.63 |
| Population | 170.72 | 16.21 | 10.53 | 0.000 | 138.93 | 202.51 |
| Town residents’ consumption expenditure | −0.33 | 0.82 | −0.41 | 0.685 | −1.95 | 1.28 |
| FDI | 830.17 | 126.62 | 6.56 | 0.000 | 581.99 | 1,078.35 |
| Total industrial output value/GDP | −1,350.28 | 6,336.16 | −0.21 | 0.831 | −13,768.90 | 11,068.38 |
| DECA | −18,431.50 | 6,189.03 | −2.98 | 0.003 | −30,561.80 | −6,301.18 |
| Shore power coverage rate | −43.57 | 7.79 | −5.59 | 0.000 | −58.85 | −28.29 |
| Total retail sales of consumer goods in society | −18,299.40 | 67,786.64 | −0.27 | 0.787 | −151,159.00 | 114,560.00 |
| Cons_ | 8,606.22 | 29,807.55 | 0.29 | 0.773 | −49,815.50 | 67,027.94 |
Regression results with shortened sample size.
In the regression results with shortened sample period, DID still had a significant positive impact on SO2 emissions. This indicates that despite shortening the sample period, the implementation of MSR policies still had a significant impact on the SO2 emissions of the study samples. In addition, after shortening the sample period, the impact of other variables on SO2 emissions in the model regression results remained the same as before, except for the two variables of town residents’ consumption expenditure and total retail sales of social consumer goods. The possible reason is mainly due to the reduction in sample size after shortening the sample period, resulting in a decrease in statistical power and a 50% reduction in sub sample observations. It is also possible that the policy effects of MSR have not been fully demonstrated in the short term.
To further validate the robustness of the model, we also conducted a placebo test to verify the reliability of the research results. We conducted placebo testing by changing the start time of the policy. We changed the start time of the policy from 2013 to 2017 and conducted a DID model regression. The results of the model regression are shown in the Table 8.
Table 8
| Variables | Coefficient | SD | z | P>z | [95% conf. interval] | |
|---|---|---|---|---|---|---|
| Lower bound | Upper bound | |||||
| DID | 17,838.16 | 6,296.85 | 2.83 | 0.689 | 5,496.54 | 30,179.77 |
| Cargo throughput | 0.08 | 0.21 | 0.38 | 0.704 | −0.34 | 0.50 |
| The number of berths | 132.19 | 21.19 | 6.24 | 0.000 | 90.65 | 173.73 |
| GDP | 1.32 | 1.54 | 0.86 | 0.391 | −1.70 | 4.35 |
| Total amount of imported goods | −24.46 | 12.73 | −1.92 | 0.050 | −49.43 | 0.49 |
| Total amount of exported goods | 17.73 | 8.98 | 1.97 | 0.048 | 0.12 | 35.33 |
| Population | 117.07 | 11.42 | 10.25 | 0.000 | 94.68 | 139.46 |
| Town residents’ consumption expenditure | −1.43 | 0.37 | −3.82 | 0.000 | −2.17 | −0.70 |
| FDI | 848.63 | 97.50 | 8.70 | 0.000 | 657.52 | 1,039.74 |
| Total industrial output value/GDP | 1,824.25 | 4,554.95 | 0.40 | 0.689 | −7,103.29 | 10,751.79 |
| DECA | −19,234.90 | 10,724.88 | −1.79 | 0.073 | −40,255.30 | 1,785.44 |
| Shore power coverage rate | −17,000.61 | 15,101.79 | 1.13 | 0.260 | −12,598.4 | 46,599.58 |
| Total retail sales of consumer goods in society | −35.30 | 3.43 | −10.28 | 0.000 | −42.03 | −28.57 |
| COVID-19 | −16,182.80 | 5,388.74 | −3.00 | 0.003 | −26,744.60 | −5,621.08 |
| Cons_ | 38,770.88 | 16,781.23 | 2.31 | 0.021 | 5,880.26 | 71,661.48 |
Model regression results of placebo test.
From the regression results of the placebo test model, it can be seen that the variable DID no longer has a significant impact on SO2 emissions. The impact of other factors on SO2 emissions has not changed. This indicates the robustness of the research model, that is, the timing of policy implementation and the ports affected by policies have a significant negative impact on SO2 emissions. If the timing of policy implementation is changed, the impact of the policy on SO2 emissions will no longer be significant.
Parallel trend testing is an important prerequisite for evaluating policy effectiveness using the DID method (Bertrand et al., 2004). The validity of the DID estimator depends on the parallel trend hypothesis, which suggests that in the absence of MSR policy, the treatment and control groups will follow similar trends over time. We referred to previous research to conduct parallel trend testing (Wan et al., 2019; Zhang et al., 2024b; Zhou et al., 2023b). This assumption implies that if policies are not implemented, the average results of the treatment group and the control group will develop in parallel. To empirically test this hypothesis, we conducted a parallel trend test by estimating a leading and lagging event study model that includes policy implementation years. Specifically, we generated a series of event time hypothesis variables before and after policy implementation, and examined whether the coefficients of the hypothesis variables before policy implementation were statistically close to 0. If the coefficient before policy implementation approaches 0 and is not significant, this provides evidence for the parallel trend hypothesis, indicating that the treatment group and the control group followed similar trajectories before policy implementation. On the contrary, if the preprocessing coefficients are statistically significant, it may indicate a violation of the parallel trend assumption and may cause bias in DID estimation. In our analysis, we also visualize the estimated coefficients and their confidence intervals to evaluate the dynamic effects of policies over time, ensuring that the trends before policy implementation are parallel and that the effects after policy implementation are strongly identified. The parallel testing effect of this research model is shown in the Figure 2.
Figure 2
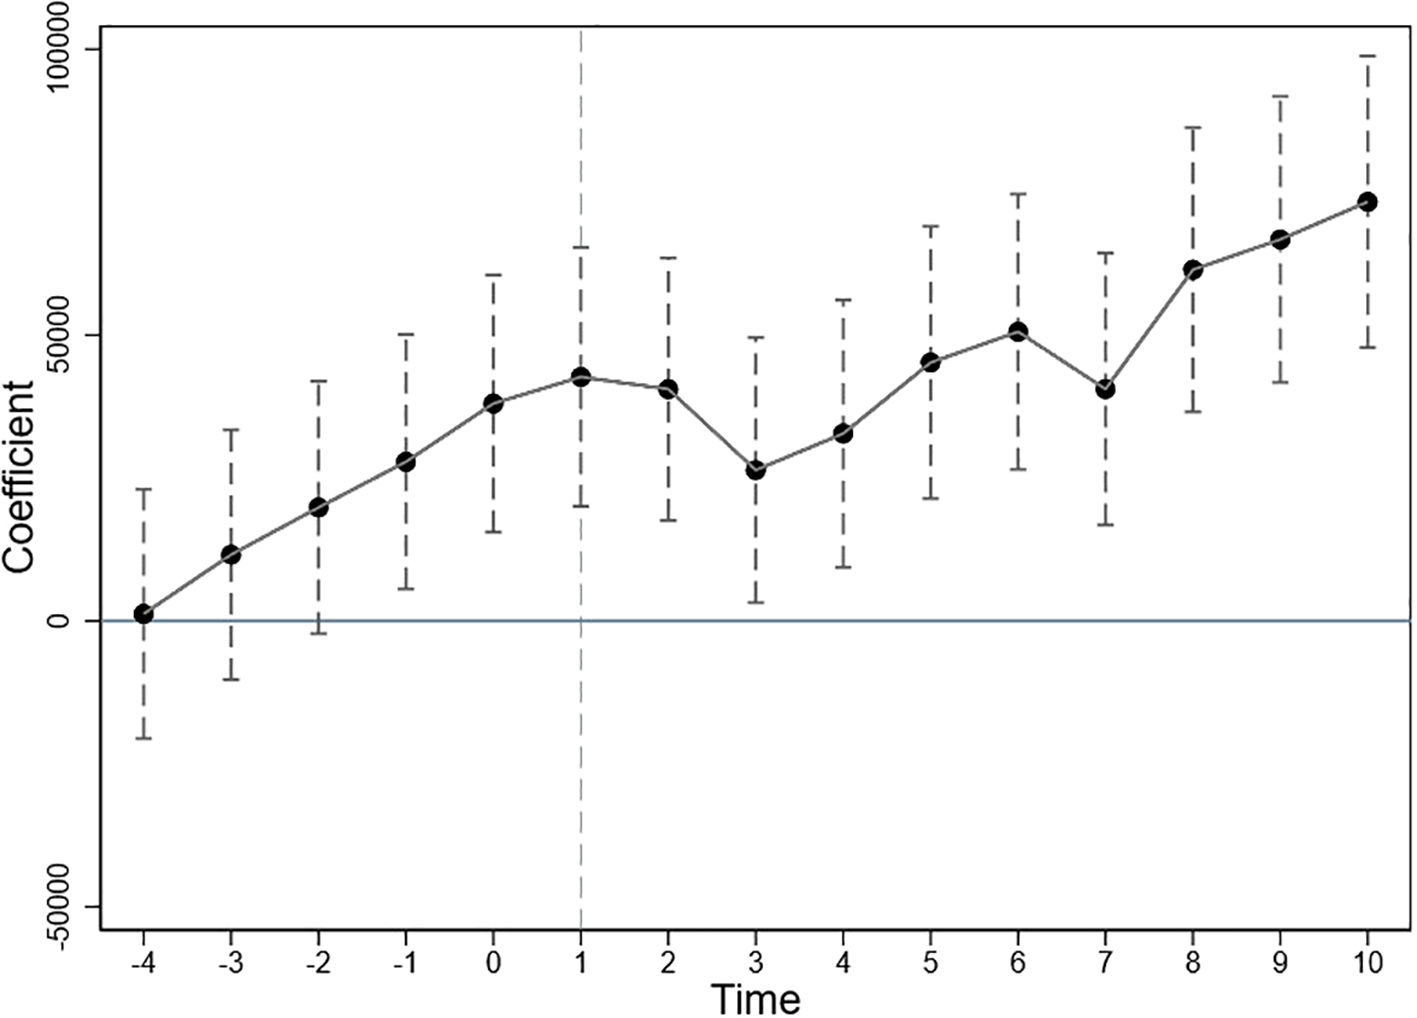
Parallel trend test of DID model.
To avoid collinearity, we usually remove variables from the first cycle. The coefficient before policy implementation (time=0) is not significant and tends to approach 0. This indicates that before implementing the MSR policy, the treatment group and the control group had similar time trends for at least five years, which means that this study satisfies the parallel trend hypothesis. According to the significance level of the coefficients, after the implementation of the MSR policy in 2013, all coefficients were significantly positive, indicating that the implementation of the MSR policy has a promoting effect on SO2 emissions.
5 Discussions
5.1 The analysis of model results
According to the regression results of the DID model, the implementation of MSR policy has a significant positive impact on SO2 emissions from ports, and the implementation of MSR strategy significantly promotes the increase of SO2 emissions. Among all control variables, the port cargo throughput, GDP, the ratio of industrial output to GDP, and the shore power coverage rate have no significant impact on SO2 emissions. The factors that have a significant impact of all control variables are mainly the number of berths, the total amount of exported goods, population, and FDI. The factors that have a significant negative impact are mainly the total amount of imported goods, town residents’ consumption expenditure, DECA, COVID-19, and total retail sales of consumer goods.
In the regression results of the DID model, the MSR policy has a significant positive impact on the SO2 emissions of the studied ports. We have analyzed the main reasons for this impact, including economic development and technological limitations. Firstly, the implementation of MSR policy has driven the logistics and economic development of ports along the route (Song and Fabinyi, 2022; Xu et al., 2023). The core goal of MSR policy is to promote smooth trade, which effectively promotes the increase of port cargo throughput and the intensification of ship activities in ports. The increase in trade volume has intensified the activity of port ships and the operational intensity of port machinery and equipment. The anchoring state of ships in ports will increase the emission of atmospheric pollutants (Gao et al., 2025). In terms of technology, taking the promotion of shore power facilities as an example, although some ports have high coverage of shore power facilities, the actual utilization rate is significantly lower than the coverage rate (Zhang et al., 2025). Due to the implementation of MSR policy, the increase in port trade volume has promoted the rapid expansion and development of ports and hinterlands. Ports may prioritize ensuring throughput capacity during the rapid expansion period, while environmental protection investment is relatively lagging behind. Within the time frame of this study, the promotion of green technologies in ports and the constraints of environmental policies have not fully offset the emission increase brought about by the expansion of economic activities.
Among all control variables, port cargo throughput, GDP, the ratio of total industrial output to GDP, and shore power coverage rate has no significant impact on SO2 emissions from ports. The reason why port cargo throughput has not had a significant impact on SO2 emissions may be due to the upgrading of port automation and the use of clean energy by ships, which have resulted in an increase in port cargo throughput but not a significant impact on SO2 emissions. Among the variables related to port size, the number of berths is the factor that truly affects SO2 emissions. The fact that GDP does not have a significant impact on SO2 emissions mainly reflects that the performance of port environmental governance depends more on local management decisions rather than the overall economic level of the region. This confirms that port emissions reduction requires targeted regulation rather than generalized economic policies. In addition, the impact of GDP on sulfur dioxide emissions may also follow the pattern of the Environmental Kuznets Curve. Some scholars have explored the environmental Kuznets curve hypothesis and analyzed the interaction between economic growth and the environment. Wang et al. (2025) and Kolasa-Wiecek et al. (2025) found that the interaction between pollutant emissions, including CO2 and particulate matter emissions, and GDP follows an inverted U-shaped trajectory. That is to say, at the beginning of economic development, environmental quality will deteriorate with economic growth, and pollutant emissions will increase. However, after reaching the peak (turning point), environmental quality may improve with subsequent economic growth, and pollutant emissions may decrease. The main reason for the insignificant ratio of industrial output value to GDP may be that the industrialization level of port cities has entered the post industrialization era, and the industrial structure has been continuously developed and optimized (Wang and Ren, 2018). Although the coverage rate of shore power is relatively high, the actual utilization rate is relatively low, and it has no significant impact on SO2 emissions from ports.
The factors that have a significant positive impact on SO2 emissions among all control variables are mainly the number of berths, total export goods, population, and foreign direct investment. The number of berths, as one of the factors reflecting the size of a port, has a significant promoting effect on SO2 emissions from the port. The total amount of exported goods also has a positive impact. The process of exporting goods, including pollutant emissions caused by ship activities and energy consumption during cargo loading and unloading, will to some extent increase the emission of SO2 from ports. The implementation of MSR policy has promoted urban expansion and increased employment opportunities, thereby promoting population growth. Population growth will drive the economic development and energy consumption of cities. In addition, the implementation of MSR policies has also promoted investment in ports and cities along the route. The increase in FDI may lead to the transfer of some pollution intensive industries to MSR ports, thereby increasing SO2 emissions from ports.
Among all control variables, the total amount of imported goods, town resident consumption expenditure, DECA, COVID-19, and total retail sales of consumer goods have a significant negative impact on SO2 emissions. The total amount of imported goods has a significant negative impact on SO2 emissions, mainly due to the fact that high value-added products account for the majority of imported goods. For example, in the total amount of imported goods in Shanghai in 2024, the proportion of mechanical and electrical products and high-tech products is relatively high. In terms of policy, the implementation of DECA policy has significantly suppressed the emission of SO2 from ports. The DECA policy has strict restrictions on the sulfur content in ship fuel along the coast and inland rivers, effectively controlling the emission of SO2. The negative impact of town residents’ consumption expenditure and total retail sales of consumer goods on SO2 emissions may be mainly due to the upgrading of people’s consumption patterns and the improvement of logistics efficiency. The occurrence of the COVID-19 has a certain impact on the port trade volume, which has a significant negative impact on the SO2 emissions of ports.
The regression results of this study have certain generalizability. The implementation of MSR policy has a significant positive impact on SO2 emissions from ports, as it promotes urban expansion and population growth in the hinterland cities of ports, and increases the trade volume of ports. The implementation of MSR policy has promoted the expansion of ports and cities, but related environmental policies and technological advances cannot fully offset the increase in emissions caused by economic development. For other ports, this result has generalizability and reference significance. Port managers should increase investment in environmental protection while promoting port development, and promote the sustainable development of ports. From the perspective of the impact of some control variables on SO2 emissions from ports, the regression results also have generalizability. For example, the implementation of DECA policy significantly suppressed the emission of SO2 from ports, indicating the effectiveness of DECA policy implementation.
5.2 Policy recommendations for the government
Based on the regression results of the model, we have proposed some targeted policy recommendations for port managers. Firstly, at the technical level, the development of port intelligence plays an important role in improving the efficiency of port operations. Port operators should invest in smart port technologies, such as automation, artificial intelligence (AI), and the Internet of Things (IoT), to enhance operational efficiency and reduce costs. Digital technology is also increasingly being applied in the shipping industry to reduce pollutant emissions (Xiao et al., 2025). Optimizing port operation processes, ship voyages, and routes through integer programming models can effectively save energy and reduce pollutant emissions. In addition, improving the utilization rate of shore power facilities is also very important for reducing SO2 emissions in ports. Although many ports have achieved 100% coverage of shore power facilities, the utilization rate is still very low. Port managers can set targets for shore power utilization and establish mandatory ratios for shore power usage. In addition to mandatory requirements, incentive policies can also be established, such as providing priority passage and berthing for ships using shore power, reducing shore power service fees, and other incentive measures. At the same time, the service capability of shore power supply should be enhanced, the disclosure of shore power facility information should be strengthened, and the convenience and safety of shore power connection with ships should be improved. Some carbon reduction technologies in the power industry have shown high efficiency in reducing carbon emissions (Wang et al., 2018a). Port managers should consider how to use electricity carbon reduction technology to empower shore power upgrades and provide more political incentives for energy intensive industries (Wang et al., 2010, 2018b).
Secondly, from the perspective of policy, ports in coastal cities should actively respond to the Belt and Road strategy and actively introduce planning measures for docking with the Maritime Silk Road. Port managers should actively promote the construction of intelligent green ports and enhance coordination and cooperation with other ports and cities. While promoting economic development, we should also pay attention to environmental protection. The implementation of MSR policy has brought development opportunities to cities and ports, increasing the trade volume of ports. But at the same time, higher requirements have been put forward for the scale and service level of ports. While increasing the number of port berths, we should also actively promote the optimization of port automation and terminal operation processes. Port operators should prioritize investing in infrastructure, and transportation infrastructure has become the main battlefield for investment (Chen and Guo, 2020). In addition, in terms of investment, in addition to investing in port infrastructure, port managers should also increase investment in technological progress and emissions reduction to promote the sustainable development of ports. When attracting foreign direct investment, port operators should promote more investment in clean industries, establish more joint ventures in clean industries, and avoid the risk of pollution industry transfer. In addition, the DECA policy’s restrictions on ship sulfur content can effectively reduce SO2 emissions from ports. For fleets and shipping companies, they can encourage ships to use clean energy, accelerate ship renovation and energy transformation. For shipping companies, optimizing cargo loading and unloading processes can reduce port time, thereby reducing ship pollutant emissions caused by fuel consumption. For port managers, the unit emission intensity can be included in the assessment indicators of the port, and certain incentive measures can be taken to promote the reduction of pollutant emissions in the port. It is necessary for port managers to enhance the implementation of policies related to port governance, establish a long-term assessment system, strengthen industry standards, and promote energy recovery and utilization (Wang and Chang, 2014, 2018). In addition, the outbreak of COVID-19 has also significantly affected the emission of SO2 from ports. The outbreak of the epidemic has affected the trade volume of ports, so port managers should also be prepared for emergencies and enhance the port’s ability to resist risks. It is crucial for ports to make quick decisions and take corresponding measures in response to risks.
Thirdly, for the government, the government should collaborate with international organizations to establish global standards for sustainable shipping. Port development projects should include environmental impact assessments to minimize damage to marine ecosystems. The government should enforce strict regulations to prevent pollution and protect the biodiversity of coastal areas (Chang and Wang, 2010; Chang et al., 2021).
5.3 The comparison of relevant studies
The existing researches on the impact of MSR policies on ports mainly focuses on port safety and operational efficiency. Huang et al. (2025) found that the weak economic connection between the port and the hinterland would affect the operational efficiency of the port, thereby affecting the cooperation effect of MSR. Lin and Liu (2023) proposed that investments in ports along the MSR should be targeted based on their resilience. Chang (2018) believes that the safety of maritime routes is the key to the sustainable development of MSR in the 21st century, and ports are the foundation of maritime route safety. This study explores the impact of MSR policy on port environment, specifically investigating whether MSR policy will affect SO2 emissions from ports. The DID regression results show that the MSR policy has a significant positive impact on port SO2 emissions.
Some studies have used double difference models to investigate the impact of ECA policies on port pollutant emissions. Wan et al. (2019) used the DID method to explore whether China’s ECA policies effectively reduced local sulfur dioxide concentrations, and the research results showed that ECA policies have a certain time lag. Wan et al. (2021) used the DID method to check whether China’s ECA helps reduce particulate matter emissions. The results show that only the Yangtze River Delta region has shown significant particulate matter reduction effects under ECA policies, while similar results have not been observed in the Pearl River Delta and Bohai Rim regions. When selecting samples for building the model, Zhoushan Port with good air diffusion conditions was excluded. The study also took into account weather and climate variables, which improved the accuracy of the estimated research results. The related studies focus more on policies directly related to emissions, such as the impact of ECA policies on port pollutant emissions. And this study focuses on the MSR policy, exploring its impact on port pollutant emissions in addition to economic development and logistics. This study used a DID model to explore the impact of MSR policies on SO2 emissions from ports, and divided the treatment group and control group based on whether they were affected by MSR policies. At the same time, relevant factors reflecting port scale, industrial structure, economic development level, urban development level, and port emission control technology are used as control variables for analysis.
The necessity of this paper is mainly included academic significance, generalizability, and practical value. In academic terms, this study used a DID model to analyze the impact of MSR policies on SO2 emissions from ports. This study explores the environmental impact of MSR policies on ports. In terms of promotional value, this study has certain generalizability to other ports. The implementation of MSR policy has had a significant positive impact on SO2 emissions from ports, as it has promoted urban expansion and population growth in the hinterland cities of ports, and increased the trade volume of ports. The implementation of MSR policies has promoted the expansion of ports and cities, but related environmental policies and technological advancements cannot fully offset the increase in emissions caused by economic development. For other ports, this result has universality and reference significance. Port managers should increase investment in environmental protection and promote sustainable development of ports while promoting port development. From the impact of some control variables on port sulfur dioxide emissions, the regression results also have universality. For example, the implementation of DECA policy significantly suppressed sulfur dioxide emissions from ports, demonstrating the effectiveness of DECA policy implementation. On a practical level, this study provides more targeted recommendations for port managers and governments based on the regression results of the model.
6 Conclusions
This study is based on panel data from 34 coastal and inland ports in China from 2008 to 2023, and establishes a DID model to analyze the impact of MSR policies on port SO2 emissions. The main research results include: (1) The implementation of MSR policy has a significant positive impact on port SO2 emissions, indicating that MSR policy promotes port SO2 emissions. (2) Port cargo throughput, GDP, the ratio of total industrial output to GDP and shore power coverage do not have a significant impact on SO2 emissions. (3) The number of berths, total export goods, population, and foreign direct investment have a significant positive impact on port SO2 emissions. (4) The total amount of imported goods, town residents’ consumption expenditure, DECA, COVID-19, and total retail sales of consumer goods have a significant negative impact on SO2 emissions. We conducted robustness tests on the regression results of the DID model, including parallel trend tests, shortened sample size tests, and placebo tests. The results of these tests validate the robustness of the model regression results, indicating that the implementation of MSR policies has a significant positive impact on SO2 emissions. The significance of this study lies in revealing the positive impact of MSR policies on port SO2 emissions, and providing targeted recommendations for port managers and governments. In addition, the impact of some control variables on SO2 emissions has reference significance for other ports. Port managers should balance development and environmental protection to achieve sustainable development of ports.
This study also has some limitations, such as data measurement errors. Firstly, different ports may have different SO2 emission estimation methods. In future research, we can adopt a unified SO2 estimation method and error correction method for each port to ensure more comprehensive and accurate data. Secondly, to improve the generalizability of the research results, we can collect more data to correct the coefficients of the regression results. Thirdly, in future research, we can examine the heterogeneous impact of port throughput by grouping ports by type, size, or region. Add interaction terms between port throughput and variables such as environmental policies and energy structure in the model, and test whether these factors moderate the impact of throughput. In addition, we can also consider incorporating non-linear assumptions of variables such as port throughput and GDP into the model to check for threshold effects or economies of scale.
Statements
Data availability statement
The original contributions presented in the study are included in the article/supplementary material. Further inquiries can be directed to the corresponding author.
Author contributions
TW: Methodology, Writing – original draft, Conceptualization. GX: Funding acquisition, Writing – review & editing, Writing – original draft, Methodology, Conceptualization. QL: Methodology, Writing – review & editing. SB: Writing – review & editing, Supervision.
Funding
The author(s) declare that financial support was received for the research and/or publication of this article. This research was funded by National Natural Science Foundation of China, grant number 52472323, 72404022, and Beijing Natural Science Foundation, grant number 9244032, Science and Technology Planning Projects of Yunnan Provincial Science and Technology Agency grant 202101BA070001-236.
Conflict of interest
The authors declare that the research was conducted in the absence of any commercial or financial relationships that could be construed as a potential conflict of interest.
Generative AI statement
The author(s) declare that no Generative AI was used in the creation of this manuscript.
Publisher’s note
All claims expressed in this article are solely those of the authors and do not necessarily represent those of their affiliated organizations, or those of the publisher, the editors and the reviewers. Any product that may be evaluated in this article, or claim that may be made by its manufacturer, is not guaranteed or endorsed by the publisher.
References
1
Bertrand M. Duflo E. Mullainathan S. (2004). How much should we trust differences-in-differences estimates? Q. J. Econ119, 249–275. doi: 10.1162/003355304772839588
2
Chang C. M. Wang W. L. Hu J. L. (2009). Environmental issues for cities in China: SO2 emissions and population distribution. Polish J. Environ. Stud.18, 789–800.
3
Chang Y. C. (2018). The ‘21st Century Maritime Silk Road Initiative’ and naval diplomacy in China. Ocean Coast. Manage.153, 148–156. doi: 10.1016/j.ocecoaman.2017.12.015
4
Chang Y. C. Khan M. I. (2019). China–Pakistan economic corridor and maritime security collaboration: A growing bilateral interests. Maritime Business Rev.4, 2397–3757. doi: 10.1108/MABR-01-2019-0004
5
Chang Y. C. Wang N. N. (2010). Environmental regulations and emissions trading in China. Energy Policy38, 3356–3364. doi: 10.1016/j.enpol.2010.02.006
6
Chang Y. C. Xu B. Li S. (2021). The impact of “Belt and Road Initiative” on Japanese shipping law. Coast. Manage.49, 233–249. doi: 10.1080/08920753.2021.1899901
7
Chen B. Y. Guo X. M. (2020). Public-private partnership and transport infrastructure investment efficiency: Evidence from countries along the 21st-Century Maritime Silk Road. J. Coast. Res.112, 269–274. doi: 10.2112/JCR-SI112-073.1
8
Chen S. Y. Tan Z. X. Wang J. Y. Zhang L. C. He X. W. Mu S. Y. (2023). Spatial and temporal evolution of synergizing the reduction of pollution and carbon emissions and examination on comprehensive pilot effects-evidence from the national eco-industrial demonstration parks in China. Environ. Impact Assess. Rev.101, 107147. doi: 10.1016/j.eiar.2023.107147
9
Cheng Y. L. Wang S. S. Zhu J. Guo Y. L. Zhang R. F. Liu Y. M. et al . (2019). Surveillance of SO2 and NO2 from ship emissions by MAX-DOAS measurements and the implications regarding fuel sulfur content compliance. Atmos. Chem. Phys.19, 13611–13626. doi: 10.5194/acp-19-13611-2019
10
Gao X. Yu Q. Dai W. Chen Q. (2025). Examining the influence of port ship activities on pollutant emissions in port environments. Heliyon11 (1), e41208. doi: 10.1016/j.heliyon.2024.e41208
11
Guo P. Li J. Kuang J. S. Zhu Y. F. Xiao R. R. Duan D. H. et al . (2022). Low-carbon governance, fiscal decentralization and sulfur dioxide emissions: Evidence from a Quasi-Experiment with Chinese heavy pollution enterprises. Sustainability14, 3220. doi: 10.3390/su14063220
12
He L. Y. Huang G. (2022). Are China’s trade interests overestimated? Evidence from firms’ importing behavior and pollution emissions. China Econ. Rev.71, 101738. doi: 10.1016/j.chieco.2021.101738
13
Huang T. C. Chen Z. Wang S. Jiang D. K. (2021). Efficiency evaluation of key ports along the 21st-Century Maritime Silk Road based on the DEA-SCOR model. Maritime Policy Manage.48, 378–390. doi: 10.1080/03088839.2020.1773558
14
Huang S. Q. Huo Y. S. Xiao G. N. (2025). Impact of the “21st Century Maritime Silk Road” construction on the efficiency of China’s coastal ports. Sustainability17, 700. doi: 10.3390/su17020700
15
Jiang M. Z. Lu J. Qu Z. H. Yang Z. L. (2022). Safety evaluation of the ports along the maritime silk road. Maritime Policy Manage.49, 797–819. doi: 10.1080/03088839.2021.1903598
16
Kolasa-Wiecek A. Steinberga I. Pilarska A. A. Suszanowicz D. Wzorek M. (2025). Study of the environmental Kuznets Curve in the EU27 countries taking into account socio-economic factors and GHG and PM emissions. Energies18, 68. doi: 10.3390/en18010068
17
Li C. R. Zhang L. J. Chen S. Y. Zhang T. Zhou J. He J. S. et al . (2024). Has the Maritime Silk Road Initiative promoted the development and expansion of port city clusters along its route? Cities151, 105127. doi: 10.1016/j.cities.2024.105127
18
Liang R. Liu Z. Y. (2020). Port infrastructure connectivity, logistics performance and seaborne trade on economic growth: An empirical analysis on “21st-Century Maritime Silk Road’’. J. Coast. Res.106, 319–324. doi: 10.2112/SI106-074.1
19
Lin W. S. Liu W. (2023). Resilience evaluation of ports along the Maritime Silk Road from the perspective of investment and construction. J. Adv Transport2023, 8818667. doi: 10.1155/2023/8818667
20
Liu W. Yang Y. B. Luo Q. Y. Zeng X. F. Chen C. X. Zhu J. F. et al . (2022). Study on the contribution of seaport to urban economy: An empirical and quantitative analysis of Xiamen Port. J. Mar. Sci. Eng.10, 1753. doi: 10.3390/jmse10111753
21
Meng X. G. Zhang M. Zhao Y. X. (2024). Environmental regulation and green transition: Quasi-natural experiment from China’s efforts in sulfur dioxide emissions control. J. Clean. Prod.434, 139741. doi: 10.1016/j.jclepro.2023.139741
22
Ministry of Industry and Information Technology of the People’s Republic of China (2025). In 2024, the three major indicators of shipbuilding in China will see comprehensive growth. Available online at: https://wap.miit.gov.cn/gxsj/tjfx/zbgy/mycb/art/2025/art_7db800ab08054066859e49992fa23314.html (Accessed June 18, 2025).
23
Nguyen D. H. Lin C. Cheruiyot N. K. Hsu J. Y. Cho M. Y. Hsu S. H. et al . (2021). Reduction of NOX and SO2 emissions by shore power adoption. Aerosol Air Qual. Res.21, 200100. doi: 10.4209/aaqr.210100
24
Peng Y. Zhang X. F. (2024). Spatio-temporal differences of port competitiveness and its influencing factors in China under the 21st century Maritime Silk Road. Int. J. Shipping Transport. Logistics19, WOS:001403138900003. doi: 10.1504/ijstl.2024.144037
25
Song A. Y. Fabinyi M. (2022). China’s 21st century maritime silk road: Challenges and opportunities to coastal livelihoods in ASEAN countries. Mar. Policy136, 104923. doi: 10.1016/j.marpol.2021.104923
26
Ünal E. Lin B. Q. Managi S. (2023). CO2 emissions embodied in bilateral trade in China: An input-output analysis. Environ. Impact Assess. Rev.103, 107218. doi: 10.1016/j.eiar.2023.107218
27
Wan Z. Zhou X. Zhang Q. Chen J. (2019). Do ship emission control areas in China reduce sulfur dioxide concentrations in local air? A study on causal effect using the difference-in-difference model. Mar. pollut. Bull.149, 110506. doi: 10.1016/j.marpolbul.2019.110506
28
Wan Z. Zhou X. J. Zhang Q. Chen J. H. (2021). Influence of sulfur emission control areas on particulate matter emission: A difference-in-differences analysis. Mar. Policy130, 104584. doi: 10.1016/j.marpol.2021.104584
29
Wang G. Ahn S.-B. (2021). Evaluating the efficiency of Chinese ports from the perspective of Maritime Silk Road. J. Korea Port Econ. Assoc.37, 19–30. doi: 10.38121/kpea.2021.03.37.1.19
30
Wang N. N. Chang Y. C. (2014). The development of policy instruments in supporting low-carbon governance in China. Renewable Sustain. Energy Rev.35, 126–135. doi: 10.1016/j.rser.2014.03.021
31
Wang N. N. Chang Y. C. (2018). Effectiveness of low-carbon governmence implementation in Cina. Environ. Eng. Manage. J.17, 601–609.
32
Wang N. N. Chang Y. C. Dauber V. (2010). Carbon print studies for the energy conservation regulations of the UK and China. Energy Buildings42, 695–698. doi: 10.1016/j.enbuild.2009.11.008
33
Wang N. N. Chen X. Y. Wu G. B. Chang Y. C. Yao S. N. (2018b). A short-term based analysis on the critical low carbon technologies for the main energy-intensive industries in China. J. Clean. Prod.171, 98–106. doi: 10.1016/j.jclepro.2017.09.261
34
Wang N. N. Chen J. Yao S. N. Chang Y. C. (2018a). A meta-frontier DEA approach to efficiency comparison of carbon reduction technologies on project level. Renewable Sustain. Energy Rev.82, 2606–2612. doi: 10.1016/j.rser.2017.09.088
35
Wang C. X. Haralambides H. Zhang L. (2021). Sustainable port development: the role of Chinese seaports in the 21st century Maritime Silk Road. Int. J. Shipping Transport. Logistics13, 205–232. doi: 10.1504/IJSTL.2021.112924
36
Wang J. Li J. (2024). Carbon emissions, import, and export: a spatial econometric analysis of the Chinese cities. Environ. Dev. Sustain.26, 16057–16072. doi: 10.1007/s10668-023-03287-w
37
Wang Z. J. Ren X. W. (2018). Measurement and empirical analysis of industrialization development level in Qingdao city. J. Qingdao Univ. Sci. Technol. (Social Sci. Edition)34, 15–18. doi: 10.16800/j.cnki.jqustss.2018.04.024
38
Wang Q. Zhang Y. J. Li R. R. (2025). Achieving sustainable development: Bridging economic growth and environmental resilience through EKC and LCC. Sustain. Dev., WOS:001497392000001. doi: 10.1002/sd.3528
39
Xiao G. N. Pan L. Lai F. B. (2025). Application, opportunities, and challenges of digital technologies in the decarbonizing shipping industry: a bibliometric analysis. Front. Mar. Sci.12, 1523267. doi: 10.3389/fmars.2025.1523267
40
Xiao G. N. A. Wang T. Chen X. Q. Zhou L. Z. (2022). Evaluation of ship pollutant emissions in the ports of Los Angeles and Long Beach. J. Mar. Sci. Eng.10, 1206. doi: 10.3390/jmse10091206
41
Xie N. Y. Chen A. L. Wang X. L. Zhang X. Y. (2023). Does the BRI contribute to poverty reduction in countries along the Belt and Road? A DID-based empirical test. Humanities Soc. Sci. Commun.10, 872. doi: 10.1057/s41599-023-02365-8
42
Xin L. Wang Y. M. (2022). Towards a green world: the impact of the Belt and Road Initiative on the carbon intensity reduction of countries along the route. Environ. Sci. pollut. Res.29, 28510–28526. doi: 10.1007/s11356-021-17575-3
43
Xu L. Huang J. C. Chen J. H. (2023). How does the initiative of 21st century maritime silk road incentive logistics development in China’s coastal region? Ocean Coast. Manage.239, 106606. doi: 10.1016/j.ocecoaman.2023.106606
44
Yan C. Li H. X. Li Z. G. (2022). Environmental pollution and economic growth: Evidence of SO2 emissions and GDP in China. Front. Public Health10, 930780. doi: 10.3389/fpubh.2022.930780
45
Yao F. G. Li L. Zhong S. (2022). Sulfur dioxide emissions curbing effects and influencing mechanisms of China’s emission trading system. PloS One17, e0276601. doi: 10.1371/journal.pone.0276601
46
Zhang X. (2014). Research on the coordination of factors influencing port cargo throughput in Fujian Province. Logistics Eng. Manage.36, 59–61. doi: 10.3969/j.issn.1674-4993.2014.09.022.
47
Zhang X. F. Lu J. Peng Y. (2023). Spatio-temporal evolution of the container port system along the 21st-century Maritime Silk Road. Maritime Policy Manage.50, 668–691. doi: 10.1080/03088839.2021.2017038
48
Zhang Q. Q. Wang Y. Ma Q. Yao Y. Xie Y. He K. (2015). Regional differences in Chinese SO2 emission control efficiency and policy implications. Atmos. Chem. Phys.15, 6521–6533. doi: 10.5194/acp-15-6521-2015
49
Zhang J. Q. Woo S. H. Li K. X. (2024b). Port-city synergism and regional development policy: Evidence from the Yangtze River Region. Transport. Res. Part E-Logistics Transport. Rev.192, 103817. doi: 10.1016/j.tre.2024.103817
50
Zhang C. H. Yang Y. X. Wang N. X. (2024a). Port governance and sustainable development: The impact of port smartization on port carbon emission efficiency. Ocean Coast. Manage.259, 107485. doi: 10.1016/j.ocecoaman.2024.107485
51
Zhang Y. Zhou R. Chen J. H. Rangel-Buitrago N. (2022). The effectiveness of emission control policies in regulating air pollution over coastal ports of China: Spatiotemporal variations of NO2 and SO2. Ocean Coast. Manage.219, 106064. doi: 10.1016/j.ocecoaman.2022.106064
52
Zhang Z. Q. Zhu Y. H. Zhu J. Huang D. Z. Yin C. Z. Li J. Y. (2025). Collaborative optimization of shore power and berth allocation based on economic, environmental, and operational efficiency. J. Mar. Sci. Eng.13, 776. doi: 10.3390/jmse13040776
53
Zhou Y. T. Li Z. F. Duan W. Deng Z. (2023b). The impact of provincial port integration on port efficiency: Empirical evidence from China’s Coastal Provinces. J. Transport. Geogr.108, 103574. doi: 10.1016/j.jtrangeo.2023.103574
54
Zhou J. K. Li Y. T. Tian J. Ma Z. F. (2023a). The spatial effect and threshold characteristics of green technological innovation on the environmental pollution of thermal power, etc., Air pollution-intensive industrial agglomeration in China. Processes11, 43. doi: 10.3390/pr11010043
55
Zhou M. Shu Z. (2024). Analysis of factors affecting port container throughput based on analytic hierarchy process: A case study of Nanchang railway bureau. Chin. Market03), 180–184.
Summary
Keywords
difference-in-difference, the 21st-Century Maritime Silk Road, sulfur dioxide emissions, port, policy
Citation
Wang T, Xiao G, Li Q and Biancardo SA (2025) The impact of the 21st-Century Maritime Silk Road on sulfur dioxide emissions in Chinese ports: based on the difference-in-difference model. Front. Mar. Sci. 12:1608803. doi: 10.3389/fmars.2025.1608803
Received
09 April 2025
Accepted
26 June 2025
Published
23 July 2025
Volume
12 - 2025
Edited by
Wei Li, Taiyuan University of Technology, China
Reviewed by
Yen-Chiang Chang, Dalian Maritime University, China
Victor Almanza, National Autonomous University of Mexico, Mexico
Updates
Copyright
© 2025 Wang, Xiao, Li and Biancardo.
This is an open-access article distributed under the terms of the Creative Commons Attribution License (CC BY). The use, distribution or reproduction in other forums is permitted, provided the original author(s) and the copyright owner(s) are credited and that the original publication in this journal is cited, in accordance with accepted academic practice. No use, distribution or reproduction is permitted which does not comply with these terms.
*Correspondence: Qingjun Li, liqj@wfu.edu.cn
Disclaimer
All claims expressed in this article are solely those of the authors and do not necessarily represent those of their affiliated organizations, or those of the publisher, the editors and the reviewers. Any product that may be evaluated in this article or claim that may be made by its manufacturer is not guaranteed or endorsed by the publisher.