Abstract
With the accelerated growth of global trade, the shipping industry has experienced substantial expansion due to its reliability and cost-effectiveness in facilitating globalization. However, the environmental consequences of this rapid development, particularly pollution emissions, have garnered increasing attention. Sulfur dioxide has drawn more attention than other shipping pollutants due to its serious negative effects on health. America has three delimited emission control areas to limit sulfur emissions from ships and to enhance the quality of air in America’s coastal areas. This paper uses the difference in difference (DID) model to assess the sulfur emissions in the five busiest ports in America and check whether the emission control area (ECA) policy has a positive significant effect in decreasing the sulfur dioxide emission in the five busiest ports in America. The variables used for this study are sulfur emissions, gross domestic products, imports, exports, inflation rate as well as throughput for each of the five ports. The research results indicate that sulfur emission policies have no significant positive impact on ports other than the Port of Los Angeles, as many regulations have been developed to reduce the adverse effects of ship pollution emissions before the implementation of sulfur regulations.
1 Introduction
Maritime transportation has long been recognized as a substantial contributor to global atmospheric pollution due to its significant emissions of sulfur oxides (SOX), nitrogen oxides (NOx), carbon dioxide (CO2), and particulate matter (PM). SOX have gained more attention recently than other air pollutants like nitrogen NOX, CO2, and PM (Vehicle Emission Control Center Ministry of Environmental Protection, 2016; Chen et al., 2018). A transition to low-sulfur fuels is one of the most effective approaches to lower SOX emissions since Wang and Corbett’s research demonstrated that local SOX emissions are strongly connected with the sulfur content of marine fuels (Wang and Corbett, 2007). The Marine Environment Committee of the International Maritime Organization (IMO) has set up four significant international emission control areas (ECAs) to reduce the air pollution brought on by ship fuel in order to deal with the effects of sulfur (Vehicle Emission Control Center Ministry of Environmental Protection, 2016). According to current regulations, ships can enter ECA with a fuel-oil sulfur level of less than 0.1%. ECAs can enhance the air quality in coastal areas, as evidenced by earlier studies on ship emission inventories as well as air-quality impact assessment in Europe and North America (Wang and Corbett, 2007; Chen et al., 2018).
Pollutant emissions rise along with the maritime industry’s expansion (International Maritime Organization, 2020). Shipping is the most energy-effective mode of transportation when considering the energy consumed per ton of cargo per kilometer. Nevertheless, pollutant emissions into the air increase as the ports and shipping industry sector expands and making it as sustainable as feasible and regulating the sector is in everyone’s best interests (Seddiek and Elgohary, 2014). The ports and shipping sector generates a lot of garbage, much of it is contaminated. Sustainable economic growth is one of the IMO’s objectives and controlling fuel requirements and lowering CO, NOX, and SOX emissions are part of the recent laws enacted by the IMO. These organizations are in charge of keeping an eye on compliance with the rules and enforcing them, as well as reporting to the IMO. The IMO can then determine whether the nation complies with the rules and determine the appropriate sanctions (International Maritime Organization, 2019; International Maritime Organization, 2025).
Air quality and local residents’ health are significantly impacted by the reduction of maritime air pollutants in and near ports. Due to their significant effects on human health, global warming, and climate change, air emissions have gained significant attention. A new cap on the amount of sulfur in fuel oil used on board ships went into effect on January 1, 2020, which is a major step toward improving air quality, protecting the environment, and safeguarding public health. The “IMO 2020” regulation, which was previously set at 3.5%, significantly lowers the amount of sulfur allowed in fuel oil used by ships operating outside of approved ECA regions to 0.50% m/m (mass by mass). The IMO has set ECAs with an even tougher restriction of 0.10% m/m.
This paper will assess the five busiest ports in America, of which three are under California ECA. We will compare the sulfur emissions of the three ports regulated by California ECA with the other two ports not regulated by California ECA. The difference in difference (DID) methodological approach is employed to analyze the ports sulfur emission from these five busiest ports in America to know if the ECAs helps reduce the quantity of sulfur emissions. Specific questions are generated by evaluating the literature and problem statement. The primary questions for this research study are: Does the sulfur ECA policy help to lower sulfur emissions at the port of Los Angeles? Is there a correlation between the sulfur ECA policy and a reduction in the sulfur content at Long Beach Port? Is it possible to restrict the amount of sulfur present at Oakland Port using the ECA policy? What are some steps the government may take to assist in lowering the amount of sulfur released into the atmosphere?
The academic contribution of this study is to use the DID model to visually regress the impact of ECA policies on SO2 emissions from major ports in the United States, providing a theoretical basis for relevant departments to propose corresponding policy recommendations for the implementation effect of ECA policies.
The main structure of this article is as follows. The Section 2 is Literature review, which mainly summarizes the relevant research on ship pollutant emissions and some studies using the DID model for analysis. The Section 3 is Materials and methods, mainly introducing the data source, sample ports, and the construction of the calculation model for SO2 emissions and DID model in this study. The Section 4 is the Results, mainly including the calculation results of SO2 emissions and the regression results of the DID model. In Section 5, we discuss the regression results of the model and provide suggestions on how to reduce port sulfur emissions and improve the implementation effectiveness of ECA policies. The Section 6 is Conclusion, which summarizes the main research results of this study and proposes future research directions.
2 Literature review
SOX, NOX, and PM are the ship emissions that are most harmful to the environment and to people’s health. More than 64,000 people, mainly in coastal areas, have died prematurely because of these pollutants (Walker, 2016). Additionally, ship emissions including those of greenhouse gases (GHG) have a detrimental impact on the environment. SOX, which are airborne pollutants in the maritime sector, are produced when fuels are burned in marine engines (Åström et al., 2018). About 13% of the world’s anthropogenic SO₂ emissions come from the shipping sector (Kotchenruther, 2015). Acid rain generation is one of SOX’s side effects. The vegetation is harmed by precipitation, which also causes water bodies to become more acidic, which has an impact on aquatic life (Åström et al., 2018). Through Annex VI of MARPOL, the IMO started to regulate SOX emissions in the year 2005 in an effort to reduce emissions and enhance air quality.
Currently, there are two ways to comply with the IMO sulfur regulations: either treat exhaust gas to keep SOX from entering the atmosphere, or use fuel with less sulfur. Exhaust gas cleaning systems (EGCS), commonly referred to as scrubbers, are utilized in the first alternative. Freshwater scrubbers are more than 90% efficient, but one drawback is the amount of storage space they require. There are hybrid scrubbers that combine freshwater and seawater (International Maritime Organization, ; Seddiek and Elgohary, 2014). Scrubbers are permitted by IMO MARPOL if the SOX discharged content is less than 0.5% (Åström et al., 2018). Scrubbers prevent ships from switching different kinds of fuel, which could be more expensive (International Maritime Organization, 2025). To reach the SOX limit, a certain number of larger ships would still require numerous scrubber installations. To comply with the SOX standard requirement limit, the remaining ships must utilize the second alternative. They must switch to fuels with less sulfur instead of Hydrofluoroolefins (HFO). Utilizing alternative fuels as well as combining HFO alongside fuel oils which possess low sulfur fuel oil (LSFO) can accomplish this (International Maritime Organization, 2025). Shipping contributes about 15% of anthropogenic NOx emissions. The MARPOL Annex VI emission standard for NOx and SOX was lowered in the year 2008 because of an amendment made by the MEPC and IMO to the convention (Sui et al., 2020).
PM refers to any combination of solid or liquid air particles that pose a significant threat to human health and the environment. PM can harm crops, forests, alter the acidity as well as balance the nutrient in water bodies (Environmental Protection Agency). PM can develop as a byproduct of SOX and NOx emissions. The American Bureau of Shipping (ABS) asserts that the IMO controls PM levels in addition to the discharge of those reactants. The IMO explicitly restricts the quantity of sulfur of the used fuels to lower PM emissions (International Maritime Organization, 2010). Because HFO has a higher quantity of sulfur and produces more SOX emissions, it has been discovered that PM emissions are higher when HFO is used (Winnes and Fridell, 2009). Monitoring fuel use, loading as well as combustion temperatures is crucial for lowering PM emissions. Catalyst filters, that remove the particles from the environment prior to it entering the air, is another alternative that is utilized (Seddiek and Elgohary, 2014).
The two major byproducts of combustion are CO2 and carbon monoxide. The maritime industry is in charge of 3.1% of the yearly anthropogenic CO2 emissions and 2.8% of the annual anthropogenic GHG emissions worldwide. Additionally, it was predicted that as marine traffic expands, emissions will rise by 50% to 250% by 2050 (International Maritime Organization, 2023; Sui et al., 2020). The increasing CO2 emissions from shipping and port operations have had a substantial effect on climate change as well as the environment in the marine industry. According to Wan et al., high CO2 emissions may result in the greenhouse effect, which harms the ecological balance of both the natural and built environment and makes port operations more difficult (Davarzani et al., 2016; Wang et al., 2018). Furthermore, the Port of Long Beach originally introduced its “green port” strategy in January 2005, along with a number of environmental protection initiatives aimed at lowering CO2 emissions (Tsai et al., 2018). Chang et al. evaluated the emission of carbon from the ships at each phase during the time from the entry of the port to the port exit and came to the conclusion that ocean car ferries were the largest emitters of CO2 at the Port of Incheon in the year 2012 (Chang et al., 2013; Chen et al., 2013). Goldsworthy and Goldsworthy built a model to quantify and spatially assign ship engine exhaust emissions at the ports in Australia utilizing terrestrial Automatic Identification System (AIS) information on the motion of the ships as well as its mode of operations (Goldsworthy and Goldsworthy, 2015).
Furthermore, Styhre et al. used yearly data from the ports of Gothenburg, Long Beach, Osaka, and Sydney to examine the amount of carbon emissions produced by ships when they are in ports (Styhre et al., 2017a). Also, it is generally accepted that cargo handling machinery used at ports also makes a sizable contribution to port CO2 emissions (Geerlings and van Duin, 2011). Peng et al. noted once again that emissions of carbon from cargo handling equipment, recently had been viewed as a serious issue due to the continuously increasing energy consumption such as fossil fuels brought on by the gradually expanding port production activities (Peng et al., 2018a).
Given that speed and energy consumption have a cubic relationship, even a small decrease in speed can have a significant impact on fuel usage. According to Buhaug et al, the greatest potential for reducing carbon emissions is typically assumed to come from lower speed (International Maritime Organization, 2009). In addition, by altering vessel speed in a waterway, Du et al. and Wang et al. (2013) developed optimization methodologies to reduce fuel usage (Du et al., 2011; Wang et al., 2013). The calculation results for ships approaching Kaohsiung Port show that reducing the speed to 12 knots can reduce CO2 emissions by about 40% (Chang and Jhang, 2016). Winnes et al. examined and projected ship emissions for the Port of Gothenburg through 2030, demonstrating that shortening berthing times is the most effective way to reduce emissions at berth (Winnes et al., 2016). By decreasing unproductive waiting times, Johnson and Styhre estimated that fuel consumption would decrease by 2–8% (Johnson and Styhre, 2015). According to research by Geerlings and Duin, switching from diesel to electric cargo stevedoring equipment can decrease CO2 emissions by 20% (Geerlings and van Duin, 2011).
According to findings by Styhre et al, the only way to significantly reduce carbon emissions is to switch to renewable fuels (Styhre et al., 2017b). This is based on an estimate of CO2 reduction for the period of 2011, and this plan will enable one to save approximately 197,000 tons of CO2 by 2020 (Peng et al., 2018a). The largest terminal operator Hamburger Hafen and Logistik AG utilizes sewage treatment facilities and the heat generated from biogas combustion to reduce 1,000 tons of CO2 annually (Peng et al., 2018b). Using biofuels can help the environment by reducing CO2 emissions compared to using traditional fossil fuels (Gaurav et al., 2017; Hoang et al., 2022). When comparing biofuels to other alternative fuels like hydrogen, it is vital to note that biofuels have a number of significant advantages (Hoang et al., 2021). In addition to ethanol, methanol is another well-liked type of alcoholic fuel. By switching to ethanol, the ship’s CO2 emissions have decreased by 25%, bringing them in line with the most recent ECA regulations for the Baltic Sea route (Bach et al., 2021). Methanol is the principal fuel used to power marine ships, and its combustion produces less CO2 and other typical air pollutants when compared to HFO and marine gas oil (Gilbert et al., 2018).
Also, hydrogen has the ability to become the preferred alternative fuel to traditional fossil fuels (Bui et al., 2020). Ammonia has recently been suggested as a potential alternative fuel for marine ships (Veritas, 2020). The usage of hydrogen fuel with regards to the ports and shipping industry possess the capacity to cut CO2 emissions by up to 40% for every unit of transportation work (Bicer and Dincer, 2018). Furthermore, ammonia which is a non-carbon fuel can be utilized as an alternative fuel for combustion engines, either alone or in combination with other fuels (Giddey et al., 2017). Ammonia becomes an ideal energy transportation tool and competitive choice (Lan et al., 2012).
In addition, the world ports and shipping industry is transitioning to a decarbonized future, and Liquefied Natural Gas (LNG) is a crucial component of that process (Al-Douri et al., 2022). The real decrease in CO2 emissions that LNG can attain, however, is between 12% and 20% because of the possibility of few methane slips (Hwang et al., 2019; Ushakov et al., 2019). It is possible to cut CO2 emissions from the principal engine of a ship by up to 10% by switching from diesel fuel to a dual-fuel, like LNG/diesel (Banawan et al., 2010). Researchers found that the average amount of CO2 was reduced respectively by 81% and 96%, when an HFO-to-LNG conversion occurred in a two-stroke diesel engine (Elgohary et al., 2015). Compared to marine fuel oils, LNG was found to emit less CO2 (Anderson et al., 2015). Because LNG emits less carbon, it is desirable fuel for the maritime industry (Hoang et al., 2022).
Lastly, dry ports can lessen carbon emissions and ease seaport congestion whilst accelerating the flow of cargo among ships and significant land transportation networks (Roso, 2007). Hanaoka and Regmi concluded that dry ports could improve traffic congestion and cut emissions by promoting a modal shift (Hanaoka and Regmi, 2011). Lattila et al. developed a technique for assessing prospective locations for dry ports, evaluating the effects of dry ports in Finland, and to find out the extent to which dry ports can reduce transportation-related emissions (Lättilä et al., 2013). Their result findings concurred with those of Roso who predicted a dry port could reduce CO2 emissions by 25% (Roso, 2007). The quantity of shippers within a specific range can raise the reduction in CO2 emissions brought on by sharing of transportation (Qiu et al., 2015).
The main objective of this study is to explore the impact of California ECA policies on pollutant emissions from ports in the United States. The DID model is an effective method for inferring the causal effects of policies. Wan et al. (2019) used the DID model to determine that ECA policies have a positive impact on reducing SO2 concentrations in the Yangtze River Delta and Bohai Rim regions. Zhou and Fan (2021) used the DID model to measure the impact of fuel conversion on SO2 concentration in the air at the Waigaoqiao Port in Shanghai, to evaluate the implementation and compliance of ECA policies. Wan et al. (2021) used the double difference method to explore whether China’s ECA policy helps reduce PM. The results indicate that only the Yangtze River Delta region showed a significant reduction in particulate matter, while similar results were not observed in the Pearl River Delta and Bohai Rim regions.
3 Materials and methods
3.1 Data source
AIS data, commonly known as ship traffic data, is gathered by the United States Coast Guard through on-board navigation safety equipment that continuously sends and tracks ship position and characteristics in both domestic and foreign waters in real time. The United States Coast Guard Navigation Center, the Marine Energy Administration (BOEM), and the National Oceanic and Atmospheric Administration (NOAA) collaborate in reusing some of the most important records in the United States Coast Guard’s national AIS network to create these records receivers. The data includes statistics from 2009 to 2014 as well as data for American coastal waters from January 2009 to December 2021. There are nine main ways to obtain AIS data, as shown in Table 1.
Table 1
| Source | Type | Characteristics | Address |
|---|---|---|---|
| Marine T. | Historical, real-time | Commercial | www.marinetraffic.com |
| Exact Earth | Historical | Commercial | www.exactearth.com |
| VT E. | Historical | Commercial | www.vtexplorer.com |
| Fleet Mon | Historical, real-time | Commercial | www.fleetmon.com |
| Vessel finder | Historical, real-time | Commercial | www.vesselfinder.com |
| Treasure Boat Net | Real-time | Commercial | www.myships.com |
| Ship News Network | Historical, real-time | Commercial | www.shipxy.com |
| AIS E. | Historical, real-time | Non-commercial | ais.exploratorium.edu |
| Marine C. | Historical | Non-commercial | marinecadastre.gov |
Sources of AIS data and their characteristics.
Static and dynamic information are the two broad categories into which AIS data can be separated. Whilst the dynamic information primarily consists of sailing state, time information, draft, the real-time ship position (latitude and longitude position), Heading (HDG), Speed Over Ground (SOG), and Course Over Ground (COG), the static information primarily consists of IMO number, cargo information, AIS equipment type, call numbers, ship size, the ship type, the Maritime Mobile Service Identity (MMSI), and the ship name (AIS (Automatic Identification System for Ships) data analysis, 2020).
3.2 Sample ports
Twelve ports are in California, and they serve as major international and domestic shipping hubs. The state is home to the two biggest ports in the country, the Ports of Los Angeles and Long Beach, which are both run by government agencies together with the small, privately-owned Port of Benicia. California’s ports have suffered a number of difficulties recently, including traffic congestion and air pollution from related vehicles and facilities.
The main ship ECAs are shown in Table 2. California ECA include six ports namely Los Angeles, Long Beach, San Diego, Oakland, Winnipeg, and San Francisco. California continues to enforce its own low sulfur fuel restrictions, the California Air Resource Board (CARB) Ocean-Going Vessel (OGV) fuel regulation, even though its waters are part of the North American ECA designated under MARPOL Annex VI. Therefore, two distinct sets of sulfur emission laws apply to ships operating within 24 nautical miles of California’s coastline.
Table 2
| Ship ECA | Establishment time | Created by | Classification |
|---|---|---|---|
| Baltic ECA | July 1, 2010 | IMO | SO2 |
| North Sea ECA | July 1, 2010 | IMO | SO2 |
| North American ECA | August 1, 2012 | IMO | SO2 |
| American Caribbean ECA | January 1, 2013 | IMO | SO2 |
| North American NECA | January 1,2016 | IMO | NOX |
| American Caribbean NECA | January 1,2016 | IMO | NOX |
| European Sea ECAs | January 1, 2010 | European Union | SO2 and NOX |
| California ECA | August 1, 2012 | America | SO2 and NOX |
| Pearl River Delta Sea ECA | January 1, 2016 | China | SO2 and NOX |
| Yangtze River Delta Sea ECA | January 1, 2016 | China | SO2 and NOX |
| Bohai Rim ECA | January 1, 2016 | China | SO2 and NOX |
ECA related information.
Although both standards have a 0.10% sulfur limit, the CARB OGV Fuel Regulation mandates that the fuel also adhere to the requirements for distillate grades which includes marine gas oil as well as marine diesel oil) and does not allow for compliance using scrubbers. Only the state of California’s legislators rejects the usage of residual fuels in conjunction with exhaust gas scrubbers as a legal method of bringing ship sulfur emissions down to the permitted levels.
This study selected five ports located in the United States, three of which are within the regulatory scope of California’s emission control zone (Los Angeles Port, Long Beach Port, Oakland Port), and the other two ports are within the regulatory scope of North American emission control zones (New York Port and New Jersey Port, Savannah Port). The distribution of selected sample ports is shown in Figure 1.
Figure 1
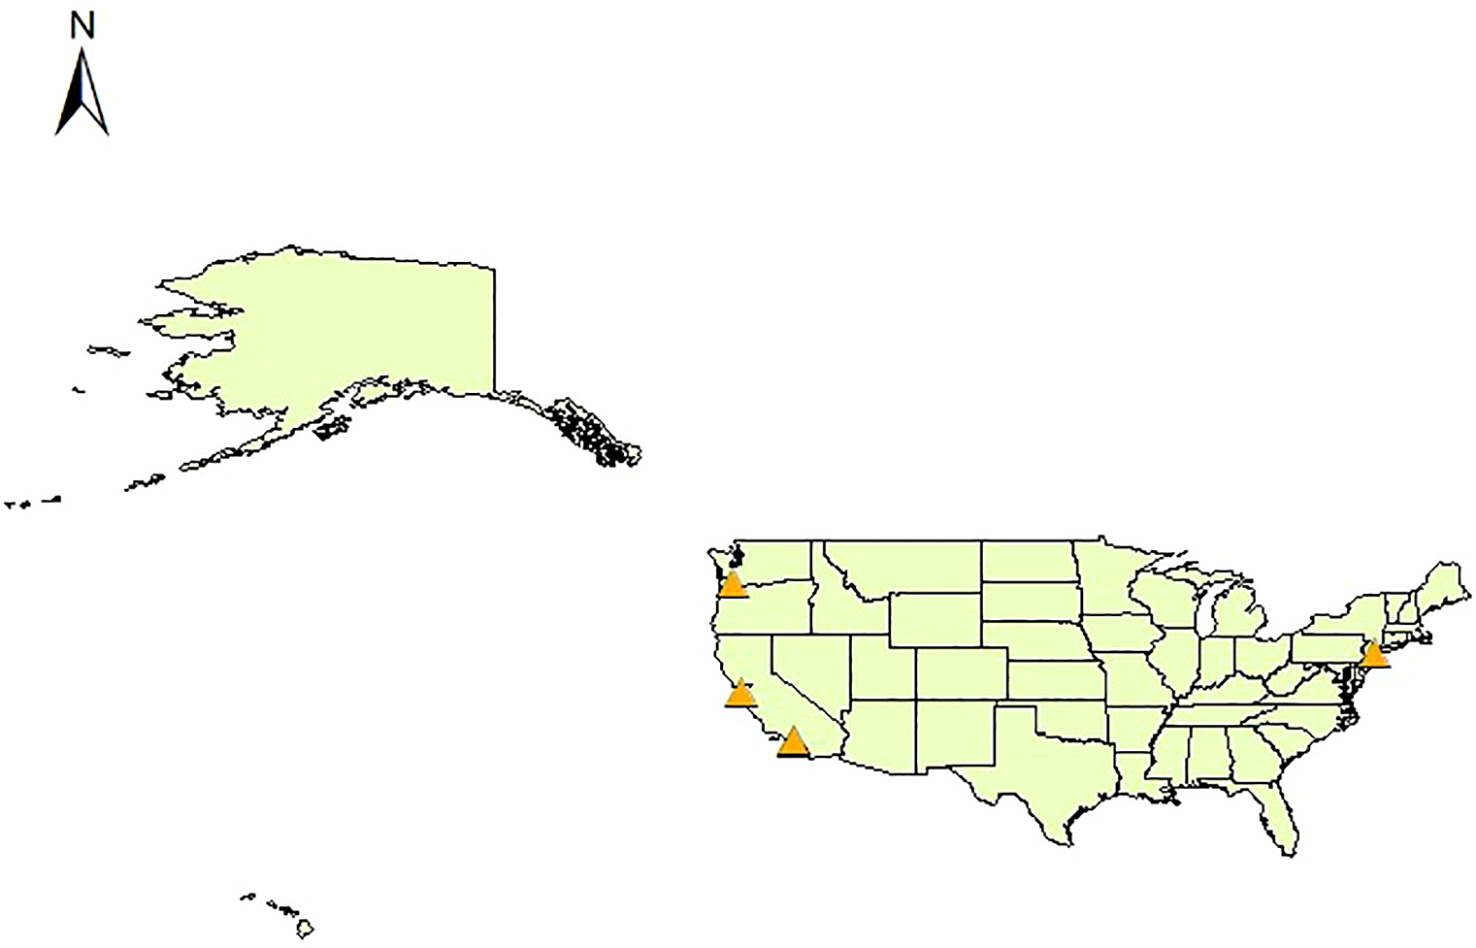
Distribution of sample ports in the United States.
The busiest port in America is the Port of Los Angeles, also referred to as America’s Port (Xiao et al., 2022). It was established in 1907, and the Los Angeles Board of Harbor Commissioners is in charge of it. This enormous port, which stretches 7,500 acres of land and water over 43 miles of the California coast, is situated in the San Pedro neighborhood, 25 miles south of downtown Los Angeles. It can accommodate 9,079,561 TEU. In the US, it is the biggest port. Since 2000, the Port of Los Angeles has led the led the nation in container volume, and it is now rated 17th globally. The principal imports at the port include electronics, furniture, footwear, clothing, auto components as well as plastic. Soybeans, pet/animal feed, scrap metal, paper/wastepaper as well as textiles/raw cotton are among the exports (Rompoti, 2025).
The port of Long Beach can handle 7,884,565 TEU. It is well known for its environmentally friendly safety procedures. According to the Port of Long Beach’s official website, the Port of Long Beach is currently the second busiest port in America, handling almost $200 billion in trade yearly (Xiao et al., 2022). This second-busiest American port experienced its second-busiest year ever in 2021, handling about 8.1 million container units whilst upholding its reputation as a superb advocate for the industry, community as well as the environmental. The port can handle a wide range of cargo. One in five occupations in Long Beach, or about 50,000 positions, are port-related (Rompoti, 2025).
In Oakland, California, on the San Francisco Bay, there is a significant container ship terminal called the Port of Oakland. It was the first significant port to construct container ship terminals on the Pacific Coast of America. The fifth-busiest container port in America is the Port of Oakland. It is a crucial port for American agricultural exports and can handle 2,460,000 TEU. The Oakland Seaport has been Northern California’s main maritime gateway for exports of overseas containers since our foundation in 1927. Glass, consumer goods, consumer electronics, clothes, and a range of home goods are all imported here. Numerous dried fruits, nuts, wines, and other alcoholic beverages are also exported from the Oakland port.
The Port of New York and New Jersey is the third busiest port in America and it constitutes the main port on the east coast. Every year, the port’s traffic volume grows more and more. The official trade report from the Port of New York and New Jersey website states that more than 4.2 million cargo containers were handled in 2019, transporting cargo with a value of more than $200 billion. An estimated 7,455,786 TEU are present at the ports. The primary imports and exports handled by this port are petroleum, breakbulk cargo, vehicles, wood, drinks, and scrap metal (Rompoti, 2025).
The fourth-busiest port in America is the Port of Savannah in the Georgia Ports. The Port of Savannah, which transported 4.6 million TEU in 2020, is North America’s largest single-terminal container facility. By 2023, it is anticipated that this figure will rise as the port’s yearly capacity for containers rises by 750 thousand TEU. The ports exports consist of animal feed, grain goods, poultry, bulbs and seeds, cotton, edible nuts, and bread flour. Palm oil, shallots, coffee, sugar, rice, and onions are among the imported goods.
3.3 Evaluation model
The framework of this paper is illustrated in the Figure 2.
Figure 2
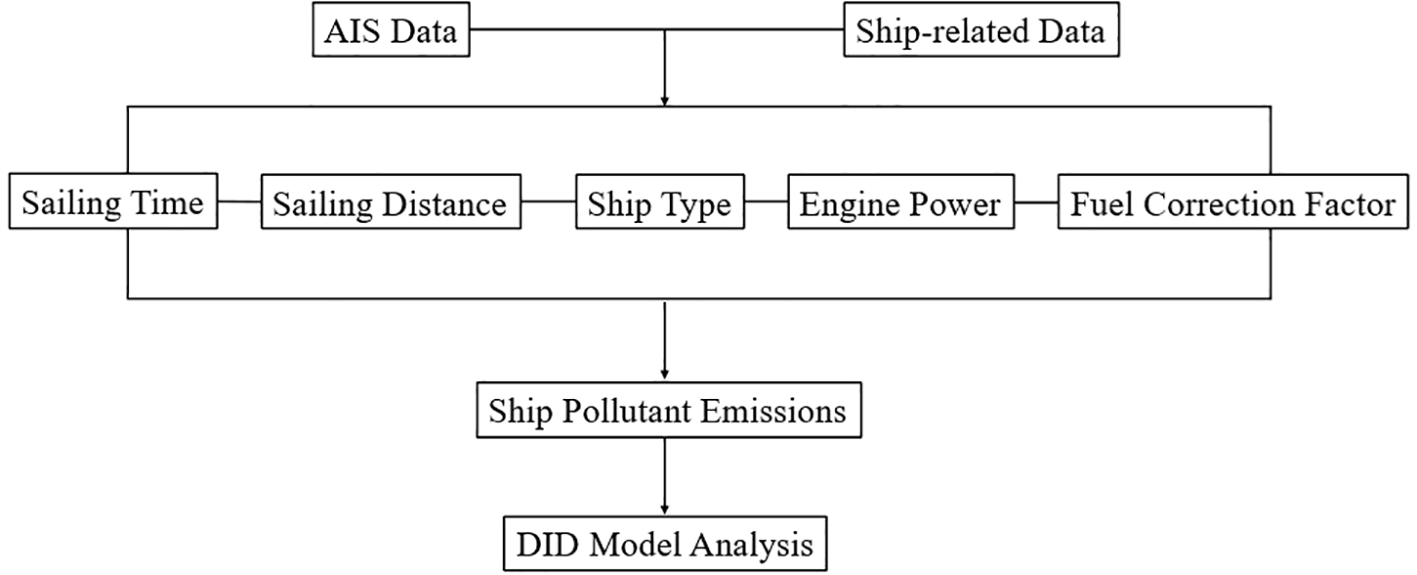
Evaluation framework.
This study aims to evaluate the whether the ECA policy established on the 1st day of 2014 had a significant impact in these ports and the sulfur policy states that ships must use low-sulfur fuel oil with a maximum 1% sulfate content. Therefore, we utilized the DID model because it can isolate changes in outcomes over time across samples that were and weren’t influenced by the policies, as well as control systematic disparities between the treatment and control groups. The DID model can eliminate any biases that may come from trends brought on by additional factors and it can effectively avoid the endogenous issues that frequently occur. The suggested DID model can be defined as Equation 1:
where the SO2 value is the interpreted variable, and the subscripts i stands for the ports and t for year, respectively. Z stands for a set of control variables. The data utilized in this study were collected statistically from January 1, 2013 to December 31, 2014. As outlined in the definition above, the DID parameters are explained (Table 3).
Table 3
| Interpretation | Before ECA implementation () | After ECA implementation () | Difference |
|---|---|---|---|
| Ports within the ECA treatment group, () | |||
| Ports not within the ECA control group, (0) | |||
| DID estimation |
DID parameters.
Ports before the implementation of the ECA sulfur policy are considered as the control groups whilst ports after implementation of ECA are handled as the treatment groups. Ports before the implementation of sulfur ECA policy is represented by whereas ports after the implementation of policy is represented by . In this case, , if the observation value falls under 2013 and , if the observation value is within 2014. Moreover, a negative coefficient indicates that the sulfur ECA policy has had a positive and significant impact by reducing the SO2 concentration at the ports.
4 Results
4.1 Variables and descriptive statistics
We use the SO2 emissions from the port as the explanatory variable (dependent variable), and the data source is AIS data published on marinecadastre.gov. The calculation of emissions is mainly based on the power of ship engines, operating time, and pollutant emission factors.
The nomenclature used in Equations 2–8 is presented below (Kao et al., 2022).
E: Emission (ton);
: Total energy demand (kWh);
: Energy demand of a main engine (kWh);
: Energy demand of an auxiliary engine (kWh);
: Energy demand of an auxiliary boiler (kWh);
: Maximum continuous rating power (kW);
: Load factor of a main engine;
: Load factor of an auxiliary engine;
: Load factor of an auxiliary boiler;
: Activity (h);
: Emission factor (g/kWh);
: Fuel correction factor;
: Actual speed (knots);
: Maximum speed (knots); and
D: Distance (nautical miles).
The core explanatory variable of this study is the interaction term DID between the region and time of implementation of ECA policies in California. Among the five ports studied in this article, the ports of Los Angeles, Long Beach, and Oakland are located within the management scope of California’s ECA policy. New Jersey and New York Port, and Savannah Port are within the jurisdiction of the North American ECA policy. The California ECA policy established new requirements for sulfur oxide emissions on January 1, 2014, requiring ships to use fuel with a sulfur content of no more than 0.10% m/m.
We calculated the SO2 emissions of five ports in the United States in 2013 and 2014, and the results are shown in the Figure 3. It can be seen that compared to 2013, the SO2 emissions from these five ports have significantly decreased in 2014.
Figure 3
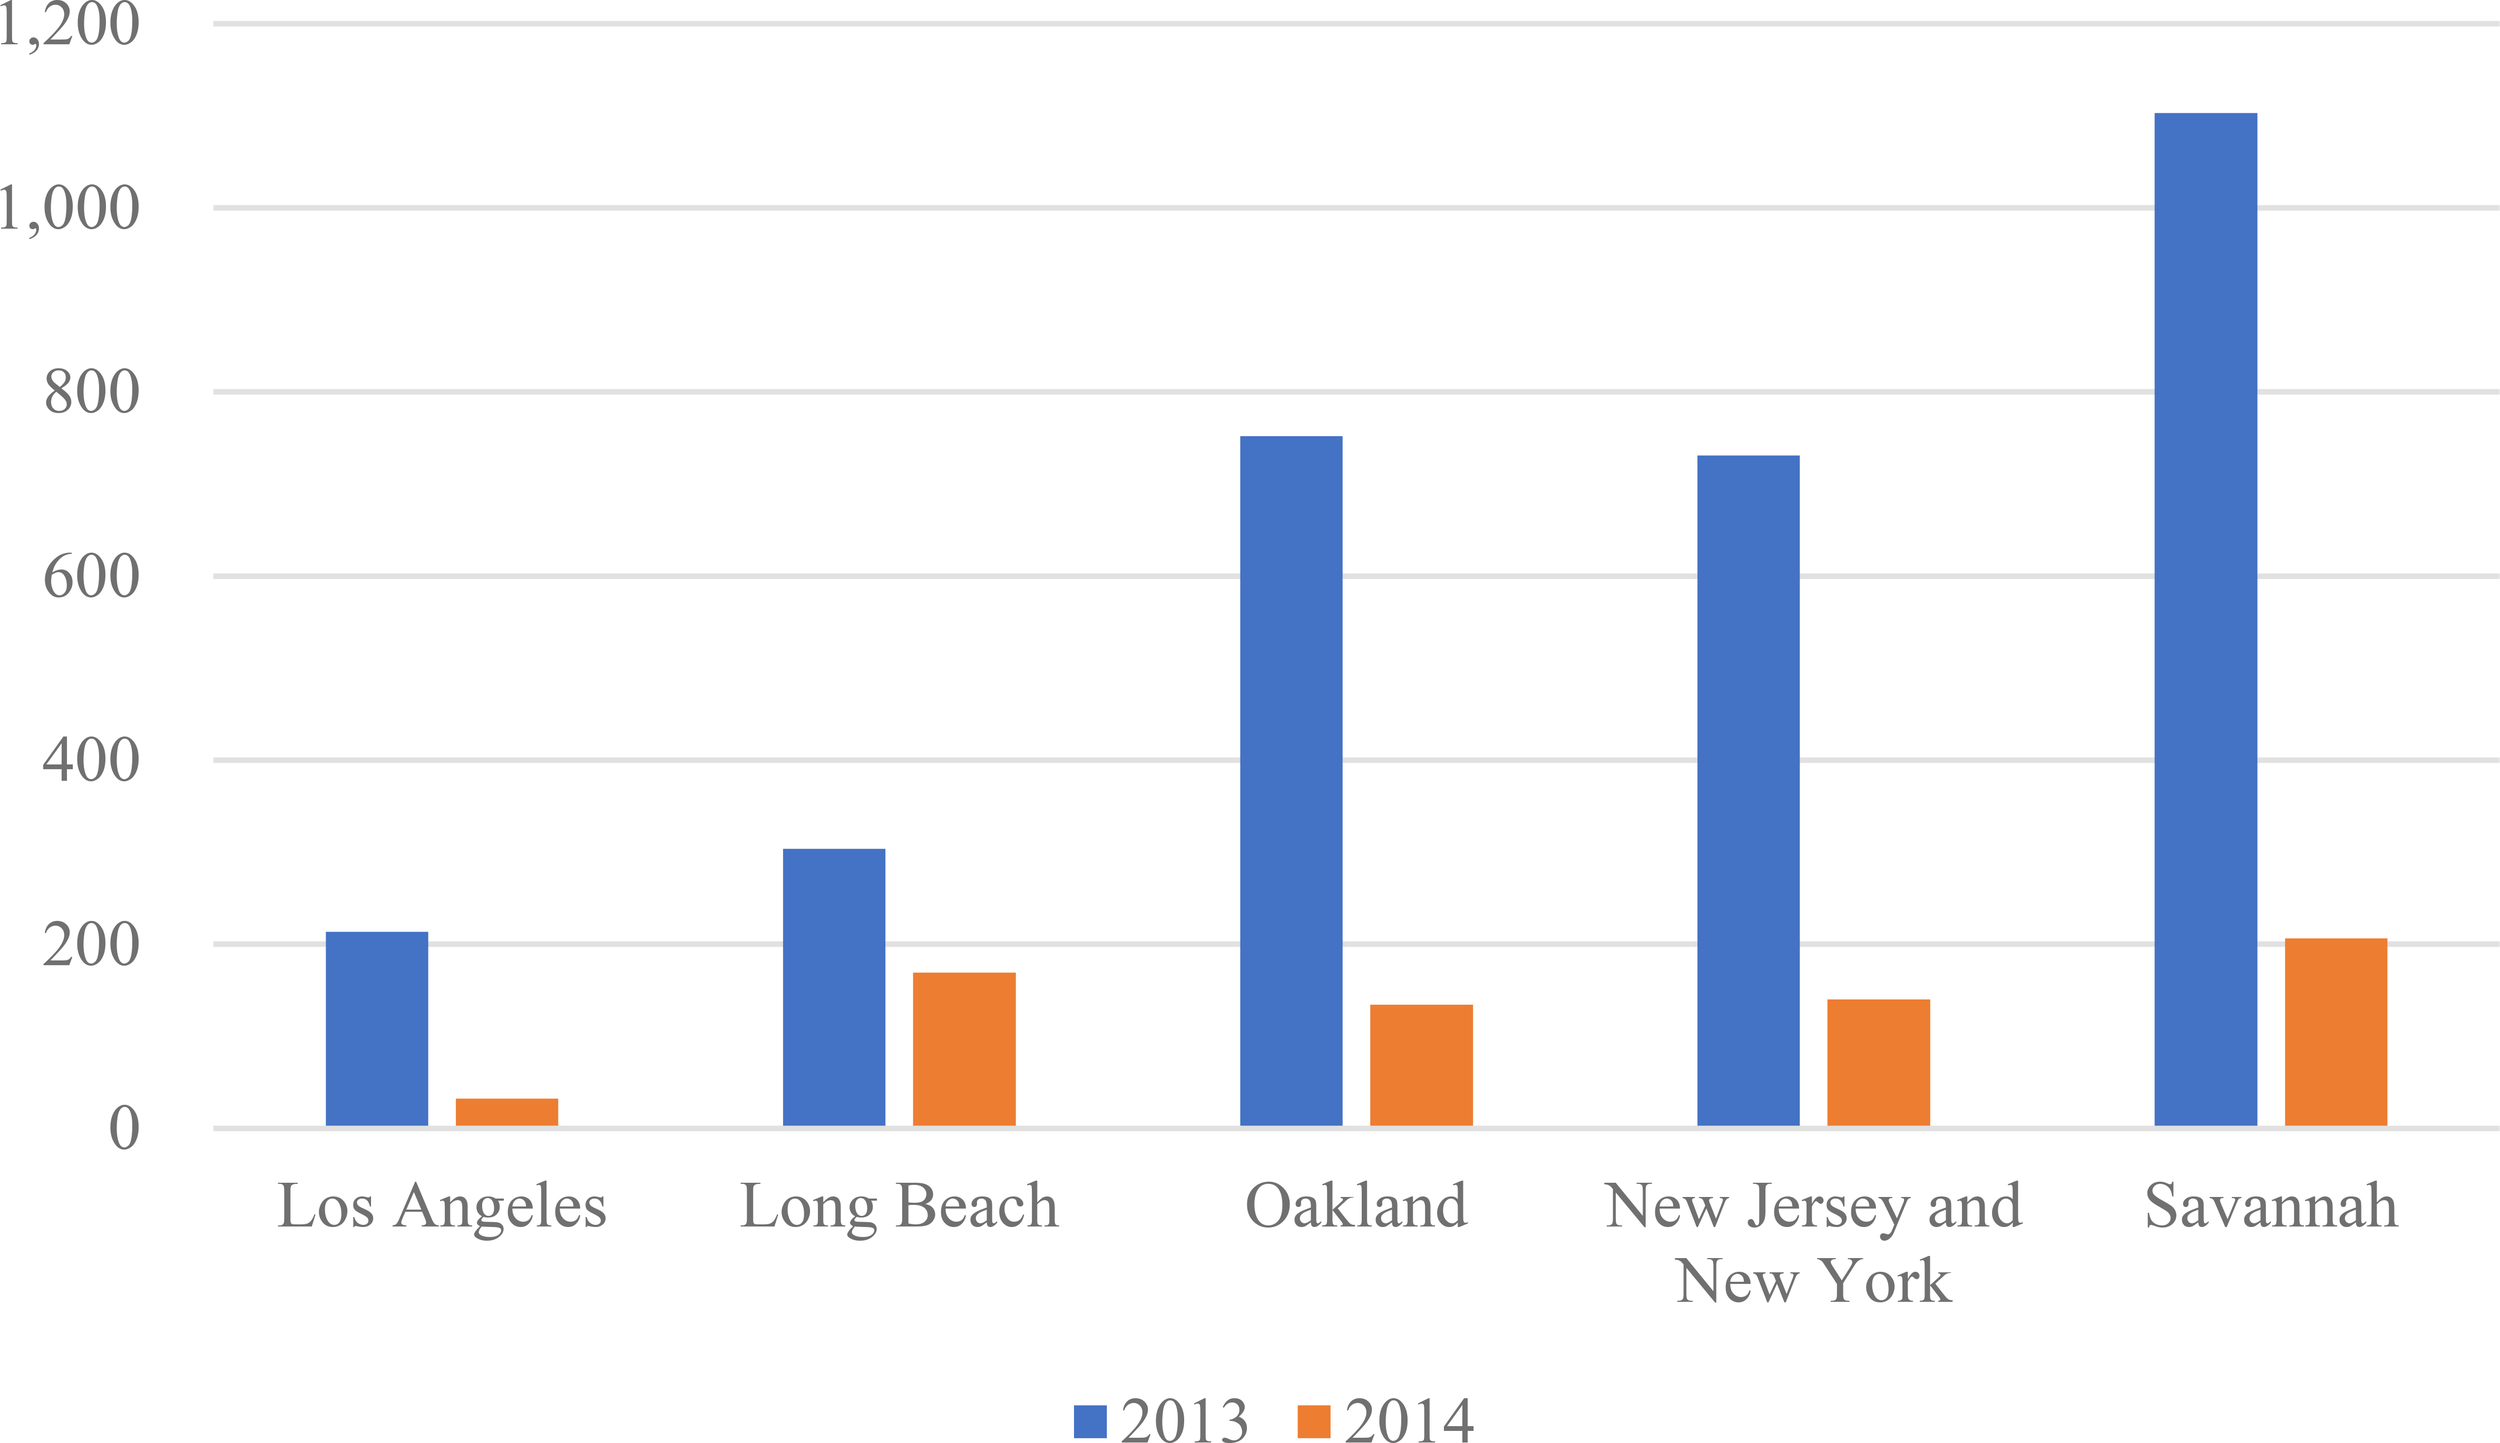
The SO2 emissions in 2013 and 2014.
Control variables: Control variables are chosen to limit how much other factors affect the interpreted variables. It has been proven that economic growth (Xu and Lin, 2016), investment in science and technology, transportation conditions (Shahraki and Turkay, 2014), environmental protection (Brännlund et al., 2007), population size (Long, 2011), spending on social welfare and industrial development (Gao et al., 2023) are all related to city air quality. As a result, the following information is included in our DID model: gross domestic products, imports, exports, port throughput and inflation rate. These data are primarily obtained from the statistics bureau data portal of the relevant port cities. For instance, ports of Oakland data on imports and exports can be retrieved at:
http://www.worldportsource.com/trade/imports/value/USA_CA_Port_of_Oakland_231.php.
Tables 4 –8 below depict the descriptive statistics of the five ports employed in this study which includes, Los Angeles, Long Beach, Oakland, New York, and New Jersey. Also, the mean and the standard deviation of the control groups and treatment groups of each of the variables are calculated together with the corresponding full sample figures.
Table 4
| Variables | Full sample | Control group | Treatment group | |||
|---|---|---|---|---|---|---|
| Mean | Std. dev | Mean | Std. dev | Mean | Std. dev | |
| In sulfur | 9.862 | 7.648 | 10.972 | 8.497 | 8.753 | 7.507 |
| In Throughput | 16.059 | 0.491 | 16.035 | 5,218,099 | 16.084 | 0.519 |
| In Pop | 16.020 | 1.548 | 16.017 | 1.644 | 16.024 | 1.640 |
| In GDP | 20.217 | 4.502 | 20.202 | 4.777 | 20.233 | 4.774 |
| In Export | 18.741 | 4.308 | 17.694 | 4.049 | 19.788 | 4.756 |
| In Import | 21.050 | 4.429 | 20.021 | 4.659 | 22.078 | 4.449 |
| In Inflating | 1.064 | 0.595 | 0.824 | 0.745 | 1.304 | 0.312 |
| Observations | 168 | 84 | 84 | |||
Descriptive statistics of Los Angeles (LA).
Table 5
| Variables | Full sample | Control group | Treatment group | |||
|---|---|---|---|---|---|---|
| Mean | Std. dev | Mean | Std. dev | Mean | Std. dev | |
| In sulfur | 9.716 | 8.019 | 9.517 | 7.592 | 10.349 | 7.248 |
| In Throughput | 13.608 | 0.840 | 13.007 | 740,059 | 13.319 | 0.715 |
| In Pop | 11.949 | 0.527 | 10.162 | 1.026 | 11.538 | 0.684 |
| In GDP | 15.042 | 0.509 | 15.936 | 0.174 | 15.241 | 0.746 |
| In Export | 15.748 | 3.594 | 14.113 | 2.596 | 16.945 | 3.083 |
| In Import | 16.630 | 4.018 | 15.053 | 4.715 | 16.022 | 4.319 |
| In Inflating | 1.017 | 0.651 | 0.368 | 1.158 | 1.831 | 0.504 |
| Observations | 168 | 84 | 84 | |||
Descriptive statistics for Long Beach (LB).
Table 6
| Variables | Full sample | Control group | Treatment group | |||
|---|---|---|---|---|---|---|
| Mean | Std. dev | Mean | Std. dev | Mean | Std. dev | |
| In sulfur | 8.860 | 7.026 | 7.138 | 7.786 | 9.008 | 7.828 |
| In Throughput | 13.004 | 0.328 | 12.125 | 159,513 | 13.183 | 0.222 |
| In Pop | 10.866 | 4.661 | 9.101 | 3.555 | 10.887 | 4.039 |
| In GDP | 15.749 | 4.092 | 15.777 | 4.918 | 14.222 | 4.935 |
| In Export | 14.829 | 4.111 | 13.206 | 3.179 | 14.160 | 4.785 |
| In Import | 16.720 | 0.064 | 15.335 | 1.001 | 16.318 | 0.731 |
| In Inflating | 1.019 | 0.674 | 1.006 | 1.816 | 1.444 | 1.641 |
| Observations | 168 | 84 | 84 | |||
Descriptive statistics for Oakland (OL).
Table 7
| Variables | Full sample | Control group | Treatment group | |||
|---|---|---|---|---|---|---|
| Mean | Std. dev | Mean | Std. dev | Mean | Std. dev | |
| In sulfur | 10.173 | 9.002 | 11.414 | 8.666 | 10.1757 | 9.171 |
| In Throughput | 12.232 | 0.115 | 11.978 | 0.140 | 12.205 | 0.996 |
| In Pop | 10.935 | 9.137 | 10.182 | 84,059 | 10.107 | 9.555 |
| In GDP | 15.800 | 0.682 | 14.198 | 0.512 | 15.559 | 0.612 |
| In Export | 15.731 | 14.919 | 15.174 | 14.001 | 15.163 | 15.893 |
| In Import | 13.621 | 0.833 | 13.226 | 0.813 | 13.657 | 0.488 |
| In Inflating | 1.366 | 0.888 | 1.013 | 0.024 | 1.001 | 1.735 |
| Observations | 168 | 84 | 84 | |||
Descriptive statistics for New York and New Jersey (NJ).
Table 8
| Variables | Full sample | Control group | Treatment group | |||
|---|---|---|---|---|---|---|
| Mean | Std. dev | Mean | Std. dev | Mean | Std. dev | |
| In sulfur | 8.494 | 7.007 | 8.846 | 6.101 | 9.605 | 7.810 |
| In Throughput | 12.342 | 4.182 | 11.561 | 4.995 | 12.597 | 4.397 |
| In Pop | 10.621 | 2.083 | 9.920 | 1.523 | 10.095 | 2.777 |
| In GDP | 11.151 | 5.366 | 10.824 | 5.562 | 11.572 | 5.653 |
| In Export | 13.044 | 4.006 | 13.555 | 4.115 | 13.041 | 4.666 |
| In Import | 9.407 | 0.019 | 8.886 | 0.564 | 9.582 | 0.448 |
| In Inflating | 1.226 | 0.756 | 0.014 | 0.567 | 1.888 | 1.107 |
| Observations | 168 | 84 | 84 | |||
Descriptive statistics for Savannah (SV).
4.2 Regression results
Tables 9 –13 shows the impact of sulfur on the ports of Los Angles, Long Beach, Oakland, New York and New Jersey and Savannah. To avoid multicollinearity, separation estimation for the control variables were made. From the regression results, it can be seen that regardless of whether control variables are added or not, the core explanatory variable DID has a significant negative impact on the SO2 emissions of the Port of Los Angeles at the 1% and 5% significance levels, respectively. This also means that the implementation of California ECA policy has a significant inhibitory effect on SO2 emissions from the Port of Los Angeles. However, in other ports, the DID variable did not show a significant impact trend on SO2 emissions. For the ports of New Jersey and New York and the port of Savannah, which are not under the jurisdiction of the California ECA policy, these two ports are within the management scope of the North American ECA policy. Since January 1, 2015, the North American ECA policy has required ships to use fuel with a sulfur content of no more than 0.10% m/m, so it is reasonable that the SO2 emissions of these two ports have not been significantly affected in the regression results. The Port of Los Angeles and the Port of Long Beach jointly developed the San Pedro Bay Area Clean Air Action Plan in 2006, in collaboration with the California Air Resources Board, the South Coast Air Quality Management District, and the US Environmental Protection Agency’s Ninth District. This plan includes the measures and goals taken by the two largest ports in the United States to reduce exhaust emissions, and plans to improve the atmospheric environment of the San Pedro Harbor where the two ports are located. At the same time, it will also track and analyse the measures taken, as well as the impact and target tasks, and conduct joint testing with relevant air quality supervision units.
Table 9
| Variables | Without control variables | With all control variables | ||||
|---|---|---|---|---|---|---|
| −0.138** (0.021) |
−0.352*** (0.001) |
−0.130** (0.023) |
−0.115** (0.027) |
−0.402* (0.009) |
−0.350*** (0.001) |
|
| −0.328*** (0.017) |
−0.521*** (0.001) |
−0.107** (0.024) |
−0.238*** (0.012) |
−0.397** (0.022) |
−0.444** (0.033) |
|
| −0.523*** (0.013) |
−0.017** (0.020) |
−0.390*** (0.019) |
−0.112** (0.022) |
−0.149*** (0.015) |
−0.104** (0.024) |
|
| In Throughput | −0.085** (0.049) |
0.996** (0.445) |
||||
| In Pop | 0.028** (0.046) |
0.897*** (0.432) |
||||
| In GDP | −0.133** (0.023) |
0.525** (0.239) |
||||
| In Export | −0.402*** (0.015) |
0.767** (0.335) |
||||
| In Import | 0.333** (0.026) |
−0.165*** (0.016) |
||||
| In Inflating | −0.094* (0.086) |
0.940** (0.481) |
||||
| C | −3.102*** (0.104) |
−4.963*** (0.189) |
2.521*** (0.016) |
−1.071*** (0.001) |
1.337*** (0.016) |
−2.004*** (0.012) |
| Adj.R2 | 0.141 | 0.249 | 0.160 | 0.117 | 0.038 | 0.084 |
Los Angeles DID result about SO2..
The values in parentheses shows the standard errors. ***, **, and * depict that the coefficient is statistically significant at the 1%, 5%, and 10% level, respectively.
Table 10
| Variables | Without control variables | With all control variables | ||||
|---|---|---|---|---|---|---|
| −0.453** (0.294) |
−0.469** (0.297) |
−0.527** (0.314) |
−0.350** (0.216) |
−0.250*** (0.110) |
−0.255*** 0.110 |
|
| 0.233* (0.061) |
0.254* (0.087) |
0.383*** (0.138) |
0.590** (0.219) |
0.337*** (0.123) |
0.364*** (0.137) |
|
| −0.023*** (0.016) |
−0.017*** (0.011) |
−0.009*** (0.001) |
−0.075** (0.059) |
−0.188* (0.072) |
−0.018*** (0.011) |
|
| In Throughput | −0.598** (0.315) |
0.591** (0.219) |
||||
| In Pop | −0.228* (0.085) |
−0.023*** (0.016) |
||||
| In GDP | 0.404** (0.216) |
0.040*** (0.138) |
||||
| In Export | 0.133** (0.005) |
0.889** (0.477) |
||||
| In Import | 0.099** (0.023) |
0.234*** (0.017) |
||||
| In Inflating | 0.251*** (0.173) |
0.456** (0.221) |
||||
| C | −2.141*** (0.549) |
4.455*** (0.134) |
−1.901*** (0.163) |
5.799** (0.286) |
−2.771*** (0.510) |
1.299*** (0.100) |
| Adj.R2 | 0.283 | 0.052 | 0.205 | 0.023 | 0.015 | 0.071 |
Long Beach DID result about SO2..
Table 11
| Variables | Without control variables | With all control variables | ||||
|---|---|---|---|---|---|---|
| −0.154** (0.213) |
−0.460*** (0.013) |
−0.230*** (0.010) |
−0.350** (0.002) |
−0.476** (0.028) |
−0.0476** (0.028) |
|
| −0.219** (0.021) |
−0.386*** (0.016) |
0.467** (0.037) |
0.330** (0.053) |
0.659*** (0.018) |
0.333** (0.053) |
|
| 0.444*** (0.014) |
0.200** (0.005) |
0.982** (0.038) |
0.457*** (0.017) |
0.350* (0.008) |
0.467** (0.037) |
|
| In Throughput | −0.740** (0.024) |
0. 456*** (0.017) |
||||
| In Pop | −0.125*** (0.012) |
0.209** (0.005) |
||||
| In GDP | 0.171*** (0.014) |
0.701** 0.023 |
||||
| In Export | 0.182** (0.023) |
0.194** 0.025 |
||||
| In Import | −0.004*** (0.010) |
0.213** (0.005) |
||||
| In Inflating | −0.665** (0.020) |
−0.662** (0.217) |
||||
| C | −1.201*** (0.026) |
−1.333*** (0.045) |
3.519*** (0.155) |
−1.266*** (0.029) |
3.787*** (0.142) |
5.555*** (0.103) |
| Adj.R2 | 0.311 | 0.242 | 0.267 | 0.407 | 0.292 | 0.036 |
Oakland DID result about SO2..
Table 12
| Variables | Without control variables | With all control variables | ||||
|---|---|---|---|---|---|---|
| −0.040*** (0.168) |
−0.057** (0.226) |
−0.035*** (0.105) |
−0.068** (0.367) |
−0.077*** (0.185) |
−0.095** (0.021) |
|
| −0.051*** (0.104) |
−0.091** (0.020) |
−0.055** (0.209) |
−0.087** (0.220) |
−0.062* (0.617) |
−0.061** (0.226) |
|
| −0.088* (0.064) |
−0.051** (0.042) |
−0.022** (0.033) |
−0.059** (0.041) |
−0.350** (0.021) |
−0.041*** (0.105) |
|
| In Throughput | −0.333* (0.515) |
−0.005** (0.231) |
||||
| In Pop | −0.028* (0.006) |
−0.019*** (0.124) |
||||
| In GDP | −0.001** (0.055) |
−0.063** (0.226) |
||||
| In Export | −0.406* (0.069) |
−0.003** (0.231) |
||||
| In Import | −0.891** (0.025) |
−0.058** (0.210) |
||||
| In Inflating | −0.125** (0.445) |
−0.068** (0.367) |
||||
| C | −2.999*** (0.210) |
−3.544*** (0.488) |
−2.399*** (0.225) |
−3.922*** (0.600) |
−2.444*** (0.212) |
−2.406*** (0.229) |
| Adj.R2 | 0.055 | 0.011 | 0.273 | 0.253 | 0.500 | 0.519 |
New York and New Jersey DID result about SO2..
Table 13
| Variables | Without control variables | With all control variables | ||||
|---|---|---|---|---|---|---|
| −0.626*** (0.131) |
−0.943*** (0.101) |
−0.533*** (0.133) |
−0.655*** (0.100) |
−0.222*** (0.158) |
−0.224*** (0.158) |
|
| 0.636*** (0.014) |
0.405*** (0.010) |
0.111* (0.007) |
0.450** (0.029) |
0.708** (0.054) |
0.408*** (0.010) |
|
| −0.048** (0.243) |
−0.039** (0.266) |
−0.021*** (0.144) |
−0.079** (0.352) |
−0.750** (0.264) |
−0.545*** (0.138) |
|
| In Throughput | 0.377** (0.002) |
0.443** (0.020) |
||||
| In Pop | −0.036** (0.202) |
−0.657*** (0.100) |
||||
| In GDP | −0.085** (0.031) |
−0.042** (0.266) |
||||
| In Export | 0.023* (0.007) |
−0.235*** (0.158) |
||||
| In Import | −0.747** (0.340) |
−0.411*** (0.010) |
||||
| In Inflating | −0.056** (0.400) |
−0.410*** (0.016) |
||||
| C | −4.009*** (0.625) |
2.434*** (0.039) |
3.105*** (0.098) |
−1.153*** (0.216) |
−2.024*** (0.469) |
−2.333*** (0.450) |
| Adj.R2 | 0.332 | 0.052 | 0.0248 | 0.393 | 0.267 | 0.071 |
Savannah DID result about SO2..
The regression results based on the DID model show significant port heterogeneity in the inhibitory effect of ECA policies on sulfur emissions. Core variable interaction term (). The coefficient at the Port of Los Angeles (LA) is −0.523*** (p<0.01), indicating a significant reduction in sulfur emissions after policy implementation, while the interaction coefficients at other ports (Long Beach, Oakland, New York New Jersey, Savannah) did not pass the significance test (p>0.1). Since 2006, the Port of Los Angeles has implemented the San Pedro Bay Clean Air Action Plan, which requires ships to use shore power, navigate at low speeds, and mandate the installation of Exhaust Gas Purification Systems (EGCS). The ECA policy (2014) has formed a synergistic effect with previous measures, further compressing the space for sulfur emissions. The main reasons for the insignificant performance of other ports may include: lagging policy implementation and insufficient fuel substitution. Some ports rely on manual verification for law enforcement, which led to implementation loopholes in the early stages of ECA policy implementation in 2014. Small and medium-sized vessels still rely on high sulfur fuels (sulfur content>0.5%), and policies have not established classification standards for such vessels.
In addition, since 2012, the enforcement of ECA policies has increased, resulting in some lagging effects on sulfur emissions from ports. Due to proactive measures taken to reduce the negative impact of ship pollutant emissions before implementing ECA sulfur policies in various ports, ECA policies are not helpful in reducing sulfur emissions in the three ports in California. In addition, since January 1, 2014, in addition to the current fuel standards for ships sailing at sea in California, more changes have been made to require ships to comply with North American ECA standards and California standards. In addition, in January 2014, a change was made to set the maximum sulfur content of marine diesel and marine diesel at 0.1%, which is also mandatory for ports in North American ECA. This change and reason explain why ECA sulfur policy has not had any significant positive impact on reducing SO2 concentration in these ports.
5 Discussions
From the regression results of the DID model, ECA policies have increasingly high requirements for the sulfur content in ship fuel, and under the influence of this policy, it has effectively suppressed the emission of SO2 from ports. For shipping companies, reducing sulfur oxide emissions from ships without significantly increasing costs is a worthwhile issue to consider. There is an unstoppable trend towards the reduction of sulfur emissions and environmental protection, as seen by the enactment of new agreements and regulations pertaining to these topics.
The regression results indicate that the ECA policy significantly reduced sulfur emissions only at the Port of Los Angeles, while its impact on other ports remained statistically insignificant. This disparity highlights the need for region-specific policy adjustments and complementary measures to enhance the effectiveness of emission control frameworks. The following recommendations are proposed: For ports like Long Beach and Oakland, which showed no significant emission reductions despite being under California ECA, stricter phased sulfur limits (e.g., incremental reductions from 0.5% to 0.1% over 3–5 years) could mitigate compliance inertia. The concurrent implementation of North American ECA (2015) and California ECA (2014) may dilute policy impacts. Harmonizing timelines and thresholds across jurisdictions could reduce confusion and enforcement costs. Implement mandatory AIS-linked emission reporting systems for ships entering all ECA zones, coupled with automated penalties for non-compliance. Independent verification of fuel logs and scrubber efficiency reports, particularly for ports like New York-New Jersey and Savannah, where lax enforcement may explain the lack of policy impact. Targeted subsidies for smaller shipping companies operating in underperforming ports could offset the cost disparity between high- and low-sulfur fuels. Link sulfur emission reductions to existing carbon trading markets, allowing ports to monetize excess emission cuts, as seen in Los Angeles’ early success. Regularly reassess emission thresholds using real-world data (e.g., AIS-derived emission trends) to account for technological advancements and traffic growth. Expand ECA mandates to include NOx and PM2.5, as these pollutants often co-vary with sulfur emissions, ensuring comprehensive air quality improvements. By aligning policy rigor with regional operational contexts, regulators can amplify the ECA’s impact while addressing the heterogeneity observed in this study.
Currently, three primary methods have been implemented aboard ships to effectively reduce SOx emissions: low-sulfur fuel adoption, exhaust gas cleaning system installation, and liquefied natural gas (LNG) as an alternative fuel. Among these, low-sulfur fuel technology involves directly using fuels with a maximum sulfur content of 0.1%, primarily including low-sulfur heavy fuel oil, low-sulfur marine diesel, and low-sulfur marine gasoline. While low-sulfur fuel represents the most straightforward solution, several operational challenges have emerged in practical maritime applications. Firstly, there is a cost issue. Low sulfur light fuel oil is much more expensive than low sulfur heavy fuel oil, which may lead to a significant increase in fuel costs for businesses. In addition, the long-term use of low sulfur light fuel oil in medium and low-speed diesel engines on board ships will increase the burden on ship equipment and fuel conversion, and increase safety risks. Therefore, ships must undergo technical modifications to the affected equipment. The main elements involved in the technological transformation of low sulfur oil systems are boilers, other equipment, ship auxiliary equipment, and oil transportation systems, as shown in Figure 4. Nowadays, heavy oil is used for combustion on many ships. Low sulphur light fuel oil, on the other hand, has clearly different physical and chemical properties, necessitating the purchase of a straightforward fuel switch to adapt associated equipment for long-term use. When a ship owner uses low sulphur oil technology, there could be numerous dangers and complications associated with the expense of adding and transforming low sulphur oil.
Figure 4
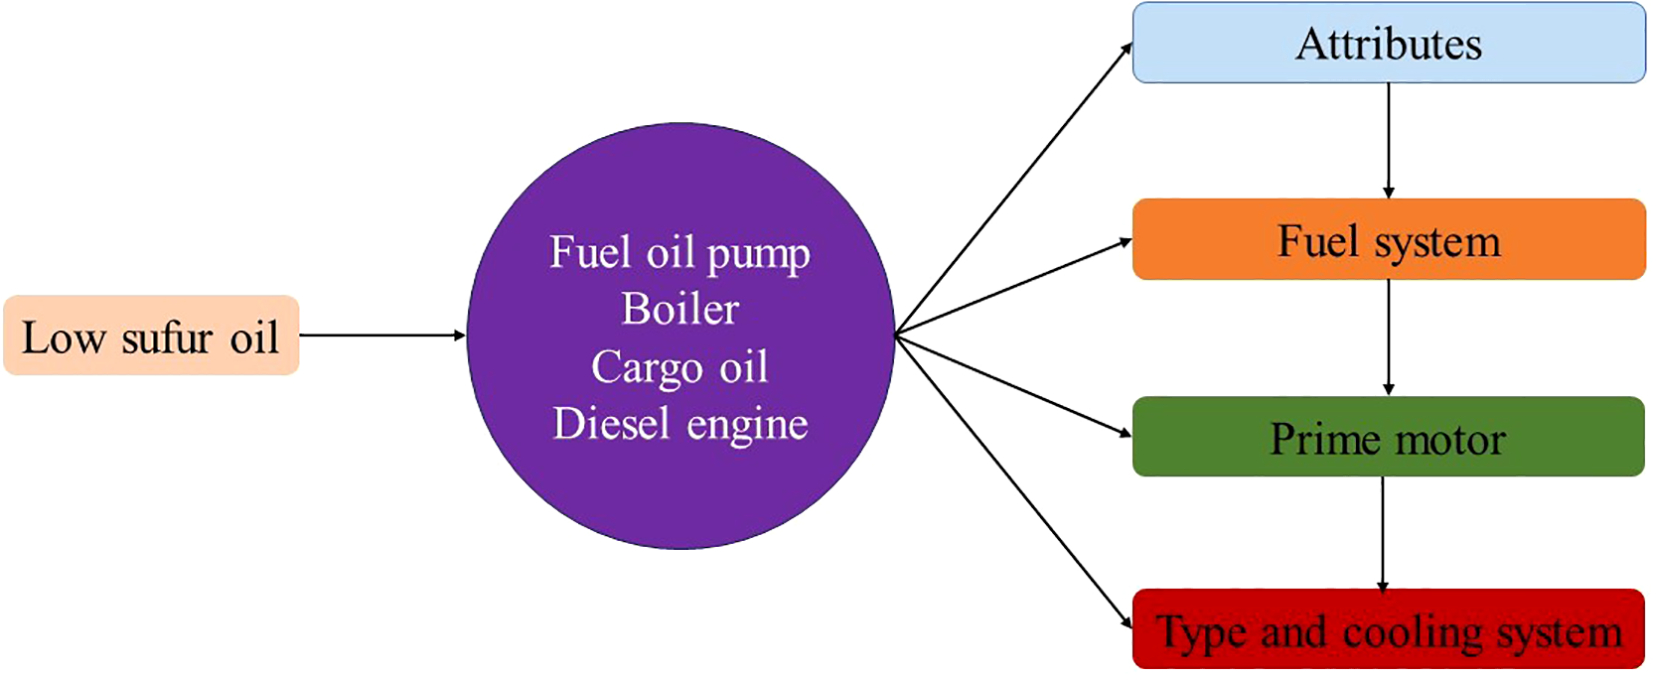
The consequences of low sulphur fuel oil usage in marine equipment.
In addition to low-sulfur fuel adoption, installing exhaust gas cleaning systems has become a widely implemented method for reducing sulfur emissions from ships. Two primary types of scrubber systems dominate maritime applications: dry scrubbers and wet scrubbers. Due to their compatibility with marine operational requirements and space constraints, wet scrubber systems have emerged as the industry standard for ship exhaust treatment, currently representing the overwhelming majority (over 90%) of installed systems worldwide.
According to various detergent cycles, wet desulfurization systems can be divided into open seawater systems, closed freshwater systems, and mixed desulfurization systems. The hybrid desulfurization system comprehensively considers the advantages of open and closed systems, which can reduce secondary environmental pollution and the storage capacity of alkali solution, while meeting the needs of various navigation environments. However, the conversion program is limited to the original ventilation ducts of the vessel, as the structure and operation of such systems are more difficult and require greater initial expenditure.
Currently, alternative fuel technologies are recognized as more cost-effective means. Ships use methanol, liquefied natural gas, biofuels, and other emerging clean energy sources as fuel alternatives to traditional marine fuel combustion technologies. The resources of liquefied natural gas are much more abundant than fuel oil. There is a price difference between fuel oil and liquefied natural gas. When ship owners use liquefied natural gas as their primary fuel, they can save a significant amount of fuel costs. In addition, liquefied natural gas has a relatively high energy content and may generate the same amount of heat while reducing carbon dioxide emissions. Natural gas undergoes pre-treatment before liquefaction. During the purification process, carbon dioxide, hydrogen sulfide, moisture, and other sulfides can be removed from the original natural gas, which means that burning liquefied natural gas produces almost no sulfur oxide emissions. In addition, artificial intelligence and automated port infrastructure have become important pathways for sustainable development and technological innovation in ports (Zou et al., 2025).
The innovation of this study mainly includes three aspects. Firstly, this study uses the DID model to analyze the impact of ECA policies on SO2 emissions from major ports in the United States. The DID model is a popular method for researching the “treatment effect” and can effectively reflect the implementation effectiveness of policies. Secondly, based on actual regression results, this study reveals the impact of ECA policies on SO2 emissions from ports. Thirdly, this study provides targeted recommendations for port managers and shipping companies to reduce SO2 emissions based on the regression results of the model.
6 Conclusions
Sulfur emissions are produced by a number of significant worldwide industries including shipping. This study evaluates the ship pollutants sulfur emissions in the five busiest ports in America. To test if the ECA policy significantly reduces the sulfur emission, this study uses the DID model. The main results of this study include: (1) The regression results of the DID model indicate that ECA policies have no significant positive impact on sulfur emissions from the four busiest ports. (2) The ECA policy has had a significant impact on sulfur emissions at the Port of Los Angeles. (3) The main reasons for this situation are the different regulatory measures of other port policies, the lack of alternative fuels, and the lagging implementation of ECA policies.
Since enforcement has tightened up since 2012, it is to be expected that the ECA sulfur policy will have some lagged impacts. Because a number of measures are put in place prior to the implementation of the ECA sulfur policy in the various ports to lessen the negative effects of ship pollutant emissions, the ECA policy does not contribute to a reduction in the sulfur emissions in the three California ports. Moreover, as of 1st January 2014, more changes were made in addition to the current California fuel standards for ships that travel on the ocean and ships had to comply with both North American ECA standards as well as California standards. Also, changes were made in January, 2014, that the maximum sulfur content of marine gas oil and marine gas oil is 0.1% and this change was also mandatory for ports in North America ECA. This changes and reasons depict why the ECA sulfur policy did not have any positive significant influence in decreasing the SO2 concentration at these ports.
In future research, more experimental components can be added to the DID model for greater flexibility and viability in decision-making if pertinent data on other variables are available. In addition, since NOX can raise the risk of respiratory illness and aid in the creation of fine particles, which are both linked to negative heath impacts, the NOX limit must also be taken into consideration.
Statements
Data availability statement
The original contributions presented in the study are included in the article/supplementary material. Further inquiries can be directed to the corresponding author.
Author contributions
GX: Conceptualization, Funding acquisition, Methodology, Writing – original draft, Writing – review & editing. CA-O: Conceptualization, Methodology, Writing – original draft. TW: Methodology, Writing – review & editing. QL: Supervision, Writing – review & editing. SB: Supervision, Writing – review & editing.
Funding
The author(s) declare that financial support was received for the research and/or publication of this article. This research was funded by the National Natural Science Foundation of China, grant number 52002243.
Conflict of interest
The authors declare that the research was conducted in the absence of any commercial or financial relationships that could be construed as a potential conflict of interest.
Generative AI statement
The author(s) declare that no Generative AI was used in the creation of this manuscript.
Publisher’s note
All claims expressed in this article are solely those of the authors and do not necessarily represent those of their affiliated organizations, or those of the publisher, the editors and the reviewers. Any product that may be evaluated in this article, or claim that may be made by its manufacturer, is not guaranteed or endorsed by the publisher.
References
1
Al-Douri A. Alsuhaibani A. S. Moore M. El-Baz A. El-Halwagi M. (2022). Greenhouse gases emissions in liquified natural gas as a marine fuel: Life cycle analysis and reduction potential. Can. J. Chem. Eng.100, 1178–1186. doi: 10.1002/cjce.24268
2
Anderson M. Salo K. Fridell E. (2015). Particle- and gaseous emissions from an LNG powered ship. Environ. Sci. Technol.49, 12568–12575. doi: 10.1021/acs.est.5b02678
3
Åström S. Yaramenka K. Winnes H. Fridell E. Holland M. (2018). The costs and benefits of a nitrogen emission control area in the Baltic and North Seas. Transportation Res. Part D: Transport Environ.59, 223–236. doi: 10.1016/j.trd.2017.12.014
4
AIS (Automatic Identification System for Ships) data analysis. (2020). [EB/OL] Available online at: https://blog.csdn.net/zrg_hzr_1/article/details/111029286 (Accessed June 20, 2025).
5
Bach H. Mäkitie T. K. Hansen T. Steen M. (2021). Blending new and old in sustainability transitions: Technological alignment between fossil fuels and biofuels in Norwegian coastal shipping. Energy Res. Soc. Sci.74, 101957. doi: 10.1016/j.erss.2021.101957
6
Banawan A. A. El Gohary M. M. Sadek I. S. (2010). Environmental and economical benefits of changing from marine diesel oil to natural-gas fuel for short-voyage high-power passenger ships. Proc. Institution Mechanical Engineers Part M: J. Eng. Maritime Environ.224, 103–113. doi: 10.1243/14750902JEME181
7
Bicer Y. Dincer I. (2018). Clean fuel options with hydrogen for sea transportation: A life cycle approach. Int. J. Hydrogen Energy43, 1179–1193. doi: 10.1016/j.ijhydene.2017.10.157
8
Brännlund R. Ghalwash T. Nordström J. (2007). Increased energy efficiency and the rebound effect: Effects on consumption and emissions. Energy Economics29, 1–17. doi: 10.1016/j.eneco.2005.09.003
9
Bui V. G. Tran V. N. Hoang A. T. Bui T. Vo A . (2020). A simulation study on a port-injection SI engine fueled with hydroxy-enriched biogas. Energy Sources Part A: Recovery Utilization Environ. Effects46 (1), 1–17. doi: 10.1080/15567036.2020.1804487
10
Chang C. C. Jhang C. W. (2016). Reducing speed and fuel transfer of the green flag incentive program in Kaohsiung port Taiwan. Transportation Res. Part D: Transport Environ.46), 1–10. doi: 10.1016/j.trd.2016.03.007
11
Chang Y. Song Y. Roh Y. (2013). Assessing greenhouse gas emissions from port vessel operations at the Port of Incheon. Transportation Res. Part D: Transport Environ.25, 1–4. doi: 10.1016/j.trd.2013.06.008
12
Chen G. Govindan K. Golias M. M. (2013). Reducing truck emissions at container terminals in a low carbon economy: Proposal of a queueing-based bi-objective model for optimizing truck arrival pattern. Transportation Res. Part E: Logistics Transportation Rev.55, 3–22. doi: 10.1016/j.tre.2013.03.008
13
Chen J. Wan Z. Zhang H. Liu X. Zhu Y. Zheng A. (2018). Governance of shipping emission of SOx in China’s coastal waters: The SECA policy, challenges, and directions. Coast. Manage.46, 191. doi: 10.1080/08920753.2018.1451727
14
Davarzani H. Fahimnia B. Bell M. Sarkis J. (2016). Greening ports and maritime logistics: A review. Transportation Res. Part D: Transport Environ.48), 473–487. doi: 10.1016/j.trd.2015.07.007
15
Du Y. Chen Q. Quan X. (2011). Berth allocation considering fuel consumption and vessel emissions. Transportation Res. Part E: Logistics Transportation Rev.47), 1021–1037. doi: 10.1016/j.tre.2011.05.011
16
Elgohary M. M. Seddiek I. S. Salem A. M. (2015). Overview of alternative fuels with emphasis on the potential of liquefied natural gas as future marine fuel. Proc. Institution Mechanical Engineers Part M: J. Eng. Maritime Environ.229, 365–375. doi: 10.1177/14750902145227
17
Environmental Protection Agency Exhaust Gas Scrubber Washwater Effluent t[EB/OL]. Available online at: https://www3.epa.gov/npdes/pubs/vgp_exhaust_gas_scrubber.pdf.
18
Gao J. Wu D. L. Xiao Q. Randhawa A. Liu Q. Zhang T. (2023). Green finance, environmental pollution and high-quality economic development-a study based on China’s provincial panel data. Environ. Sci. pollut. Res.30, 31917–31939. doi: 10.1007/s11356-022-24428-0
19
Gaurav N. Sivasankari S. Kiran G. Ninawe A. Selvin J. (2017). Utilization of bioresources for sustainable biofuels: A Review. Renewable Sustain. Energy Rev.73, 205–214. doi: 10.1016/j.rser.2017.01.070
20
Geerlings H. van Duin R. (2011). A new method for assessing CO2-emissions from container terminals: a promising approach applied in Rotterdam. J. Cleaner Production19, 657–666. doi: 10.1016/j.jclepro.2010.10.012
21
Giddey S. Badwal S. Munnings C. Dolan M. (2017). Ammonia as a renewable energy transportation media. ACS Sustain. Chem. Eng.5, 10231–10239. doi: 10.1021/acssuschemeng.7b02219
22
Gilbert P. Walsh C. Traut M. Kesieme U. Pazouki K. Murphy A. (2018). Assessment of full life-cycle air emissions of alternative shipping fuels. J. Cleaner Production172, 855–866. doi: 10.1016/j.jclepro.2017.10.165
23
Goldsworthy L. Goldsworthy B. (2015). Modelling of ship engine exhaust emissions in ports and extensive coastal waters based on terrestrial AIS data – An Australian case study. Environ. Model. Software: Environ. Data News63, 45–60. doi: 10.1016/j.envsoft.2014.09.009
24
Hanaoka S. Regmi M. B. (2011). Promoting intermodal freight transport through the development of dry ports in Asia: An environmental perspective. IATSS Res.35, 16–23. doi: 10.1016/j.iatssr.2011.06.001
25
Hoang A. Foley A. Nižetić S. Ong H. (2022). Energy-related approach for reduction of CO2 emissions: A critical strategy on the port-to-ship pathway. J. Cleaner Production355, 131772. doi: 10.1016/j.jclepro.2022.131772
26
Hoang A. Nizetic S. Ölçer A. Ong H. (2021). Synthesis pathway and combustion mechanism of a sustainable biofuel 2.5-Dimethylfuran: Progress and prospective. Fuel286, 119337. doi: 10.1016/j.fuel.2020.119337
27
Hwang S. Jeong B. Jung K. Kim M. Zhou P. (2019). Life cycle assessment of LNG fueled vessel in domestic services. J. Mar. Sci. Eng.7, 359. doi: 10.3390/jmse7100359
28
International Maritime Organization . (2020). Sulphur 2020 – cutting sulphur oxide emissions. [EB/OL]. Available online at: https://www.imo.org/en/MediaCentre/HotTopics/Pages/Sulphur-2020.aspx (Accessed June 20, 2025).
29
International Maritime Organization . (2025). Introduction to IMO. [EB/OL]. Available online at: https://www.imo.org/en/About/Pages/Default.aspx (Accessed June 20, 2025).
30
International Maritime Organization . (2019). Conventions international maritime organization 2019. [EB/OL]. Available online at: https://www.imo.org/en/about/conventions/pages/listofconventions.aspx (Accessed June 20, 2025).
31
International Maritime Organization . (2010). Sulphur oxides (SOx) and Particulate Matter (PM) – Regulation 14. [EB/OL]. Available online at: http://www.imo.org/en/OurWork/Environment/PollutionPrevention/AirPollution/Pages/Sulphur-oxides-(SOx)–Regulation-14.aspx (Accessed June 20, 2025).
32
International Maritime Organization . (2023). Greenhouse gas emissions. [EB/OL]. Available online at: https://www.imo.org/en/ourwork/environment/pages/2023-imo-strategy-on-reduction-of-ghg-emissions-from-ships.aspx (Accessed June 20, 2025).
33
International Maritime Organization . (2009). Prevention of air pollution from ships second IMO GHG study 2009. Int. J. Mar. Coast. Law3, 235–245. Available online at: https://www.imo.org/en/ourwork/environment/pages/second-imo-ghg-study-2009.aspx.
34
Johnson H. Styhre L. (2015). Increased energy efficiency in short sea shipping through decreased time in port. Transportation Res. Part A: Policy Pract.71, 167–178. doi: 10.1016/j.tra.2014.11.008
35
Kao S. Chung W. Chen C. (2022). AIS-based scenario simulation for the control and improvement of ship emissions in ports. J. Mar. Sci. Eng.10, 129. doi: 10.3390/jmse10020129
36
Kotchenruther R. A. (2015). The effects of marine vessel fuel sulfur regulations on ambient PM2. 5 along the west coast of the US. Atmos. Atmospheric Environ.103), 121–128. doi: 10.1016/j.atmosenv.2014.12.040
37
Lan R. Irvine J. T. S. Tao S. (2012). Ammonia and related chemicals as potential indirect hydrogen storage materials. Int. J. Hydrogen Energy37, 1482–1494. doi: 10.1016/j.ijhydene.2011.10.004
38
Lättilä L. Henttu V. Hilmola O. (2013). Hinterland operations of sea ports do matter: Dry port usage effects on transportation costs and CO2 emissions. Transportation Res. Part E: Logistics Transportation Rev.55, 23–42. doi: 10.1016/j.tre.2013.03.007
39
Long S. (2011). Empirical analysis on the impact of population, economic output, economic structure and technological progress on China’s SO2 emissions: based on extension of the grossman pollution equation. J. Stat Inf.26, 45–51.
40
Peng Y. Li X. D. Wang W. D. Liu K. Li C. (2018a). A simulation-based research on carbon emission mitigation strategies for green container terminals. Ocean Eng.163, 288–298. doi: 10.1016/j.oceaneng.2018.05.054
41
Peng Y. Wang W. Y. Liu K. Li X. Tian Q. (2018b). The impact of the allocation of facilities on reducing carbon emissions from a green container terminal perspective. Sustainability6, 10061813. doi: 10.3390/su10061813
42
Qiu X. Lam J. S. L. Huang G. Q. (2015). A bilevel storage pricing model for outbound containers in a dry port system. Transportation Res. Part E: Logistics Transportation Rev.73, 65–83. doi: 10.1016/j.tre.2014.10.009
43
Rompoti S. (2025). The largest and busiest ports in the U.S. [EB/OL]. Available online at: https://www.thomasnet.com/insights/top-usa-ports/ (Accessed June 20, 2025).
44
Roso V. (2007). Evaluation of the dry port concept from an environmental perspective: A note. Transportation Res. Part D: Transport Environ.12, 523–527. doi: 10.1016/j.trd.2007.07.001
45
Seddiek I. S. Elgohary M. M. (2014). Eco-friendly selection of ship emissions reduction strategies with emphasis on SOx and NOx emissions. Int. J. Naval Architecture Ocean Eng.3, 737–748. doi: 10.2478/IJNAOE-2013-0209
46
Shahraki N. Turkay M. (2014). Analysis of interaction among land use, transportation network and air pollution using stochastic nonlinear programming. Int. J. Environ. Sci. Technol.11, 2201–2216. doi: 10.1007/s13762-014-0566-3
47
Styhre L. Winnes H. Black J. Lee J. Griffin H. (2017b). Greenhouse gas emissions from ships in ports- Case studies in four continents. Transportation Res. Part D: Transport Environ.54), 212–224. doi: 10.1016/j.trd.2017.04.033
48
Styhre L. Winnes H. Black J. Lee J. Griffin H. (2017a). Greenhouse gas emissions from ships in ports – Case studies in four continents. Transportation Res. Part D: Transport Environ.54, 212–224. doi: 10.1016/j.trd.2017.04.033
49
Sui C. de Vos P. Stapersma D. Visser K. Ding Y. (2020). Fuel consumption and emissions of ocean-going cargo ship with hybrid propulsion and different fuels over voyage. J. Mar. Sci. Eng.8, 588. doi: 10.3390/jmse8080588
50
Tsai Y. Liang C. Huang K. Hung K. Jheng C. Liang J. (2018). Self-management of greenhouse gas and air pollutant emissions in Taichung Port, Taiwan. Transportation Res. Part D: Transport Environ.63), 576–587. doi: 10.1016/j.trd.2018.07.001
51
Ushakov S. Stenersen D. Einang P. M. (2019). Methane slip from gas fuelled ships: a comprehensive summary based on measurement data. J. Mar. Sci. Technol.24, 1308–1325. doi: 10.1007/s00773-018-00622-z
52
Vehicle Emission Control Center Ministry of Environmental Protection . (2016). Air pollutant emission inventory of marine in China. [EB/OL]. Available online at: https://www.efChina.org/Attachments/Report/report-20170918-3-zh/report-20170918-3-zh (Accessed June 20, 2025).
53
Veritas D. N. (2020). Comparison of alternative marine fuels. [EB/OL]. Available online at: https://sea-lng.org/wp-content/uploads/2020/04/Alternative-Marine-Fuels-Study_final_report_25.09.19.pdf (Accessed June 20, 2025).
54
Walker T. R. (2016). Green Marine: An environmental program to establish sustainability in marine transportation. Mar. pollut. Bull.105, 199–207. doi: 10.1016/j.marpolbul.2016.02.029
55
Wan Z. Zhou X. Zhang Q. Chen J. (2019). Do ship emission control areas in China reduce sulfur dioxide concentrations in local air? A study on causal effect using the difference-in-difference model. Mar. pollut. Bull.2019, 110506. doi: 10.1016/j.marpolbul.2019.110506
56
Wan Z. Zhou X. Zhang Q. Chen J. (2021). Influence of sulfur emission control areas on particulate matter emission: A difference-in-differences analysis. Mar. Policy130, 104584. doi: 10.1016/j.marpol.2021.104584
57
Wang C. Corbett J. J. (2007). The costs and benefits of reducing CO2 emissions from ships in the US West Coastal waters. Transportation Res. Part D: Transport Environ.12, 577–588. doi: 10.1016/j.trd.2007.08.003
58
Wang S. Meng Q. Liu Z. (2013). A note on “Berth allocation considering fuel consumption and vessel emissions. Transportation Res. Part E: Logistics Transportation Rev.49), 48–54. doi: 10.1016/j.tre.2012.07.002
59
Wang B. Sun Y. Wang Z. (2018). Agglomeration effect of CO2 emissions and emissions reduction effect of technology: A spatial econometric perspective based on China’s province-level data. J. Cleaner Production204, 96–106. doi: 10.1016/j.jclepro.2018.08.243
60
Winnes H. Fridell E. (2009). Particle emissions from ships: Dependence on fuel type. J. Air Waste Manage. Assoc.59, 1391–1398. doi: 10.3155/1047-3289.59.12.1391
61
Winnes H. Styhre L. Fridell E. (2016). Reducing GHG emissions from ships in port areas. Res. Transportation Business Manage.17), 73–82. doi: 10.1016/j.rtbm.2015.10.008
62
Xiao G. Wang T. Chen X. Zhou L. (2022). Evaluation of ship pollutant emissions in the ports of Los Angeles and Long Beach. J. Mar. Sci. Eng.10, 1206. doi: 10.3390/jmse10091206
63
Xu B. Lin B. (2016). Regional differences of pollution emissions in China: contributing factors and mitigation strategies. J. Cleaner Production112, 1454–1463. doi: 10.1016/j.jclepro.2015.03.067
64
Zhou F. Fan Y. (2021). Determination of the influence of fuel switching regulation on the sulfur dioxide content of air in a port area using DID model. Adv. Meteorol.2021, 1–10. doi: 10.1155/2021/6679682
65
Zou Y. Xiao G. Li Q. Biancardo S. (2025). Intelligent maritime shipping: A bibliometric analysis of Internet technologies and automated port infrastructure applications. J. Mar. Sci. Eng.13, 979. doi: 10.3390/jmse13050979
Summary
Keywords
ship emissions, sulfur emissions, emission control area, difference in difference model, port
Citation
Xiao G, Amamoo-Otoo C, Wang T, Li Q and Biancardo SA (2025) Evaluating the impact of ECA policy on sulfur emissions from the five busiest ports in America based on difference in difference model. Front. Mar. Sci. 12:1609261. doi: 10.3389/fmars.2025.1609261
Received
10 April 2025
Accepted
30 June 2025
Published
06 August 2025
Volume
12 - 2025
Edited by
Juan Moreno-Gutiérrez, University of Cádiz, Spain
Reviewed by
Ran Yan, Nanyang Technological University, Singapore
Octavian Postolache, O. Postolache, University Institute of Lisbon (ISCTE), Portugal
Updates
Copyright
© 2025 Xiao, Amamoo-Otoo, Wang, Li and Biancardo.
This is an open-access article distributed under the terms of the Creative Commons Attribution License (CC BY). The use, distribution or reproduction in other forums is permitted, provided the original author(s) and the copyright owner(s) are credited and that the original publication in this journal is cited, in accordance with accepted academic practice. No use, distribution or reproduction is permitted which does not comply with these terms.
*Correspondence: Qingjun Li, liqj@wfu.edu.cn
Disclaimer
All claims expressed in this article are solely those of the authors and do not necessarily represent those of their affiliated organizations, or those of the publisher, the editors and the reviewers. Any product that may be evaluated in this article or claim that may be made by its manufacturer is not guaranteed or endorsed by the publisher.