Abstract
The squat lobster or munida (Pleuroncodes monodon) is one of the most abundant species in the coastal zone of the Peruvian Current. Due to its high incidence of occurrence and biomass, it has been monitored since 1998 by the Instituto del Mar del Perú (IMARPE) through the Hydroacoustic Assessment Surveys for Anchoveta and Other Pelagic Resources. In this study, 59 surveys conducted between 1998 and 2024 were analyzed to study the spatial distribution, abundance, and ecological relationship of munida with anchoveta (Engraulis ringens). The results showed that between 1998 and 2000, munida expanded its distribution northward along the Peruvian coast, while from 2001 onward its range remained relatively stable. A clear seasonal pattern was identified: during winter and spring, both the distribution area and inertia increased, and the species tended to occur farther from the coast, whereas in summer and autumn the distribution contracted, except during anomalous oceanographic events (e.g., warm or cold conditions). Vertically, munida generally inhabited the surface layer down to approximately 168 m, although during the 2015 -2016 El Niño event it was recorded as deep as 203 m. The average biomass throughout the study period was close to 2.04 million tons, with a maximum of 5.38 million tons recorded during survey 1703-04. Munida was also the species most closely associated with anchoveta, and when both occurred together, their interaction varied depending on the time of day, probably reflecting diel vertical migration and differential aggregation behaviors. These findings suggest that munida is a key component of the Peruvian Current ecosystem, whose variability is influenced both by seasonal cycles and by anomalous oceanographic conditions, and that its association with anchoveta may have implications for ecosystem functioning and fisheries management in the region.
1 Introduction
The squat lobster Pleuroncodes monodon, commonly known as munida or red shrimp, is an ecologically significant species in the Peruvian marine ecosystem. It typically inhabits cold coastal waters (CCWs), with a geographic distribution extending from Lobos de Afuera Island (06°S) in Peru to Bahía Ancud (42°S) in Chile (Franco-Meléndez, 2012; Yapur-Pancorvo et al., 2023). However, some authors have suggested a broader range from 15°N (Mexico) to 41°S (Chile) (Hendrickx and Harvey, 1999). Due to its high abundance, P. monodon has emerged as an important fishery resource and plays a key role in maintaining ecosystem stability through its position in the marine food web (Escobedo, 2018; Quispe-Machaca et al., 2024).
The presence of P. monodon in the Peruvian marine ecosystem has been noted since the mid-1990s, coinciding with its increasing occurrence in fisheries (Paredes and Elliot, 1997). In 1996, hydroacoustic studies were initiated to estimate biomass and spatial distribution (Segura and Castillo, 1996). Since 1998, following the 1997–1998 El Niño event and a notable increase in its abundance, the species has been included as a secondary target in hydroacoustic surveys of pelagic resources conducted by the Instituto del Mar del Perú (IMARPE).
The 1997–1998 El Niño event led to a significant rise in sea surface temperature, beginning in March 1997, due to the incursion of subtropical and equatorial waters (Ñiquen and Bouchón, 2004). This oceanographic anomaly caused a decline in the abundance of sardine, jack mackerel, and mackerel by reducing their optimal habitat, mainly due to a shallower upper boundary of the Oxygen Minimum Zone (OMZ). In contrast, anchoveta (Engraulis ringens) showed only a temporary decline, followed by gradual recovery (Ñiquen et al., 1998; Gutiérrez et al., 2012). The ecological space left vacant by these species was likely occupied by munida, whose abundance has remained elevated in subsequent years.
In Chile, P. monodon is considered a benthodemersal species found at depths up to 350 m. It serves as a crucial prey item for several commercially valuable benthodemersal fish species (Palma and Arana, 1990) and is subject to regulated commercial exploitation under a full exploitation status (Palma, 1994; Gallardo et al., 2017; Guzmán et al., 2016; Subpesca, 2025). In Peru, by contrast, the species is found in shallower waters and is mainly caught incidentally during industrial anchoveta fishing, reflecting a high degree of spatial overlap between both species (Segura and Castillo, 1996; Escobedo, 2018). This overlap is particularly pronounced at night when both species occupy the same pelagic habitat. Additionally, munida is targeted by artisanal fishers in southern Peru for use as bait, and there has been interest in extracting astaxanthin—a carotenoid used as a pigment additive in salmonid aquaculture—from this species (Morante, 2021).
Munida and anchoveta share similar ecological niches. However, munida is generally confined to the coldest portion of the productive CCW, closely associated with upwelling processes, and may influence the spatial distribution of anchoveta (Gutiérrez et al., 2008). The interaction between these species is marked by high biomasses and reflects key trophic and oceanographic processes, including diel vertical migrations and aggregation behavior. For instance, the formation of anchoveta schools at dawn occurs more rapidly in areas where munida is absent or scarce (Gutiérrez and Gerlotto, 2016).
The distribution of P. monodon along the Peruvian coast is shaped by upwelling intensity, dissolved oxygen availability, and trophic interactions. Its tolerance to hypoxic conditions enables it to inhabit the OMZ, with greater abundance observed during strong upwelling events and vertical habitat compression (Gutiérrez et al., 2011; Bertrand et al., 2010). This increases the likelihood of spatial overlap with anchoveta, particularly during nighttime vertical migrations (Santivañez, 2017). Both species share habitat and food sources, and their coexistence may intensify during oceanographic events such as El Niño or La Niña, suggesting that their relationship is driven by both environmental conditions and adaptive, trophic responses to variability (Bertrand et al., 2004; Santivañez, 2017).
We hypothesize that the spatial distribution and temporal distribution of P. monodon along the Peruvian coast follow seasonal patterns and are significantly influenced by oceanographic anomalies and their ecological association with anchoveta.
The objective of this study was to analyze acoustic data from the “Hydroacoustic Assesment Surveys for Anchoveta and Others Pelagic Resourses” conducted by the IMARPE between 1998 and 2024. The goal is to better understand the abundance and ecological stability of munida, and its association with anchoveta, and to provide scientific support for the potential implementation of management measures aimed at limiting its extraction in areas of high species overlap—thereby promoting sustainability and maintaining ecological balance in this region of the Pacific Ocean.
2 Materials and methods
2.1 Period of analysis
The present study considered the data from the “Hydroacoustic Assesment Surveys for Anchoveta and Others Pelagic Resourses” conducted between latitudes 03°23′–18°21′S (Tumbes–Tacna) on board research vessels of the IMARPE and vessels of the fishing industry between 1998 and 2024.
A total of 59 surveys were analyzed and are described in Table 1. Each survey has a code; for example, in the case of code 9808-09, the first two numbers (98) correspond to the last two digits of the year in which the survey took place (1998), and 08–09 indicates the months of August–September in which the survey took place.
Table 1
| No. | Year | Surveys | Survey date | Transects | Length (nm) | ESDU (nm) | CV (%) | No. | Year | Surveys | Survey date | Transects | Length (nm) | ESDU (nm) | CV (%) |
|---|---|---|---|---|---|---|---|---|---|---|---|---|---|---|---|
| 1 | 1998 | 9808-09 | 20/08/1998–18/09/1998 | 76 | 80–150 | 7,499 | 773.64 | 32 | 2011 | 1102-04 | 23/02/2011–18/04/2011 | 80 | 20–80 | 6,339 | 350.13 |
| 2 | 9811-12 | 30/11/1998–21/12/1998 | 68 | 50–77 | 3,235 | 921.49 | 33 | 1110-12 | 29/10/2011–17/12/2011 | 58 | 40–150 | 6,503 | 534.23 | ||
| 3 | 1999 | 9902-03 | 10/02/1999–01/04/1999 | 75 | 30–119 | 6,696 | 407.27 | 34 | 2012 | 1202-04 | 17/02/2012–13/04/2012 | 79 | 20–80 | 6,944 | 470.78 |
| 4 | 9911-12 | 23/11/1999–15/12/1999 | 43 | 100–120 | 5,202 | 526.41 | 35 | 1209-11 | 18/09/2012–05/11/2012 | 76 | 20–130 | 6,021 | 791.10 | ||
| 5 | 2000 | 0001-02 | 17/01/2000–29/02/2000 | 77 | 100–120 | 8,801 | 661.99 | 36 | 2013 | 1302-04 | 23/02/2013–17/04/2013 | 79 | 20–110 | 6,669 | 478.12 |
| 6 | 0006-07 | 07/06/2000–07/07/2000 | 50 | 100–120 | 6,671 | 1,607.06 | 37 | 1308-09 | 16/08/2013–19/09/2013 | 79 | 26–146 | 7,915 | 572.94 | ||
| 7 | 0010-11 | 09/10/2000–17/11/2000 | 68 | 100–120 | 8,032 | 672.29 | 38 | 2014 | 1402-04 | 24/02/2014–11/04/2014 | 79 | 20–100 | 6,434 | 352.23 | |
| 8 | 2001 | 0103-04 | 28/02/2001–13/04/2001 | 74 | 90–120 | 9,357 | 598.14 | 39 | 1411-12 | 05/11/2014–13/12/2014 | 57 | 60–100 | 4,278 | 323.51 | |
| 9 | 0107-08 | 02/07/2001–08/08/2001 | 71 | 100–120 | 9,223 | 1,041.33 | 40 | 2015 | 1502-04 | 17/02/2015–09/04/2015 | 60 | 20–100 | 5,352 | 562.56 | |
| 10 | 0110-11 | 03/10/2001–13/11/2001 | 147 | 200 | 19,608 | 567.81 | 41 | 1508-10 | 20/08/2015–08/10/2015 | 100 | 50–100 | 6,346 | 1,334.25 | ||
| 11 | 2002 | 0202-03 | 17/02/2002–13/03/2002 | 74 | 120 | 6,081 | 482.46 | 42 | 2016 | 1603-04 | 29/03/2016–30/04/2016 | 86 | 50–80 | 5,956 | 407.79 |
| 12 | 0208-09 | 07/08/2002–01/09/2002 | 65 | 45–148 | 4,836 | 444.32 | 43 | 1609-11 | 17/09/2016–03/11/2016 | 115 | 60–120 | 10,363 | 611.30 | ||
| 13 | 0209-11 | 30/09/2002–16/11/2002 | 66 | 200 | 10,580 | 330.39 | 44 | 2017 | 1703-04 | 03/03/2017–13/04/2017 | 112 | 60–80 | 8,612 | 334.43 | |
| 14 | 2003 | 0302-04 | 26/02/2003–01/04/2003 | 76 | 110 | 7,086 | 307.53 | 45 | 1709-11 | 22/09/2017–09/11/2017 | 108 | 50–120 | 10,630 | 1,668.53 | |
| 15 | 0310-12 | 25/10/2003–12/12/2003 | 70 | 180–200 | 11,113 | 338.77 | 46 | 2018 | 1802-04 | 22/02/2018–06/04/2018 | 114 | 50–92 | 10,219 | 443.16 | |
| 16 | 2004 | 0402-03 | 15/02/2004–26/03/2004 | 82 | 100 | 5,898 | 533.06 | 47 | 1809-11 | 27/09/2018–18/11/2018 | 116 | 142 | 11,484 | 362.95 | |
| 17 | 0408-09 | 08/08/2004–15/09/2004 | 47 | 100 | 5,537 | 443.30 | 48 | 2019 | 1902-03 | 12/02/2019–27/03/2019 | 118 | 100 | 10,290 | 409.09 | |
| 18 | 0411-12 | 26/11/2004–21/12/2004 | 41 | 60 | 2,759 | 302.94 | 49 | 1909-11 | 29/09/2019–15/11/2019 | 113 | 116 | 11,446 | 380.38 | ||
| 19 | 2005 | 0502-04 | 20/02/2005–05/04/2005 | 82 | 100 | 4,916 | 491.06 | 50 | 2020 | 2002-03 | 15/02/2020–29/03/2020 | 112 | 90 | 11,248 | 369.89 |
| 20 | 0508-09 | 15/08/2005–22/09/2005 | 54 | 100 | 5,582 | 504.37 | 51 | 2009-11 | 22/09/2020–13/11/2020 | 78 | 90–120 | 7,865 | 423.81 | ||
| 21 | 0511-12 | 23/11/2005–23/12/2005 | 41 | 100–120 | 4,006 | 466.30 | 52 | 2021 | 2102-07 | 17/02/2021–13/07/2021 | 110 | 80 | 9,956 | 499.17 | |
| 22 | 2006 | 0602-04 | 20/02/2006–14/04/2006 | 99 | 100 | 8,052 | 455.33 | 53 | 2109-11 | 22/09/2021–03/11/2021 | 77 | 120 | 10,867 | 1,202.32 | |
| 23 | 0611-12 | 05/11/2006–23/12/2006 | 95 | 20–200 | 8,387 | 432.14 | 54 | 2022 | 2202-04 | 15/02/2022–09/04/2022 | 104 | 80 | 9,841 | 400.68 | |
| 24 | 2007 | 0702-04 | 22/02/2007–08/04/2007 | 95 | 20–150 | 9,925 | 1,422.14 | 55 | 2209-11 | 15/09/2022–14/11/2022 | 77 | 150 | 11,078 | 707.74 | |
| 25 | 0708-09 | 10/08/2007–21/09/2007 | 78 | 22–155 | 9,398 | 567.32 | 56 | 2023 | 2302-03 | 22/02/2023–24/03/2023 | 95 | 100 | 9,180 | 601.55 | |
| 26 | 2008 | 0802-04 | 26/02/2008–12/04/2008 | 96 | 18–142 | 9,945 | 643.35 | 57 | 2309-11 | 20/09/2023–04/11/2023 | 78 | 100 | 6,887 | 1,109.86 | |
| 27 | 0811-12 | 05/11/2008–24/12/2008 | 75 | 40–300 | 9,834 | 664.82 | 58 | 2024 | 2402-04 | 16/02/2024–06/04/2024 | 113 | 100 | 9,612 | 426.14 | |
| 28 | 2009 | 0902-04 | 24/02/2009–16/04/2009 | 79 | 40–90 | 6,661 | 416.66 | 59 | 2409-10 | 03/09/2024–31/10/2024 | 81 | 80–140 | 11,247 | 597.40 | |
| 29 | 0912-12 | 04/12/2009–30/12/2009 | 40 | 10–100 | 2,537 | 707.28 | |||||||||
| 30 | 2010 | 1002-04 | 23/02/2010–11/04/2010 | 74 | 20–82 | 5,527 | 518.84 | ||||||||
| 31 | 1011-12 | 10/11/2010–22/12/2010 | 56 | 40–96 | 5,241 | 625.08 |
Research surveys analyzed between 1998 and 2024.
ESDU, elemental sampling distance unit (number of nautical miles); CV, coefficient of variation.
2.2 Acoustic data
The acoustic data were obtained from the digital formats corresponding to the research surveys (acoustic logs at the frequency of 120 kHz), which were accumulated to have a total acoustic matrix. The procedure for the generation of these logs is described in Castillo et al. (2009). This information comes from scientific echo sounders EK500, EK60, and/or EK80 SIMRAD with five sound emission frequencies (18, 38, 70, 120, and 200 kHz) on each vessel; the processing of these data allowed the acquisition of the Nautical Acoustic Scattering Coefficient (NASC; expressed in m2·nm−2) of the echotraces of munida and other species, as described in MacLennan et al. (2002). The identification of munida echotraces, along with those of other pelagic and mesopelagic species, was based on the species-specific acoustic characteristics of each echotrace, fishing haul results, oceanographic habitat location relative to the coast, and multifrequency analysis (Castillo et al., 2009). Munida echotraces generally appear as continuous aggregations with a vertically oscillating pattern, characterized by upward and downward movements in the water column.
On some occasions, due to the unavailability of IMARPE vessels, fishing industry boats were used, which were installed with a portable scientific echo sounder EK80 SIMRAD with a tube with a support for 38- and 120-kHz frequency transducers on the port side. The acoustic sample or elemental sampling distance unit (ESDU) was 1 nm (Simmonds and MacLennan, 2005).
2.3 Spatial distribution and biomass
The center of gravity (CG) and inertia (I) (Bez and Rivoirard, 2001; Woillez et al., 2007) were computed from the spatial distribution of the munida data. The formulation is as follows:
where is the NASC value of the munida, is the point in space (latitude and longitude) of the sample, and CG is the center of gravity. Inertia measures the spatial dispersion of NASC values with respect to the CG. That is, if the inertia is low, the munida is more concentrated near the CG.
If the inertia is high, the munida is more spatially dispersed.
The area of the spatial distribution of the munida was determined through the GRD files of the kriging data interpolation in the Surfer program.
For the determination of the mean values of the vertical distribution of the munida, the data matrix of the accumulation of the “logs by regions” obtained in each survey with the Echoview software (https://echoview.com/), visualized in a box plot, was used. However, due to the methodology used, it was only considered from 2005 onward.
The mean depth of munida was graphically represented through boxplots. El Niño Coastal Index (ICEN) values were obtained from the monthly average of the period of execution of each survey, obtained from the ICEN web page with data from ERSSTv5.
The abundance of the munida by degree of latitude was obtained from the archives of each survey, and the biomass estimation process used the stratification method (Simmonds and MacLennan, 2005), with each stratum defined within an isoparalitoral area of 10 by 30 nautical miles. The total biomass is the sum of all strata where munida is present. The method is described in Castillo et al. (2009) and is based on the following formula:
where is the target strength (in decibels), is the length of the munida (in centimeters), and is a coefficient that depends on the reflective properties of the munida.
The density or number of individuals () was calculated using the following formulas:
The biomass () within each isoparalitoral stratum was calculated using the average weight () of each munida, estimated using the following formula:
where and are constants. Knowing the area () of each stratum, biomass was determined using the formula:
2.4 Association of the munida with other species
An exploratory analysis was conducted on the acoustic data matrix recorded in 1-nm intervals, excluding samples in which the target species was completely absent. To eliminate possible outliers, the Z-score of each species was calculated, and those observations whose Z-score exceeded the threshold of 3 or −3 were identified. The species analyzed were as follows: munida (P. monodon), anchoveta (E. ringens), jack mackerel (Trachurus murphyi), chub mackerel (Scomber japonicus), samasa or samasa anchovy (Anchoa nasus), catfish (Galeichthys peruvianus), lightfish (Vinciguerria lucetia), and giant squid (Dosidicus gigas). The total number of data points was 210,610 with the presence of these species.
The association analysis of munida with other species was performed by hierarchical clustering (Sieger et al., 2017). The dendrograms obtained are the graphical representation of this process, where each node of the tree corresponds to a group of data points. The height at which two groups meet in the dendrogram reflects the distance or dissimilarity between them (Bisson and Blanch, 2012; Zuur, 2012; Vahidipour et al., 2014; Kassambara, 2017).
2.5 Data analysis
For the analysis of the hydroacoustic data, the Echoview software was used. It is a versatile tool with various applications, ranging from biomass estimate assessments (Higginbottom et al., 2008; Harrison et al., 2015) to behavior (Jarvis and Scoulding, 2016) and marine organism habitat studies (Lowe et al., 2022). It was used to identify and label different species by region using echotraces, and it exports three types of outputs: regions, regions by cells, and cells. Another tool employed was Surfer, a widely used software in the spatial analysis of aquatic resources, known for its ability to produce accurate maps and three-dimensional visualizations of spatial data (Zhu et al., 2010; Chiappa-Carrara et al., 2003). Finally, the R programming language was employed for statistical analysis and data visualization. Several libraries were used depending on the type of graph, including readxl, ggplot2, egg, plotly, dplyr, tidyr, factoextra, ggstream, tidyverse, ggalt, flextable, and officer (R Core Team, 2023; Murrell, 2019).
3 Results
3.1 Center of gravity and inertia of the spatial distribution of the munida
The distribution of munida was coastal and varied among the different surveys. The coefficient of variation (CV%) of NASC values for munida showed high variability between surveys, reflecting differences in aggregation levels. The lowest CV values, indicating greater homogeneity in measurements, were recorded during cruises 0411-12 (302.94%) and 0302-04 (307.53%). In contrast, the highest values, suggesting greater heterogeneity in munida aggregations, were observed in surveys 1709-11 (1,668.53%) and 0006-07 (1,607.06%). A tendency toward higher CVs was evident following anomalous warm events.
Munida is a crustacean that forms aggregations with a generally continuous distribution longitudinally and latitudinally, whose northern latitudinal distribution limit has shown variability due to the surface oceanographic conditions of the CCW mass. In the presence of warm waters (Tropical Surface Waters, Equatorial Surface Waters, or El Niño events) that flow from the Equator from north to south, munida tends to migrate southward, such as those recorded in surveys 9808-09, 0702-04, 1002-04, 1603-04, and 1703-04. Significant ICEN values (≥ ± 2.0), in this case significant warm conditions, were recorded at the end of 2015 and in 2023, without significant impacts on their distribution and abundance. The center of gravity of the latitudinal distribution showed an increasing trend in the first years (1998–2000) from south to north and then maintained a certain stability in 11–12°S of the Peruvian coast (Figure 1). In this figure, the lower limit of the latitudinal distribution of the munida in some years did not go to the extreme south due to the coverage of the research area of the survey carried out (which ended or began at 14°S), such as those carried out in 0208-09, 0408-09, 0411-12, 0508-09, and 0511-12.
Figure 1
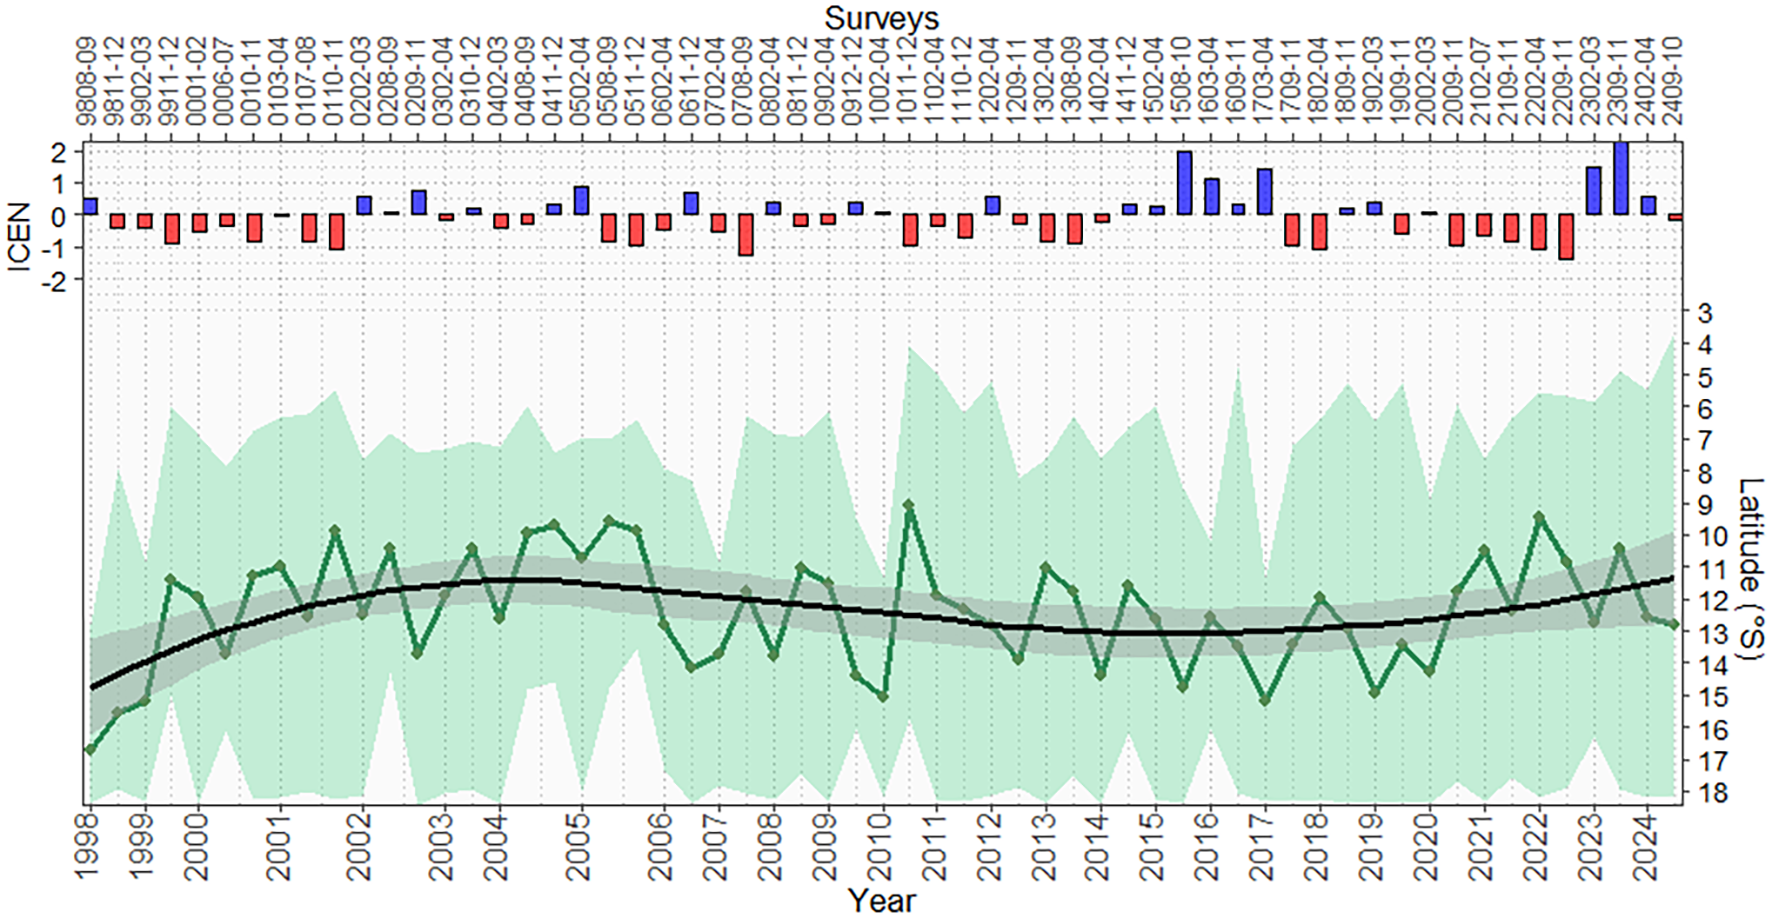
Trend of the centers of gravity of the spatial distribution of the munida by year and survey; the green shaded area corresponds to the distributional limits of latitude (upper and lower) found in each research survey between 1998 and 2024. At the top are monthly ICEN data for each survey according to Multisectoral Commission for the National Study of the El Niño Phenomenon (ENFEN), using ICEN with ERSSTv5 data. The figure shows a clear increasing and decreasing trend in the latitudinal position of munida over time, associated with variability in oceanographic conditions. In surveys 9911-12, 0208-09, 0408-09, 0411-12, 0508-09, and 0511-12, the research coverage area did not reach the southern boundary, as it was limited in its extent. ICEN, El Niño Coastal Index.
The variability of the munida distribution was also at the longitudinal level, that is, its presence with respect to distance from the coast. The Gravity Center (GC) analysis of the distribution by distance from the coast showed that the munida was further from the coast, mainly in the winter and spring seasons, with the exception of the summer surveys—1402-04, 1902-03, and 2202-04—due to the cold conditions recorded in these years, obtaining larger areas of its distribution and with higher values of its inertia. In the summer, under normal conditions, generally, the munida tends to approach the coast due to the retreat toward the coast of the CCW and/or approach the coast of the oceanic waters or superficial subtropical waters (warm), presenting smaller areas of distribution and inertia, except for the years 2000, 2014, and 2017 (Figure 2).
Figure 2
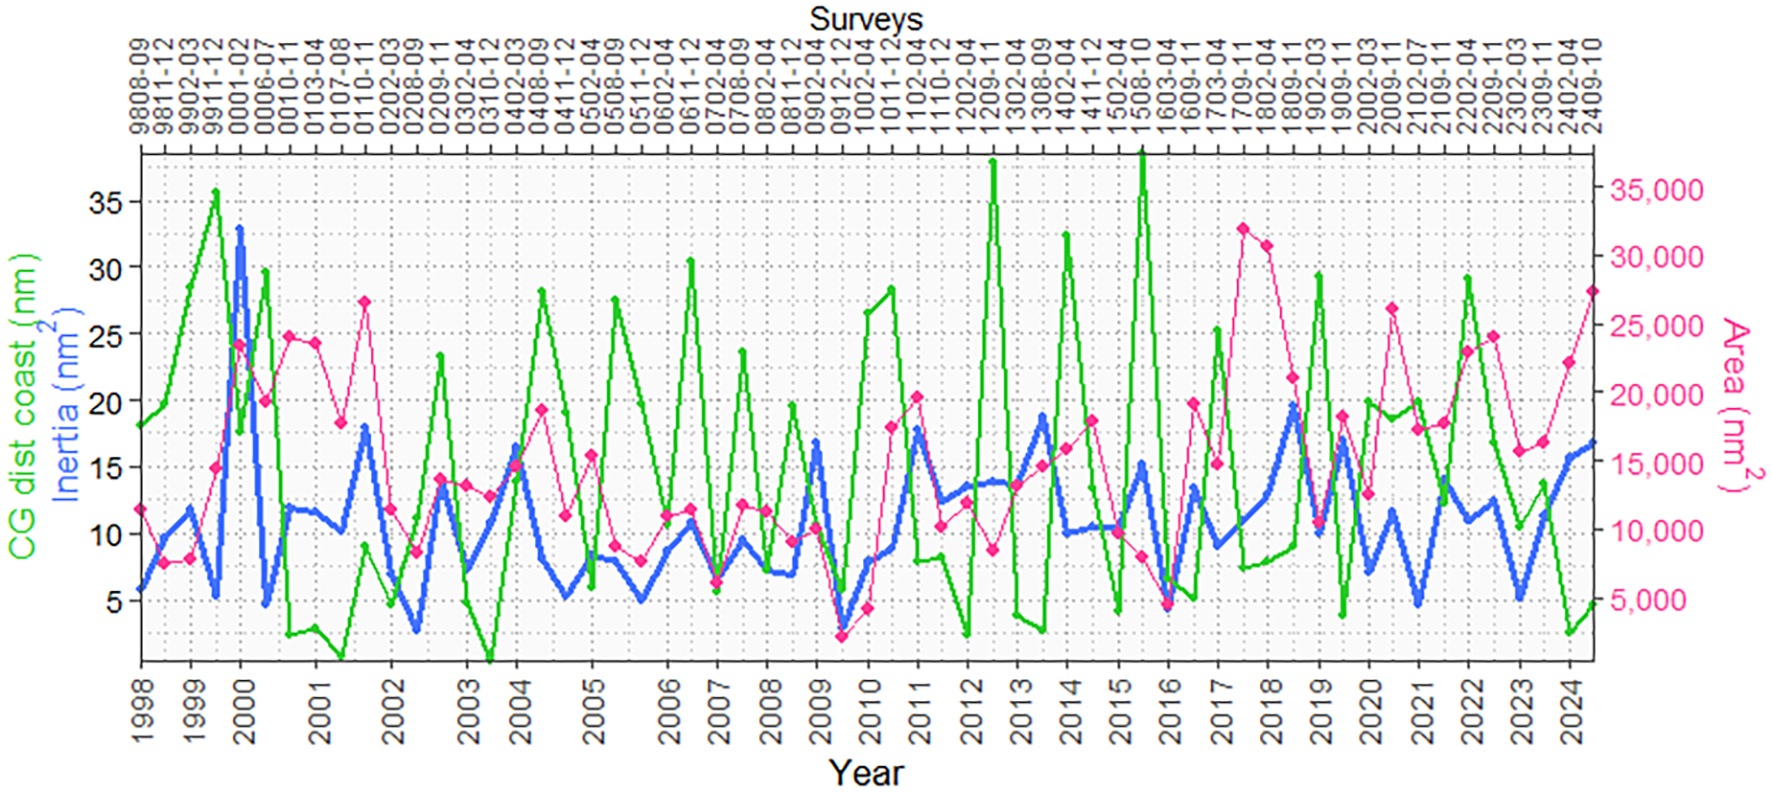
Center of gravity of the distribution by distance from the coast, inertia, and distribution area of the surveys carried out between 1998 and 2024. The figure shows a clear correspondence between different indices.
3.2 Vertical distribution of munida aggregations
Munida aggregations fluctuated in the surface layer of the 168.03-m depth, with the highest abundances in the 50-m depth, with the exception of survey 1508-10, which were recorded deeper due to the presence of warm waters at the sea surface by the El Niño 2015–2016 event of strong intensity, which reached up to 200-m depth with an average at 49.89 m. Another survey that had a slight deepening of the highest abundances was survey 0708-09, which was recorded at an average of 32.51 m; however, its vertical distribution limit was up to 96.03 m (Figure 3).
Figure 3
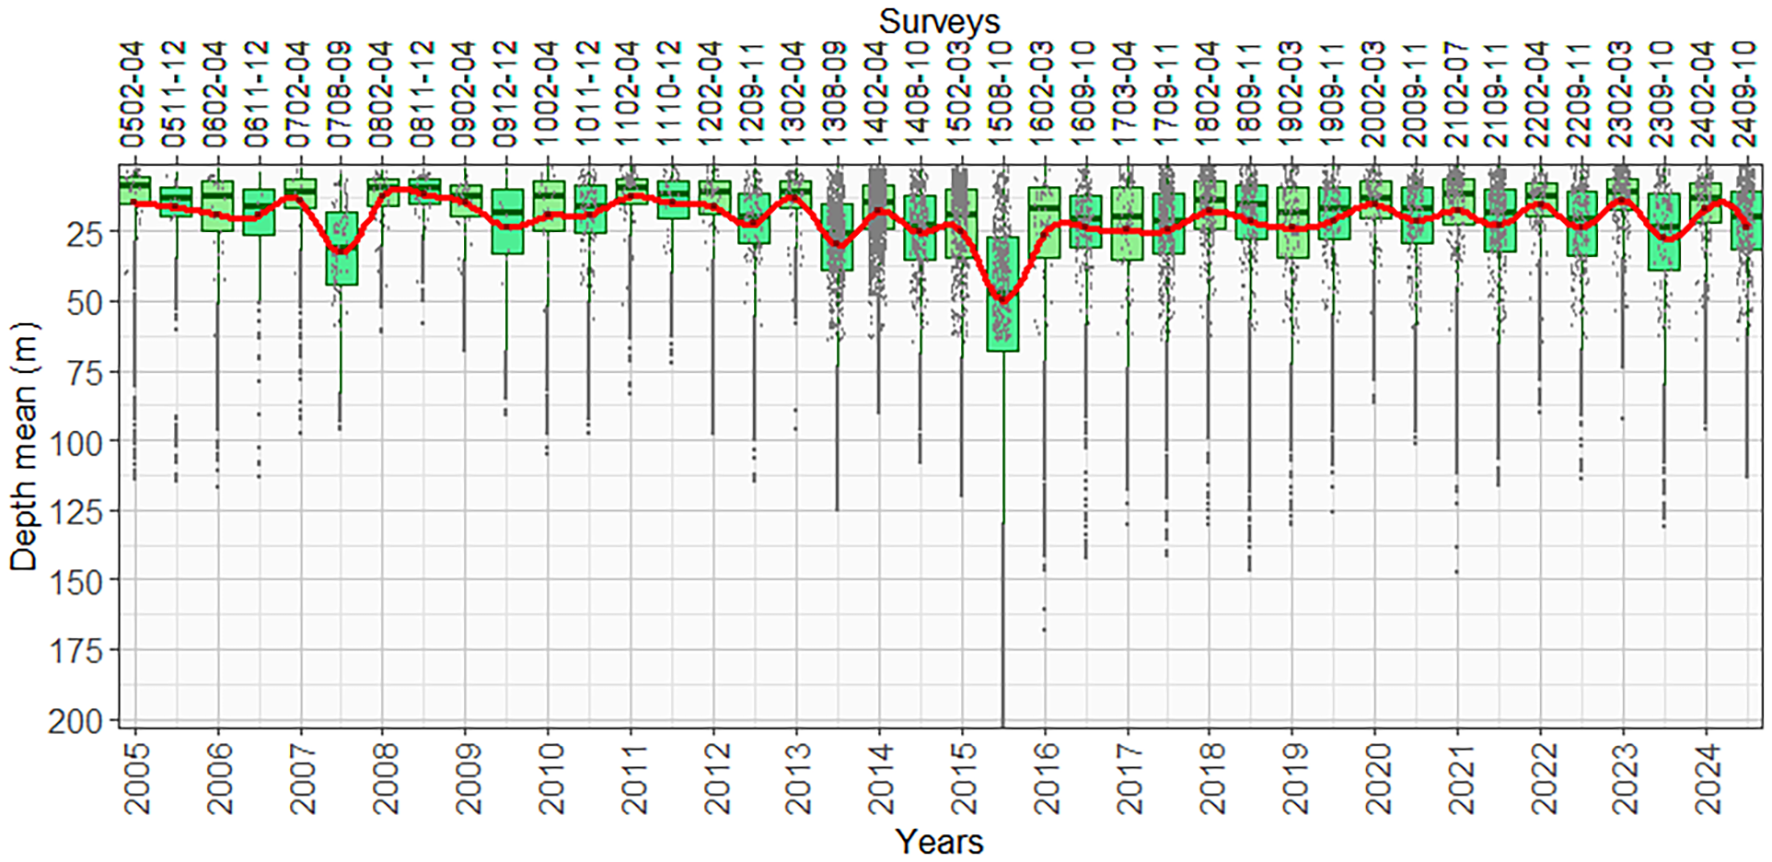
Fluctuations in the vertical distribution of munida aggregations were observed between 2005 and 2024. The figure shows a marked deepening in 2015.
3.3 Munida abundance
The abundance of munida varied significantly between 1998 and 2024, ranging from 0.26 to 5.38 million tons, with an average of 2.04 million tons over the period analyzed. Its high abundance is favored by cold oceanic conditions. The highest abundances were recorded in 2010, 2017, and 2018, with biomass estimates of 3,979,280 tons (survey 1011-12), 5,379,839 tons (survey 1703-04), and 4,975,611 tons (survey 1802-04), respectively. High-density cores were generally located in the northern zone (Figure 4). The El Niño events of “strong” intensity that occurred in 2015–2016 and 2023 generated southward migrations of the munida, recording high abundances in this area (13–16°S).
Figure 4
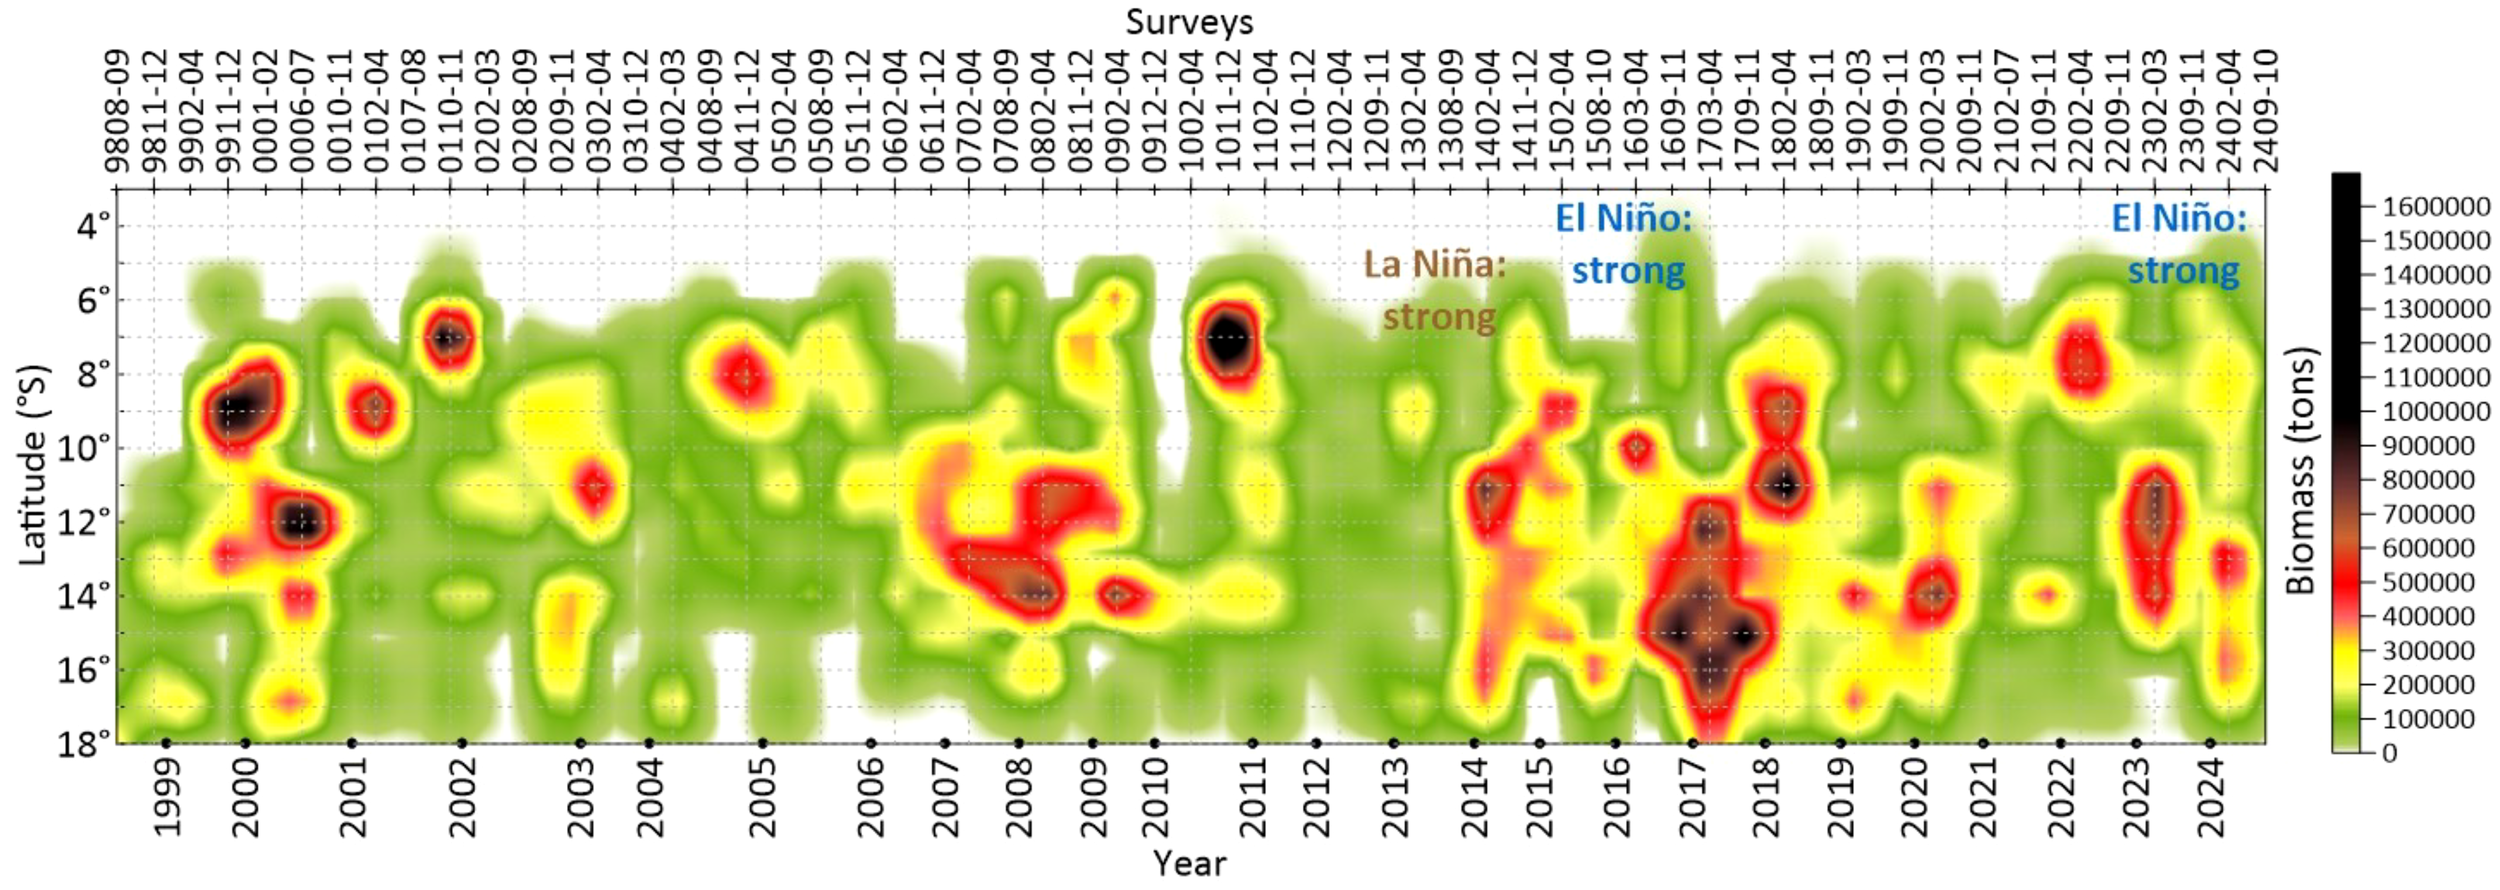
Hovmöller diagram of the abundance of munida distributed by degree of latitude per survey per year between 1998 and 2024.
Although biomass (tons) and distribution area (nm2) are expressed in different units and cannot be directly compared in magnitude, their relationship allows for the interpretation of spatial patterns through density analysis (tons/nm2). As shown in Figure 5, surveys such as 0107–08 and 2409–10 recorded low biomass and large distribution areas, resulting in low densities (14.68 and 18.27 t/nm2, respectively), which suggest greater dispersion. In contrast, surveys 1603-04, 1703-04, and 0702–04 showed high biomass and more restricted distribution areas, leading to higher densities (504.93, 364.40, and 347.45 t/nm2, respectively), indicating a greater spatial concentration of munida.
Figure 5
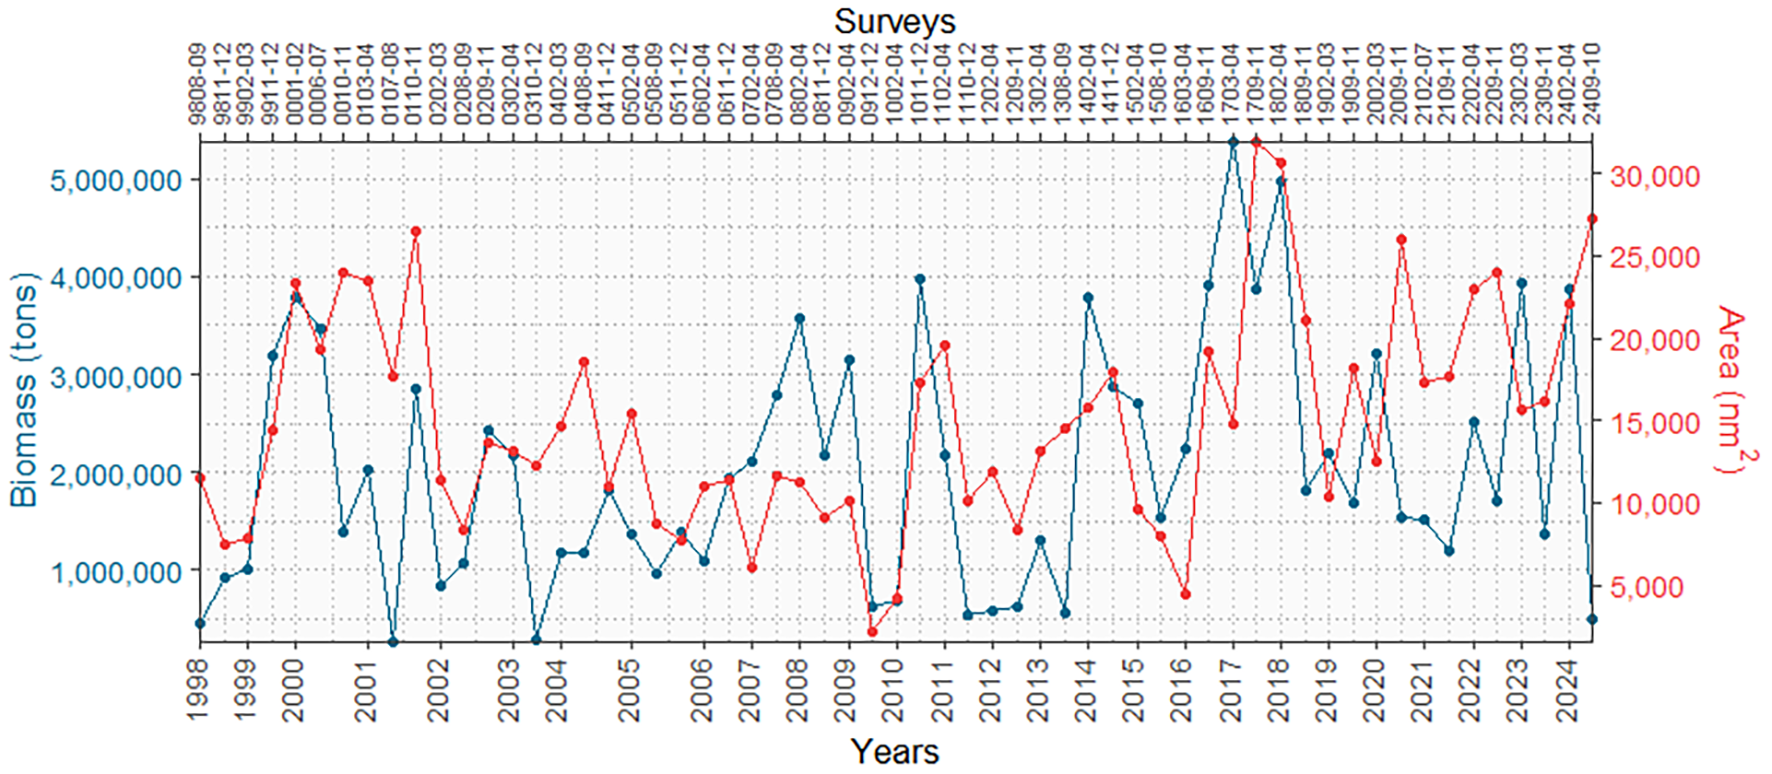
Biomass and distribution area by year and survey of the munida between 1998 and 2024.
3.4 Association of the munida with other pelagic species
Anchoveta and munida are pelagic species that inhabit the CCW of the Peruvian marine ecosystem. However, there are also other coastal species that inhabit these waters, such as samasa anchovy, catfish, Lorna drum, silverside, and lumptail searobin, and sometimes, generally in the summer or warm conditions, mesopelagic species such as giant squid, lightfish, myctophids, and silver smelt approach the coast. These last ones usually interact sporadically with the munida; however, it is not common.
The hierarchical clustering analysis of the species investigated in hydroacoustic surveys between 1998 and 2024 revealed four main groups (K = 4), differentiated by their distribution and ecological behavior. Two of these groups corresponded to coastal species: one composed of samasa anchovy and catfish (species of low abundance found in isolated coastal areas) and another formed by anchoveta and munida (more abundant species with a continuous latitudinal distribution). In the oceanic zone, two additional groups were identified: one formed by horse mackerel and chub mackerel (species that exhibit similar “plume”-shaped echotraces and are distributed in sporadic areas) and another composed of giant squid and lightfish (species with diel vertical migration behavior and generally high abundances). This clustering structure reflected consistent ecological and spatial patterns among the assessed species (Figure 6).
Figure 6
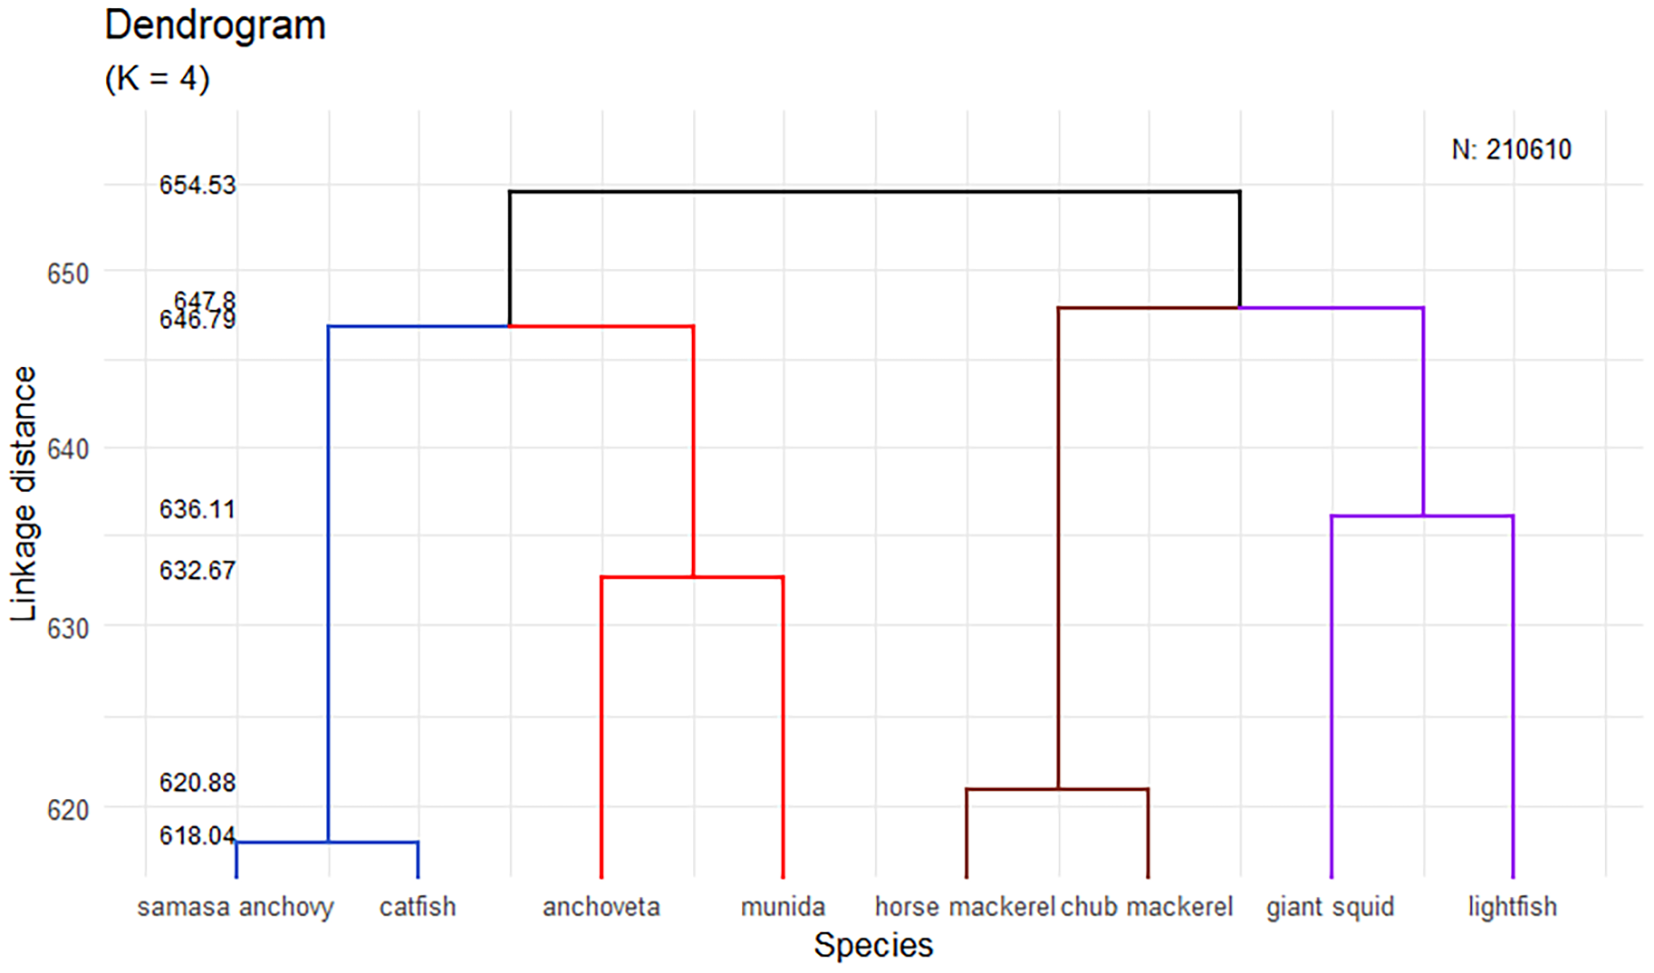
Hierarchical cluster dendrogram of the main species investigated in the hydroacoustic assessment surveys between 1998 and 2024.
3.5 Cases of aggregation behavior in the association between munida and anchoveta
Under normal oceanographic conditions, the vertical distribution of munida in association with anchoveta varies depending on the time of day. Anchoveta typically forms schools located in the surface layer, between 60 and 70 m deep, while munida forms aggregations both during the day and at night, with their position shifting according to the diel cycle.
During daylight hours (from 06:00 to 18:00), both species tend to separate: anchoveta forms schools in the surface layer, while munida aggregates in a continuous band located beneath these schools, as illustrated in Figure 7. However, on certain occasions, anchoveta schools are found slightly below the continuous munida aggregations (Figure 8), which facilitates their identification in acoustic records.
Figure 7
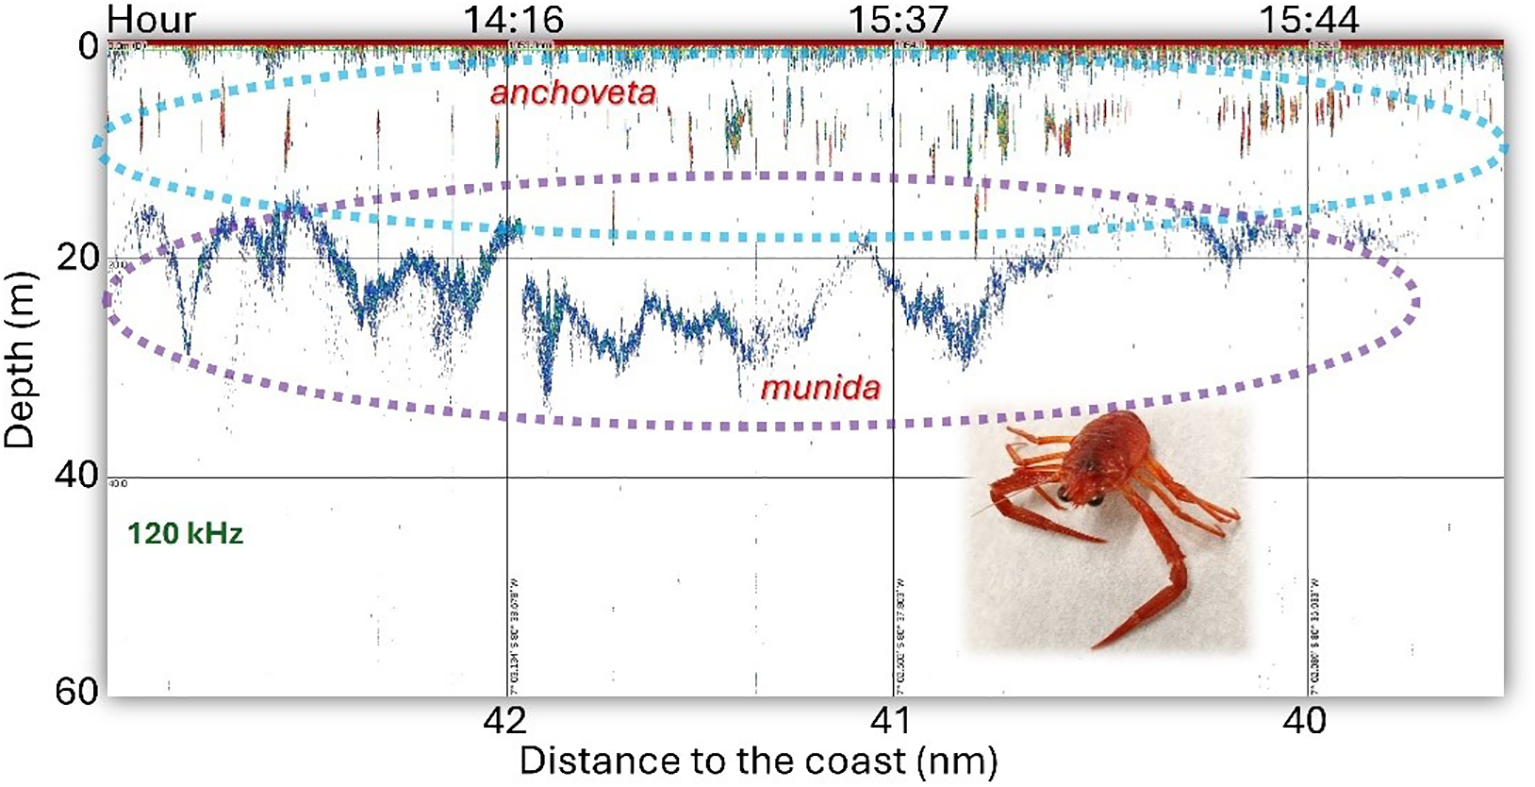
Echogram at 120 kHz with anchoveta and munida records detected during daylight hours. Normally, the munida records are located below the anchoveta schools.
Figure 8
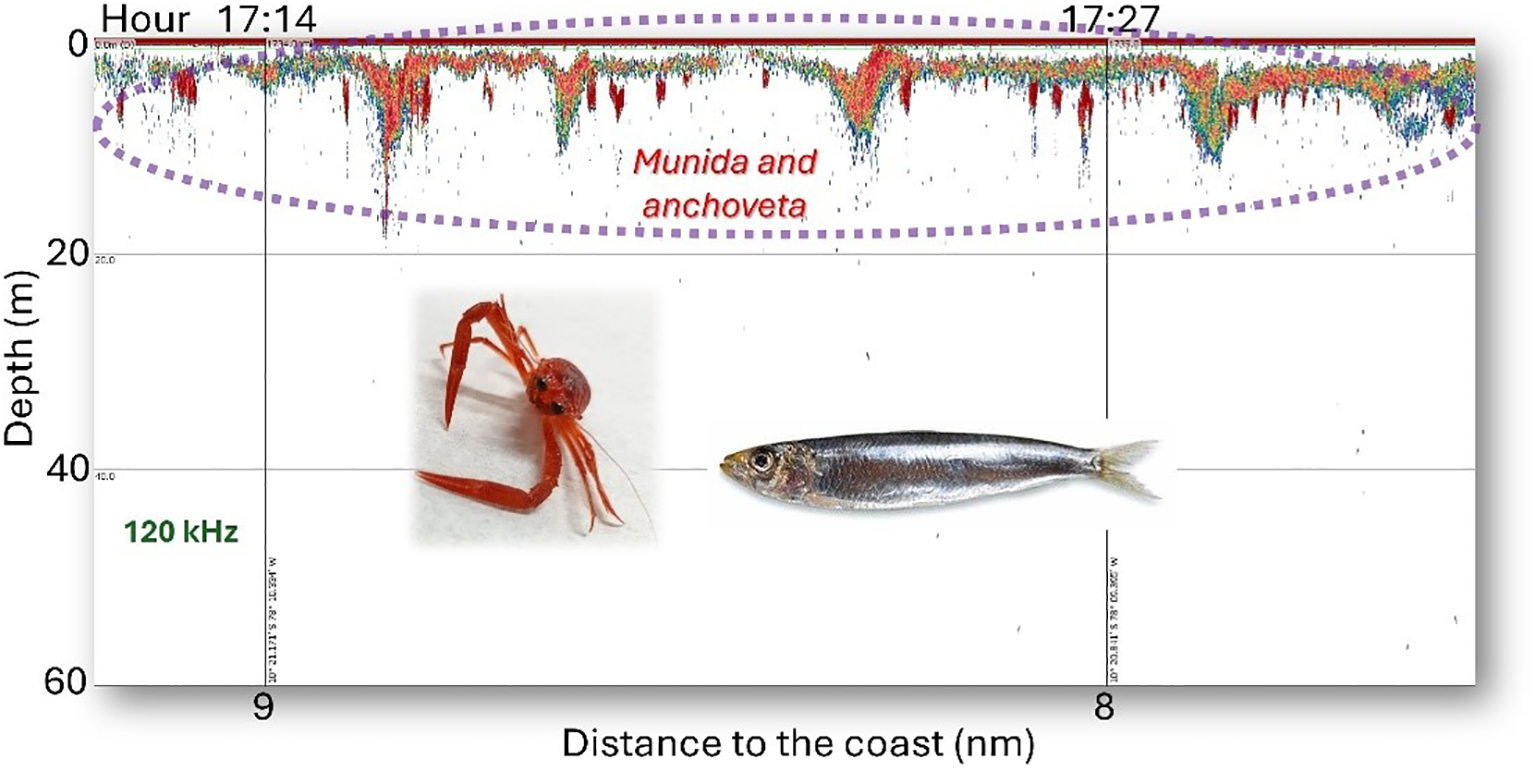
Echogram at 120 kHz with anchoveta and munida records detected during daylight hours. On some occasions, the anchoveta is found slightly below the aggregations of munida.
During the night hours, the identification of these species is more complex because they are in the same depth of the surface layer, forming a continuous “cloud” type “cordon”. To identify them, the echo sounder frequency records were used, first detecting the anchoveta at the 38-kHz frequency with an increase in the threshold and verifying it using frequency response graph analysis (Figure 9). At first sight, the differences in the echo sounding were not different, and strategies are required for their identification; therefore, it is advisable to capture them during daylight hours.
Figure 9
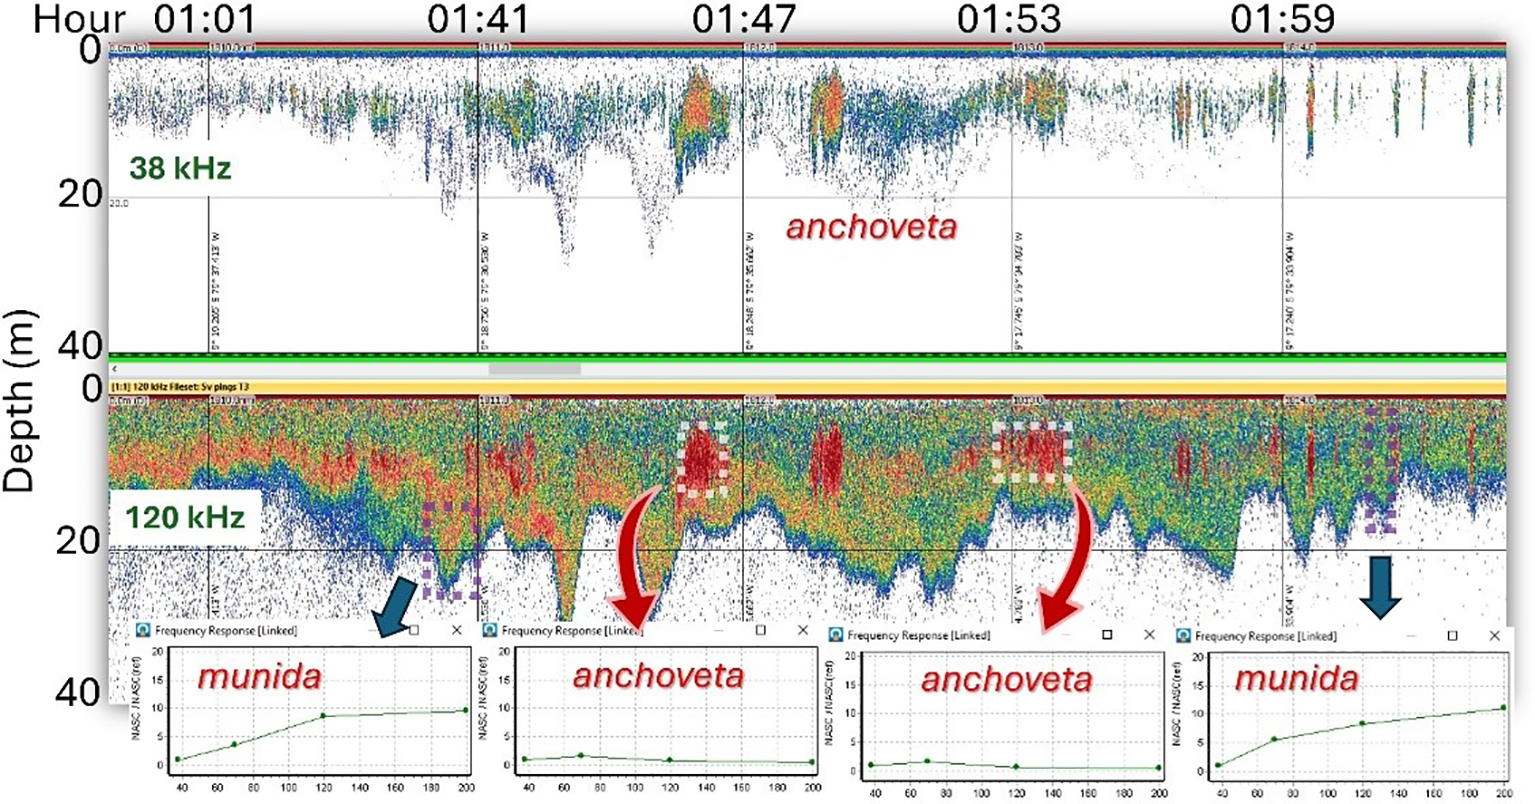
Echograms at 38 and 120 kHz with anchoveta and munida records detected at night in the same area. In the 38-kHz echogram (top), the threshold was lowered to −60 dB, and the 120-kHz echogram remained at −68 dB. The lower boxes are frequency response analysis plots of selected areas.
4 Discussion
Following the intense El Niño event of 1997–1998, a significant decline in the biomass of sardine, horse mackerel, and chub mackerel was observed in the coastal zone. This reduction allowed munida to occupy a larger portion of the coastal habitat, leading to an increase in its abundance and presence in survey records. Prior to this period, its occurrence was sporadic, and it was recorded only as an occasional catch during research surveys. Gutiérrez et al. (2012) considered that due to CCW and upwelling processes, the munida extended its distribution area from central Chile to the north of the Peruvian coast. However, the munida population in Chile is found in the benthic zone with depth of between 50 and 350 m (Palma and Arana, 1990; Quispe-Machaca et al., 2024), and when migrating to Peru, it adapted to the pelagic layer of 168-m depth with the highest abundances probably due to the location of the oxycline (intense OMZ with values less than 0.5 mL/L ~ 50–500 m) found at shallower depths than in the Chilean zone and, as mentioned by Flores et al. (2013) and Calienes (2014), those that regulate the vertical distribution of many neritic and oceanic pelagic species.
The characteristics of the spatial distribution of munida in Peru are somewhat similar to those of anchoveta; that is, i) it has spatial continuity at latitudinal and longitudinal levels in the coastal zone, which is why it has positive spatial autocorrelation; ii) it is structured because its distribution contains areas or hotspot of high density and areas of low dispersion; and iii) it is variable over time due to the dynamics of the CCW, as described in Castillo et al. (2015).
In terms of abundance, the munida is the second species with the highest biomass in the Peruvian coastal marine ecosystem. Although Cornejo et al. (2022) indicated that its biomass can fluctuate between 1.5 and 3.5 million tons at certain times of the year—highlighting its crucial role in the ecosystem’s food web—the series analyzed estimated biomasses of up to 5.38 million tons. These fluctuations are mainly associated with the variability of the Peruvian Current, influenced by the presence of warm or cold water masses, as occurs during El Niño and La Niña events.
Regarding the spatial interaction between anchoveta and squat lobster, as well as the daily vertical migration (nycthemeral cycle) of the latter, several studies agree on a dynamic coexistence influenced by environmental and behavioral factors.
Gutiérrez et al. (2008) and Santivañez (2017) reported significant spatial overlap between the two species, although their interpretations differ slightly. Gutiérrez et al. (2008) suggested that this interaction is not necessarily competitive, but rather a response to shared environmental conditions, such as coastal upwelling and the depth of the OMZ. They described a partially overlapping ecological niche, with behavioral differences that allow a degree of coexistence. Regarding vertical migration, they noted that squat lobsters descend during the day into low-oxygen waters (OMZ) and rise to the surface at night, forming dispersed aggregations.
In contrast, Santivañez (2017), using generalized additive models (GAMs) and aggregation analyses, argued that coexistence may be mediated by vertical segregation strategies and the availability of microhabitats related to oxygen levels. He also observed that squat lobsters tend to dominate more coastal and oxygenated areas in certain years, which could lead to habitat competition under specific environmental conditions. Additionally, he characterized the ecological niche patterns of both species using indices of aggregation, abundance, distribution, and water mass preferences.
Gutiérrez and Gerlotto (2016) also described vertical occupation strategies linked to nycthemeral aggregation behavior. During the day, squat lobsters formed extensive and continuous layers deeper than anchoveta schools, while at night, they moved toward the surface, forming smaller substructures with some spatial overlap with anchoveta, as also reported by Cornejo et al. (2022). Furthermore, these authors, along with Haye et al. (2010), found that higher squat lobster abundances were associated with areas rich in zooplankton and that their eggs and larvae are part of the anchoveta’s regular diet.
Overall, these findings suggest that the coexistence between anchoveta and squat lobster is shaped by a combination of environmental factors (oxygen, upwelling, and food availability) and distinct spatial and temporal behaviors, which help minimize direct competition and support niche partitioning.
However, this vertical behavior of the species at night is also difficult for anchoveta fishing skippers to distinguish. As a result, their catches often include higher percentages of munida since they usually rely on commercial echo sounders with a single transducer and frequency. Some skippers wait until dawn to begin fishing, when the species separate into the water column, and anchoveta tend to form schools. Therefore, fishing skippers should consider these behavioral patterns to avoid unwanted catches. Additionally, they should aim to fish during times of day when the species are more clearly separated in the water column, improving efficiency and reducing the impact on munida populations.
Several studies have highlighted the distribution, abundance, and potential uses of Pleuroncodes species in Latin America. In south-central Chile, Ibarra and Yáñez (2021) reported that biomass estimates for P. monodon based on surveys for direct methods do not exceed 90,000 tons, with landings approximately 8,000 tons. Similarly, Cusba et al. (2024) observed high variability in yellow squat lobster (Cervimunida johni) abundance depending on benthic spatial distribution, with biomass reaching a peak of 87,293 tons in 2009 and fluctuating between 19,708 and 48,943 tons between 2011 and 2015, rising again to 34,890 tons by 2019. Guzmán-Rivas et al. (2021) noted that the red squat lobster (P. monodon) supports Chile’s largest lobster fishery, with juveniles adjusting their bioenergetic reserves based on environmental factors such as temperature and chlorophyll-a concentration at their locations (Coquimbo and Concepción), showing differences in lipid and fatty acid composition. In Mexico, Vallarta-Zárate et al. (2023) reported that a related species, Pleuroncodes planipes (langostilla), is abundant along the western coast of the Baja California Peninsula and the Gulf of California. It is considered a strong candidate for a sustainable fishery, with biomass potentially exceeding 400,000 tons and a recommended annual catch of 40,000 tons, although it is not yet commercially exploited. This species is used for human consumption, aquaculture feed, and pharmaceutical applications. Furthermore, Ahumada et al. (2013) demonstrated the effectiveness of video recording systems in characterizing aggregations and habitats of P. monodon and C. johni in Coquimbo (Chile), and the technique proved effective for quantifying abundances and characterizing both the biotic and abiotic components of the species’ habitat, while Yapur-Pancorvo et al. (2023) highlighted P. monodon’s tolerance to oceanographic variation and its biotechnological potential in pharmaceutical and food industries.
We believe that, given the abundance of P. monodon in the Peruvian marine ecosystem, a fishery should be initiated, primarily for human consumption, aquaculture feed, and pharmaceutical applications—like the approaches being developed in Chile and Mexico. The implementation of research-based management measures for this species is supported by its continuous monitoring, which is regularly carried out by the IMARPE through hydroacoustic surveys of pelagic resources. This consistent monitoring provides a solid foundation for the sustainable development of a new fishery, especially given the species’ high abundance along the Peruvian coastal zone. Therefore, it is important to promote the development of this emerging fishery while simultaneously initiating regulatory processes—such as the establishment of a quota-based management system—to prevent potential overfishing.
A relevant example is the case of Chile, where the red squat lobster (P. monodon) fishery underwent overexploitation in 2017 due to bottom trawling on the continental shelf. This led to a significant decline in stock biomass and reproductive potential, particularly in the south-central region. Recovery efforts in Chile have since focused on regulatory measures and scientific monitoring to rebuild the population (Barros et al., 2023; CIAM, 2017).
5 Conclusions
-
Between 1998 and 2000, the center of gravity of squat lobster distribution shifted progressively from south to north, stabilizing between 11°S and 12°S from 2001 to 2024.
-
The spatial distribution of squat lobster follows a clear seasonal pattern: it expands during winter and spring, extending farther offshore, and contracts toward the coast in summer and autumn. However, anomalous oceanographic events (warm and/or cold) can trigger significant latitudinal and longitudinal displacements.
-
Vertically, squat lobster is mainly concentrated in the surface layer, with the highest presence approximately 50-m depth and a typical range extending to 168 m. During the 2015–2016 El Niño event, the species was recorded at depths of up to 203 m.
-
The average biomass between 1998 and 2014 was 2.04 million tons, with a maximum of 5.38 million tons observed during survey 1703-04.
-
Squat lobster shows a strong spatial and temporal association with anchoveta. During daylight hours, it is typically found beneath anchoveta schools, while at night, both species tend to mix in the surface layer.
-
Given the high biomass of the munida and its spatial overlap with the anchovy, it should be included in integrated fisheries management models with the possibility of precautionary exploitation.
Statements
Data availability statement
The raw data supporting the conclusions of this article will be made available by the authors, without undue reservation.
Author contributions
PC: Conceptualization, Formal analysis, Methodology, Supervision, Writing – original draft, Writing – review & editing. LL: Investigation, Methodology, Software, Writing – review & editing. CV: Data curation, Methodology, Writing – review & editing. GC: Data curation, Investigation, Methodology, Writing – review & editing. DG: Investigation, Supervision, Writing – review & editing. KF: Data curation, Methodology, Writing – review & editing. MP-H: Data curation, Software, Writing – review & editing. RC: Data curation, Writing – review & editing. AA: Data curation, Writing – review & editing.
Funding
The author(s) declare that no financial support was received for the research and/or publication of this article.
Acknowledgments
We thank a friend who worked at the General Directorate of Research in Hydroacoustics, Remote Sensing and Fishing Gear (DGIHSA) of the IMARPE, and who actively contributed to the logistics of the execution of the Hydroacoustic Assesment Surveys for Anchoveta and Others Pelagic Resourses carried out mainly between 2015 and 2020. Thanks to Pedro Romaní Matta and also the support of the administrative and secretarial staff of DGIHSA: Gisella, Fernando, Julio, Joyci, etc.
Conflict of interest
The authors declare that the research was conducted in the absence of any commercial or financial relationships that could be construed as a potential conflict of interest.
Generative AI statement
The author(s) declare that no Generative AI was used in the creation of this manuscript.
Any alternative text (alt text) provided alongside figures in this article has been generated by Frontiers with the support of artificial intelligence and reasonable efforts have been made to ensure accuracy, including review by the authors wherever possible. If you identify any issues, please contact us.
Publisher’s note
All claims expressed in this article are solely those of the authors and do not necessarily represent those of their affiliated organizations, or those of the publisher, the editors and the reviewers. Any product that may be evaluated in this article, or claim that may be made by its manufacturer, is not guaranteed or endorsed by the publisher.
References
1
Ahumada M. Queirolo D. Acuña E. Gaete E. (2013). Caracterización de agregaciones de langostino colorado (Pleuroncodes monodon) y langostino amarillo (Cervimunida johni) mediante un sistema de filmación remolcado. Latin Am. J. Aquat. Res.41, 199–208. doi: 10.3856/vol41-issue1-fulltext-20
2
Barros M. Alarcon R. Arancibia H. (2023). Distribución espaciotemporal del potencial reproductivo del stock de hembras de langostino colorado (Pleuroncodes monodon) en la zona centro-sur de Chile. Cienc. Marinas49, e3321. doi: 10.7773/cm.y2023.3321
3
Bertrand A. Ballón M. Chaigneau A. (2010). Acoustic observation of living organisms reveals the upper limit of the oxygen minimum zone. PloS One5, e10330. doi: 10.1371/journal.pone.0010330
4
Bertrand A. Segura M. Gutiérrez M. Vásquez L. (2004). From small-scale habitat loopholes to decadal cycles: A habitat-based hypothesis explaining fluctuation in pelagic fish populations off Peru. Fish. Fish.5, 296–316. doi: 10.1111/j.1467-2679.2004.00165.x
5
Bez N. Rivoirard J. (2001). Transitive geostatistics to characterize spatial aggregations with diffuse limits: an application on mackerel ichtyoplankton. Fish. Res.50, 41–58. doi: 10.1016/S0165-7836(00)00241-1
6
Bisson G. Blanch R. (2012). “ Improving visualization of large hierarchical clustering,” in 2012 16th International Conference on Information Visualisation. 220–228. doi: 10.1109/IV.2012.45
7
Calienes R. (2014). Producción primaria en el ambiente marino en el Pacífico sudeste, Perú, 1960–2000. Bol. Inst. Mar. Perú29, 232–288. Available online at: https://hdl.handle.net/20.500.12958/2302 (Accessed November 21, 2024).
8
Castillo P. R. Madureira L. Marangoni J. Gerlotto F. Guevara-Carrasco R. (2015). “ Variability in distribution and aggregation behavior of the Peruvian anchovy (Engraulis ringens) analyzed using a fifteen-year long series of acoustic surveys, (2000–2014),” in 2015 IEEE/OES Acoustics in Underwater Geosciences Symposium (RIO Acoustics)(Rio de Janeiro, Brazil: IEEE), 1–9. doi: 10.1109/RIOAcoustics.2015.7473636
9
Castillo P. R. Peraltilla S. Aliaga A. Flores M. Ballón M. Calderón. J. et al . (2009). Protocolo técnico para la evaluación acústica de las áreas de distribución y abundancia de recursos pelágicos en el mar Peruano. Versión 2009 Vol. 36 (Callao, Peru: Instituto del Mar del Perú), 7–28. Available online at: https://hdl.handle.net/20.500.12958/2001 (Accessed October 12, 2024).
10
Chiappa-Carrara X. Gallardo-Cabello M. Espinosa-Pérez H. S. (2003). Spatial distribution of fish larvae in the Gulf of California and its relation to oceanographic features using Surfer software. J. Plankton Res.25, 1105–1119. doi: 10.1093/plankt/25.7.687
11
CIAM (2017). Compilation of biological and fishery background on the squat lobster (Pleuroncodes sp.) in Chile and Peru. Centro Investigación Aplicada Al Mar. S.A. (CIAM), 24.
12
Cornejo R. La Cruz L. Castillo R. (2022). Distribución y biomasa de anchoveta (Engraulis ringens) y múnida (Pleuroncodes monodon) en el ecosistema marino de la Reserva Nacional de Paracas, región sur del Perú. Bull. Mar. Coast. Res.51, 99–116. doi: 10.25268/bimc.invemar.2022.51.1.1065
13
Cusba J. Queirolo D. Ahumada M. Apablaza P. Paramo J. Wiff R. (2024). Modelling density on historical aggregation areas improves biomass estimates in yellow squat lobster off Chile. Fish. Res.275, 107026. doi: 10.1016/j.fishres.2024.107026
14
Escobedo R. (2018). Índice de abundancia para múnida (Pleuroncodes monodon) a partir de datos de su captura incidental en la pesca industrial de la anchoveta Peruana (Engraulis ringens) desde 1997 a 2014. Tesis para Maestro en Ciencias del Mar (Lima Perú: Escuela de Posgrado Víctor Alzamora Castro. Univ. Peruana Cayetano Heredia), 93. Available online at: https://hdl.handle.net/20.500.12866/1536 (Accessed January 06, 2025).
15
Flores R. Espino M. Luque G. Quispe J. (2013). Patrones de variabilidad ambiental en el mar Peruano. Rev. Per. Biol.20, 21–28. doi: 10.15381/rpb.v20i1.2630
16
Franco-Meléndez M. T. (2012). Comportamiento reproductivo y variación de la proporción sexual de Pleuroncodes monodon (Crustácea: Galatheidae) en la costa Peruana. Cienc. Marinas38, 441–457.
17
Gallardo M.D.L.Á. González López A. E. Ramos M. Mujica A. Muñoz P. Sellanes J. et al . (2017). Reproductive patterns in demersal crustaceans from the upper boundary of the OMZ off north-central Chile. Continental Shelf Res.141, 26–37. doi: 10.1016/j.csr.2017.04.011
18
Gutiérrez D. Bouloubassi I. Sifeddine A. Purca S. Goubanova K. Graco M. et al . (2011). Coastal cooling and increased productivity in the main upwelling region off Peru since the mid-twentieth century. Geophysical Res. Lett.38. doi: 10.1029/2010GL046324
19
Gutiérrez M. Castillo R. Segura M. Peraltilla S. Flores M. (2012). Trends in spatio-temporal distribution of Peruvian anchovy and other small pelagic fish biomass from 1966-2009. Lat. Am. J. Aquat. Res.40, 633–648.
20
Gutiérrez M. Gerlotto F. (2016). Dinámica de la interacción espacial entre agregaciones de anchoveta (Engraulis ringens) y la pequeña langosta múnida (Pleuroncodes monodon) en el curso de un ciclo nictemeral. Inf. Inst. Mar. Perú43, 264–274. Available online at: https://hdl.handle.net/20.500.12958/3112.
21
Gutiérrez M. Ramírez A. Bertrand S. Morón O. Bertrand A. (2008). Ecological niches and areas of overlap of the squat lobster ‘múnida’ (Pleuroncodes monodon) and anchoveta (Engraulis ringens) off Peru. Prog. Oceanography79, 256–263. doi: 10.1016/j.pocean.2008.10.019
22
Guzmán F. Olavarría L. Urzúa Á. (2016). Seasonal variation in reproductive parameters of the squat lobster Pleuroncodes monodon from a South Pacific population. Invertebrate Reprod. Dev.60, 137–144. doi: 10.1080/07924259.2016.1174155
23
Guzmán-Rivas F. Quispe-Machaca M. Queirolo D. Ahumada M. Urzúa Á. (2021). Latitudinal changes in the lipid content and fatty acid profiles of juvenile female red squat lobsters (Pleuroncodes monodon) in breeding areas of the Humboldt Current System. PloS One16, e0253314. doi: 10.1371/journal.pone.0253314
24
Harrison L.-M. K. Cox M. Skaret G. Harcourt R. (2015). The R package EchoviewR for automated processing of active acoustic data using Echoview. Front. Mar. Sci.2. doi: 10.3389/fmars.2015.00015
25
Haye P. A. Salinas P. Acuña E. Poulin E. (2010). Heterochronic phenotypic plasticity with lack of genetic differentiation in the southeastern Pacific squat lobster Pleuroncodes monodon. Evol. Dev.12, 628–634. doi: 10.1111/j.1525-142X.2010.00447.x
26
Hendrickx M. E. Harvey A. W. (1999). Checklist of anomuran crabs (Crustacea: Decapoda) from the eastern tropical Pacific. Belgian J. Zool.129, 363–389.
27
Higginbottom I. Woon S. Schneider P. (2008). Hydroacoustic data processing for standard stock assessment using Echoview: technical manual. AdriaMed. Tech. Documents25, 161. FAO.
28
Ibarra M. Yáñez A. (2021). Estatus y posibilidades de explotación para langostino amarillo, langostino colorado y camarón nailon. Convenio de Desempeño 2020. Estatus y posibilidades de explotación biológicamente sustentables de los principales recursos pesqueros nacionales, año 2021: Crustáceos demersales. Informe Consolidado (Valparaíso (Chile: Instituto de Fomento Pesquero (IFOP), 322.
29
Jarvis T. Scoulding B. (2016). Using Echoview software to characterise acoustic scattering by aquatic organisms: The case of Atlantic mackerel (Scomber scombrus). J. Acoustical Soc. America140, 3244. doi: 10.1121/1.4970262
30
Kassambara A. (2017). Practical Guide to Cluster Analysis in R: Unsupervised Machine Learning (California, USA: STHDA). Available online at: https://books.google.com.pe/books?id=plEyDwAAQBAJ (Accessed December 12, 2024).
31
Lowe S. McGarry L. Douglas J. Newport J. Oore S. Whidden C. et al . (2022). Echofilter: A deep learning segmentation model improves the automation, standardization, and timeliness for post-processing echosounder data in tidal energy streams. Front. Mar. Sci.9, 867857. doi: 10.3389/fmars.2022.867857
32
MacLennan D. N. Fernandes P. G. Dalen J. (2002). A consistent approach to definitions and symbols 508 in fisheries acoustics. ICES J. Mar. Sci.59, 365–369. doi: 10.1006/jmsc.2001.1158
33
Morante F. (2021). Obtención de Astaxantina de la múnida Pleuroncodes monodon (Crustácea, decápoda, anomura), empleando CO2 supercrítico para su aplicación en acuicultura (Lima. Peru: Tesis para optar título Ing. Pesquero. Fac. Oceanog. Pesq. Ciencias Aliment y Acui. Univ. Nac. Federico Villarreal), 110.
34
Murrell P. (2019). R Graphics. 3rd (USA: Chapman and Hall/CRC), 442.
35
Ñiquen M. Bouchón M. (2004). Impact of El Niño events on pelagic fisheries in Peruvian waters. Deep-Sea Res. II51, 563–574. doi: 10.1016/j.dsr2.2004.03.001
36
Ñiquen M. Bouchon M. Echevarria A. Dávalos R. Cahuín S. Valdez D. et al . (1998). Situación de los principales recursos pelágicos en el mar Peruano durante el periodo post-Niño 1997-98. Inf. Inst. Mar. Perú141, 13–29. doi: 10.15381/rpb.v6i3.8434
37
Palma S. (1994). Distribución y abundancia de larvas de langostino colorado Pleuroncodes monodon frente a la costa de Concepción, Chile. Invest. Mar. Valparaiso.22, 13–29. doi: 10.4067/S0717-71781994002200002
38
Palma S. Arana P. (1990), 77. Aspectos reproductivos del langostino colorado (Pleuroncodes monodon H. Milne Edwards, 1837) en la zona centro-sur de Chile. Estud. Doc., Univ. Católica Valparaíso, 1/90.
39
Paredes F. Elliot W. (1997). Estudio biolόgico pesquero del “camaroncito rojo” o “múnida” frente a Pucusana, Lima. Inf. Progresivo N° 57: 21-34. IMARPE. Mayo 1997. Available online at: https://hdl.handle.net/20.500.12958/1449 (Accessed November 15, 2024).
40
Quispe-Machaca M. Zilleruelo M. Espinoza P. Torres G. Urzúa Á. (2024). Living along distribution margins: differences in the body and biochemistry of red squat lobster morphotypes (Grimothea monodon) from the humboldt current system. Fishes9, 445. doi: 10.3390/fishes9110445
41
R Core Team (2023). R: A Language and Environment for Statistical Computing (Vienna: R Foundation for Statistical Computing). Available online at: https://www.R-project.org/ (Accessed January 05, 2025).
42
Santivañez M. (2017). Caracterización y comparación de patrones espacio-temporales y nichos ecológicos de la múnida (Pleuroncodes monodon) y la anchoveta (Engraulis ringens) en el mar Peruano desde 1998 hasta 2013 [thesis, Universidad Nacional Mayor de San Marcos]. Repositorio UNMSM.
43
Segura M. Castillo R. (1996). Distribución y concentración de la múnida (Pleuroncodes monodon) durante el crucero BIC SNP-1 9602-04. Inf. Inst. Mar. Perú122, 79–85. Available online at: https://hdl.handle.net/20.500.12958/848.
44
Sieger T. Hurley C. B. Fiser K. Beleites C. (2017). Interactive Dendrograms: The R Packages idendro and idendr0. J. Stat. Software. 76, 1:22. doi: 10.18637/jss.v076.i10
45
Simmonds J. MacLennan D. (2005). Fisheries Acoustics. Theory and Practice. 2nd ed. (UK: Blackwell Science), 436. doi: 10.1002/9780470995303
46
Subpesca (2025). Langostino Colorado. Información general. Available online at: https://www.subpesca.cl/portal/616/w3-article-79859.html (Accessed February 25, 2025).
47
Vahidipour S. M. Mirzaei A. Rahmati M. (2014). Comparing weighted combination of hierarchical clustering based on Cophenetic measure. Intelligent Data Anal.18, 547–559. doi: 10.3233/IDA-140657
48
Vallarta-Zárate J. R. Vásquez-Ortiz M. Payán-Alejo J. Rojas-González R. I. (2023). Patrones de distribución de la langostilla (Pleuroncodes planipes) en la costa occidental de la península de Baja California, México. Rev. Mexicana Biodiversidad94, e944862. doi: 10.22201/ib.20078706e.2023.94.4862
49
Woillez M. Poulard J.-C. Rivoirard J. Petitgas P. Bez N. (2007). Indices for capturing spatial patterns and their evolution in time, with application to European hake (Merluccius merluccius) in the Bay of Biscay. ICES J. Mar. Sci.64, 537–550. doi: 10.1093/icesjms/fsm025
50
Yapur-Pancorvo A. L. Quispe-Machaca M. Guzmán-Rivás F. Urzúa Á. Espinoza P. (2023). The red squat lobster pleuroncodes monodon in the humboldt current system: from their ecology to commercial attributes as marine bioresource. Animals13, 2279. doi: 10.3390/ani13142279
51
Zhu G. Chen X. Liu B. (2010). Spatial distribution of Dosidicus gigas in the eastern Pacific Ocean based on acoustic survey and Surfer software. Fish. Sci.76, 409–417.
52
Zuur A. F. (2012). A beginner’s guide to generalized additive models with R (Newburgh, England: Highland Statistics Ltd).
Summary
Keywords
spatial distribution, biomass, munida, species interaction, diel vertical migration
Citation
Castillo PR, La Cruz L, Valdez C, Cuadros G, Ferrel K, Pozada-Herrera M, Cornejo R, Aliaga A and Grados D (2025) Distribution and abundance of squat lobster (Pleuroncodes monodon) and its association with anchoveta in the coastal zone of the Peruvian Current (1998–2024). Front. Mar. Sci. 12:1609766. doi: 10.3389/fmars.2025.1609766
Received
10 April 2025
Accepted
15 September 2025
Published
07 October 2025
Volume
12 - 2025
Edited by
Susana Carvalho, King Abdullah University of Science and Technology, Saudi Arabia
Reviewed by
Ian David Tuck, Ministry for Primary Industries, New Zealand; José Cusba, José Benito Vives of Andréis Marine and Coastal Research Institute, Colombia
Updates
Copyright
© 2025 Castillo, La Cruz, Valdez, Cuadros, Ferrel, Pozada-Herrera, Cornejo, Aliaga and Grados.
This is an open-access article distributed under the terms of the Creative Commons Attribution License (CC BY). The use, distribution or reproduction in other forums is permitted, provided the original author(s) and the copyright owner(s) are credited and that the original publication in this journal is cited, in accordance with accepted academic practice. No use, distribution or reproduction is permitted which does not comply with these terms.
*Correspondence: Pedro Ramiro Castillo, ramirocasti@gmail.com
Disclaimer
All claims expressed in this article are solely those of the authors and do not necessarily represent those of their affiliated organizations, or those of the publisher, the editors and the reviewers. Any product that may be evaluated in this article or claim that may be made by its manufacturer is not guaranteed or endorsed by the publisher.