Abstract
Introduction:
The coastal waters of the Leizhou Peninsula, as an important ecological transition zone in the northern South China Sea, face water quality issues that urgently require effective monitoring methods.
Methods:
Based on data from 188 stations across four seasons from 2020-2024, this study innovatively proposes a quantile statistical classification method based on mean and standard deviation, and compares results with typical bays at similar latitudes globally.
Results:
The research classifies regional water spectral types into four categories: Type I (17.22%) with high reflection narrow peaks at 570 nm; Type II (35.10%) featuring broad peaks at 540-560 nm; Type III (27.81%) showing gentle distribution across 500-570 nm; and Type IV (19.87%) with decreasing reflectance as wavelength increases, peaking around 500 nm.
Discussion:
Results indicate this region is dominated by mixed turbid waters (Types II and III accounting for 62.91%), providing scientific basis for water quality monitoring, aquaculture planning, algal bloom identification, and marine functional zoning, thus promoting regional marine ecological protection and sustainable resource utilization.
1 Introduction
Remote Sensing Reflectance (Rrs), a fundamental physical quantity of marine optical properties, is of great significance for studying marine optical characteristics and conducting satellite ocean color remote sensing (Yu et al., 2018). Therefore, high-precision in-situ measurements serve as the foundational work for water quality remote sensing monitoring and satellite application research. The reflection capacity of water bodies to electromagnetic radiation at different wavelengths varies due to the combined effects of their material composition and physicochemical properties. The law describing how reflectance changes with incident wavelength is referred to as the spectral characteristics of water bodies. Water optical properties include apparent optical properties (also known as apparent optical quantities) and inherent optical properties (also known as inherent optical quantities) (Ma et al., 2009).
On June 8, 2024, the Ministry of Natural Resources officially released the 2023 China Marine Ecological Early Warning and Monitoring Report. The report indicates that although China has achieved phased achievements in marine ecological protection and restoration in recent years, the challenges of marine ecological environmental protection remain severe amid structural, root-cause, and trend-based pressures. Additionally, with the intensification of climate change, the associated risk pressures are increasing daily, further highlighting the urgency of safeguarding the boundaries and bottom lines of marine ecological security. Against this backdrop, regular or real-time spectral detection becomes particularly critical. Timely monitoring of nearshore case II water body conditions—including the types, concentrations, and distributions of pollutants—can effectively protect the marine ecological environment and prevent and control water pollution incidents (Li et al., 2002; Bi et al., 2012). This initiative is of profound significance for maintaining marine ecological security and ensuring the sustainable utilization of marine resources.
The spectral characteristics of water bodies are the external manifestations of their components, with the highs and lows of remote sensing reflectance curves across different bands indirectly characterizing the types and concentrations of water substances (Sun et al., 2013). For water bodies, these spectral characteristics are primarily determined by their spectral absorption and scattering properties, while also being influenced by various water state conditions. Ye et al (Ye, 2009). analyzed the complex and variable spectral characteristics of waters in the Huanghai and East China Seas and studied classification methods for marine ocean color spectral characteristics. Wang et al (Wang et al., 2009). conducted measurements of water surface reflectance spectra in turbid waters of the Hangzhou Bay and, based on spectral characteristic analysis, investigated the correlation between surface suspended sediment concentration and remote sensing reflectance in different bands. Liu et al (Liu et al., 2010). utilized in-situ hyperspectral remote sensing reflectance data and suspended sediment mass concentration data from the Pearl River Estuary to establish a quantitative remote sensing inversion model for suspended sediment concentration. Chen, Tang et al (Chen et al., 1999). conducted field measurements on the spectral characteristics of 54 water bodies in the East China Sea test area and introduced the on-site measurement methods. Huang, Fu et al (Huang et al., 2019). explored the types and spatio-temporal distribution characteristics of remote sensing reflectance in the Pearl River Estuary based on four cruises of in-situ apparent spectral data.
Recent advances in satellite remote sensing technology have significantly enhanced our ability to monitor coastal water quality. Mondal et al (Mondal et al., 2025). investigated the spatiotemporal variability of optical characteristics in the Sundarbans estuary system using Sentinel-3 OLCI data and in-situ measurements. Their research demonstrated high correlations (R²=0.90-0.99) between satellite data and field measurements, proving the superiority of high-resolution remote sensing approaches over conventional methods for assessing water quality parameters. Similarly, Mondal et al (Mondal et al., 2024). evaluated the spatiotemporal variations of water quality parameters in three tropical estuaries using the Case 2 Regional Colour Correction (C2RCC) processor, revealing strong correlations between OLCI-derived data and field measurements for chlorophyll-a (r=0.829) and total suspended matter (r=0.924). Building on this, Bar et al (Bar et al., 2023). applied Sentinel-3 OLCI imagery to analyze temporal variations in the Hooghly estuary, recommending the regional use of SNAP C2RCC for water quality product retrieval in estuarine monitoring. Machine learning techniques have further advanced the field of water quality monitoring. Karmakar et al (Karmakar et al., 2024). developed an innovative approach using Support Vector Machine regression models to extract productivity-related indicators from MODIS multispectral imagery over a twenty-year period (2002-2021), finding that particulate organic carbon and chlorophyll-a were highly correlated (0.79). Beyond water quality monitoring, coastal regions face additional environmental challenges such as sea level rise. Mondal et al (Mondal et al., 2021). found that the sea level rise rate in the Sundarbans region exceeds global trends, with projections of approximately 4mm/year by 2090. Their analysis of Landsat time series imagery revealed a loss of 8.5 square kilometers of mangrove area between 1990 and 2019, highlighting the combined impact of sea level rise and anthropogenic activities on coastal ecosystems. These findings emphasize the importance of comprehensive monitoring approaches that consider both water quality parameters and broader environmental changes.
The Leizhou Peninsula and the coastal waters of the Beibu Gulf are rich in fishery and energy resources (Xu et al., 2023; Xia et al., 2022), This sea area serves as a habitat for numerous rare marine organisms, and the coastal mangrove wetlands play ecological roles in purifying water quality, carbon sequestration and storage, and storm surge resistance, acting as a natural barrier for regional ecological security. Economically, fishery resources support a huge fishing, aquaculture and processing industry, providing livelihoods for millions of people, while abundant energy resources drive the development of related industries. However, current research on the types and spatio-temporal variation patterns of remote sensing reflectance spectral characteristics in this region is insufficient. These spectral characteristics contain key information such as water chlorophyll concentration, suspended sediment and pollutant distribution, serving as important bases for monitoring ecological changes, evaluating fishery sustainability, early warning of disasters and ensuring the safety of energy facilities. Failure to grasp their changes in time will make it difficult to identify risks like ecological degradation, resource decline and aggravated pollution, affecting ecological protection and economic development decisions. Therefore, in-depth exploration of the types and spatio-temporal variation patterns of remote sensing reflectance spectral characteristics in the nearshore waters of the Leizhou Peninsula is crucial for achieving coordinated development of regional ecological and economic benefits.
2 Data and methods
2.1 Study area
The study area of this paper is the coastal waters of the Leizhou Peninsula (19.7°N–21.8°N; 108.0°E–111.2°E), located in the tropical and subtropical zones. The water depth here ranges from 20 meters to 50 meters, with a maximum depth not exceeding 90 meters. The annual sea surface temperature ranges from 22.4°C to 24.5°C (Mei-yan et al., 2021). In winter, influenced by continental cold air, the dominant wind is northeasterly; in summer, southeasterly and southwesterly winds prevail, with frequent typhoons (Liu, 1981). The eastern coast of the Leizhou Peninsula exhibits irregular semidiurnal tides, while the western coast features regular diurnal tides. Relevant tidal data can be obtained from the website https://mds.nmdis.org.cn/. The tidal range increases gradually from the bay mouth to the bay head, resulting in a complex tidal structure. The spectral characteristics of water bodies in the nearshore waters of the Beibu Gulf and Leizhou Peninsula are complex, resulting from the combined effects of multiple natural factors and environmental processes. This complexity is primarily caused by the large input of sediments with rainy-season runoff enhancing light scattering and winter-summer ocean currents driving sediment resuspension, the strong blue-light absorption of terrigenous CDOM (colored dissolved organic matter) in summer and the altered absorption spectrum due to biogenic CDOM contribution in winter, the significant red-light absorption by chlorophyll and green-light reflection peak from phytoplankton blooms in summer versus the spectral dominance of CDOM and sediments due to low biomass in winter, as well as the material transport differences from reverse winter-summer currents and hydrodynamic effects such as seasonal thermoclines/vertical mixing.
Four cruises were conducted in September 2020 (autumn), April 2021 (spring), January 2022 (winter), and July 2024 (summer). The originally scheduled cruise in 2023 was canceled due to weather conditions. Figure 1 shows the distribution of sampling stations for the four seasonal cruises. The cruise station design was based on the following principles: (1) Maximizing spatial coverage to ensure comprehensive coverage of the eastern and western coasts of the Leizhou Peninsula and the nearshore waters of the Beibu Gulf; (2) Environmental gradient principle, with stations arranged along the shore-offshore direction to capture the gradient changes of terrestrial inputs; (3) Hydrological and geomorphological features principle, with additional stations set up according to special hydrodynamic environments such as estuaries, bays, and areas surrounding islands. The selection of cruise timing for each season considered: (1) Representativeness of typical seasons, choosing characteristic months for spring, summer, autumn, and winter; (2) Influence of tidal cycles, avoiding spring tide periods and preferring to sample during neap tides to reduce interference from short-term changes caused by tides; (3) Suitability of meteorological conditions, avoiding strong wind and wave periods during typhoon season and heavy precipitation periods during the rainy season to ensure sampling safety and data quality. In the figure, inverted yellow triangles (C1–D31), upright purple triangles (E1–E43), blue diamonds (B1–B51), and green circles (T1–S17) represent valid stations, and red rectangular points represent invalid stations (due to nighttime measurements or abnormal data). A total of 188 station data were obtained, including 151 valid station data. The specific measured parameters are listed in Table 1.
Figure 1
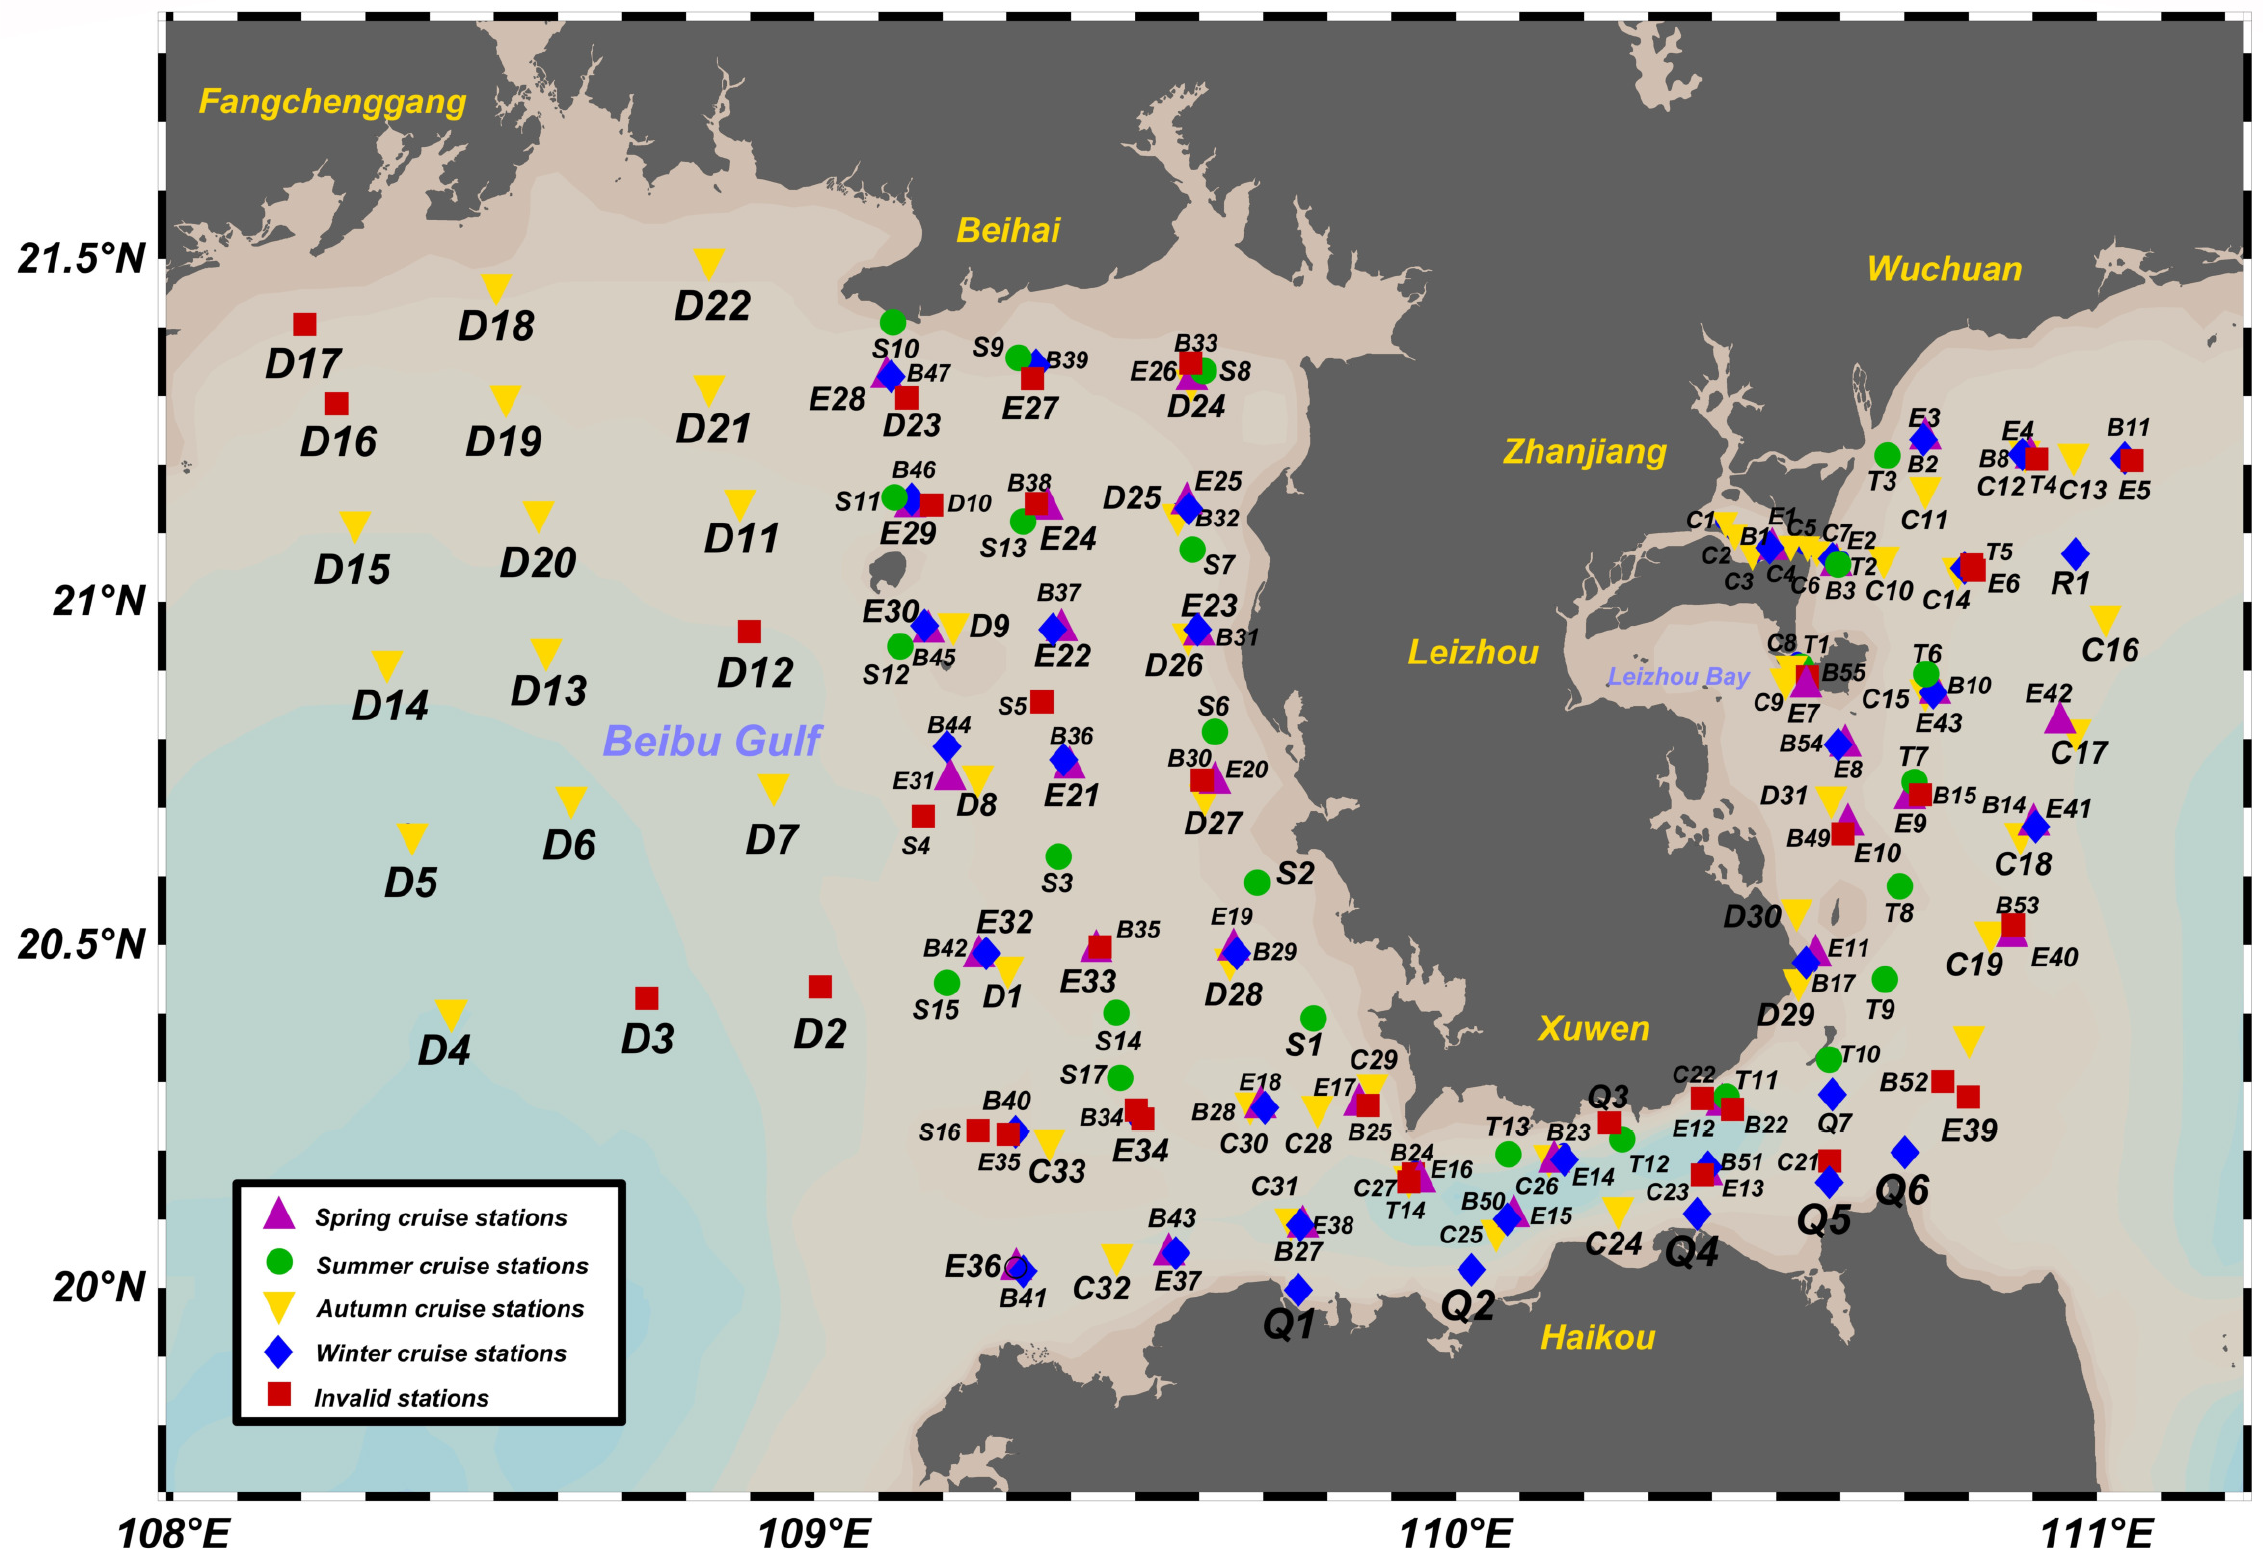
Spatial distribution map of the study area boundary and all sampling stations.
Table 1
| Cruise | Total stations | Valid stations | Optical parameters | Suspended sediment concentration (average) |
|---|---|---|---|---|
| 2020 | 64 | 54 | Lu,Lsky,Ed (0+) | — |
| 2021 | 43 | 37 | Lu,Lsky,Ed (0+) | 5.92 (mg/L) |
| 2022 | 50 | 35 | Lu,Lsky,Ed (0+) | 11.12 (mg/L) |
| 2024 | 31 | 25 | Lu,Lsky,Ed (0+) | 13.11 (mg/L) |
Number of measured stations for each cruise and their corresponding parameters.
2.2 Measurement methods
Spectral data were collected using the RAMSES-SW surface spectrometer system from TriOS, Germany. This system is designed for measuring apparent optical properties (AOP) in ocean color remote sensing, capable of accurately measuring solar irradiance, water radiance, and photosynthetically active radiation (PAR).Its measurement spectral range spans 310 nm to 1100 nm, with a wavelength resolution of 0.3 nm, ensuring data precision and a wide application range. The specific performance specifications of the instrument’s sensors are detailed in Table 2, which define key parameters to guarantee high-quality and reliable measurement results.
Table 2
| Sensor parameters | RAMSES - ARC | RAMSES - ACC - VIS |
|---|---|---|
| Light Receptor Type | Field of View (FOV)7° | Cosine |
| NIST Calibration Range | 320−950 nm | 320−950 nm |
| Integration Time | 4 ms to 8 s | 4 ms to 8 s |
| Detector | 256 pixels, silicon photodiode array | 256 pixels, silicon photodiode array |
| Spectral Sampling Interval | 3.3 nm/pixel | 3.3 nm/pixel |
| Spectral Resolution | 10 nm | 10 nm |
| Number of Effective Channels | 190 | 190 |
| Noise Equivalent Irradiance 8-second integration time |
2.5×10⁻⁵µW cm−2nm−1sr−1 500nm |
4×10⁻⁵µW cm−2nm−1 500nm |
| Saturation 4-millisecond integration time |
1×10²µW cm−2nm−1sr−1 500nm |
8×10²µW cm−2nm−1 500nm |
Various parameter specifications of spectral measurement instruments used in this study.
For the measurement methodology, the above-water method proposed by Tang et al (Tang et al., 2004). was adopted, following NASA’s ocean optical protocols. To minimize the impact of ship shadows on measurement results, the angle between the bow and the instrument was maintained between 90° and 135° during the measurement, while the solar zenith angle was ensured to be within the range of 20° to 40°. These settings not only enhance the accuracy of measured data but also reduce environmental interference during measurement, ensuring the authenticity and validity of the data.
2.3 Data acquisition
The RAMSES-SW instrument is equipped with 1 irradiance sensor and 2 radiance sensors. The irradiance sensor is used to measure the total irradiance, i.e., the total amount of radiation received at the water surface. The two radiance sensors are used to measure the upwelling radiance from the water body and the downwelling radiance from the sky, respectively. The remote sensing reflectance measured by the instrument is defined as:
In the equation, Lw represents the water-leaving radiance, and represents the total irradiance, where 0+ denotes the region above the water surface. The water-leaving radiance is calculated from the upwelling radiance of the water body (Lu) and the downwelling radiance of the sky light (Lsk):
where rsky is the surface Fresnel coefficient. In this study, the measurement was conducted during calm wind and wave periods, so the empirical value of 0.02 was adopted (Wen et al., 2018). Combining Equations 1, 2, the remote sensing reflectance formula is obtained as:
where λ is the corresponding wavelength. The above constitutes the acquisition process of remote sensing reflectance, and Equation 3 is the final result.
In this study, multiple measurements of remote sensing reflectance were conducted for each sampling site, with at least 5 measurements per site. The average value was taken as the remote sensing reflectance for that site. To ensure data quality, outliers were removed to reduce the impact of measurement errors on the results. To facilitate the comparison of spectra across different sites, the spectral wavelength range was selected as 350–850 nm. This range covers most of the visible and near-infrared regions and provides sufficient information for the research objectives to analyze and compare the spectral characteristics of different sites. Additionally, it improves the efficiency of data processing and the reliability of results across different sites.
In the suspended sediment concentration measurement experiment, water samples collected from each sampling site were first placed in a muffle furnace and treated at 450°C to burn off the organic matter on the filter membrane. A precision balance was then used to weigh a 0.7 micrometer-pore-diameter filter membrane and record its initial weight. Each sample was thoroughly shaken before filtration, and the instrument was thoroughly cleaned with distilled water after filtration to avoid residual substances from the previous sample affecting the filtration of the next sample. The purpose of the filtration operation is to collect the particulate matter in the water on the surface of the filter membrane. After that, the petri dish was sealed with tape to prevent external contamination of the filter membrane, wrapped in tin foil, and stored in a refrigerator to maintain the relatively stable state of the membrane. Finally, the sample was taken out from the refrigerator, dried in an oven set to 45°C, and the dried filter membrane was reweighed with the balance. The suspended sediment concentration was calculated by subtracting the pre-filtration weight from the post-filtration weight and then dividing by the volume (mL) of the filtered water sample. This step ensures that the suspended sediments are effectively intercepted, providing a reliable basis for subsequent concentration quantification.
2.4 Technical route
This paper draws on Ye’s (Ye, 2009) maximum-value supervised classification method and proposes a quantile statistical method for data classification based on the mean and standard deviation (Parzen, 2004). This method calculates the maximum value of each curve and determines classification thresholds based on the mean and standard deviation of these maximum values. Innovatively, it combines the mean and standard deviation to construct quantiles for data classification: the mean reflects the central position of the data, while the standard deviation reflects the discrete range. Their joint use describes the data distribution from multiple dimensions, enabling more accurate classification.
The specific operational process is shown in Figure 2: First, the interquartile range (IQR) method (Yang et al., 2020) is used to identify and remove extreme values. The mean and standard deviation of the maximum values of all curves are then calculated, with the mean plus or minus the standard deviation serving as the classification quantiles. Next, curves are categorized according to these quantiles. For each category, the average curve is calculated, and categories are sorted by the maximum value of their average curves. Finally, the sorted average curves are plotted. This statistical-quantile-based method helps analyze data distribution characteristics and the properties of different categories.
Figure 2
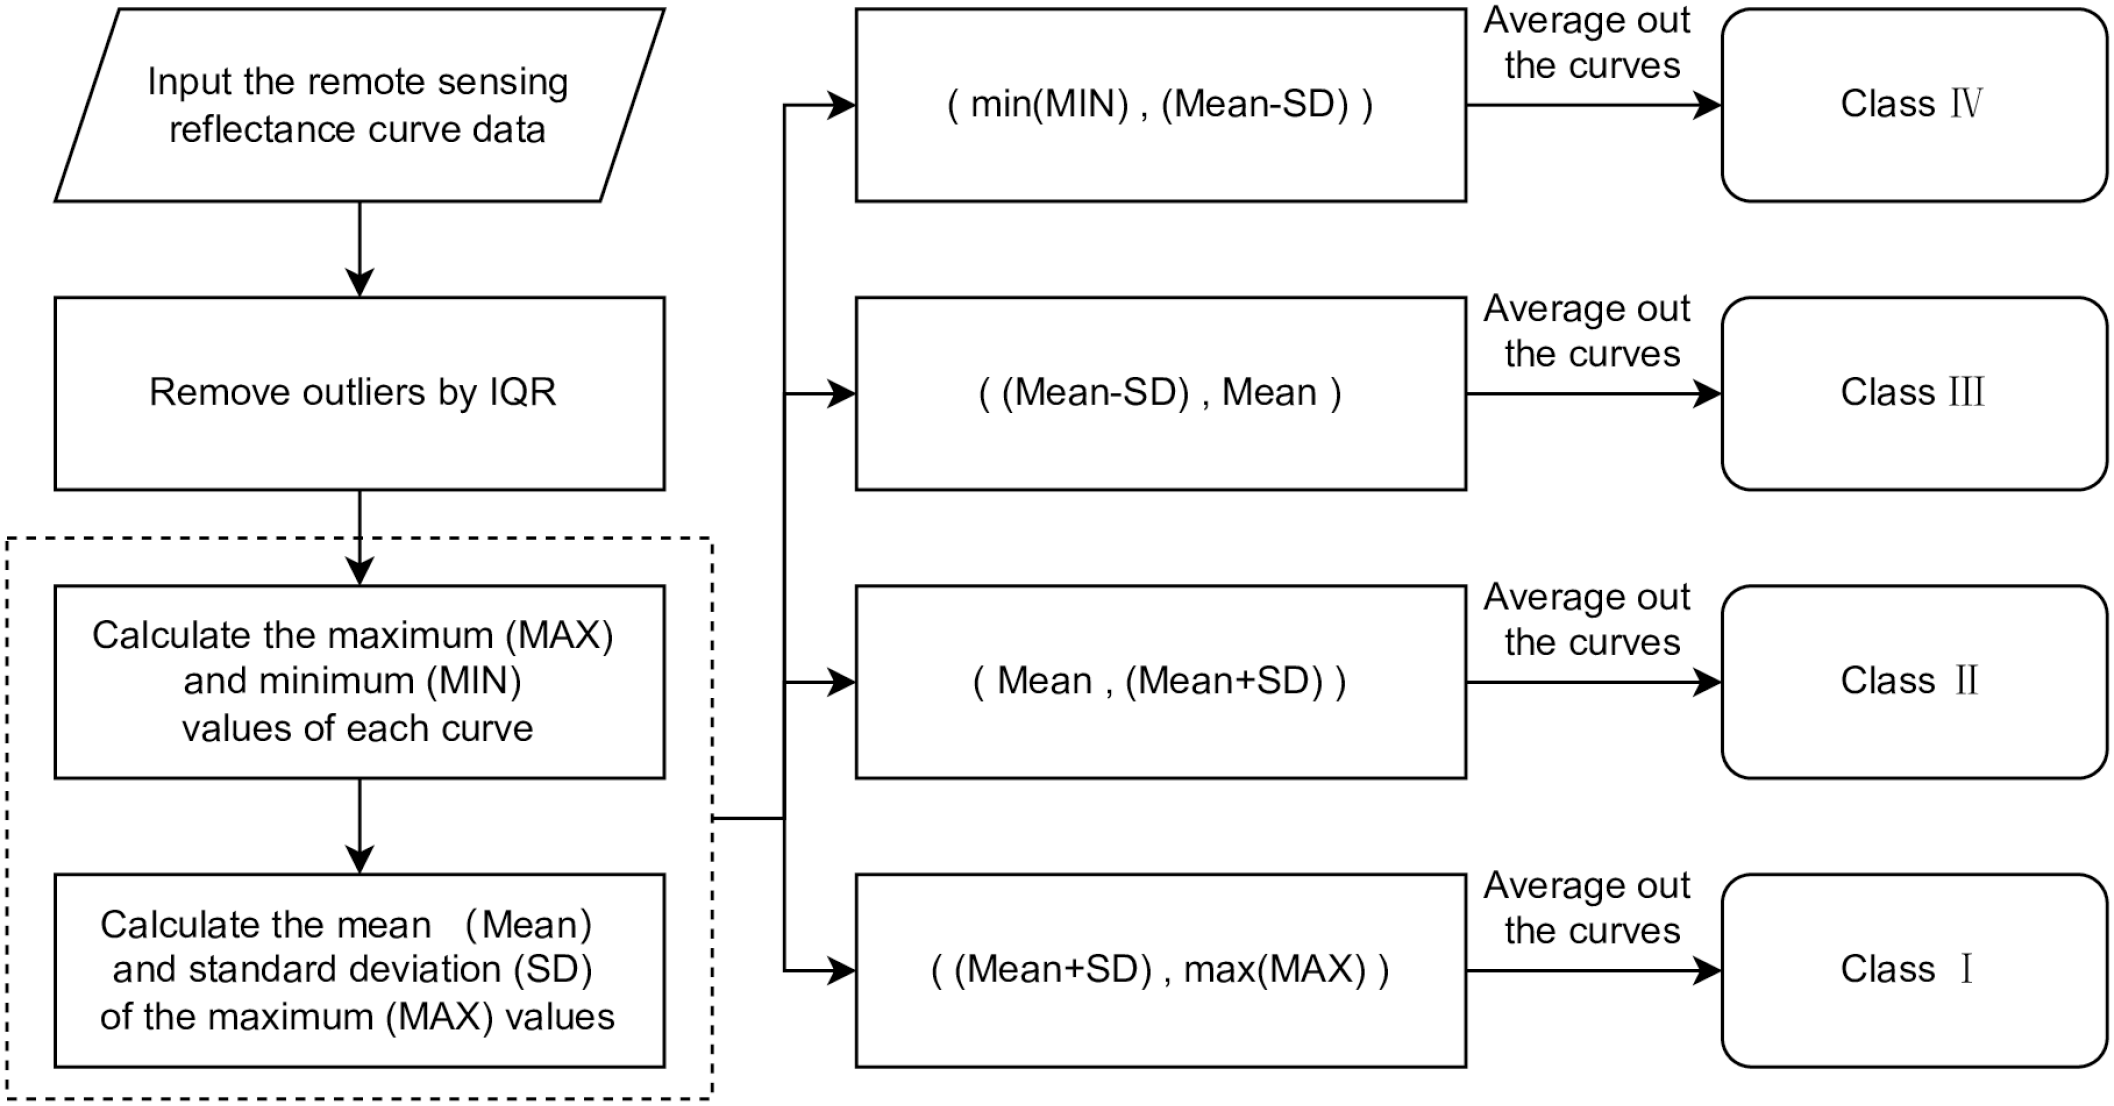
Flow chart of the quantile statistical method based on the mean and standard deviation.
This classification method offers several advantages: First, it defines classification thresholds by automatically calculating statistics such as the mean and standard deviation, eliminating the need for manual setting and reducing subjectivity caused by human intervention. Second, it is applicable when the data distribution is unknown or non-standard, as it can automatically adjust classification boundaries according to the data’s distribution characteristics. Third, classification based on statistics has clear statistical significance: the mean and standard deviation reflect the central tendency and dispersion degree of the data, respectively, making the classification results highly interpretable. Fourth, plotting the average curves of classified categories visually presents the characteristic differences between categories, facilitating further analysis and interpretation. Fifth, it allows flexible adjustment of the number of categories (e.g., increasing or decreasing quantiles) to meet different analytical objectives. Sixth, when processing largescale data, this method is computationally efficient, suitable for quickly generating results and conducting preliminary exploratory analysis.
Compared with traditional classification methods, the quantile statistical method proposed in this paper shows significant differences: traditional methods typically use fixed thresholds or empirical rules that require manual parameter setting; whereas the quantile method automatically adapts to data distribution characteristics, reduces subjective intervention, has no special requirements for data distribution, provides clear statistical interpretation, and is more computationally efficient when processing massive spectral data. These advantages enable the method to demonstrate stronger objectivity and adaptability in water body spectral classification.
In summary, this method demonstrates high flexibility and practicality in data classification and visualization, capable of rapidly revealing data distribution characteristics and category differences.
3 Results and discussion
3.1 Classification of water body types at measured stations
Class I water bodies mainly refer to open ocean waters; Class II water bodies have complex optical properties, influenced by multiple components such as suspended sediments, chlorophyll, and yellow substances. These are primarily distributed in coastal and inland areas, representing the waters most closely related to human activities and most strongly affected by human intervention. Most coastal waters in China are Class II water bodies (Tang et al., 2004; Ren and Zhao, 2002). Based on this, this paper analyzes the water body types in the coastal waters of Leizhou Peninsula using specific wavebands.
Using the classification method for Class I and Class II water bodies proposed by Zhang (Zhang and Shi, 2005) et al., we calculated the measured data from stations in the coastal waters of Leizhou Peninsula. The water body type can be quickly and effectively identified by calculating the ratio of remote sensing reflectance at 412 nm and 510 nm. The discriminant formula is as follows:
According to this simple criterion in Equation 4, if the band ratio is less than 1.5, the water body is classified as Class I; otherwise, it is Class II.
Given the limited number of stations in a single voyage, we merged data from four voyages to improve the uniformity of station distribution, enhance interpolation accuracy, and comprehensively characterize the general pattern of water body types in the sea area. The distribution of Class I and Class II water bodies from the four voyages in the coastal waters of Leizhou Peninsula is shown in Figure 3A, where the color scale values represent the band ratio. Based on the maximum and minimum values of the band ratio from four years of measured data, a color scale range of 0.5 to 2.5 was selected. A yellowish color indicates turbid water, while a bluish color indicates clear water. The contour line at 1.5 serves as the threshold boundary between Class I and Class II water bodies. It should be noted that the Data-Interpolating Variational Analysis (DIVA) method in the Ocean Data View (ODV) software was used for interpolation to plot the water body type distribution map. This map is generated from measured station data, with black dots representing station locations. A more uniform distribution and larger number of stations improve interpolation accuracy; thus, the accuracy of the contour lines in the figure is closely related to the effective number of stations in Table 1.
Figure 3
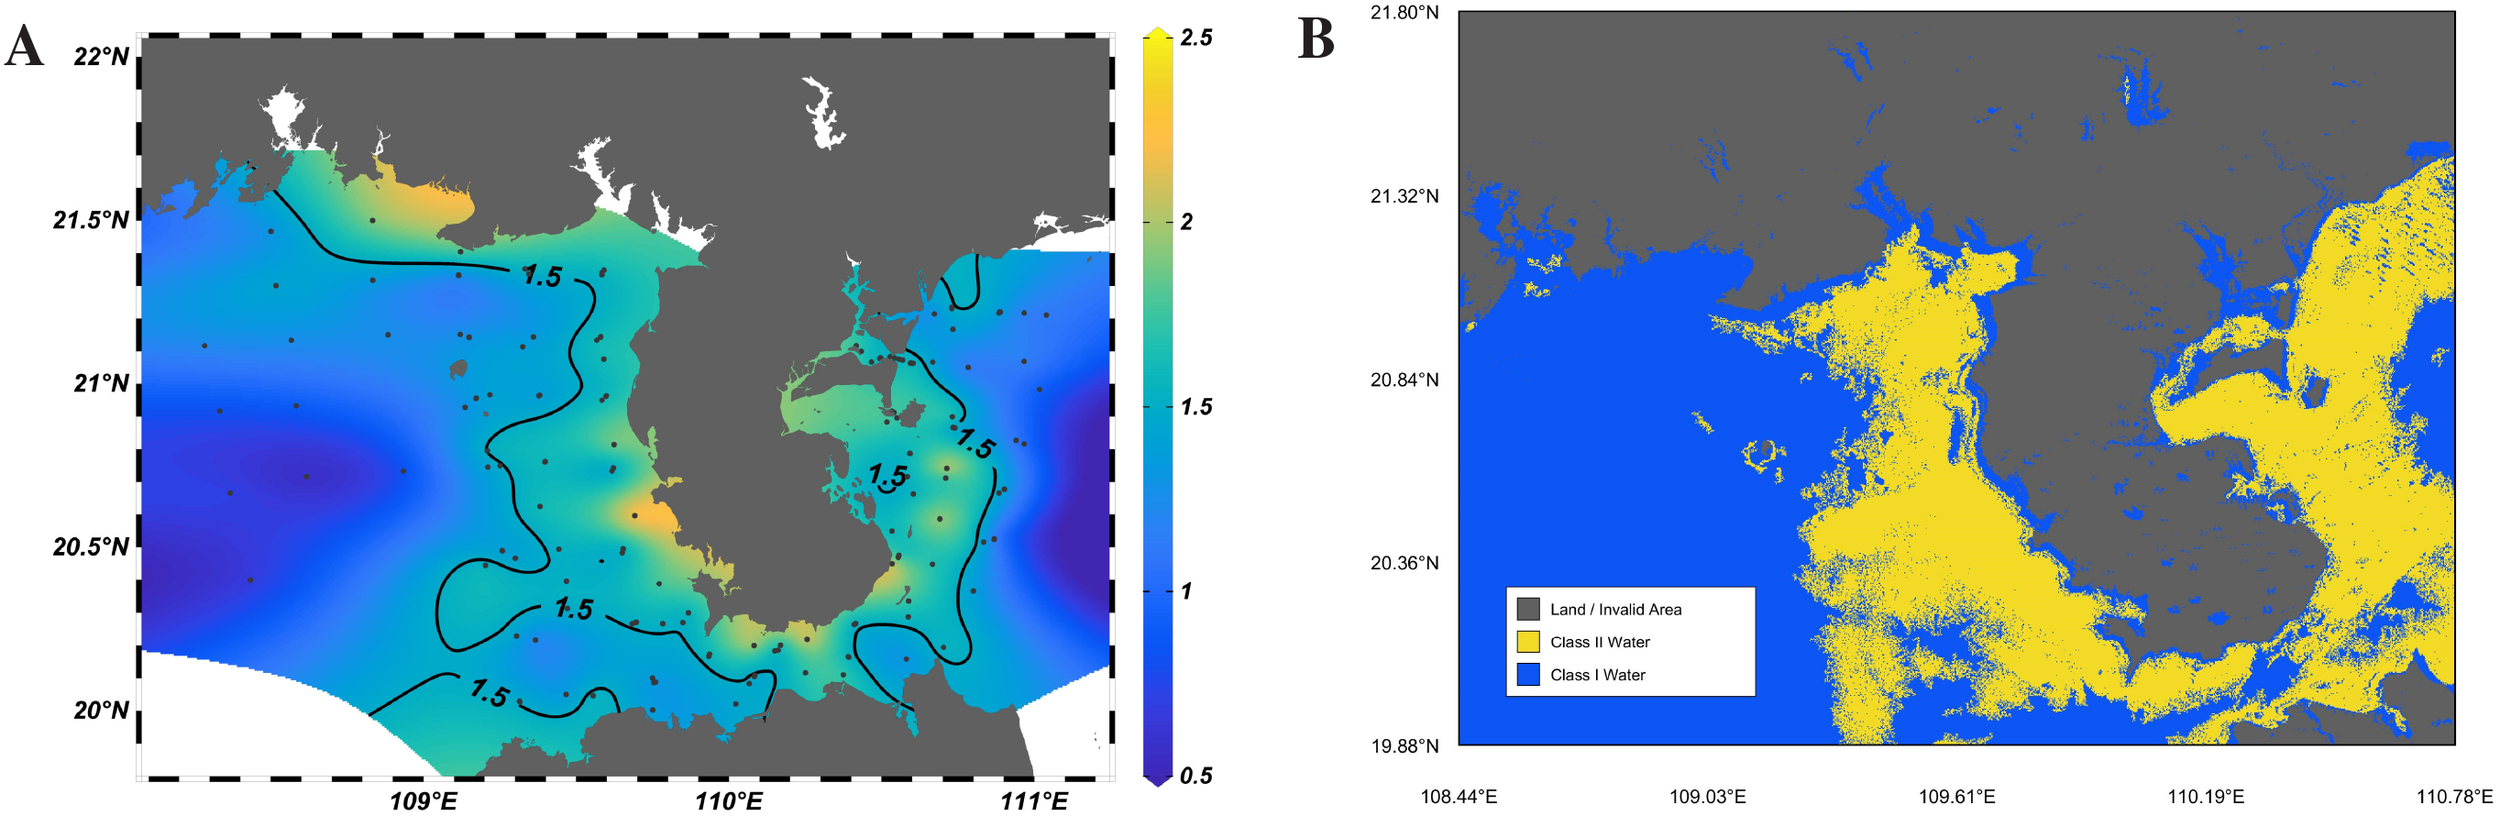
(A) Distribution of water body types in coastal waters of Leizhou Peninsula based on measured station data (The 1.5 contour line in the figure represents the band ratio, used for classifying water body types); (B) Distribution of water body types in the coastal waters of Leizhou Peninsula based on Sentinel-3 OLCI data.
However, due to differences in the number of stations and their spatial distribution, the interpolation method based on station data can only roughly estimate the distribution range of Class I and Class II water bodies, failing to achieve precise classification. To verify the reliability of the station data, we introduced remote sensing data from the Sentinel-3 Ocean and Land Colour Instrument (OLCI) Level-2 Water Full Resolution product for comparative analysis. Sentinel-3 OLCI data was selected due to its optimized spectral band configuration designed specifically for water color observation, appropriate spatial resolution for coastal water monitoring, high-quality atmospheric correction processing in Level-2 products, good temporal consistency with field observations, and band design particularly suitable for water body type differentiation. These remote sensing data offer the advantages of wide coverage and continuous spatial information, enabling macro-scale monitoring of water body types in the coastal waters of the Leizhou Peninsula.
We selected four cloud-free images close in time to the station measurement dates (October 5, 2020; May 22, 2021; February 22, 2022; June 28, 2024), extracted the remote sensing reflectance information of the Oa02 and Oa05 bands, preprocessed the data, and calculated the band ratio using the same method. Finally, an average calculation was performed on the Rrs(Oa05)/Rrs(Oa02) results of the four images, which can balance data differences across different times and spaces to a certain extent. This averaging reduces the impact of fluctuations in water body types among images in some areas, yielding relatively stable classification results and improving the accuracy of interpolation. Statistics show that the number of stations correctly classified is 128, the number of stations incorrectly classified is 23, and the accuracy rate reaches 84.77%. The final classification effect is shown in Figure 3B.
The high concentration of suspended sediments in the waters around Leizhou Peninsula results from the combined effects of natural geographical conditions and human activities. For example, Class II water bodies along the coast of Beihai City are mainly caused by sediment-laden river water discharged into the sea (Li et al., 2022), while the darker areas along the coast of Leizhou Peninsula are mostly due to aquaculture zones (Chen et al., 2012b; Zhang et al., 2012). Overall, the ecological mechanisms in the waters surrounding the Leizhou Peninsula are complex, necessitating long-term monitoring of the region through multi-source data surveillance and cross-departmental collaborative management to balance development needs and ecological protection.
3.2 Analysis of spatiotemporal variations and differences
This study analyzes the spectral characteristics of the coastal waters of Leizhou Peninsula using remote sensing reflectance data from four offshore cruises in different seasons. The remote sensing spectral reflectance curves for the four cruises are shown in Figure 4. The autumn cruise (Figure 4A) shows diverse reflectance patterns across multiple sampling stations, while the spring cruise (Figure 4B) demonstrates clear stratification of reflectance curves. The winter cruise (Figure 4C) exhibits relatively higher reflectance intensity, and the summer cruise (Figure 4D) shows the most pronounced peaks in certain stations. Analysis reveals that although there are certain differences in the remote sensing reflectance curves of the four cruises, their general spectral shapes are basically consistent, with common features in specific wavebands, as shown in the overall cruise overview in Figure 5.
Figure 4
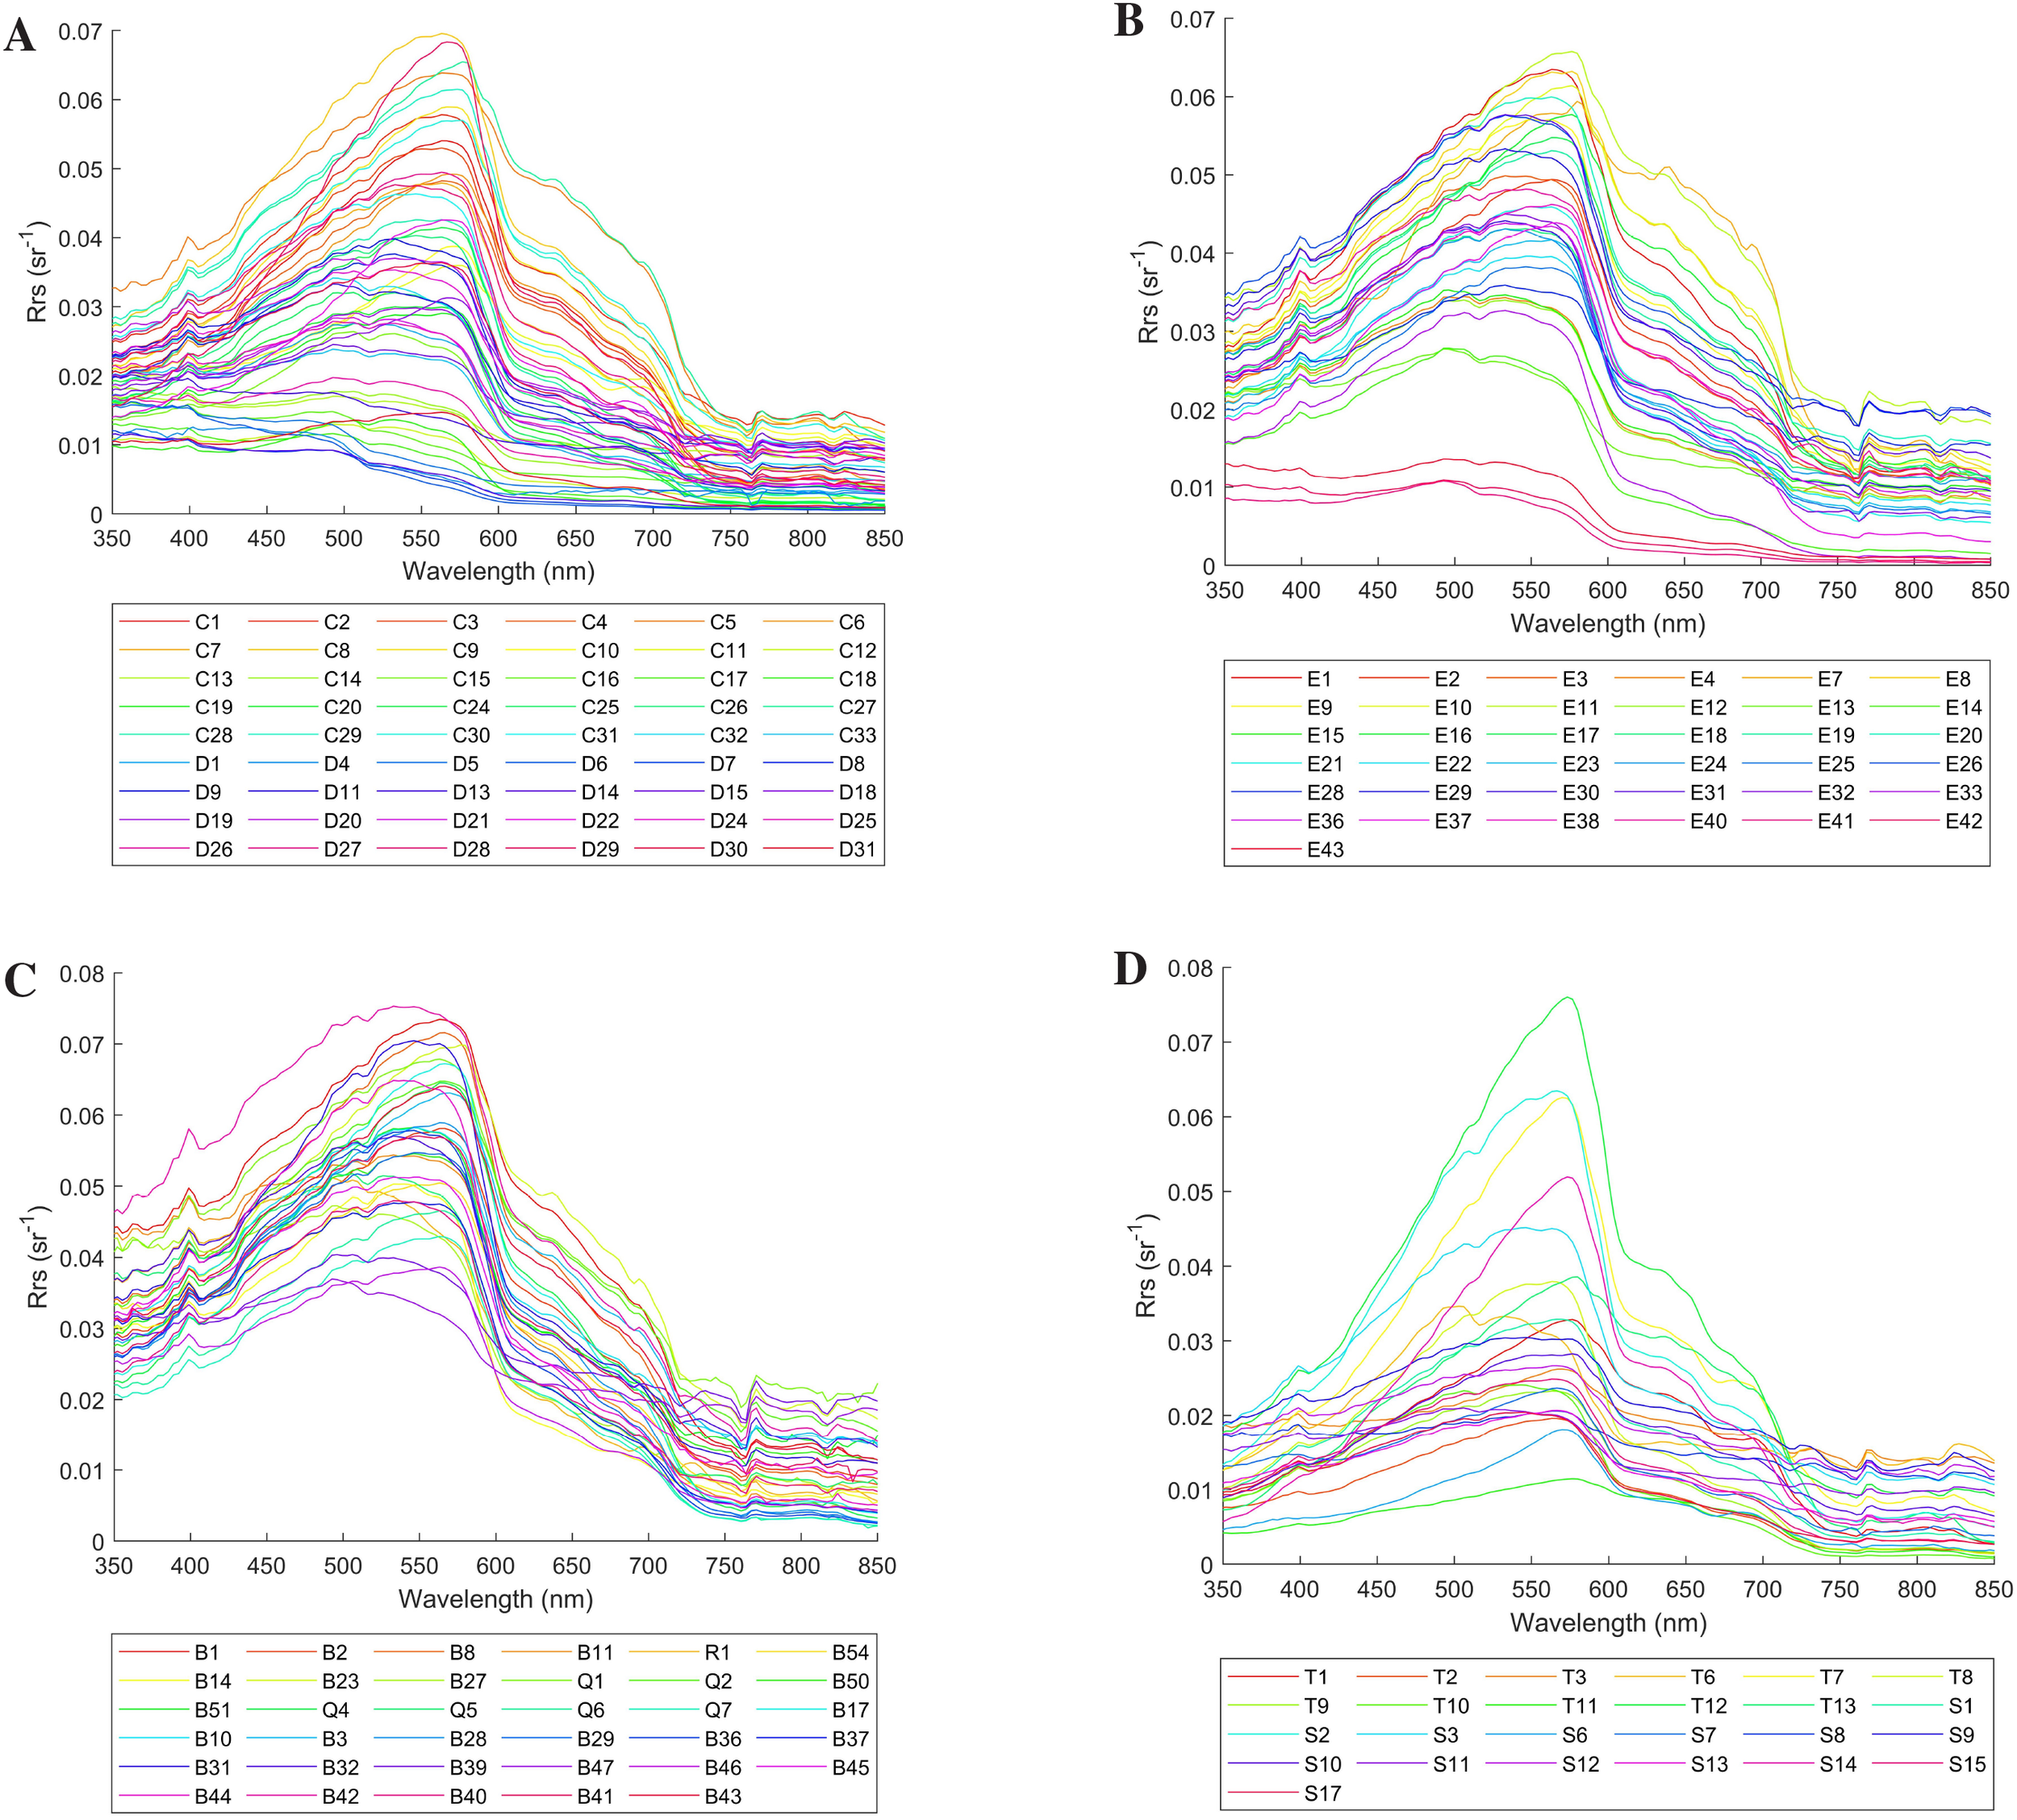
(A) Spectral curve diagram of the autumn cruise in 2020; (B) Spectral curve diagram of the spring cruise in 2021; (C) Spectral curve diagram of the winter cruise in 2022; (D) Spectral curve diagram of the summer cruise in 2024.
Figure 5
Spectral curve diagram of the total cruises from 2020 to 2024.
Analyzing from the shortest to longest wavelengths, Blondeau-Patissier et al (Blondeau-Patissier et al., 2014). pointed out in their study on the influencing factors of algal bloom development in coastal and open ocean waters that the peak near 400 nm is mainly related to CDOM and turbidity in water bodies. For the Leizhou Peninsula, this statement has certain significance, but this study tends to attribute the visual effect to the strong absorption of the blue light band on the right side. A significant trough exists in the 400–440 nm wavelength range, which falls within the blue band of the visible spectrum. This indicates that this band is the primary absorption band for chlorophyll-a in blue light. The 455–577 nm range constitutes the blue-green band, where water reflectance is predominantly concentrated. A maximum peak near 570 nm occurs due to the combined effects of low absorption by phytoplankton photosynthetic pigments and increased backscattering caused by high suspended sediment concentrations in the coastal waters of Leizhou Peninsula (Gitelson et al., 1993). Additionally, the maximum reflection peak gradually shifts toward longer wavelengths (i.e., exhibits a “red shift phenomenon”) as suspended sediment concentrations increase (Lu, 2016). Taking Figure 4B as an example, stations with yellow curves (E9–E14) are at the top, those with blue curves (E28–E33) are in the middle, and those with purple curves (E36–E42) are at the bottom. To reduce errors, the average suspended sediment concentrations for these three groups of stations are calculated as 9.23 mg/L, 4.12 mg/L, and 3.71 mg/L, respectively. A less obvious secondary peak near 640 nm arises from the combined effects of chlorophyll absorption, scattering by inorganic suspended matter, and the scattering properties of water itself (Menken et al., 2006). A trough appears near 670 nm, corresponding to the maximum absorption band of chlorophyll-a in red light. Within the 680–700 nm wavelength range, a chlorophyll-a fluorescence peak occurs, whose intensity and position are influenced by phytoplankton reflectance and the exponential increase in water molecule absorption indices (Liu and Chao, 2019).
In terms of temporal distribution, the seasonal average mass concentration of chlorophyll-a in the Beibu Gulf is higher in summer and winter than in spring and autumn, thus the chlorophyll-a fluorescence peaks are more pronounced in summer and winter. In terms of spatial distribution, the average chlorophyll-a concentration in the inshore waters of the Beibu Gulf is relatively high, with high-value areas concentrated in the shallow waters along the western coast of Leizhou Peninsula in the northern part of the gulf, while low-value areas are located in the central and southern deep-water regions of the gulf. Therefore, the fluorescence peaks at inshore stations (with higher remote sensing reflectance curves) are more significant (Zhao et al., 2010).
In the inshore waters of Leizhou Peninsula, the suspended sediment concentration is relatively high in summer and exhibits bimodal characteristics, yet the overall remote sensing reflectance is not high. This may be the result of combined effects from factors such as uneven particle size distribution of suspended sediments, sediment types, water chlorophyll, and CDOM (Fan et al., 2007). Additionally, existing research has shown that spectral reflectance is significantly sensitive to the particle size distribution of suspended particles in water. Specifically, as the relative proportion of small-sized suspended particles (< 1µm) increases, the spectral reflectance of water correspondingly increases; conversely, when the relative proportion of large-sized particles (> 20µm) rises, spectral reflectance decreases (Forget et al., 1999).
At the 760 nm wavelength, oxygen exhibits strong absorption properties, causing a significant reduction in incident irradiance at this band when sunlight penetrates the atmosphere and enters water, forming a trough. Due to the absorption by various components in water, the water-leaving radiance reflectance valley at 760 nm is further deepened. Even after removing the influence of sky light, the obtained water-leaving radiance still shows a distinct reflectance valley feature at 760 nm (Wang et al., 2011). This feature has important applications in ocean color remote sensing, including serving as a key reference band for atmospheric correction, improving the accuracy of water quality parameter retrieval, evaluating remote sensing data quality, and assisting in identifying changes in water optical properties. Utilizing this characteristic can effectively distinguish different water body types, optimize remote sensing algorithm performance, and provide more reliable data support for marine environmental monitoring.
Typically, coastal waters near land have higher sediment and suspended particle concentrations, leading to higher water turbidity, which makes the bimodal characteristics of water remote sensing reflectance more prominent. This study shows that the first reflectance peak in the inshore waters of Leizhou Peninsula mainly appears around 570 nm, with a second reflectance peak in the 820–830 nm band. Notably, the intensity of the first reflectance peak in this study area is significantly higher than that of the second peak, indicating that although suspended sediments and sediment content exist in the inshore waters of Leizhou Peninsula, their overall concentrations are not extremely high (Ye, 2009). This phenomenon may be related to the geographical and hydrological characteristics of the inshore waters of Leizhou Peninsula. Suspended sediments in coastal areas mainly originate from terrestrial runoff and human activities, while deep-water areas, being far from terrestrial influences, have lower suspended sediment concentrations and clearer water. Furthermore, hydrodynamic conditions in this region, such as tides and ocean currents, help disperse and dilute suspended sediments, resulting in relatively low overall water turbidity.
In summary, this study not only reveals the seasonal variation patterns of water spectral characteristics in the inshore waters of Leizhou Peninsula but also provides important scientific evidence for a deeper understanding of the distribution and sources of suspended sediments in this region.
3.3 Comparative analysis of typical bays at the same latitude worldwide
To deeply analyze the spectral characteristics of the inshore waters of Leizhou Peninsula, this study compares their remote sensing reflectance with that of typical bays at the same latitude globally, dissects regional differences in spectral characteristics, and further reveals the uniqueness and general laws of their spectral properties.
This paper selects the Bay of Bengal, the Gulf of Thailand, the Gulf of Mexico, and the Arabian Gulf for comparative analysis, as detailed below:
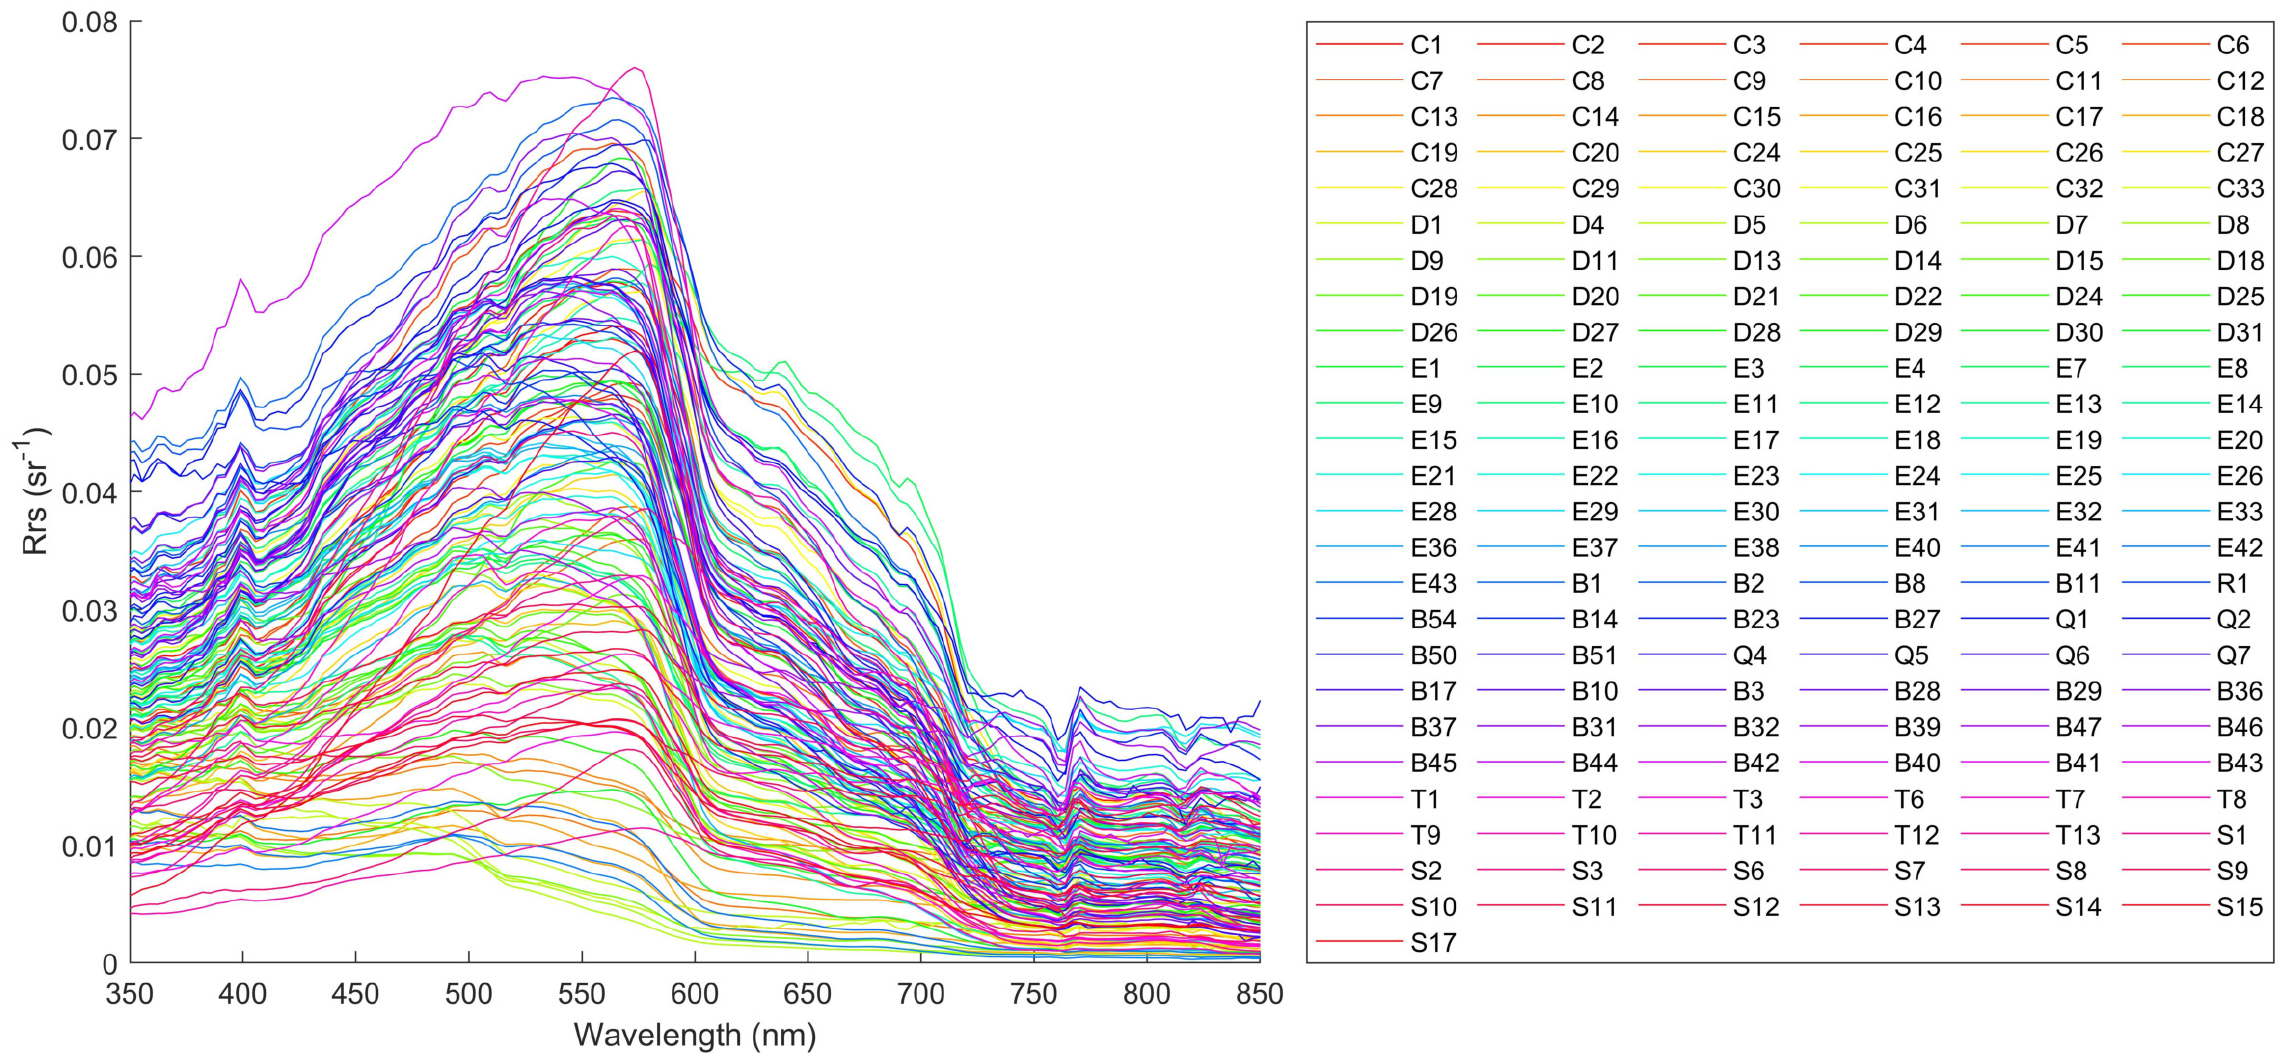
The spectroscopic measurements for the Bay of Bengal cover the visible light band (400–700 nm). Samples were collected by Latha et al (Latha et al., 2013). in March 2012 near the Godavari River estuary in the western Bay of Bengal (16°41.125′N–16°58.099′N; 82°23.425′E – 82°32.141′E), with remote sensing reflectance shown in Figure 6. A high reflectance peak at 570 nm indicates elevated chlorophyll concentrations nearby, a feature consistent with the inshore waters of Leizhou Peninsula. However, the Godavari River area exhibits low remote sensing reflectance values (below 0.02 Sr−1), attributed to the special environmental characteristics of the Bay of Bengal: the water depth in this region ranges from 10 to 150 meters, much deeper than the shallow coastal waters of Leizhou Peninsula, resulting in more significant light absorption by the water column; furthermore, as a semi-enclosed tropical basin, the Bay of Bengal is strongly influenced by seasonally reversing monsoons, forming a complex circulation system with limited water exchange, and in spring (March), basin-scale circulation gyres rapidly transport terrestrial materials and sediments from the Godavari Delta to deep sea areas, reducing the contribution of suspended particles to light scattering. The remote sensing reflectance displays a broad spectral peak, confirming high turbidity in this region. A narrow spectral peak occurs at the high chlorophyll-a concentration zone, and a chlorophyll-a fluorescence peak near 690 nm is observed—similar to Leizhou Peninsula’s inshore waters, though with less pronounced peak values and amplitudes.
Figure 6
Remote sensing reflectance curves in the Bay of Bengal (Latha et al., 2013).
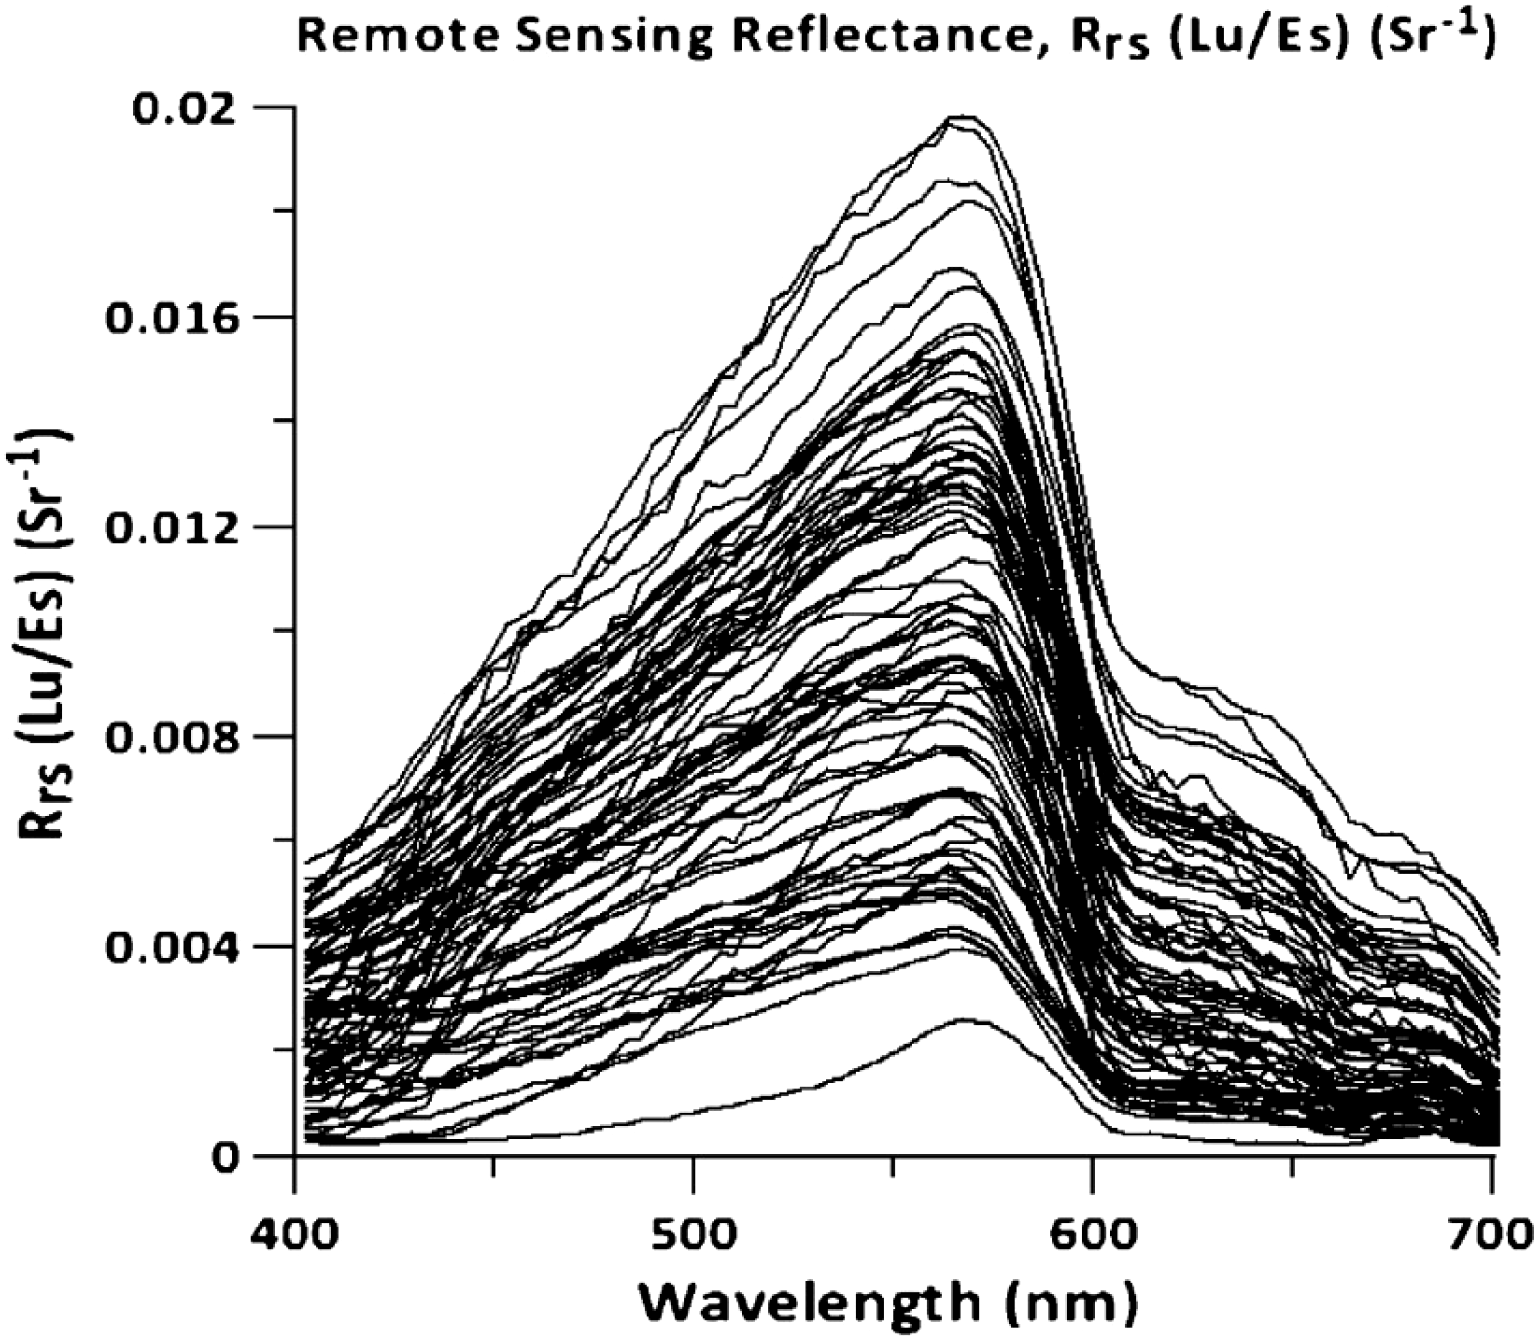
Mahasandana et al (Mahasandana et al., 2009). sampled the Bang Pakong River in Chonburi Province, northeastern Gulf of Thailand (13°24′N; 100°54′E), in May 2005, with remote sensing reflectance shown in Figure 7. The band range covers the visible light region (400–750 nm), featuring distinct reflectance curve characteristics: a peak at 570 nm (corresponding to point b in Figure 7), and troughs at 435 nm and 675 nm (points a and c, respectively). The 570 nm green band, a high-reflectance region, is strongly influenced by chlorophyll-a content; the 435 nm blue band and 675 nm red band correspond to chlorophyll-a’s maximum absorption zones, reflecting its spectral signature.
Figure 7
Remote sensing reflectance curves in the Gulf of Thailand (Mahasandana et al., 2009).
The Gulf of Thailand is a semi-enclosed shallow water bay with an average depth of only about 45 meters and a maximum depth not exceeding 80 meters, much shallower than the Bay of Bengal. This region receives large inputs of freshwater and nutrients from multiple rivers including the Chao Phraya River and Bang Pakong River. Combined with a relatively closed circulation system driven by monsoons, water renewal is slow, leading to significant eutrophication in coastal waters. Influenced by the southwest wind and coastal currents along the northern shoreline in the eastern part, chlorophyll-a gradually enriches along the gulf’s east coast, leading to high chlorophyll-a concentrations in May and pronounced chlorophylla maximum absorption bands. This combination of shallow water environment and high chlorophyll concentration is the main reason for its spectral characteristics being similar to but with more pronounced peaks and troughs than those of the Leizhou Peninsula’s inshore waters.
Leizhou Peninsula’s inshore waters share similar features, though the troughs at points a, c, and bimodal characteristics are less distinct than those in the Gulf of Thailand. The Gulf of Thailand’s remote sensing reflectance peak is slightly higher than that of Leizhou Peninsula’s inshore waters.
Gulf of Thailand data were collected using a portable spectrometer (Handy Lambda model, Multi-Band Spectral Co., Japan) with a wavelength resolution of 1 nm—lower than the 0.3 nm resolution of the spectrometer used in this study. While lower-resolution spectrometers struggle to identify fine spectral details and distinguish signals at adjacent wavelengths, they retain major spectral features, with an overall trend consistent with Leizhou Peninsula’s inshore waters.
Verma et al (Verma et al., 2021). conducted observations in April 2009 around Cape Hatteras in the northern Gulf of Mexico (27°N–31°N; 87°W–94°W), with remote sensing reflectance shown in Figure 8. The experiment covered the 300–800 nm band, comparing ship-borne sensor (HyperSAS and HyperPro) and MODIS Aqua (blue cross symbols) derived remote sensing reflectance at selected sites, including estuarine sites (C1, E1), inner shelf sites (UWS1, E3), mid-shelf sites (UWS2, A3), and open ocean sites (B4, C5).
Figure 8
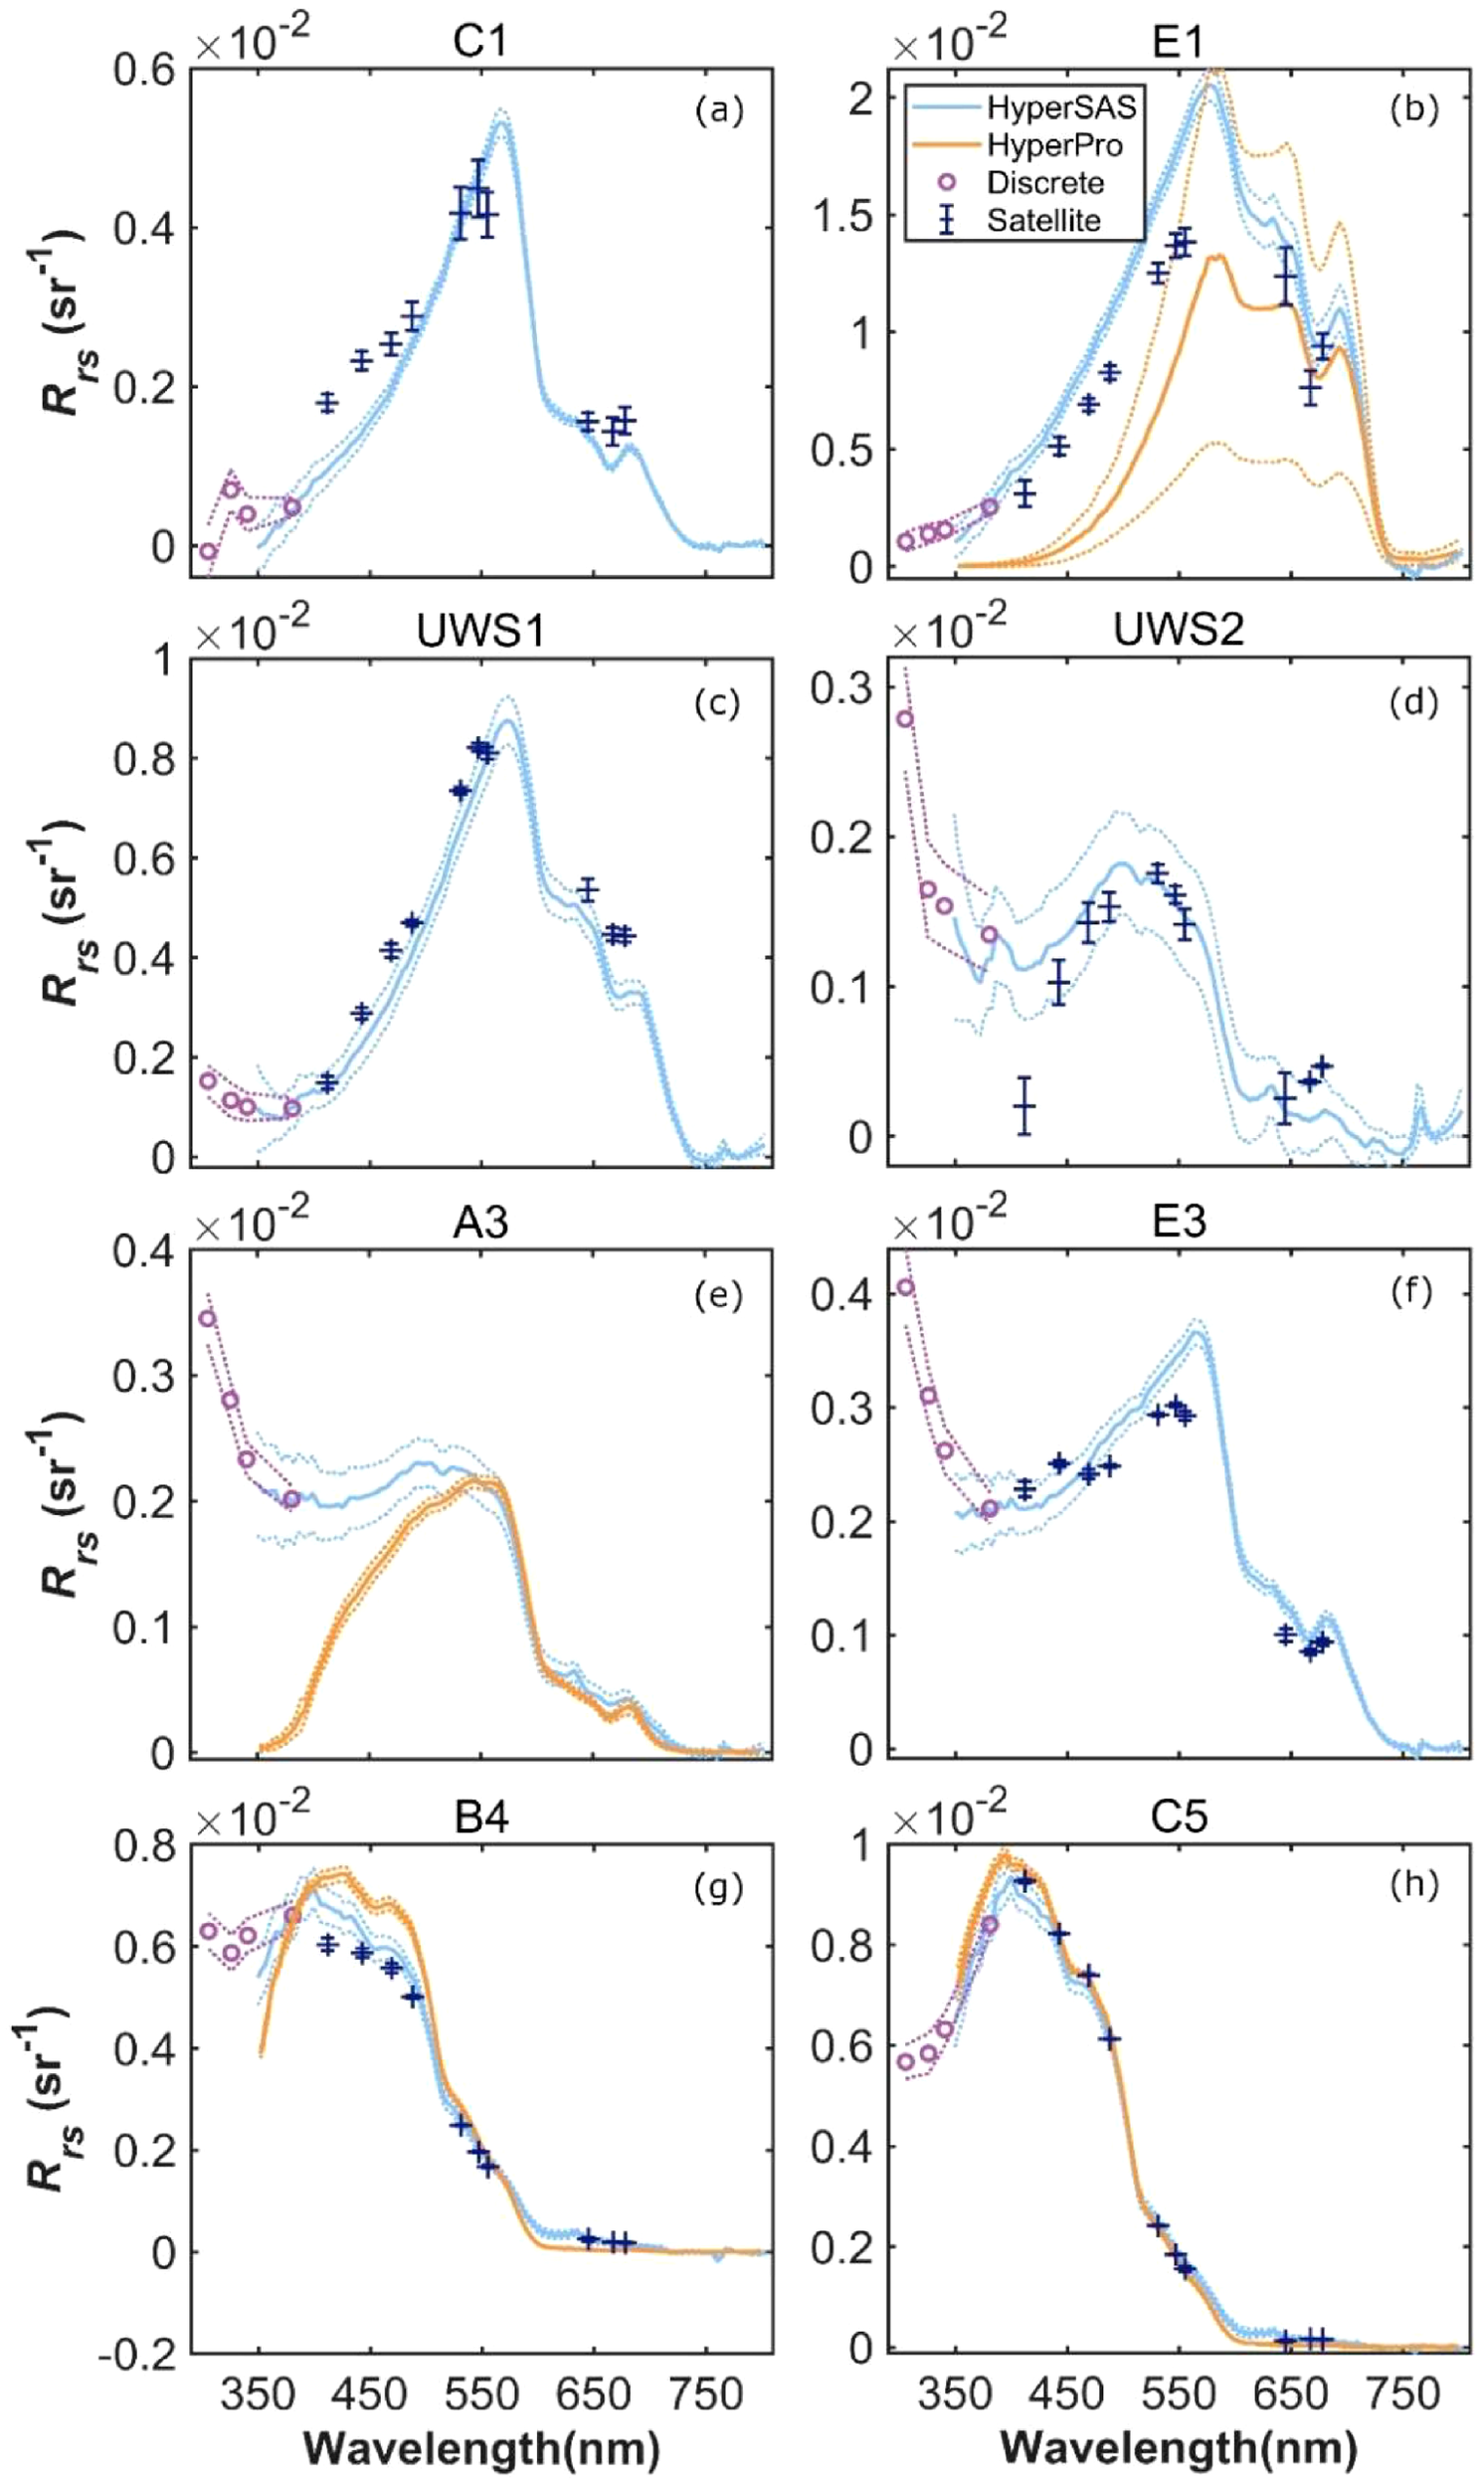
Remote sensing reflectance curves in the Gulf of Mexico (Verma et al., 2021): (a) estuarine station C1, (b) estuarine station E1, (c) inner shelf station UWS1, (d) mid-shelf station UWS2, (e) mid-shelf station A3, (f) inner shelf station E3, (g) open ocean station B4, and (h) open ocean station C5.
The Gulf of Mexico is a semi-enclosed large bay with water depths ranging from a few meters along the coast to over 3000 meters in the central basin, forming a distinct gradient from shallow to deep water. This region is strongly influenced by inputs from major rivers such as the Mississippi River and Atchafalaya River, with significant decreasing gradients of suspended matter and nutrients from coastal to offshore directions. Additionally, the Gulf of Mexico Loop Current, as a powerful western boundary current, together with local wind-driven circulation and mesoscale eddies, constitutes a complex hydrodynamic environment, resulting in distinct water color characteristics in different regions. This complex optical gradient from estuaries to open ocean makes the Gulf of Mexico an ideal location for validating water color remote sensing algorithms.
In terms of measurement consistency, estuarine and inner shelf sites showed overall agreement between HyperSAS and satellite remote sensing reflectance values. However, at site E1, HyperPro values were low and highly variable, likely due to its location within the Atchafalaya River plume, where surface water transparency is high and suspended matter concentration is low; complex vertical gradients and optical properties increased measurement difficulty for HyperPro.
Regarding reflectance differences at different wavelengths, mid-shelf sites exhibited HyperSAS remote sensing reflectance values often higher than MODIS Aqua or HyperPro below 500 nm. Discrete wavelength measurements at mid- and inner-shelf sites increased with decreasing wavelength in the ultraviolet region. At open ocean sites, all measurement methods showed good overall consistency across all wavelength ranges.
In the study of Leizhou Peninsula’s inshore waters, this research focuses on comparing remote sensing reflectance data from different cruises with Sentinel-3 OLCI product data to explore spectral characteristics. Results show that Leizhou Peninsula’s inshore waters exhibit specific reflectance features across different bands, with key wavelengths and corresponding characteristics differing from those in the Gulf of Mexico.
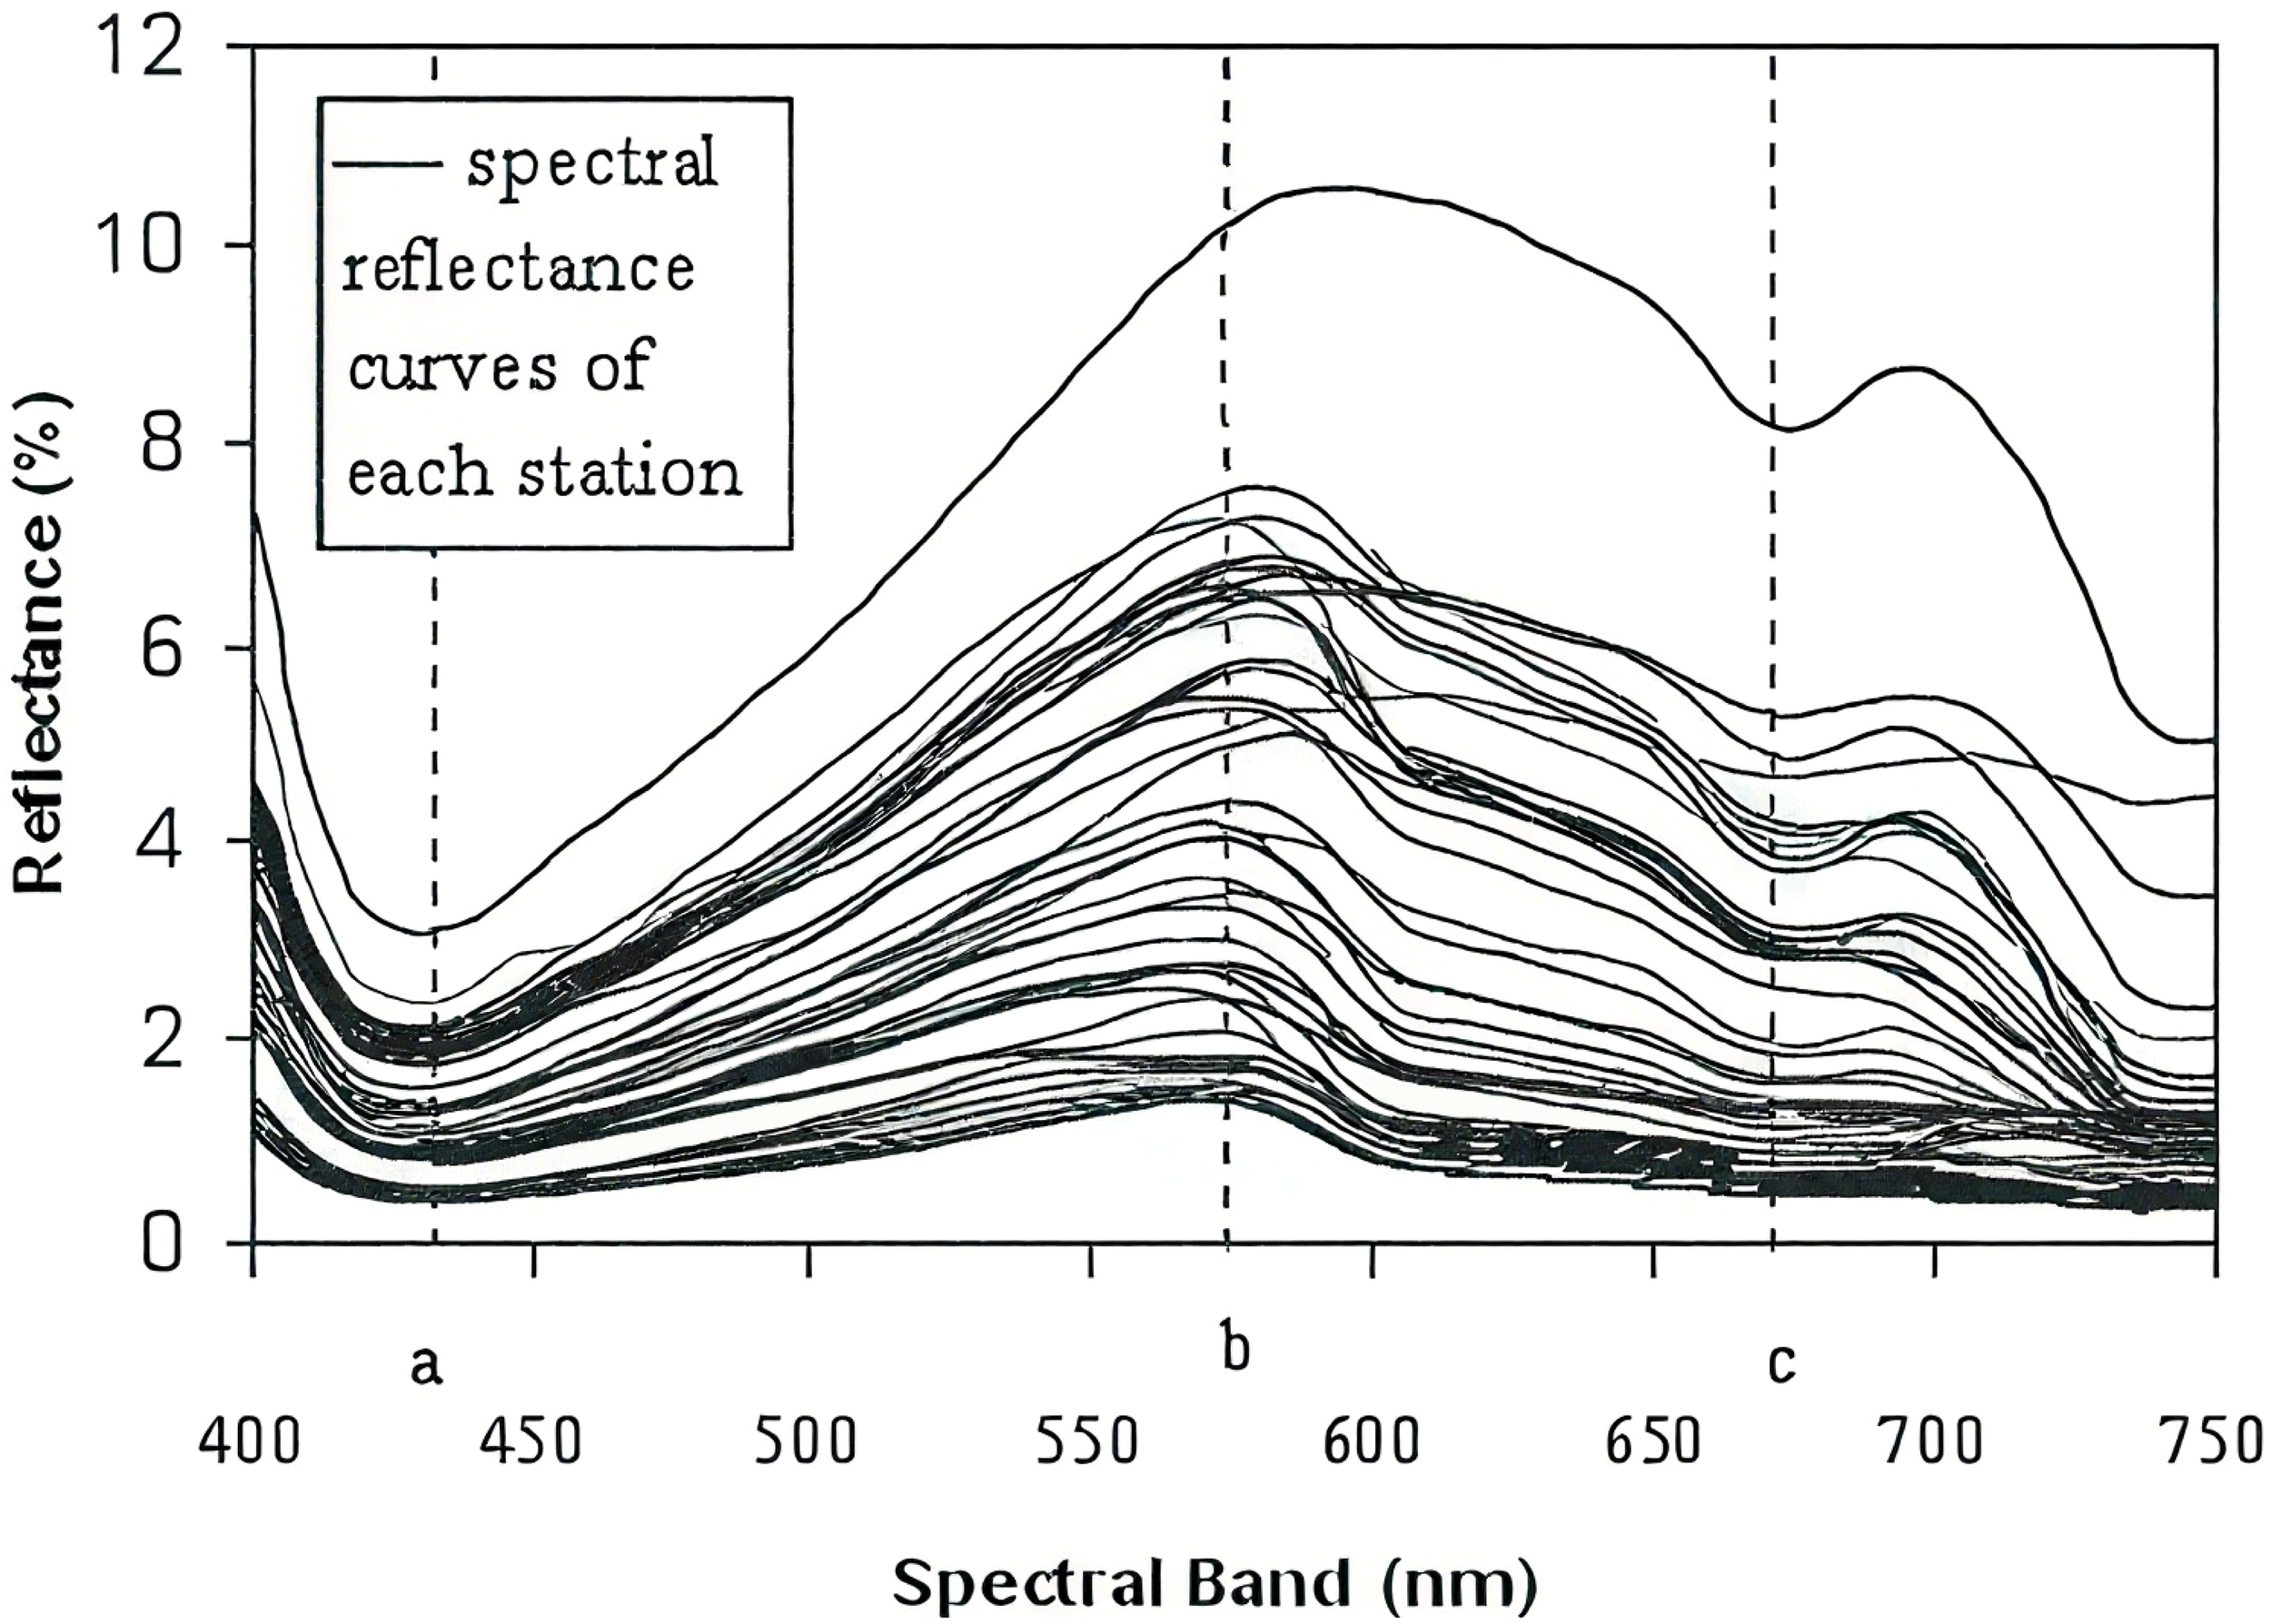
Al Shehhi et al (Al Shehhi et al., 2017). conducted field measurements in the Arabian Gulf (23°N–27°N; 51°E–57°E) from 2013 to 2016, studying the spatiotemporal variation of water spectra between 400 nm and 800 nm, with hyperspectral reflectance maps shown in Figure 9.
Figure 9
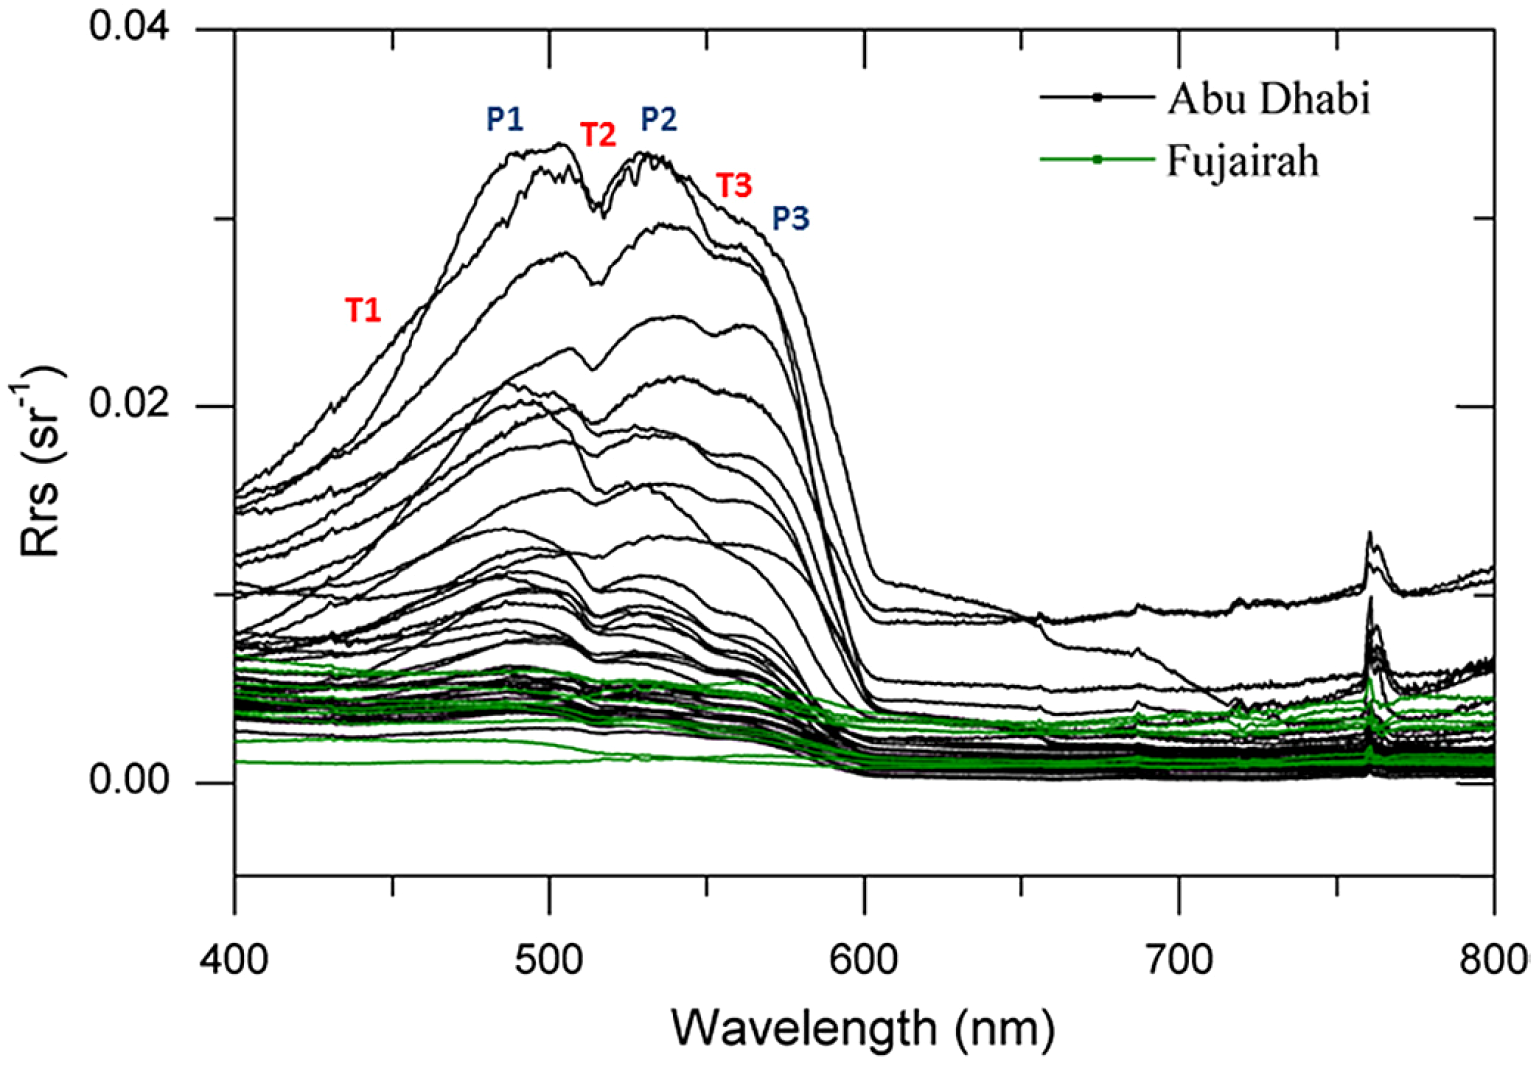
Remote sensing reflectance curves in the Arabian Gulf (Al Shehhi et al., 2017).
The Arabian Gulf is a semi-enclosed shallow water bay with an average depth of only about 35 meters and a maximum depth of about 90 meters, making it one of the shallowest marginal seas globally. Located in a tropical arid climate zone, it experiences intense evaporation and scarce precipitation, resulting in abnormally high seawater salinity averaging over 40‰, far exceeding the global ocean average. Limited water exchange, coupled with developed petroleum industries and accelerated urbanization in the surrounding areas, leads to high nutrient levels in coastal waters. The Arabian Gulf is also affected by seasonal dust storms, with large amounts of terrestrial material input into the ocean. Combined with shallow water environments causing frequent sediment resuspension, these factors create extremely complex water optical properties with obvious seasonal differences. These unique environmental conditions collectively shape its special spectral reflection characteristics.
Reflectance is higher below 600 nm and lower above 600 nm, with strong water absorption at 600 nm. This is influenced by topographic differences (e.g., water depth), as well as algae (chlorophyll-a) and non-algal water components (sediments, CDOM—colored dissolved organic matter).
Regarding spectral peaks/troughs and chlorophyll-a relationships: Peak P1 decreases with increasing chlorophyll-a; the 530–540 nm peak (P2) is caused by low chlorophyll-a and pigment absorption; peaks at 560–570 nm (P3), 677 nm, 687 nm (when chlorophyll-a > 2 mg/L), and 760 nm are induced by chlorophyll-a increases or its fluorescence. Troughs at 517–520 nm (T2), caused by water absorption, show a strong negative correlation with chlorophyll-a concentration; the 551–555 nm trough (T3) is primarily due to chlorophyll-a and pigment absorption.
Menon et al (Menon et al., 2006). studied the diffuse attenuation coefficient of downwelling irradiance, showing that 90% of light is absorbed by CDOM in northern coastal waters, 75% in northern and southern coastal waters, and 15% by chlorophyll-a. Coastal waters have chlorophyll-a and sediment concentrations roughly twice those of other regions, with blue light absorbed by both CDOM and suspended particles. Except for coastal areas, most sites have greater water depth, contributing to lower remote sensing reflectance values.
Comparing Leizhou Peninsula’s inshore waters with the Arabian Gulf, their overall spectral reflectance curves show similarities in the 450–550 nm range. Given previous research on chlorophyll-a’s critical role in water spectral characteristics, this similarity is likely related to chlorophyll-a.
Combining existing data, a statistical comparison of typical global bays at the same latitude is now presented, as shown in Table 3.
Table 3
| Characteristic | Leizhou Peninsula inshore waters | Bengal Bay | Gulf of Thailand | Gulf of Mexico | Arabian Gulf |
|---|---|---|---|---|---|
| First backscattering peak | 570 nm | 570 nm | 570 nm | 560 nm, 500–550 nm, 400 nm (moving from estuary to open ocean) |
480–540 nm |
| Peak value of first reflectance peak | 0.07 Sr−1 | 0.02 Sr−1 | 0.08 Sr−1 | 0.015 Sr−1, 0.002 Sr−1, 0.008 Sr−1 |
0.034 Sr−1 |
| Chlorophyll-a fluorescence peak | 680–700 nm | 690 nm | 700 nm | 680 nm | 760 nm |
| Peak value of fluorescence peak | 0.014 Sr−1 | 0.004 Sr−1 | 0.04 Sr−1 | 0.4 Sr−1, 0.2 Sr−1, 0.05 Sr−1 |
0.01 Sr−1 |
Main characteristic differences among different gulfs.
3.4 Spectral types of coastal waters off the Leizhou Peninsula
Using the quantile statistical method based on mean and standard deviation as an example in this paper, the classification of coastal water data off the Leizhou Peninsula is conducted. The performances of the four cruises are shown in Figure 10, with detailed information listed in Table 4.
Figure 10
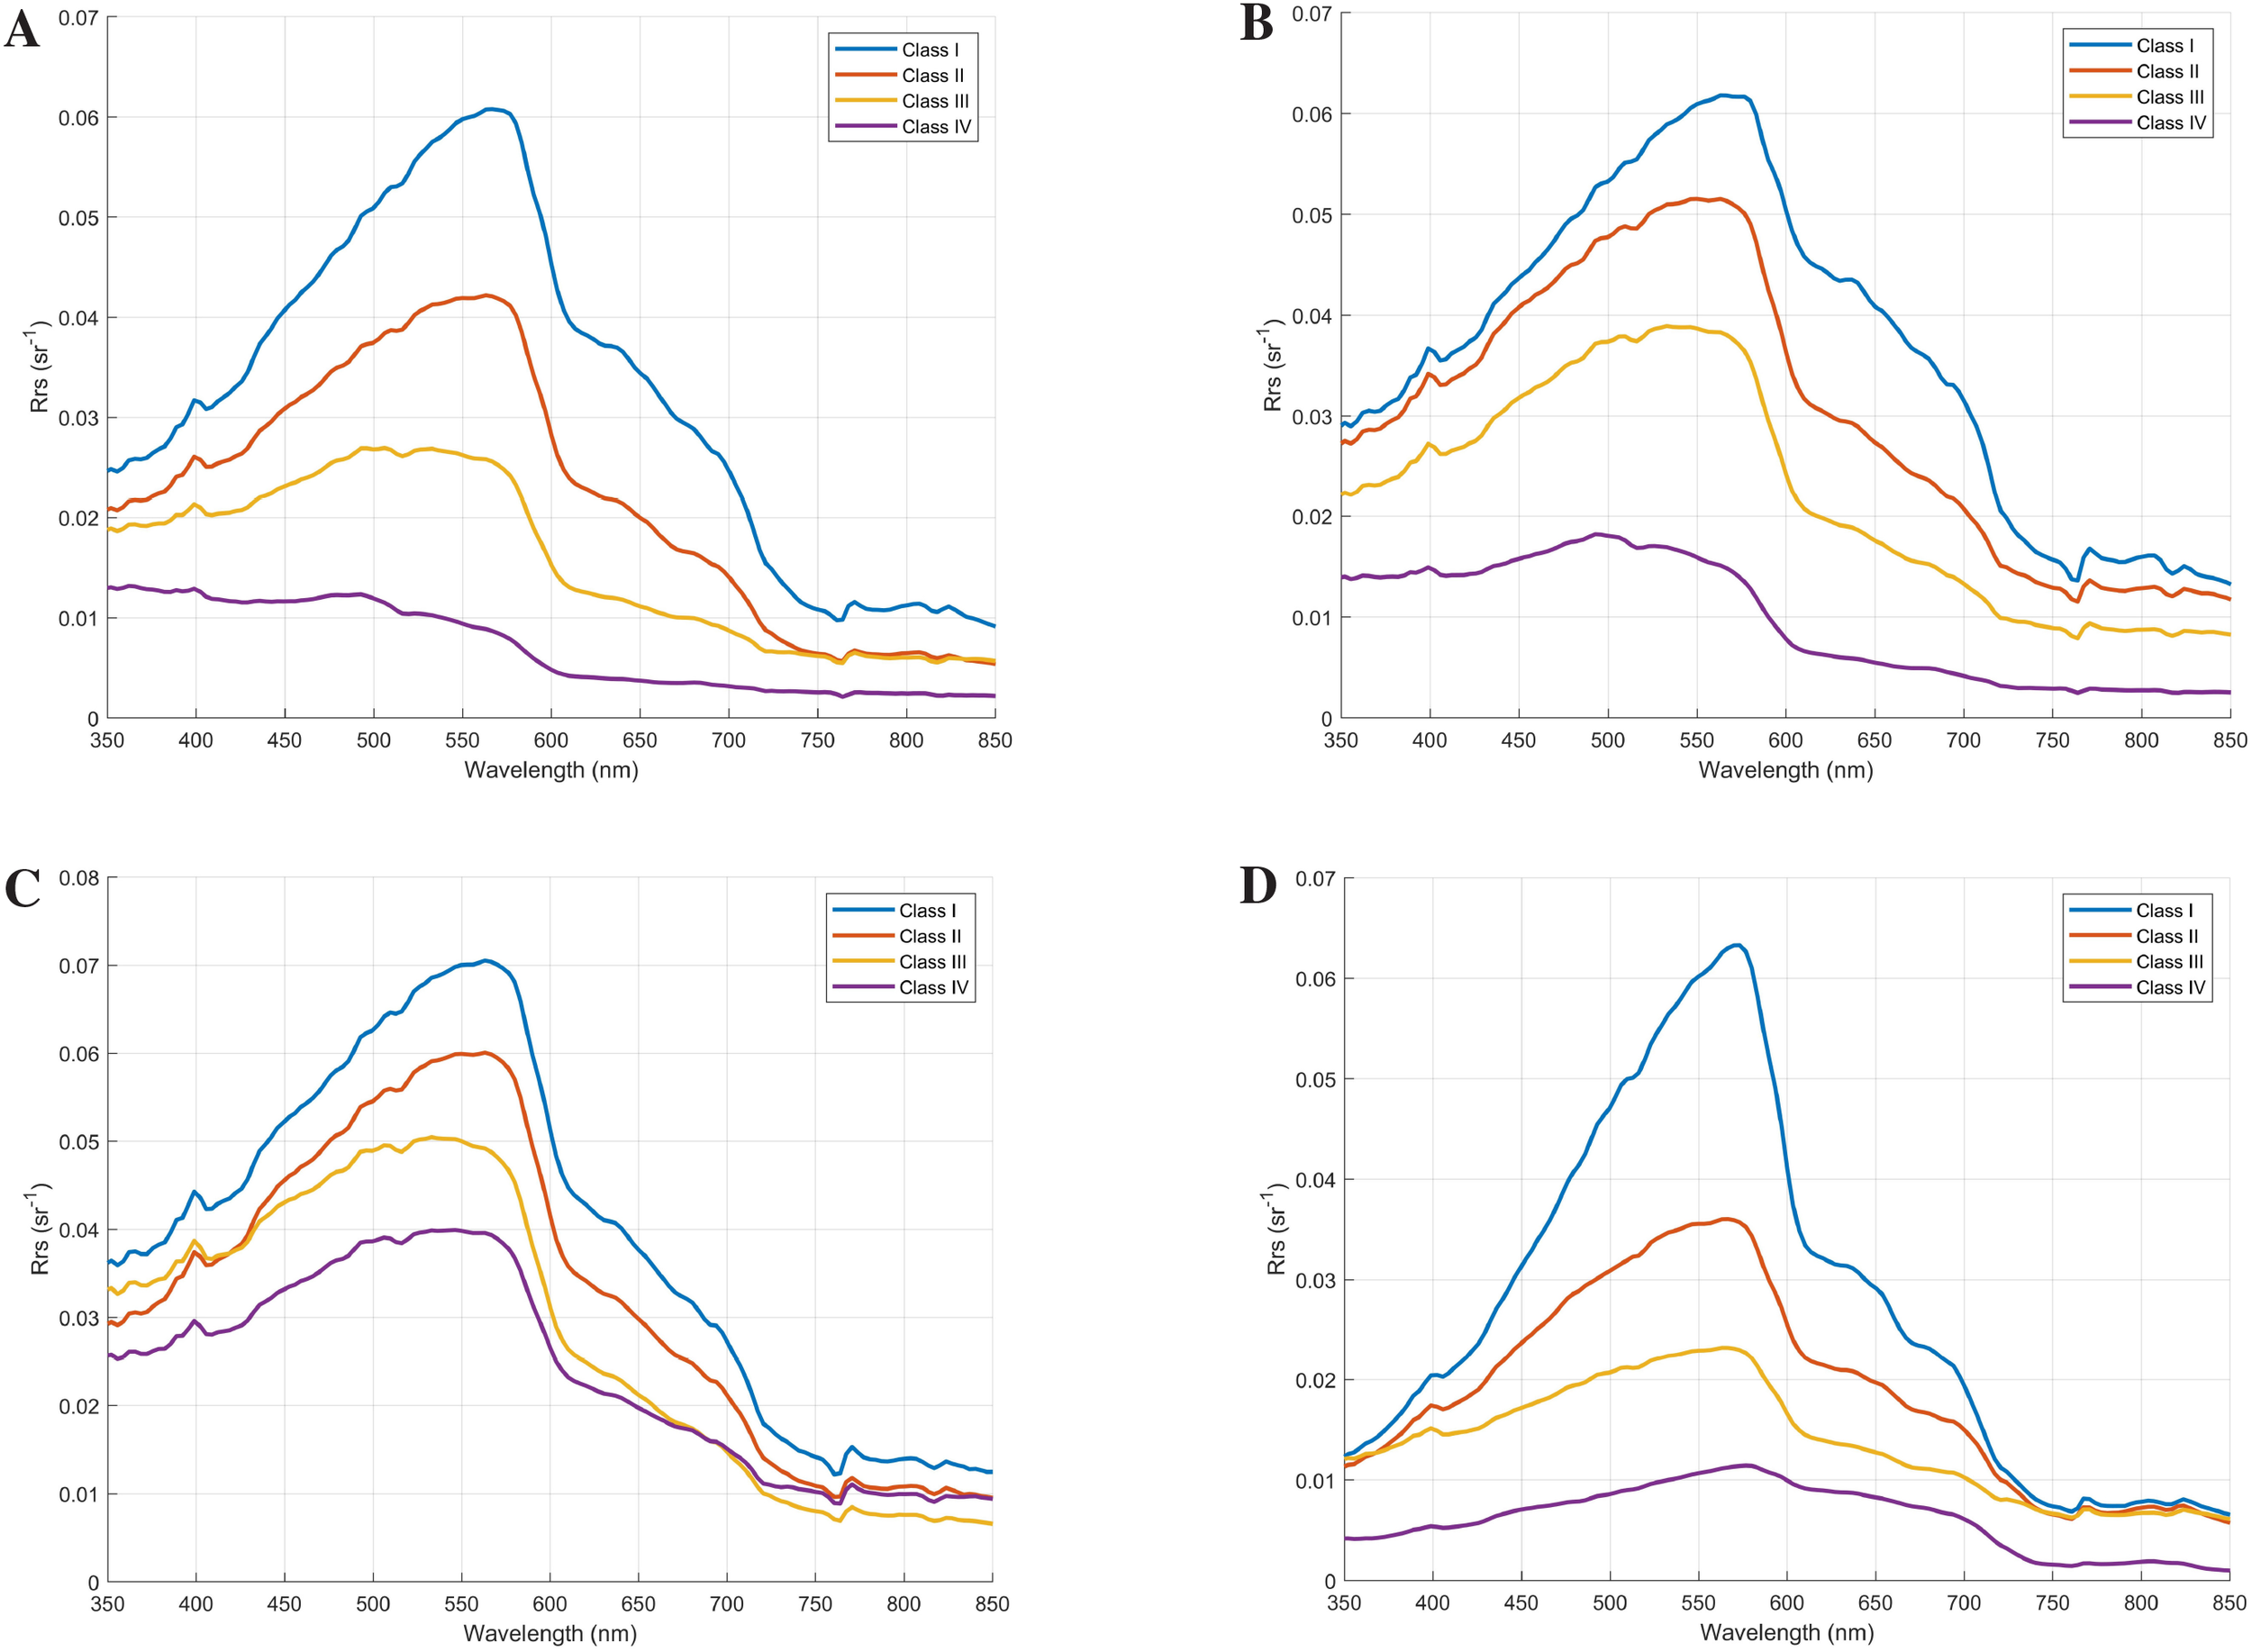
(A) Spectral types of the coastal waters off the Leizhou Peninsula in 2020; (B) Spectral types of the coastal waters off the Leizhou Peninsula in 2021; (C) Spectral types of the coastal waters off the Leizhou Peninsula in 2022; (D) Spectral types of the coastal waters off the Leizhou Peninsula in 2024.
Table 4
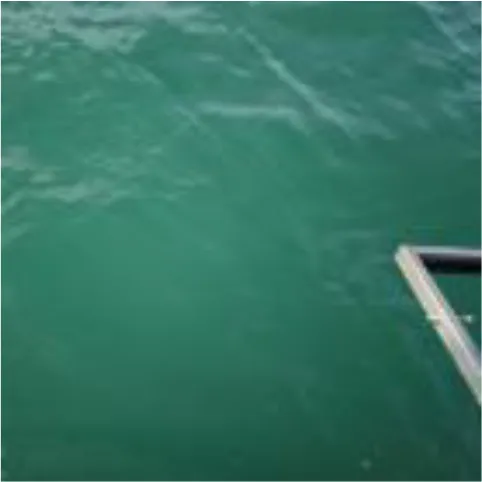
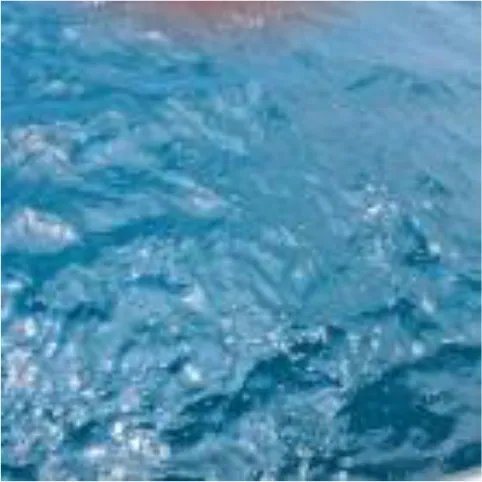
| Measured sea water image | Type | 2020 autumn classification | 2021 spring classification | 2022 winter classification | 2024 summer classification | Total voyage statistics after classification |
|---|---|---|---|---|---|---|
|
Type I | 10 | 6 | 7 | 4 | 26 |
|
Type II | 16 | 13 | 12 | 6 | 53 |
|
Type III | 17 | 13 | 11 | 14 | 42 |
|
Type IV | 11 | 5 | 5 | 1 | 30 |
Statistics of the number of categories after classification for each cruise.
Finally, combining the total remote sensing reflectance data from the four cruises in the coastal waters off the Leizhou Peninsula, the types are classified using the quantile statistical method and then statistically analyzed, resulting in four main types, as shown in Figure 11. The detailed descriptions of each type are as follows:
Figure 11
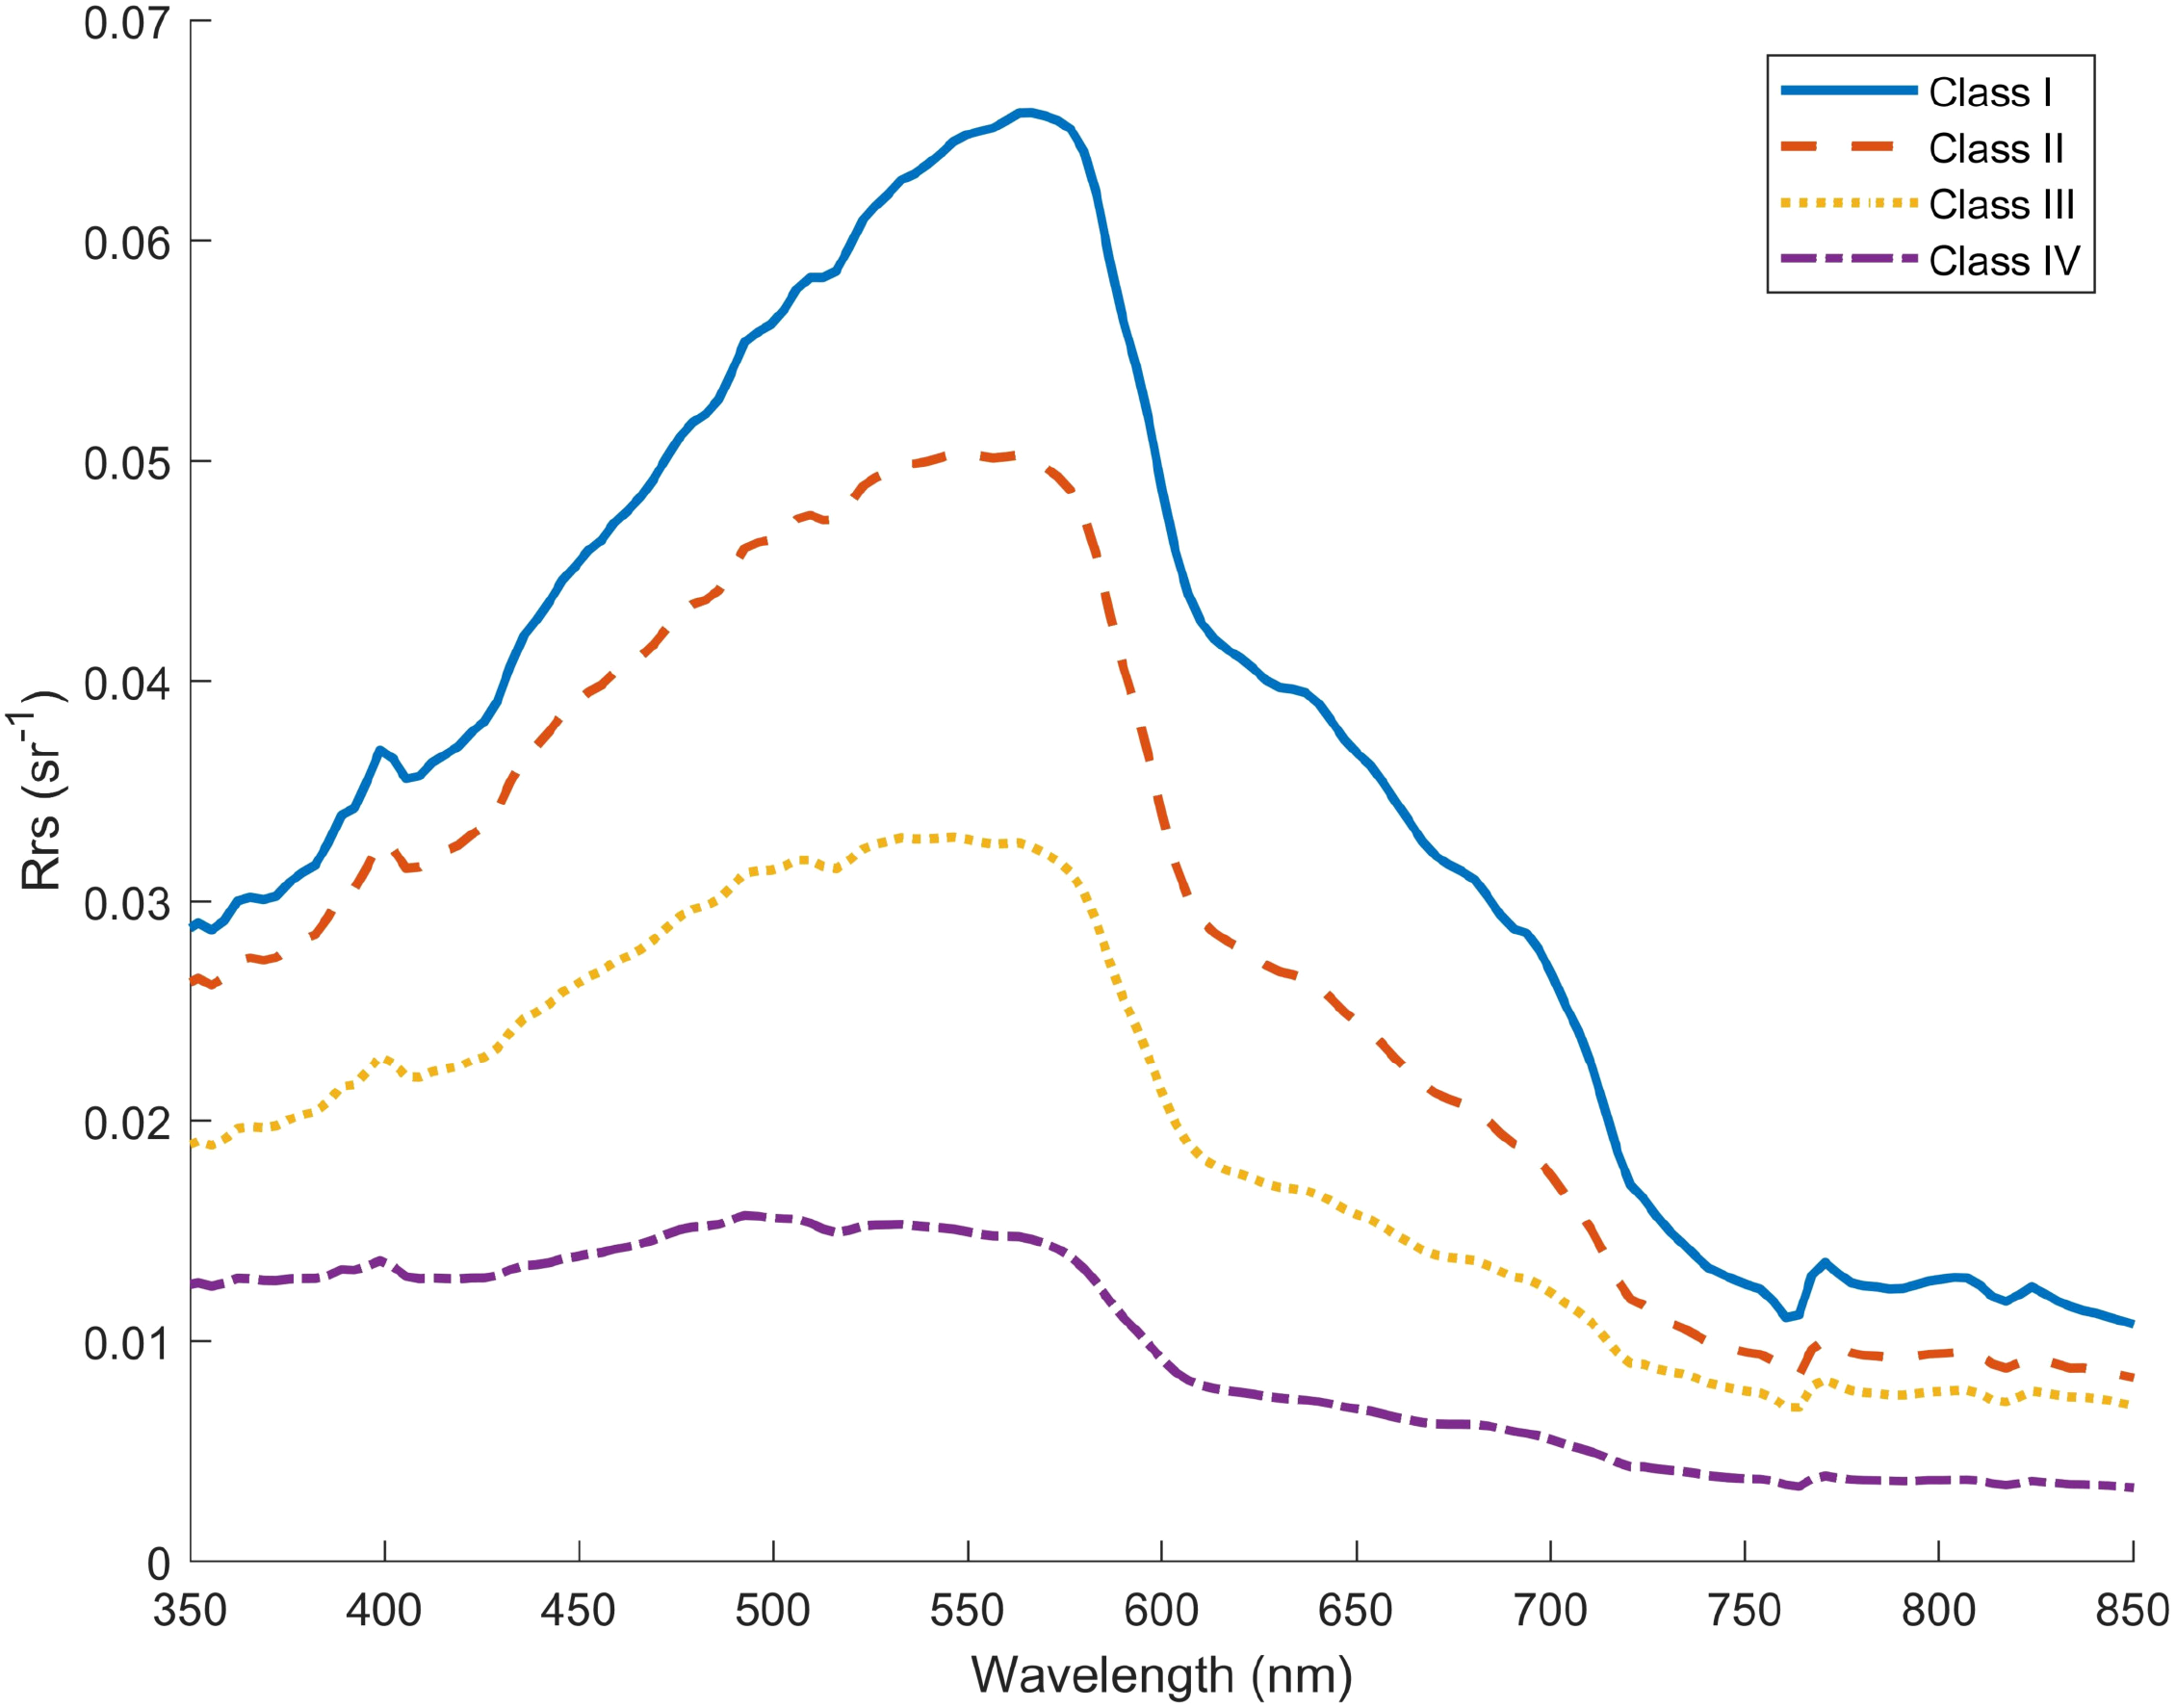
Four spectral types in the coastal waters of the Leizhou Peninsula.
Type I: The remote sensing reflectance is generally high with a narrow peak region. The maximum backscattering peak mostly occurs in the 570 nm band, and a second reflection peak appears at 810 nm due to the backscattering effect of suspended matter. Stations of this type are mainly distributed in nearshore areas such as Leizhou Bay and the Qiongzhou Strait. Extensive active dune shoals in the eastern waters of the Leizhou Peninsula provide a large amount of suspended matter, while the strong tidal currents at the east entrance of the Qiongzhou Strait significantly increase and fluctuate the concentration of suspended matter, forming a trend extending from high-value to low-value areas (Chen et al., 2012a). This spectral type is consistent with Type D proposed by Ye (Ye, 2017) in the study of Yellow Sea waters, characterized by suspended sediment-dominated spectral changes, belonging to typical Case II waters, corresponding to the spectral types of estuarine stations in the Bay of Bengal, the Gulf of Thailand, and the Gulf of Mexico.
Type II: This type is mainly characterized by a relatively wide wave peak. The maximum backscattering peak is between 540 nm and 560 nm. The fluctuation amplitude of the second reflection peak is not obvious. The remote sensing reflectance decreases rapidly as the wavelength increases. It is mainly distributed in the middle sea area that extends outward from the nearshore waters around the Leizhou Peninsula and Hainan Island. It lies between the ultra-high suspended sediment water bodies and the mixed transitional water bodies. Its spectral characteristics are similar to Type 2 in the classification of water color spectra of the Bohai Sea and the northern Yellow Sea conducted by Zhou (Zhou et al., 2005) and his colleagues, and are also analogous to the mid-shelf station A3 in the Gulf of Mexico.
Type III: The primary feature is a gentle peak in the remote sensing reflectance spectrum between 500–570 nm. Influenced by backscattering, it significantly affects the spectral shape, with low suspended sediment concentration. It is mainly distributed in offshore areas far from the Leizhou Peninsula, around the 1.5 contour line dividing Case I and Case II waters. Belonging to Type C proposed by Huping Ye in the study of Yellow Sea waters, it is a mixed transitional type, similar to the mid-shelf station UWS2 in the Gulf of Mexico and characteristics of the Arabian Gulf.
Type IV: The spectral characteristics show gentle changes, with the overall remote sensing reflectance gradually decreasing as the wavelength increases. The spectral curve has insignificant fluctuations, approximating a nearly horizontal but slightly inclined straight line, with a gentle peak near 480 nm. It is roughly distributed in waters far from the coast of the Leizhou Peninsula. This type is similar to Type d in IOCCG Report 3 (Sathyendranath, 2000), Type 4 by Liangming Zhou, and Type A by Huping Ye, approaching oceanic Case I waters, corresponding to the spectral characteristics of the open ocean station B4 in the Gulf of Mexico and the Arabian Gulf.
The type to which each measured station belongs represents the water distribution in adjacent sea areas. Based on this, the Geostatistical Analyst module in ArcGIS software was used to create the map through the built-in Kriging interpolation method, as shown in Figure 12. The Kriging interpolation method was chosen mainly for its significant advantages in marine water color spatial analysis, as it considers spatial correlation and anisotropic characteristics between sampling points, quantifies spatial structure through variogram models, and achieves optimal linear unbiased estimation. For sea areas with uneven station distribution, this study effectively optimized the interpolation results by properly setting search radius and neighborhood point numbers, selecting variogram models suitable for marine environments, and validating with remote sensing data. These approaches ensured the spatial expression accuracy of the water type distribution map, providing a reliable spatial analysis foundation for water body type distribution in the coastal waters of Leizhou Peninsula.
Figure 12
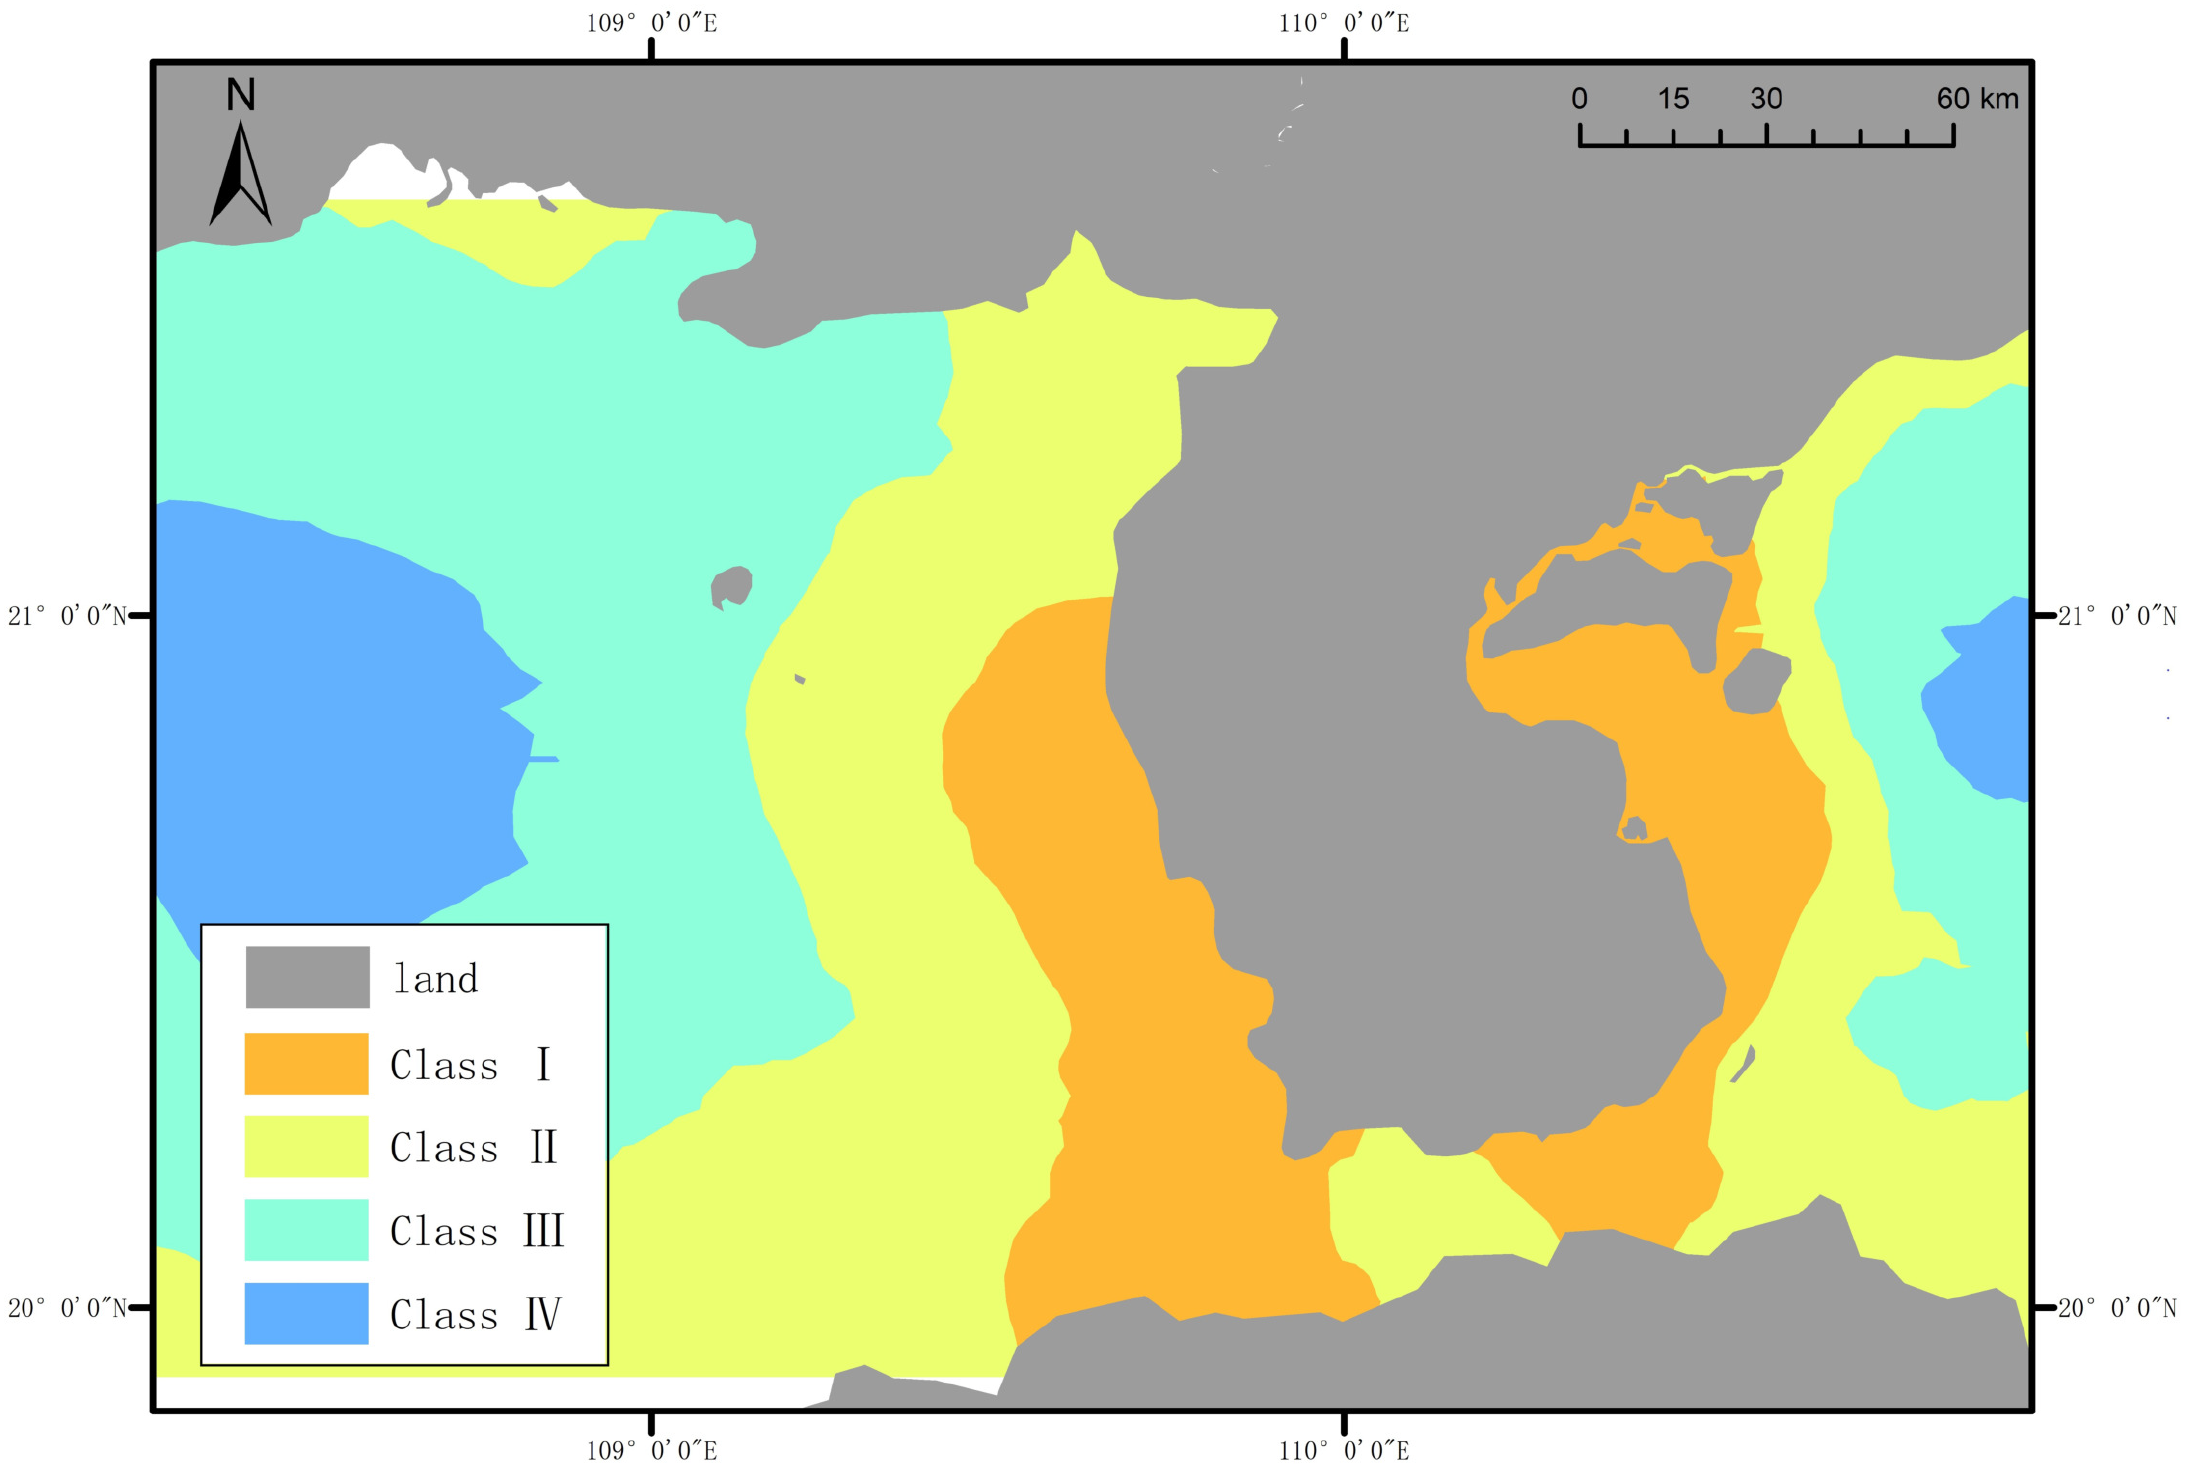
Classification interpolation map of the coastal waters off the Leizhou Peninsula.
The proportions of each type in the total station measurement data are as follows: Type I accounts for 17.22%, Type II accounts for 35.10%, Type III accounts for 27.81%, and Type IV accounts for 19.87%. Although the proportional distribution is affected by the selection of stations, it still indicates that the coastal waters off the Leizhou Peninsula have complex components, dominated by mixed transitional waters transitioning from turbid to clean waters, with a greater tendency toward turbidity.
4 Discussion
The existing spectral classification methods for inshore waters mainly suffer from three deficiencies: strong subjectivity due to reliance on manual annotation or threshold setting, poor adaptability due to strict assumptions on data distribution, and lack of cross-scale applicability due to inadequate consideration of regional differences. In contrast, the quantile statistical method proposed in this study automatically divides thresholds by calculating the mean (Mean) and standard deviation (SD) of the maximum values of spectral curves, eliminating human intervention. The mean reflects the central tendency of data, while the SD characterizes the degree of dispersion, and their combination quantifies the variation amplitude of spectral features. This method does not depend on data distribution assumptions and can adaptively adjust classification boundaries. The application of this method in the Leizhou Peninsula demonstrates that it not only eliminates the subjectivity of manual thresholds but also enhances the interpretability of classification results through statistical quantification.
In the future, integrating multi-source remote sensing data (such as MODIS, VIIRS, and Sentinel-3) to build a global spectral classification database for inshore waters will be particularly suitable for estuaries and aquaculture areas strongly affected by human activities, providing standardized tools for defining marine ecological security boundaries. Recent studies using Sentinel-3 OLCI data and in-situ measurements in the Sundarbans estuary system have shown high correlations between satellite data and field measurements, demonstrating its advantages (Mondal et al., 2025). These encouraging results further support the potential for developing comprehensive spectral libraries for global coastal environmental monitoring.
5 Conclusions
Based on the preceding analysis, the conclusions are summarized as follows:
-
Using data from 188 stations measured in four cruises, Case I and Case II waters were roughly classified, presenting the distribution of water types from 2020 to 2024. Case II waters are widely distributed, consistent with the suspended sediment concentration at the measured stations, mainly
-
in the coastal areas on both the eastern and western sides of the Leizhou Peninsula, the waters above Beihai City, and the vicinity of the Qiongzhou Strait.
-
The coastal waters off the Leizhou Peninsula exhibit complex structures and diverse spectral types, with coexisting Case I and Case II waters. The 400 nm peak is generated by the joint influence of CDOM and turbidity. The 400–440 nm band is the maximum absorption band of chlorophyll-a for blue light, while the 455–577 nm blue-green band is the concentrated region of water reflectance. The first reflection peak mostly occurs around 570 nm. The 670 nm band is the maximum absorption band of chlorophyll-a for red light, with a chlorophyll-a fluorescence peak appearing at 680–700 nm. Strong oxygen absorption occurs at 760 nm, and a second reflection peak emerges at 820–830 nm. The chlorophyll-a fluorescence peaks are more distinct and intense in summer and winter, while spectral types show higher consistency in spring and autumn.
-
Comparing the spectral characteristics of four typical bays at the same latitude globally, all share similar features with the coastal waters off the Leizhou Peninsula. The overall remote sensing reflectance curve of the Bay of Bengal is highly similar; the maximum chlorophyll-a absorption band in the Gulf of Thailand matches exactly; stations in the Gulf of Mexico are widely distributed with diverse spectral types, showing multiple similarities despite differences; and the overall spectral characteristics of the Arabian Gulf are consistent with Type III in the coastal waters off the Leizhou Peninsula.
-
Using the quantile statistical method based on mean and standard deviation, combined with the classification of remote sensing data from four cruises in the coastal waters off the Leizhou Peninsula, four main spectral types were identified. Type I: Characterized by high reflectance and a narrow peak region, with the maximum peak close to 570 nm; Type II: Features a broad peak, with the maximum peak occurring in the 540–560 nm range; Type III: Exhibits a gentle remote sensing reflectance spectrum distributed across the 500–570 nm range; Type IV: Displays minimal fluctuations in the spectral curve, with reflectance gradually decreasing as the wavelength increases and a peak around 500 nm.
The water composition in this sea area is complex, dominated by Type II and Type III, which are transitional types from turbid to clean waters, with an overall tendency toward turbidity.
The research results have significant practical applications in marine environmental monitoring and resource management. The spectral classification approach and water type distribution maps can be directly applied to: coastal water quality dynamic monitoring and early warning systems; suitability assessment and environmental capacity calculation for aquaculture areas; early identification and diffusion simulation of harmful algal blooms such as red tides and green tides; scientific basis for marine functional zoning and ecological redline delineation; and estimation of land-based pollutant discharge fluxes and environmental impact assessment, thus providing comprehensive decision-making support for marine ecological protection and sustainable management.
However, we must candidly acknowledge the current research limitations, particularly regarding the limited dataset. Although our in-situ measurements are sufficient for preliminary analysis in terms of spatial and temporal coverage, expanding the sampling scope would better represent seasonal and geographical variations across the study area. For future research directions, we will increase the number of sampling points to enhance spatial resolution and statistical robustness; incorporate deep learning and other methods for more sophisticated pattern recognition and prediction modeling; integrate multi-platform remote sensing data to overcome single-sensor limitations; and develop standardized spectral libraries specific to the unique characteristics of the Leizhou Peninsula coastal waters to improve classification accuracy and applicability to other similar ecosystems.
Statements
Data availability statement
The raw data supporting the conclusions of this article will be made available by the authors, without undue reservation.
Author contributions
YL: Data curation, Formal Analysis, Investigation, Visualization, Writing – original draft, Writing – review & editing. XC: Investigation, Supervision, Writing – review & editing. FG: Writing – review & editing. XS: Investigation, Methodology, Software, Writing – review & editing. ZC: Investigation, Methodology, Writing – review & editing. DF: Conceptualization, Funding acquisition, Supervision, Writing – review & editing. DL: Funding acquisition, Project administration, Writing – review & editing.
Funding
The author(s) declare financial support was received for the research and/or publication of this article. This research was supported by the Scientific Research Start-up Fund of Guangdong Ocean University (Grant No. 060302102304), the National Key Research and Development Program of China (Grant No. 2022YFC3103101), the Key Special Project for Introduced Talent Teams of the Southern Marine Science and Engineering Guangdong Laboratory (Grant No. GML2021GD0809), the National Natural Science Foundation of China (Grant No. 42206187), and the Key Project of the Guangdong Provincial Department of Education (Grant No. 2023ZDZX4009).
Acknowledgments
Thank our supervisor and classmates for their assistance in this study.
Conflict of interest
The authors declare that the research was conducted in the absence of any commercial or financial relationships that could be construed as a potential conflict of interest.
Generative AI statement
The author(s) declare that no Generative AI was used in the creation of this manuscript.
Any alternative text (alt text) provided alongside figures in this article has been generated by Frontiers with the support of artificial intelligence and reasonable efforts have been made to ensure accuracy, including review by the authors wherever possible. If you identify any issues, please contact us.
Publisher’s note
All claims expressed in this article are solely those of the authors and do not necessarily represent those of their affiliated organizations, or those of the publisher, the editors and the reviewers. Any product that may be evaluated in this article, or claim that may be made by its manufacturer, is not guaranteed or endorsed by the publisher.
References
1
Al Shehhi M. R. Gherboudj I. Ghedira H. (2017). In situ spectral response of the arabian gulf and sea of Oman coastal waters to bio-optical properties. J. Photochem. Photobiol. B: Biol.175, 235–243. doi: 10.1016/j.jphotobiol.2017.09.007
2
Bar A. R. Mondal I. Das S. Biswas B. Samanta S. Jose F. et al . (2023). Mapping of tidedominated hooghly estuary water quality parameters using sentinel-3 olci time-series data. Environ. Monit. Assess.195, 975. doi: 10.1007/s10661-023-11552-8
3
Bi Y. Wen X. Zhao P. Wang Y. Diao M. (2012). Research on the model of land-based water pollution load in the coastal zone. Yellow River34, 68–70. doi: 10.3969/j.issn.1000-1379.2012.07.022
4
Blondeau-Patissier D. Gower J. F. Dekker A. G. Phinn S. R. Brando V. E. (2014). A review of ocean color remote sensing methods and statistical techniques for the detection, mapping and analysis of phytoplankton blooms in coastal and open oceans. Prog. oceanography123, 123–144. doi: 10.1016/j.pocean.2013.12.008
5
Chen Q. Tang J. Wang X. Ren H. (1999). In - situ measurement and data analysis of water spectral characteristics in the east China sea test area. Ocean Technol.18, 25–37.
6
Chen L. Xu D. Li T. (2012a). Analysis of the characteristics of suspended sediment concentration and seawater turbidity in the western guangdong and northeastern hainan sea areas. J. Trop. Oceanography31, 80–86. doi: 10.3969/j.issn.1009-5470.2012.02.011
7
Chen L. Zhang Y. Li T. Xu D. (2012b). Analysis of in - situ laser particle size characteristics of suspended matter in the sea areas of western guangdong and northeastern hainan. Trop. Geogr.32, 6–10. doi: 10.3969/j.issn.1001-5221.2012.01.002
8
Fan H. Huang H. Tang J. (2007). Spectral characteristics of water and remote sensing estimation of suspended sediment concentration in the yellow river estuary. Geomatics Inf. Sci. Wuhan Univ.32, 601–604. doi: 10.3321/j.issn:1671-8860.2007.07.009
9
Forget P. Ouillon S. Lahet F. Broche P. (1999). Inversion of reflectance spectra of nonchlorophyllous turbid coastal waters. Remote Sens. Environ.68, 264–272. doi: 10.1016/S0034-4257(98)00117-5
10
Gitelson A. Garbuzov G. Szilagyi F. Mittenzwey K. Karnieli A. Kaiser A. (1993). Quantitative remote sensing methods for real-time monitoring of inland waters quality. Int. J. Remote Sens.14, 1269–1295. doi: 10.1080/01431169308953956
11
Huang Y. Fu D. Liu D. Yu G. Zhang X. Lin D. et al . (2019). Analysis of surface spectral characteristics and types of water in the pearl river estuary. Mar. Environ. Sci.38, 891–897.
12
Karmakar J. Mondal I. Hossain S. A. Jose F. Pichuka S. Ghosh D. et al . (2024). Analyzing spatio-temporal variability of aquatic productive components in northern bay of bengal using advanced machine learning models. Ocean Coast. Manage.251, 107074. doi: 10.1016/j.ocecoaman.2024.107074
13
Latha T. P. Nagamani P. V. Rao B. S. Amarendra P. Rao K. Choudhury S. et al . (2013). Particle backscattering variability in the coastal waters of bay of bengal: a case study along off kakinada and yanam regions. IEEE Geosci. Remote Sens. Lett.10, 1517–1521. doi: 10.1109/LGRS.8859
14
Li T. Chen Q. Zhu J. (2002). Measurement and research on the spectral characteristics of case - ii coastal waters in China. Mar. Sci. Bull.21, 9–15. doi: 10.3969/j.issn.1001-6392.2002.06.002
15
Li S. Yang X. Huang H. Liang X. Wang R. Feng B. (2022). Variations in the suspended sediment concentration in mountain-type rivers flowing into the sea in the past 60 years—taking nanliu river in beibu gulf as an example. Front. Earth Sci.10, 913022. doi: 10.3389/feart.2022.913022
16
Liu Z. (1981). China encyclopedia press. China Publishing J.8, 15–18.
17
Liu D. Chao Q. (2019). Study on the spatio - temporal distribution of chlorophyll a concentration in the beibu gulf. J. Mar. Sci.37, 95.
18
Liu D. Zhang C. Fu D. Shen C. (2010). Remote sensing inversion model of suspended sediment in surface water of the pearl river estuary based on hyperspectral data. Mar. Sci.34, 77–80.
19
Lu S. (2016). Research progress on remote sensing of suspended solids in case ii waters. Modern Computer: Mid - Month32, 34–39. doi: 10.3969/j.issn.1007-1423.2016.32.008
20
Ma R. Tang J. Duan H. Pan D. (2009). Research progress in lake water color remote sensing. J. Lake Sci.21, 143–158. doi: 10.18307/2009.0201
21
Mahasandana S. Tripathi N. K. Honda K. (2009). Sea surface multispectral index model for estimating chlorophyll a concentration of productive coastal waters in Thailand. Can. J. Remote Sens.35, 287–296. doi: 10.5589/m09-017
22
Mei-yan P. Yu-xing X. Wan-kuan Z. A-peng D. Zhi-chao W . (2021). Analysis of climate change in offshore waters of leizhou peninsula in recent 38 year-2019). Eucalyptus Sci. Technol.38, 62–67. doi: 10.13987/j.cnki.askj.2021.01.011
23
Menken K. D. Brezonik P. L. Bauer M. E. (2006). Influence of chlorophyll and colored dissolved organic matter (cdom) on lake reflectance spectra: Implications for measuring lake properties by remote sensing. Lake Reservoir Manage.22, 179–190. doi: 10.1080/07438140609353895
24
Menon H. B. Lotliker A. A. Moorthy K. K. Nayak S. R. (2006). Variability of remote sensing reflectance and implications for optical remote sensing—a study along the eastern and northeastern waters of arabian sea. Geophysical Res. Lett.33. doi: 10.1029/2006GL026026
25
Mondal I. De A. Nandi S. Thakur S. Raman M. Jose F. et al . (2024). Estimation of chlorophyll-a, tsm and salinity in mangrove dominated tropical estuarine areas of hooghly river, north east coast of bay of bengal, India using sentinel-3 data. Acta Geophysica72, 303–322. doi: 10.1007/s11600-023-01040-5
26
Mondal I. Jha I. Hossain S. A. De A. Altuwaijri H. A. Jose F. et al . (2025). Variability of bio-optical properties of sundarbans mangrove estuarine ecosystem using elemental analysis, sentinel 3 olci imageries and neural network models. Adv. Space Res.75, 2028–2047. doi: 10.1016/j.asr.2024.10.059
27
Mondal I. Thakur S. Ghosh P. De T. K. (2021). Assessing the impacts of global sea level rise (slr) on the mangrove forests of Indian sundarbans using geospatial technology. Geographic Inf. Sci. land resource Manage.209–227. doi: 10.1002/9781119786375.ch11
28
Parzen E. (2004). Quantile probability and statistical data modeling. Stat. Sci.19, 652–662. doi: 10.1214/088342304000000387
29
Ren J. Zhao J. (2002). Main progress and development prospects of water color remote sensing for case - ii waters. Adv. Earth Sci.17, 363. doi: 10.3321/j.issn:1001-8166.2002.03.011
30
Sathyendranath S. (2000). Remote sensing of ocean colour in coastal, and other optically-complex, waters. (Dartmouth, Canada: Reports of the International Ocean-Colour Coordinating Group, No. 3, IOCCG).
31
Sun Z. Zheng W. Xie Y. Yu T. Wei C. Yu X. (2013). Measurement and analysis of water body spectra in dalinor lake. J. Anhui Agric. Sci.41, 4182–4186. doi: 10.3969/j.issn.0517-6611.2013.09.153
32
Tang J. Tian G. Wang X. Wang X. Song Q. (2004). Measurement and analysis of water spectra: Above - water measurement method. J. Remote Sens.8, 37–44. doi: 10.3321/j.issn:1007-4619.2004.01.006
33
Verma N. Lohrenz S. Chakraborty S. Fichot C. G. (2021). Underway hyperspectral bio-optical assessments of phytoplankton size classes in the river-influenced northern gulf of Mexico. Remote Sens.13, 3346. doi: 10.3390/rs13173346
34
Wang L. Zhao D. Yang J. Liu Y. Wang X. Zou X. (2011). Influence of red tides on the bio optical properties of coastal waters. Environ. Sci.32, 2855–2860.
35
Wang F. Zhou B. Xu J. Ling Z. Zhou G. (2009). Surface spectral measurement and spectral characteristic analysis of turbid water in hangzhou bay. Spectrosc. Spectral Anal.29, 730–734.
36
Wen Y. Deng J. Mao Z. Shi J. Zhou Y. Lu T. et al . (2018). Influence of fresnel reflection on the estimation of chlorophyll fluorescence at 761 nm over water surface. J. Remote Sens.22 (3), 424–431.
37
Xia J. Han Y. Tan J. Abarike G. A. Song Z. (2022). The characteristics of organic carbon in the offshore sediments surrounding the leizhou peninsula, China. Front. Earth Sci.10, 648337. doi: 10.3389/feart.2022.648337
38
Xu L. Du F. Tang Q. Wang L. Ning J. Huang D. et al . (2023). Seasonal variability of nektonic community structure and phylogenetic diversity in weizhou island, the beibu gulf. Front. Mar. Sci.10, 1133462. doi: 10.3389/fmars.2023.1133462
39
Yang Z. Li Y. Zhang P. Lu X. Li X. (2020). An improved method for abnormal identification of safety monitoring data based on m - estimator and standard inter - quartile range. J. Yangtze River Sci. Res. Institute37, 77. doi: 10.11988/ckyyb.20190335
40
Ye H. (2009). Study on oceanic spectral classification methods in the yellow sea and east China sea. Ph.D. thesis (Tianjin: National Ocean Technology Center).
41
Ye H. (2017). Research on the accurate correction and remote sensing retrieval of the absorption coefficient of Case - II waters. Ph.D. thesis (Beijing: University of Chinese Academy of Sciences (Institute of Remote Sensing and Digital Earth, Chinese Academy of Sciences).
42
Yu H. Cui T. Liu R. Miao J. Lu Z. Liu L. et al . (2018). Study on the spectral characteristics of remote sensing reflectance in the southern part of the eastern Indian ocean: Comparison of different observation methods and data processing methods. J. Ocean Technol.37, 1–8. doi: 10.3969/j.issn.1003-2029.2018.01.001
43
Zhang C. Lin H. Sun S. (2012). Sources and distribution of surface sedimentary organic matter in typical bays of guangdong province. J. Trop. Oceanography31, 62–68. doi: 10.3969/j.issn.1009-5470.2012.06.010
44
Zhang T. Shi Y. (2005). A method for classifying case i and case ii waters. Periodical Ocean Univ. China (Natural Sci. Edition)35, 849–853. doi: 10.3969/j.issn.1672-5174.2005.05.030
45
Zhao D. Xing X. Liu Y. Yang J. Wang L. (2010). The relation of chlorophyll-a concentration with the reflectance peak near 700 nm in algae-dominated waters and sensitivity of fluorescence algorithms for detecting algal bloom. Int. J. Remote Sens.31, 39–48. doi: 10.1080/01431160902882512
46
Zhou L. Liu Y. Guo P. (2005). Characteristic analysis of water - color spectra in the bohai sea and the northern yellow sea. Mar. Sci. Bull.24, 13–19. doi: 10.3969/j.issn.1001-6392.2005.02.002
Summary
Keywords
Leizhou Peninsula, remote sensing reflectance, spectral characteristics, water body spectral types, spatiotemporal analysis
Citation
Li Y, Chai X, Guo F, Sun X, Cheng Z, Fu D and Liu D (2025) Spatiotemporal characteristics of the apparent optical spectrum in the coastal waters of Leizhou Peninsula and their comparative analysis. Front. Mar. Sci. 12:1610901. doi: 10.3389/fmars.2025.1610901
Received
13 April 2025
Accepted
24 July 2025
Published
20 August 2025
Volume
12 - 2025
Edited by
Yimian Dai, Nanjing University of Science and Technology, China
Reviewed by
Huizeng Liu, Shenzhen University, China
Shaohua Lei, Nanjing Hydraulic Research Institute, China
Ismail Mondal, University of Calcutta Department of Marine Science, India
Updates
Copyright
© 2025 Li, Chai, Guo, Sun, Cheng, Fu and Liu.
This is an open-access article distributed under the terms of the Creative Commons Attribution License (CC BY). The use, distribution or reproduction in other forums is permitted, provided the original author(s) and the copyright owner(s) are credited and that the original publication in this journal is cited, in accordance with accepted academic practice. No use, distribution or reproduction is permitted which does not comply with these terms.
*Correspondence: Dongyang Fu, fudy@gdou.edu.cn; Dazhao Liu, liudz@gdou.edu.cn
Disclaimer
All claims expressed in this article are solely those of the authors and do not necessarily represent those of their affiliated organizations, or those of the publisher, the editors and the reviewers. Any product that may be evaluated in this article or claim that may be made by its manufacturer is not guaranteed or endorsed by the publisher.