Abstract
Invasive species pose significant threats to native biodiversity, ecosystem stability, and the sustainability of fisheries. The Nile tilapia (Oreochromis niloticus), a highly adaptable invasive fish, has rapidly proliferated across the aquatic ecosystems of Eastern India, necessitating precise and efficient monitoring strategies. This study employed environmental DNA (eDNA) analysis to assess the distribution of O. niloticus across multiple aquatic habitats, leveraging species-specific primers enabled high-resolution detection. eDNA signatures were successfully amplified from sediment and direct tissue samples, with sequences submitted to NCBI (PQ810007, PQ810734, PQ814753, PQ814801, PQ821106), confirming the widespread presence of species. Spatial heterogeneity in physicochemical parameters influenced eDNA persistence and detection efficiency, with temperature, pH values, and sediment composition playing crucial roles. Sand-dominated substrates facilitated rapid DNA percolation and loss, whereas finer sediments enhanced retention. PCR validation demonstrated high specificity, with no cross-reactivity with non-target species, reinforcing the robustness of the primer design. Despite successful amplification in lentic environments, the absence of O. niloticus eDNA in Kolaghat, Akaipur, and Ganga River sediments suggests either low species abundance or rapid degradation in high-flow systems. These findings underscore the influence of hydrodynamic conditions on eDNA stability, emphasizing the need for habitat-specific sampling strategies. This study establishes eDNA as a powerful, non-invasive tool for invasive species monitoring, bridging molecular ecology with conservation management. Future research should refine molecular protocols, integrate hydrodynamic modeling, and optimize eDNA sampling methodologies to enhance surveillance accuracy. The study highlights the urgent need for targeted mitigation strategies to control O. niloticus populations and protect native biodiversity, advocating for eDNA-based monitoring as a cornerstone in global invasive species management frameworks.
Highlights
-
eDNA-based assays successfully identified the presence of Oreochromis niloticus in various aquatic habitats, demonstrating high sensitivity compared to traditional survey methods.
-
The study highlights the effectiveness of eDNA in detecting low-density populations, enabling early intervention before the species establishes a strong foothold.
-
The study provides evidence of O. niloticus expansion into new ecosystems, raising concerns about potential ecological disruptions and native species competition.
-
eDNA monitoring offers a non-invasive, cost-effective approach for tracking invasive species, aiding in targeted control strategies and biodiversity conservation efforts.
-
This research contributes to refining eDNA-based ecological assessments by optimizing sampling protocols, degradation analysis, and data interpretation techniques.
1 Introduction
The intricate interplay between biological invasions and ecological stability has emerged as a pivotal concern in contemporary global ecology, accentuated by economic globalization and climate change factors. Biological invasion involves the migration of organisms from their native habitats into new environments, often facilitated by human activities, resulting in profound economic, ecological, and biodiversity impacts (Wan et al., 2002; Hulme et al., 2009). Aquatic ecosystems, particularly in regions like Eastern India, are exceptionally vulnerable to these invasions due to the multifaceted pathways of species introduction, including ballast water, agricultural runoff, and trade (Ruiz and Carlton, 2003; Lovell et al., 2006). Once introduced, invasive species often exhibit high adaptability and reproductive potential, disrupting native ecosystems, altering trophic dynamics, and degrading ecological health (Knight, 2010). In the context of Eastern India’s extensive aquatic systems, such invasions threaten ecological integrity, alter trophic dynamics, and diminish the self-purification capacities of water bodies, resulting in severe consequences for biodiversity and habitat quality (Havel et al., 2015; Chin and Siang, 2018). Anthropogenic activities such as aquaculture, international trade, recreation, and the pet trade have accelerated the dismantling of geographical barriers, promoting the introduction and establishment of non-native species. Climate change exacerbates this phenomenon by enabling species redistribution, creating novel ecosystems where native species struggle to compete (Su et al., 2016; Minchin et al., 2013). While some non-native species remain innocuous, others trigger cascading ecological effects, particularly in freshwater ecosystems, where their rapid proliferation poses serious threats to native biodiversity and ecosystem services (Copp et al., 2017; Strayer, 2010).
In particular, non-native or exotic tilapias, especially the Nile tilapia, Oreochromis niloticus, are among the most successful and invasive fish species globally (Esmaeili and Eslami Barzoki, 2023). The Nile tilapia is a cichlid fish native to Africa that has been successfully introduced to at least 100 countries, including those in the Arabian Peninsula, for aquaculture due to its high growth rate, disease resistance, tolerance to various environmental conditions, high meat quality, and significant production (Grammer et al., 2012; Freyhof and Yoğurtçuoğlu, 2020). Currently, it is one of the most important freshwater species used in India and worldwide aquaculture. Because of its potential to cause various environmental and ecological problems, such as changes in water quality, habitat degradation, trophic cascades, and modifications of ecosystem function (Shuai and Li, 2022), O. niloticus is now recognized as one of the most dangerous invasive fish in tropical and subtropical regions of the world (Stauffer et al., 2022).
Despite these challenges, the impacts of invasive species on the Indian subcontinent, particularly within the context of climate change, remain underexplored. Monitoring biodiversity is essential for mitigating the risks associated with biological invasions. However, conventional species identification methods, such as visual surveys and manual counting, are often hindered by phenotypic plasticity, cryptic species, and the presence of morphologically similar taxa across different life stages (Brock, 1982). Moreover, these methods often involve invasive or destructive sampling techniques that may inadvertently harm the ecosystems under investigation (Jones, 1992; Baldwin et al., 1996). This underscores the need for innovative, non-invasive, and efficient tools for biodiversity assessment and monitoring.
Environmental DNA (eDNA) has emerged as a transformative tool in ecological research, offering a non-invasive, cost-effective, and highly sensitive approach for detecting and monitoring species. eDNA refers to the genetic material shed by organisms into their environment through skin cells, excreta, mucous, or other biological residues (Ogram et al., 1987; Foote et al., 2012). It encompasses both particulate DNA (P-DNA) associated with cellular material and dissolved DNA (D-DNA) comprising free-floating genetic fragments (Paul et al., 1991). eDNA in aquatic systems is diverse, ranging from biological materials such as skin flakes, feces, and saliva to environmental inputs like plant leaves and pollen (Bunce et al., 2005; Strausberger and Ashley, 2001). The detection and analysis of eDNA rely on molecular techniques such as quantitative polymerase chain reaction (qPCR), reverse transcription PCR (RT-PCR), and next-generation sequencing (NGS), which provide high specificity and sensitivity (Taberlet et al., 2012; Yoccoz, 2012). Since its initial application in aquatic ecosystems to detect the invasive American bullfrog (Rana catesbeiana), eDNA has revolutionized biodiversity monitoring, enabling the detection of elusive or low-density species with unparalleled accuracy (Ficetola et al., 2008). Its applications span identifying single species, community biodiversity assessments, and ecological monitoring across taxa such as fish, amphibians, benthic organisms, and microorganisms (Bohmann et al., 2014; Pawlowski et al., 2022).
This study investigates eDNA-based monitoring of Oreochromis niloticus dynamics in Eastern India’s aquatic ecosystems, assessing its potential for invasive species management. By leveraging advanced molecular tools, we aim to detect and monitor invasive species with high precision, providing critical insights into their ecological impacts and informing effective management strategies. This research advances the understanding of invasive species dynamics in one of India’s most biodiverse regions. It contributes to the growing body of evidence supporting the integration of eDNA into ecological monitoring frameworks. Through this work, we seek to establish eDNA as a cornerstone of sustainable biodiversity management in the face of escalating environmental challenges.
2 Materials and methods
2.1 Ethical statement
This study was conducted strictly with ethical standards and national legal regulations. All research activities adhered to the guidelines outlined by the Institute Animal Ethics Committee (Approval No. CIFRI/IAEC-22-23/01).
2.2 Study area and sampling strategy
The sediment samples were collected from seven major wetland ecosystems across West Bengal, India, including Sardar Wetland Wetland, Kolaghat, Beri Bow, Moyna, Kakdwip, Akaipur, and Khalsi (Figure 1). Sampling was conducted during the pre-monsoon period of 2023–2024 under the National Mission for Clean Ganga (NMCG) initiative. Precise sampling locations were determined using a handheld GPS device (Model: Garmin GPS 12). These wetlands serve as the fish baskets of Kolkata, providing nutritional and food security to thousands of people. The data on fish production, species composition, and major contributors to total fish production were collected from all culture systems. Two methods were employed: secondary data and umbrella fish trapping. Umbrella fish traps (134 cm³ crayfish traps with 16 conical funnel entrances and 5 mm mesh netting) were deployed at a depth of approximately 80 cm at four shoreline sites per wetland. Each trapping session lasted two days and was conducted four times between March and April 2024. These surveys provided baseline data on fish communities and complemented subsequent eDNA-based assessments for invasive species monitoring.
Figure 1
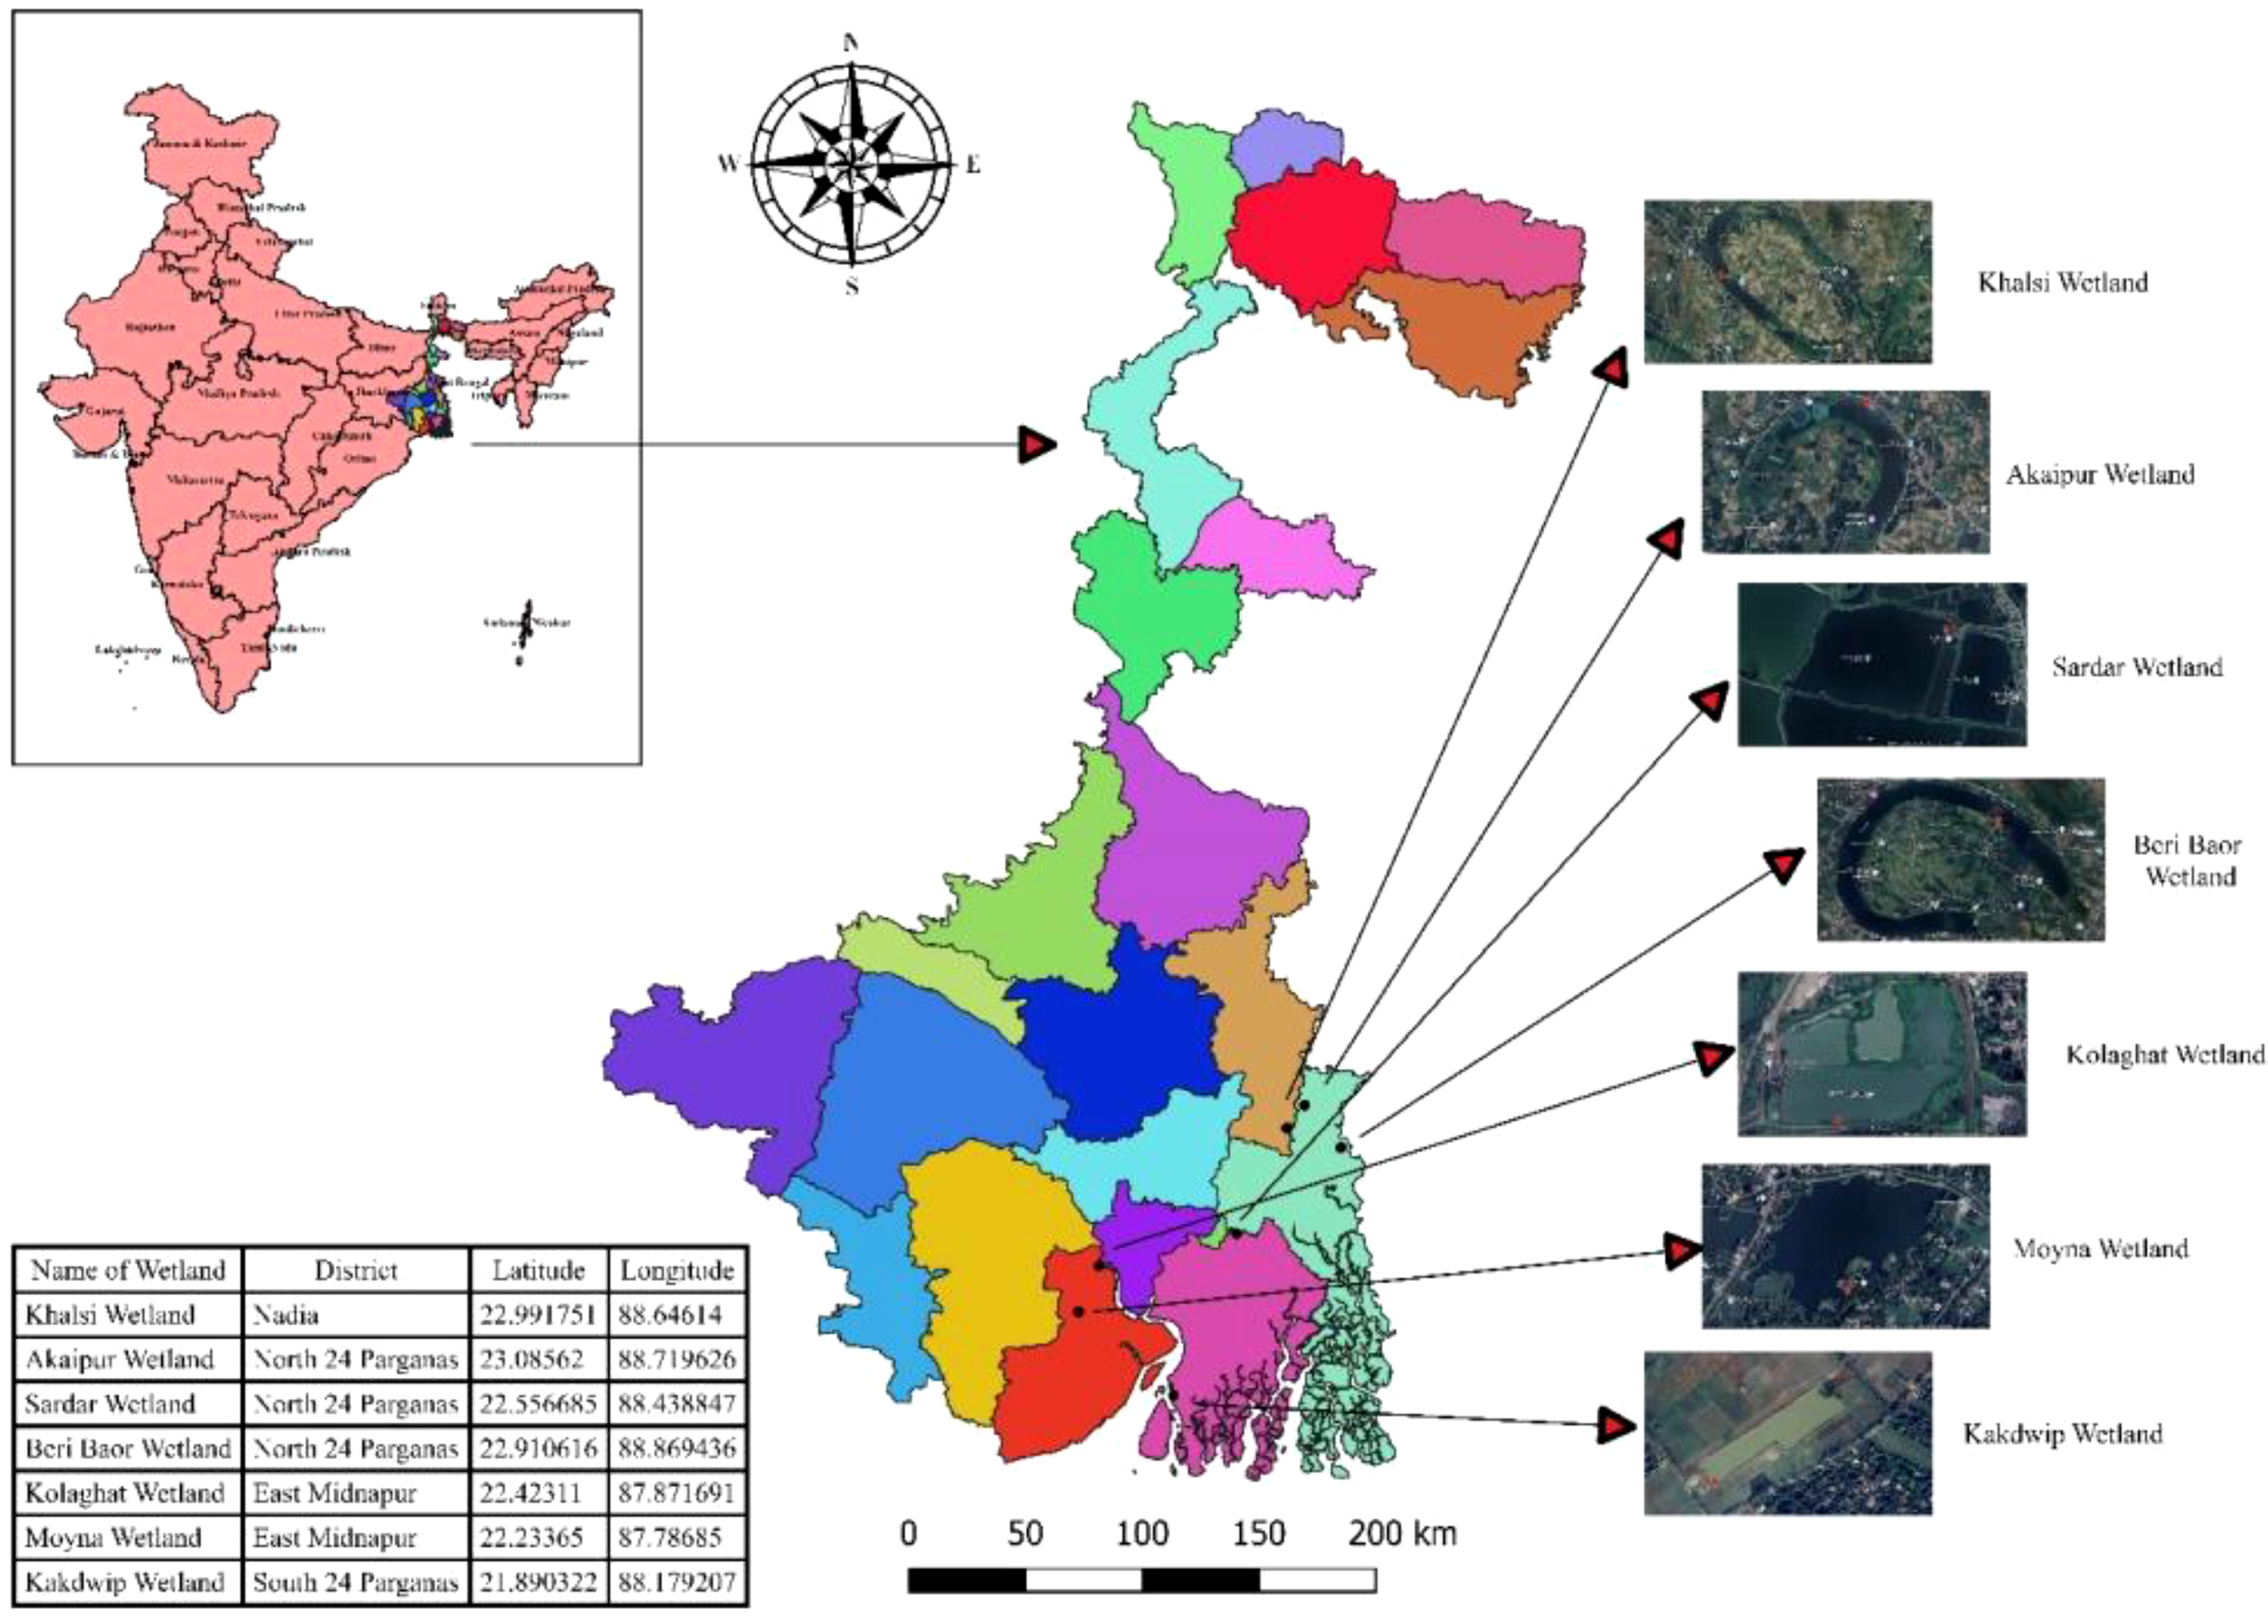
Study area and sampling locations. Seven wetlands, including Sardar wetland, Kolaghat wetland, Beri Bow wetland, Moyna wetland, Kakdwip wetland, Akaipur wetland, and Khalsi wetland, were selected for the study.
Later, the sediment samples from all selected wetlands were collected for analysis. The 0-15 cm surface sediment samples at 10.00 am were collected from the wetland using ethanol-disinfected core tubes and stored in sterile sampling bottles at 4 °C until processed within 24 h. A total of 3 samples from each sampling site were collected and used for the analysis. The fecal matter from Oreochromis niloticus culture tanks at ICAR-CIFRI was collected and analyzed for control.
2.3 Water sampling and physicochemical analysis
Water samples were collected at three distinct points (inlet, mid-point, and outlet) from each wetland to ensure data representativeness. Physicochemical parameters, including temperature, pH, specific electrical conductivity (EC), total dissolved solids (TDS), salinity, and dissolved oxygen (DO), were measured onsite using a pre-calibrated portable multi-parameter water quality analyzer (Eutech Instruments, Multi-Parameter PCSTestrTM35). Dissolved oxygen levels were cross-validated using Winkler’s method in the laboratory. Sub-surface water samples for nutrient analysis were collected in clean TARSON bottles, transported in ice-free conditions, and stored at 4°C before analysis. Nutrient concentrations were assessed using standard spectrophotometric techniques. The Nessler method quantified ammonia, the preferred nitrogen source for plant growth. Nitrate (NO3) concentrations were determined using the phenol disulphonic acid method (APHA, 2017). Phosphate was measured by treating an aliquot of the water sample with an acidic molybdate reagent containing ascorbic acid and potassium antimony tartrate (Murphy & Riley, 1962). Total nitrogen was determined using the Kjeldahl method (Bremner, 1960), involving treatment with sodium hydroxide (NaOH) and Devarda’s alloy. Chlorophyll a was estimated following the non-acidification spectrophotometric method (Jeffrey & Humphrey, 1975). The water samples were analyzed using a vacuum pump and using a glass membrane filter coated with magnesium carbonate suspension. The filters were stored at 4°C overnight in acetone, homogenized, centrifuged, and Chlorophyll a was analyzed using a UV spectrophotometer.
2.4 Sediment sampling and analysis
The sediment samples were collected from seven wetlands (approximately 45 g/site). Sediment samples were collected from 0–15 cm depths using a grab sampler at three locations per wetland. Each sample was transferred into sterile 50-mL tubes, homogenized thoroughly, and partitioned into nine 15-mL tubes, with 3 g of sediment per tube. Later, the samples were transported at 4°C before being stored at −25°C to preserve eDNA integrity until further processing.
Biological debris, such as plant material, was manually removed. The sediment was air-dried and sieved through a 10-mesh sieve for further analysis. The hydrometer method determined Particle size distribution. The electrical conductivity of the sediments was measured using a conductivity meter (Rhoades, 1996), and pH was analyzed using a potentiometric pH meter (Thomas-Rüddel et al., 1996). The dry combustion method determined the Soil organic carbon content at 900°C (Nelson & Sommers, 1996). Total nitrogen was measured using the Kjeldahl method (Bremner, 1960), while total phosphorus was estimated spectrophotometrically using the molybdenum blue method.
2.5 Contamination prevention
All materials and containers used for sample collection and analysis were decontaminated using 0.1% chlorine bleach (Clorox, India) before and after sampling to prevent cross-contamination among samples. This comprehensive approach ensured robust eDNA sampling and facilitated downstream analyses to evaluate the ecological dynamics of invasive O. niloticus and its interaction with West Bengal’s aquatic ecosystems. All experiments were performed in accordance with the animal utilization protocol approved by the Institutional Animal Ethics Committee, ICAR-CIFRI, Kolkata, India (CIFRI-IAEC/17/2023-24), for the experimental setup. All procedures were conducted with utmost care to minimize fish suffering.
2.6 Soil eDNA extraction
Soil environmental DNA (eDNA) was extracted using the DNeasy PowerSoil Pro Kit (MoBio Qiagen Laboratories Inc., Carlsbad, CA, USA), following the manufacturer’s protocol to ensure high-quality DNA recovery. Briefly, 250 mg of the sediment and fecal matter sample was added to a PowerBead Pro Tube containing lysis beads for extraction. After the extraction process, the column was centrifuged at 15,000 × g for 1 minute, and the resulting eluted DNA was stored at −20°C for subsequent analysis. Before PCR amplification, the quality and concentration of the extracted DNA were verified using a Nanodrop.
2.7 Soil eDNA amplification and sequencing
PCR amplifications were performed in a 50 μL reaction volume, in triplicate, using Sigma PCR master mix. Each reaction contained 40 μL nuclease-free water, 4 μL PCR buffer, 0.5 μL MgCl2, 0.5 μL dNTPs, 1 μL each of forward and reverse primers, 1 μL Taq polymerase, and 2 μL of template DNA. To monitor potential contamination during amplification, 1 μL of ddH2O was used as a template in each negative control reaction. Two primer sets were employed to target invasive species and confirm the detection of general fish eDNA. The first set of primers, COI-F (5′ CCACTTGCTGGAGTGTCAT 3′) and COI-R (5′ GAACGGGCAGGGATAGAAGG 3′), was designed for the detection of Oreochromis niloticus (195 bp amplicon). PCR conditions consisted of an initial denaturation at 95°C for 2 minutes, followed by 35 cycles of denaturation at 94°C for 30 seconds, annealing at 58°C for 90 seconds, and extension at 72°C for 45 seconds, with a final extension at 72°C for 3 minutes. For O. niloticus detection, the designed primers Fish-F1 (5′ TCAACCAACCACAGACATTGGCAC 3′) and Fish-R1 (5′ TAGACTTCTGGGTGGCGAAAGAATCA 3′) were used, generating a 655 bp amplicon. PCR parameters included an initial denaturation at 94°C for 4 minutes, followed by 35 cycles of denaturation at 94°C for 1 minute, annealing at 55°C for 1 minute, and extension at 72°C for 1.3 minutes, with a final extension at 72°C for 4 minutes (Table 1). PCR products were resolved on a 2% agarose gel to confirm successful amplification. Products were purified using the AxyPrep™ Mag PCR Clean-Up Kit (Axygen, Hangzhou, China) for downstream applications. Negative controls showed no amplification, confirming the absence of false positives and contamination.
Table 1
| Target | Primer Name | Primer Sequence (5′ → 3′) | Amplicon Size (bp) | Annealing Temperature (°C) | PCR Cycling Conditions | Reference |
|---|---|---|---|---|---|---|
| Oreochromis niloticus | COI-F | CCACTTGCTGGAGTGTCAT | 195 | 58 | 95°C (2 min); 35 cycles: 94°C (30 s), 58°C (90 s), 72°C (45 s); Final extension: 72°C (3 min) | This Study |
| COI-R | GAACGGGCAGGGATAGAAGG | |||||
| Universal Fish DNA | Fish-F1 | TCAACCAACCACAGACATTGGCAC | 655 | 55 | 94°C (4 min); 35 cycles: 94°C (1 min), 55°C (1 min), 72°C (1.3 min); Final extension: 72°C (4 min) | Ward et al., 2005 |
| Fish-R1 | TAGACTTCTGGGTGGCGAAAGAATCA |
Details of primer sets used for eDNA-based detection of Oreochromis niloticus and general fish DNA.
2.8 Fish collection for DNA isolation
The Oreochromis niloticus (Length = 120.4 ± 6.8 mm, Weight = 12.51 ± 1.9 g) were collected from the culture facility of ICAR-Central Inland Fisheries Research Institute, Barrackpore, Kolkata 700120, India. Total genomic DNA was extracted from tissue samples of moribund fish using a DNeasy Blood and Tissue kit (Qiagen, Hilden, Germany) following the manufacturer’s instructions. Fish from each wetland farm were pooled in three replicates, with five fish/replicate. The DNA concentration was quantified using a UV-visible spectrophotometer. The isolated DNA was checked on a 1.8% agarose gel, and the DNA quality was studied using a NanoDrop (Eppendorf, Germany).
2.9 Data quality and statistical analysis
All measurements were performed in triplicate and were representative of two independent experiments. Statistical analyses were conducted using R software (version 4.2.0) to assess correlations between physicochemical parameters and the abundance of invasive species. Multivariate techniques were employed to identify key environmental factors influencing invasive species dynamics.
3 Results
3.1 Physicochemical characteristics of water
The physicochemical parameters of water among seven distinct aquatic ecosystems in Eastern India exhibited considerable spatial variability, influencing eDNA persistence and invasive species detection. Depth (DEP) and Transparency (TRA) varied significantly across sites. Akaipur (4.5 m) and Khalsi (3.5 m) were the deepest sites, whereas Sardar Wetland (1.38 m) was the shallowest. Water transparency ranged from 21 cm (Kakdwip) to 55 cm (Khalsi and Akaipur). Air temperature (AT) varied between 25°C (Moyna) and 32.5°C (Sardar Wetland), while water temperature (WT) ranged from 24°C (Moyna) to 31.4°C (Sardar Wetland). The pH spectrum ranged from 7.49 to 8.91, with the highest pH recorded in Sardar Wetland (8.91). Dissolved oxygen (DO) levels varied between 4 ppm (Sardar Wetland) and 7.4 ppm (Kolaghat). Electrical conductivity (COND) ranged from 231 µS/cm (Akaipur) to 1238 µS/cm (Sardar Wetland). Salinity (SAL) peaked at Kakdwip (4.7 ppt). Total alkalinity (TA) and total hardness (TH) showed significant variation, with Kakdwip displaying the highest hardness (550 ppm) and carbonate content (28 ppm CO3) (Figure 2, Supplementary Table 1). Ammonia concentrations ranged from 0.1 to 0.25 ppm, with Moyna exhibiting the highest levels (0.25 ppm). Nitrate concentrations peaked at Kolaghat (0.15 ppm), while total nitrogen (TN) was highest in Beri Boar and Akaipur (0.48 ppm). Chlorophyll-a (Chlo-a) concentration was highest in Sardar Wetland (116.72 mg/m³) and lowest in Kakdwip (4.37 mg/m³).
Figure 2
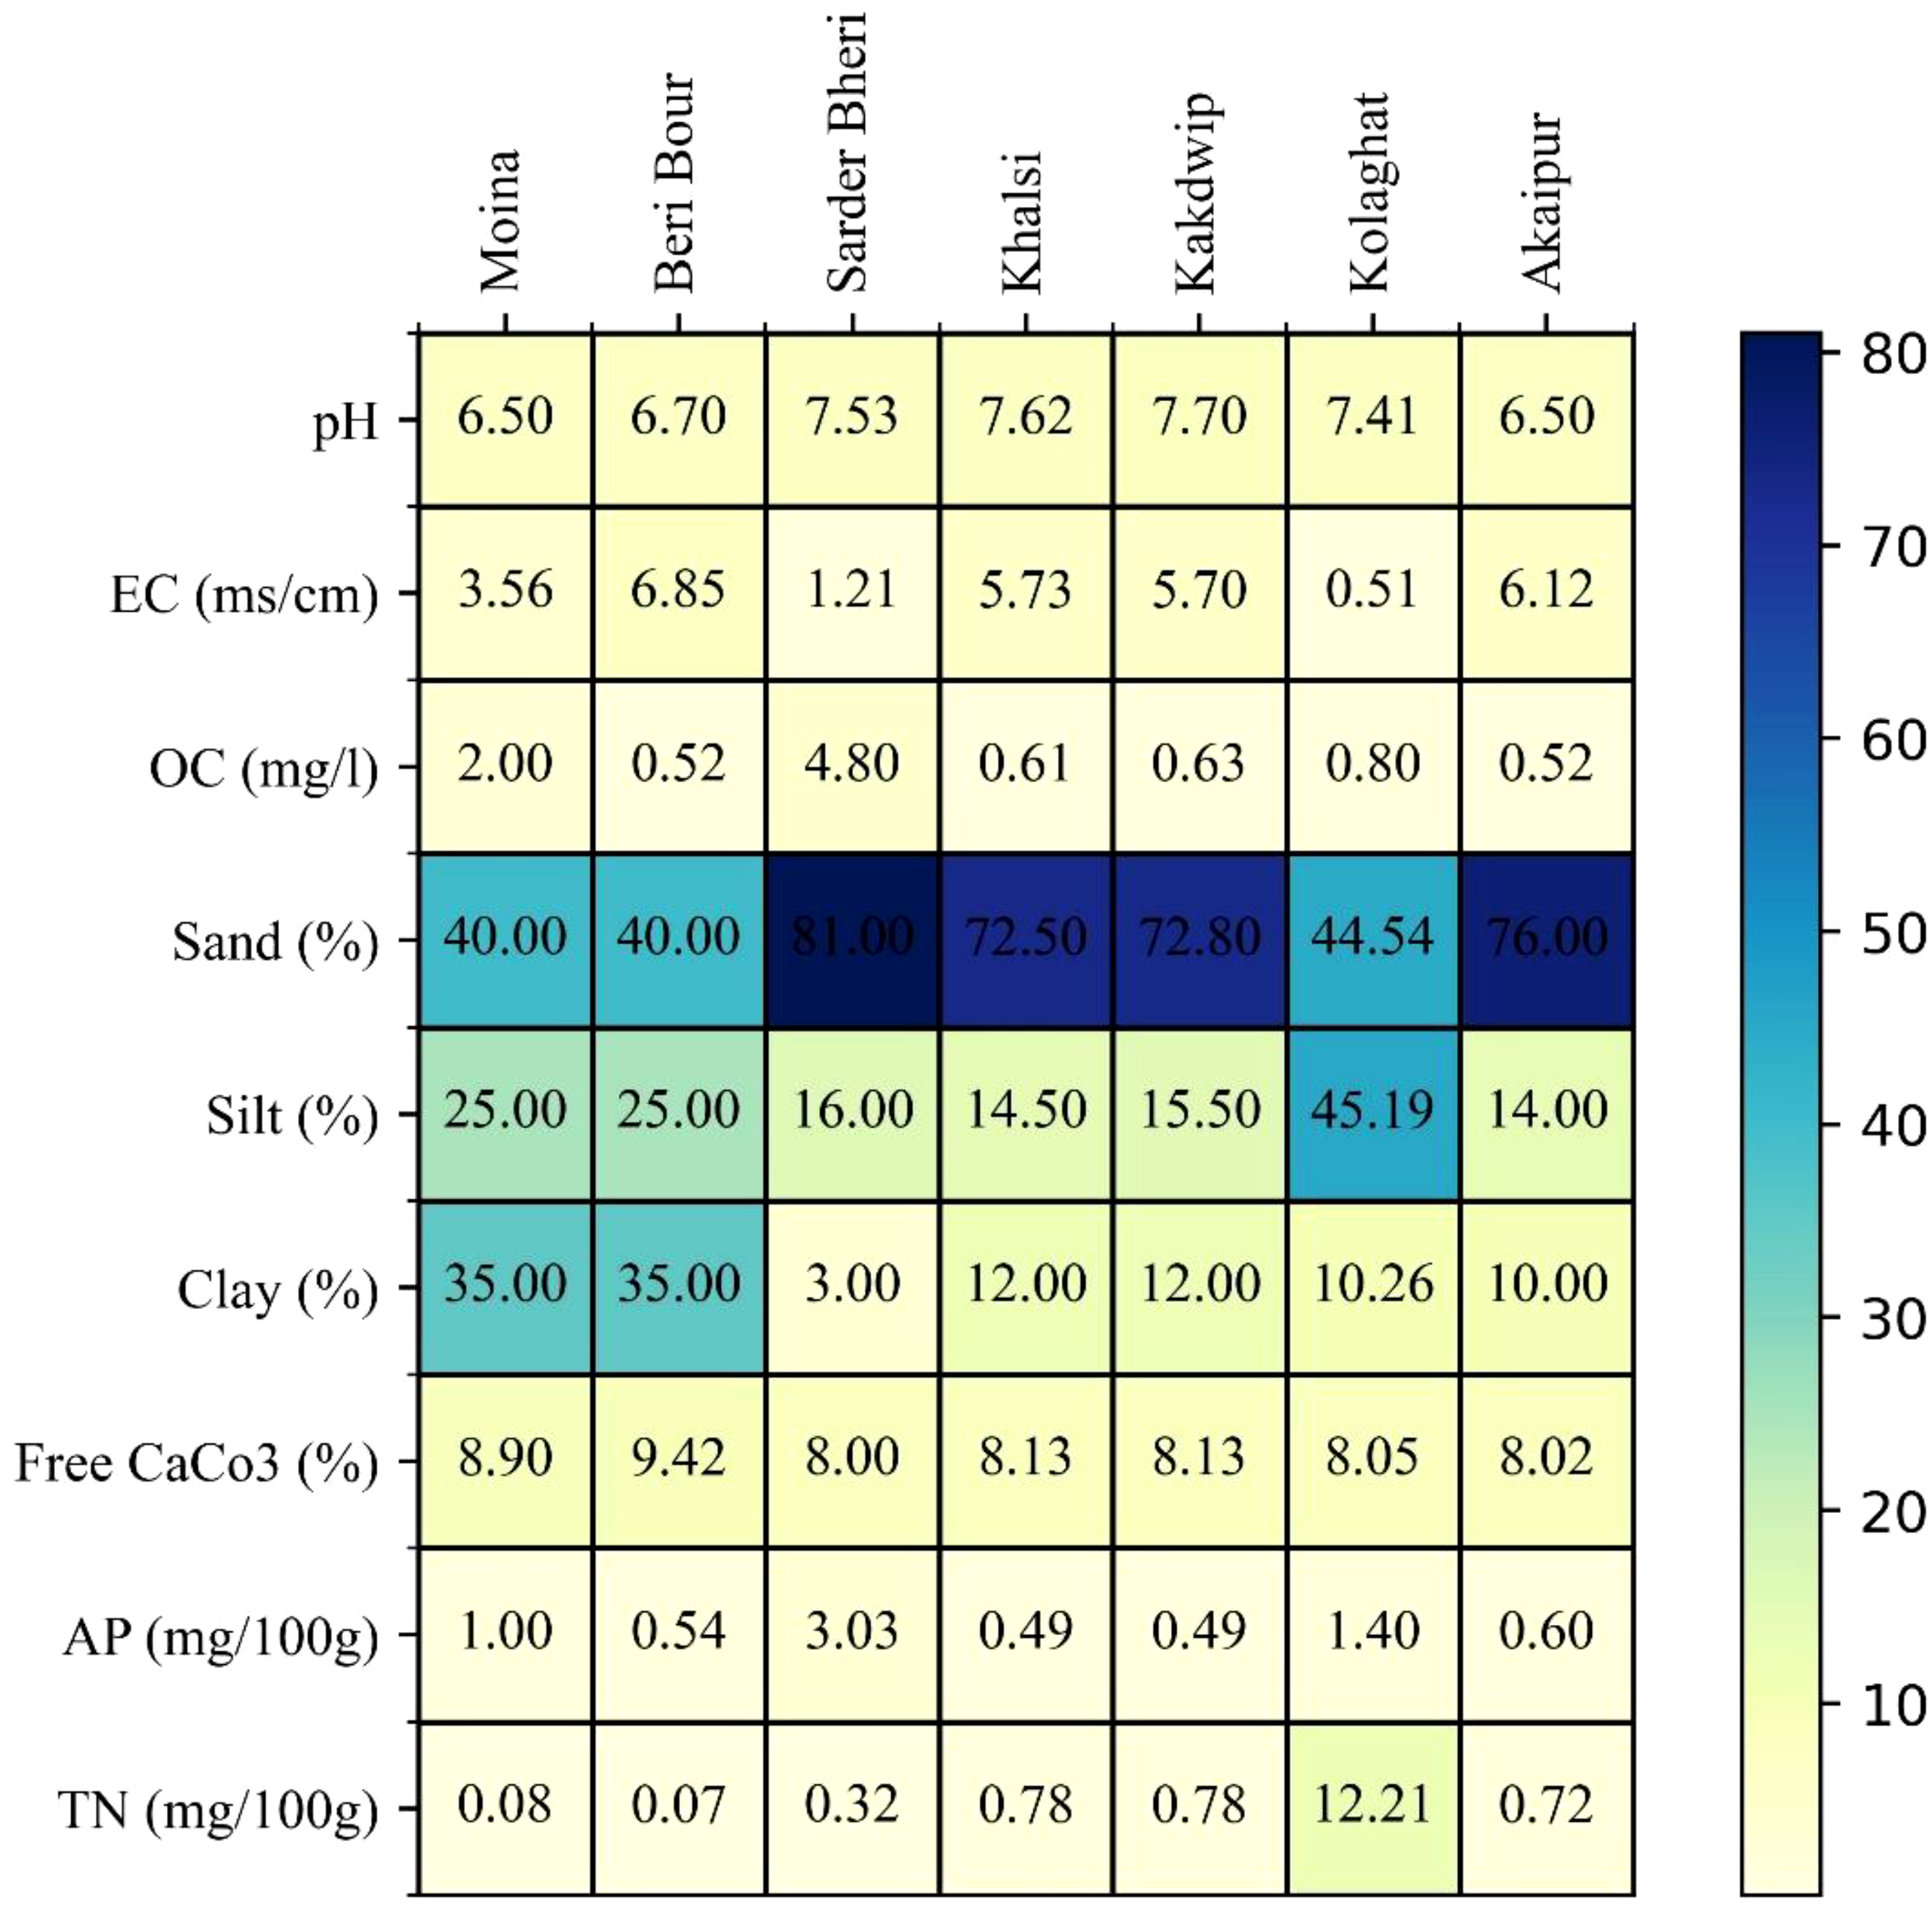
Physicochemical and sedimentological parameters of the study sites in Eastern India’s aquatic ecosystems, crucial for environmental DNA (eDNA) persistence and invasive species detection. The pH varied from 6.5 (Moyna, Akaipur) to 7.7 (Kakdwip), influencing DNA stability. Electrical conductivity (EC) peaked at 6.85 ms/cm (Beri Boar) and was lowest at 0.507 ms/cm (Kolaghat). Organic carbon (OC) ranged from 0.52 mg/l (Beri Boar, Akaipur) to 4.8 mg/l (Sardar Wetland), affecting DNA adsorption. The high sand content at Sardar Wetland (81%) suggests rapid percolation, whereas Kolaghat (45.19% silt) favors retention. Total nitrogen (12.21 mg/100g, Kolaghat) highlights nutrient-driven microbial degradation potential.
Water pH varied from 6.5 (Moyna and Akaipur) to 7.7 (Kakdwip). Electrical conductivity (EC) showed substantial variation, with Kolaghat (0.507 ms/cm) having the lowest ionic content, while Beri Boar (6.85 ms/cm) and Akaipur (6.12 ms/cm) exhibited the highest values. Organic carbon (OC) content varied across sites, with Sardar Wetland exhibiting the highest OC (4.8 mg/l), while Beri Boar and Akaipur recorded the lowest (0.52 mg/l). Sediment composition varied significantly, with Sardar Wetland (81% sand, 16% silt, 3% clay) and Akaipur (76% sand, 14% silt, 10% clay) being predominantly sandy. Kolaghat had a balanced silt-clay matrix (44.54% sand, 45.19% silt, 10.26% clay). Calcium carbonate (CaCO3) content varied minimally across sites, ranging from 8.0% to 9.42%, with Beri Boar showing the highest CaCO3 levels (9.42%) and Kolaghat the lowest (8.05%) (Figure 3, Supplementary Table 2). Available phosphorus (AP) levels ranged from 0.49 mg/100g (Khalsi and Kakdwip) to 3.03 mg/100g (Sardar Wetland). Total nitrogen (TN) varied significantly, with Kolaghat (12.21 mg/100g) exhibiting the highest concentration and Moyna (0.08 mg/100g) and Beri Boar (0.07 mg/100g) showing the lowest values.
Figure 3
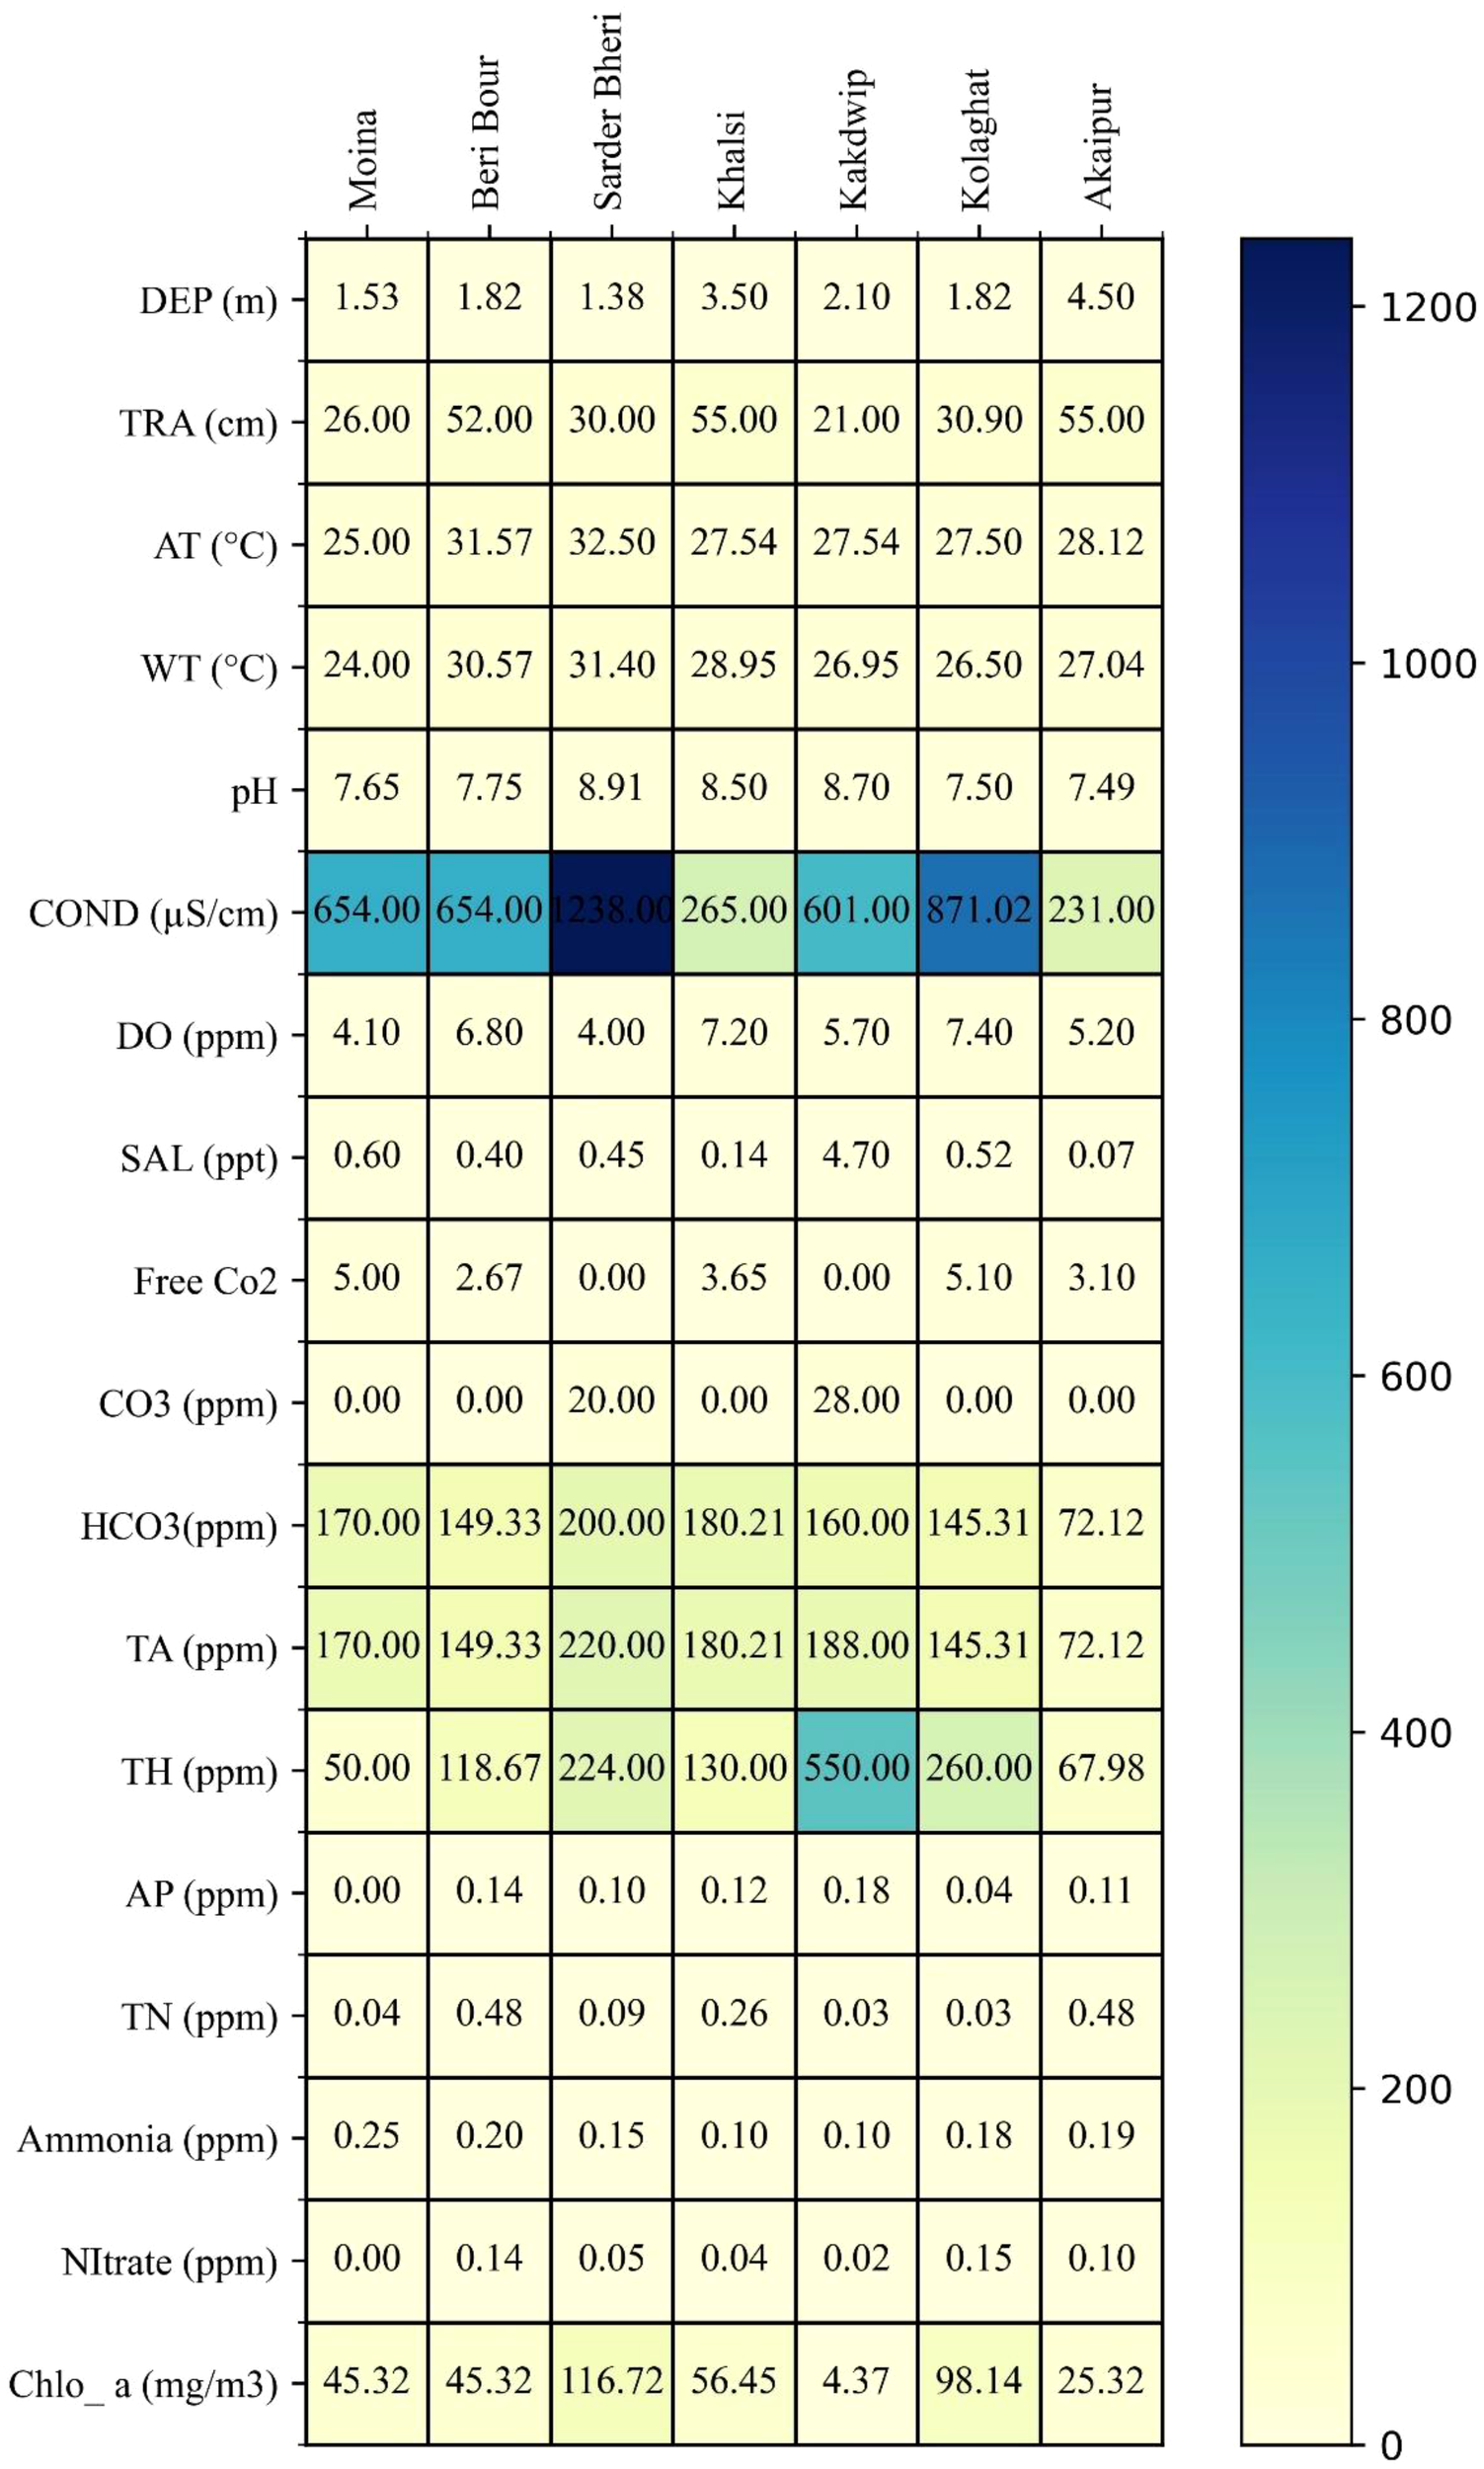
Spatial variation in physicochemical parameters influencing eDNA persistence across aquatic sites in Eastern India. The dataset highlights fluctuations in key environmental factors crucial for monitoring invasive species. Notable variations include chlorophyll-a (4.37–116.72 mg/m³), dissolved oxygen (4–7.4 ppm), total hardness (50–550 ppm), and salinity (0.07–4.7 ppt), reflecting diverse trophic states and hydrodynamic conditions. Elevated conductivity at Sardar Wetland (1238 µS/cm) and high carbonate levels in Kakdwip (28 ppm) suggest localized geochemical influences.
3.2 Distribution of Oreochromis niloticus across wetlands
Environmental DNA (eDNA) analysis confirmed the presence of O. niloticus across diverse aquatic ecosystems in Eastern India. Water and sediment samples from East Kolkata Wetlands (EKW1), Khalsi (N2), Moyna (M.P4), and Culture Pond (CP.T2) yielded successful eDNA amplification alongside direct tissue samples (ON.T1) collected from the study sites. The amplified sequences were submitted to the NCBI GenBank, receiving accession numbers PQ810007 (EKW1), PQ810734 (N2), PQ814753 (M.P4), PQ814801 (CP.T2), and PQ821106 (ON.T1). The eDNA from different water bodies was compared and validated with fish catch composition (Table 2). Alongside fish catch composition, positive eDNA results were observed where O. niloticus is a predominant species caught. The widespread detection of O. niloticus in multiple sites indicates its successful establishment in varied ecological conditions, likely facilitated by its broad environmental tolerance and high reproductive potential.
Table 2
| S. No. | Name of the water body | Total area (ha) | Fish production/ha | Fish Diversity | Major Catch |
|---|---|---|---|---|---|
| 1. | Moyna Fishery | 0.405 | ~12000 kg | Labeo rohita, L. catla, Cirrhinus mrigala, Oreochromis niloticus, | Labeo rohita |
| 2. | Khalsi Wetland | 60 | ~1500 kg | Labeo rohita, L. catla, L. calbasu, Cirrhinus mrigala, Ctenopharyngodon idella, Cyprinus carpio, Oreochromis niloticus, | Labeo rohita, L. catla |
| 3. | Sardar Wetland | 133.8 | ~1800 kg | Hypophthalmichthys molitrix, Ctenopharyngodon idella, Cyprinus carpio, Oreochromis niloticus, Labeo catla, Cirrhinus mrigala, L. rohita, L. bata | Oreochromis niloticus, L. bata |
| 4. | Kakdwip Fishery | 1.64 | ~6000 kg | Labeo rohita, L. catla, Cirrhinus mrigala, Ctenopharyngodon idella, Cyprinus carpio, Oreochromis niloticus, | Labeo rohita, L. catla |
| 5. | Kolaghat Fishery | 0.84 | ~7000 kg | Labeo rohita, L. catla, Cirrhinus mrigala | Labeo rohita, L. catla |
| 6. | Beri boar | 300 | ~1200 kg | Labeo rohita, L. catla, Cirrhinus mrigala, Lates calcarifer, Oreochromis niloticus, | Lates calcarifer |
| 7. | Akaipur Wetland | 350 | ~1600 kg | Hypophthalmichthys molitrix, Ctenopharyngodon idella, Cyprinus carpio, Labeo catla, Cirrhinus mrigala, L. rohita, L. bata | Labeo rohita, L. catla |
Fish production and composition from selected aquatic ecosystems.
The sequencing of amplified eDNA fragments confirmed the species identity of O. niloticus, with high sequence similarity to reference sequences available in GenBank. A BLAST analysis of the obtained sequences revealed 99–100% identity with previously documented O. niloticus sequences, confirming the specificity and accuracy of the primers used (Figure 4). No cross-reactivity was observed with non-target species, validating the effectiveness of the designed primers for species-specific detection. Integrating molecular and environmental data highlights the applicability of eDNA in monitoring invasive fish species across diverse habitats. The findings underscore the importance of site-specific optimization of eDNA methodologies, considering environmental factors that affect DNA persistence and degradation. Future research should incorporate hydrodynamic modeling and microbial activity assessments to refine eDNA degradation kinetics and enhance species detection efficiency.
Figure 4
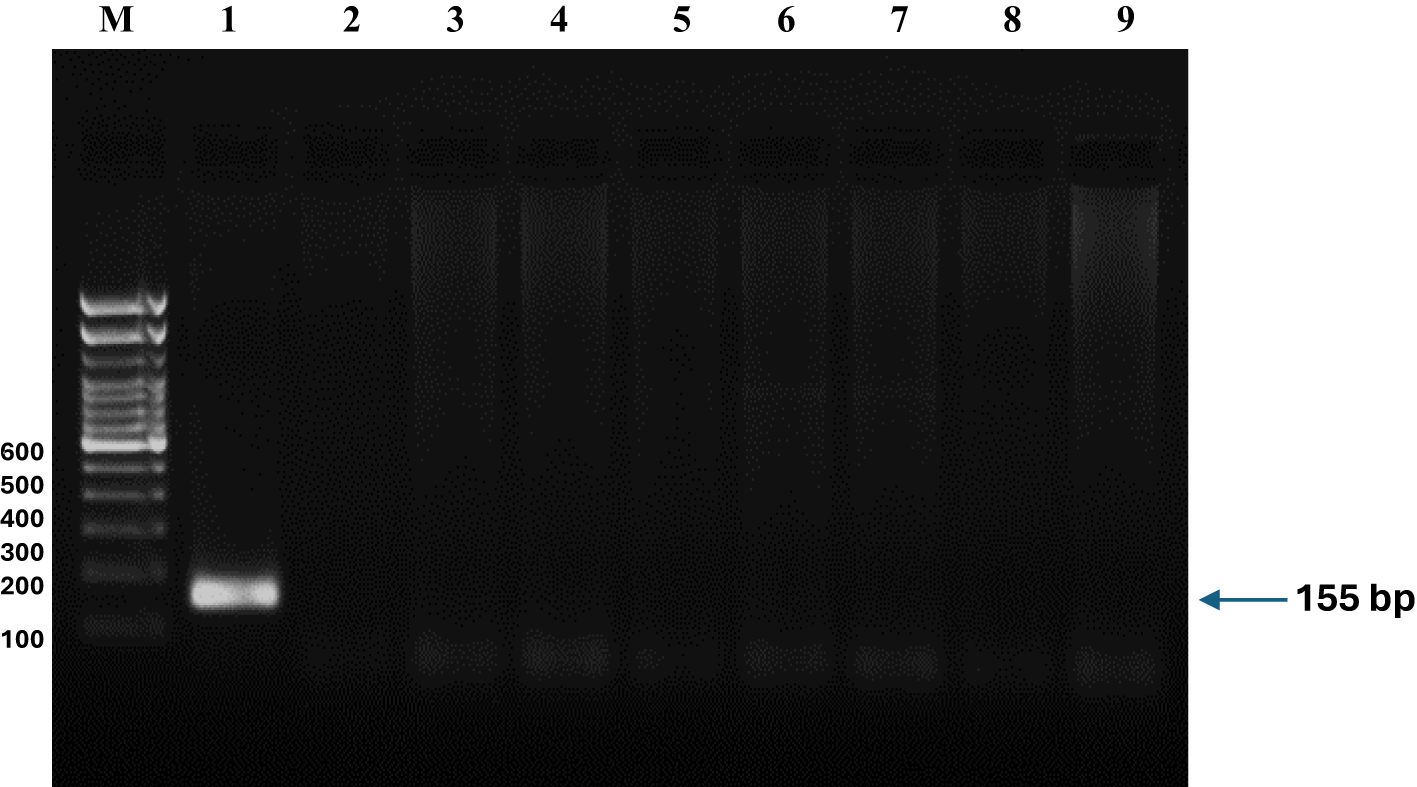
Amplification of environmental DNA from Nile tilapia (Oreochromis niloticus) using designed primers. DNA was isolated from (1) Oreochromis niloticus, (2) O. mossambicus, (3) Cirrhinus mrigala, (4) Mystus cavasius, (5) M. gulio, (6) Carassius auratus, (7) Labeo bata, (8) L. catla and (9) Cyprinus carpio. PCR amplification results demonstrating specific detection of Nile tilapia (Oreochromis niloticus) environmental DNA. No amplification was observed in other tested species, including Oreochromis mossambicus, Cirrhinus mrigala, Mystus cavasius, Mystus gulio, Carassius auratus, Labeo rohita, Labeo catla, and Cyprinus carpio, confirming the specificity of the primer. The 155 bp product was visualized alongside a 100 bp DNA ladder.
3.3 Primer specificity and sensitivity validation
PCR assays using the designed O. niloticus-specific primers demonstrated high specificity, as no amplification was observed in non-target fish species, including Oreochromis mossambicus, Cirrhinus mrigala, Mystus cavasius, Mystus gulio, Carassius auratus, Labeo rohita, Labeo catla, Labeo bata, and Cyprinus carpio. The exclusive amplification of a 155 bp product in O. niloticus samples validates the primers’ specificity and eliminates concerns regarding cross-reactivity (Figures 5–7). Further, primer sensitivity analysis in tissue samples confirmed robust amplification in positive controls while yielding no amplification in negative controls, ensuring experimental reliability and eliminating contamination risks. These findings reinforce the utility of our primer set for eDNA-based detection of O. niloticus in complex aquatic environments.
Figure 5
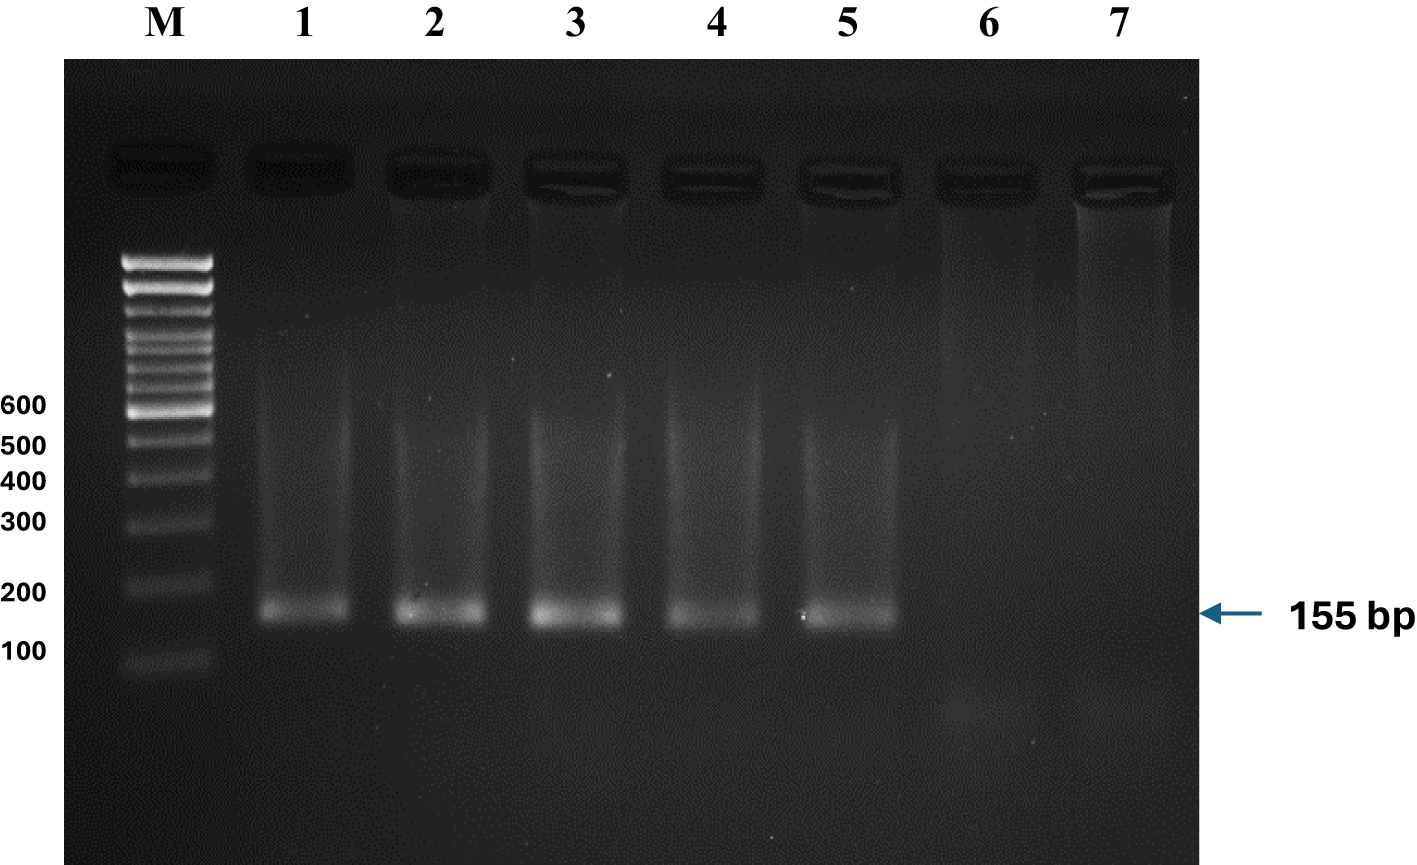
PCR detection of O. niloticus using species-specific primers in sediment samples from selected wetlands in Eastern India. DNA was isolated from (1) Moyna, (2) Sardar Wetland, (3) Khalsi, (4) Beri Boar, (5) Kakdwip, (6) Kolaghat and (7) Akaipur sediment samples. PCR amplification using O. niloticus-specific primers yielded a 155 bp product in sediment samples from five wetlands: Moyna, Sardar Wetland, Khalsi, Beri Boar, and Kakdwip, confirming the presence of the invasive species. No amplification was observed in samples from the Kolaghat and Akaipur wetlands. This suggests either the absence of O. niloticus in these two wetlands or a limitation in primer sensitivity due to lower concentrations of environmental DNA. Sediment samples were processed to extract eDNA, followed by PCR using species-specific primers. Each experiment was conducted in quintuplicate to ensure reproducibility.
Figure 6
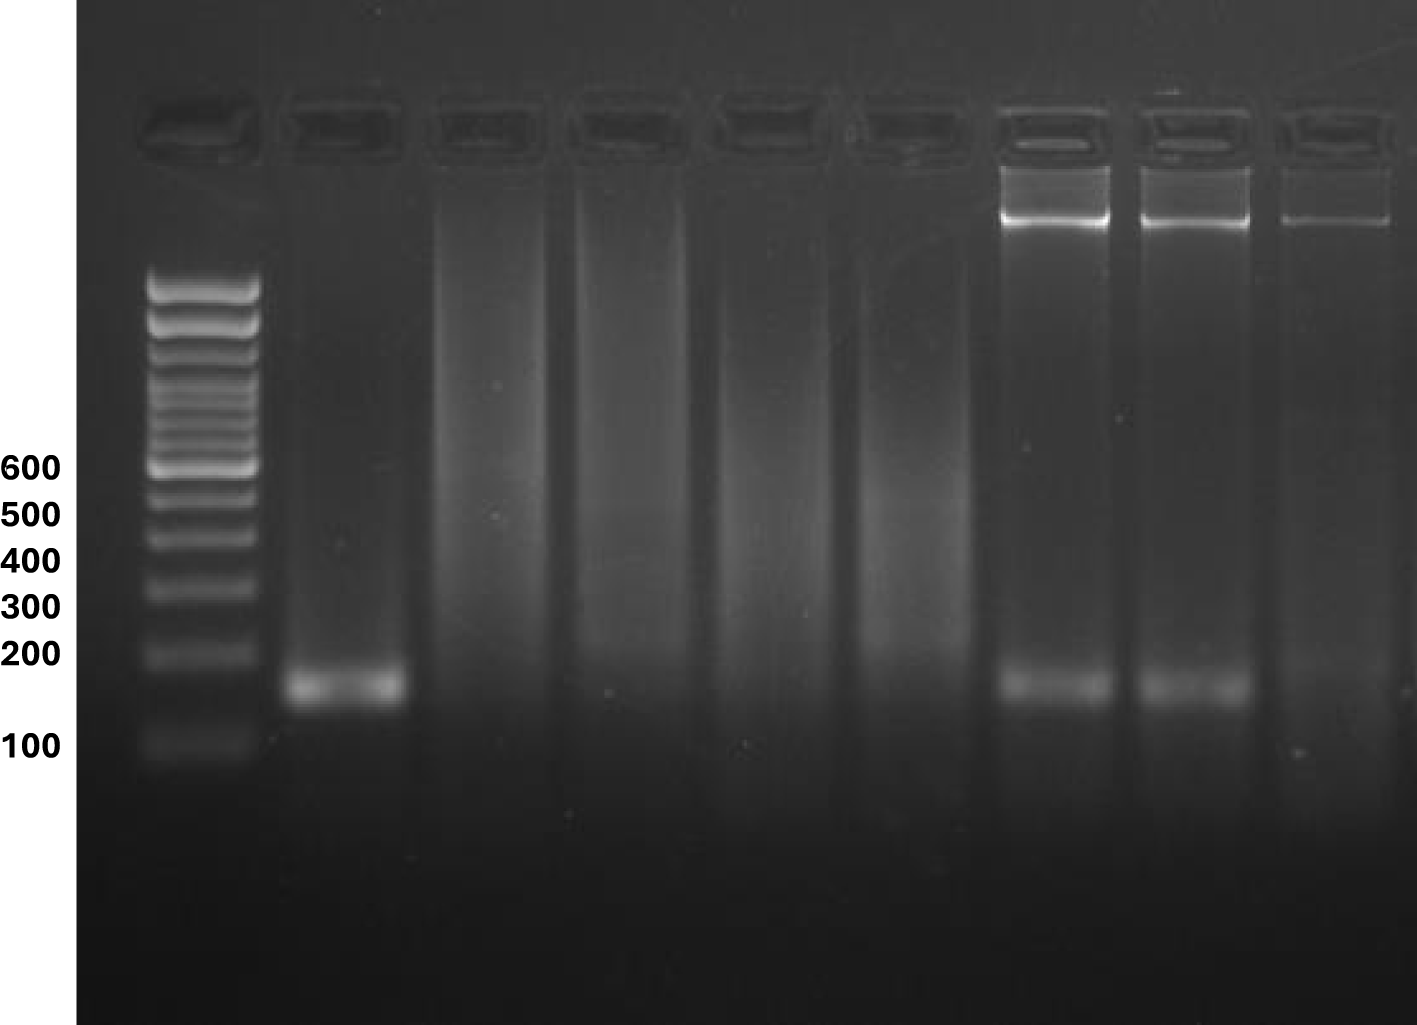
Detection of Oreochromis niloticus using species-specific PCR from environmental DNA and tissue samples across various aquatic ecosystems in Eastern India. DNA was isolated from (1) Oreochromis niloticus, (2) O. mossambicus, (3) Cirrhinus mrigala, (4) Mystus cavasius, (5) M. gulio, (6) Culture Pond Soil eDNA, (7) EKW (Sardar Wetland) Soil eDNA, and (8) Ganga River (DuPaisar Ghat) Soil eDNA. Species-specific PCR amplification targeting a 155-bp fragment of Oreochromis niloticus was conducted using both tissue and environmental DNA (eDNA) samples. Positive amplification was observed exclusively in O. niloticus tissue samples and eDNA samples collected from Ponds 1 and 2, located in the East Kolkata Wetlands (EKW, Sardar Wetland). No amplification was detected in eDNA samples from Ganga River sediment (Dupaoisar Ghat) or tissue samples from other fish species, including O. mossambicus, Cirrhinus mrigala, Mystus gulio, and Goldfish (Carassius auratus). A 100 bp DNA ladder was used for molecular weight estimation. Universal primers were used as a positive control to confirm the presence of DNA in all sediment samples.
Figure 7
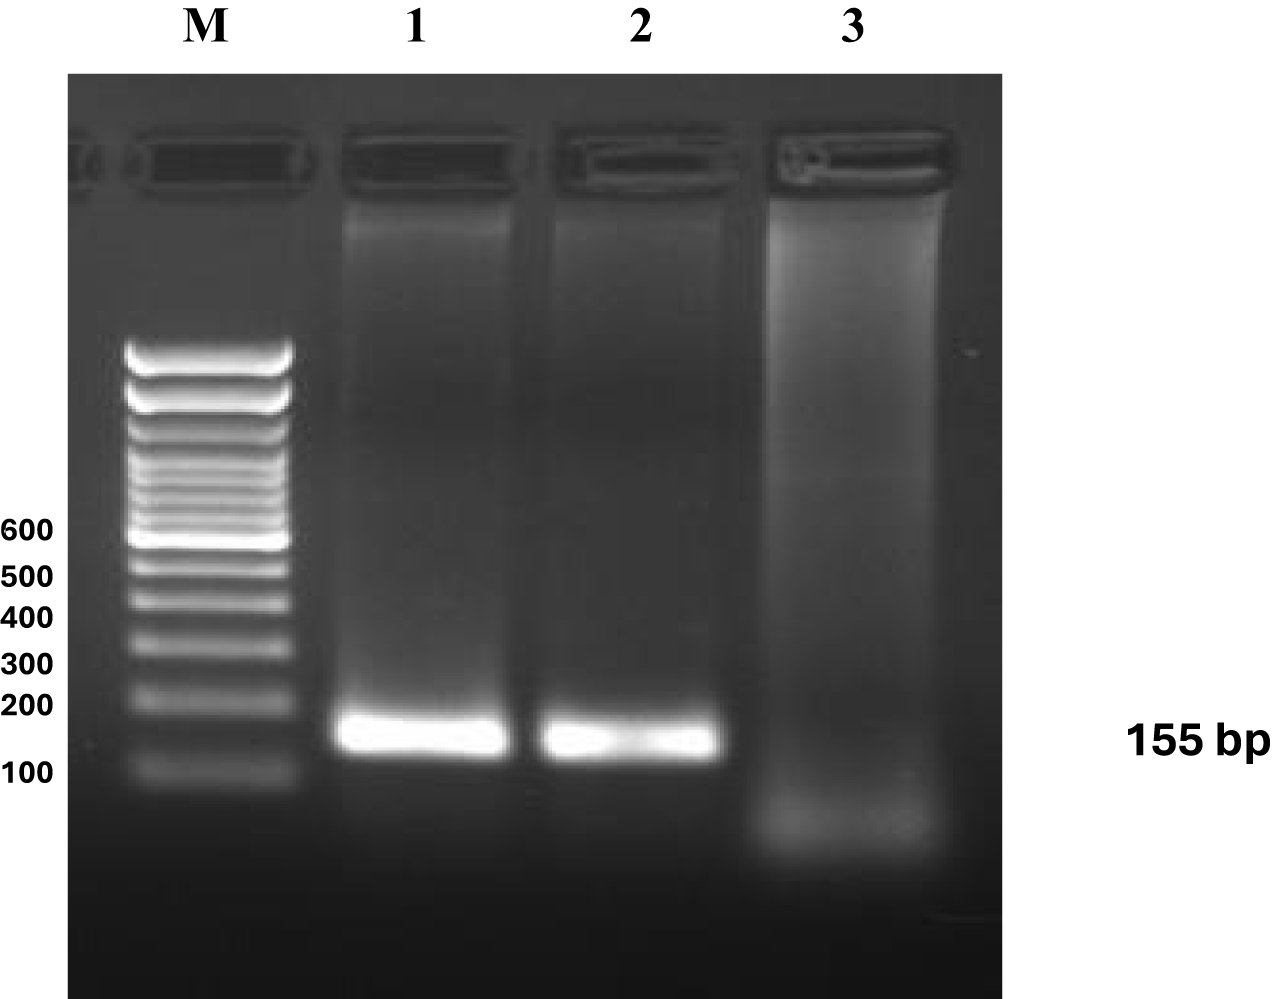
Primer sensitivity analysis for eDNA detection in fish tissue samples. DNA was isolated from (1, 2) Oreochromis niloticus, the Positive control, and (3) nuclease-free water. The sensitivity of the designed primers was tested using fish tissue samples as positive controls and molecular-grade water as negative controls. Amplification was observed in the positive controls, confirming primer specificity and efficiency. In contrast, no amplification was detected in the negative controls, ensuring the absence of contamination or non-specific binding.
3.4 Detection of environmental DNA across sampling sites
Species-specific PCR amplification targeting O. niloticus was successfully conducted across diverse aquatic habitats, including ponds, wetlands, and river sediments. Positive amplification in sediment samples from Moyna, Sardar Wetland, Khalsi, Beri Boar, and Kakdwip wetlands confirms the presence of O. niloticus in these regions. However, no amplification was detected in samples from Kolaghat and Akaipur wetlands, suggesting either the absence of the species in these ecosystems or a limitation in detection sensitivity due to low eDNA concentrations. Similarly, universal Cox1 gene primers successfully amplified a 655 bp product in tissue samples from multiple fish species, including O. niloticus, Cirrhinus cirrhosus, Mystus cavasius, Carassius auratus, and Mystus gulio, as well as sediment samples from East Kolkata Wetlands (Sardar Wetland) and a pond. Interestingly, no Cox1 amplification was observed in sediment samples from the Ganga River (Dui Paoisar Ghat), indicating a potential absence or extremely low abundance of O. niloticus eDNA in this major riverine system (Figure 8).
Figure 8
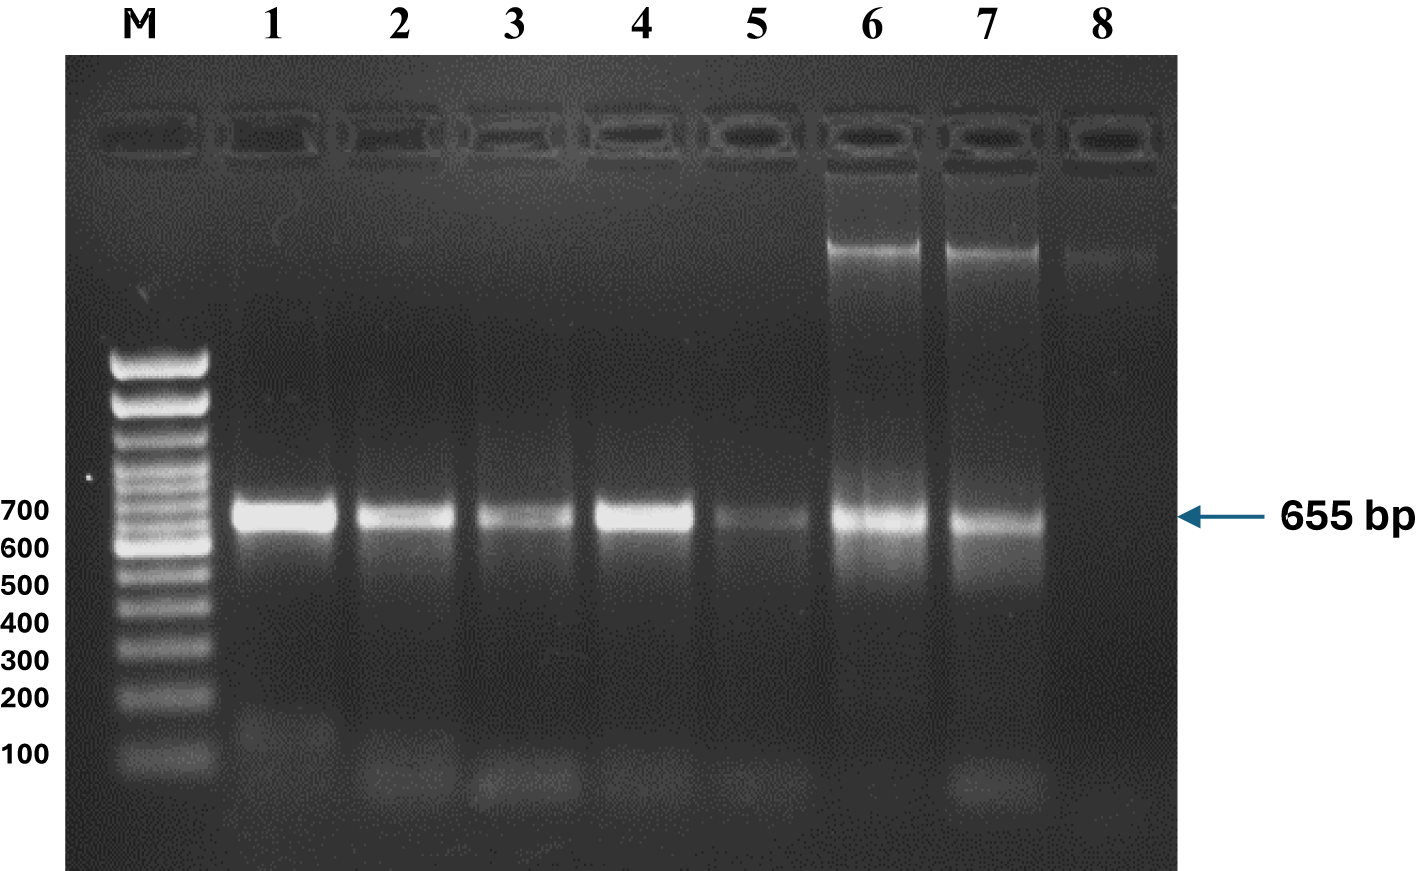
PCR amplification of the Cox1 gene in fish tissue and sediment samples from various aquatic ecosystems in Eastern India. DNA was isolated from (1) Oreochromis niloticus, (2) O. mossambicus, (3) Cirrhinus mrigala, (4) Mystus cavasius, (5) M. gulio, (6) Culture Pond Soil eDNA, (7) EKW (Sardar Wetland) Soil eDNA, and (8) Ganga River (DuPaisar Ghat) Soil eDNA. PCR amplification results of the Cox1 gene (655 bp) using universal primers in tissue samples from Nile Tilapia (Oreochromis niloticus), Mrigal (Cirrhinus cirrhosus), Gangetic Mystus (Mystus cavasius), Goldfish (Carassius auratus), and Long Whiskers Catfish (Mystus gulio), as well as sediment samples from a pond, East Kolkata Wetlands (Sardar Wetland), and the Ganga River (Dui Paoisar Ghat). The gene was successfully amplified in all fish tissue samples and sediment samples from the pond and East Kolkata Wetlands, but not in the Ganga River sediments, suggesting the absence or extremely low abundance of the target species in the river sediments. A 100 bp molecular weight ladder was used for reference. Each PCR experiment was repeated five times to ensure consistency, and environmental DNA (eDNA) was extracted and analyzed to confirm the presence of species across sampling sites.
Tilapia’s resilience to suboptimal environmental conditions makes it a promising candidate for aquaculture in Eastern India. Its ability to withstand fluctuating temperature, pH, and oxygen levels enables successful cultivation across diverse aquatic systems (Imsland and Jonassen, 2003). However, site-specific management interventions are necessary to optimize production. For instance, aeration systems should be implemented in sites with lower DO levels to enhance oxygen availability (DeLong, 2009). Similarly, in high-temperature locations like Sardar Wetland, stocking density adjustments and shade provision may mitigate thermal stress (Ma et al., 2006). Tilapia culture is widely practiced, yet inadequate knowledge of aquaculture systems limits productivity, particularly in developing regions (Machena and Moehl, 2001). Growth performance is influenced by feed quality (Sadowski et al., 2011), stocking density (Ma et al., 2006), biotic (Imsland and Jonassen, 2003) and abiotic factors, including temperature and dissolved oxygen (Imsland et al., 2007; Bhatnagar and Devi, 2013). Optimal tilapia growth occurs at 25–27°C and pH 6–9 (van de Walle and Hammerschmid, 2011). Effective aquaculture depends on water quality parameters such as DO, pH, and BOD (Ngugi et al., 2007; DeLong, 2009). The growth of Nile tilapia (Oreochromis niloticus), an ideal aquaculture species due to its adaptability, reproductive efficiency, and low trophic feeding behavior is maximized at temperatures between 25 and 27°C and pH levels of 6 to 9 (van de Walle and Hammerschmid, 2011).
The differential detection of O. niloticus across sampling sites highlights the species’ adaptability and invasion potential in lentic systems such as ponds and wetlands, where it thrives under relatively stable environmental conditions. Conversely, the absence of detectable eDNA in Ganga River sediment suggests either localized eradication efforts, environmental constraints limiting the survival of O. niloticus, or a low-density population below the detection threshold. These findings align with previous studies, which indicate that riverine systems with high flow dynamics often exhibit lower eDNA detectability due to increased dilution and degradation rates.
The successful detection of O. niloticus eDNA in sediment samples provides strong evidence for the effectiveness of molecular approaches in monitoring invasive species. Traditional survey methods often fail to detect cryptic or low-density populations, whereas eDNA analysis offers a highly sensitive and non-invasive alternative. By enabling early detection, this approach enhances biosecurity measures and informs management strategies to mitigate the ecological impact of O. niloticus in vulnerable aquatic ecosystems. Future research should focus on expanding eDNA sampling across a broader spatiotemporal scale to refine detection probabilities and understand seasonal variations in the population dynamics of O. niloticus. Moreover, integrating next-generation sequencing (NGS) approaches could facilitate the simultaneous monitoring of multiple invasive species, providing a more comprehensive assessment of biodiversity shifts in Eastern India’s aquatic ecosystems.
One of the key strengths of eDNA is its ability to detect species at different life stages and in varying environmental conditions. Several studies have demonstrated the utility of targeted qPCR and metabarcoding approaches for detecting well-established and emerging invasive taxa (LeBlanc et al., 2020; Duarte et al., 2023). For instance, highlighted the role of eDNA metabarcoding in comprehensive biodiversity assessments, enabling early warning systems in aquatic ecosystems. Similarly, Mauvisseau et al. (2019a) successfully applied eDNA techniques to detect parthenogenetic crayfish, demonstrating the method’s effectiveness for monitoring species with cryptic reproductive strategies.
Despite its advantages, several challenges and limitations persist. Sensitivity and specificity of detection assays remain a concern, particularly in complex environmental matrices where degradation, inhibition, and contamination can impact results (Adrian-Kalchhauser and Burkhardt-Holm, 2016; Klymus et al., 2017). The need for standardized methodologies, including marker optimization and validation across different ecological contexts, has been emphasized to enhance the robustness of eDNA-based monitoring (Fonseca et al., 2023; Langlois et al., 2021). Moreover, the temporal and spatial persistence of eDNA signals can introduce uncertainties in species presence and abundance estimations, necessitating complementary verification methods such as direct observations or netting surveys (Sepulveda et al., 2020; Valentin et al., 2018). The integration of eDNA approaches into management frameworks has also raised policy and practical considerations. While several studies have provided guidance on best practices for eDNA-based invasive species surveillance (Abbott et al., 2021; Westfall et al., 2020), the question of when eDNA detections should trigger management interventions remains debated (Sepulveda et al., 2023). For example, targeted detection assays for species such as Rangia cuneata in European waters (Ardura et al., 2015) and Dikerogammarus haemobaphes (Mauvisseau et al., 2019b) have informed rapid response strategies. Yet, regulatory adoption of these tools varies across jurisdictions. Additionally, emerging innovations such as loop-mediated isothermal amplification (LAMP) assays offer improved field-deployable solutions for real-time detection, further expanding eDNA’s applicability in rapid biosurveillance (Porco et al., 2022). The environmental parameters across the studied aquatic ecosystems exhibited significant spatial variation, influencing the persistence and detectability of Oreochromis niloticus eDNA. Depth, transparency, temperature, pH, dissolved oxygen (DO), conductivity, and sediment composition collectively impacted eDNA degradation rates and detection efficiency. The shallowest site, Sardar Wetland (1.38 m), with high temperature (31.4°C) and elevated pH (8.91), likely experienced accelerated DNA decay, potentially reducing eDNA detection sensitivity. Conversely, deeper sites like Akaipur (4.5 m) and Khalsi (3.5 m) with greater transparency (55 cm) might have provided more stable conditions for eDNA persistence. Conductivity variations, ranging from 231 µS/cm (Akaipur) to 1238 µS/cm (Sardar Wetland), along with fluctuating DO levels (4–7.4 ppm), may have further influenced microbial degradation of eDNA. Nutrient dynamics also played a crucial role in shaping the aquatic environments. High chlorophyll-a concentration in Sardar Wetland (116.72 mg/m³) suggests eutrophic conditions, which could enhance microbial activity and accelerate DNA degradation. Similarly, elevated organic carbon levels in Sardar Wetland (4.8 mg/L) may have promoted microbial interactions, further affecting eDNA stability. Sediment composition was another critical factor, with sandy environments (e.g., Sardar Wetland: 81% sand) potentially allowing faster DNA dispersal than silty habitats (e.g., Kolaghat: 45.19% silt).
Species-specific PCR assays demonstrated exceptional sensitivity and specificity in detecting Oreochromis niloticus eDNA, with no cross-amplification observed in non-target species, confirming the robustness of the primer design. The presence of O. niloticus was successfully confirmed across five wetlands, Moyna, Sardar Wetland, Khalsi, Beri Boar, and Kakdwip, reinforcing the efficacy of eDNA-based surveillance in tracking the dynamics of invasive species. However, the absence of amplification in Kolaghat and Akaipur suggests either species absence or potential eDNA degradation, emphasizing the role of site-specific environmental factors in detection success. Cox1 gene amplification from fish tissues and sediment samples further validated the integrity of eDNA across multiple habitats, with successful amplification in most study sites except the Ganga River sediments, where no O. niloticus eDNA was detected. This absence suggests that either the species is at negligible abundance or that rapid DNA degradation in high-flow riverine systems hinders detection, underscoring the influence of hydrodynamic conditions on eDNA persistence. The lack of detectable O. niloticus eDNA in Kolaghat and Akaipur aligns with this finding, highlighting the need for optimized sampling strategies tailored to different aquatic environments. Environmental parameters were decisive in shaping eDNA persistence, as evidenced by significant spatial physicochemical variability across study sites. Sand-dominated sediments facilitated rapid DNA percolation, reducing retention, whereas silt-rich substrates promoted prolonged eDNA stability, thereby influencing detection success. Moreover, pH, conductivity, and carbonate concentrations significantly modulate DNA degradation rates, further reinforcing the necessity of integrating physicochemical profiling into eDNA-based monitoring frameworks. These findings highlight the complex interplay between molecular detection and environmental conditions, necessitating habitat-specific considerations for improving eDNA surveillance accuracy.
This study establishes eDNA as a highly effective, non-invasive tool for invasive species monitoring, with species-specific primers demonstrating exceptional diagnostic precision across diverse aquatic ecosystems. The successful application of eDNA technologies in detecting O. niloticus within lentic environments, coupled with observed detection limitations in lotic systems, underscores the need for further assay optimization. Future research should prioritize refining molecular protocols, improving sampling methodologies, and integrating predictive modeling to enhance the resolution of eDNA-based ecological assessments. These advancements will facilitate integrating eDNA tools into global invasive species management strategies, bridging molecular ecology with conservation policy and ecosystem management initiatives.
4 Conclusion
The study showed that environmental DNA (eDNA) could become a powerful and non-invasive tool for monitoring invasive fish species (e.g., Oreochromis niloticus) in aquatic ecosystems. We developed a specific and sensitive PCR assay using species-specific primers to detect O. niloticus across multiple wetlands while identifying its absence in select locations. The findings underscore the importance of eDNA in resolving spatial distribution patterns and assessing invasion risks with unprecedented precision. Physicochemical profiling reveals that environmental factors influence DNA persistence, offering novel insights into detection variability across diverse aquatic habitats. The study highlights the interplay between sediment composition, water chemistry, and hydrodynamic conditions in shaping eDNA stability, paving the way for habitat-specific optimization of molecular monitoring approaches. Moreover, refinement is essential for standardizing eDNA methodologies across different ecological settings, enhancing their reliability for long-term invasive species surveillance. The demonstrated efficiency of eDNA highlights its potential for detecting O. niloticus in aquatic ecosystems, which could be useful for determining the abundance of invasive species in various ecosystems and informing management guidelines. Future research should integrate eDNA monitoring with ecological modeling to predict invasion trajectories and assess population dynamics over time. Additionally, interdisciplinary collaborations involving policymakers, fisheries managers, and local communities will be crucial in formulating effective control measures.
Statements
Data availability statement
The original contributions presented in the study are publicly available. The nucleotide sequences of the COI gene have been deposited in the GenBank database under accession numbers PQ810007 (EKW1), PQ810734 (N2), PQ814753 (M.P4), PQ814801 (CP.T2), and PQ821106 (ON.T1).
Ethics statement
All experiments were performed according to the animal utilization protocol approved by the Institutional Animal Ethics Committee, ICAR-CIFRI, Kolkata, India (CIFRI-IAEC/17/2023-24) for the experimental setup. All procedures were made with maximal efforts to minimize fish suffering. The study was conducted in accordance with the local legislation and institutional requirements.
Author contributions
BD: Supervision, Validation, Conceptualization, Project administration, Writing – review & editing, Formal analysis, Funding acquisition, Visualization. BM: Formal analysis, Data curation, Writing – original draft, Investigation, Software, Resources. VK: Writing – review & editing, Supervision, Resources, Investigation, Methodology, Data curation, Formal analysis. SR: Data curation, Writing – review & editing, Methodology, Formal analysis. SD: Methodology, Data curation, Writing – review & editing, Formal analysis. SS: Methodology, Data curation, Writing – review & editing, Formal analysis.
Funding
The author(s) declare that financial support was received for the research and/or publication of this article. This study was funded by the Ministry of Jal Shakti, National Mission for Clean Ganga (NMCG), under the project titled “Fish Conservation and Stock Enhancement of Fishery in the Ganga River Basin” (Ad-35012/1/2023-NMCG-NMCG).
Acknowledgments
The authors thank the ICAR-CIFRI Director for supporting the experiment trials and analysis.
Conflict of interest
The authors declare that the research was conducted in the absence of any commercial or financial relationships that could be construed as a potential conflict of interest.
Generative AI statement
The author(s) declare that no Generative AI was used in the creation of this manuscript.
Publisher’s note
All claims expressed in this article are solely those of the authors and do not necessarily represent those of their affiliated organizations, or those of the publisher, the editors and the reviewers. Any product that may be evaluated in this article, or claim that may be made by its manufacturer, is not guaranteed or endorsed by the publisher.
Supplementary material
The Supplementary Material for this article can be found online at: https://www.frontiersin.org/articles/10.3389/fmars.2025.1614086/full#supplementary-material
References
1
Abbott C. Coulson M. Gagné N. Lacoursière-Roussel A. Parent G. J. Bajno R. et al . (2021). Guidance on the use of targeted environmental DNA (eDNA) analysis for the management of aquatic invasive species and species at risk (Ottawa, ON, Canada: Canadian Science Advisory Secretariat (CSAS).
2
Adrian-Kalchhauser I. Burkhardt-Holm P. (2016). An eDNA assay to monitor a globally invasive fish species from flowing freshwater. PLoS One11, e0147558. doi: 10.1371/journal.pone.0147558
3
APHA (2017). Standard Methods for the Examination of Water and Wastewater (23rd ed.). (Washington DC: American Public Health Association).
4
Ardura A. Zaiko A. Martinez J. L. Samulioviene A. Semenova A. Garcia-Vazquez E. (2015). eDNA and specific primers for early detection of invasive species–A case study on the bivalve Rangia cuneata, currently spreading in Europe. Mar. Environ. Res.112, 48–55. doi: 10.1016/j.marenvres.2015.09.013
5
Baldwin M. W. Keelan J. P. R. Fehr B. Enns V. Koh-Rangarajoo E . (1996). Social-cognitive conceptualization of attachment working models: Availability and accessibility effects. J. Personality Social Psychol.71 (1), 94.
6
Bhatnagar A. Devi P. (2013). Water quality guidelines for the management of pond fish culture. Int. J. Environ. Sci.3, 1980–2009. doi: 10.6088/ijes.2013030600019
7
Bohmann K. Evans A. Gilbert M. T. P. Carvalho G. R. Creer S. Knapp M. et al . (2014). Environmental DNA for wildlife biology and biodiversity monitoring. Trends Ecol. Evol.29, 358–367. doi: 10.1016/j.tree.2014.04.003
8
Bremner J. M. (1960). Determination of Nitrogen in Soil by the Kjeldahl Method. J. Agric. Sci.55, 11–33. doi: 10.1017/S0021859600021572
9
Brock R. E. (1982). A critique of the visual census method for assessing coral reef fish populations. Bull. Mar. Sci.32, 269–276.
10
Bunce M. Szulkin M. Lerner H. R. L. Barnes I. Shapiro B. Cooper A. Holdaway R. N . (2005). Ancient DNA provides new insights into the evolutionary history of New Zealand's extinct giant eagle. PLoS biology. 3 (1), e9.
11
Chin S. L. Siang T. K . (2018). Challenges in managing marine bio-invasions via shipping in Singapore. ASEAN J. Sci. Technol. Develop.35 (1), 125–132.
12
Copp J. E. Giordano P. C. Longmore M. A. Manning W. D. (2017). Living with parents and emerging adults’ depressive symptoms. J. Family Issues38, 2254–2276. doi: 10.1177/0192513X15617797
13
DeLong E. F. (2009). The microbial ocean from genomes to biomes. Nature459, 200–206. doi: 10.1038/nature08059
14
Duarte S. Simões L. Costa F. O. (2023). Current status and topical issues on the use of eDNA-based targeted detection of rare animal species. Sci. Total Environ.904, 166675. doi: 10.1016/j.scitotenv.2023.166675
15
Esmaeili H. R. Eslami Barzoki Z. (2023). Climate change may impact Nile tilapia, Oreochromis niloticus (Linnaeus 1758) distribution in the Southeastern Arabian Peninsula through range contraction under various climate scenarios. Fishes8, 481. doi: 10.3390/fishes8100481
16
Ficetola G. F. Miaud C. Pompanon F. Taberlet P. (2008). Species detection using environmental DNA from water samples. Biol. Lett.4, 423–425. doi: 10.1098/rsbl.2008.0118
17
Fonseca F. Forrester M. Advinha A. M. Coutinho A. Landeira N. Pereira M. (2023). “Clostridioides difficile infection in hospitalized patients—a retrospective epidemiological study,” in Healthcare, vol. 12. (Basel, Switzerland: MDPI), 76.
18
Foote A. D. Thomsen P. F. Sveegaard S. Wahlberg M. Kielgast J. Kyhn L. A. et al . (2012). Investigating the potential use of environmental DNA (eDNA) for genetic monitoring of marine mammals. PLoS ONE. 7 (8), e41781. doi: 10.1371/journal.pone.0041781
19
Freyhof J. Ö. R. G. Yoğurtçuoğlu B. (2020). A proposal for a new generic structure of the killifish family Aphaniidae, with the description of Aphaniops teimorii (Teleostei: Cyprinodontiformes). Zootaxa4810, 421–451. doi: 10.11646/zootaxa.4810.3.2
20
Grammer G. L. Slack W. T. Peterson M. S. Dugo M. A. (2012). Nile tilapia Oreochromis niloticus (Linnaeus 1758) establishment in temperate Mississippi, USA: Multi-year survival confirmed by otolith ages. Aquat. Invasions7, 367–376. doi: 10.3391/ai.2012.7.3.008
21
Havel J. E. Kovalenko K. E. Thomaz S. M. Amalfitano S. Kats L. B. (2015). Aquatic invasive species: challenges for the future. Hydrobiologia750, 147–170. doi: 10.1007/s10750-014-2166-0
22
Hulme P. E. Pyšek P. Nentwig W. Vilà M. (2009). Will threat of biological invasions unite the European Union? Science324, 40–41. doi: 10.1126/science.1171111
23
Imsland A. K. Foss A. Koedijk R. Folkvord A. Stefansson S. O. Jonassen T. M. (2007). Persistent growth effects of temperature and photoperiod in Atlantic cod Gadus morhua. J. Fish Biol.71, 1371–1382. doi: 10.1111/j.1095-8649.2007.01600.x
24
Imsland A. K. Jonassen T. M. (2003). Growth and age at first maturity in turbot and halibut reared under different photoperiods. Aquacult. Int.11, 463–475. doi: 10.1023/B:AQUI.0000004191.43885.b2
25
Jeffrey S. W. Humphrey G .F. (1975). New spectrophotometric equations for determining chlorophylls a, b, c1 and c2 in higher plants, algae and natural phytoplankton. Biochemie und Physiologie der Pflanzen167, 191–194.
26
Jones J. C . (1992). Design methods. (John Wiley & Sons) P1–405.
27
Klymus K. E. Marshall N. T. Stepien C. A. (2017). Environmental DNA (eDNA) metabarcoding assays to detect invasive invertebrate species in the Great Lakes. PLoS One12, e0177643. doi: 10.1371/journal.pone.0177643
28
Knight J. M. (2010). Invasive ornamental fish: a potential threat to aquatic biodiversity in peninsular India. J. Threatened Taxa2, 700–704. doi: 10.11609/JoTT.o2179.700-4
29
Langlois V. S. Allison M. J. Bergman L. C. To T. A. Helbing C. C. (2021). The need for robust qPCR-based eDNA detection assays in environmental monitoring and species inventories. Environ. DNA3, 519–527. doi: 10.1002/edn3.v3.3
30
LeBlanc J. F. Germain M. Delage G. OʼBrien S. Drews S. J. Lewin A. (2020). Risk of transmission of severe acute respiratory syndrome coronavirus 2 by transfusion: A literature review. Transfusion60, 3046–3054. doi: 10.1111/trf.v60.12
31
Lovell S. J. Stone S. F. Fernandez L. (2006). The economic impacts of aquatic invasive species: a review of the literature. Agric. resource economics Rev.35, 195–208. doi: 10.1017/S1068280500010157
32
Ma W. J. Beck J. M. Latham P. E. Pouget A . (2006). Bayesian inference with probabilistic population codes. Nature Neuroscience, 9 (11), 1432–1438.
33
Machena C. Moehl J. (2001). African aquaculture: a regional summary with emphasis on Sub-Saharan Africa. (Bangkok, Thailand: Technical Proceedings of the Conference on Aquaculture in the Third Millennium) 341–355.
34
Mauvisseau Q. Davy-Bowker J. Bulling M. Brys R. Neyrinck S. Troth C. et al (2019a). Combining ddPCR and environmental DNA to improve detection capabilitiesof a critically endangered freshwater invertebrate. Sci. Rep. 9, 14064. doi: 10.1038/s41598-019-50571-9
35
Mauvisseau Q. Tönges S. Andriantsoa R. Lyko F. Sweet M. (2019b). Early detection of an emerging invasive species: eDNA monitoring of a parthenogenetic crayfish in freshwater systems. Manage. Biol. Invasions10, 461. doi: 10.3391/mbi.2019.10.3.04
36
Minchin D. Cook E. J. Clark P. F. (2013). Alien species in British brackish and marine waters. Aquat. Invasions8, 3–19. doi: 10.3391/ai.2013.8.1.02
37
Murphy J. A. M. E. S. Riley J. P. (1962). A modified single solution method for the determination of phosphate in natural waters. Analytica Chimica Acta, 27, 31–36.
38
Nelson D. W. Sommers L. E. (1996). Total carbon, organic carbon, and organic matter. Methods of soil analysis: Part 3 Chemical methods, 5, 961–1010.
39
Ngugi C. C. Bowman J. R. Omolo B . (2007). A new guide to fish farming in Kenya. P1–95.
40
Ogram A. Sayler G. S. Barkay T. (1987). The extraction and purification of microbial DNA from sediments. J. Microbiological. Methods7, 57–66. doi: 10.1016/0167-7012(87)90025-X
41
Paul J. H. Jiang S. C. Rose J. B. (1991). Concentration of viruses and dissolved DNA from aquatic environments by vortex flow filtration. Appl. Environ. Microbiol.57, 2197–2204. doi: 10.1128/aem.57.8.2197-2204.1991
42
Pawlowski J. Bruce K. Panksep K. Aguirre F. I. Amalfitano S. Apothéloz-Perret-Gentil L. et al . (2022). Environmental DNA metabarcoding for benthic monitoring: A review of sediment sampling and DNA extraction methods. Sci. Total Environ.818, 151783. doi: 10.1016/j.scitotenv.2021.151783
43
Porco D. Hermant S. Purnomo C. A. Horn M. Marson G. Colling G. (2022). eDNA-based detection of the invasive crayfish Pacifastacus leniusculus in streams with a LAMP assay using dependent replicates to gain higher sensitivity. Sci. Rep.12, 6553. doi: 10.1038/s41598-022-10545-w
44
Rhoades J. D . (1996). Salinity: Electrical conductivity and total dissolved solids. Methods of soil analysis: Part 3 Chemical methods5, 417–435.
45
Ruiz G. M. Carlton J. T. (2003). Invasive species: vectors and management strategiesxiii+–xi518. Washington USA: Island Press.
46
Sadowski J. Mastalerz A. Niznikowski T. Wisniowski W. Biegajlo M. Kulik M . (2011). The effects of different types of verbal feedback on learning a complex movement task. Polish J. Sport and Tourism. 18 (4), 308.
47
Sepulveda A. J. Dumoulin C. E. Blanchette D. L. McPhedran J. Holme C. Whalen N. et al . (2023). When are environmental DNA early detections of invasive species actionable? J. Environ. Manage.343, 118216. doi: 10.1016/j.jenvman.2023.118216
48
Sepulveda A. J. Hutchins P. R. Forstchen M. Mckeefry M. N. Swigris A. M. (2020). The elephant in the lab (and field): Contamination in aquatic environmental DNA studies. Front. Ecol. Evol.8, 609973. doi: 10.3389/fevo.2020.609973
49
Shuai F. Li J. (2022). Nile tilapia (Oreochromis niloticus Linnaeus 1758) invasion caused trophic structure disruptions of fish communities in the South China river—Pearl river. Biology11, 1665. doi: 10.3390/biology11111665
50
Stauffer J. R. Jr. Chirwa E. R. Jere W. Konings A. F. Tweddle D. Weyl O. (2022). Nile Tilapia, Oreochromis niloticus (Teleostei: Cichlidae): A threat to native fishes of Lake Malawi? Biol. Invasions24, 1585–1597. doi: 10.1007/s10530-022-02756-z
51
Strausberger B. M. Ashley M. V. (2001). Eggs yield nuclear DNA from egg-laying female cowbirds, their embryos and offspring. Conserv. Genet.2, 385–390. doi: 10.1023/A:1012526315617
52
Strayer D. L. (2010). Alien species in fresh waters: ecological effects, interactions with other stressors, and prospects for the future. Freshw. Biol.55, 152–174. doi: 10.1111/j.1365-2427.2009.02380.x
53
Su L. Swanson S. R. Chen X. (2016). The effects of perceived service quality on repurchase intentions and subjective well-being of Chinese tourists: The mediating role of relationship quality. Tourism Manage.52, 82–95. doi: 10.1016/j.tourman.2015.06.012
54
Taberlet P. Coissac E. Pompanon F. Brochmann C. Willerslev E. (2012). Towards next-generation biodiversity assessment using DNA metabarcoding. Mol. Ecol.21, 2045–2050. doi: 10.1111/j.1365-294X.2012.05470.x
55
Thomas-Rüddel D. Winning J. Dickmann P. Ouart D. Kortgen A. Janssens U. et al . ashington, Invasive species: vectors and management stra.
56
Valentin R. E. Fonseca D. M. Nielsen A. L. Leskey T. C. Lockwood J. L. (2018). Early detection of invasive exotic insect infestations using eDNA from crop surfaces. Front. Ecol. Environ.16, 265–270. doi: 10.1002/fee.2018.16.issue-5
57
Wan D. Ong C. H. Kok V . (2002). Strategic human resource management and organizational performance in Singapore. Compensation Benefits Rev.34 (4), 33–42.
58
Ward R. D. Zemlak T. S. Innes B. H. Last P. R. Hebert P. D . (2005). DNA barcoding Australia's fish species. Philosophical Trans. Royal Soc.: Biol. Sci.360 (1462), 1847–1857.
59
Westfall K. M. Therriault T. W. Abbott C. L. (2020). A new approach to molecular biosurveillance of invasive species using DNA metabarcoding. Global Change Biol.26, 1012–1022. doi: 10.1111/gcb.14886
60
Yoccoz N.G. Bråthen K. A. Gielly L. Haile J. Edwards M. E. Goslar T et al . (2012). DNA from soil mirrors plant taxonomic and growth form diversity. Molecular Ecol.21 (15), 3647–3655.
Summary
Keywords
biodiversity assessment, environmental DNA, fisheries management, Oreochromis niloticus , species surveillance
Citation
Das BK, Mandal B, Kumar V, Roy S, Dalal S and Samanta S (2025) Molecular traces of invasion: eDNA-based high-resolution mapping of Nile tilapia (Oreochromis niloticus) across freshwater habitats of West Bengal, India. Front. Mar. Sci. 12:1614086. doi: 10.3389/fmars.2025.1614086
Received
18 April 2025
Accepted
03 June 2025
Published
30 June 2025
Volume
12 - 2025
Edited by
Yafei Duan, South China Sea Fisheries Research Institute, China
Reviewed by
Taner Yildiz, Istanbul University, Türkiye
Sofia Priyadarsani Das, National Taiwan Ocean University, Taiwan
Updates
Copyright
© 2025 Das, Mandal, Kumar, Roy, Dalal and Samanta.
This is an open-access article distributed under the terms of the Creative Commons Attribution License (CC BY). The use, distribution or reproduction in other forums is permitted, provided the original author(s) and the copyright owner(s) are credited and that the original publication in this journal is cited, in accordance with accepted academic practice. No use, distribution or reproduction is permitted which does not comply with these terms.
*Correspondence: Basanta Kumar Das, basantakumard@gmail.com
Disclaimer
All claims expressed in this article are solely those of the authors and do not necessarily represent those of their affiliated organizations, or those of the publisher, the editors and the reviewers. Any product that may be evaluated in this article or claim that may be made by its manufacturer is not guaranteed or endorsed by the publisher.