Abstract
Introduction:
Container relocation in port yards represents a canonical NP-hard problem, characterized by high-dimensional nonlinear constraints and stringent real-time decision-making requirements.
Methods:
This study proposes a unified framework integrating an Intelligent Decision-Driven Model (IDDM), an Adaptive Data Generator (ADG), and an Optimization–Learning Closed-Loop Framework (OLCF).
Results:
The IDDM leverages heuristic search and machine learning within a multi-stage decision mechanism to mitigate the curse of dimensionality; in two-dimensional scenarios involving 50–100 containers, the model achieves an average response time of 9.83 ± 0.12 µs and reduces relocation operations by 61.68%. In three-dimensional experiments at the scale of 104 containers, total computation time remains consistently below 60s, satisfying real-time scheduling requirements for automated guided vehicles (AGVs). Additionally, the ADG integrates physical constraints and spatial autocorrelation (Moran’s I = 0.3064) to generate high-fidelity, three-dimensional yard configurations at a rate of 105 instances per cycle. Predictive models trained on this dataset achieve coefficient-of-determination values of R2 ≥ 0.85 (peaking at 0.882) across large-scale fully automated, medium-scale semi-automated, and small-scale conventional yard typologies. The OLCF methodology extracts and quantifies 17 key performance indicators. A multi-layer stacked ensemble predicts relocation counts with 90.76% accuracy (R2 = 0.9139), while a dynamic constraint-weighting mechanism balances movement frequency and energy consumption, thereby enhancing green operational efficiency in high-density container yards.
Discussion:
From both theoretical and practical perspectives, this work establishes a multi-stage collaborative optimization pathway by systematically integrating data-driven and model-driven approaches, limits strategy-generation time for 105-container-scale yards to under 60s, and provides a scalable technological paradigm for smart-port development, sustainable logistics, and the attainment of dual-carbon objectives.
1 Introduction
1.1 Research background
Modern logistics systems are undergoing significant transformation due to global value chain restructuring and the Fourth Industrial Revolution. This transformation features the integration of intelligent technologies with sustainable development paradigms. In response to global “Dual Carbon” objectives and new industrialization demands, the General Office of the State Council of China issued the “14th Five-Year Plan for Modern Logistics Development” (Guobanfa [2022] No. 17). This policy establishes “intelligent and green” development as the core strategy for logistics systems and promotes innovation in transportation routing, vehicle scheduling, and clean energy utilization driven by artificial intelligence (AI). Such policy orientation provides institutional support for applying combinatorial optimization (CO) theories and creates a framework for interdisciplinary research.
1.2 Technological bottlenecks
It is well established that the world’s oceans cover more than 70 percent of the Earth’s surface, and over 80 percent of global cargo is transported by sea. From transoceanic trade to the growing utilization of inland waterways, maritime and riverine shipping serve as the backbone of both global and regional economies. As traffic on inland waterways continues to rise, concerns over navigational safety and environmental impact have intensified, placing ever more stringent demands on green logistics (Chen et al., 2022; Zou et al., 2025).
Against this backdrop, transportation routing and optimized load efficiency represent core technological challenges within green logistics systems. Conventional CO methods have established mature theoretical frameworks for classical scenarios such as the Traveling Salesman Problem (TSP) and the Vehicle Routing Problem (VRP). However, these methods face inherent scalability limitations when addressing dynamic environmental constraints, nonlinear carbon-emission targets, and real-time decision-making requirements due to their NP-hard nature. For instance, container-port operations must simultaneously satisfy time-window constraints, handle dynamic task insertions, and respect resource-capacity limitations—all of which impose strict demands on the responsiveness of optimization algorithms. Empirical studies indicate that conventional exact algorithms exhibit time complexities on the order of when tackling threedimensional container-loading problems at the scale of thousands of containers. This complexity renders them unable to fulfill the millisecond-level decision-making requirements of modern automated terminals (Zhao et al., 2016).
Figure 1 illustrates the evolution of CO from an experience-driven approach to a data intelligencedriven approach. AI methods, particularly deep learning, offer two significant advantages. First, these methods automatically extract high-level decision rules through end-to-end feature learning, reducing reliance on domain expertise. Second, they enable the construction of general-purpose solvers with crossscenario transfer capabilities and real-time inference abilities. However, existing research faces three main limitations: approximate solutions lack strict theoretical guarantees; model performance varies with training data distribution; and generalization under high-dimensional dynamic constraints remains limited (Hu et al., 2022; Bi et al., 2022; Jiang et al., 2024). In response, recent work explores novel “learning–optimization” collaborative frameworks. These include optimizing branch-and-bound strategies through reinforcement learning and employing graph neural networks to generate high-quality initial solutions that accelerate metaheuristic search. Such approaches are fundamentally reshaping CO methodology (Kool et al., 2018).
Figure 1
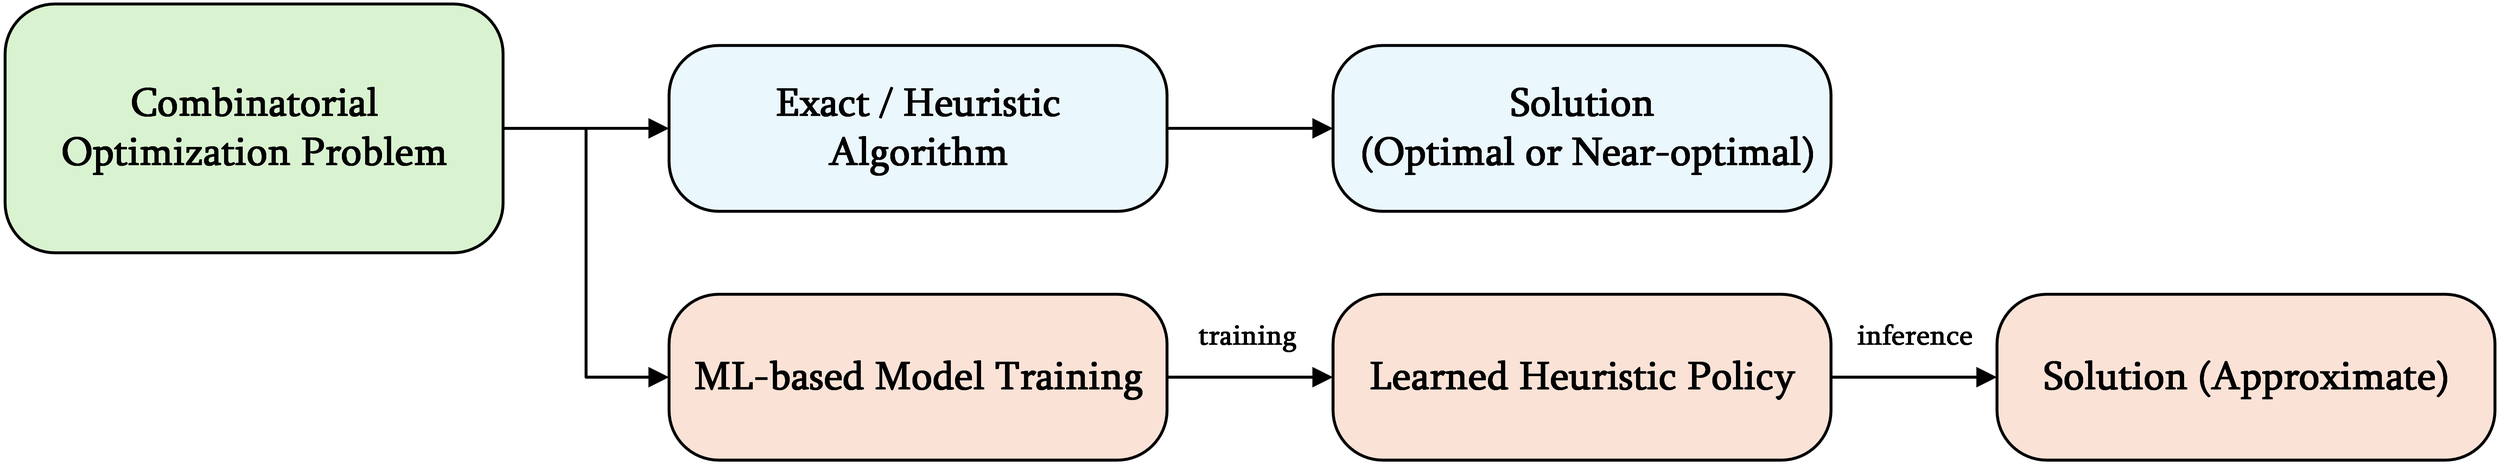
Schematic diagram of the evolution of combinatorial optimization solution paradigms.
1.3 Port logistics
Container ports, serving as critical hubs in international trade, function as complex systems with multiple interacting agents, operational scales, and competing objectives. Among various challenges, the container relocation problem (CRP) has become a research focus due to its impact on economic efficiency and environmental sustainability. Industry data indicate that traditional operating methods result in container relocation rates of 30%–40%, increasing energy consumption by 15%-20% and prolonging operational cycles by over 40% (Lee and Hsu, 2007; Carlo et al., 2014). From a computational complexity perspective, this problem can be modeled as a three-dimensional container loading problem with dynamic constraints, with the solution space growing exponentially with the number of containers. Recent studies demonstrate that novel algorithms based on mixed-integer programming (MIP) can reduce container relocation rates to 12%–18% for problems involving thousands of containers while maintaining millisecond-level response times, meeting the real-time scheduling needs of modern automated ports (Almasan et al., 2022; Munikoti et al., 2024; Liu et al., 2024).
1.4 Innovative contributions
To address the challenges outlined above, this research presents a dual-engine “intelligent optimization–data-driven” collaborative framework with three key methodological breakthroughs:
-
An Intelligent Decision-Driven Model (IDDM) and Algorithm (IDDA). For the CRP in port terminals, an IDDM is developed with two critical improvements. First, a priority scoring mechanism is designed to map high-dimensional discrete decision space into a differentiable weight optimization problem, yielding approximately optimal solutions in polynomial time. Second, an IDDA is constructed to circumvent the curse of dimensionality through dynamic penalty function adjustment. The experimental results demonstrate that in typical two-dimensional scenarios (50–100 containers), the model reduces container relocations by 61.68% with a per-container response time of 9.83 ± 0.12 µs. This represents an improvement of three orders of magnitude over conventional algorithms. In three-dimensional scenarios with tens of thousands of containers, computation time remains under 60 seconds, thereby satisfying real-time port operation requirements;
-
An Adaptive Data Generator (ADG). Due to limitations in existing datasets regarding dimensional representation and scenario diversity, an ADG for the CRP is developed. Its core innovations include the application of constraint satisfaction paradigms to data generation. This application enables adaptive configuration and automated verification of multiple dynamic constraints. Additionally, it involves the construction of a three-dimensional spatial feature enhancement module that generates yard data with spatial autocorrelation (Moran’s I = 0.3064, Z = 5.32, p< 0.001). Compared to benchmark datasets, ADG significantly improves spatial feature simulation accuracy and provides high-quality data for algorithm training and evaluation;
-
An Optimization-Learning Closed-loop Framework (OLCF). To integrate the complementary advantages of optimization algorithms and AI methods, an OLCF with a bidirectional empowerment mechanism is designed. The first component is learning-assisted optimization, where interpretable machine learning methods are employed to identify 17 key features that guide algorithm search direction. The second component is optimization-guided learning, where a multi-level stacked ensemble model with ridge regression as its meta-learner (α = 0.5) achieves 90.76% prediction accuracy (R2 = 0.9139, p< 0.001). In tests with 100,000 initial matrices, the framework completes container relocation prediction within 60 seconds, providing a robust foundation for intelligent decision-making in complex dynamic environments.
2 Literature review
The optimization of container port logistics systems has become a key research topic in modern transportation, driven by the restructuring of global supply chains and the push for green logistics transformation. This section employs the CRP as an entry point to systematically review interdisciplinary advances in AI and CO.
2.1 Combinatorial Optimization Paradigms
Combinatorial optimization solution paradigms have evolved through distinct stages, as illustrated in Figure 2. The core driving force stems from synergistic breakthroughs in computational theory and information technology. Bengio et al. (2021) and Bai et al. (2023) first presented a systematic theoretical framework integrating machine learning with CO—known as Neural Combinatorial Optimization (NCO). They suggested that deep neural networks (DNNs) could implicitly learn high-level decision rules, potentially overcoming the theoretical limits of traditional algorithms in solution space search.
Figure 2
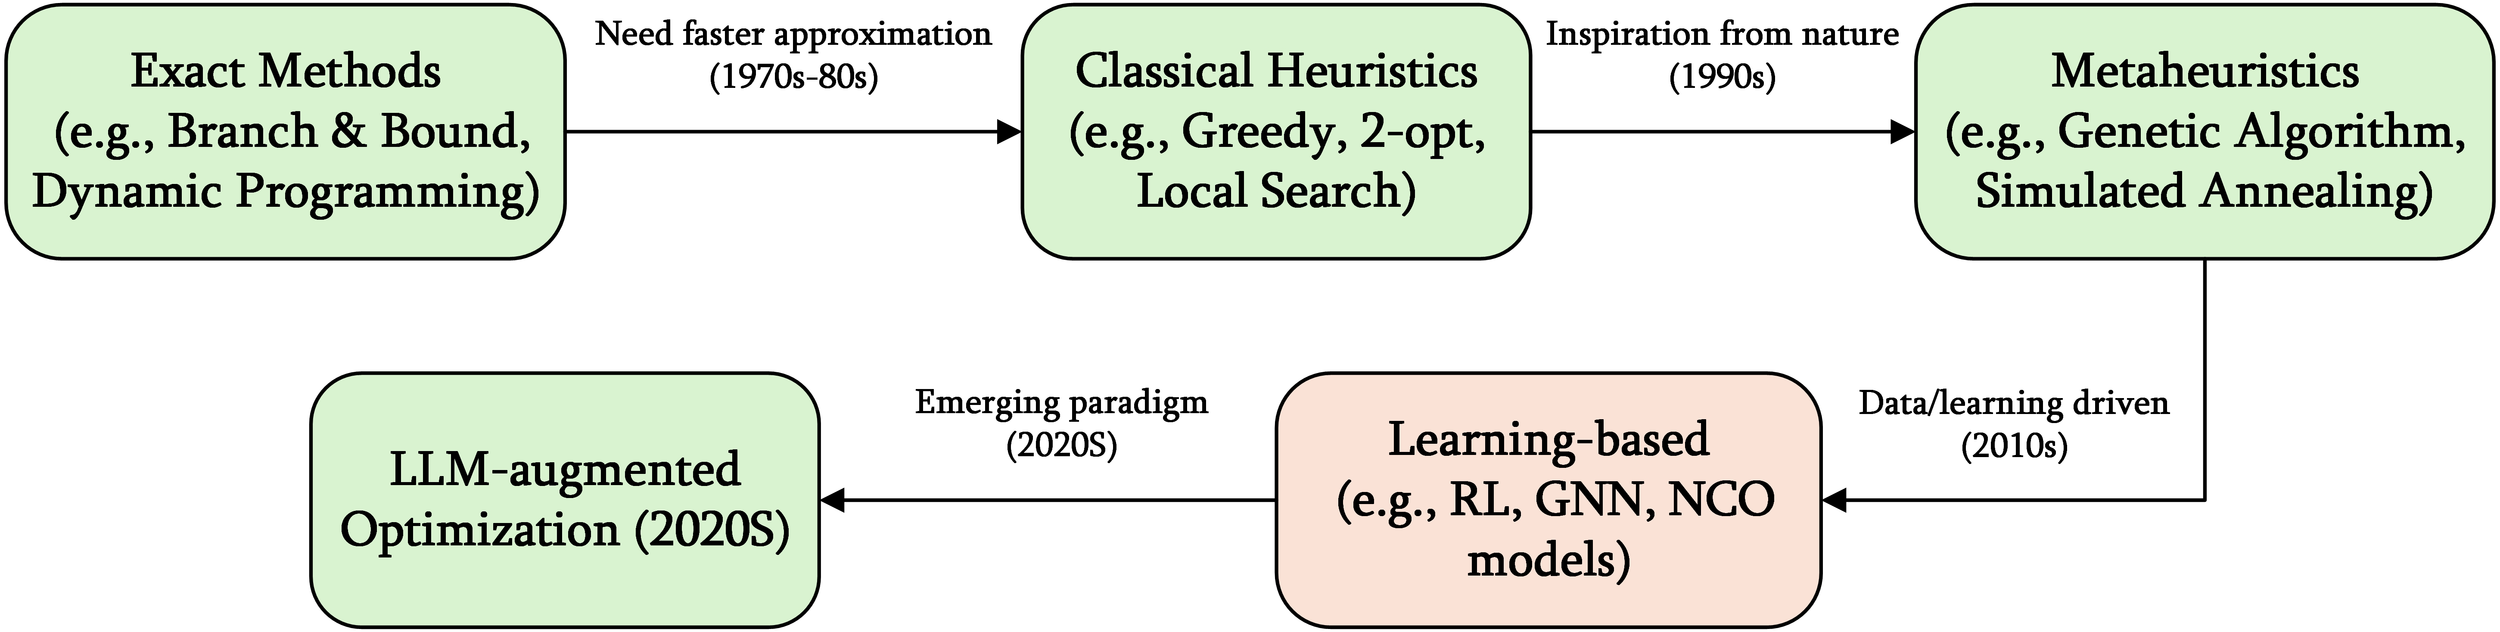
Schematic diagram of the evolution of combinatorial optimization strategies.
At the implementation level, the TSP served as a typical validation scenario in early studies. The Hopfield network (Hopfield and Tank, 1985) was the first neural network model to solve nonlinear optimization problems; however, its unstable convergence limited large-scale applications. The Pointer Network presented by Vinyals et al. (2015) employed attention mechanisms to model sequential decisionmaking, elevating end-to-end optimization paradigms. Subsequent studies combined attention mechanisms (Kool et al., 2018), graph neural networks (Khalil et al., 2017), and reinforcement learning (Nazari et al., 2018) to scale problems to tens of thousands of nodes. Jing et al. (2022) proposed a cooperativecontrol strategy for dynamic on-ramp merging scenarios, significantly enhancing the real-time optimization performance of sequential decision-making and thereby providing robust safety assurance for traffic merging operations. Chen et al. (2023) developed an ensemble generative adversarial network framework to deliver high-precision ship detection under low-visibility conditions, thereby furnishing reliable perceptual support for combinatorial optimization tasks in complex maritime environments. These approaches enhanced model generalization in complex, large-scale scenarios, marking a paradigm shift from “algorithm design” to “strategy learning” (Lin et al., 2024).
2.2 CRP modeling theories
The Container Relocation Problem (CRP) represents a paradigmatic NP-hard challenge in container yard operations at port terminals. Under a predetermined retrieval sequence, its primary objective is to minimize the overall number of relocation moves necessary to retrieve each designated container. Established solution approaches predominantly employ dynamic programming formulations, branch-and-bound algorithms, and heuristic search strategies to produce often suboptimal solutions within acceptable computational budgets.
CRP modeling theories are commonly divided into three key stages (Table 1). The early exploration stage (1990–2010) was dominated by heuristic rules. The mid-stage development (2010–2020) focused on MIP, while the current innovation stage (2020–present) shifted toward data-driven methods. In a pioneering study, Watanabe (1992) established the first prediction model for the number of container relocations. However, practical applications were limited by overly idealized static assumptions. Subsequently, Caserta et al. (2012) confirmed the NP-hard property of CRP through rigorous mathematical derivation and presented the standard model framework (CRP-I/II). Zehendner et al. (2015) significantly improved MIP problem-solving efficiency by applying upper-lower bound theory, marking an important milestone in CRP research. Petering and Hussein (2013) increased the computational efficiency of the CRP-III model through variable reduction techniques. However, the algorithm still exhibited exponential space complexity in three-dimensional scenarios, spurring the rapid development of learning algorithms.
Table 1
| Development Stage | Core Method | Main Contributions | Limitations |
|---|---|---|---|
| Early Exploration (1990-2010) | Heuristic Rules | Established basic problem definitions and classification systems (Watanabe, 1992) | Lacked rigorous mathematical proofs |
| Mid-Stage Development (2010-2020) |
MIP | Proposed standard models CRP-I/II/III (Caserta et al., 2012; Petering and Hussein, 2013; Zehendner et al., 2015) |
Computational complexity remains exponential |
| Current Innovation (2020-present) | Data-Driven Optimization | Achieved polynomial-time approximate algorithms (Galle et al., 2018; Jin, 2020) | Exhibits sensitivity to training data quality |
Comparison of developmental stages in CRP modeling theories.
2.3 Learning algorithms for the CRP
With the rapid advancement of AI technologies, algorithms capable of autonomously learning efficient container relocation strategies for the CRP have been developed, aiming to outperform classical heuristics and exact methods across problem instances of varying scales. Table 2 presents a comparative overview of these methods, detailing their algorithmic frameworks, experimental configurations, datasets, and principal findings.
Table 2
| Study | Algorithmic Framework | Experimental Setting | Dataset Source | Key Findings |
|---|---|---|---|---|
| Liu et al. (2023) | Dynamic Attention Mechanism |
2D single-bay yard |
Caserta et al. (2012) benchmark instances | Reduces relocation counts significantly compared to classical heuristics and consistently produces optimal or near-optimal solutions across multiple scales. |
| Ye et al. (2023) | Supervised Learning | 2D single-bay yard |
Self-generated random instances | Achieves 94% classification accuracy in predicting relocation requirements; feature-attribution analysis identifies the primary determinants of relocation counts, guiding further optimization. |
| Tang et al. (2024) | Predictive Model + DRL |
3D multi-bay yard | Historical import–export records from a real port |
Substantially reduces average relocations compared to rule-based and non-predictive RL approaches, demonstrating robust performance under randomized retrieval sequences. |
| Yan et al. (2024) | Beam Search + DRL |
2D single-bay yard |
Simulated scenario instances | Achieves near-optimal strategy quality, while beam-search integration further reduces relocation operations and maintains superior performance across varied random test scenarios. |
| Liu et al. (2025) | Q-learning + Heuristic Rules |
2D single-bay yard |
Caserta et al. (2012) benchmark instances | Consistently yields optimal or near-optimal solutions on public benchmarks, outperforming state-of-the-art exact algorithms and heuristics in relocation efficiency for large-scale instances. |
| Wang et al. (2025) | Operations- Research Model + DRL |
2D single-bay yard |
Mixed-integer programming– generated simulation data | Incorporation of operations-research lower-bound information significantly accelerates training convergence, resulting in more stable solution quality and enhanced generalization. |
Comparison of learning algorithms for the CRP.
Deep reinforcement learning (DRL) methods autonomously generate efficient container-relocation strategies without requiring manually designed rules, achieving substantial reductions in the number of relocation operations. Moreover, integrating DRL with classical optimization techniques or heuristic rules further enhances solution optimality and algorithmic robustness.
2.4 Sustainable logistics optimization methods
In the context of carbon neutrality strategies, logistics system optimization has gradually exhibited features of multi-objective collaboration. McKinnon et al. (2015) conducted an empirical study demonstrating that real-time dynamic route planning could reduce carbon emissions in urban distribution networks by 12–18%. Jiang et al. (2023) further verified this finding using a DRL framework. The multi-objective reward function presented in their study achieved significant improvements on the Pareto frontier between energy efficiency and timeliness. Additionally, a bibliometric analysis conducted by Nikseresht et al. (2024) indicated that the integration of Internet of Things (IoT) and Digital Twin technologies has become an important technical approach for reducing supply chain carbon emissions. Furthermore, decision-optimization problems in the field of maritime engineering have received widespread attention. For example, Cao et al. (2024) developed a decision-making framework for Chinese-style cruise ship design that is based on the informativeness-weight method and a group-consensus reaching model, providing a new approach for the multi-objective optimization of maritime equipment.
2.5 Research approaches
Based on a systematic review of existing literature, several research gaps have been identified. First, no universal theoretical framework exists for dynamic constraint modeling in three-dimensional scenarios, making adaptation to diverse port operating conditions difficult. Second, data generation mechanisms largely rely on human experience and cannot adequately support large-scale model training or cross-scenario generalization. To address these shortcomings, this research presents three innovative approaches:
-
MIP Model Based on Obstructing Container Relocation Strategies: This model leverages the inherent characteristics of the problem to compress the solution space, resulting in higher solving efficiency and better scalability in complex real-world scenarios;
-
Rapid Label Generation System: An automated label generation mechanism is designed to reduce manual annotation costs while offering scalable data support for large-scale model training and cross-scenario applications;
-
Cooperative Optimization Mechanism for Container Handling Efficiency and Energy Consumption: Within a sustainable decision-making framework, this mechanism integrates operational efficiency with carbon emission factors to provide data support and algorithmic assurance for the green transformation of port logistics.
These theoretical and methodological innovations facilitate the evolution of CO from “algorithmic innovation” to “system optimization” and offer a new methodological foundation for intelligent and green upgrading of port logistics.
3 Intelligent decision-driven model
In the context of a three-dimensional container yard, this section presents an Intelligent Decision-Driven Model (IDDM) for the CRP. The model employs a priority sequence to guide the optimization process, thereby effectively mitigating secondary container relocations triggered by extraction operations.
3.1 Problem description
Modern container port scheduling systems typically face three primary constraints:
-
Spatial Constraints: Limited yard capacity conflicts with rapidly increasing throughput demands;
-
Temporal Constraints: Operational timeliness requirements conflict with high-frequency turnover needs;
-
Economic Constraints: Equipment energy consumption and labor costs require balancing in dynamic environments.
Intelligent scheduling systems often address these constraints through a multi-attribute collaborative clustering strategy. A dynamic partitioning mechanism is established based on comprehensive evaluation of container properties: physical attributes (weight and dimensions), logistics attributes (multimodal transport routes and destination port clusters), and commercial attributes (shipper priority and tariff status). This process forms a four-dimensional topological structure represented as “block → bay → stack → tier,” as shown in Figure 3.
Figure 3
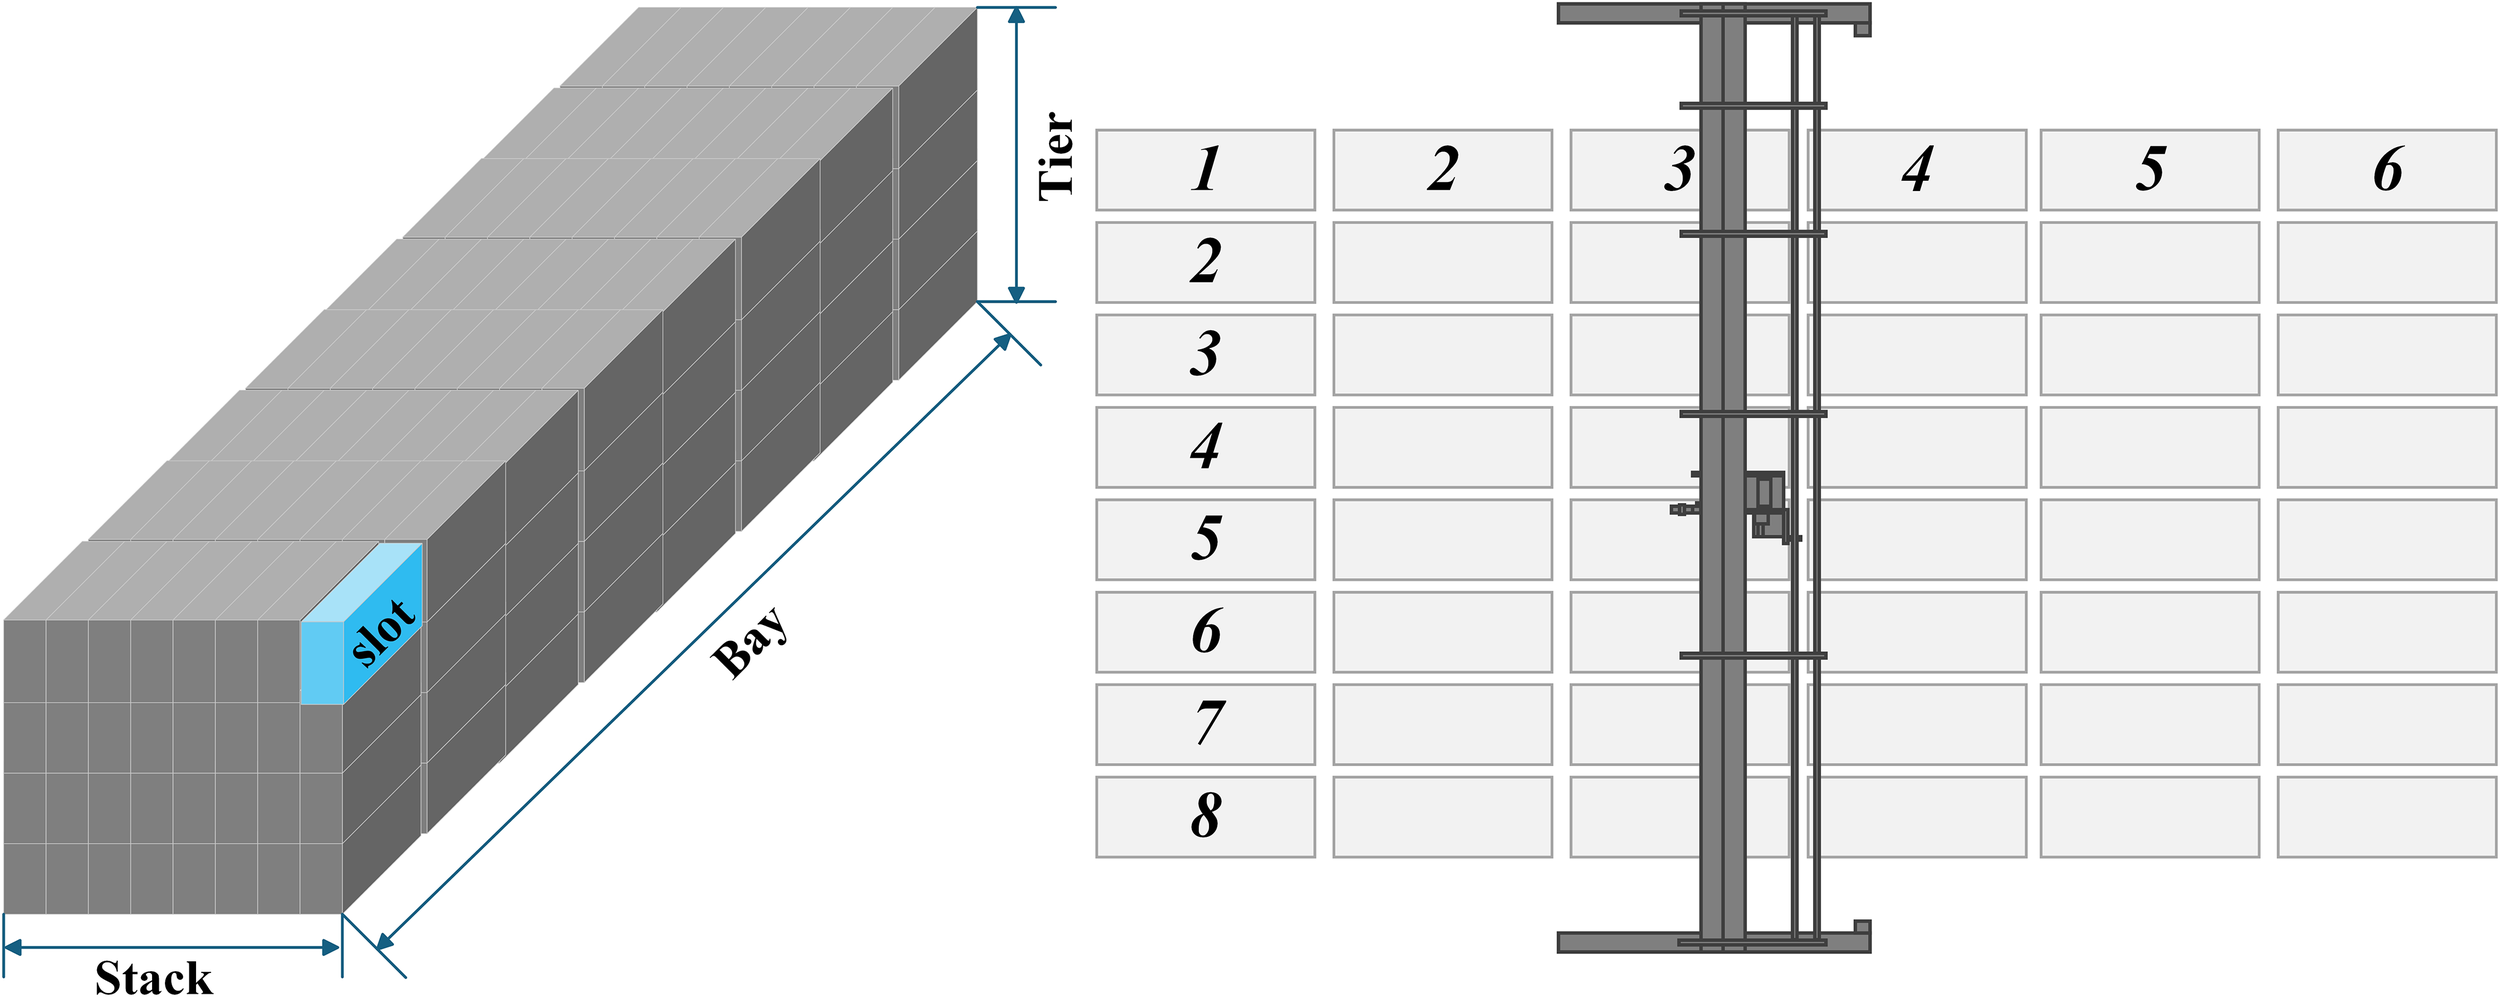
Schematic diagram of container yard spatial topology.
To ensure the feasibility and prediction accuracy of the constructed model, this study adopts the following core assumptions:
-
Closed System Assumption: The total number of containers remains unchanged throughout the operation cycle, i.e., ;
-
Static Configuration Assumption: The initial stacking state tensor and the target container extraction sequence are determined during preprocessing;
-
Tensor Representation: The three-dimensional stacking state of the yard is represented by the tensor , where , , and denote vertical tiers, horizontal stacks, and bays, respectively;
-
Temporal Constraints: Container extraction operations must satisfy time monotonicity, i.e., ;
-
Physical Constraints: Single-step operations are performed only on containers at stack tops. Target containers at the top can be directly extracted; otherwise, container relocation must occur first;
-
Dynamic Obstructing Assumption: If obstructing containers exist above the target container (i.e., instantaneous obstructing set ), these containers must be relocated before the target container can be extracted.
3.2 Model development
3.2.1 Symbol system
Table 3 summarizes the definitions of the primary parameters and decision variables incorporated in the model.
Table 3
| Symbol | Domain | Description |
|---|---|---|
| T,S,B | Maximum stacking height (T), number of stacks (S), and number of bays (B). | |
| N | ≤ T ×S ×B −(T −1) | Total number of containers. |
| Yijk | {0,1,…,N} | Priority code assigned to the container at position (i,j,k). |
| Q | {q1,…,qN} | Prescribed retrieval sequence. |
| wijk | {0,1} | Indicator that an obstructing container is present above (i,j,k). |
| xijk | {0,1} | Indicator that the container at (i,j,k) can be retrieved directly. |
| fijk | {0,1} | Indicator that a relocation operation occurs at (i,j,k). |
| sijk | Spatio-temporal aggregate cost coefficient at (i,j,k). | |
| δ(j) | {0,1} | Indicator that two stacks belong to the same bay. |
| ψ(j) | — | Lexicographic priority vector of stack j. |
| α,λ | Weighting coefficients for relocation cost (α) and priorityloss (λ). |
Definitions of model parameters and variables.
(1) Indices i, j, and k denote tier, stack, and bay positions, respectively. (2) The upper bound N ≤ T ×S ×B −(T −1) guarantees that at least one column of height T remains partially empty, thus permitting direct extraction without relocating.
3.2.2 Decision workflow
Figure 4 illustrates the operational workflow of the IDDM, which comprises four sequential stages:
-
Initialization: The initial yard configuration Y0 and the prescribed retrieval sequence Q are loaded;
-
Obstruction Identification: For the current target container, the obstructing set of all containers above it is determined;
-
Optimal Decision Making: Subject to the multi-objective function and associated constraints, the optimal sequence of operations—relocations and/or retrievals—is computed;
-
Execution and Update: The selected operation—either a relocation or the direct retrieval of the target container—is executed; the yard state is then updated, and the workflow repeats for the next target.
Figure 4

Schematic representation of the decision-making workflow within the IDDM framework.
3.2.3 Key constraints
Key constraints ensuring model feasibility include (see Equations 1–5):
• Stack Height Safety Constraint:
This constraint prevents overstacking safety hazards by ensuring;
• Extract Accessibility:
Container extraction operations are permitted only on containers at stack tops, following the “last in, first out” principle;
• Relocation Necessity:
Container relocation operations are triggered only when obstructing containers exist above the target container;
• Cost Mapping Mechanism:
This equation links operational cost with the obstructing container indicator , reflecting that more relocations result in higher costs;
• Priority Lexicographic Order:
Optimization then proceeds strictly according to the lexicographic order ≺.
3.2.4 Objective function
Assuming that the system operates as a deterministic Markov Decision Process and that the retrieval schedule Q and yard state are fully known over the entire planning horizon, the IDDM framework achieves a dynamic trade-off between operational efficiency and cost by minimizing the following composite objective function (see Equation 6):
Here, the first term corresponds to the aggregate spatio–temporal cost; the second term reflects the relocation cost; and the third term imposes a priority-loss penalty, as quantified by the lexicographic rank of .
3.3 Multi-bay relocation example
A small-scale yard section comprising four bays, four stacks per bay, and three tiers is examined (Figure 5). Each slot is numbered sequentially from 1 to 42, with empty positions denoted by 0. Figure 6 depicts the container retrieval workflow under the four-stage lexicographic strategy:
-
Obstruction Identification (Stage 1). Determine the target container and its obstructing set;
-
Bay Coordination (Stage 2). Prioritize relocations within the same bay;
-
Minimization of Additional Obstructing (Stage 3). Among cost-equivalent alternatives, select the stack that introduces the fewest new obstructing containers;
-
Minimization of Lateral Movement (Stage 4). Choose the relocation requiring the shortest horizontal transfer distance;
-
Stack Height Balancing (Stage 5). If multiple candidates remain, select the stack with the lowest tier height to preserve downstream operational flexibility.
Figure 5
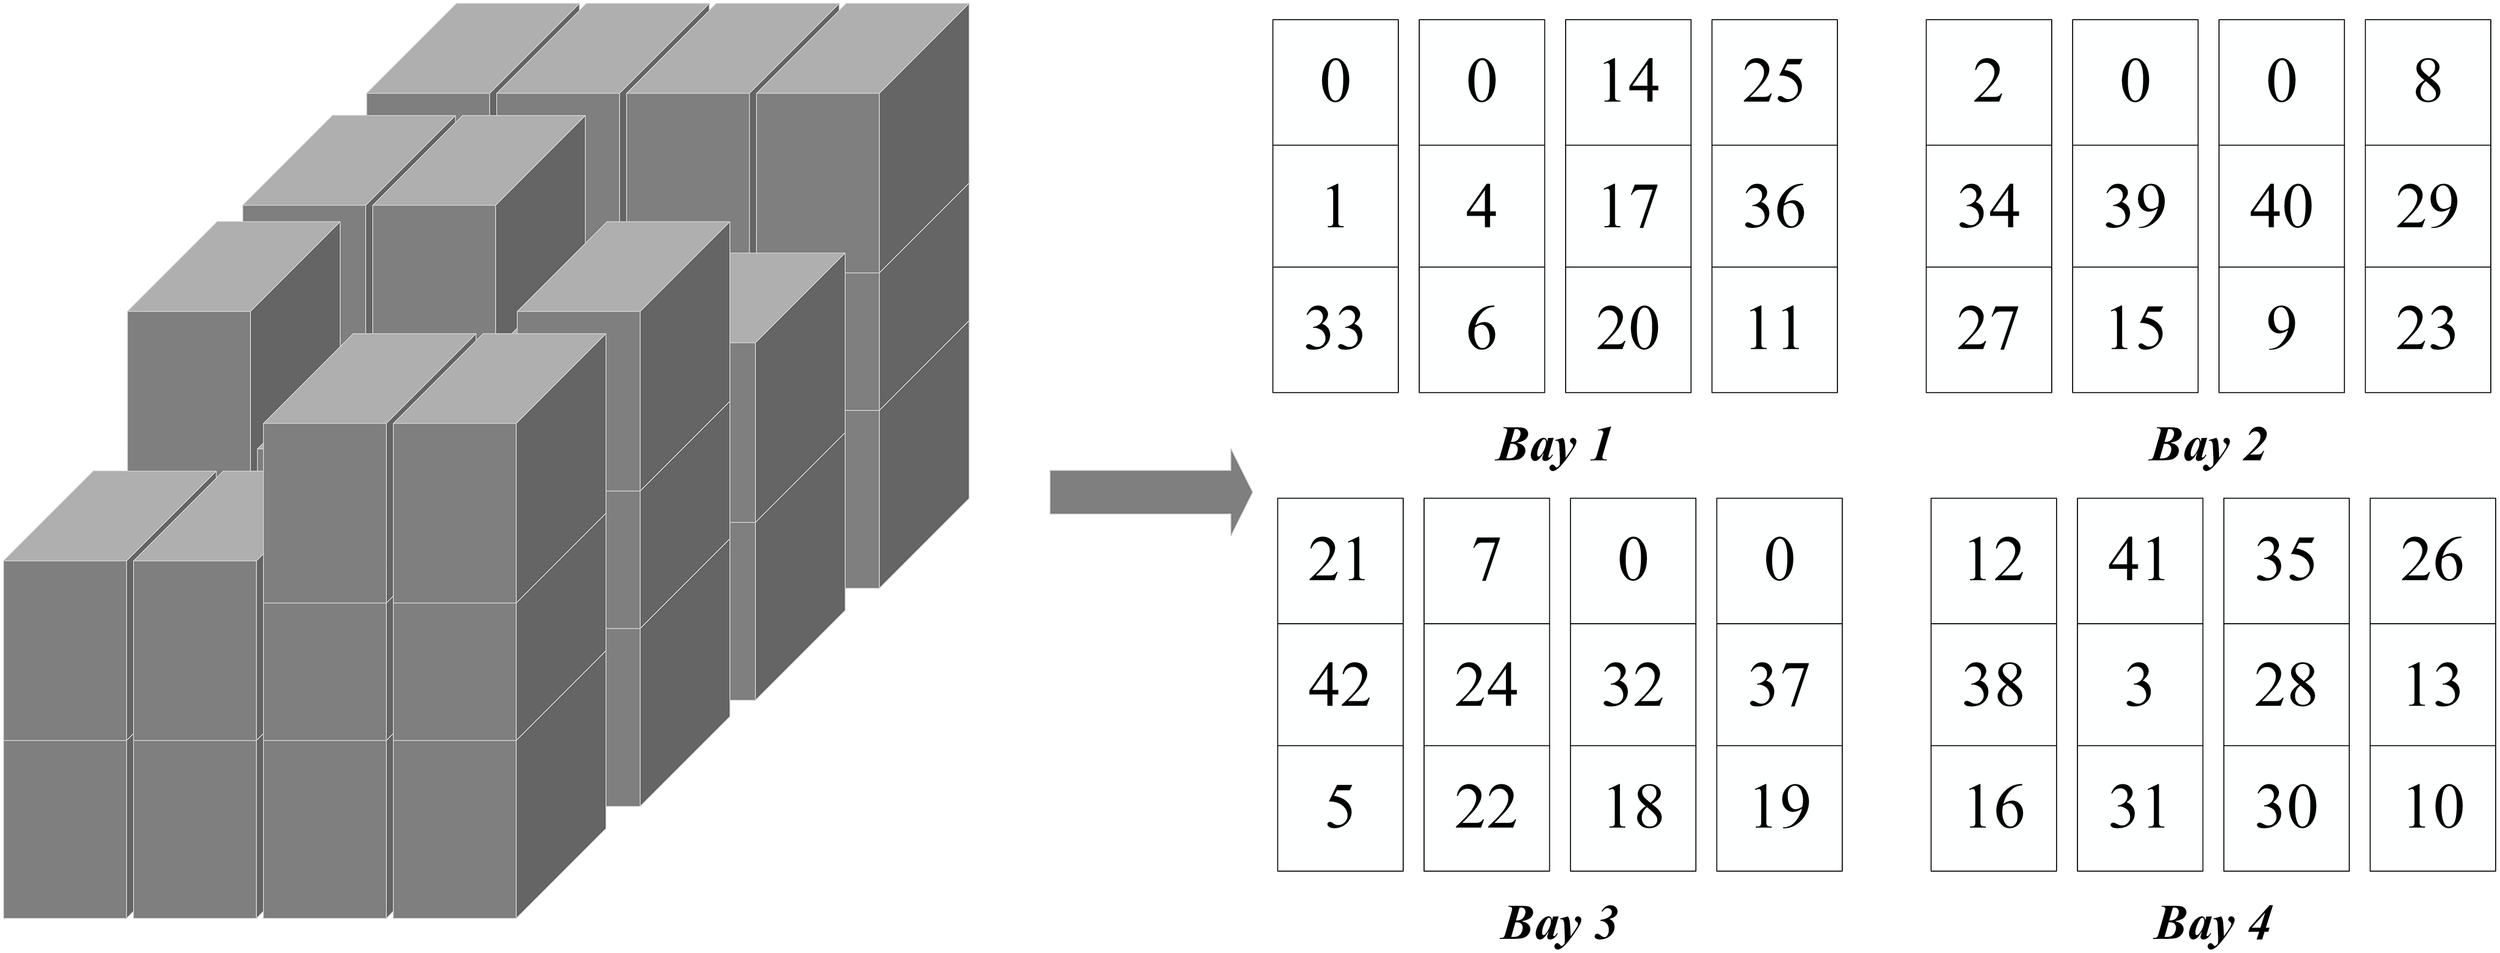
Schematic diagram of the initial yard-stacking configuration indicating each container’s priority level.
Figure 6

Process flowchart of the container retrieval procedure executed in parallel across the four operational stages.
Parallel implementation of the multi-stage lexicographic strategy markedly reduces the computational complexity of cross-bay relocations and improves overall operational efficiency in real-world yard operations, thereby underscoring its substantial potential for practical engineering application.
4 Intelligent decision-driven algorithm
For the optimization problem of container relocation in three-dimensional container yards, this section presents an Intelligent Decision-Driven Algorithm (IDDA) for the CRP. The algorithm combines a hierarchical decision-making mechanism with heuristic strategies to build a closed-loop optimization process consisting of “target identification → feasibility analysis → dynamic container relocation → state update”.
4.1 Hierarchical decision-making framework
The algorithm adopts a five-stage progressive decision-making architecture. Its core innovation lies in integrating a triple-sorting heuristic with a bay cooperation mechanism.
4.1.1 Environment modeling and initialization
First, a three-dimensional yard state matrix is constructed to precisely characterize the physical layout of the yard, where:
-
T denotes the maximum number of stackable tiers (constrained by the safety threshold Hmax);
-
S represents the total number of stacks (typically organized by bay areas);
-
B signifies the number of bays (used in computing the inter-bay movement penalty coefficient β).
Subsequently, the operation sequence O is initialized as ∅, the container relocation counter R is set to 0, and the system’s start timestamp Tstart is recorded to provide a basis for subsequent performance evaluations. Additionally, the initial number of containers N is calculated using an indicator function that counts all occupied positions (see Equation 7):
where denotes the set of all possible coordinates in the yard, thereby ensuring comprehensive global state awareness.
4.1.2 Task sequence planning
Based on the predetermined container extraction sequence , a priority queue is constructed via a dual-indexing mechanism:
-
Temporal Dimension: Adheres to the first-in-first-out (FIFO) principle;
-
Spatial Dimension: Clusters factors such as destination port to optimize the loading sequence.
The pre-calculated initial container extraction plan enables subsequent dynamic scheduling to effectively reduce the frequency of adjustments.
4.1.3 Dynamic priority scheduling
For each target container c ∈ Q in the sequence, the following steps are executed:
Step 1: Target Localization
Tensor slicing and fast retrieval techniques determine the three-dimensional coordinates of the target container (see Equation 8):
Step 2: Accessibility Detection
The existence of obstructing containers above the target container is evaluated as (see Equation 9):
Step 3: Operation Decision
Based on the accessibility detection result, one of the following procedures is executed:
-
If is true, the target container is directly extracted from the stack top; that is, set ;
-
Otherwise, the container relocation subroutine is invoked to relocate the obstructing containers. Once no obstructing containers remain above the target container, the formal extraction is performed.
4.1.4 Multi-objective container relocation strategy
When obstructing containers are detected, a triple sorting function is defined (see Equations 10–14):
where:
• quantifies the potential obstructing risk of the candidate stack to proactively reduce subsequent relocation operations:
• evaluates the horizontal movement distance to optimize short-term operational efficiency:
• represents the available stack height, measuring space utilization and operational stability:
The optimal target stack is selected through lexicographic minimization:
where denotes the set of feasible stacks. The algorithm prioritizes container relocation within the same bay to reduce additional penalties from inter-bay movements.
4.1.5 State Update and Feedback
To adapt to complex dynamic environments, a dual state update mechanism is implemented:
-
Explicit Update: After each container operation, the yard state matrix Y and operation sequence O are immediately updated. This process iterates until all target containers are successfully extracted;
-
Implicit Update: Based on impact predictions for subsequent operations, the weights of the triple sorting function are dynamically adjusted to balance container relocation cost, movement distance, and stack utilization.
After each iteration, the container relocation rate indicator is re-evaluated (see Equation 15):
(15)
When Δη > ηth, where ηth is the preset threshold, a strategy adjustment mechanism is triggered to prevent convergence to local optima.
4.2 Hierarchical decision-making algorithm
Algorithm 1 presents the complete pseudocode of IDDA, which combines hierarchical decision-making with dynamic feedback, enabling continuous optimization under multi-objective constraints.
Algorithm 1
Intelligent decision-driven algorithm (IDDA).
1:Input: Yard state tensor, container extraction sequence

2:Output: Operation sequence , number of container relocations , and total execution time

3:Procedure MAIN(Y,Q)
4:

5:

6: fortodo

7:

8:  ifthen

9:

10:

11:  else
12:

13:

14:

15:  end if

16: end for

17:

18: return

19: end Procedure

20: Function()
21:  fortodo

22:

23:

24:

25:   ifthen

26:

27:

28:

29:

30:   else

31:    fordo

32:     Inter-bay container relocation (similar to        lines 21–29)

33:    end for

34:   end if

35:  end for

36:  return (O, R)
37: end Function
4.3 Innovative advantages
Compared with traditional container relocation strategies, IDDA offers three main advantages:
-
Multi-objective Collaborative Mechanism: The algorithm integrates dynamic programming (Zhu et al., 2012) with heuristic rules (Kim and Hong, 2006). It simultaneously considers container relocation cost, obstructing risk, and space utilization through its triple sorting function. This approach significantly enhances decision completeness and environmental adaptability compared with conventional Lower Bound 1 (LB1) methods (Tanaka and Takii, 2016). This mechanism effectively addresses more complex and variable operational scenarios;
-
Adaptive Decision Architecture: The algorithm employs a two-layer decision framework, first attempting intra-bay container relocation to reduce inter-bay operation frequency; if no feasible solution exists, it resorts to inter-bay alternatives. Coupled with real-time state monitoring and feedback-based tuning, this strategy adapts dynamically to environmental changes, thereby reducing overall operating costs;
-
Preventive Optimization Strategy: A conflict prediction model based on statistical learning proactively reduces the probability of subsequent container relocations. This strategy mitigates efficiency losses from high-frequency relocations and ensures stable, efficient performance for long-sequence operations.
IDDA integrates CO theory with intelligent decision-making methods, providing a computationally efficient and practically feasible solution for high-frequency operational environments such as automated terminals.
5 Optimization-learning closed-loop framework
This section introduces the Optimization-Learning Closed-loop Framework (OLCF) for the NP-hard three-dimensional CRP. The framework addresses the scalability limitations of traditional approaches and enhances both solution efficiency and quality through a coordinated design of feature engineering and optimization algorithms.
5.1 Data analysis
High-quality datasets are a prerequisite for the successful application of AI algorithms. This study systematically reviews and analyzes typical benchmark datasets widely used in international academia. Among these, the Block Relocation Problem (BRP) dataset published by Tanaka et al. at Okayama University provides significant reference value (see https://sites.google.com/site/shunjitanaka/brp). That platform offers two classical datasets describing container layouts in a single bay using a two-dimensional matrix (see Figure 7). However, when applying the model to three-dimensional scenarios involving multiple bays, the single-bay model must be expanded into a higher-dimensional cooperative optimization framework. The complexity of three-dimensional scenarios is reflected in three key aspects:
-
Cooperative operations across multiple bays: The algorithm must avoid strategies that sequentially empty adjacent bays, because such strategies violate physical constraints and may cause safety hazards such as shifts in the yard’s center of gravity;
-
Spatiotemporal constraints across bays: Equipment scheduling across different bays significantly increases the dimensionality and complexity of the problem;
-
Exponential growth of the solution space: In a three-dimensional environment, the complexity of planning container extraction paths grows exponentially.
Figure 7
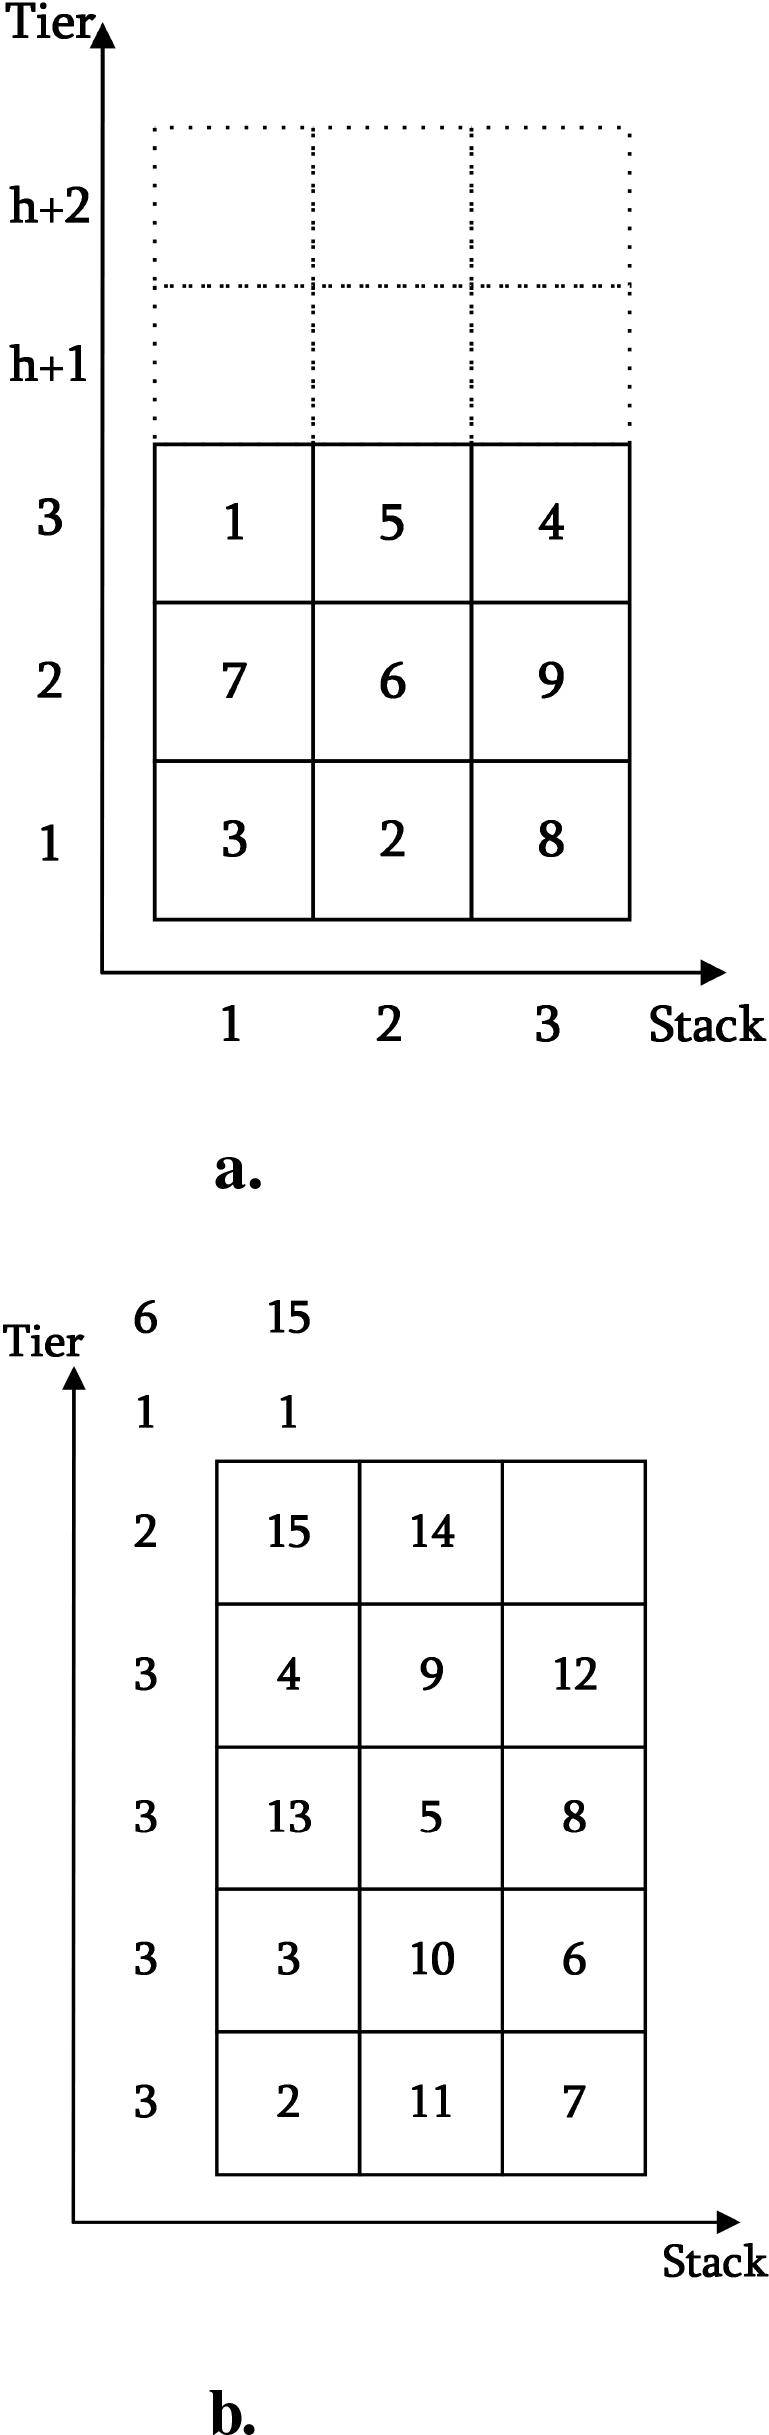
Schematic diagram of the encoding structure of the two-dimensional benchmark datasets. (a) Caserta–Voß Dataset. (b) Zhu et al. Dataset.
Due to these factors, the three-dimensional CRP presents extreme challenges. Existing studies remain limited, and most test cases are relatively small-scale. For example, in the study by Lee and Lee (2010), the maximum problem size was only 6 bays × 16 stacks × 10 tiers (approximately 720 containers, see Figure 8). This falls far short of meeting the operational requirements of real port terminals. This limitation indirectly reflects how the high complexity of the three-dimensional CRP has hindered the exploration of larger-scale applications.
Figure 8
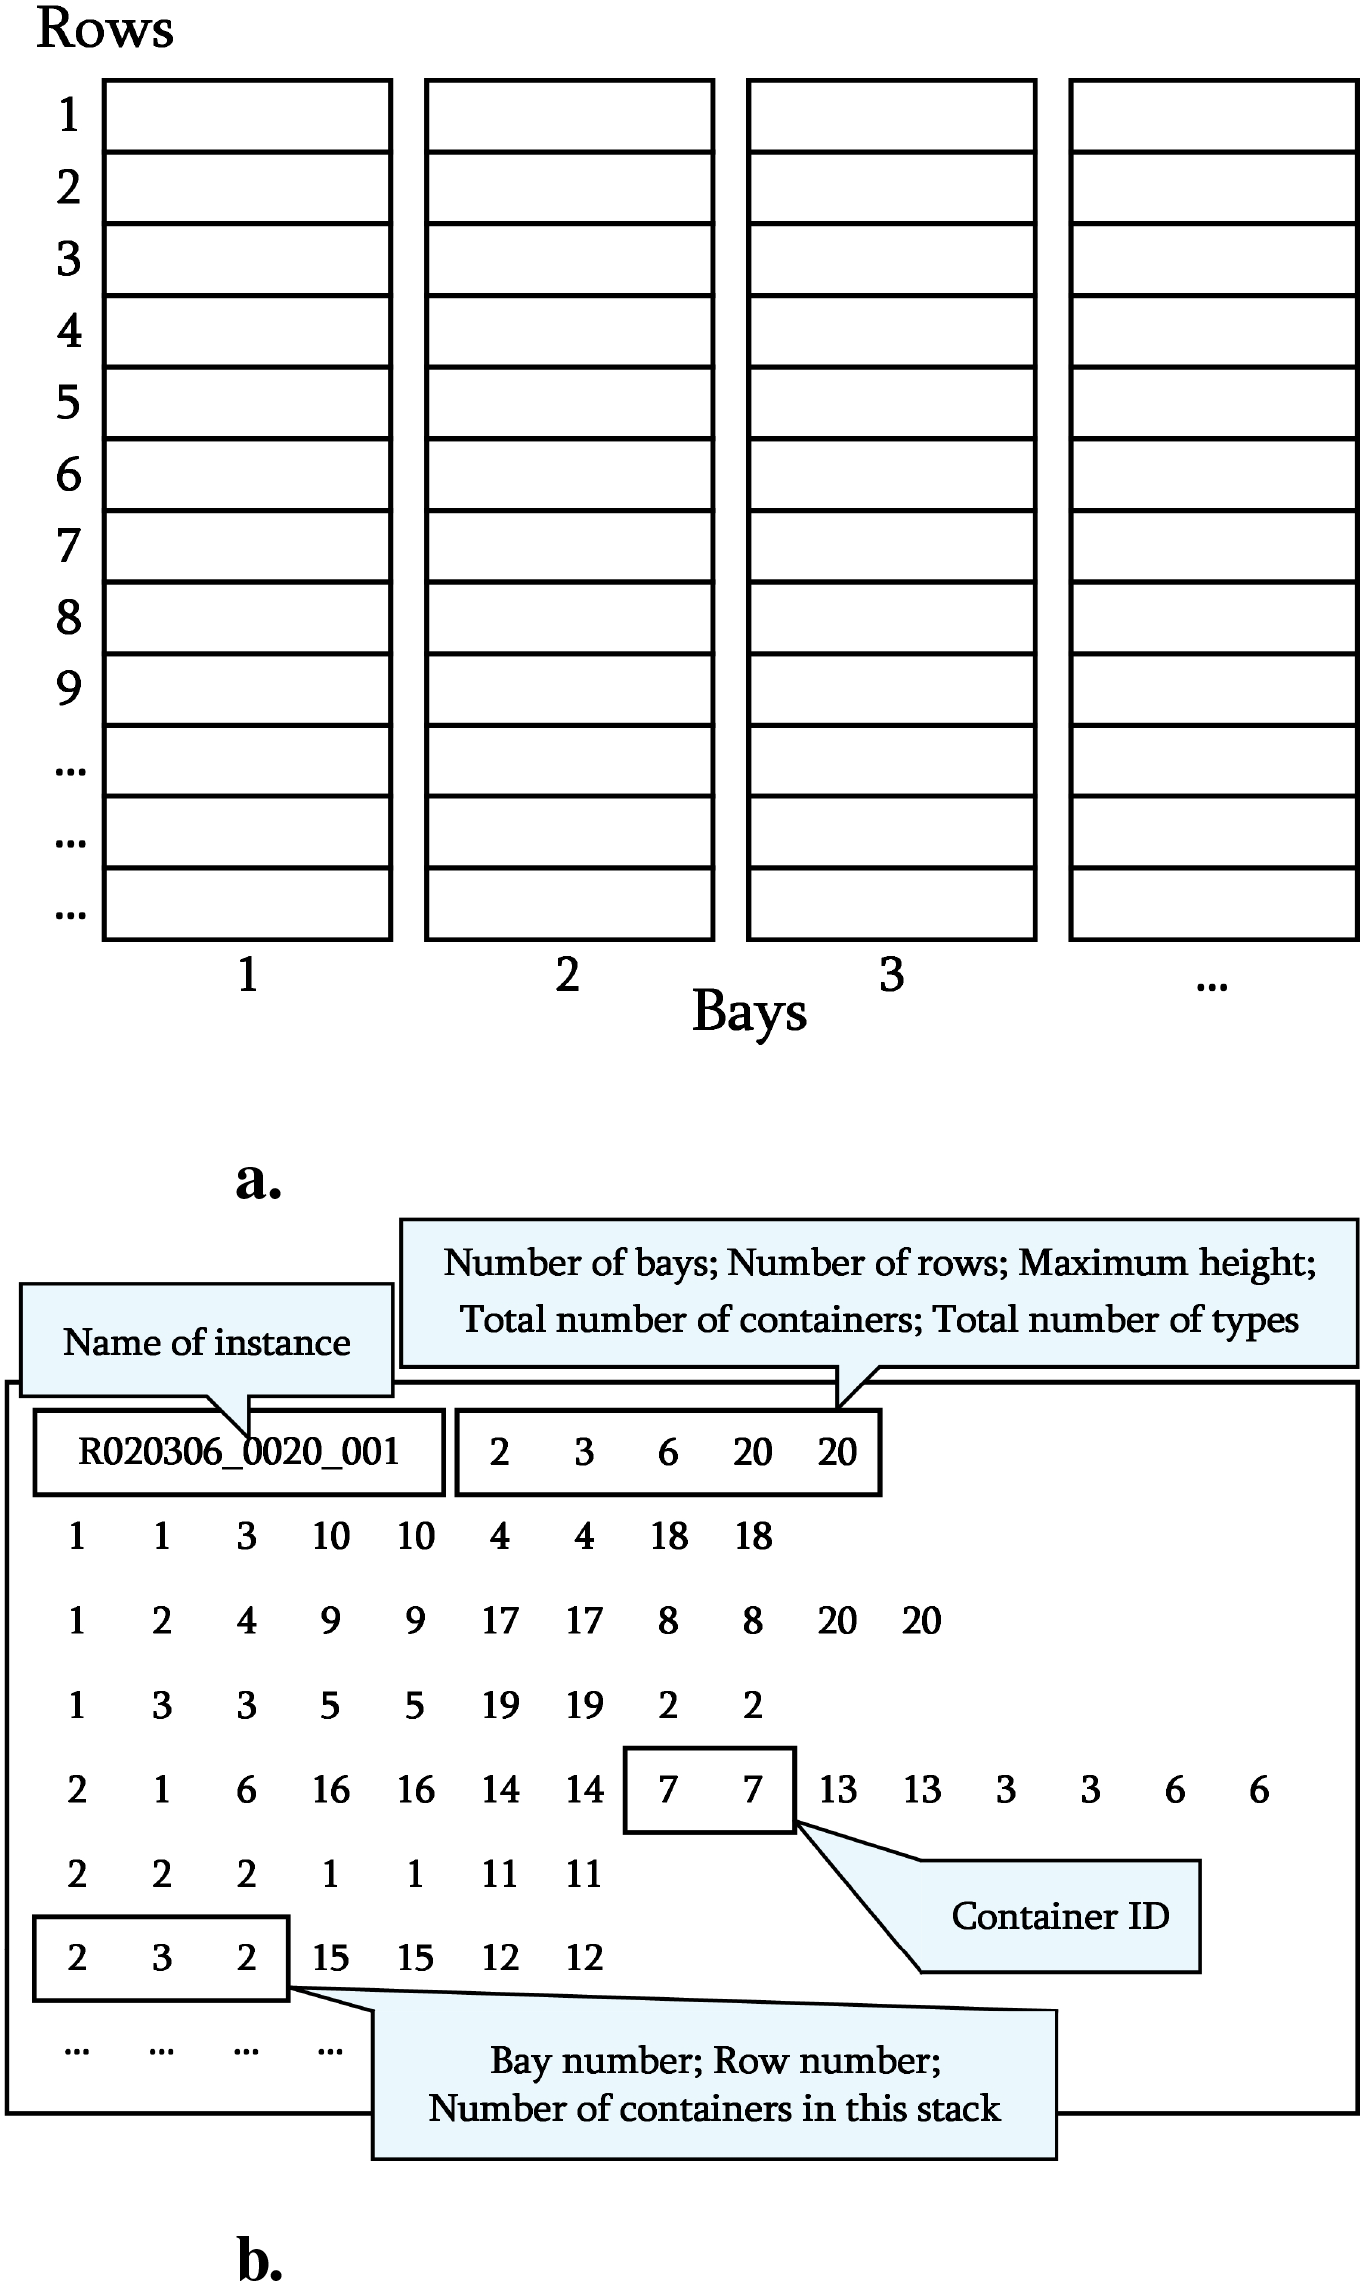
Schematic diagram of the Lee–Lee three-dimensional Dataset structure. (a) Aerial view of the container yard. (b) Hierarchical structure of instances.
5.1.1 Benchmark dataset
-
Caserta–Voß two-dimensional Dataset (Caserta and Voß, 2009)
-
Spatial Representation: A two-dimensional matrix i describes the container layout, where T denotes the number of tiers and S represents the number of stacks. Each matrix element indicates the unique priority of a container;
-
Scale Characteristics: The dataset encompasses 21 different dimension combinations with sizes ranging from 3 × 3 to 10 × 10;
-
Data Capacity: Each dimension includes 40 instances, totaling 840 samples;
-
Buffer Mechanism: A fixed dual-layer buffer (T + 2) is employed, reserving two extra tiers for relocation operations;
-
Coding Structure: The file naming format is “data T-S-N.bat” (see Figure 7a). The first line contains the number of tiers and the container count, while subsequent lines record the container priority distribution for each tier.
• Zhu et al. two-dimensional Dataset (Zhu et al., 2012)
-
Spatial Representation: Similarly, a two-dimensional matrix represents both unique and duplicate priorities;
-
Scale Characteristics: The dataset covers 125 dimension combinations, ranging from 3 × 6 to 10 × 10;
-
Data Capacity: For each dimension combination, 100 instances are generated, yielding a total of 12,500 samples per data category;
-
Coding Structure: A hierarchical progressive coding scheme is adopted (see Figure 7b). The first line specifies the number of tiers and the total container count; subsequent lines record the container priority distribution for each tier.
• Lee–Lee three-dimensional Dataset (Lee and Lee, 2010)
-
Spatial Representation: A three-dimensional matrix is used, where B denotes the number of bays, S the number of stacks, and T the number of tiers;
-
Instance Types: Two types of instances are provided: random instances and upside-down instances;
-
Scale Characteristics: For random instances, the dimension combinations range from 1 × 16 × 6 to 10×16×8, covering 10 combinations. The upside-down instances cover the same 10 combinations;
-
Data Capacity: Random instances include 5 instances per combination (totaling 50). Upside-down instances include 2 instances per combination (totaling 20);
-
Coding Structure: The file naming format is “XBBRRHH_YYYY_ZZZ.txt” (see Figure 8), where X indicates either random or upside-down; BB denotes the number of bays; RR, the number of stacks; HH, the number of tiers; YYYY represents the container count; and ZZZ is the instance number. The first line specifies the spatial dimensions, and subsequent lines record the container priority distribution for each tier.
5.1.2 Dataset limitations
Although the aforementioned benchmark datasets provide significant support for theoretical research, they exhibit several limitations:
-
Scale Constraints: The largest scale is only on the order of 102, with the largest instance containing 720 containers (i.e., 10×16×8). This scale does not meet the large-scale data requirements necessary for deep model training;
-
Insufficient Dimensions: Existing three-dimensional datasets are sparse and small-scale, making it challenging to adequately support precise modeling and optimization of real three-dimensional relocation operations;
-
Distribution Bias: The spatial distribution of containers shows notable clustering, which limits the generalization capabilities of algorithms and makes it difficult to cover the complex, dynamic scenarios encountered in actual port environments.
5.1.3 Adaptive data generator
To overcome these limitations, an Adaptive Data Generator (ADG) for the CRP, driven by constraint satisfaction, is presented. It comprises three core modules:
-
Dynamic Sampling Module: Dynamic programming strategies generate the distribution of nonzero elements by considering both the number of remaining columns and the count of available elements. This module dynamically allocates the nonzero element count in each column to ensure the overall distribution meets predefined constraints;
-
Constraint Verification Module: Multiple checks are performed on the generated nonzero element distribution to ensure that counts in each tier and column lie within reasonable ranges, conforming to the physical structure and safety requirements of container yards;
-
Backtracking Correction Module: A backtracking algorithm fills the matrix with specific numerical values. Different numerical combinations are attempted at various levels to enhance efficiency while ensuring unique solutions.
The core idea of ADG is to first use dynamic programming to produce a nonzero element distribution matrix that satisfies constraints, and then sequentially fill in actual values using a backtracking algorithm, ultimately yielding distinct three-dimensional data structures.
Through extensive experiments, the data generated by Algorithm 2 exhibits significant yet moderate spatial autocorrelation (Moran’s I = 0.3064, Z = 5.32, p< 0.001), effectively simulating the distribution characteristics of real container yards. Compared with traditional data generation methods, this generator offers several advantages:
Algorithm 2
Adaptive data generator (main algorithm pseudocode).
1: Parameters:

2:  : max number of nonzero elements per column
3:  : number of columns
4:  : number of bays
5:  T: target number of generated structures
6:  The generated 3D structure is .
7: ProcedureGenerateConstrainedStructures()
8:    # Set for unique 3D structures

9:    # Set for storing string representations

10:    # Counter for successful generation

11:    # Counter for attempts

12:

13:  whileanddo

14:
15:

16:   ifthen

17:    continue # Skip if distribution      generation fails

18:   end if

19:   if not CHECKCONSTRAINTS then

20:    continue

21:   end if

22:     # Random number pool

23:        # Initialize empty structure

24:   if not BACKTRACKFIX then

25:    continue # Skip if backtracking fails

26:   end if

27:   σ ← SERIALIZE(X)
28:   ifthen

29:

30:

31:

32:    ifthen

33:     OUTPUTPROGRESS(γ, T, α, ELAPSEDTIME())
34:    end if

35:   end if

36:  end while

37:  return A # Return the set of 3D structures
-
Three-dimensional Topology Modeling: Direct extension to a three-dimensional structure (tier–stack–bay) with an integrated physical constraint-based buffer design that better meets practical operational requirements;
-
Intelligent Optimization: Integration of dynamic programming with heuristic search strategies to flexibly evaluate and generate feasible container relocation plans;
-
Massive Data Generation: Capable of generating up to 105 non-repetitive instances in a single run, enhancing data diversity and complexity.
5.1.4 Data-generation constraints
To guarantee that the generated data remain both realistic and adequately diverse, the ADG framework implements a multi-tiered hierarchy of constraints derived from real-world operational rules. These constraints are divided into two principal categories (see Equations 16–23):
5.1.4.1 Physical-structure constraints
• Stack-height limit
where denotes the observed height of the stack in Bay k of Stack j, and Hmax denotes the maximum permissible safe stacking height.
• Bottom-layer non-emptiness
If Stack j contains any containers, then
thereby ensuring that containers are stacked contiguously from the base upward.
• Contiguous-stacking constraint
For any level , if
Then
thus preventing unsupported containers.
• Balance-distribution constraint
Let denote the set of all stack heights across every bay. The standard deviation is required to satisfy
where δmax specifies the maximum permissible tilt of the storage yard.
5.1.4.2 Operational-logic constraints
• Priority-uniqueness constraint
thereby guaranteeing that each non-zero priority is assigned to exactly one container.
• Temporal-consistency constraint
Define the retrieval sequence as Q = (q1,q2,…,qN). Assigned priorities satisfy
thus enforcing a strictly monotonic relationship between lower priority values and earlier retrieval.
• Feasibility constraint
The initial stacking configuration must ensure the existence of at least one feasible extraction sequence for the specified retrieval order Q, thereby precluding unsolvable scenarios.
• Obstruction-container ratio control
At any time t, let be the set of obstructing containers and N the total container count. This ratio is required to satisfy
thus maintaining the obstruction proportion within acceptable bounds.
By incorporating these constraints, the generated data more accurately emulate real-world port operations. Section 6 provides comparative experiments to quantitatively assess the suitability of ADG across diverse port environments.
5.2 Feature engineering
Based on the large-scale sample set constructed by ADG, key features are extracted from multiple dimensions, including container priority distribution and the three-dimensional spatial layout of the yard. To meet the spatiotemporal constraints of relocation operations and improve optimization efficiency, this section extends and refines feature extraction for three-dimensional scenarios based on previous research on two-dimensional CRP (Ye et al., 2023).
5.2.1 Initial yard storage state parameters
To precisely characterize the overall storage configuration at the initial time, a series of core parameters and vectors describe the yard’s scale and load distribution characteristics (see Equations 24–35).
-
• Core Scale Indicators
-
: Total number of bays, representing the horizontal scale of the yard;
-
: Total number of stacks, characterizing the vertical scale of the yard;
-
: Maximum stackable tiers, indicating the vertical space capacity;
-
: Total initial number of containers, reflecting the overall system load;
-
N = [N1,…,NB]T: Initial container count vector for bays, where Nk denotes the container count in the k-th bay.
-
• Load and Distribution Balance
-
The storage balance index measures load differences among bays:
A larger indicates a more imbalanced load distribution among bays, which necessitates more inter-bay container relocations and significantly influences algorithmic strategy selection.
5.2.2 Capacity characteristics
In three-dimensional CRP scenarios, capacity utilization is a key indicator of storage pressure and resource usage efficiency. This subsection presents multidimensional capacity characteristics:
-
Capacity Evaluation in Three-Dimensional CRP Scenarios
-
Theoretical Maximum Capacity
Here, the term (T − 1) is subtracted to reserve necessary buffer space for relocation operations;
• Overall Space Utilization
This indicator reflects overall resource utilization efficiency and indirectly gauges the complexity level of relocation operations;
Bay Utilization Vector
This vector represents capacity occupancy rates in both horizontal and vertical dimensions for each bay, providing a quantitative basis for zonal optimization strategies;
• Utilization Peak
This metric quantifies the degree of local congestion. A higher value indicates more pronounced congestion, suggesting that relocation operations may occur more frequently in that area;
• Safety Stock Ratio
This ratio represents the proportion of free space available for container relocation and temporary transfer operations, crucial for ensuring operational flexibility and safety.
5.2.3 Three-dimensional storage distribution characteristics
To precisely characterize the spatial distribution of the initial storage state in three dimensions, two key matrices are introduced:
• Tier–Bay Column Occupancy Matrix
Here, denotes the number of stacks occupied in bay k at tier i. This matrix analyzes load distribution across different tiers within each bay;
• Stack–Bay Height Matrix
Here, indicates the actual stacking height of stack j in bay k. This matrix assesses spatial resource occupancy across stacks and assists in prioritizing relocation operations.
5.2.4 Priority space mapping
In a three-dimensional storage environment, each location possesses not only spatial coordinates but also multiple attributes, such as priority. To facilitate feature extraction by intelligent optimization models—especially DRL—a three-dimensional tensor representation is constructed:
Here, denotes the priority of the container at position (i,j,k) (an empty position is denoted by 0). This tensor fully characterizes the priority state of any stacking location and can be directly employed by neural network models for multidimensional feature learning and extraction.
5.2.5 Container relocation operation complexity
To quantify the complexity of relocation operations under various storage layouts and priority distributions, several core indicators are defined, considering the requirements of CO and DRL:
Bay-Level Container Relocation Upper Bound [Based on the Caserta Paradigm (Caserta et al., 2012)]
where . This formula estimates the potential maximum number of container relocations in a single bay and provides a theoretical upper bound for optimization algorithms;
• Three-Dimensional Scenario Container Relocation Upper Bound
where . In three-dimensional environments, container relocation may occur across different bays and stacks, resulting in higher complexity. This indicator quantifies the theoretical upper bound for relocation operations in a three-dimensional setting;
• Container Relocation Lower Bound Estimation
Here, denotes the indicator function, and represents the priority of the container at that location. This estimation dynamically assesses the potential relocation pressure for each stack, providing guidance for local decision-making in intelligent algorithms.
In summary, a multidimensional and systematic feature framework is constructed for the threedimensional CRP, covering elements such as initial storage state, spatial capacity utilization, threedimensional distribution characteristics, priority mapping, and operation complexity. These features significantly improve the solution efficiency of traditional CO methods while providing high-quality data inputs for integrating advanced AI techniques with operations research methods. This framework establishes a solid theoretical and practical foundation for the deep fusion of AI and operations research.
6 Numerical experiments
This section provides a rigorous evaluation of the ADG and IDDA frameworks in both two-dimensional and three-dimensional container-yard scenarios. A multi-dimensional evaluation methodology, combining statistical inference with computational complexity analysis, is employed to assess improvements in solution quality, computational efficiency, and scalability.
6.1 Applicability analysis of the ADG framework in diverse port environments
Modern ports are categorized into three distinct classes based on automation level, scale, and operational mode: large fully automated ports, medium semi-automated ports, and small conventional ports. To assess the generalizability of the ADG framework across these contexts, bespoke parameter templates were developed for each port class, covering:
-
Physical parameters: storage yard height, number of bays, stacks, etc.;
-
Operational parameters: utilization ratio, priority assignment strategy, and handling-time variability, etc.
To quantify the impact of this parameterization on model performance, 10,000 synthetic samples were randomly generated for each port scenario and partitioned into training (80%) and testing (20%) sets. Experiments were conducted with identical random seeds, repeated in triplicate, and results were averaged to enhance robustness and reproducibility. Table 4 summarizes the key parameter configurations alongside the corresponding model training outcomes for the three port categories.
Table 4
| Parameter | Port Type | Large Fully Automated Port | Medium Semi- Automated Port | Small Traditional Port |
|---|---|---|---|---|
| Physical Parameters |
Maximum Stack Height Hmax |
8 | 6 | 4 |
| Number of Bays (B) | 10 | 8 | 6 | |
| Number of Stacks (S) | 10 | 8 | 6 | |
| Balance Factor δmax | 0.4 | 0.3 | 0.2 | |
| Operational Parameters | Utilization-Ratio Range (%) | 60–90 | 50–80 | 40–70 |
| Priority Assignment Strategy | Strict priority | Strict priority | Mixed priority | |
| Operation-Time Variability (%) | 10–15 | 15–20 | 20–30 | |
| Balance Impact Factor | 0.5 | 0.3 | 0.2 | |
| Model Performance |
Mean Squared Error (MSE) | 5.86 | 3.57 | 3.61 |
| Coefficient of Determination (R²) |
0.851 | 0.851 | 0.882 | |
| Relative Prediction Error (%) | 9.3 | 9.2 | 7.8 | |
| Computation Time (ms/sample) | 7.5 | 6.8 | 6.3 |
Parameter configurations and performance metrics of the ADG in different port environments.
As presented in Table 4, the coefficient of determination (R²) for all three port-type models exceeds 0.85, evidencing that the ADG furnishes high-quality training data while ensuring accurate predictions of container relocation counts. Notably, the small traditional port model achieved the highest R² (0.882), a result attributable to the greater regularity and fewer disturbances in small-scale port scenarios, which facilitates the model’s ability to capture underlying operational patterns. Further analysis indicates that yard height (Hmax) and utilization ratio serve as the primary drivers influencing container relocation counts. Moreover, the priority strategy employed by each port exerts a significant influence on handling efficiency, with the magnitude of this effect contingent upon port scale.
Overall, the model effectively reflects the relationship between yard scale and operational efficiency. Through predefined parameter templates, dynamic parameter adjustments, and an adjustable constraintweight mechanism, the ADG exhibits exceptional adaptability across various port environments.
6.2 IDDA performance evaluation
The data employed in this subsection were generated by the ADG framework. The primary motivations for this methodology are as follows: (1) Data Availability and Privacy Constraints: Real-world operational datasets are often classified as proprietary or subject to stringent privacy regulations. Publicly accessible historical trajectory records offering comprehensive, continuous, multi-port coverage—including extreme event scenarios—are exceedingly scarce. (2) Multi-Scenario Coverage and Algorithmic Validation: The ADG framework facilitates parameterized simulation of a broad spectrum of operational scenarios—ranging from routine throughput to peak congestion, equipment failures, and other emergent events—thereby enabling a systematic evaluation of algorithmic robustness under diverse, extreme operating conditions.
6.2.1 Benchmark testing in two-dimensional scenarios
To verify the effectiveness of IDDA in two-dimensional scenarios, an evaluation system focusing on the number of relocation operations and computational time was established. Four representative algorithms were selected for comparative analysis under the standardized testing framework of Caserta–Voß (Caserta et al., 2012): the KH algorithm (Kim and Hong, 2006), the DH algorithm (Aydin, 2006), the CM algorithm (Caserta et al., 2009), and the LA algorithm (Petering and Hussein, 2013). The experiments utilized the developed ADG to produce 100,000 sets of two-dimensional yard instances, covering specifications ranging from 3 × 3 to 10 × 10. The hardware environment was uniformly configured with an Intel Core i7-12700F processor and 16 GB RAM. Table 5 summarizes the performance of the algorithms across different scales, where all results represent the averages of multiple independent runs.
Table 5
| Tier×Stack | KH | DH | CM | LA | IDDA (Proposed) | |||||
|---|---|---|---|---|---|---|---|---|---|---|
| Relocs | Time | Relocs | Time | Relocs | Time | Relocs | Time | Relocs | Time | |
| 3×3 | 7.1 | 0.1 | 5.6 | <1 | 5.1 | 0.1 | 5.4 | <1 | 2.4 | 0.00001 |
| 3×4 | 10.7 | 0.1 | 7.3 | <1 | 6.3 | 0.1 | 6.5 | <1 | 2.4 | 0.00001 |
| 3×5 | 14.5 | 0.1 | 8.0 | <1 | 7.0 | 0.1 | 7.3 | <1 | 2.5 | 0.00001 |
| 4×4 | 16.0 | 0.1 | 12.2 | <1 | 10.4 | 0.2 | 9.9 | <1 | 4.1 | 0.00001 |
| 4×5 | 23.4 | 0.1 | 15.7 | <1 | 13.0 | 0.5 | 16.5 | <1 | 4.8 | 0.00001 |
| 4×6 | 26.2 | 0.1 | 17.3 | <1 | 14.0 | 0.5 | 19.8 | <1 | 5.5 | 0.00001 |
| 4×7 | 32.2 | 0.1 | 20.2 | <1 | 16.4 | 0.5 | 21.5 | <1 | 6.3 | 0.00001 |
| 5×5 | 37.5 | 0.1 | 23.9 | <1 | 18.8 | 0.8 | 19.7 | <1 | 7.5 | 0.00001 |
| 5×6 | 45.5 | 0.1 | 27.9 | <1 | 22.1 | 0.8 | 22.6 | <1 | 8.6 | 0.00001 |
| 5×7 | 52.3 | 0.1 | 31.9 | <1 | 25.8 | 1.43 | 24.8 | <1 | 9.6 | 0.00001 |
| 5×8 | 61.8 | 0.1 | 36.4 | <1 | 30.1 | 1.46 | 27.8 | <1 | 10.7 | 0.00001 |
| 5×9 | 72.4 | 0.1 | 40.3 | <1 | 33.1 | 1.41 | 30.7 | <1 | 11.8 | 0.00001 |
| 6×6 | 37.3 | 0.1 | 41.3 | 1.74 | 32.4 | 1.74 | 32.6 | <1 | 12.1 | 0.00001 |
| 6×10 | 75.1 | 0.1 | 61.5 | 1.95 | 49.5 | 1.95 | 46.8 | <1 | 17.8 | 0.00001 |
| 10×6 | 141.6 | 0.1 | 107.4 | 4.73 | 102 | 4.73 | 85.0 | <1 | 32.9 | 0.00001 |
| 10×10 | 178.6 | 0.2 | 152.4 | 6.34 | 128.3 | 6.34 | 119.5 | <1 | 45.8 | 0.00001 |
Performance comparison of algorithms in two-dimensional scenarios (Container Relocation Operations, Relocs: TEU; Time: s).
“<1” indicates that higher-precision time data were not provided in reference (Petering and Hussein, 2013); the boldfaced values in the table represent the best performance indicators for each corresponding scale.
The experimental results demonstrate that IDDA offers significant advantages in both solution quality and computational efficiency:
-
Superior Solution Quality: As the problem scale increases, IDDA consistently achieves lower container relocation counts than competing algorithms. For instance, on a 10 × 10 scale, IDDA registers only 45.82 TEU, a 61.68% reduction compared to the second-best algorithm, LA (Δ = 73.68 TEU, p< 0.001). Polynomial regression analysis indicates that the advantage coefficient of IDDA grows superlinearly as the scale expands (R2 = 0.98, p< 0.001), demonstrating excellent asymptotic approximation performance and strong scalability for large-scale NP-hard problems;
-
Breakthrough in Computational Efficiency: While maintaining high-quality solutions, IDDA reaches microsecond-level responses (9.83 ± 0.12 µs), approximately three orders of magnitude faster than traditional algorithms (Cohen’s d = 4.72). This breakthrough is critical for real-time decision-making scenarios such as intelligent port scheduling.
6.2.2 Benchmark testing in three-dimensional scenarios
To further assess the applicability and efficacy of the proposed IDDA algorithm in three-dimensional container-yard scheduling, the evaluation framework and hardware environment were kept consistent with those employed in the two-dimensional benchmark tests. Standardized three-dimensional instances from Lee and Lee (2010) served as test cases, and IDDA’s performance was rigorously benchmarked against three established methods—the LL algorithm (Lee and Lee, 2010), the BJ algorithm (Bian and Jin, 2013), and the LL Heuristic algorithm (Lin et al., 2015)—across various bay–stack–tier configurations and container volumes (see Table 6). All results represent the averages of multiple independent runs, ensuring statistical validity.
Table 6
| Instance | Bay | Stack | Tier | Volume (TEU) | LL | BJ | LL Heuristic | IDDA | Improvement Rate |
|---|---|---|---|---|---|---|---|---|---|
| R011606_0070 | 1 | 16 | 6 | 70 | 125.4 | 108.2 | 110.2 | 90.6 | 17.79% |
| R021606_0140 | 2 | 16 | 6 | 140 | 230.2 | 211.4 | 213.4 | 189.8 | 11.06% |
| R041606_0280 | 4 | 16 | 6 | 280 | 454.2 | 427.6 | 433.0 | 388.6 | 10.25% |
| R061606_0430 | 6 | 16 | 6 | 430 | 709.8 | 658.8 | 657.4 | 619 | 5.84% |
| R081606_0570 | 8 | 16 | 6 | 570 | 945.4 | 875.6 | 876.2 | 810.6 | 7.49% |
| R101606_0720 | 10 | 16 | 6 | 720 | 1169.2 | 1095.8 | 1093.0 | 1002 | 8.33% |
| R011608_0090 | 1 | 16 | 8 | 90 | 191.4 | 142.0 | 152.0 | 130.4 | 14.21% |
| R021608_0190 | 2 | 16 | 8 | 190 | 367.8 | 307.6 | 315.2 | 302.8 | 3.93% |
| R041608_0380 | 4 | 16 | 8 | 380 | 768.6 | 610.6 | 623.8 | 600.6 | 3.72% |
| R061608_0570 | 6 | 16 | 8 | 570 | 1242 | 907.6 | 926.2 | 894.2 | 3.45% |
Average retrieval moves (TEU) across various algorithms in three-dimensional scenarios.
Boldface values denote the best performance for each instance; the “Improvement Rate” indicates the percentage reduction in average moves achieved by IDDA relative to the second-best method, LL Heuristic.
Based on the analysis of the experimental data, the following key conclusions can be drawn:
-
Overall solution-quality advantage. Across all ten test instances—with varying bay–stack–tier configurations and container volumes—IDDA consistently achieved the lowest average number of moves. The smallest improvement was 3.5% (instance R061608_0570), while the largest reached 17.8% (instance R011606_0070), demonstrating that IDDA provides stable and substantial enhancements in solution quality across diverse spatial arrangements;
-
Scale sensitivity and scalability. As container volumes increase from 70 TEU to 720 TEU, the performance gap between IDDA and traditional heuristic methods widens steadily. This pattern indicates that IDDA maintains favorable asymptotic approximation properties and scalability when addressing large-scale, NP-hard three-dimensional yard-scheduling problems.
6.2.3 Performance evaluation in large-scale three-dimensional scenarios
To assess IDDA performance in large-scale three-dimensional container yards, 15 dimensional configurations were designed, ranging from 5 × 20 × 12 to 10 × 25 × 16. For each configuration, 5,000 independent instances were generated to simulate the high-dimensional complexity observed in real port terminals. The evaluation metrics included: total operations (TEU), relocation operations (TEU), computation time per instance (seconds), and scheduling efficiency (%). Table 7 summarizes the statistical results, including averages and standard deviations.
Table 7
| Tier×Stack×Bay | Operations (TEU) | Relocations (TEU) | Per Time (s) | Efficiency (%) | ||||
|---|---|---|---|---|---|---|---|---|
| Average | SD | Average | SD | Average | SD | Average | SD | |
| 5×20×12 | 87 | 15 | 43 | 9 | 0.005 | 0.001 | 51.05% | 3.89% |
| 6×20×12 | 111 | 18 | 60 | 11 | 0.007 | 0.001 | 46.17% | 3.42% |
| 7×20×12 | 135 | 21 | 78 | 14 | 0.016 | 0.01 | 42.52% | 3.17% |
| 8×20×12 | 159 | 24 | 97 | 17 | 0.012 | 0.002 | 39.50% | 2.86% |
| 9×20×12 | 186 | 27 | 117 | 19 | 0.014 | 0.002 | 36.99% | 2.65% |
| 10×20×12 | 213 | 30 | 139 | 22 | 0.016 | 0.003 | 34.93% | 2.41% |
| 10×20×13 | 203 | 30 | 134 | 22 | 0.016 | 0.003 | 34.15% | 2.46% |
| 10×20×14 | 192 | 30 | 128 | 22 | 0.015 | 0.003 | 33.56% | 2.55% |
| 10×20×15 | 184 | 29 | 124 | 21 | 0.015 | 0.005 | 33.03% | 2.62% |
| 10×20×16 | 176 | 29 | 119 | 22 | 0.014 | 0.003 | 32.53% | 2.69% |
| 10×21×16 | 184 | 29 | 124 | 22 | 0.016 | 0.003 | 32.58% | 2.62% |
| 10×22×16 | 194 | 30 | 131 | 22 | 0.019 | 0.01 | 32.54% | 2.55% |
| 10×23×16 | 202 | 31 | 136 | 23 | 0.02 | 0.009 | 32.57% | 2.45% |
| 10×24×16 | 212 | 32 | 143 | 23 | 0.024 | 0.014 | 32.55% | 2.42% |
| 10×25×16 | 221 | 32 | 149 | 24 | 0.021 | 0.004 | 32.61% | 2.36% |
Performance evaluation of IDDA for large-scale instances in three-dimensional scenarios.
Key conclusions from the experimental results are as follows:
-
Algorithm Stability and Statistical Robustness: In scenarios covering 15 configurations with a total of 75,000 test instances, IDDA exhibits stable performance across metrics such as total operations, container relocations, and efficiency, with standard deviations within 2.36% to 3.89%. This indicates strong convergence and generalization capabilities, meeting industrial robustness requirements;
-
Vertical Scalability and Nonlinear Complexity: When the number of tiers increases from 5 to 10 (with Stack × Bay held at 20 × 12), total operations rise from 87 to 213 (a 145% increase), and container relocations grow from 43 to 139 (a 223% increase), while scheduling efficiency drops from 51.05% to 34.93%. This trend confirms the “curse of dimensionality” and emphasizes stacking height as a primary source of complexity in the three-dimensional CRP;
-
Diminishing Marginal Returns of Bay Expansion: Keeping “Tier × Stack” at 10 × 20 but increasing the number of bays from 12 to 16 reduces total operations and container relocations by 17.4% and 14.4%, respectively. However, scheduling efficiency levels off, showing a typical diminishing marginal return;
-
Horizontal Dimension and Computational Complexity: With “Tier × Bay” fixed at 10×16, increasing the number of stacks from 20 to 25 results in an approximate 25% increase in total operations and container relocations. Nonetheless, scheduling efficiency remains around 32.5%, and the computation time per instance rises only slightly (from 0.014 to 0.021 seconds), consistent with CO theory regarding the heterogeneous impact of different dimensions;
-
Engineering Feasibility of Millisecond-Level Computation: Under all tested configurations, IDDA maintains response times in the millisecond range (0.005 to 0.024 seconds). Even in the largest configuration (10 × 25 × 16), computation does not exceed 0.151 seconds, fulfilling real-time optimization requirements for practical port operations;
-
Container Relocation Ratio as a Performance Bottleneck: Across various configurations, as stacking height increases, efficiency decreases from 51.05% to 32.53%, while horizontal or vertical expansions yield only limited improvements. This indicates that container relocation remains the main bottleneck for performance enhancement and a critical focus for future algorithmic improvements.
As illustrated in Figure 9, the three-dimensional surface—constructed based on the number of tiers (Tier), bay positions (Bay), and relocation rate (Z-axis)—visually illustrates the nonlinear increase in complexity that occurs as yard scale expands across different dimensions. When the number of tiers rises from 5 to 10, the relocation rate increases markedly, producing a distinct “phase-change surface” on the plot, emphasizing the critical impact of vertical expansion on problem complexity. By contrast, lateral and longitudinal expansions display relatively gradual gradients, further supporting that the three-dimensional CRP exhibits diverse difficulty characteristics across different dimensions.
Figure 9
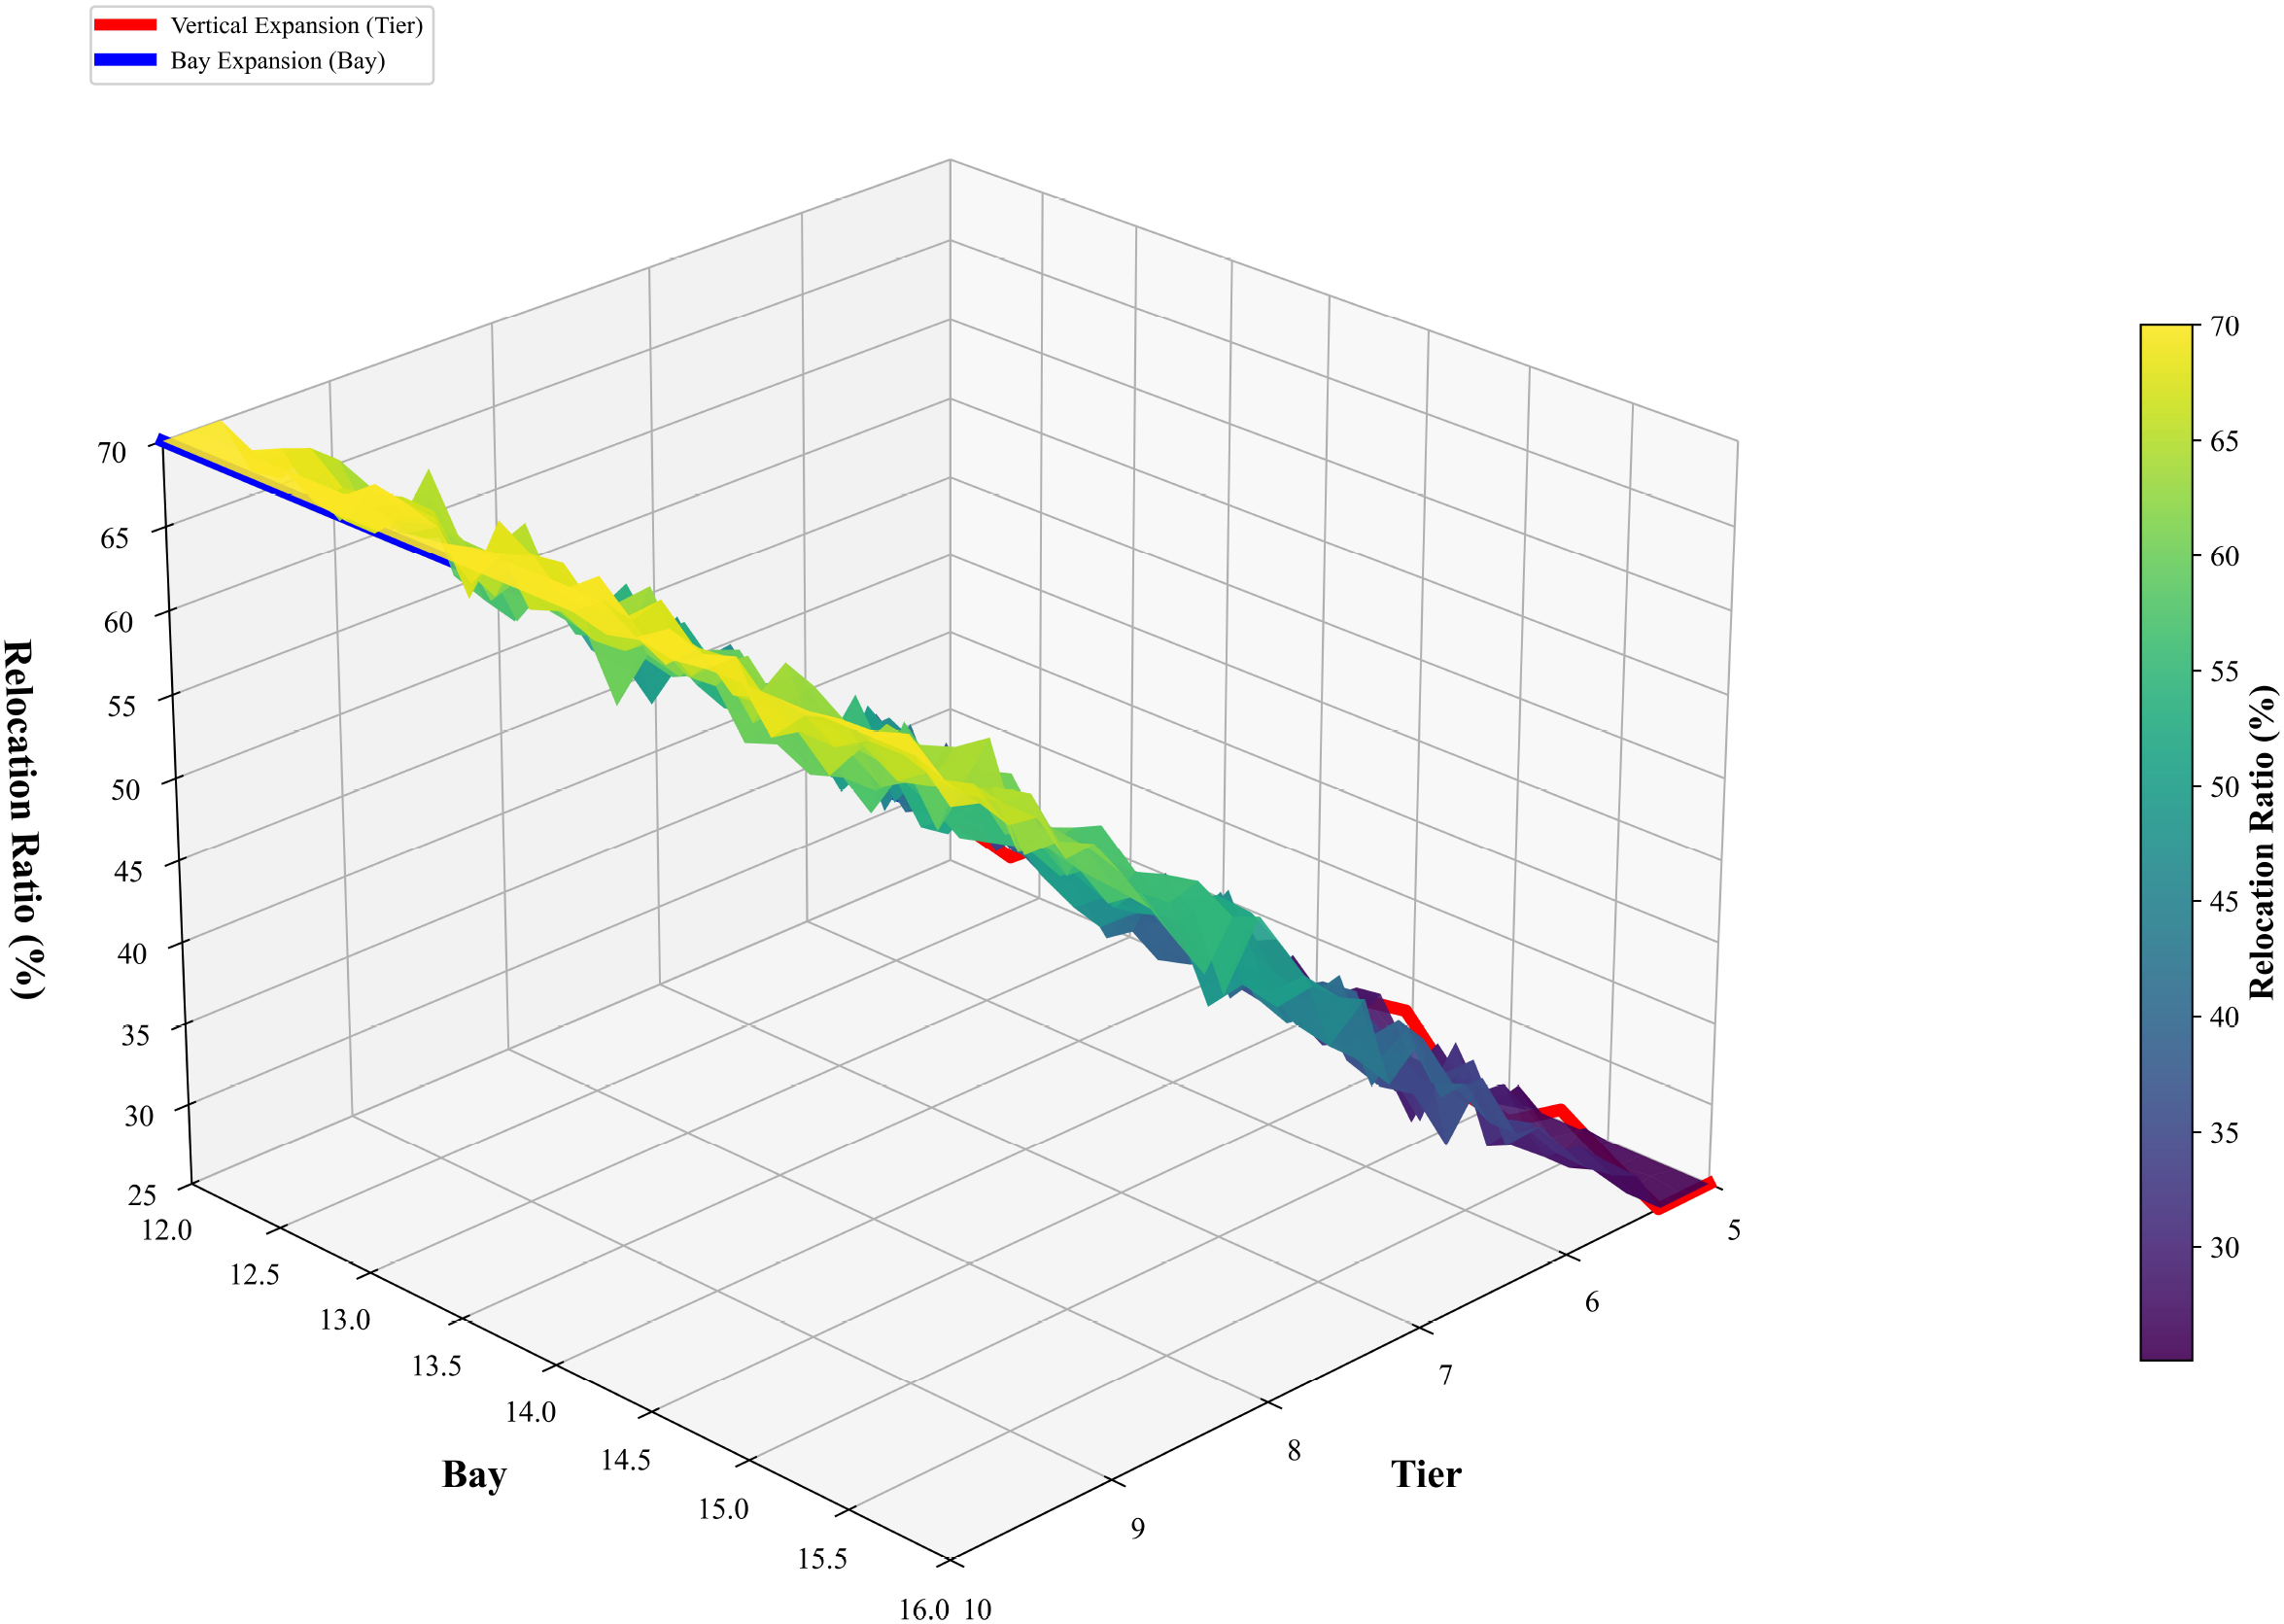
Phase transition surface for problem complexity.
6.3 OLCF performance evaluation
6.3.1 Effectiveness of feature engineering
A dataset representing a container yard scenario (6 bays, 6 stacks, 6 tiers) was constructed via ADG. Systematic feature engineering was then applied to 100,000 initial matrices, with the number of container relocations output by IDDA serving as the target variable. This transformation treats the CRP as a prediction task. The dataset includes 178 feature variables and one target variable, culminating in a 100,000 × 179 data scale.
To quantify the correlation between features and the target variable, the Pearson correlation coefficient was utilized. The results show that certain features demonstrate a significant linear correlation with container relocation count:
-
Total initial container count, the relocation upper bound for three-dimensional scenarios, overall space utilization, and container relocation count are significantly positively correlated (ρ ≈ 0.56), indicating that higher loading and space utilization lead to greater relocation demands;
-
Safety stock ratio is negatively correlated with container relocation count (ρ ≈−0.56), implying that a larger degree of available vacant space coincides with fewer relocations;
-
Stacking amount at higher tiers shows a moderate positive correlation with container relocation count (ρ ≈ 0.47 − 0.51), suggesting that as stacking height increases, the likelihood of container relocations rises significantly.
These findings indicate that container relocation is influenced by both macroscopic factors (loading, space utilization) and local stacking conditions, providing insights for subsequent model development and feature selection.
6.3.2 Architecture design
Before model construction, the dataset was partitioned into training, validation, and test sets in a 7:1.5:1.5 ratio via stratified random sampling. Five-fold cross-validation and a fixed random seed were used to ensure stability and reproducibility of results. For predicting the container relocation count, various learning models (Wolpert, 1992; Chen and Guestrin, 2016; Ke et al., 2017; Lundberg and Lee, 2017; Prokhorenkova et al., 2018) were systematically evaluated:
-
Linear Regression: Baseline model using the least squares method;
-
Ridge Regression: Incorporates L2 regularization. The hyperparameter α was optimized using grid search and 5-fold cross-validation over a logarithmic interval of [10−3,103];
-
ElasticNet: Combines L1 and L2 penalties to balance feature selection and model complexity;
-
Random Forest: An ensemble method based on multiple decision trees, with hyperparameters (number of trees, maximum depth, min samples per leaf) tuned for performance;
-
Gradient Boosting Regression: Employs a forward-additive ensemble learning framework;
-
XGBoost: An efficient gradient boosting framework capable of capturing nonlinear relationships;
-
LightGBM: A high-performance gradient boosting model based on gradient histograms;
-
CatBoost: Implements a symmetric tree strategy to mitigate categorical bias and enhance training efficiency;
-
Deep Neural Network Model: Constructs a five-layer fully connected network using the ReLU activation function and the Adam optimizer, enhancing model performance through increased training epochs, network structure optimization, and regularization;
-
Stacking Ensemble: Uses Ridge Regression (α = 0.5) as the meta-learner, stacking outputs from multiple base models across several layers.
6.3.3 Architecture evaluation
During the training phase, models were initially fitted on the training set, then optimized on the validation set through hyperparameter search, and finally evaluated on the test set for predictive performance. The evaluation metrics included MSE, RMSE, MAE, R2, and accuracy. Table 8 presents the predictive performance of the models for the CRP.
Table 8
| Model Name | MSE | RMSE | MAE | R 2 | Accuracy |
|---|---|---|---|---|---|
| Linear Regression | 1.7645 | 1.3283 | 1.0541 | 0.8377 | 87.29% |
| Ridge Regression | 1.7624 | 1.3276 | 1.0534 | 0.8379 | 87.29% |
| ElasticNet | 1.7789 | 1.3338 | 1.0595 | 0.8364 | 87.24% |
| Random Forest | 3.7439 | 1.9349 | 1.5451 | 0.6557 | 81.48% |
| Gradient Boosting Regression | 2.8912 | 1.7004 | 1.3556 | 0.7341 | 83.73% |
| XGBoost | 1.0590 | 1.0294 | 0.8364 | 0.9026 | 90.15% |
| LightGBM | 1.1093 | 1.0532 | 0.8520 | 0.8980 | 89.92% |
| CatBoost | 1.0487 | 1.0241 | 0.8305 | 0.9035 | 90.21% |
| Deep Neural Network | 1.1487 | 1.0717 | 0.8705 | 0.8942 | 89.75% |
| Stacking Ensemble | 0.9347 | 0.9668 | 0.7854 | 0.9139 | 90.76% |
Comparison of predictive model performance.
The boldfaced values in the table represent the best performance indicators for each indexes.
The results support the following conclusions:
-
• Performance Advantage of Stacking Ensemble
-
Best Prediction Accuracy: The stacking ensemble achieves the highest prediction accuracy (90.76%) and R2 (0.9139), surpassing the best individual model (CatBoost) by 0.55 percentage points;
-
Statistical Significance: Friedman test and Nemenyi post-hoc test (p< 0.01) indicate that the differences are statistically significant;
-
Multi-Level Learning: The stacking ensemble leverages linear, tree-based, and deep learning models to capture nonlinear relationships and feature interactions.
-
• Key Feature Analysis
-
Structural Features: Variables such as maximum stackable tiers, theoretical maximum capacity, and total number of stacks directly affect relocation operations;
-
Spatial Features: Overall space utilization and the safety stock ratio strongly impact relocation demand.
-
• Trade-off between Performance and Efficiency
-
Stacking Ensemble: Achieves optimal prediction accuracy with sufficient computational resources;
-
CatBoost: Offers a favorable balance between accuracy and efficiency;
-
Linear Models: Provide strong interpretability, making them suitable where model transparency is crucial.
-
• Application Scenario Adaptation
-
High-Precision Scenarios: Stacking ensemble is recommended;
-
Real-Time Requirements: CatBoost or lightweight neural networks are advisable;
-
Interpretability Requirements: Linear regression with enhanced features should be considered.
In summary, the experiments verify the effectiveness of ensemble learning and feature engineering in predicting container relocation counts, offering a scientifically sound basis for model selection in real-world applications. The results indicate that when computational resources are abundant, the stacking ensemble achieves optimal predictive performance. However, if a balance between accuracy and efficiency is desired, CatBoost or linear regression with enhanced features is a preferable alternative.
6.4 Energy saving and carbon emission reduction estimation
This section applies an indirect estimation approach to quantify the benefits of energy savings and CO2 emission reductions enabled by the proposed algorithm for green port development.
6.4.1 Energy consumption conversion assumptions
This section utilizes unit operation energy consumption coefficients commonly reported in the open literature to perform estimations:
• RTG (Rubber-Tyred Gantry) Crane Handling Energy Consumption: Industry reports and field measurements indicate that an electrified RTG crane consumes approximately 4 kWh per complete horizontal transfer and relocation operation, with typical literature values between 3 and 4 kWh per operation (Mathias et al., 2022).
For consistency in subsequent quantitative analyses, this section defines the average energy consumption of a “complete container relocation operation” (encompassing both the STS quay crane cycle and the RTG handling cycle) as (see Equation 36):
6.4.2 Carbon emission conversion assumptions
This section presumes that the electricity supply originates primarily from the local power grid. According to the “2021 Power Generation Carbon Dioxide Emission Factors” announcement issued jointly by the Ministry of Ecology and Environment and National Bureau of Statistics of China (2024), the national average emission factor is 0.5568 kg CO2 per kWh. Consequently, the carbon emissions for a single container relocation operation can be determined as follows (see Equation 37):
This conversion factor derives from authoritative national data and reflects both the national average level and regional applicability.
6.4.3 Data sources and calculation method
In the three-dimensional scenario benchmark test, a yard configuration of 6 × 16 × 8 served as the basis for comparative analysis. For identical test instances, the LL heuristic algorithm averaged 926.2 relocation operations, while the proposed IDDA algorithm required only 894.2 operations, thus saving approximately 32 relocation moves (see Table 6).
Accordingly, the energy savings for a single test instance are estimated as follows (see Equation 38):
The corresponding reduction in carbon emissions is therefore calculated as (see Equation 39):
Under hundred-container-scale three-dimensional yard experimental conditions, the IDDA algorithm yields an energy saving of approximately 384 kWh per operational cycle compared to the traditional heuristic algorithm, corresponding to a reduction of approximately 213.7 kg of CO2 emissions. This preliminary estimate underscores the proposed algorithm’s potential for energy and emission reductions in green port operations.
7 Conclusions
This study systematically integrates combinatorial optimization theory and artificial intelligence techniques to address the CRP, providing a comprehensive solution comprising mathematical model formulation, algorithm development, data generation, and collaborative learning frameworks. The principal findings are summarized as follows:
7.1 Intelligent decision-driven model and high-performance algorithm
-
Computational Efficiency: In two-dimensional scenarios involving 50–100 containers, the hybrid heuristic-search and machine-learning algorithm achieves an average per-decision response time of 9.83 ± 0.12 µs, representing a three-order-of-magnitude improvement over conventional methods. In three-dimensional experiments at the 104-container scale, total computation time remains below 60s, fully meeting the real-time scheduling requirements of automated guided vehicles (AGVs);
-
Solution Quality and Scalability: In two-dimensional experiments, the average relocation count is reduced by 61.7% relative to benchmark algorithms. In three-dimensional standard scenarios, the average move count declines by 3.5%–17.8%, with performance improvements becoming more pronounced as yard capacity grows from 70 TEU to 720 TEU.
7.2 Adaptive three-dimensional data-generation and multi-scenario generalization framework
-
Data Diversity: The proposed generator incorporates spatial autocorrelation and physical constraints, yielding datasets with Moran’s I = 0.3064 and producing up to 105 unique 3D yard instances per run, thereby providing abundant, high-quality training samples;
-
Scenario Adaptability: Generated datasets cover large-scale fully automated, medium-scale semiautomated, and small-scale conventional yard typologies. Predictive models trained on these datasets achieve R2 ≥ 0.85 (peaking at 0.882) across all scenarios, demonstrating robust generalization capabilities.
7.3 Optimization–learning closed-loop collaborative paradigm
-
Feature Engineering: Seventeen key performance indicators are extracted from optimal solutions and quantified via explainable machine learning techniques, enabling dynamic adjustment of algorithm parameters and constraint weights;
-
Predictive Modeling: A multi-layer stacked ensemble attains 90.76% accuracy in relocation count prediction (R2 = 0.9139), exhibiting high stability and computational efficiency across 105 simulated 6 × 6 × 6 workflows;
-
Policy Optimization: A dynamic constraint-weighting mechanism balances movement counts and energy consumption, substantially reducing overall energy expenditure and enhancing operational efficiency in high-density container yards.
From a theoretical standpoint, this study proposes a multi-stage collaborative optimization framework that synergizes data-driven and model-driven strategies, thereby advancing research on NP-hard combinatorial optimization problems. In practical terms, the methodology limits strategy-generation time for 105container-scale yards to under 60 s and offers a scalable technological paradigm for smart-port development, sustainable logistics operations, and the achievement of national carbon-neutrality objectives. In a hundred-container-scale three-dimensional yard experiment, the IDDA algorithm demonstrated savings of approximately 384 kWh of electric energy per operation cycle relative to the traditional heuristic algorithm, thereby reducing approximately 213.7 kg of CO2 emissions. Furthermore, the feature-engineering framework provides standardized data interfaces for sensor deployment and intelligent upgrades of logistics equipment.
Future research should focus on three primary directions:
-
Real-world validation: Conduct end-to-end experiments in operational port environments to systematically evaluate the model’s robustness and stability;
-
Generator optimization under complex conditions: Refine the design and training strategies of the ADG framework to enhance its adaptability and fault tolerance in scenarios involving multi-equipment coordination and equipment failures;
-
Unified multi-objective optimization framework: Integrate carbon emissions, operational costs, and safety risks into a unified optimization framework, while examining the generalization and adaptability of deep reinforcement learning and graph neural networks in complex dynamic environments to enable globally optimal scheduling and decision support for port operations.
Statements
Data availability statement
The datasets presented in this study can be found in online repositories. The names of the repository/repositories and accession number(s) can be found below: The datasets for optimization algorithms and AI techniques at various scales are available at https://github.com/paosi1122/CRP.
Author contributions
SZ: Software, Funding acquisition, Writing – review & editing, Formal Analysis, Conceptualization, Visualization, Methodology, Validation. JS: Funding acquisition, Validation, Conceptualization, Writing – original draft, Methodology, Visualization, Formal Analysis. YW: Writing – review & editing, Supervision. YK: Writing – review & editing, Supervision.
Funding
The author(s) declare that financial support was received for the research and/or publication of this article. This research was supported by the following projects: the 2022 Youth Project of the Guangdong Basic and Applied Basic Research Fund (grant number 2022A1515110437); the 2022 Guangdong Provincial Department of Education Innovation Team Project (grant number 2022WCXTD009); the 2024 Guangdong Provincial Department of Education Scientific Research Project-Key Field Special Project (grant number 2024ZDZX2088); the 2024 Guangdong Province Graduate Education Innovation Plan Project (grant number 2024SFKC_042); the 2024 Guangdong Province Undergraduate University Teaching Quality and Teaching Reform Initiative Project: A Course Reform Study on “Mathematical Modeling” for Mathematics Majors through Deep Integration of Data Empowerment and Ideological-Political Guidance (Yuejiao Document [2024] No. 30); the 2024 Guangdong Province Education Science Planning Project (grant number 2024GXJK352); the 2022 Guangdong Provincial Education Science Planning Project (grant number 2022GXJK211); the 2024 Huizhou Philosophy and Social Science Planning Project (grant number HZSK2024GJ030); the 2024 Guangdong Ocean University Education and Teaching Reform Project (grant number PX-972024027); the Guangdong Ocean University Scientific Research Start-up Fund Project (grant number 101502/R18014); and the 2024 Huizhou University Teaching Quality and Teaching Reform Project: “Integrating Ideological and Political Education with Competition Motivation in Mathematical Modeling: An Innovative Teaching Approach” (Huizhou University Document [2024] No. 173).
Conflict of interest
The authors declare that the research was conducted in the absence of any commercial or financial relationships that could be construed as a potential conflict of interest.
Generative AI statement
The author(s) declare that no Generative AI was used in the creation of this manuscript.
Publisher’s note
All claims expressed in this article are solely those of the authors and do not necessarily represent those of their affiliated organizations, or those of the publisher, the editors and the reviewers. Any product that may be evaluated in this article, or claim that may be made by its manufacturer, is not guaranteed or endorsed by the publisher.
References
1
Almasan P. Suárez-Varela J. Rusek K. Barlet-Ros P. Cabellos A. Perello J. (2022). Deep reinforcement learning meets graph neural networks: Exploring a routing optimization use case. Comput. Commun.196, 184–194. doi: 10.1016/j.comcom.2022.09.029
2
Aydin C. (2006). Improved Rehandling Strategies for Container Retrieval Process (Istanbul, Turkey: Sabanci University).
3
Bai R. Chen X. Chen Z. L. Li T. Tang M. (2023). Analytics and machine learning in vehicle routing research. Int. J. Production Res.61, 4–30. doi: 10.1080/00207543.2021
4
Bengio Y. Lodi A. Prouvost A. (2021). Machine learning for combinatorial optimization: A methodological tour d’horizon. Eur. J. Operational Res.290, 405–421. doi: 10.1016/j.ejor.2020.07.063
5
Bi J. Ma Y. Wang J. Li Z. Chen X. Zhang Y. (2022). Learning generalizable models for vehicle routing problems via knowledge distillation. Adv. Neural Inf. Process. Syst.35, 31226–31238. doi: 10.48550/arXiv.2210.07686
6
Bian Z. Jin Z. H. (2013). Optimization on retrieving containers based on multi-phase hybrid dynamic programming. Proc. - Soc. Behav. Sci.96, 844–855. doi: 10.1016/j.sbspro.2013.08.096
7
Cao M. Jin Y. Hu Y. Huang X. Wu J. (2024). A decision framework for chinese-style cruise ship design based on informativeness weight method and group consensus reaching model. Advanced Eng. Inf.62, 102698. doi: 10.1016/j.aei.2024.102698
8
Carlo H. J. Vis I. F. A. Roodbergen K. J. (2014). Storage yard operations in container terminals: Literature overview, trends, and research directions. Eur. J. Operational Res.235, 412–430. doi: 10.1016/j.ejor.2013.10.054
9
Caserta M. Schwarze S. Voß S. (2009). “A new binary description of the blocks relocation problem and benefits in a look ahead heuristic,” in European Conference on Evolutionary Computation in Combinatorial Optimization (Springer, Berlin/Heidelberg, Germany), 37–48. doi: 10.1007/978-3-642-01009-54
10
Caserta M. Schwarze S. Voß S. (2012). A mathematical formulation and complexity considerations for the blocks relocation problem. Eur. J. Operational Res.219, 96–104. doi: 10.1016/j.ejor.2011.12.039
11
Caserta M. Voß S. (2009). “A corridor method-based algorithm for the pre-marshalling problem,” in Applications of Evolutionary Computation (EvoWorkshops 2009), vol. 5484. (Springer, Berlin/Heidelberg, Germany), 788–797. doi: 10.1007/978-3-642-01129-089
12
Chen T. Guestrin C. (2016). “XGBoost: A scalable tree boosting system,” in Proceedings of the 22nd ACM SIGKDD International Conference on Knowledge Discovery and Data Mining, (San Francisco, California, USA: Association for Computing Machinery). 785–794. doi: 10.1145/2939672.2939785
13
Chen X. Wei C. Xin Z. Zhao J. Xian J. (2023). Ship detection under low-visibility weather interference via an ensemble generative adversarial network. J. Mar. Sci. Eng.11, 2065. doi: 10.3390/jmse11112065
14
Chen X. Wu X. Prasad D. K. Wu B. Postolache O. Yang Y. (2022). Pixel-wise ship identification from maritime images via a semantic segmentation model. IEEE Sensors J.22, 18180–18191. doi: 10.1109/JSEN.2022.3195959
15
Galle V. Manshadi V. H. Boroujeni S. B. Woensel T. V. Fransoo J. C. (2018). The stochastic container relocation problem. Transportation Sci.52, 1035–1058. doi: 10.1287/trsc.2018.0828
16
Hopfield J. J. Tank D. W. (1985). neural“ computation of decisions in optimization problems. Biol. Cybernetics52, 141–152. doi: 10.1007/BF00339943
17
Hu Z. Zheng Y. Wang Y. (2022). Packing computing servers into the vessel of an underwater data center considering cooling efficiency. Appl. Energy314, 118986. doi: 10.1016/j.apenergy.2022.118986
18
Jiang Y. Cao Z. Wu Y. Song Z. Zhang J. (2023). Ensemble-based deep reinforcement learning for vehicle routing problems under distribution shift. Adv. Neural Inf. Process. Syst.36, 53112–53125. https://proceedings.neurips.cc/paper_files/paper/2023/file/a68120d2eb2f53f7d9e71547591aef11-Paper-Conference.pdf
19
Jiang X. Wu Y. Wang Y. Geng X. Zhang Q. (2024). UNCO: Towards unifying neural combinatorial optimization through large language model. arXiv. doi: 10.48550/arXiv.2408.12214
20
Jin B. (2020). On the integer programming formulation for the relaxed restricted container relocation problem. Eur. J. Operational Res.281, 475–482. doi: 10.1016/j.ejor.2019.08.041
21
Jing X. Pei X. Yan S. Han C. Selpi Andreotti E. et al . (2022). Safety benefit of cooperative control for heterogeneous traffic on-ramp merging. Transportation Saf. Environ.4, tdac031. doi: 10.1093/tse/tdac031
22
Ke G. Meng Q. Finley T. Wang T. Chen W. Ma W. et al . (2017). “Lightgbm: A highly efficient gradient boosting decision tree,” in Advances in Neural Information Processing Systems, vol. 30. (Red Hook, NY, United States: Curran Associates Inc).
23
Khalil E. Dai H. Zhang Y. Dilkina B. Song L. (2017). Learning combinatorial optimization algorithms over graphs. Adv. Neural Inf. Process. Syst.30. doi: 10.48550/arXiv.1704.01665
24
Kim K. H. Hong G. P. (2006). A heuristic rule for relocating blocks. Comput. Operations Res.33, 940–954. doi: 10.1016/j.cor.2004.08.005
25
Kool W. Hoof H. V. Welling M. (2018). Attention, learn to solve routing problems! arXiv. doi: 10.48550/arXiv.1803.08475
26
Lee Y. Hsu N. Y. (2007). An optimization model for the container pre-marshalling problem. Comput. Operations Res.34, 3295–3313. doi: 10.1016/j.cor.2005.12.006
27
Lee Y. Lee Y. J. (2010). A heuristic for retrieving containers from a yard. Comput. Operations Res.37, 1139–1147. doi: 10.1016/j.cor.2009.10.005
28
Lin D. Y. Lee Y. J. Lee Y. (2015). The container retrieval problem with respect to relocation. Transportation Res. Part C: Emerging Technol.52, 132–143. doi: 10.1016/j.trc.2015.01.024
29
Lin Z. Wu Y. Zhou B. Zheng Q. Li X. (2024). Cross-problem learning for solving vehicle routing problems. arXiv. doi: 10.48550/arXiv.2404.11677
30
Liu L. Feng Y. Zeng Q. Chen Z. Li Y. (2025). A q-learning-based algorithm for the block relocation problem. J. Heuristics31, 14. doi: 10.1007/s10732-024-09545-y
31
Liu X. Peng Y. Zhang G. Wu L. Xu F. (2024). An efficient node selection policy for monte carlo tree search with neural networks. INFORMS J. Computing. doi: 10.1287/ijoc.2023.0307
32
Liu F. Ye T. Zhang Z. (2023). “Dynamic attention model – a deep reinforcement learning approach for container relocation problem,” in Advances and Trends in Artificial Intelligence. Theory and Applications. IEA/AIE 2023. Lecture Notes in Computer Science, vol. 13926. (Springer, Cham), 273–285. doi: 10.1007/978-3-031-36822-624
33
Lundberg S. M. Lee S. I. (2017). “A unified approach to interpreting model predictions,” in Advances in Neural Information Processing Systems, vol. 30. (Red Hook, NY, United States: Curran Associates, Inc.).
34
Mathias T. N. Shinoda T. Sugimura Y. (2022). “2022a-os5–2 energy consumption behavior analysis of transfer cranes toward a dx container terminal,” in Conference Proceedings of The Japan Society of Naval Architects and Ocean Engineers, No. 35. 277–280 (Tokyo, Japan: The Japan Society of Naval Architects and Ocean Engineers).
35
McKinnon A. Browne M. Whiteing A. Piecyk M. (2015). Green Logistics: Improving the Environmental Sustainability of Logistics (London, UK: Kogan Page).
36
Ministry of Ecology and Environment and National Bureau of Statistics of China (2024). Announcement on Releasing the CO Emission Factors of Power Generation in 2021 (Announcement No. 12 of 2024) (Beijing, China: Ministry of Ecology and Environment of the People’s Republic of China; National Bureau of Statistics of China).
37
Munikoti S. Agarwal D. Das L. Halappanavar M. Natarajan B. (2024). Challenges and opportunities in deep reinforcement learning with graph neural networks: A comprehensive review of algorithms and applications. IEEE Trans. Neural Networks Learn. Syst.35, 15051–15071. doi: 10.1109/TNNLS.2023.3283523
38
Nazari M. Oroojlooy A. Snyder L. Takac M. (2018). Reinforcement learning for solving the vehicle routing problem. Adv. Neural Inf. Process. Syst.31. doi: 10.48550/arXiv.1802.04240
39
Nikseresht A. Golmohammadi D. Zandieh M. (2024). Sustainable green logistics and remanufacturing: A bibliometric analysis and future research directions. Int. J. Logistics Manage.35, 755–803. doi: 10.1108/ijlm-03-2023-0085
40
Petering M. E. Hussein M. I. (2013). A new mixed integer program and extended look-ahead heuristic algorithm for the block relocation problem. Eur. J. Operational Res.231, 120–130. doi: 10.1016/j.ejor.2013.05.037
41
Prokhorenkova L. Gusev G. Vorobev A. Dorogush A. V. Gulin A. (2018). “Catboost: Unbiased boosting with categorical features,” in Advances in Neural Information Processing Systems, vol. 31. (Red Hook, NY, United States: Curran Associates, Inc.).
42
Tanaka S. Takii K. (2016). A faster branch-and-bound algorithm for the block relocation problem. IEEE Trans. Automation Sci. Eng.13, 181–190. doi: 10.1109/TASE.2015.2434417
43
Tang Y. Ye Z. Chen Y. Lu J. Huang S. Zhang J. (2024). Regulating the imbalance for the container relocation problem: A deep reinforcement learning approach. Comput. Ind. Eng.191, 110111. doi: 10.1016/j.cie.2024.110111
44
Vinyals O. Fortunato M. Jaitly N. (2015). Pointer networks. Adv. Neural Inf. Process. Syst.28. doi: 10.48550/arXiv.1506.03134
45
Wang P. Xu Q. Li Y. Chen Q. Tao J. Qin W. et al . (2025). Learning-based hybrid algorithms for container relocation problem with storage plan. Transportation Res. Part E: Logistics Transportation Rev.197, 104048. doi: 10.1016/j.tre.2025.104048
46
Watanabe I. (1992). Analysis on characteristics and relationship between annual handling ability and stowing capacity in container terminals. J. Soc. Naval Architects Japan171, 621–625. doi: 10.2534/jjasnaoe1968.1992.621
47
Wolpert D. H. (1992). Stacked generalization. Neural Networks5, 241–259. doi: 10.1016/S0893-6080(05)80023-1
48
Yan Q. Song R. Kim K. H. Feng X. (2024). Optimizing container relocation operations by using deep reinforcement learning. Maritime Policy Manage.1–23, 1–23. doi: 10.1080/03088839.2024.2424865
49
Ye R. Ye R. Zheng S. (2023). Machine learning guides the solution of blocks relocation problem in container terminals. Transportation Res. Rec.2677, 721–737. doi: 10.1177/03611981221117157
50
Zehendner E. Caserta M. Feillet D. Voß S. (2015). An improved mathematical formulation for the blocks relocation problem. Eur. J. Operational Res.245, 415–422. doi: 10.1016/j.ejor.2015.03.032
51
Zhao X. Bennell J. A. Bektas T. Yang J. (2016). A comparative review of 3d container loading algorithms. Int. Trans. Operational Res.23, 287–320. doi: 10.1111/itor.12094
52
Zhu W. Qin H. Lim A. Rodrigues B. (2012). Iterative deepening a* algorithms for the container relocation problem. IEEE Trans. Automation Sci. Eng.9, 710–722. doi: 10.1109/TASE.2012.2198642
53
Zou Y. Xiao G. Li Q. Biancardo S. A. (2025). Intelligent maritime shipping: A bibliometric analysis of internet technologies and automated port infrastructure applications. J. Mar. Sci. Eng.13, 979. doi: 10.3390/jmse13050979
Summary
Keywords
green ports, container relocation problem, artificial intelligence, intelligent decision-driven model, adaptive data generator, closed-loop framework
Citation
Zheng S, Sha J, Kong Y and Wang Y (2025) Research on artificial intelligence-driven container relocation problem for green ports. Front. Mar. Sci. 12:1614356. doi: 10.3389/fmars.2025.1614356
Received
18 April 2025
Accepted
09 June 2025
Published
02 July 2025
Volume
12 - 2025
Edited by
Guangnian Xiao, Shanghai Maritime University, China
Reviewed by
Xinqiang Chen, Shanghai Maritime University, China
Qiaoyu Peng, Wuhan University of Science and Technology, China
Mingshuo Cao, Shanghai Maritime University, China
Updates
Copyright
© 2025 Zheng, Sha, Kong and Wang.
This is an open-access article distributed under the terms of the Creative Commons Attribution License (CC BY). The use, distribution or reproduction in other forums is permitted, provided the original author(s) and the copyright owner(s) are credited and that the original publication in this journal is cited, in accordance with accepted academic practice. No use, distribution or reproduction is permitted which does not comply with these terms.
*Correspondence: Jin Sha, gdoutnt@126.com
Disclaimer
All claims expressed in this article are solely those of the authors and do not necessarily represent those of their affiliated organizations, or those of the publisher, the editors and the reviewers. Any product that may be evaluated in this article or claim that may be made by its manufacturer is not guaranteed or endorsed by the publisher.