 Courtney Nicole Hammond
 Sibel Bargu
 Caitlin R. R. Turner
 Matthew Hiatt
 John R. White
- 1Department of Oceanography & Coastal Sciences, Louisiana State University, Baton Rouge, LA, United States
- 2Coastal Studies Institute, Louisiana State University, Baton Rouge, LA, United States
Estuaries in the Gulf, especially Lake Pontchartrain Estuary in southeastern Louisiana, USA, are experiencing significant changes due to climate change and coastal restoration efforts. Lake Pontchartrain Estuary receives nutrient-rich Mississippi River water through a controlled diversion called Bonnet Carré Spillway (BCS), which has been associated with toxic cyanobacterial blooms (cyanoHABs). This study examines the seasonal factors influencing cyanoHABs in the Lake Pontchartrain Estuary when the BCS is closed, addressing gaps in the understanding of HABs related to other physical drivers. Field samples collected in 2021, during the closure of the spillway, revealed significant evidence of seasonal variations in cyanoHAB formation. Results indicate that water leakage from the spillway and tributary discharge are critical for supporting cyanoHABs during the summer months. Moreover, nitrogen-fixing cyanobacteria, such as nitrogen-fixing Dolichospermum and Cylindrospermum, were more abundant following strong winds from significant weather events, including cold fronts and hurricanes, which can resuspend phosphorus that is bound to sediment. This research improves our understanding of the physical factors that drive the formation of cyanoHABs, the prevalence of different species, and the production of toxins in the Lake Pontchartrain Estuary. The insights gained from this study are essential for environmental managers to develop effective, long-term monitoring strategies for harmful algal blooms.
1 Introduction
Harmful algal blooms (HABs) are increasing globally and are expected to become a more frequent phenomenon as human and climatic disturbances result in greater nutrient enrichment (Anderson et al., 2009; Gobbler, 2020). Several groups of phytoplankton can cause HABs; however, three of the most frequently documented groups known to produce toxins are cyanobacteria, dinoflagellates, and diatoms (Hallegraeff, 2003). The diatom genus Pseudo-nitzschia spp. and various genera of dinoflagellates, such as Heterocapsa spp. and Prorocentrum spp., are known to cause blooms that can pose public health risks in saltwater ecosystems (Tas and Yilmaz, 2015; Sarkar, 2018). Cyanobacteria, while playing a crucial role in nutrient cycling and atmospheric oxygen production in all aquatic ecosystems, are particularly abundant and problematic in nutrient-rich, warm freshwater lakes, reservoirs, and estuaries (Paerl and Huisman, 2009; Paerl and Paul, 2012; Preece et al., 2017). Harmful cyanobacterial blooms (cyanoHABs) are composed of these naturally occurring phototrophic prokaryotes with the ability to produce secondary metabolites called cyanotoxins that can cause potential harm to animals, plants, and human health (Pearson et al., 2010). Eutrophication, caused by watershed development, urbanization, and intensified agricultural activities, along with the effects of climate change, is expected to worsen, leading to an increase in the frequency and spread of cyanoHABs (Paerl and Huisman, 2009; Visser et al., 2016; Preece et al., 2017). During severe weather events, the mixing and resuspension of sediments in shallow aquatic systems intensifies. High flow conditions can quickly reduce residence time and physically flush out harmful blooms, while also introducing external nutrients such as nitrogen (N), phosphorus (P), and silicon (Si) into shallow estuarine systems. During storms, cyanobacterial blooms may be temporarily suppressed due to high turbidity and low light conditions. However, once the storms subside and calm, warm water conditions return, these cyanobacterial blooms can reemerge (Jöhnk et al., 2008; Carey et al., 2012; Paerl et al., 2016).
Human activities have significantly impacted river systems through changes in land use, river diversion operations, and flood control measures. In the past decade, the southeastern United States has seen an increase in both the number and frequency of HABs, particularly in coastal waters and estuaries along the Gulf. This increase is attributed to significant changes in both natural and human-induced processes that contribute to greater eutrophication in the region (Anderson et al., 2021). Louisiana, in particular, is at the forefront of these blooms, as the estuarine waters adjacent to the Mississippi River receive numerous nutrient inputs from natural processes and large-scale efforts to slow or reverse wetland losses, focusing on the construction of river diversions (Bargu et al., 2019; Turner et al., 2019). River diversions can introduce large volumes of nutrients and rapidly decrease salinities, creating optimal conditions for cyanobacteria growth. Increased instances of toxic and noxious freshwater cyanobacteria have been observed in Louisiana estuaries, especially during the spring and summer months (Ren et al., 2009; Garcia et al., 2010; Bargu et al., 2011; Riekenberg et al., 2015).
Lac des Allemands in Barataria Bay has experienced alternating blooms of Microcystis spp. and nitrogen-fixing Dolichospermum spp., driven by nutrient-rich waters from surface runoff (Ren et al., 2008, 2009; Garcia et al., 2010). Additionally, the Breton Sound Estuary is directly influenced by Mississippi River water through the Caernarvon Diversion. Dolichospermum, Microcystis, and Cylindrospermum have been documented in the Breton Sound Estuary during the summer when water residence time and temperatures are elevated (Riekenberg et al., 2015). The Lake Pontchartrain Estuary, located in the southeastern part of the state, has also experienced frequent cyanoHABs over the past two decades, largely due to episodic large nutrient inputs from a flood control river diversion known as the Bonnet Carré Spillway (BCS). However, the formation of these blooms has proven difficult to predict and seems to be dependent on both the timing and duration of the BCS openings (Mize and Demcheck, 2009; White et al., 2009; Bargu et al., 2011; Roy and White, 2012; Roy et al., 2016). When the BCS is opened later in the year, there is an increased probability of bloom formation after the spillway closes due to sustained warm temperatures (Bargu et al., 2023; Snow et al., 2023).
In addition to the sudden influx of nutrients into estuaries caused by human-made river diversions, nutrient levels are also affected by ongoing tidal and freshwater inputs from tributaries, as well as occasional natural weather events such as heavy rainfall, hurricanes, and cold fronts (Saksa and Xu, 2006; Wu and Xu, 2007; McCorquodale et al., 2009; Hiatt et al., 2019). These various sources can contribute to the development of cyanoHABs. Our current understanding of baseline conditions in these estuaries is limited. This study aims to enhance our knowledge of baseline conditions when the BCS is closed and to identify seasonal variability that may promote or hinder the development of cyanoHABs in the Lake Pontchartrain Estuary. The findings will provide significant insights that can be applied to analogous ecosystems.
2 Materials and methods
2.1 Study site and field sampling
Lake Pontchartrain Estuary is an oligohaline system in southeastern Louisiana, spanning approximately 1,630 km2 with an average depth ranging from 3.6 to 4.2 m. The region experiences an average annual air temperature of 19°C to 20°C, with July peaking at 30.5°C and January averaging 11.6°C (U.S. Geological Survey, 2005). Annual rainfall is high, ranging from 140 to 160 centimeters (cm). This microtidal system experiences diurnal tides with a range of approximately 0.16 m (NOAA, 2024). The estuary’s average salinity is 3.5 and decreases with increased freshwater input from northern tributary rivers, such as the Tangipahoa, Tchefuncte, Tickfaw, Amite, and Bogue Falaya, as well as from the Mississippi River and Lake Maurepas through Pass Manchac (U.S. Geological Survey, 2005). Increases in salinity happen due to low freshwater flow and salt intrusion caused by high tides and storm surges from the Gulf through Lake Borgne (U.S. Geological Survey, 1998; McCorquodale et al., 2009; Figure 1).
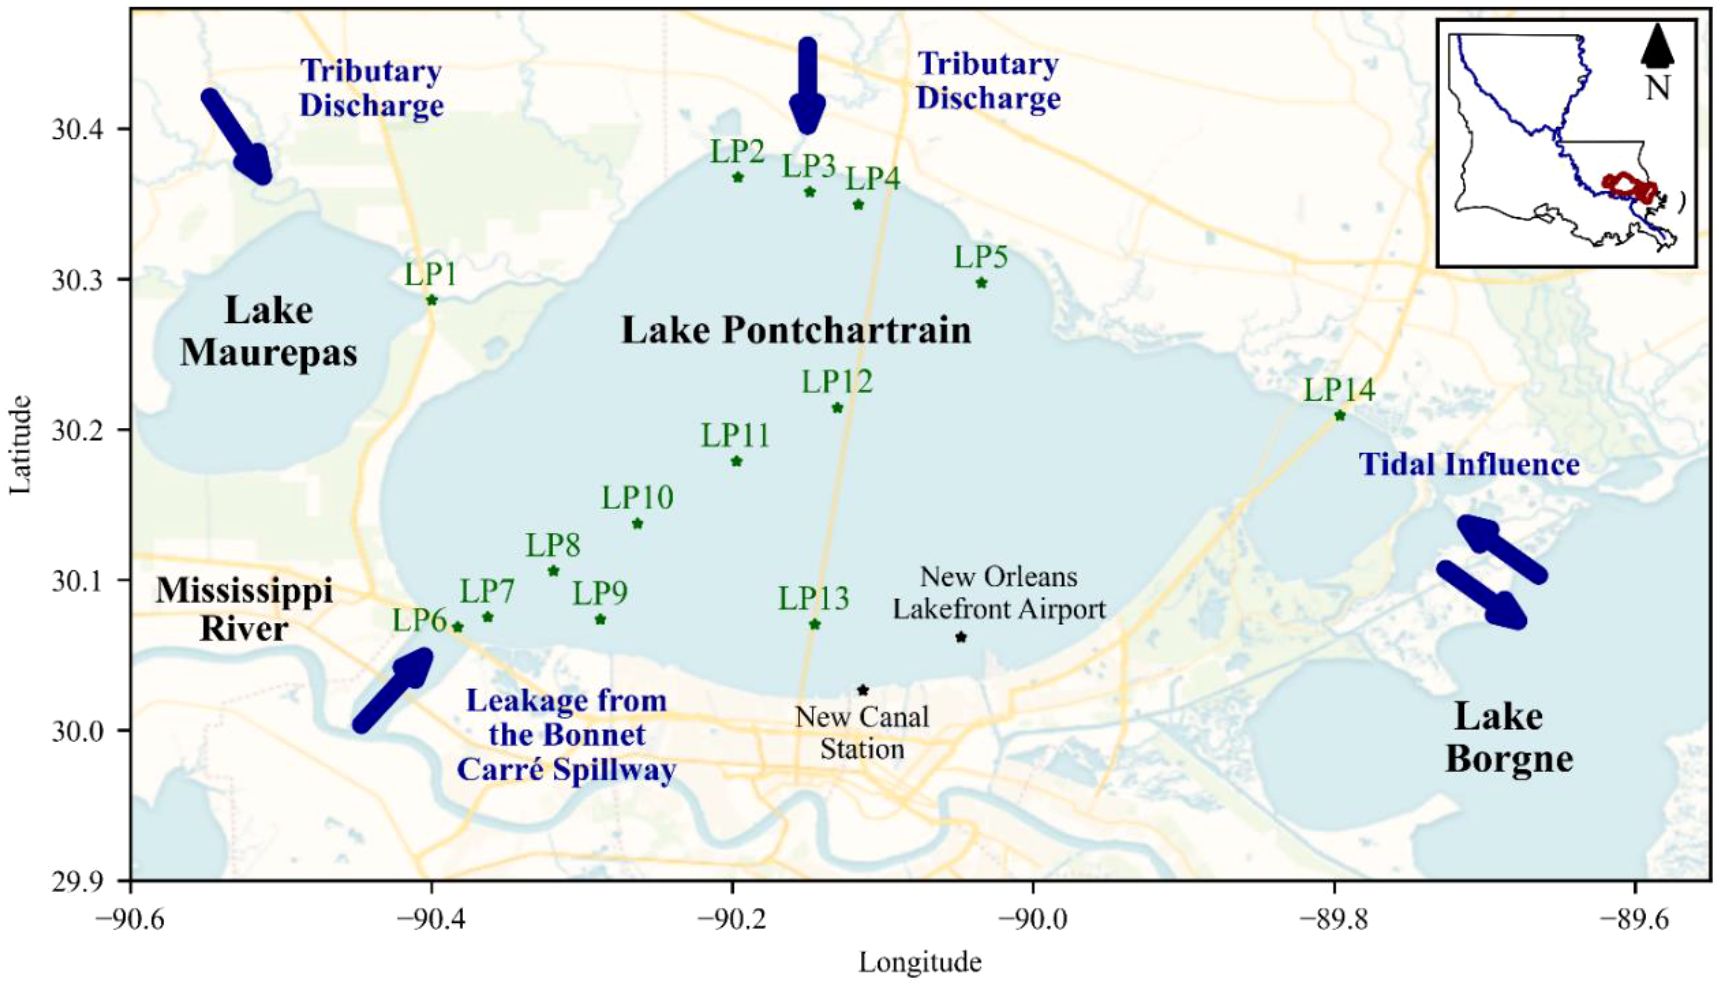
Figure 1. Map of 2021 field collection sites along the Lake Pontchartrain Estuary in southeastern Louisiana.
From February to December 2021, monthly water samples were collected from 14 stations across the Lake Pontchartrain Estuary. While previous studies focused on field data from a transect (LP6-LP13) extending from the BCS, our study sampled this transect and additional regions impacted by freshwater discharge (LP1-LP5) and saltwater intrusion (LP14). We measured temperature, pH, salinity, and dissolved oxygen using a YSI 556 MPS and assessed water clarity using the Secchi disk depth. Triplicate water samples were collected from each station, and each sample was analyzed for total suspended solids (TSS), nutrients (SRP, NOx, NH4, SiO2), chlorophyll a (chl a), phycocyanin pigments, microcystin toxins, signature phytoplankton pigment composition, and microscopic identification of dominant species, with samples kept on ice in the dark during transport back to the laboratory.
2.2 Discharge and residence time
Tidal prism flushing time () of Lake Pontchartrain Estuary was calculated using a simple tidal prism model of a well-mixed estuary with complete tidal exchange (Monsen et al., 2002; Sheldon and Alber, 2006), shown in Equation 1:
where is the volume of Lake Pontchartrain Estuary (6 km3) and is the sum of the tributary discharge and leakage from the BCS (m3 s−1). The volume of the tidal prism, VTP (m3), is the product of the tidal range, TR (m), and the area of Lake Pontchartrain Estuary, (m2), (Equation 2).
Equation 1 was adjusted to account for the lunar day by introducing a correction factor, γ, defined as the ratio of the lunar day to the solar day. This resulted in the following equation for estimating tidal prism flushing time (Equation 3):
For freshwater input, tributary discharge and leakage from the BCS were used. Daily mean tributary discharge values were obtained from the USGS stream gages for the four primary tributaries entering Lake Pontchartrain Estuary (Hodson et al., 2023; U. S. Geological Survey, 2024): the Tchefuncte River (USGS gage #7375000), the Tickfaw River (7376000), the Tangipahoa River (7375500), and the Amite River (7378500), as summarized in Table 1. Discrepancies in discharge between upstream and downstream drainage basins were addressed using correction factors derived by Roblin (2008) and van den Huevel (2010), also shown in Table 1. Missing data from the Tchefuncte River were replaced with 12-year monthly means corresponding to months with gaps (January 2021 to May 2021). The impact is minimal due to the Tchefuncte River contributing between 1% and 3% of the flow from January to May, on average.
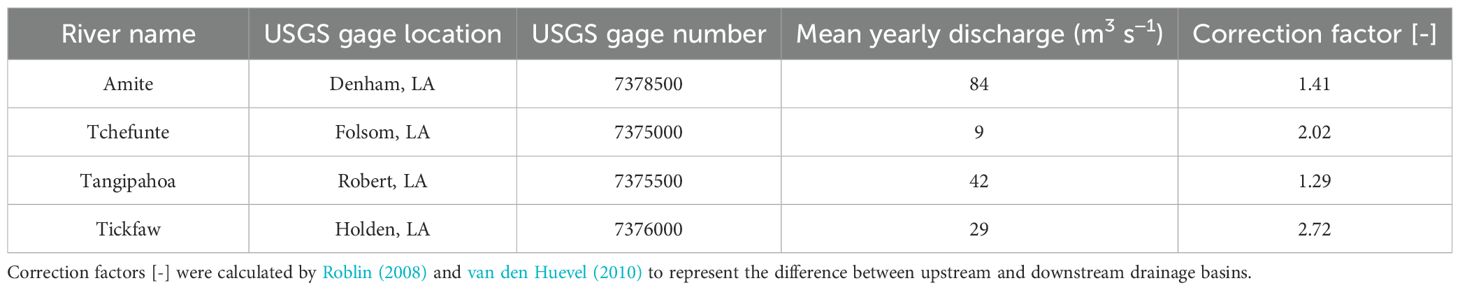
Table 1. USGS river gage stations with mean discharge [m3 s−1] of historical data. .
The leakage discharge from the BCS was estimated using the broad-crested spillway equation (Chow, 1959), which has been previously applied in leakage estimates of the BCS (McCorquodale et al., 2009). The total leakage discharge was calculated based on the fraction of the spillway above the crest where leakage occurs (i.e., through wooden timbers), the width of the spillway crest, the discharge coefficient, and the water level above the spillway crest. Water level measurements were obtained from the Mississippi River at Bonnet Carré gauge (01280) (USACE, 2024) and were converted to mean lower low water (MLLW). The equation for determining leakage and the calculation of the discharge coefficient can be found in the Supplementary Materials S1.
Tidal elevation data (MLLW) for 2021 were obtained from the National Oceanic and Atmospheric Administration (NOAA) Service Station at New Canal Station (8761927) (NOAA, 2024). To remove short-term meteorological influences, the tidal elevation data were processed using a sixth-order low-pass Butterworth filter with a four-cycles-per-day cutoff frequency (Parker, 2007). Monthly mean tidal ranges were calculated using the Manual of Tide Observations protocol (U.S. C&GS, 1965), which involved determining the difference between the monthly mean high and low values of mean lower low water (MLLW) elevation measurements.
Additional environmental data on precipitation were obtained from the NOAA National Centers for Environmental Information Database using station NCDC72235 at New Orleans Lakefront Airport. Meteorological data on wind speed were obtained from NOAA Tides and Currents at the New Canal Station (8761927) (NOAA, 2024).
2.3 Chemical and biological analysis
Water samples were collected in acid-washed bottles and analyzed for nutrients and total suspended solids (TSS). Dissolved inorganic nutrients were assessed using an automated discrete analyzer (AQII; SEAL Analytical). In the lab, 40 mL of each sample was vacuum-filtered through 0.7 μm glass microfiber filter (GF/F, Whatman) membrane filters, and the filtrates were used for nitrogen (N), phosphorus (P), and silicon (Si) analysis. Ammonium nitrogen (NH4-N) was measured via EPA Method 350.1, and nitrate plus nitrite (NOx) was measured using Method 353.2 (USEPA, 1993). The sum of NH4-N and NOx-N represents the dissolved inorganic nitrogen (DIN) pool. Dissolved inorganic phosphorus (DIP) was assessed with Method 365.1, whereas dissolved silicon (DSi) was analyzed using an O.I. Analytical Flow Solutions IV Autoanalyzer using National Environmental Methods Index (NEMI) Method 4500-SiO2. The TSS was quantified by filtering water through pre-ashed, preweighted GF/F filters, drying it at 105°C, and reweighing it (USEPA, 1979, Method No. 160.2).
Biological samples were processed the same day as collection in a dimly lit environment, and multiple parameters were assessed at all stations. For phytoplankton biomass, 50 mL of subsurface water samples was filtered through 25-mm GF/F filters to measure extracted chlorophyll a (chl a). The filters were extracted for 24 h in 90% acetone at −20°C and analyzed using a Turner 10 AU fluorometer (Parsons et al., 1984). Phycocyanin and chlorophyll raw fluorescence units (RFUs) were measured with the Turner CyanoFluor. Phycocyanin RFU values were converted to concentrations (μg L−1) using a standard curve from phycocyanin in a phosphate buffer. The ratio of phycocyanin to chlorophyll helps estimate the prominence of cyanobacteria in a mixed algal population. If phycocyanin exceeds chlorophyll, it suggests that cyanobacteria are dominant, indicating a potential bloom (Turner Designs, 2022, CyanoFlour Handheld Indicator User Guide).
Water samples were also analyzed for intracellular and extracellular forms of the cyanobacterial toxin, microcystin. 100–200 mL of samples was filtered through GF/F filters. Intracellular microcystin (IM) was measured from the material on the filters, whereas the remaining water was used for extracellular microcystin (EM) analysis. Both samples were stored at −20°C prior to extraction. Extraction was performed using a modified protocol from Garcia et al. (2010), which involved a solution of methanol, water, and acetic acid. 5 mL of extraction solution was added to the filter and vortexed for 1 min. This mixture was then sonicated for 2 min in an ice bath and centrifuged at 3,000 rpm for 10 min to remove debris. The supernatant was filtered through a 0.2-μm syringe filter with an SFCA membrane filter. The remaining pellet was resuspended with an additional 5 mL of extraction solution, and the process was repeated. Toxin concentrations in collected water samples were determined using commercially available highly sensitive enzyme-linked immunosorbent assay (ELISA) kits (Microcystin-ADDA ELISA, Abraxis LLC) with a detection limit of 0.01 μg L−1. Samples were analyzed according to the protocol provided in the kits, and the absorbance was measured at 450 nm using a microplate ELISA photometer.
Bulk phytoplankton groups were identified using signature pigment ratios. Samples were vacuum filtered through 25-mm GF/F filters and stored at −20°C in foil-covered 15-mL tubes. Diagnostic pigments were analyzed using high-performance liquid chromatography (HPLC), following the method established by Pinckney et al. (1998) at the HPLC Photopigment Analysis Facility at the University of South Carolina.
The following accessory pigments were analyzed as indicators of the signature pigment groups: chlorophyll c3, chlorophyll c1 c2, peridinin, 19′-butanoyloxyfucoxanthin, fucoxanthin, 19′-hexanoyloxyfucoxanthin, 9′-cis-neoxanthin, prasinoxanthin, violaxanthin, myxoxanthophyll, diadinoxanthin, antheraxanthin, alloxanthin, monadoxanthin, diatoxanthin, lutein, zeaxanthin, gyroxanthin, canthaxanthin, carotenal (internal standard), bacteriochlorophyll a, chlorophyll b, crocoxanthin, chlorophyll a-allomer, divinyl chlorophyll a, chlorophyll a′, echinenone, α carotene, and ß carotene. The phytoplankton community composition based on the diagnostic pigment ratio by specific functional groups was calculated using the formula below from Wang et al. (2015), where ΣDP is the sum of the weighted concentrations of all diagnostic pigments, which was used to find the overall contribution by group of the phytoplankton characteristic of this region and their associated accessory pigments.
Functional groups were chosen based on phytoplankton groups that tend to dominate coastal waters of the Gulf (Chakraborty and Lohrenz, 2015). The functional groups included are haptophytes (19′-hexanoyloxyfucoxanthin, Hex-fuco), chlorophytes (chlorophyll b), cryptophytes (alloxanthin (Allo)+ α carotene), cyanobacteria (zeaxanthin, Zea), diatoms (fucoxanthin (Fuco) + diatoxanthin + diadinoxanthin), and dinoflagellates (peridinin, Per) (Pinckney et al., 1997; Liu et al., 2019). Additionally, 100 mL of water samples was preserved in 2% glutaraldehyde for microscopy to identify the dominant species of phytoplankton using an inverted microscope, the Axio Observer A1 (Zeiss, Axiovert 135).
2.4 Statistical analysis
The data were analyzed using R (Version 4.5.1). ANOVAs assessed seasonal and spatial variations in environmental conditions (e.g., salinity, DO, pH, and nutrients) and cyanobacteria biomass (phycocyanin) and toxins. To identify specific differences between groups, post-hoc tests were conducted, along with a correlation test to determine potential relationships between variables. A multivariate regression was also performed to explore relationships between environmental predictors and cyanobacteria biomass. The ANOVAs and regressions were assessed for possible interaction between variables.
3 Results
3.1 Hydrologic and meteorological influences
In 2021, the increase in nutrient levels in Lake Pontchartrain Estuary, despite no openings of the Bonnet Carré Spillway, was mainly attributed to the influx of nutrients from watershed tributary discharge. This influx was primarily driven by precipitation runoff and leakage from the BCS, with the impact being notably seasonal (Figure 2). Precipitation in 2021 varied throughout the year, generally peaking in the spring. A notable spike later occurred due to Hurricane Ida, a Category 4 hurricane that struck Louisiana in September. The total rainfall for the year reached 204 cm, with the highest monthly precipitation recorded at 14 cm in March. The total annual discharge volume from northern tributaries and Lake Maurepas into the Lake Pontchartrain Estuary was 2.54 × 10¹² m³, resulting in an average daily discharge of 221 m³ s−1. The highest total discharge occurred in mid-April, following the high precipitation in March, while the lowest discharge was observed in November (Figure 2). The total volume of water discharged from Lake Maurepas during the year was 20 times greater (2.4 × 10¹² m³) than that from the northern shore of the estuary (1.2 × 10¹¹ m³). Discharge from the northern tributaries peaked in September after Hurricane Ida, whereas Lake Maurepas experienced peak discharge in the spring when precipitation levels were highest (Figure 2).
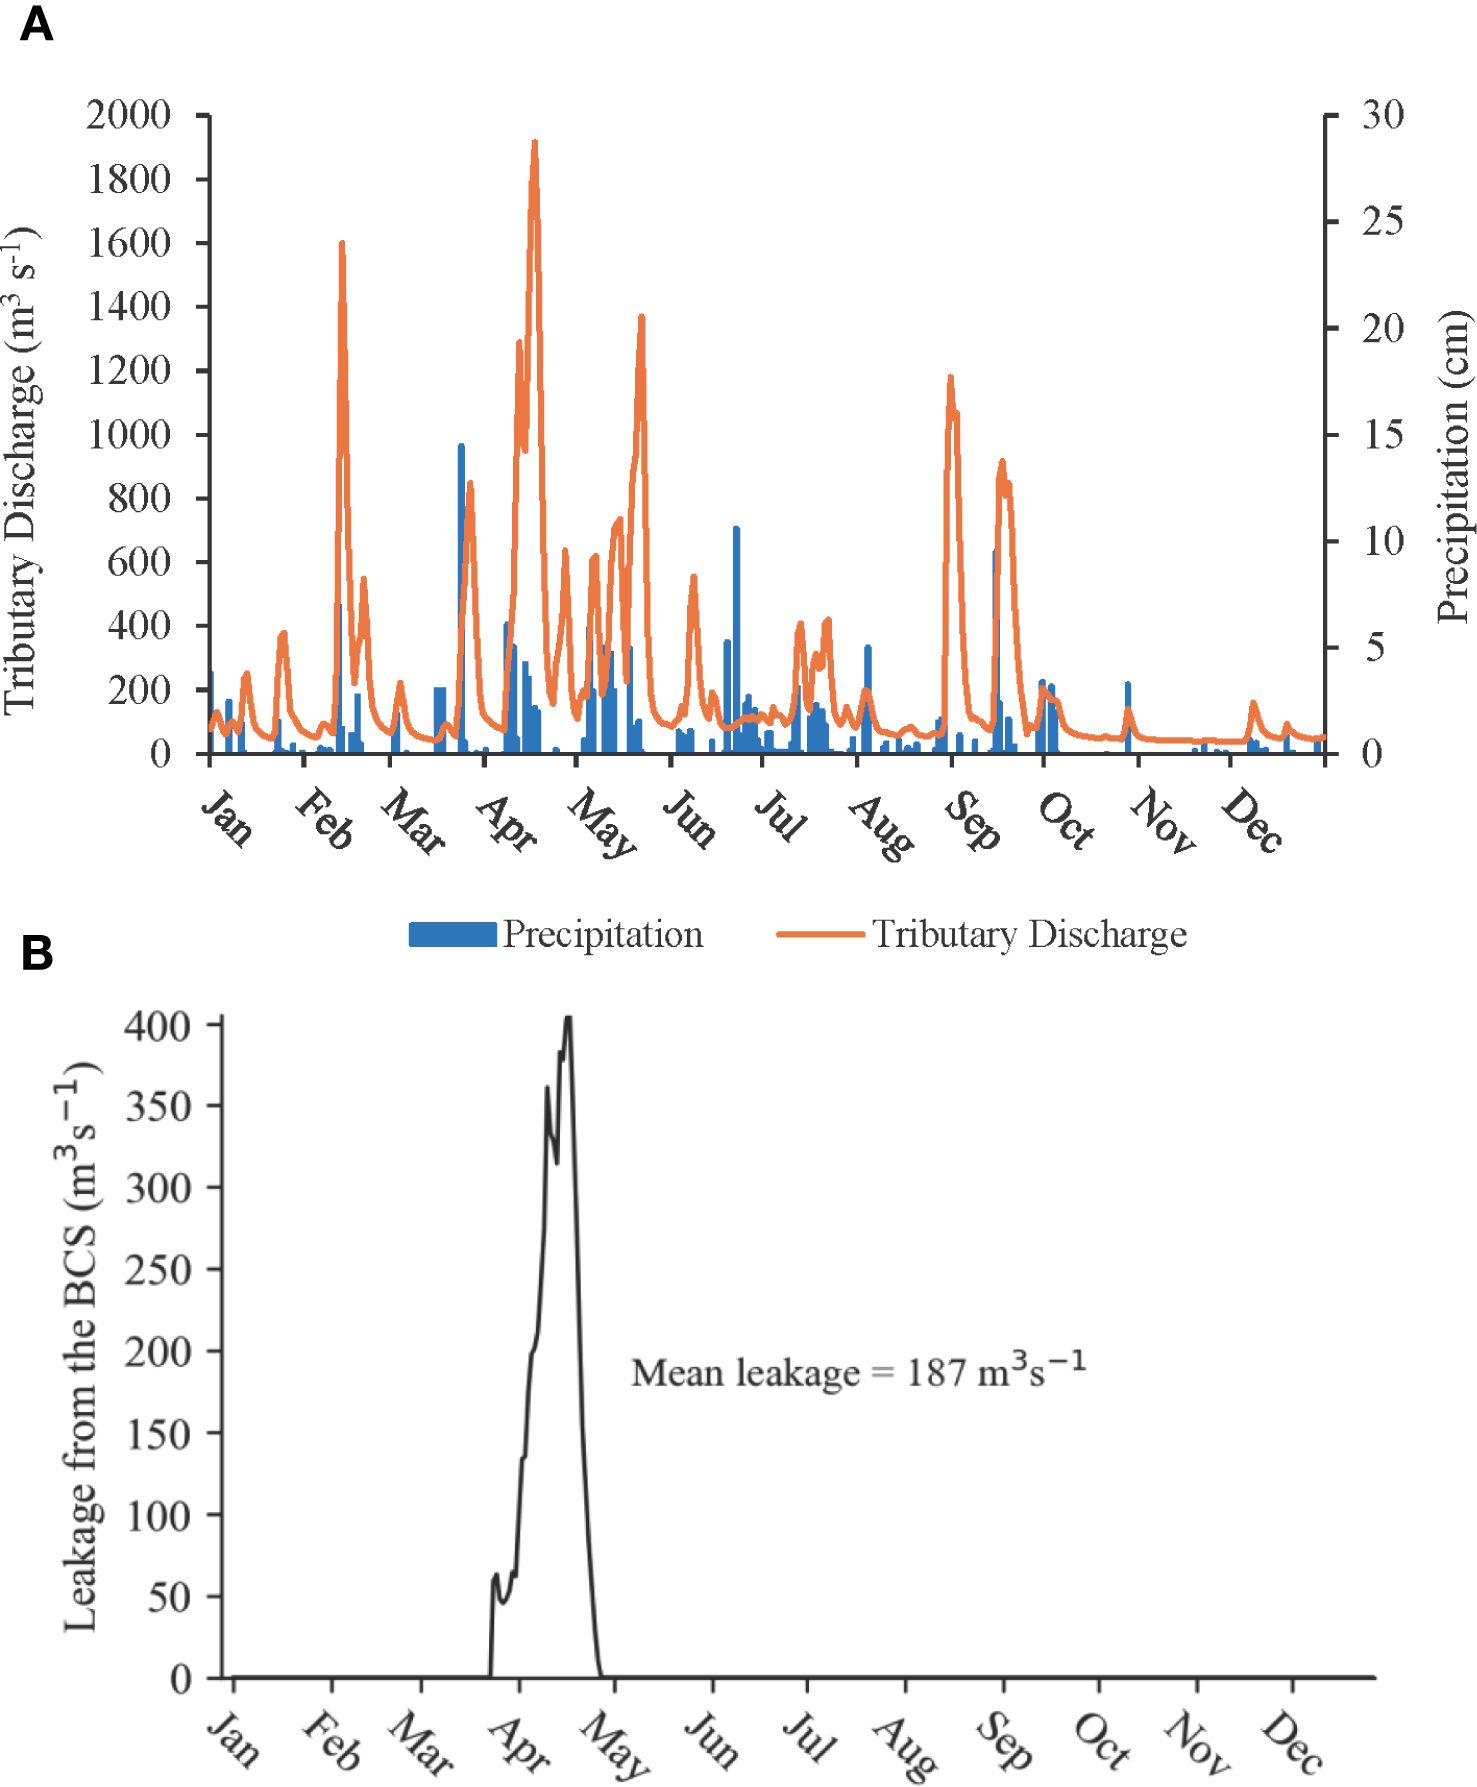
Figure 2. (A) Mean daily total tributary discharge (m3 s−1) into Lake Pontchartrain Estuary and precipitation (cm) during January–December 2021. (B) Leakage (m3 s−1) from the Bonnet Carré Spillway (BCS) into Lake Pontchartrain Estuary in 2021.
Leakage or discharge from the BCS typically occurs during the winter and spring months when the Mississippi River reaches its highest flood stage (Huang et al., 2020). In 2021, although the BCS remained closed, leakage occurred from March to April due to flooding from the low bay sills and through the timber slats in the spillway (Figure 2). Leakage from the BCS peaked at a rate of 407.3 m³ s−1 recorded on April 17, 2021, and had a mean leakage rate of 186.6 m³ s−1.
While average water levels in the Lake Pontchartrain Estuary remained relatively stable due to microtidal forces, they were affected by weather conditions throughout the study period. The lowest water levels were observed during the winter months, with the minimum recorded level at −0.33 m in January. Conversely, the highest water level was 1.84 m, recorded in late August during the passage of Hurricane Ida. Generally, average water levels were highest in the fall and lowest in the winter (Figure 3). The average wind speed was 5.78 m s−1 over the year, with peak gusts reaching 43.54 and 39.85 m s−1 during Hurricane Ida at the end of August (Figure 3). Wind direction varied daily but mostly blew toward the southwestern part of the estuary.
Figure 3. (A) Wind speed (m s−1) for Lake Pontchartrain Estuary during 2021. (B) Water height (meters) with a mean lower low water (MLLW) datum at New Canal Station located along Lake Pontchartrain, LA.
The tidal prism flushing time (Equation 3) ranged from 22 to 42 days. Tidal prism flushing time was lower during spring and summer and higher during fall and winter but remained relatively constant throughout the year. It is important to note that the calculation of tidal prism flushing time does not include the effects of wind, which can be an additional factor influencing water transport in Lake Pontchartrain Estuary (Li et al., 2018). Accordingly, relatively high discharge and leakage during the spring months (Figure 2) led to decreased flushing times (Figure 4), with leakage reducing tidal prism flushing time by 1.3–4.0%. Likewise, elevated discharges due to increased precipitation owing to Hurricane Ida in August 2021 induced the minimum value of flushing time observed (Figure 4).
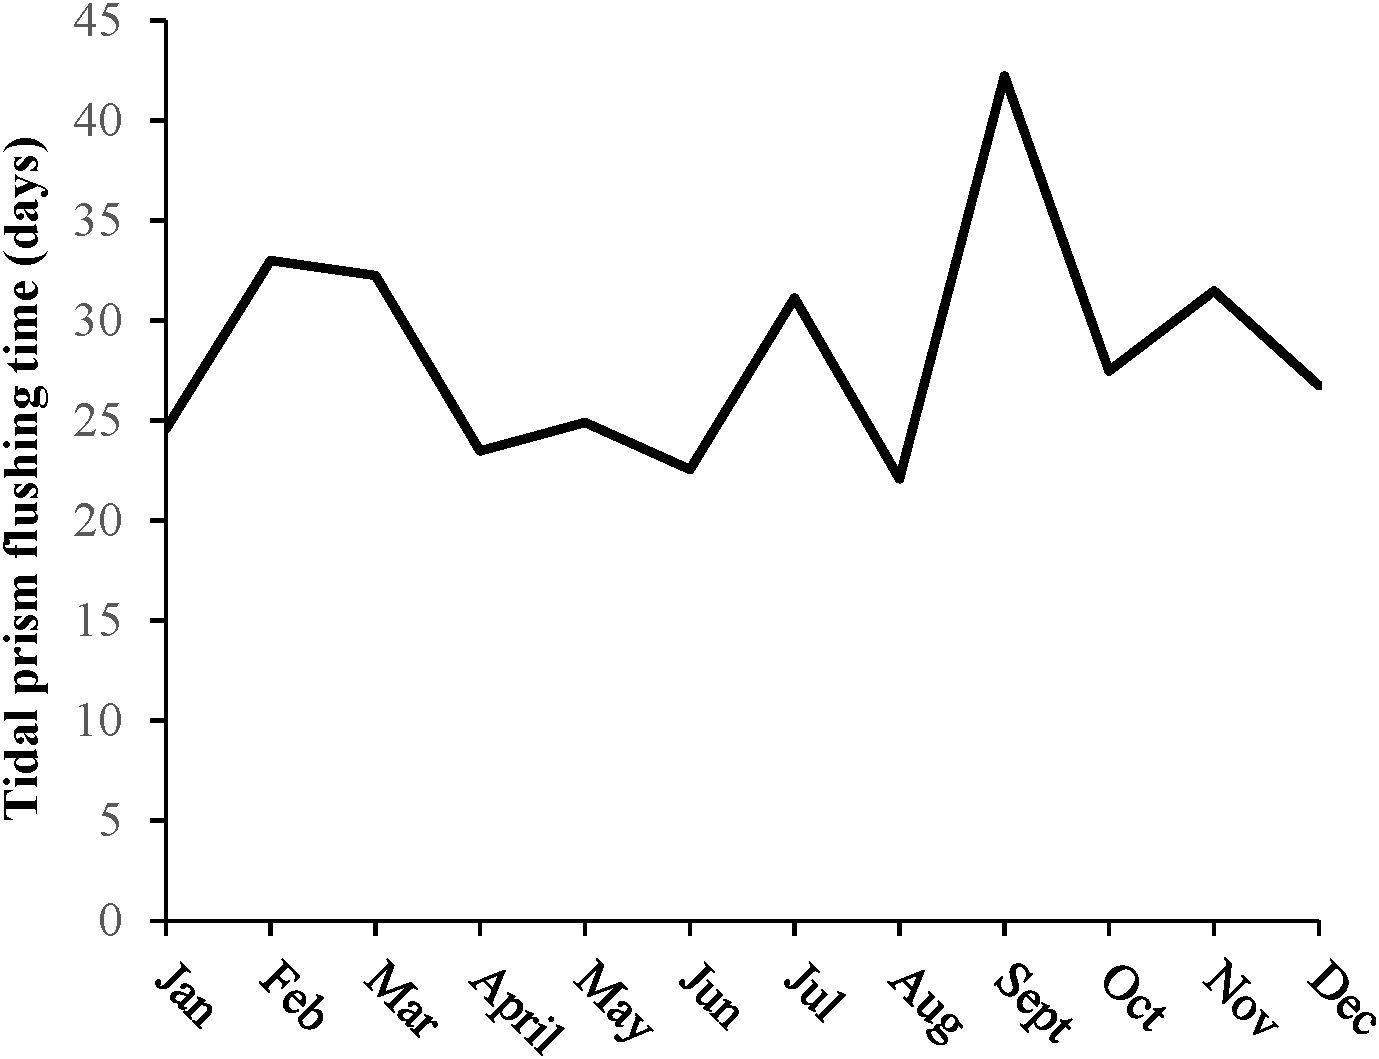
Figure 4. Tidal prism flushing time (in days) within the Lake Pontchartrain Estuary during 2021 when the Bonnet Carré Spillway remained closed, but leakage from the spillway was observed.
3.2 Environmental conditions
In 2021, the environmental conditions in Lake Pontchartrain Estuary varied both seasonally and across different monitoring stations. The seasons are categorized as winter (December, January, February), spring (March, April, May), summer (June, July, August), and fall (September, October, November).
Water temperatures exhibited significant differences among the seasons (p< 0.05), with substantial variations in temperatures between each season (p< 0.05). During summer, water temperatures ranged from 25.1°C to 32.3°C, whereas in winter, they ranged from 7.66°C to 20.5°C. Spring temperatures fluctuated between 18.2°C and 26.4°C, and fall temperatures ranged from 16.9°C to 25.8°C (Figure 5A).
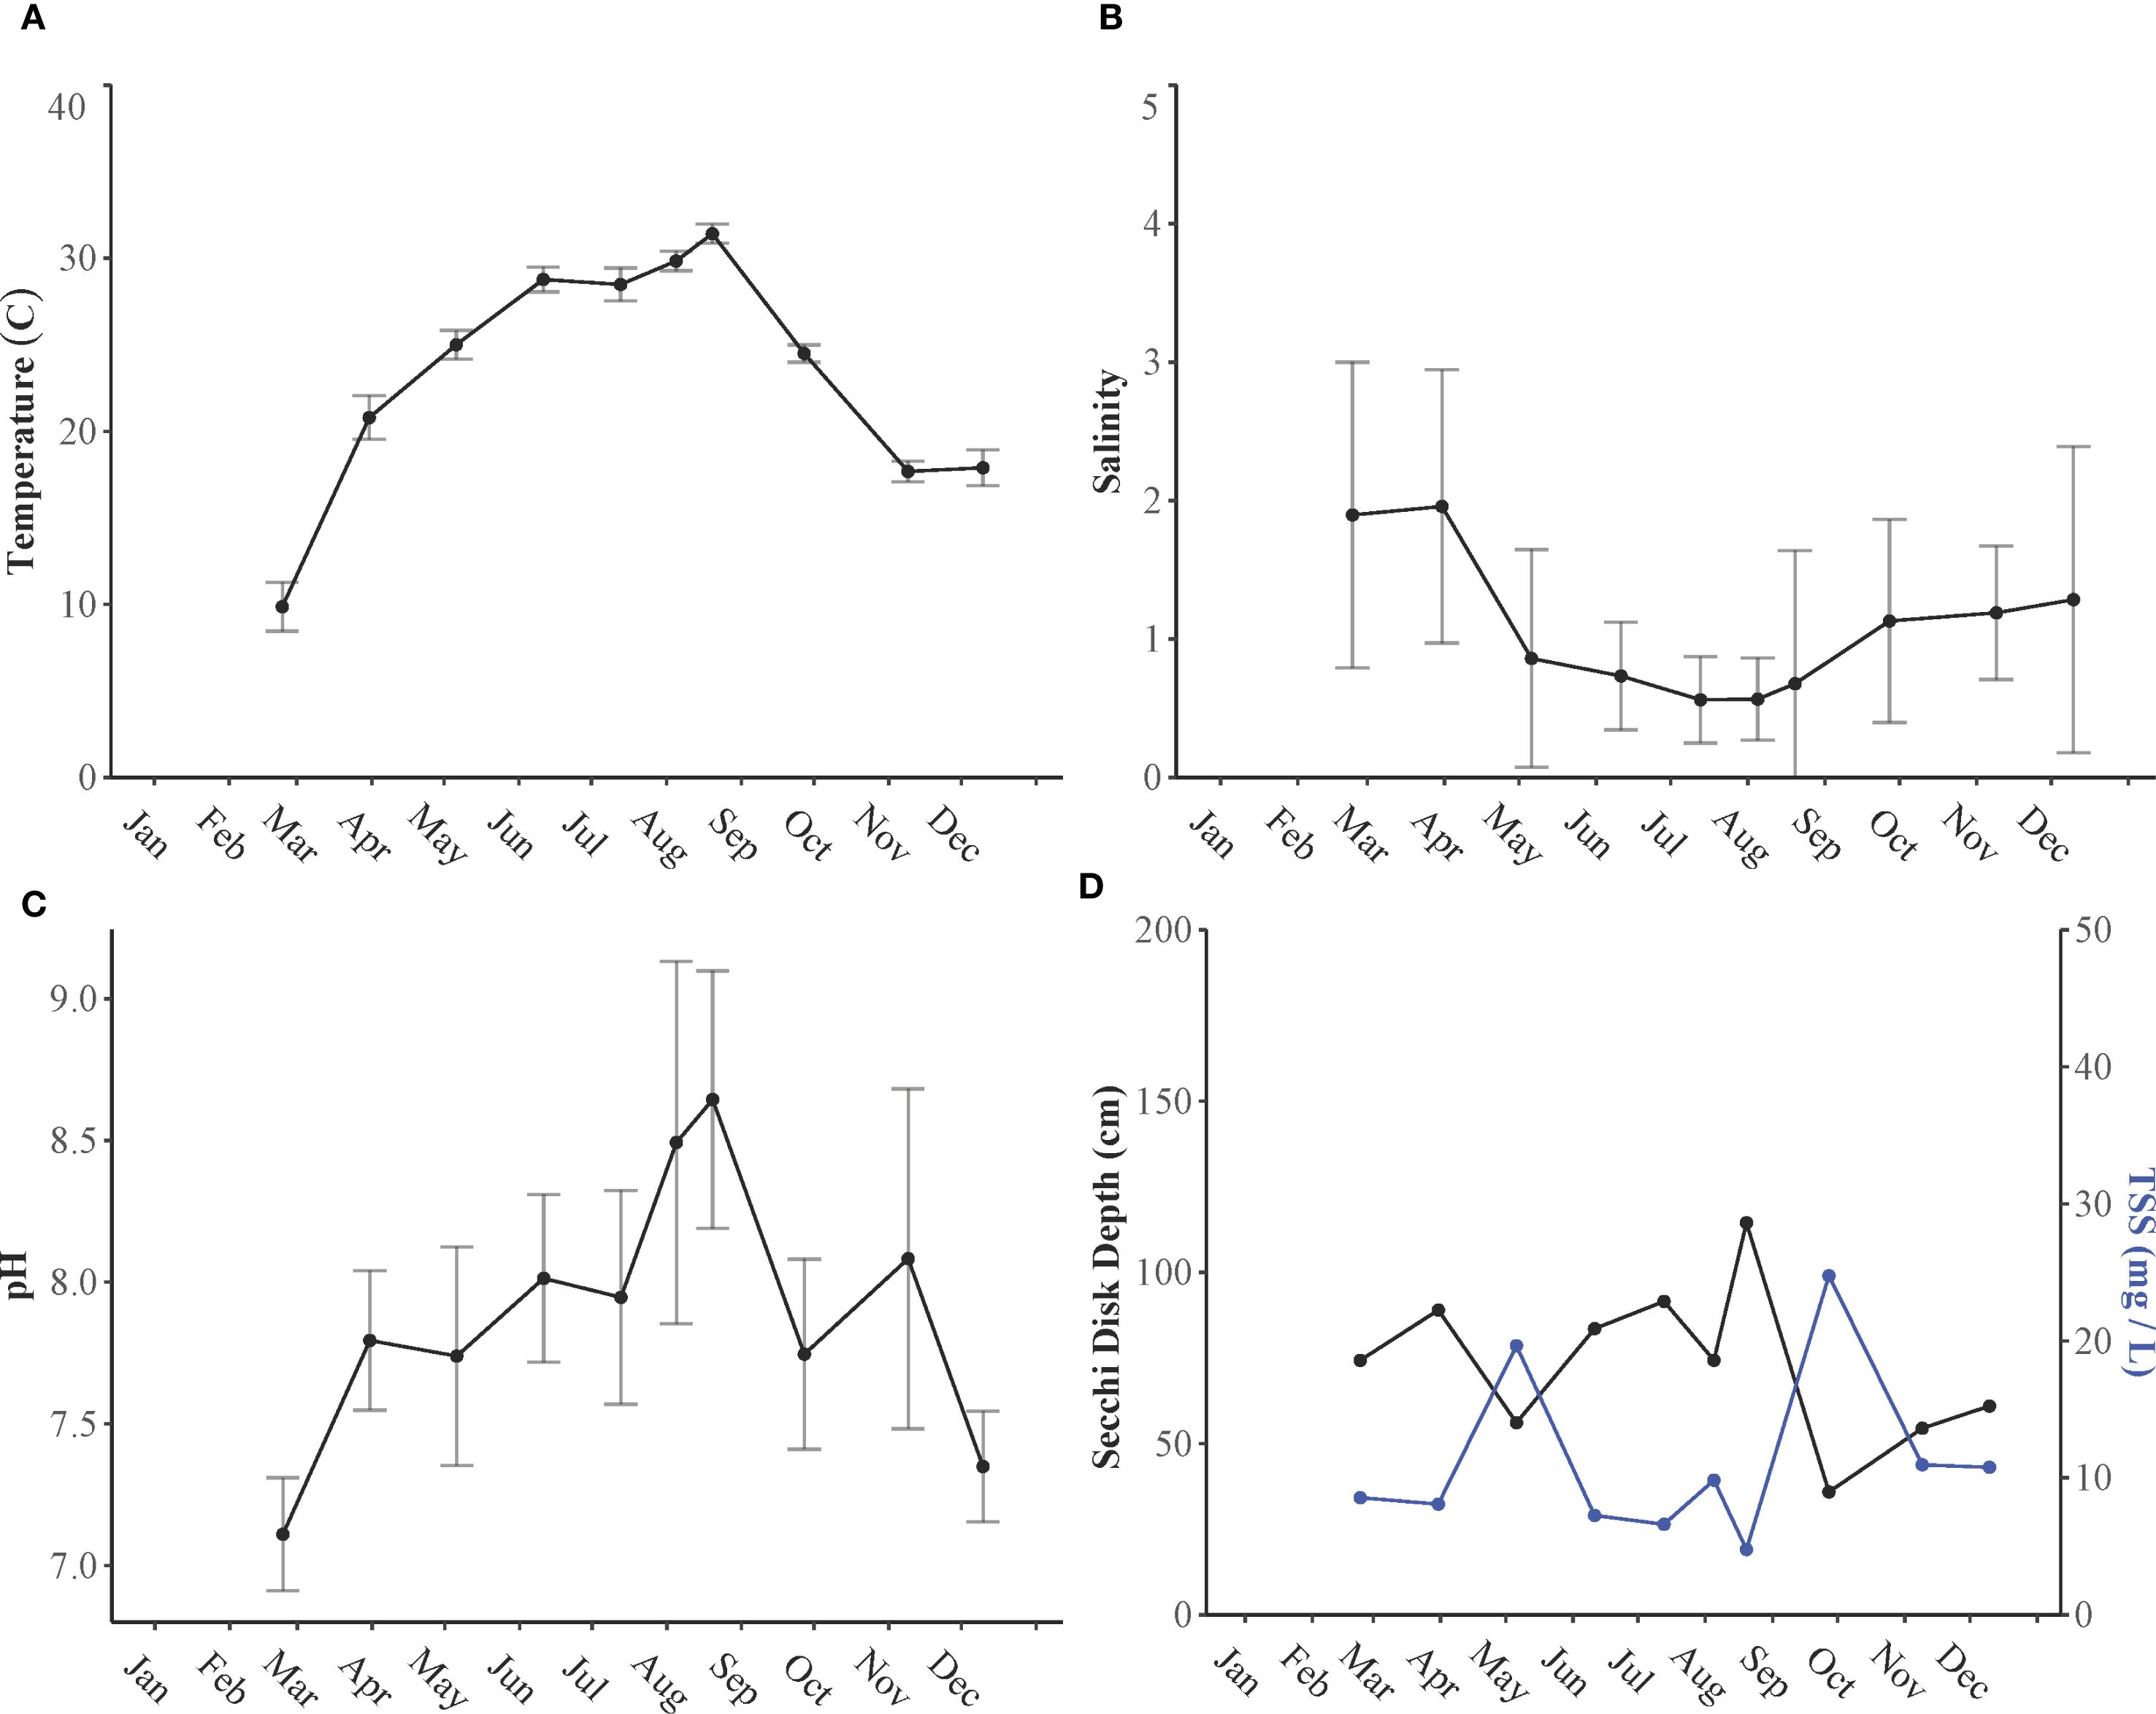
Figure 5. (A) Temperature (°C), (B) salinity, (C) pH, and (D) Secchi disk depth (cm) and total suspended solids (mg/L) of water samples collected from Lake Pontchartrain Estuary in 2021.
Salinity varied significantly between seasons (p< 0.01) and across different locations (p< 0.01). There were notable differences in salinity between summer months and all other seasons (p<0.05). During the summer, salinity levels were low (0.63 ± 0.56) due to increased rainfall and runoff, whereas winter salinity reached a peak of 1.54 ± 1.13, influenced by lower precipitation and runoff. The highest salinity was observed at the easternmost station (LP14), affected by coastal waters, and the lowest at stations impacted by continuous freshwater discharge from tributaries in the north (LP1–LP4) (Figure 5B). The maximum salinity recorded was 5.62 at station LP14 in December, whereas the minimum was 0.04 at station LP1 in April.
Like salinity, pH can be influenced by various factors, but it is primarily affected by biological processes. During phytoplankton blooms, pH levels increase due to enhanced photosynthesis. Significant differences in pH were observed across seasons (p< 0.05), but not between different stations (p > 0.05). Specifically, a notable difference in pH was observed between winter and all other seasons (p< 0.05). Lower pH values were recorded during the winter months (7.24 ± 0.22), whereas higher pH levels were noted in the summer (8.28 ± 0.54) and fall (7.91 ± 0.51) (Figure 5C). Similarly, dissolved oxygen (DO) levels also varied significantly across seasons (p< 0.05) but not among stations (p > 0.05). The lowest recorded DO level was 4.79 mg L−¹, which occurred in late August. Throughout the year, DO levels remained above 2 mg L−¹, indicating that hypoxia was not measured in the estuary during 2021.
There was high variability in TSS across seasons (p< 0.05), but no significant variation was observed across stations (p > 0.05). However, a significant interaction was found between the two variables (p< 0.05). Summer showed a significant difference in TSS compared with fall and spring (p<0.05). The highest TSS level recorded was 143 mg L−1 at station LP6 in September, following Hurricane Ida. Similarly, Secchi disk depth exhibited a significant seasonal difference (p< 0.051) and also showed significant variation across stations (p< 0.05). The interaction between stations across seasons was significant (p< 0.05). There was a significant difference in Secchi disk depth between the fall and summer months (p< 0.05), and notably, a strong significant difference was observed between LP14 and LP1 (p< 0.05). Stations closer to freshwater inflow, whether from leakage or tributary discharge, exhibited smaller Secchi disk depths due to increased water mixing, whereas stations farther from tributary influx exhibited higher Secchi disk depths (Figure 5D).
Nutrient concentrations showed both seasonal and spatial variation, demonstrating a consistent trend throughout the estuary (Figure 6). The concentration of SRP varied significantly with both season (p< 0.05) and location (p< 0.05); however, the combined interaction of these factors was not significantly different (p > 0.05). The highest recorded SRP level, which was 7.88 μM, occurred at station LP6 at the entrance to the BCS in September following Hurricane Ida. There was a notable difference in SRP levels between winter and summer months (p< 0.05). The highest average SRP levels were observed in the summer months (1.38 ± 0.75 μM), whereas the lowest levels were recorded during the winter months (0.91 ± 0.37 μM) (Figure 6A).
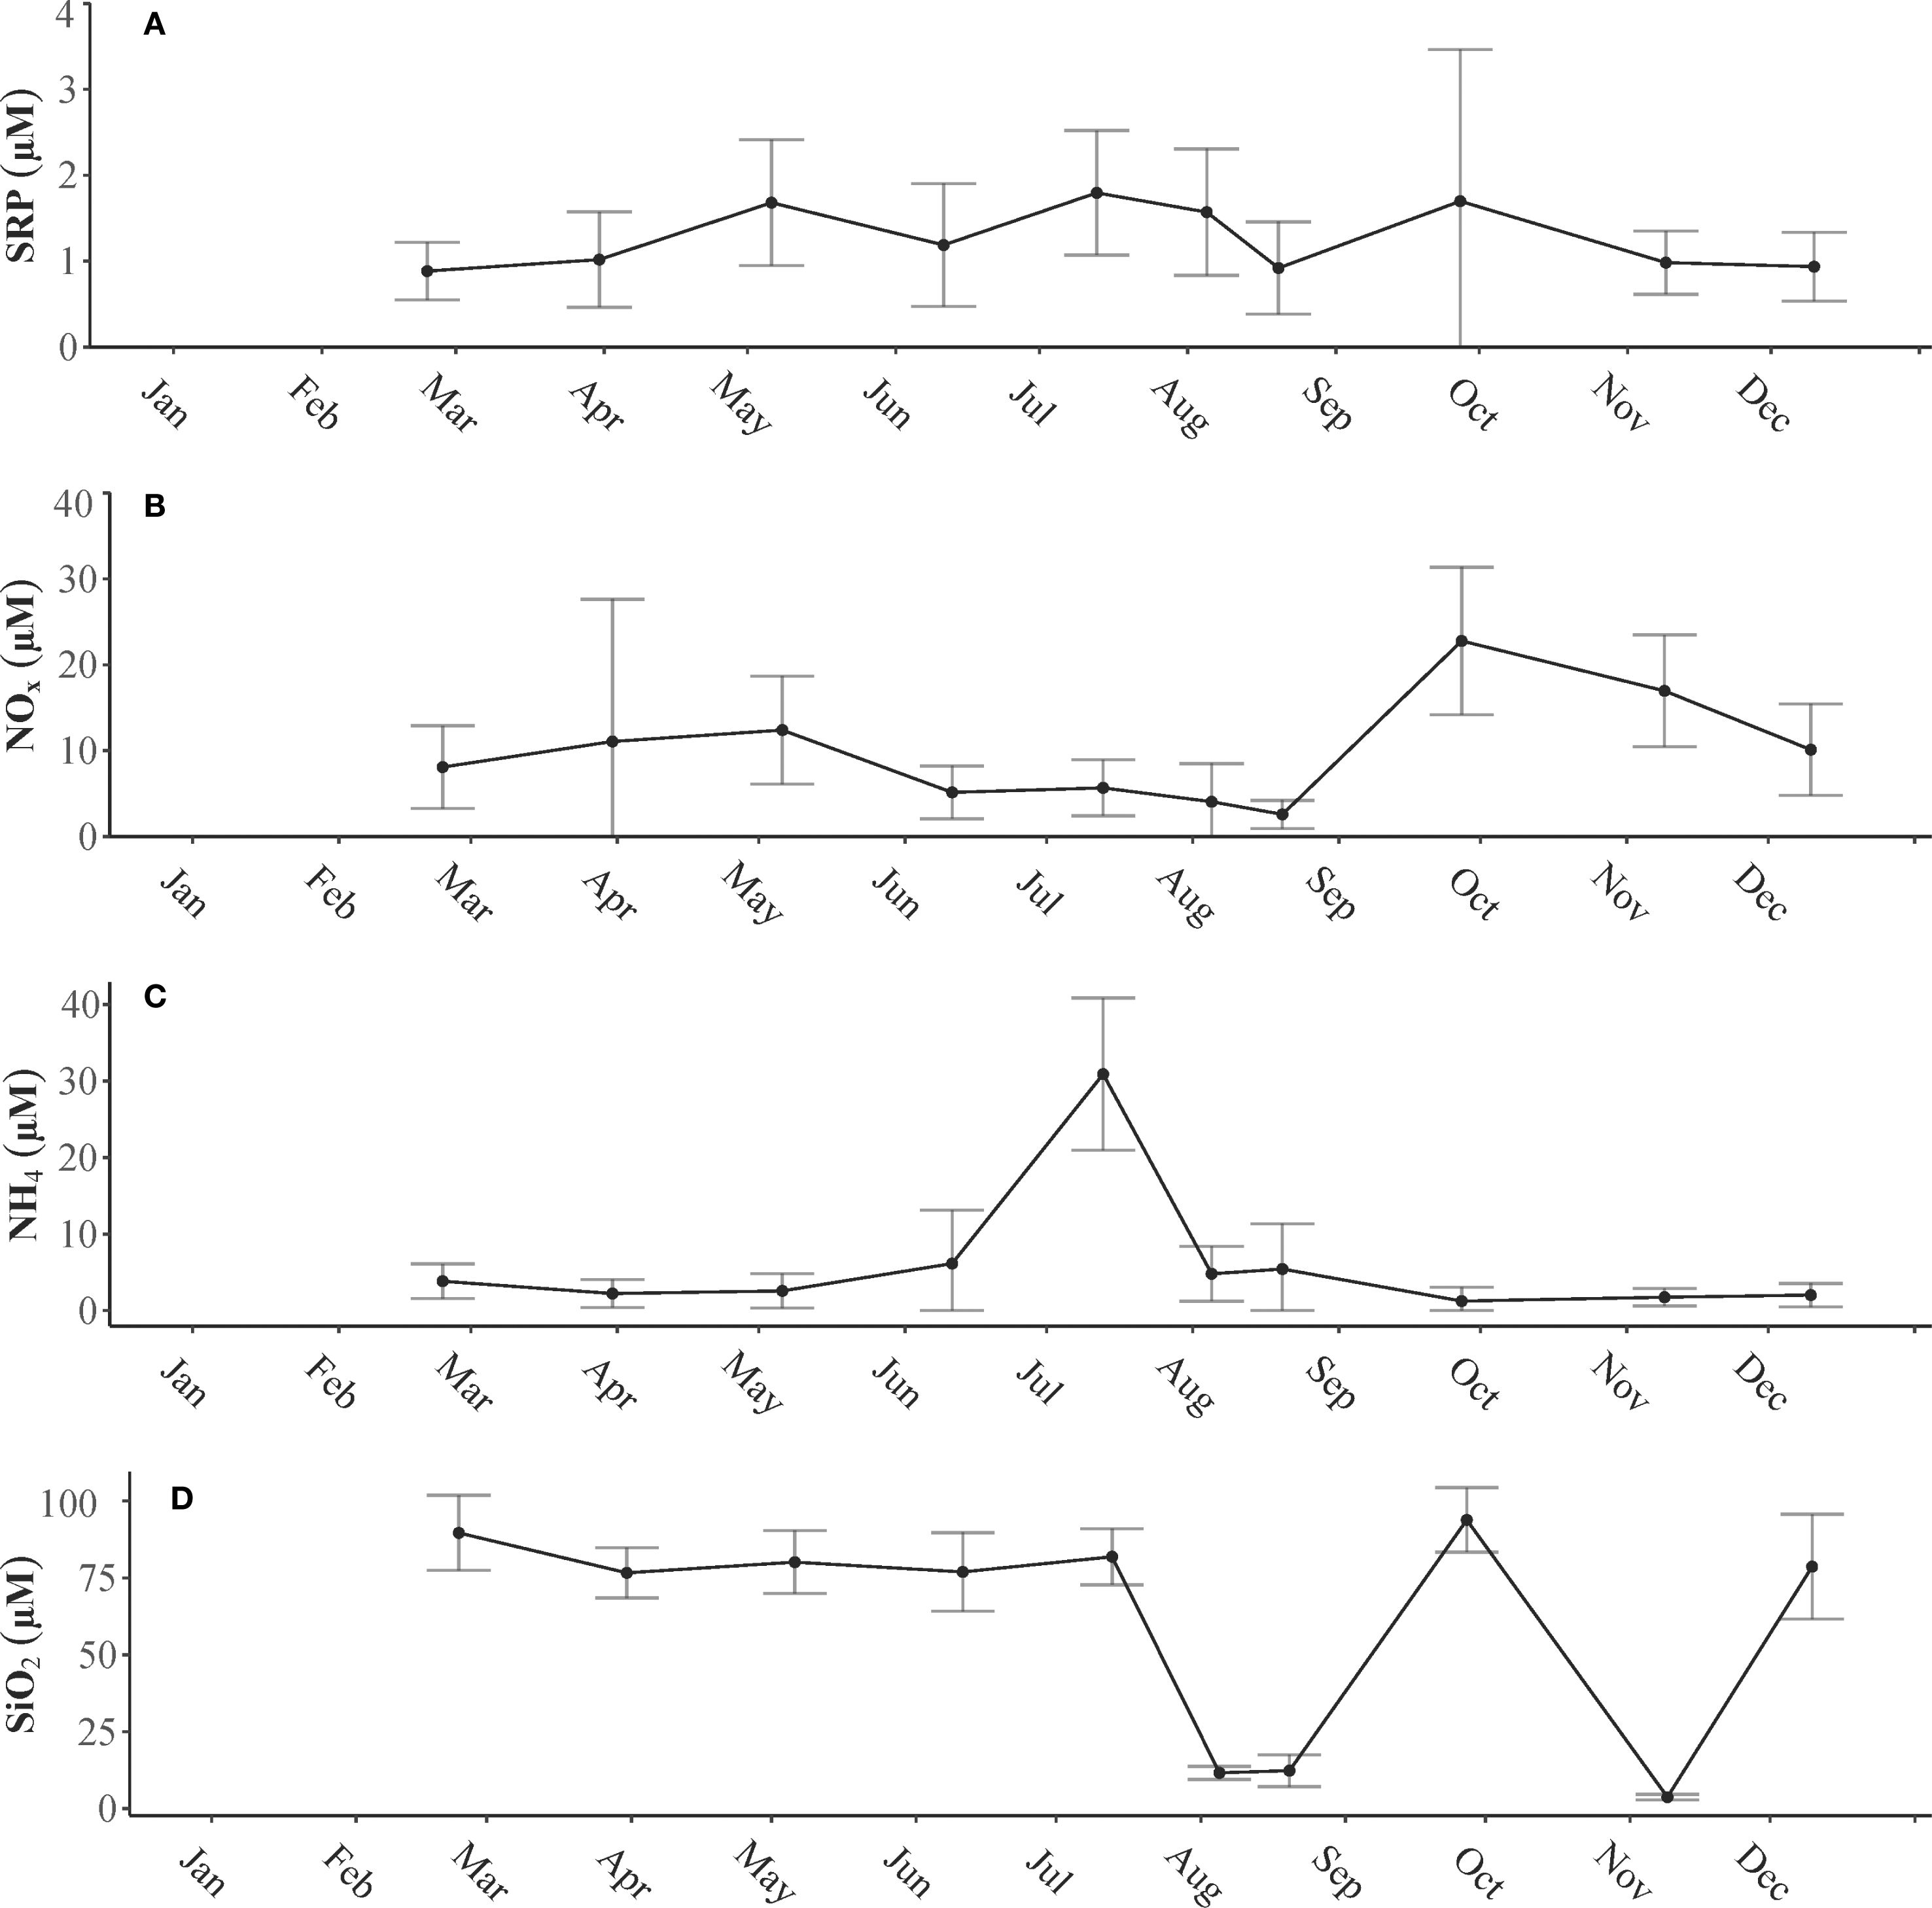
Figure 6. Average concentrations of (A) soluble reactive phosphorus (SRP μM), (B) nitrate (NOx μM), (C) ammonium (NH4 μM), and (D) silica (SiO2 μM) in water samples collected from the subsurface of the Lake Pontchartrain Estuary in 2021.
NOx levels varied seasonally and across different stations (p< 0.05), and there was a strong interaction between these two variables. A significant difference in NOx concentrations was observed during the fall months compared with other seasons. The highest levels of NOx, averaging 19.87 ± 8.08 μM, were recorded in the fall following Hurricane Ida, whereas the lowest levels, averaging 4.31 ± 3.38 μM, were detected during the summer; this decrease may be attributed to biological uptake (Figure 6B). The highest concentration of NOx, which reached 64 μM, was measured at station LP6 in March, coinciding with peak leakage from the BCS. NH4 concentrations exhibited significant seasonal variations (p< 0.05), but no notable differences were found between different sampling stations (p > 0.05). A marked difference was observed in the summer months compared with other seasons. Throughout the year, NH4 concentrations remained below 10 μM, except in July, when levels ranged from 15.76 to 47.93 μM (Figure 6C).
Silica (SiO2) concentrations also displayed significant seasonal variability (p< 0.05), whereas no significant differences were detected across different stations (p > 0.05). Generally, silica levels were highest during the winter months with pronounced decreases noted in August and November (Figure 6D).
The N:P ratio varied significantly across different seasons (p< 0.05) but showed no significant variation across stations (p > 0.05). A significant difference was observed between fall and summer; the N:P ratios were lowest during summer, at 3.7:1, indicating nitrogen limitation caused by biological uptake or a lack of external nitrogen input due to low discharge levels. In contrast, the N:P ratios were highest in the fall months at 21:1, suggesting phosphorus limitation as a result of increased nitrogen input into the system from freshwater discharge following Hurricane Ida (Figures 2, 6). Silica exhibited similar patterns, peaking in spring due to the influx of river water from the spillway leakage and in fall because of the influx of freshwater from tributaries after the hurricane (Figure 6).
3.3 Phytoplankton biomass and community composition
Temperature, nutrient availability, and turbidity all influence seasonal trends in phytoplankton biomass. Phytoplankton biomass ranged from 1.09 to 396 μg chl a L−1, peaking in the summer and fall, whereas the lowest levels were observed in winter and spring (p< 0.0001) (Figure 7). Significant differences in biomass were also noted among different sampling stations (p< 0.05), with the highest levels recorded at station LP11 in August and September.
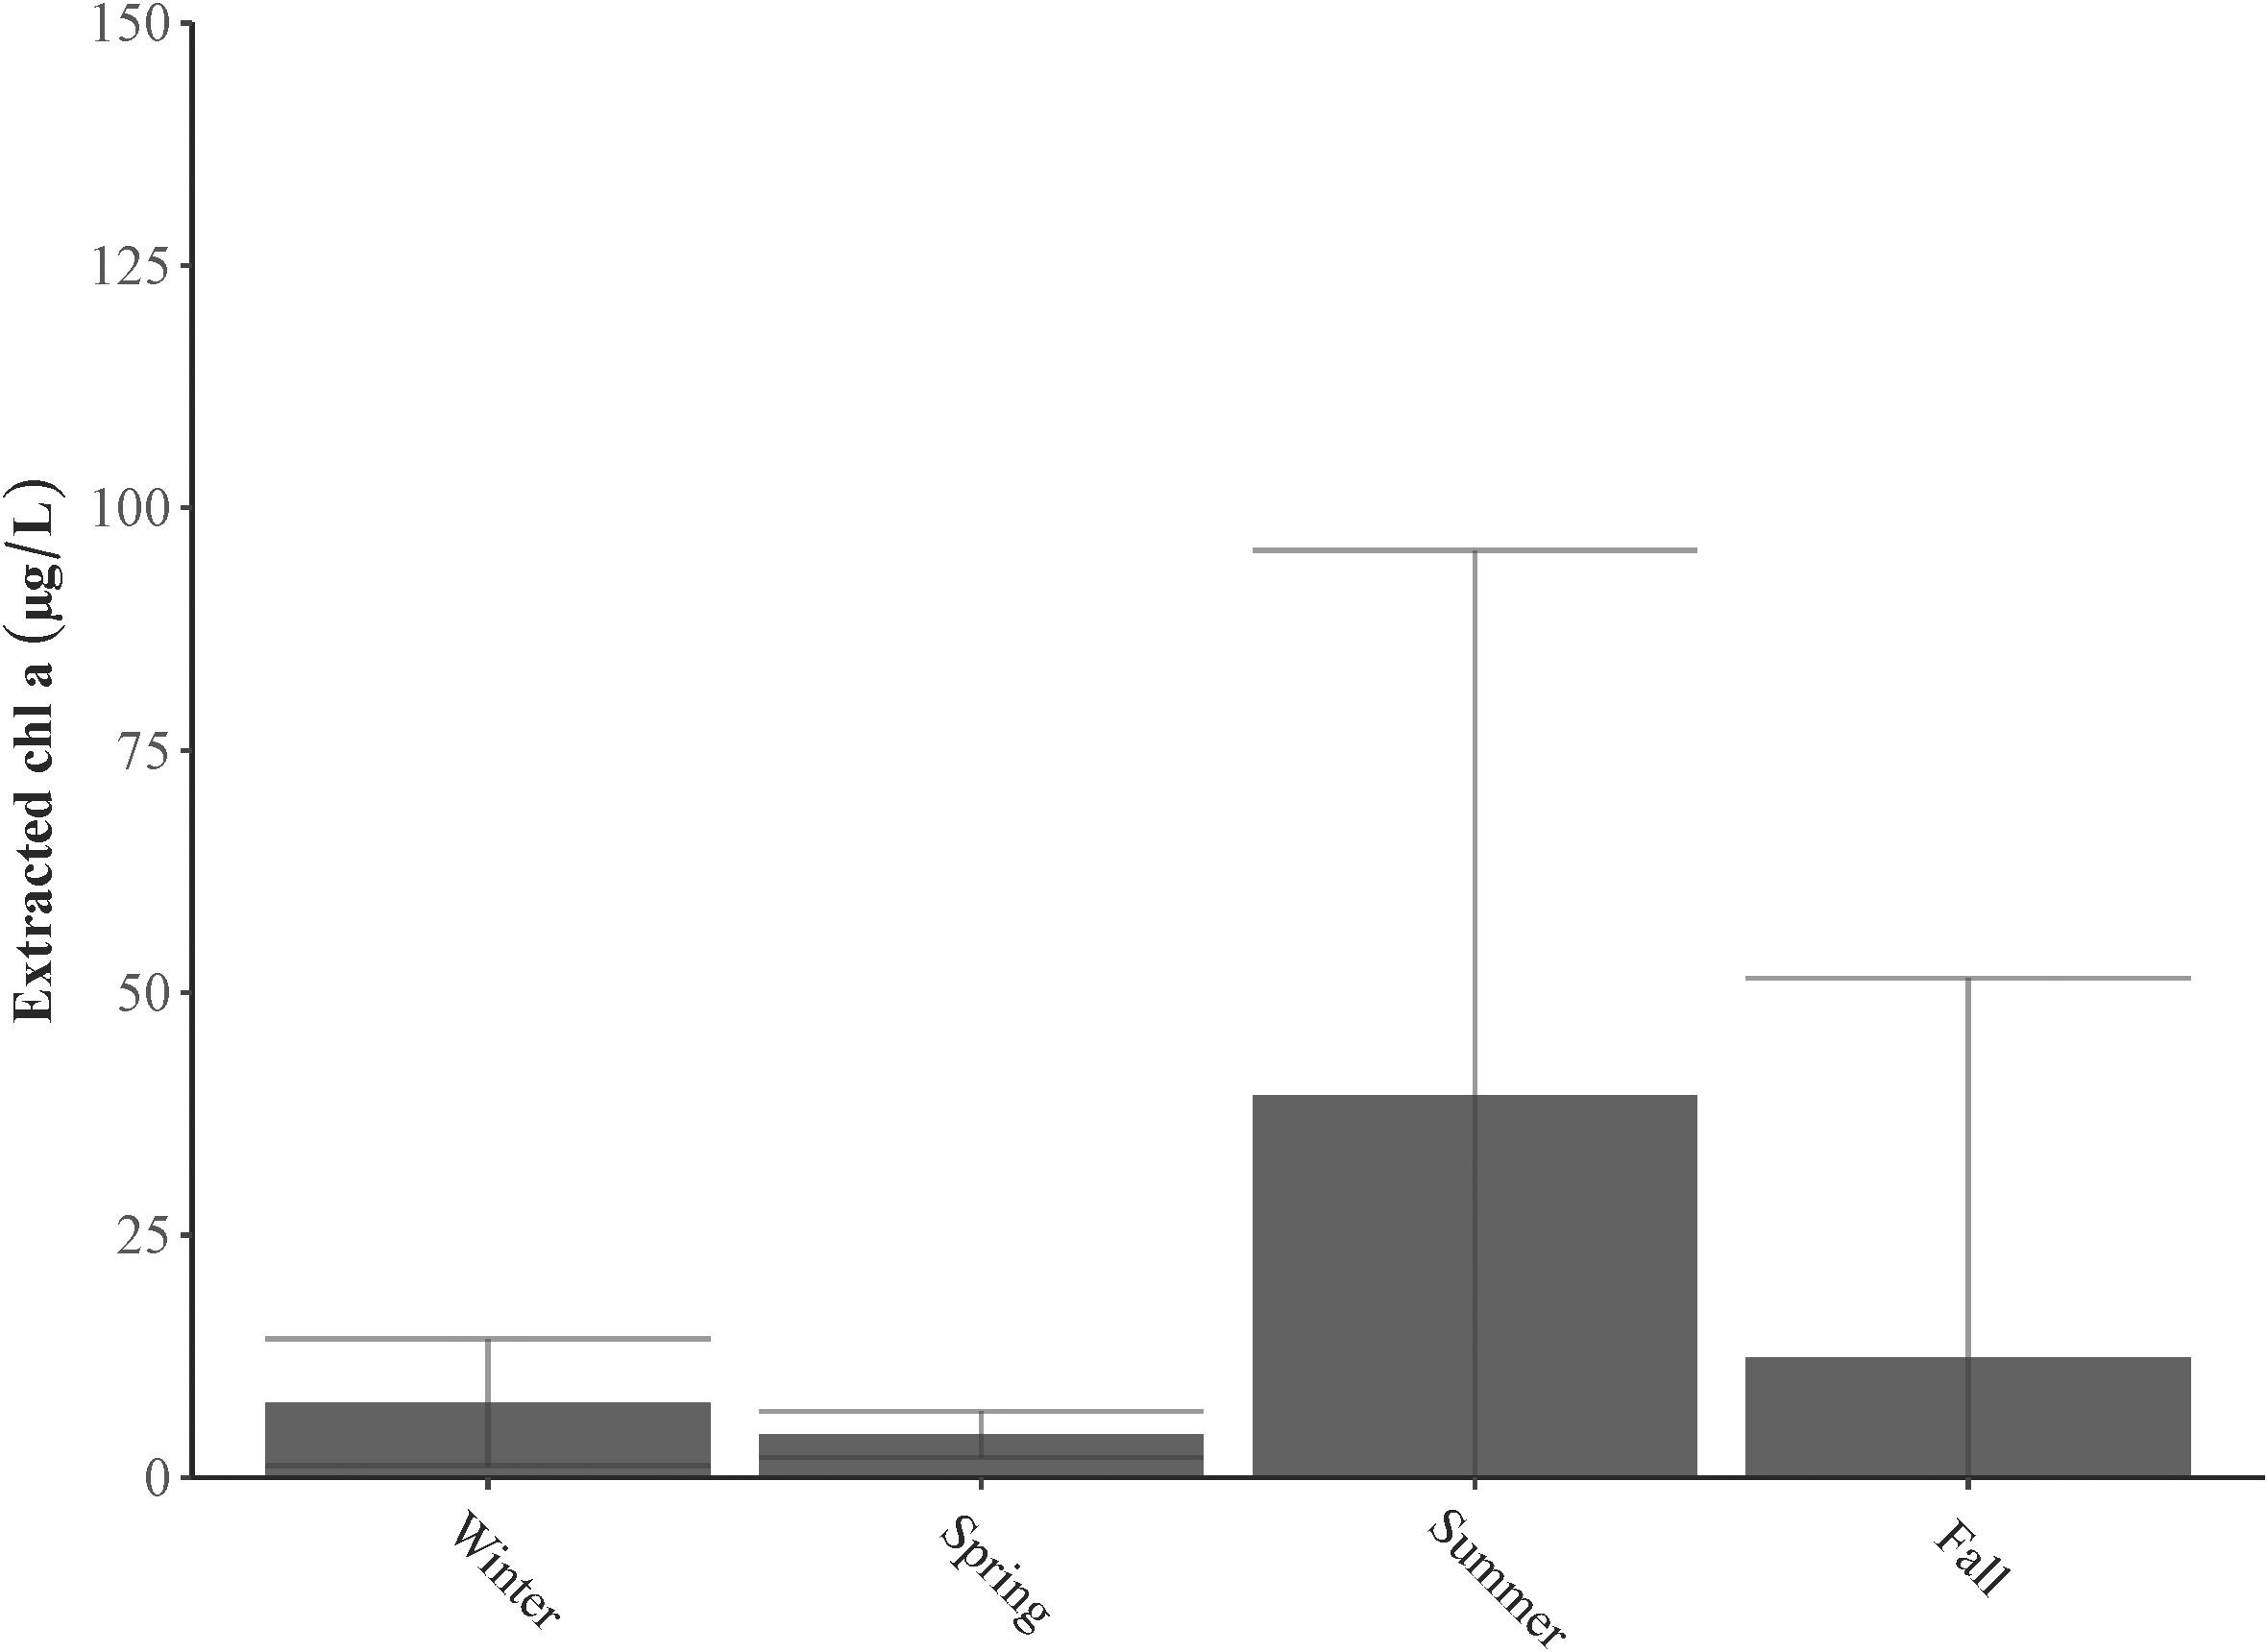
Figure 7. Extracted chl a (µg L−1) in samples collected from Lake Pontchartrain Estuary in 2021 corresponding to seasons: Winter (December, January, February), Spring (March, April, May), Summer (June, July, August), and Fall (September, October, November).
Diatoms, cryptophytes, and cyanobacteria primarily dominated the phytoplankton community throughout all seasons (Figure 8A). Despite being fewer in number, diatoms accounted for over 25% of the total biomass due to their larger size. Microscopic examination revealed that the dominant diatom species included Skeletonema, Melosira, and Thalassiosira. Cryptophytes represented 15% to 25% of the community, featuring species such as Proteomonas and Cryptomonas. During the warmer months, cyanobacteria made up 25% to 30% of the community, with their higher abundance attributed to their smaller size. Early in the year and early summer, Microcystis was common, whereas in late summer and fall, Dolichospermum became more predominant, although smaller amounts of Microcystis were still present. Diatoms and cyanobacteria exhibit an inverse relationship within the community. During the winter and spring months, when diatoms made up a larger part of the community, the amount of cyanobacteria was low. Conversely, in the summer and early fall, an increase in cyanobacteria was accompanied by a decrease in diatom presence (Figure 8B).
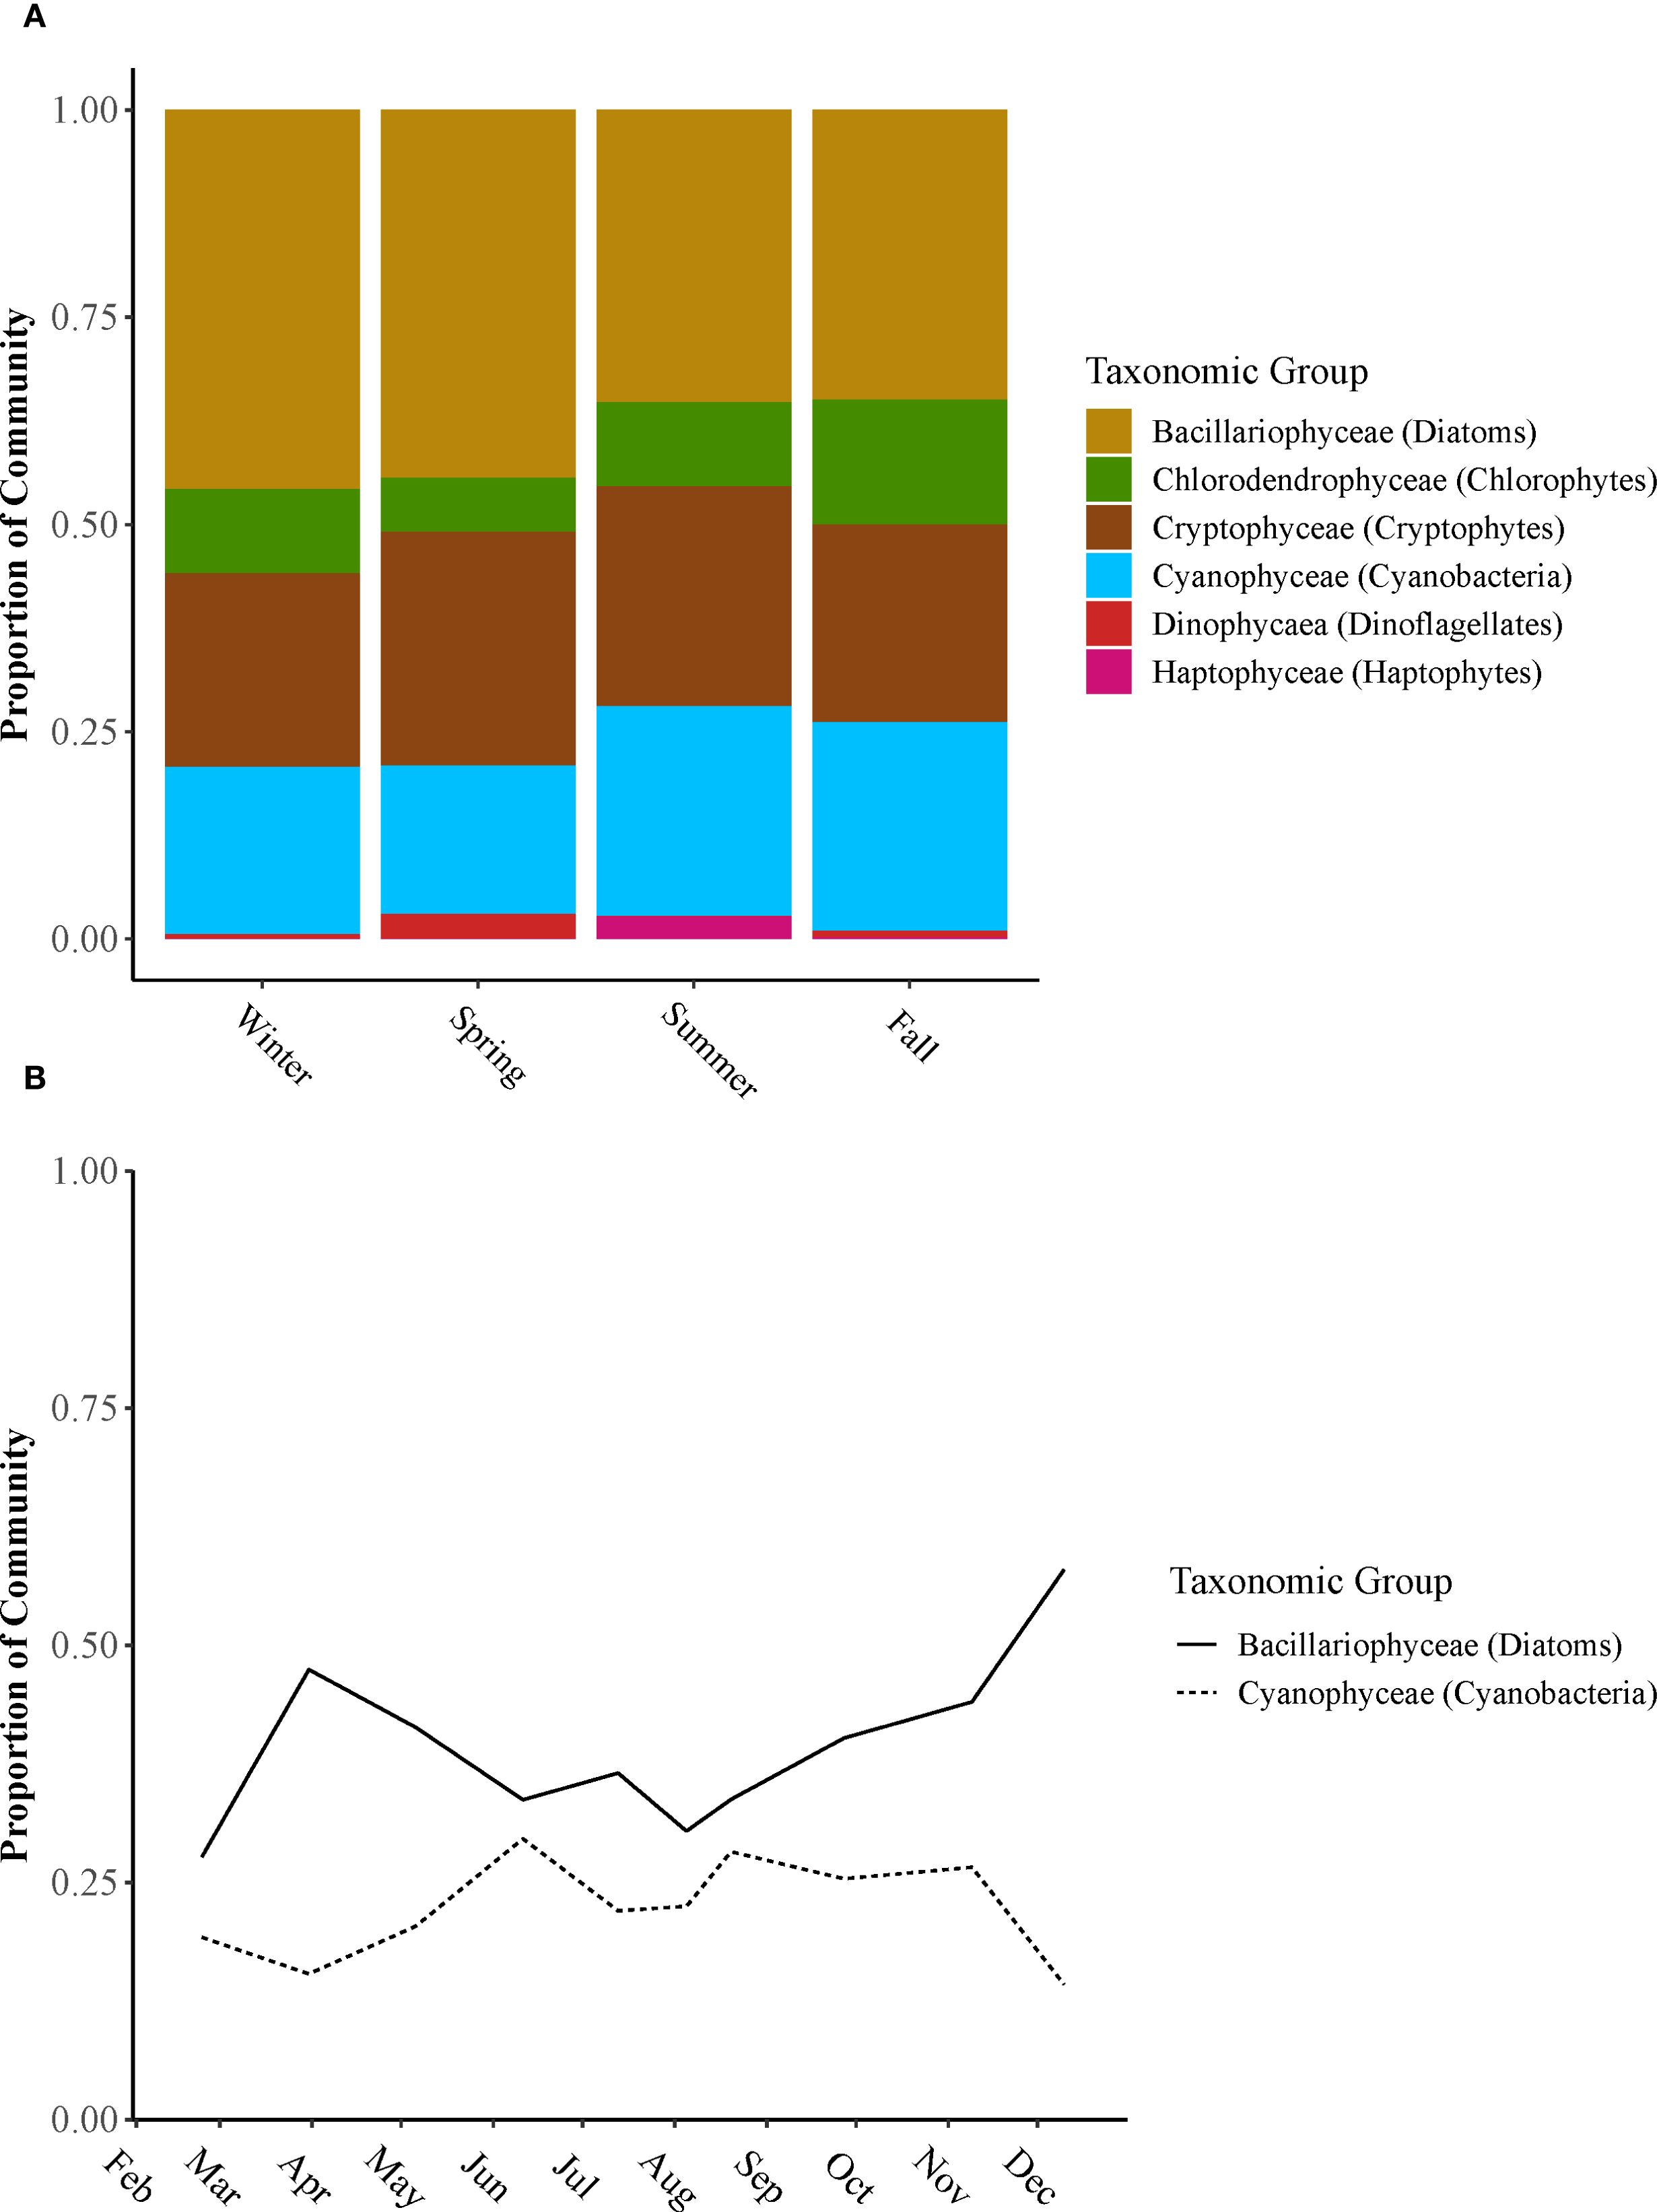
Figure 8. (A) The proportion of taxonomic groups making up the phytoplankton community across winter, spring, summer, and fall of 2021. Functional groups include diatoms, chlorophytes, cryptophytes, cyanobacteria, dinoflagellates, and haptophytes. (B) Monthly proportion of the community for diatoms and cyanobacteria taxonomic groups across Lake Pontchartrain Estuary in 2021.
3.4 Cyanobacteria biomass and toxicity
Cyanobacteria blooms (defined as PC RFU: CHL RFU > 1) were observed throughout the estuary, with varying levels of biomass (Figure 9). During winter, lower biomass was observed, reaching only 18.8 ± 6.7 µg PC L−¹ in February. In contrast, higher biomass and corresponding toxin levels were recorded in the summer, peaking at 963 ± 630 µg PC L−¹ in August (Figure 9). The concentrations of microcystin toxins varied by season (p< 0.01) and among different sampling stations (p< 0.0001). Additionally, the correlation between cyanobacteria biomass and toxin levels (whether intracellular or extracellular) was not significant (p > 0.05), indicating the complex relationships between biomass and toxin production.
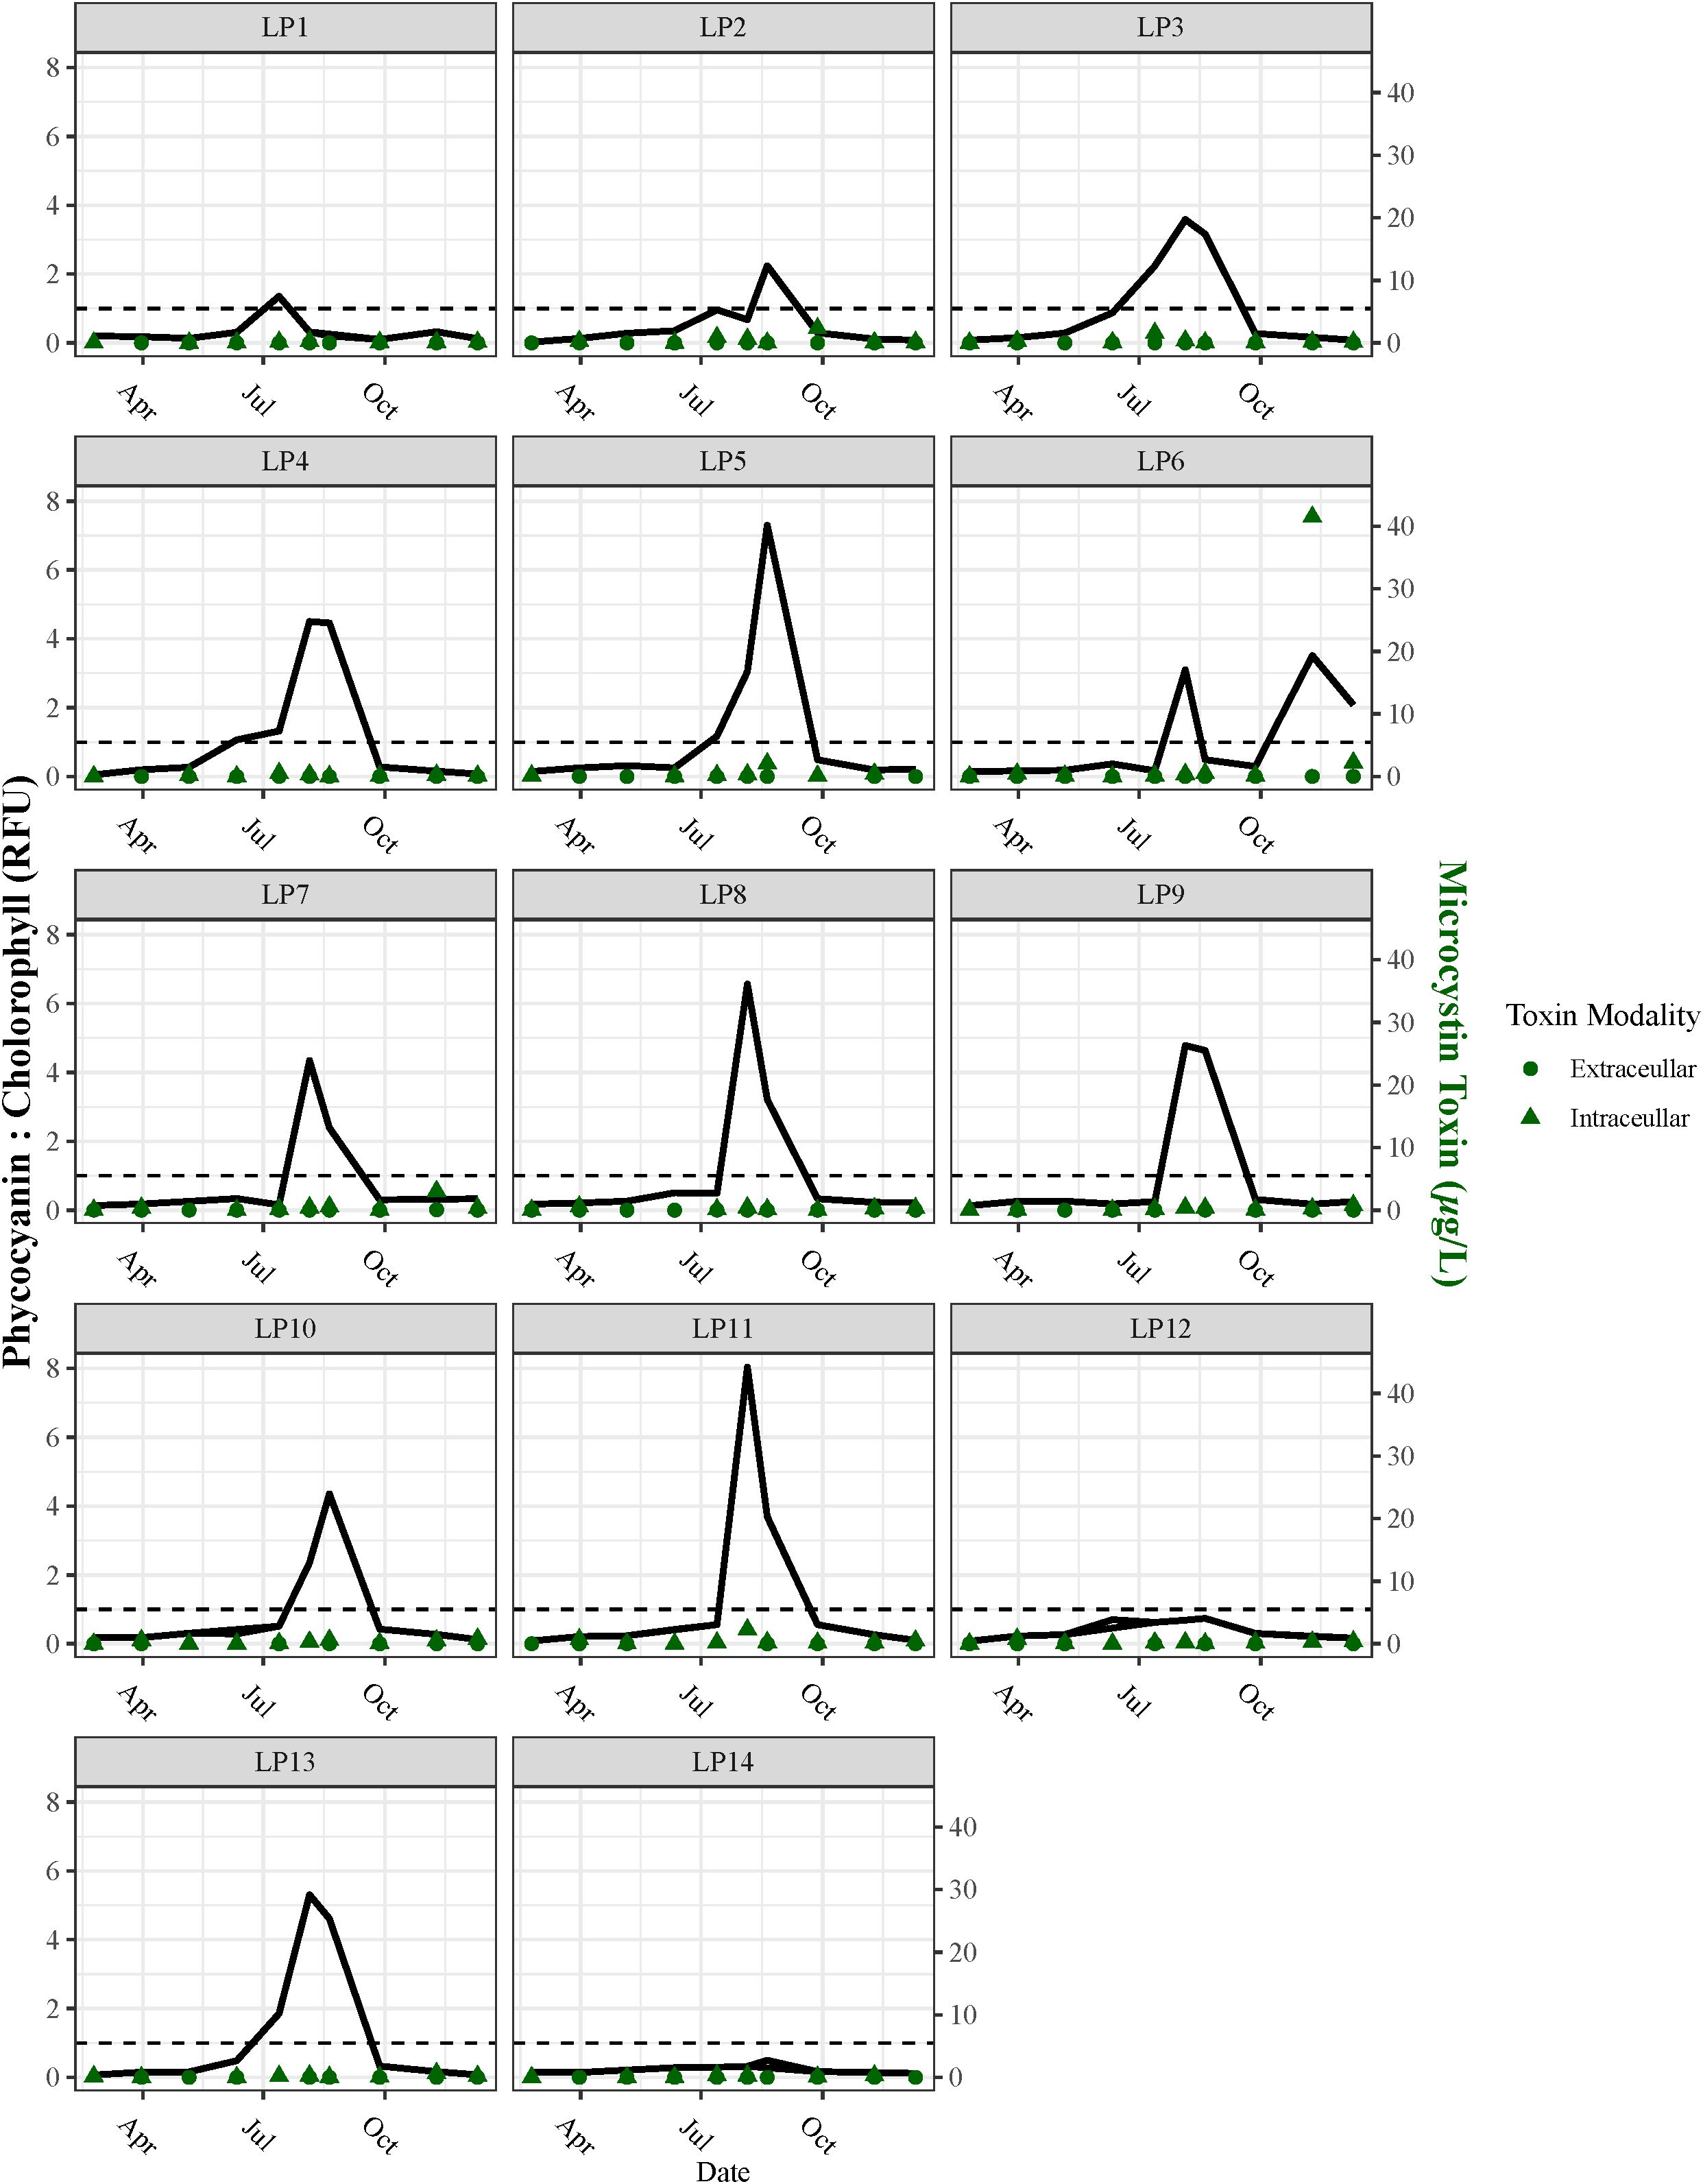
Figure 9. Phycocyanin: chlorophyll ratio (RFU) and microcystin toxin concentrations (µg L−1) for stations. The dotted line at 1 represents the threshold for cyanobacteria to become dominant.
The central region of the estuary (stations LP8 to LP11) exhibited the highest concentrations of cyanobacteria biomass during late summer and fall (ranging from 211 to 2,762 µg PC L−¹). Additional blooms were recorded in November (340 ± 112 µg PC L−¹) and December (236 ± 207 µg PC L−¹) at station LP6. Stations influenced by northern tributary discharge (LP2 to LP5) reported higher levels of biomass and toxin compared with the Lake Maurepas-influenced station LP1. Notably, stations farther from the tributary inflow showed greater biomass during the summer (Figure 9).
There was a significant difference between intracellular microcystin and extracellular microcystin (p< 0.05). Intracellular microcystin (IM) was detected alongside cyanobacteria and generally stayed below the EPA threshold of 8 µg L−¹, except in November at station LP6, where levels ranged from 37.8 to 47.1 µg L−¹. Higher IM levels were also observed in December at LP6, with measurements ranging from 1.88 to 2.493 µg L−¹. Meanwhile, extracellular microcystin (EM) levels peaked in the fall, averaging 0.0069 ± 0.0155 µg L−¹ (Figure 9). A significant difference in toxin levels was observed between the spring and summer months (p< 0.05), with summer levels being higher than those in spring (Figure 9).
3.5 Relationships between physical–chemical conditions and CyanoHAB formation
There was a clear connection between the presence of cyanoHABs and the environmental conditions influenced by hydrological inputs in the estuary. The predictor variables showed no collinearity; however, the multivariate linear regression analysis untangled the relationships between the response variable (cyanobacteria biomass) and the environmental predictor variables. An interaction model was generated, which demonstrated no significant interactions between the predictor variables. Overall, cyanobacteria biomass varied significantly during the summer months (p< 0.01) and at locations with minimal tributary influence (e.g., LP14, p< 0.01).
A positive relationship was observed between temperature and cyanobacteria biomass, indicating that higher temperatures corresponded to increased cyanobacterial biomass (Figure 10A). In contrast, as salinity increased, cyanobacteria biomass significantly decreased, especially at stations influenced by tides (Figure 10B). There was a notable and significant difference in phytoplankton community (PC) during the summer months linked to salinity (p< 0.05).
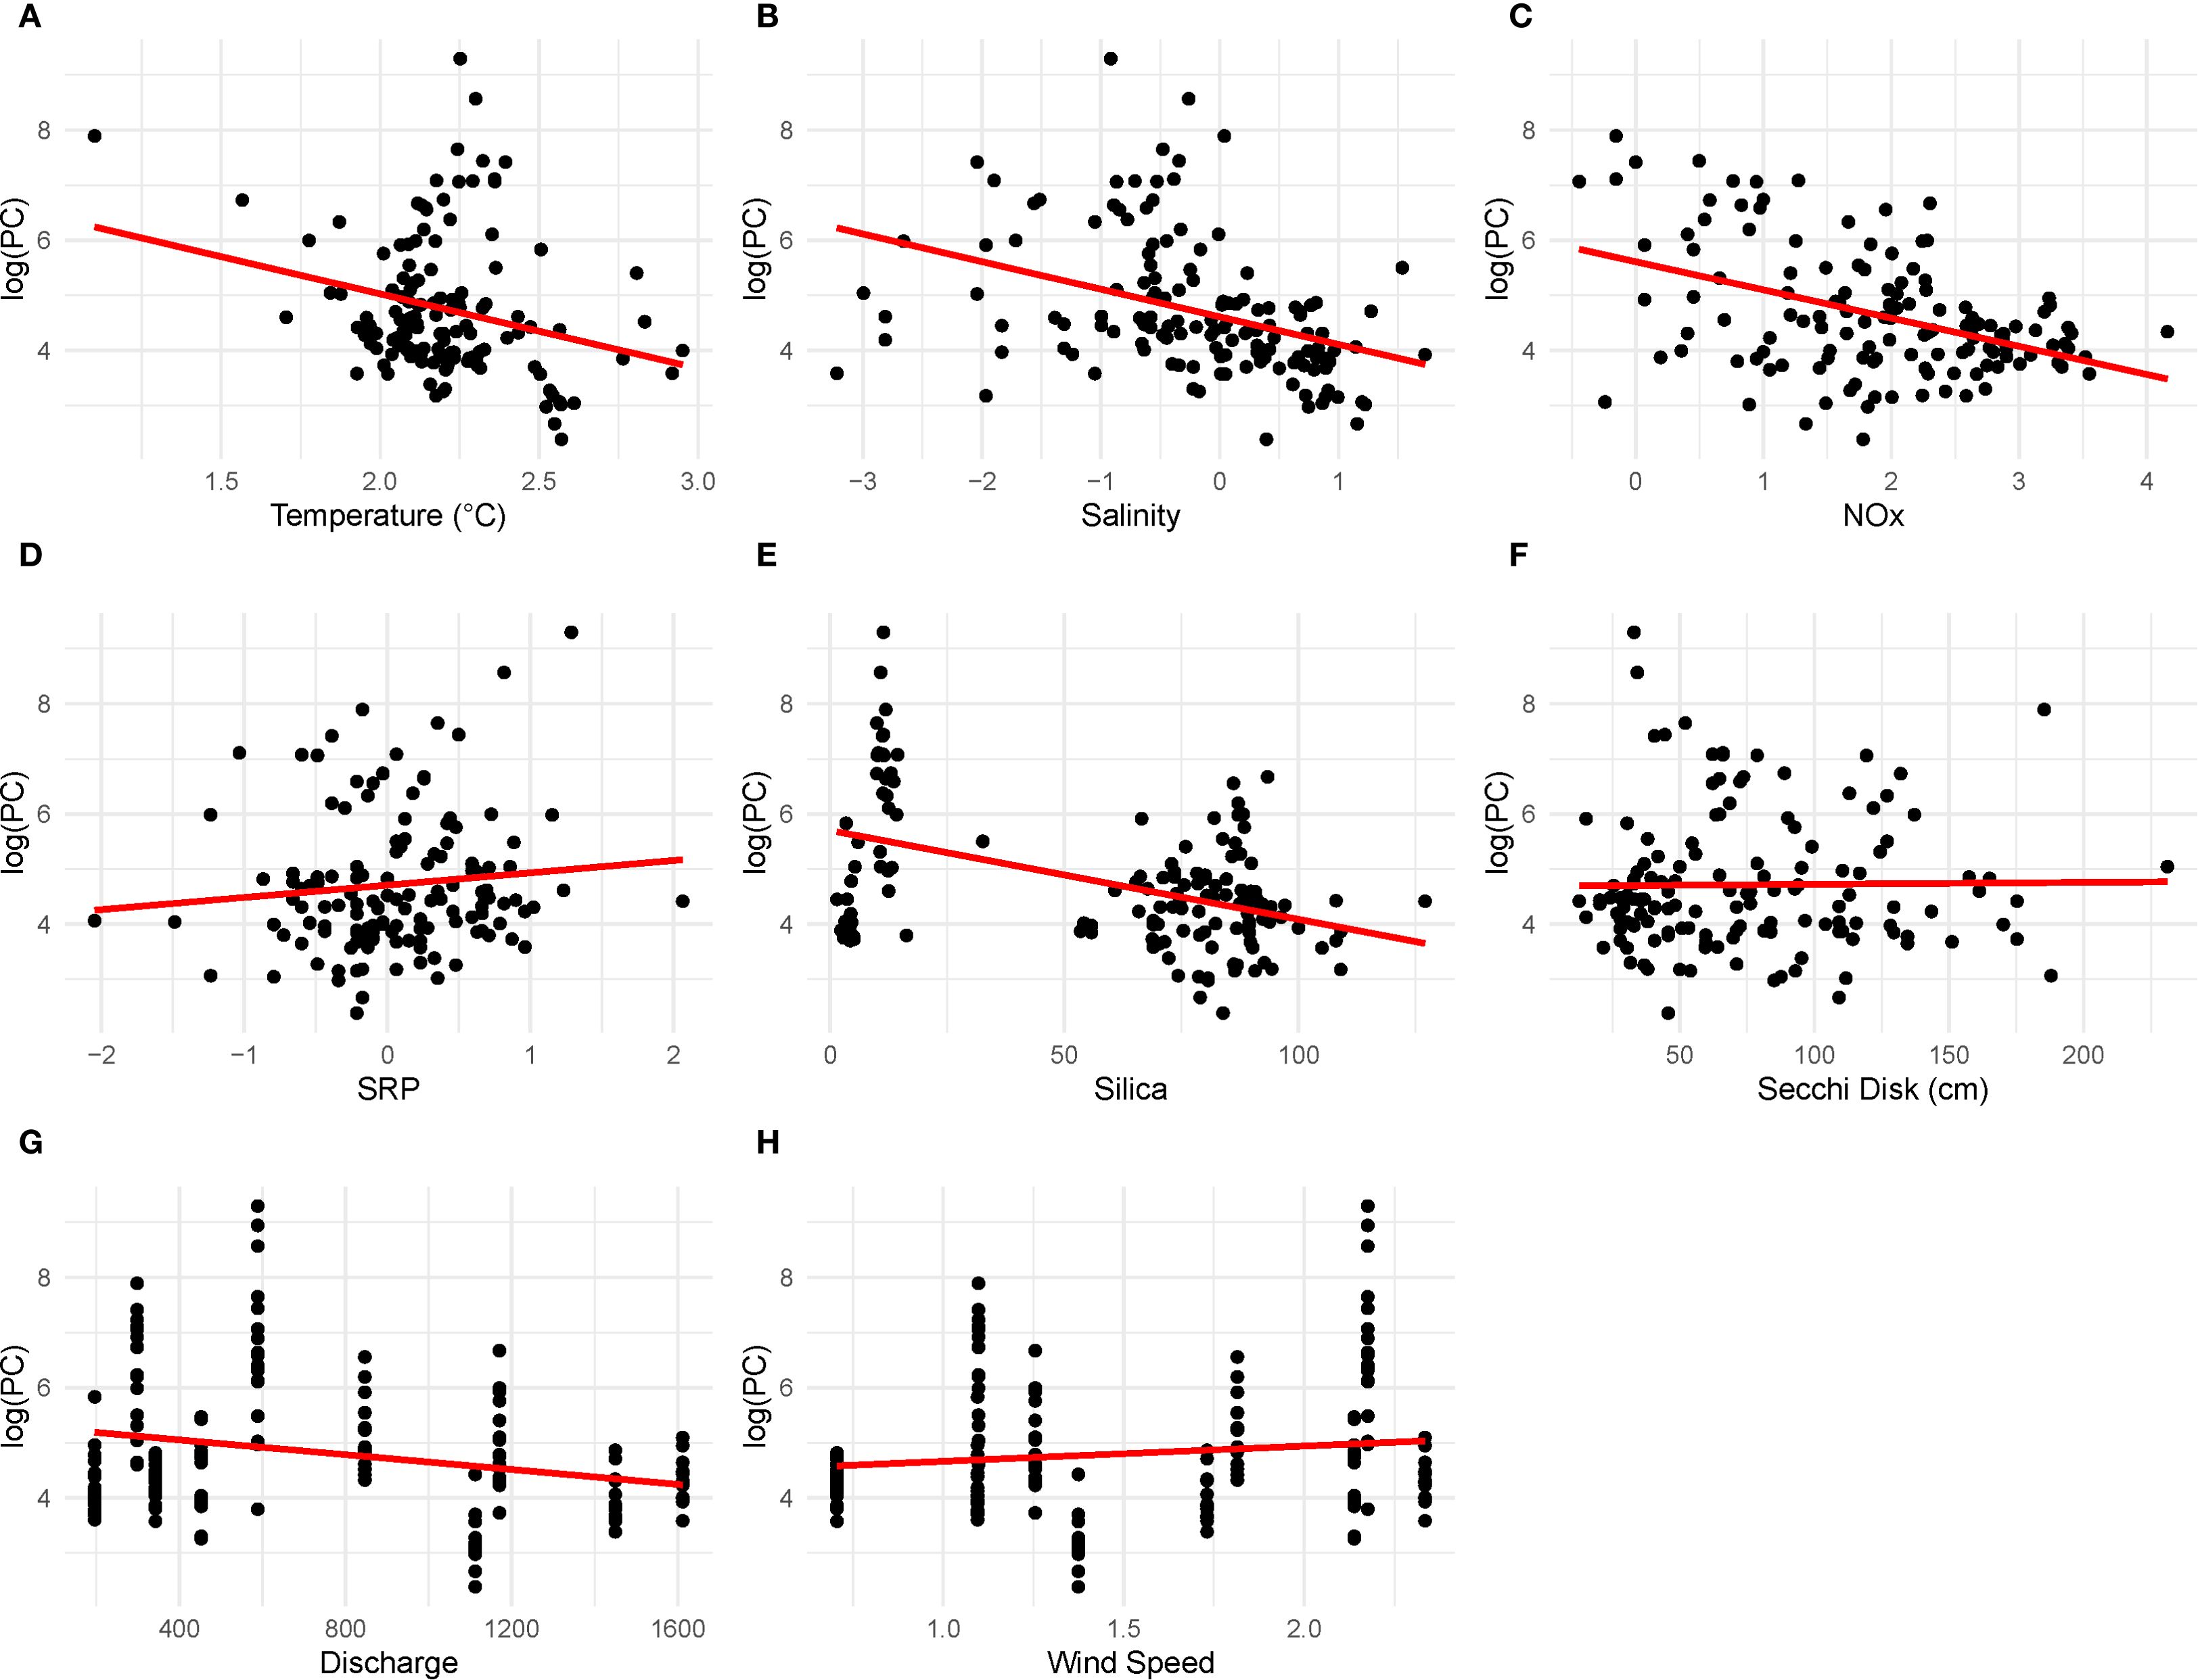
Figure 10. Linear regressions for the response variable (cyanobacteria biomass—phycocyanin), and predictor variables ran in the model include (A) temperature (°C), (B) salinity, (C) NOx, (D) SRP, (E) Silica (SiO2), (F) Secchi disk depth (cm), (G) discharge (m3 s−1), and (H) wind speed (m/s).
Additionally, a significant negative relationship was found between biomass and NOx; when NOx levels were low, cyanobacteria biomass was high and dominated by nitrogen-fixing species (Figure 10C, p< 0.05). There was no significant difference in SRP levels (Figure 10D), which indicates that NOx is the primary nutrient controlling cyanobacteria biomass. Cyanobacteria biomass was low when silica levels were high in the system (Figure 10E, p< 0.05), highlighting the complex nutrient dynamics that govern phytoplankton community succession. During these times, diatoms were the dominant species in the water.
While no significant relationship was established between biomass and Secchi disk depth (Figure 10F), it was generally noted that lower Secchi disk depths were associated with lower biomass, suggesting potential light limitations in the water column.
Hydrological changes prior to bloom had a strong influence on environmental conditions. The speed of water flow affects residence time, which in turn impacts the formation and growth of blooms. When overall surface water discharge into the estuary was high, biomass levels tended to be low (Figure 10G). This suggests that high rates and volumes of water inflow can alter nutrient and light availability, thereby impacting cyanobacteria growth. Additionally, there was no significant difference in cyanobacteria biomass in response to wind speed (Figure 10H).
There was no significant correlation between toxin concentrations and environmental conditions. A negative trend was observed between toxin concentration and silica levels (p< 0.10), corresponding to the higher presence of cyanobacteria biomass in summer and early fall and their absence in spring, where diatoms outcompete under high silica conditions. A negative correlation was observed between cyanobacteria biomass and the N:P ratio (p< 0.05), but no significant link was found between microcystin toxin levels and the N:P ratio (p > 0.05). Nitrogen was identified as the main nutrient influencing the differences observed between spring and summer in terms of the N:P ratio. A similar spring–summer distinction was observed in toxin levels and their interaction with NOx (p< 0.05), whereas no significant relationship was found with SRP (p > 0.05).
4 Discussion
CyanoHABs pose a serious threat to various freshwater and estuarine ecosystems, impacting the health of both humans and animals (Sukenik et al., 2015; Paerl, 2018; Zhang et al., 2022). There is concern that the more commonly occurring spillway openings in the Lake Pontchartrain Estuary (six openings between 2011 and 2020) due to alterations in seasonal patterns may foster more frequent blooms in the estuary, which can adversely affect water resources for fisheries and human health (Bargu et al., 2023).
Our study aimed to enhance our understanding of baseline conditions when human-managed flood-control structures are not in operation and to identify the seasonal physical factors that may either contribute to or help mitigate the formation of cyanoHABs in large, shallow, oligohaline estuaries, such as the Lake Pontchartrain Estuary. The results indicated that tributary discharge and spillway leakage provided sufficient nutrients during the non-BCS opening year in the Lake Pontchartrain Estuary to support summer cyanoHAB growth, contrary to previous assumptions that identified the spillway as the primary nutrient source for these blooms (Snow et al., 2023).
Earlier research has emphasized the unpredictable nature of cyanoHAB occurrences in Lake Pontchartrain Estuary and shown how the timing and duration of BCS operations can affect cyanobacterial bloom development (White et al., 2009; Bargu et al., 2011; Roy et al., 2013; Bargu et al., 2023; Snow et al., 2023). Seasonality is also a significant factor in determining which phytoplankton assemblages dominate in these highly variable and impacted systems (Bargu et al., 2011). High turbidity and low light availability limit phytoplankton growth while the diversion is open, despite the nutrient-rich conditions. When BCS opens in the spring, diatoms and chlorophytes can frequently dominate spring blooms in the estuary, whereas cyanobacteria typically dominate phytoplankton communities during summer (Bargu et al., 2011). When the spillway opens early in the year (as experienced in 2016, with a January opening that lasted only briefly), a cyanobacterial bloom either does not occur or develops later in the season (Sapkota et al., 2023). Conversely, keeping the spillway open during summer, as documented in 2019, creates more favorable conditions for cyanobacterial growth after BCS closes compared with other phytoplankton species. Factors contributing to this included higher levels of bioavailable nutrients, warmer surface water temperatures, and lower turbidity (Bargu et al., 2023; Snow et al., 2023). In our study, seasonal fluctuations in N:P ratios and changes in silica levels offered insights into the dominance of key phytoplankton groups, particularly diatoms and cyanobacteria. We observed a shift from Microcystis in late spring and early summer to Dolichospermum in July and August. Nitrogen concentrations were low in July and August, likely promoting nitrogen-fixing Dolichospermum. Additionally, low silica from reduced summer discharge rates and earlier silica uptake by diatoms, combined with higher temperatures, suppressed diatom dominance and allowed cyanobacteria biomass to increase.
During the summer and fall of 2021, we observed high levels of cyanobacteria biomass and toxins in the Lake Pontchartrain Estuary. At times, these levels exceeded those recorded in previous years when the BCS was operational (Bargu et al., 2019, 2023). The earlier openings of the spillway resulted in a significant influx of nutrients; however, the rapid flow of water during this time limited the growth of cyanobacteria during the opening. In non-open years, productivity is driven by seasonal tributary discharges and spillway leakage, which are much less impactful compared with spillway input. During these times, bloom formation becomes seasonal, responding to precipitation-driven discharge. Previous research and our findings emphasize that seasonal environmental changes, especially hydrologic variability, significantly influence the development of cyanoHABs (Snow et al., 2023).
In 2021, Louisiana recorded its third-highest rainfall, which significantly increased cyanobacterial biomass and toxin production during the summer months due to the excess nutrients delivered by high discharge levels. For instance, the elevated discharge from Lake Maurepas resulted in lower cyanobacterial biomass at LP1, as the increased water flow physically removed them and created less favorable light conditions for growth. Conversely, despite lower flow rates, northern tributaries provided sufficient nutrients to support extensive and toxic blooms at stations LP2 to LP4 during late summer. Notably, higher biomass levels were observed further away from the mouths of the tributaries, where reduced water velocities contributed to more favorable conditions for cyanobacterial growth (Figures 1, 9).
Like the northern tributaries, the leakage from the spillway provides essential nutrients that support cyanoHABs during the summer months (Figures 2, 9; Snow et al., 2023). This leakage typically occurs for several weeks in the spring or early summer when the water level in the river exceeds the height of the spillway. While typical leakage rates are less than 300 m³ s−1, they can significantly increase during extended periods of river flooding (Huang et al., 2020). Notably, in 2021, leakage rates surpassed 300 m³ s−1 between April 10th and April 18th. Increased toxin production was observed at stations closer to the spillway inflow, whereas those farther away exhibited reduced toxin levels. For instance, station LP6, which is nearest to the spillway, experienced two primary bloom cycles, whereas station LP12, the farthest from the spillway, did not encounter any blooms throughout the year. Additionally, the leakage from the BCS has a slower flow rate compared with tributary discharge and possesses a longer residence time. This study demonstrates that even in years when the spillway remains closed, the leakage still provides sufficient nutrients to promote the growth of cyanoHABs, especially during periods of elevated temperatures.
The seasonal variability of environmental conditions greatly affects when and where cyanobacteria bloom. Cyanobacteria thrive in water temperatures above 25°C, which gives them an advantage in warmer conditions (Jöhnk et al., 2008). This study found that as temperatures increased, the biomass of cyanobacteria also increased. With warm temperatures continuing into the fall months (averaging 21.1 ± 3.29°C), higher levels of cyanobacteria biomass persisted through November and December (Figure 9). Salinity negatively affects cyanobacteria growth by impacting cell development, the integrity of the plasma membrane, and the photosynthetic process (Kononen and Nommann, 1992; Moisander et al., 2002; Sinha et al., 2017). Additionally, tidal influences can impact nutrient availability in the water system, leading to decreased phosphorus and nitrate levels, which in turn suppress the growth of cyanobacteria (Morse et al., 2014). In this study, the site most affected by tides (LP14) did not experience any cyanobacteria bloom throughout the year (Figure 9). The production of cyanotoxins is not solely linked to changes in environmental conditions; it involves a complex interplay of various factors that warrants further detailed investigation.
Louisiana is most vulnerable to hurricanes during the late summer months, specifically from August through October. Large-scale disturbances, such as hurricanes, cause multiple changes, including alterations in nutrient and light availability due to increased water column mixing and sediment resuspension. Physical disruptions (e.g., mixing and physical transport) from forces such as wind and discharge may occur immediately; however, it is challenging to directly link these processes to cyanobacteria bloom formation due to a lagged response (Wang et al., 2025). Previous studies have shown that increased nutrient loading caused by wind-induced sediment resuspension can stimulate HABs and worsen eutrophication (Zhu et al., 2014; Paerl, 2018). In August 2021, Hurricane Ida produced high-energy winds that resuspended sediments, leading to an increase in bioavailable phosphorus in late summer (Figure 6). However, this also caused a short-term decrease in light availability, as shown by reduced Secchi depth, which limited algal growth during the hurricane. Conditions in early fall, following the hurricane, improved for nitrogen-fixing Dolichospermum blooms due to calmer waters, higher phosphorus levels resulting from resuspension, increased nitrogen from high discharge, and warmer temperatures. Previous research also noted the dominance of nitrogen-fixing cyanobacteria in late summer (Bargu et al., 2011). This suggests that hurricanes can strongly influence the composition of cyanobacterial harmful algal blooms by changing the nutrient pool’s stoichiometry. In this case, the hurricane released P from sediments, which has been shown to be a source of bioavailable P (Roy et al., 2017; White et al., 2019).
The changes in temperature and precipitation patterns caused by climate change will significantly affect the prevalence and distribution of cyanoHABs in the Lake Pontchartrain Estuary and estuaries worldwide. Research conducted in 2012, the year when the BCS was also closed, showed trends that differed from those observed in 2021. In 2012, although cyanobacteria were present, their toxicity and biomass levels were lower than those recorded in 2021 (Smith, 2014; this study). In 2012, lower discharge rates from surrounding tributaries, resulting from low precipitation, created nitrogen-limited conditions throughout the year (N:P< 16:1) (Table 2). This condition favored nitrogen-fixing species when phosphorus was available. In contrast, the high discharge rates in 2021 resulted in conditions where nitrogen was more readily available, promoting proliferation and increased frequency of cyanoHABs (N:P > 16:1) (Table 2). Furthermore, the higher temperatures and increased precipitation in 2021 compared with 2012 contributed to the growth of cyanoHABs by altering residence time and discharge rates, ultimately affecting nutrient availability (Table 2). As global temperatures continue to rise and wet years become more frequent, there is an increased likelihood that cyanoHABs will exhibit higher biomass and toxicity in the future, even during years when human-made operations do not introduce excessive nutrient inputs.
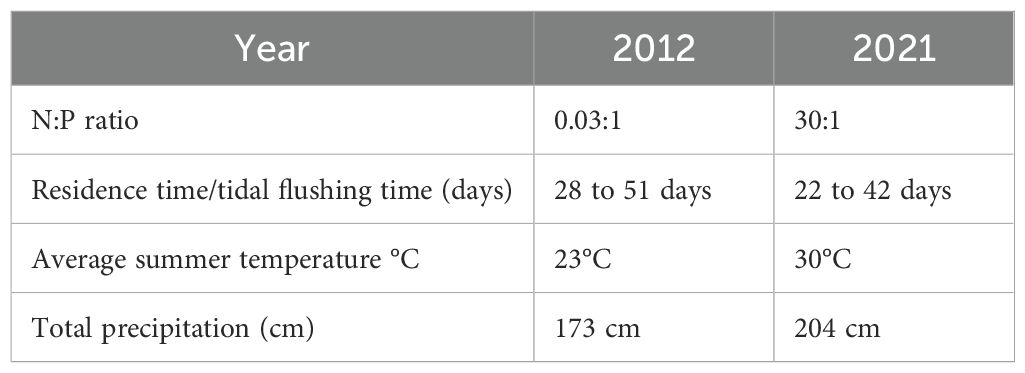
Table 2. N:P ratio (nitrogen to phosphorus), residence time (days), summer temperature (°C), and precipitation (cm) in the Lake Pontchartrain Estuary for the years 2012 and 2021.
5 Conclusion
This study offers valuable insights into the formation of cyanoHABs, particularly in situations where physical processes result in seasonal changes in nutrient availability and subsequent biological responses. The occurrence of cyanoHABs varies significantly with the seasons: N-fixing cyanobacteria blooms can be triggered by hurricanes in the fall due to increased runoff and phosphorus release from sediment resuspension. Spring watershed discharge promotes the growth of other types of blooms, such as diatoms, during the spring. CyanoHABs can thrive and become more frequent and toxic in summer months as temperatures rise and precipitation increases. This pattern highlights the ongoing need for resource managers to monitor cyanoHABs, even when human-controlled river inputs are removed, due to potential public health risks.
Data availability statement
The raw data supporting the conclusions of this article will be made available by the authors, without undue reservation.
Author contributions
CH: Conceptualization, Data curation, Formal analysis, Investigation, Methodology, Software, Validation, Visualization, Writing – original draft, Writing – review & editing. SB: Conceptualization, Funding acquisition, Project administration, Resources, Supervision, Writing – review & editing. CT: Formal analysis, Methodology, Validation, Visualization, Writing – review & editing. MH: Formal analysis, Funding acquisition, Methodology, Validation, Visualization, Writing – review & editing. JW: Resources, Writing – review & editing.
Funding
The author(s) declare financial support was received for the research and/or publication of this article.This work has been supported with funding provided by the Louisiana Sea Grant College Program (LSG) under its Competitive Research Program (Project ID: R/TMA-03) and NOAA Award no. NA18OAR4170098. The funding support of LSG and NOAA is gratefully acknowledged. Additional funding support was obtained through the US Department of Defense, specifically through the US Army Engineer Research and Development Center (ERDC), under Award ID W912HZ2220005.
Acknowledgments
We extend our gratitude to the College of Coast and Environment for their field support and to Louisiana Sea Grant for their financial assistance. Special thanks go to our field technician, Eddie Weeks, as well as to the graduate and undergraduate students who assisted with both field and lab work.
Conflict of interest
The authors declare that the research was conducted in the absence of any commercial or financial relationships that could be construed as a potential conflict of interest.
The author(s) declared that they were an editorial board member of Frontiers, at the time of submission. This had no impact on the peer review process and the final decision.
Generative AI statement
The author(s) declare that no Generative AI was used in the creation of this manuscript.
Any alternative text (alt text) provided alongside figures in this article has been generated by Frontiers with the support of artificial intelligence and reasonable efforts have been made to ensure accuracy, including review by the authors wherever possible. If you identify any issues, please contact us.
Publisher’s note
All claims expressed in this article are solely those of the authors and do not necessarily represent those of their affiliated organizations, or those of the publisher, the editors and the reviewers. Any product that may be evaluated in this article, or claim that may be made by its manufacturer, is not guaranteed or endorsed by the publisher.
Supplementary material
The Supplementary Material for this article can be found online at: https://www.frontiersin.org/articles/10.3389/fmars.2025.1618353/full#supplementary-material
References
Anderson B. T., Ruane A. C., Roads J. O., and Kanamitsu M. (2009). Estimating the influence of evaporation and moisture-flux convergence upon seasonal precipitation rates. Part II: An analysis for North America based upon the NCEP-DOE Reanalysis II Model. J. Hydrometeorol. 10, 893–911. doi: 10.1175/2009JHM1063.1
Anderson D. M., Fensin E., Gobler C. J., Hoeglund A. E., Hubbard K. A., Kulis D. M., et al. (2021). Marine harmful algal blooms (HABs) in the United States: History, current status and future trends. Harmful Algae 102, 101975. doi: 10.1016/j.hal.2021.101975
Bargu S., Justic D., White J. R., Lane R., Day J., Paerl H., et al. (2019). Mississippi River diversions and phytoplankton dynamics in deltaic Gulf of Mexico estuaries: A review. Estuar. Coast. Shelf Sci. 221, 39–52. doi: 10.1016/j.ecss.2019.02.020
Bargu S., Skaggs B., Boudreaux M., Hammond C. N., Snow C., Tiong G. A., et al. (2023). Water quality and toxic cyanobacteria in oligohaline estuary beaches during the longest Mississippi River basin flood event in 2019. Estuar. Coasts 46, 1865–1879. doi: 10.1007/s12237-023-01247-1
Bargu S., White J. R., Li C., Czubakowski W., and Fulweiler W. (2011). Effects of freshwater input on nutrient loading, phytoplankton biomass, and cyanotoxin production in an oligohaline estuarine lake. Hydrobiologia 661, 377–389. doi: 10.1007/s10750-010-0545-8
Carey C. C., Ibelings B. W., Hoffmann E. P., Hamilton D. P., and Brookes J. D. (2012). Eco-physiological adaptations that favour freshwater cyanobacteria in a changing climate. Water Res. 46, 1394–1407. doi: 10.1016/j.watres.2011.12.016
Chakraborty S. and Lohrenz S. E. (2015). Phytoplankton community structure in the river-influenced continental margin of the northern Gulf of Mexico. Mar. Ecol. Prog. Ser. 521, 31–47. doi: 10.3354/meps11107
Garcia A. C., Bargu S., Dash P., Rabalais N., Sutor M., Morrison W., et al. (2010). Evaluating the potential risk of microcystins to blue crab (Callinectes sapidus) fisheries and human health in a eutrophic estuary. Harmful Algae 9, 134–143. doi: 10.1016/j.hal.2009.08.011
Gobbler C. (2020). Climate change and harmful algal blooms: insights and perspective. Harmful Algae 91, 1–4. doi: 10.1016/j.hal.2019.101731
Hallegraeff G. M. (2003). “Harmful algal blooms: a global overview,” in Manual on Harmful Marine Microalgae (France: UNESCO Publishing).
Hiatt M., Snedden G., Day J. W., Rohli R. V., Nyman J. A., Lane R., et al. (2019). Drivers and impacts of water level fluctuations in the Mississippi River delta: Implications for delta restoration. Estuar. Coast. Shelf Sci. 224, 117–137. doi: 10.1016/j.ecss.2019.04.020
Hodson T. O., Hariharan J. A., Black S., and Horsburgh J. S. (2023). Dataretrieval (Python): a Python package for discovering and retrieving water data available from U.S. Federal hydrologic web services [Computer software manual]. Reston, VA: U.S. Geological Survey. doi: 10.5066/P94I5TX3
Huang W., Li C., White J. R., Bargu S., Milan B., and Bentley S. (2020). Numerical experiments on variation of freshwater plume and leakage effect From Mississippi River Diversion in the Lake Pontchartrain Estuary. J. Geophys. Res.: Oceans 125, e2019JC015282. doi: 10.1029/2019JC015282
Jöhnk K. D., Huisman J., Sharples J., Sommeijer B., Visser P. M., and Stroom J. M. (2008). Summer heatwaves promote blooms of harmful cyanobacteria. Global Change Biol. 14, 495–512. doi: 10.1111/j.1365-2486.2007.01510.x
Kononen K. and Nommann S. (1992). “Spatio-temporal dynamics of the cyanobacteria blooms in the Gulf of Finland, Baltic Sea,” in Marine Pelagic Cyanobacteria: Trichodesmium and other Diazotrophs, 95–113. Dordrecht: Springer Netherlands.
Li C., Huang W., Chen C., and Lin H. (2018). Flow regimes and adjustment to wind-driven motions in Lake Pontchartrain Estuary: A modeling experiment using fvcom. J. Geophys. Res.: Oceans 123, 8460–8488. doi: 10.1029/2018JC013985
Liu M., Ma J., Kang L., Wei Y., He Q., Hu X., et al. (2019). Strong turbulence benefits toxic and colonial cyanobacteria in water: A potential way of climate change impact on the expansion of Harmful Algal Blooms. Science of The Total Environment. 670, 613–622.
McCorquodale J. A., Roblin R. J., Georgiou I. Y., and Haralampides K. A. (2009). Salinity, nutrient, and sediment dynamics in the Pontchartrain Estuary. J. Coast. Res. 2009 (Special Issue 54), 71–87. doi: 10.2112/SI54-000.1
Mize S. and Demcheck D. K. (2009). Water quality and phytoplankton communities in Lake Pontchartrain during and after the Bonnet Carré Spillway opening, April to October 2008 in Louisiana, USA. Geo Marine Lett. 29, 431–440. doi: 10.1007/s00367-009-0157-3
Moisander P. H., McClinton E., and Paerl H. W. (2002). Salinity effects on growth, photosynthetic parameters, and nitrogenase activity in estuarine planktonic cyanobacteria. Microb. Ecol. 43, 432–442. doi: 10.1007/s00248-001-1044-2
Monsen N. E., Cloern J. E., Lucas L. V., and Monismith S. G. (2002). A comment on the use of flushing time, residence time, and age as transport time scales. Limnol. Oceanogr. 47, 1545–1553. doi: 10.4319/lo.2002.47.5.1545
Morse R. E., Mulholland M. R., Egerton T. A., and Marshall H. G. (2014). Phytoplankton and nutrient dynamics in a tidally dominated eutrophic estuary: daily variability and controls on bloom formation. Mar. Ecol. Prog. Ser. 503, 59–74. doi: 10.3354/meps10743
NOAA (2024). National Oceanic and Atmospheric Administration (NOAA) Tides and Currents. Available online at: https://tidesandcurrents.noaa.gov/met.html (Accessed June 2024).
Paerl H. W. (2018). Mitigating harmful cyanobacterial blooms in a human- and climatically-impacted world. Life 8, 33. doi: 10.3390/life8020033
Paerl H. W., Gardner W. S., Havens K. E., Joyner A. R., McCarthy M. J., Newell S. E., et al. (2016). Mitigating cyanobacterial harmful algal blooms in aquatic ecosystems impacted by climate change and anthropogenic nutrients. Harmful algae, 54, 213-222. doi: 10.1016/j.hal.2015.09.009
Paerl H. W. and Huisman J. (2009). Climate change: a catalyst for global expansion of harmful cyanobacterial blooms. Environ. Microbiol. Rep. 1, 27–37. doi: 10.1111/j.1758-2229.2008.00004.x
Paerl H. W. and Paul V. J. (2012). Climate change: Links to global expansion of harmful cyanobacteria. Water Res. 46, 1349–1363. doi: 10.1016/j.watres.2011.08.002
Parker B. B. (2007). Tidal analysis and prediction (NOAA Special Publication NOS CO-OPS 3). Silver Spring, MD: NOAA NOS Center for Operational Oceanographic Products and Services.
Parsons T. R., Maita Y., and Lalli C. M. (1984). Determination of Chlorophylls and Total Carotenoids: Spectrophotometric Method A Manual of Chemical & Biological Methods for Seawater Analysis, Elsevier, 101-104.
Pearson L., Mihali T., Moffitt M., Kellmann R., and Neilan B. (2010). On the chemistry, toxicology, and genetics of the cyanobacterial toxins, microcystin, nodularin, saxitoxin and cylindrospermopsin Marine Drugs. 8 (5), 1650–1680.
Pinckney J. L., Paerl H. W., Harrington M. B., and Howe K. E. (1997). Annual cycles of phytoplankton community-structure and bloom dynamics in the Neuse River Estuary, North Carolina. Biology. 131, 371–381. doi: 10.1007/s002270050330
Pinckney J. L., Paerl H. W., Harrington M. B., and Howe K. E. (1998). Annual cycles of phytoplankton community structure and bloom dynamics in the Neuse River Estuary, North Carolina. Mar. Biol. 131, 371–382. doi: 10.1007/s002270050330
Preece E. P., Hardy J. F., Moore B. C., and Bryan M. (2017). A review of microcystin detections in Estuarine and Marine waters: Environmental implications and human health risk. Harmful Algae 61, 31–45. doi: 10.1016/j.hal.2016.11.006
Ren L., Mendenhall W., Atilla N., Rabalais N. N., and Morrison W. (2008). “Cyanobacteria in eutrophied fresh to brackish lakes in Barataria estuary, Louisiana,” in Cyanobacterial Harmful Algal Blooms; State of the Science and Research Needs, vol. 619, 308–309.
Ren L., Rabalais N., Turner R. E., Morrison W., and Mendenhall W. (2009). Nutrient limitation on phytoplankton growth in the upper Barataria Basin, Louisiana: microcosm bioassays. Estuar. Coasts 32, 958–974. doi: 10.1007/s12237-009-9174-8
Riekenberg J., Bargu S., and Twilley R. (2015). Phytoplankton community shifts and harmful algae presence in a diversion influenced estuary. Estuar. Coasts 38, 2213–2226. doi: 10.1007/s12237-014-9925-z
Roblin R. (2008). “Water quality modeling of freshwater diversions in the Pontchartrain Estuary,” in (Master’s thesis, University of New Orleans) New Orleans, LA: University of New Orleans, 693. Available online at: https://scholarworks.uno.edu/td/693.
Roy E. D., Nguyen N. T., and White J. R. (2017). Changes in estuarine sediment phosphor fractions during a large-scale Mississippi River diversion. Sci. Total Environ. 609, 1248–1257. doi: 10.1016/j.scitotenv.2017.07.224
Roy E. D., Smith E. A., Bargu S., and White J. R. (2016). Will Mississippi River diversions designed for coastal restoration cause harmful algal blooms? Ecol. Eng. 91, 350–364. doi: 10.1016/j.ecoleng.2016.02.030
Roy E. D. and White J. R. (2012). Nitrate Flux into the Sediments of a Shallow Oligohaline Estuary during Large Flood Pulses of Mississippi River Water. J. Environ. Qual. 41, 1549–1556. doi: 10.2134/jeq2011.0420
Roy E. D., White J. R., Smith E. A., Bargu S., and Li C. (2013). Estuarine ecosystem response to three large-scale Mississippi River flood diversion events. Sci. Total Environ. 458, 374–387. doi: 10.1016/j.scitotenv.2013.04.046
Saksa P. and Xu Y. J. (2006). “Riverine nutrient inputs to Lake Ponchartrain, Louisiana, USA,” in Coastal Environment and Water Quality (AIH 25th Anniversary Meeting & International Conference: Changes in Coastal Hydrology and Water Quality), 195–203.
Sapkota Y., Bargu S., and White J. R. (2023). Temporally-displaced Mississippi River spring flood pulse shows muted aquatic ecosystem response in estuarine waters: A climate change warning for coastal food webs. Sci. Total Environ. 874, 162623. doi: 10.1016/j.scitotenv.2023.162623
Sarkar S. K. (2018). “Harmful algal blooms (HABs),” in Marine Algal Bloom: Characteristics, Causes and Climate Change Impacts (Springer, Singapore).
Sheldon J. E. and Alber M. (2006). The calculation of estuarine turnover times using freshwater fraction and tidal prism models: A critical evaluation. Estuar. Coasts 29, 133–146. doi: 10.1007/BF02784705
Sinha E., Michalak A., and Balaji V. (2017). Eutrophication will increase during the 21st century as a result of precipitation changes. Science 357, 405–408. doi: 10.1126/science.aan2409
Smith E. A. (2014). Cyanobacteria harmful algal blooms in south Louisiana estuaries: A synthesis of field research, management implications, and outreach. LSU Doctoral Dissertations. Baton Rouge, LA. 283. Available online at: https://www.proquest.com/dissertations-theses/cyanobacteria-harmful-algal-blooms-south/docview/2674875882/se-2 (Accessed June 1, 2023).
Snow C., Bargu S., Hammond C. N., Hiatt M., and White J. R. (2023). Effect of Mississippi River discharge plume on temporal and spatial variability of toxic cyanobacteria in an oligohaline estuary. Hydrobiologia 851, 87–103. doi: 10.1007/s10750-023-05322-3
Sukenik A., Quesada A., and Salmaso N. (2015). Global expansion of toxic and non-toxic cyanobacteria: effect on ecosystem functioning. Biodivers. Conserv. 24, 889–908. doi: 10.1007/s10531-015-0905-9
Tas and Yilmaz I. (2015). Potentially harmful microalgae and algal blooms in a eutrophic estuary in Turkey. Mediterr. Mar. Sci. 16, 432–443. doi: 10.12681/mms.1042
Turner R. E., Swenson E. M., Milan C. S., and Lee J. M. (2019). Spatial variations in Chlorophyll a, C,N, and P in Louisiana estuary from 1994 to 2016. Hydrobiologia 834, 131–144. doi: 10.1007/s10750-019-3918-7
Turner Designs (2022). CyanoFluor™ handheld HAB indicator user manual (Rev. D, Part No. 998-8701) (San Jose, California: Turner Designs). Available online at: https://docs.turnerdesigns.com/t2/doc/manuals/998-8701.pdf (Accessed June 1, 2023.)
United States Army Corps of Engineers Rivers Gauges. Available online at: https://rivergages.mvr.usace.army.mil/WaterControl/stationinfo2.cfm?dt=S&sid=01280&fid=NORL1 (Accessed January 2025).
U.S. Geological Survey (2005). Environmental Atlas of Lake Pontchartrain. Available online at: https://pubs.usgs.gov/of/2002/of02-206/ (Accessed June 1, 2023).
US Coast and Geodetic Survey (1965). Manual of tide observations (Publication 30-1). Washington, DC: United States Government Printing Office. doi: 10.25607/OBP-160
U.S. Environmental Protection Agency (1993). Methods for the determination of inorganic substances in environmental samples (EPA/600/R-93/100) (Washington DC: U.S. Environmental Protection Agency).
U.S. Environmental Protection Agency (USEPA) (1979). Methods for chemical analysis of water and wastes (EPA-600/4-79-020) (Washington DC: U.S. Environmental Protection Agency, Environmental Monitoring and Support Laboratory).
U.S. Geological Survey (1998). Lessons on the lake: An educator’s guide to the Lake Pontchartrain Basin (Open-File Report 98-805) (Washington DC: U.S. Department of the Interior). Available online at: https://pubs.usgs.gov/of/1998/of98-805/lessons/chpt3/index.htm (Accessed June 1, 2023).
U. S. Geological Survey (2024). United States Geological Survey Water Data Nation. Available online at: https://waterdata.usgs.gov/nwis (Accessed June 2024).
van den Huevel S. (2010). Modeling the hydrodynamics and salinity of the Pontchartrain Basin. (Master’s thesis, Delft University of Technology). Delft, The Netherlands: Delft University of Technology. Available online at: http://resolver.tudelft.nl/uuid:5b7cdba3-4bfb-49e5-99b2-cf16423161ea.
Visser P. M., Ibelings B. W., Bormans M., and Huisman J. (2016). Artificial mixing to control cyanobacterial blooms: a review. Aquatic Ecology, 50 (3), 423–441.
Wang W., Huang H., Zhao K., Lv J., Liu X., Xie S., et al. (2025). Multiple influences on cyanobacterial abundance and diversity in the Beijing-Tianjin-Hebei Economic Circle and nearby areas of China. Curr. Res. Microb. Sci. 8, 100400. doi: 10.1016/j.crmicr.2025.100400
Wang Z., Li D., Cao X., Song C., and Zhou Y. (2015). Photosynthesis regulates succession of toxic and nontoxic strains in blooms of Microcystis (Cyanobacteria). Phycologia. 54 (6), 640–648.
White J. R., DeLaune R. D., Justic D., Pahl J., Day J., Lane R., et al. (2019). Consequences of Mississippi River diversions on nutrient dynamics of coastal deltaic wetland soils and estuarine sediments: A review. Estuar. Coast. Shelf Sci. 224, 209–216. doi: 10.1016/j.ecss.2019.04.027
White J. R., Fulweiler R. W., Li C. Y., Bargu S., Walker N., Twilley R. R., et al. (2009). The Mississippi River flood of 2008 – effects of a large freshwater diversion on physical, chemical and biological characteristics of a shallow, Estuarine Lake. Environ. Sci. Technol. 43, 5599–5604. doi: 10.1021/es900318t
Wu K. and Xu Y. J. (2007). Long-term freshwater inflow and sediment discharge into Lake Pontchartrain in Louisiana, USA. Hydrol. Sci. J. 52, 166–180. doi: 10.1623/hysj.52.1.166
Zhang W., Liu J., Xiao Y., Zhang Y., Yu Y., Zheng Z., et al. (2022). The impact of cyanobacteria blooms on the aquatic environment and human health. Toxins 14, 658. doi: 10.3390/toxins14100658
Keywords: phytoplankton, cyanobacteria, HABs, estuaries, water residence time, river diversion, water quality
Citation: Hammond CN, Bargu S, Turner CRR, Hiatt M and White JR (2025) The impact of seasonal hydrological disturbances on the presence and formation of toxic cyanobacteria blooms in coastal Louisiana. Front. Mar. Sci. 12:1618353. doi: 10.3389/fmars.2025.1618353
Received: 25 April 2025; Accepted: 15 September 2025;
Published: 15 October 2025.
Edited by:
Pierina Visciano, University of Teramo, ItalyReviewed by:
Arief Rachman, National Research and Innovation Agency, IndonesiaTodd Tietjen, Southern Nevada Water Authority, United States
Copyright © 2025 Hammond, Bargu, Turner, Hiatt and White. This is an open-access article distributed under the terms of the Creative Commons Attribution License (CC BY). The use, distribution or reproduction in other forums is permitted, provided the original author(s) and the copyright owner(s) are credited and that the original publication in this journal is cited, in accordance with accepted academic practice. No use, distribution or reproduction is permitted which does not comply with these terms.
*Correspondence: Sibel Bargu, c2Jhcmd1QGxzdS5lZHU=