Abstract
Seagrasses, often referred to as ecosystem engineers, play a vital role in shallow coastal waters worldwide. They can not only provide key ecological benefits such as ecosystem restoration and carbon sequestration, but also offer significant engineering benefits, including sediment stabilization and wave energy dissipation. Despite its potential biological benefits, the mechanisms behind seagrass-induced wave attenuation remain inadequately understood. Furthermore, inconsistencies in the recorded metrics complicate the comparison of findings across various experimental studies. This study aims to address these challenges by thoroughly examining six key parameters for assessing the wave attenuation performance of seagrass meadows: wave energy dissipation, drag coefficient, wave transmission coefficient, wave attenuation coefficient, wave-induced flow velocity, and turbulent kinetic energy. By systematically reviewing the most relevant lab-based experimental studies conducted from 2000 to 2024, this study summarises the developments, applications, and performance of these key parameters in analysing seagrass-induced wave dissipation, discussing the physical mechanism behind. The effects of currents on seagrass-induced wave attenuation performance are also investigated. The findings of this work provide a foundation for conducting a unified framework to assess the impact of canopy features and wave characteristics on seagrass-induced wave attenuation, further contributing to the development of coastal protection policies in combination with seagrass restoration guidance.
1 Introduction
Over 40% of the global population, approximately 2.15 billion people, currently reside in coastal regions, and this number is projected to rise in the coming years (Reimann et al., 2023; Shukla et al., 2021; Apine and Stojanovic, 2024). Consequently, coastal areas play a significant and increasingly important role in the global socio-economic landscape (Merkens et al., 2016; Kummu et al., 2016; Wei et al., 2024). The coastal communities and properties, especially in low-elevation regions, are facing the increasing threats of storms, flooding, and erosion. In this case, hard-engineered coastal defences such as seawalls, breakwaters, and dykes have been widely implemented worldwide to protect coastal regions (Singhvi et al., 2022; Vozzo et al., 2024). Nevertheless, with the increasing challenges posed by climate-induced sea level rise and the associated frequency and magnitude of extreme wave hazards, such conventional sea defence approaches are reported to be unsustainable in the long term (Morris et al., 2018; Lansu et al., 2024; Salauddin et al., 2021). Furthermore, such hard-engineered sea defence approaches can significantly damage the surrounding ecosystems (Singhvi et al., 2022; Hosseinzadeh et al., 2022). For instance, constructing seawalls in the coastal regions leads to the occupation of coastal habitats and a smoother surface structure. Such a truncation of intertidal areas and the simplification of surface complexity will further result in habitat fragmentation and a decrease in marine diversity (Bulleri and Chapman, 2010; Firth et al., 2020; Rella et al., 2018).
Recognising this, more and more focus has been paid on the potential for restoring coastal habitats in recent years, such as seagrass meadows (do Amaral Camara Lima et al., 2023; Forrester et al., 2024; Carus et al., 2022; Manousakas et al., 2022), oyster reefs (Osorio-Cano et al., 2019), salt marshes (Lopez-Arias et al., 2023), mangroves (Phan et al., 2019; De Dominicis et al., 2023; van Hespen et al., 2023), as nature-based solutions (NbS) (Inácio et al., 2022). These habitats offer numerous benefits, including wave energy dissipation, ecosystem resilience (referring to the ability of regrowth or the recovery after being damaged by natural disasters), and dynamic adaptability to sea-level rise (La Peyre et al., 2022; Kamil et al., 2021; Sachithanandam et al., 2022). Despite their potential ecological benefits, there is still a lack of knowledge and guidance regarding their application and effectiveness for coastal protection services (Kumar et al., 2021). The assessment of how ecosystems respond to extreme climatic events, such as storm surges, is important for accurately evaluating the effectiveness of NbS in mitigating coastal hazards and providing environmental benefits, and further promoting NbS restorations. For instance, up to 68% seagrass meadows were uprooted in the South Andaman Islands under the combined effects of the extremely high gradient of vertical velocities, turbulence kinetic energy, destructive waves, and storm surge during the severe cyclone event named Lehar (Sachithanandam et al., 2014). However, the unignorable self-healing ability of seagrass ecosystems was also observed, with up to 44.5% seagrass meadows recovered within a one-year period (Sachithanandam et al., 2022).
Seagrass meadows are essential foundational species in shallow coastal waters worldwide and are recognized as engineering species (Duarte, 1999; Folkard, 2005; Xu et al., 2025) and they are increasingly recognized for their critical dual contributions: they not only provide essential ecological benefits, such as ecosystem restoration and carbon sequestration, but they also perform vital eco-engineering functions like wave energy dissipation and sediment stabilisation (Temmerman et al., 2013; Bouma et al., 2014; Madsen et al., 2001), as illustrated in Figure 1.
Figure 1
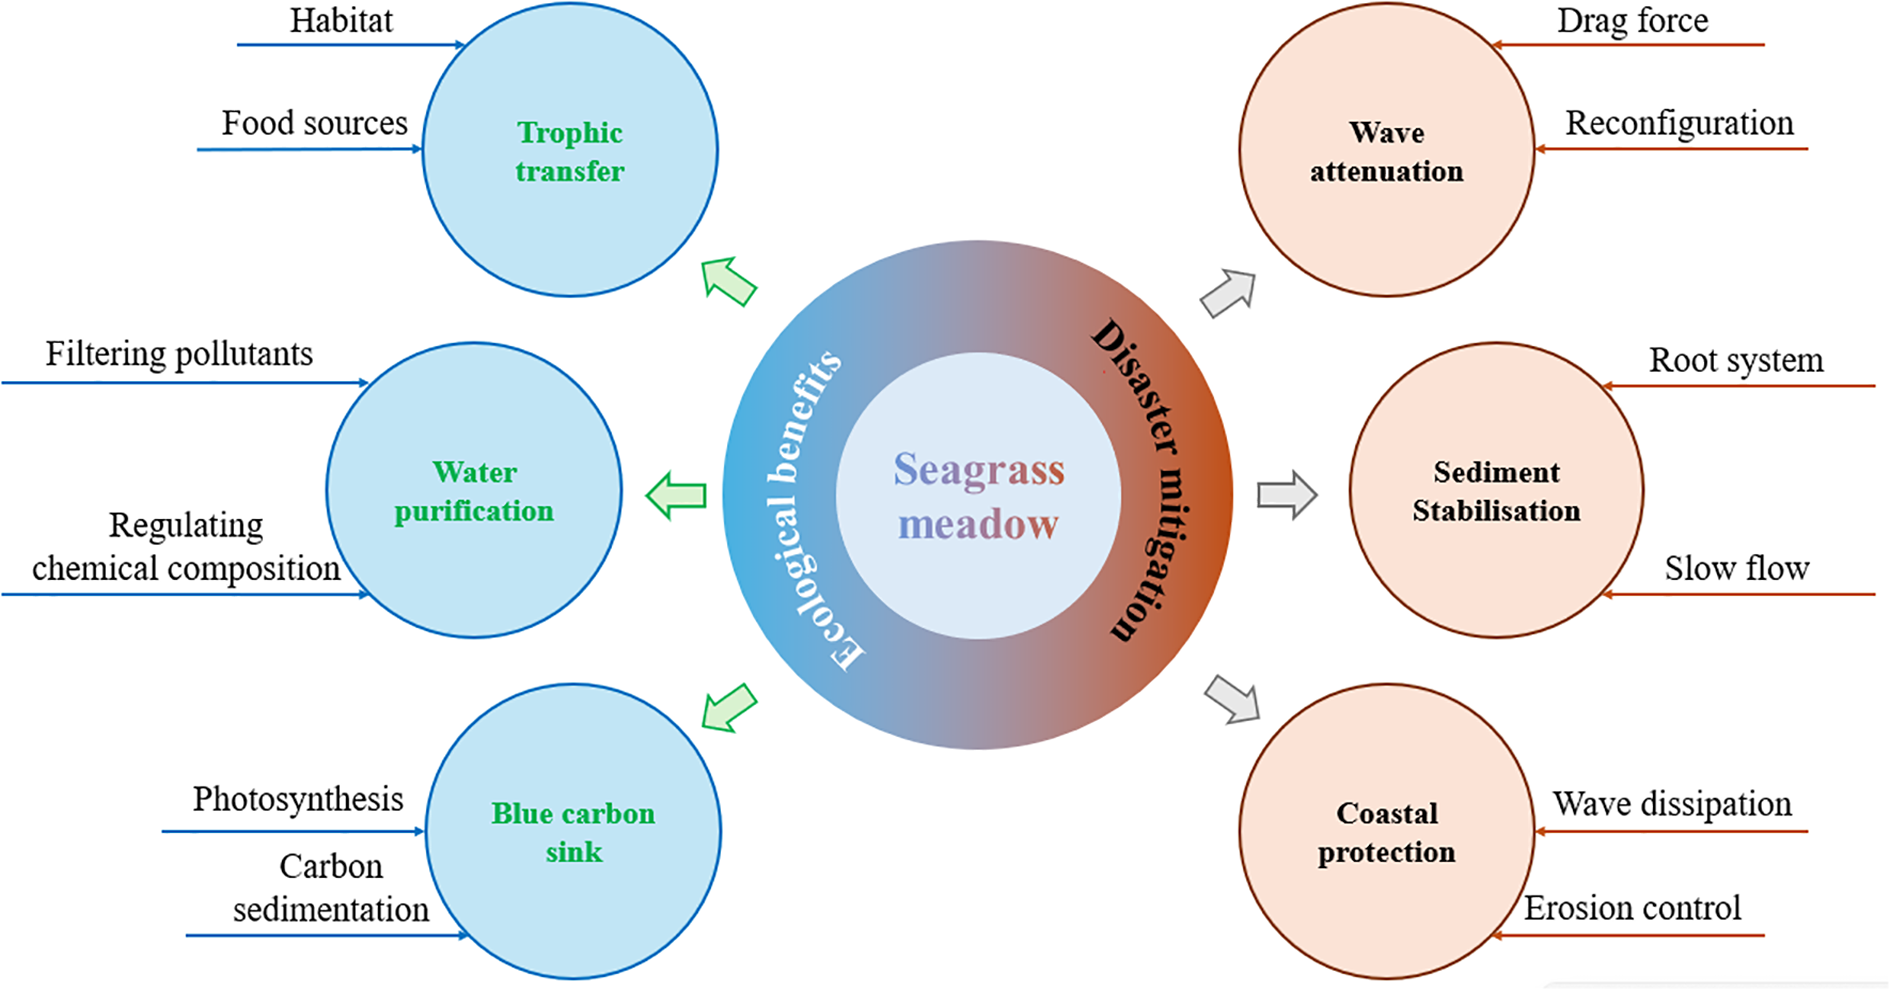
Seagrass meadow's contribution to ecological and engineering perspectives (Bos et al., 2007; Heck et al., 2008; Mazarrasa et al., 2018; de los Santos et al., 2020; Beth Schaefer and Nepf, 2022; Vierros, 2017).
In contrast to conventional submerged structures such as submerged breakwaters, seagrass meadows are spatially and temporally variable in height, shape, and coverage area (Twomey et al., 2022), which makes it significantly more challenging to quantify and predict the influences of seagrass meadows on wave height and local hydrodynamics. To address this challenge, the effects of canopy characteristics and environmental factors (including water depth, wave height and wave period) on seagrass-induced wave attenuation have been introduced and become a research hotspot in recent years (Figure 2), employing approaches ranging from field measurements (Sevim and Otay, 2024; Jacob et al., 2023; James et al., 2021) to laboratory experiments (Vettori et al., 2024; Liu et al., 2023; van Rooijen et al., 2020) and numerical modelling (Schaefer and Nepf, 2024; El Rahi et al., 2023; Familkhalili and Tahvildari, 2022).
Figure 2
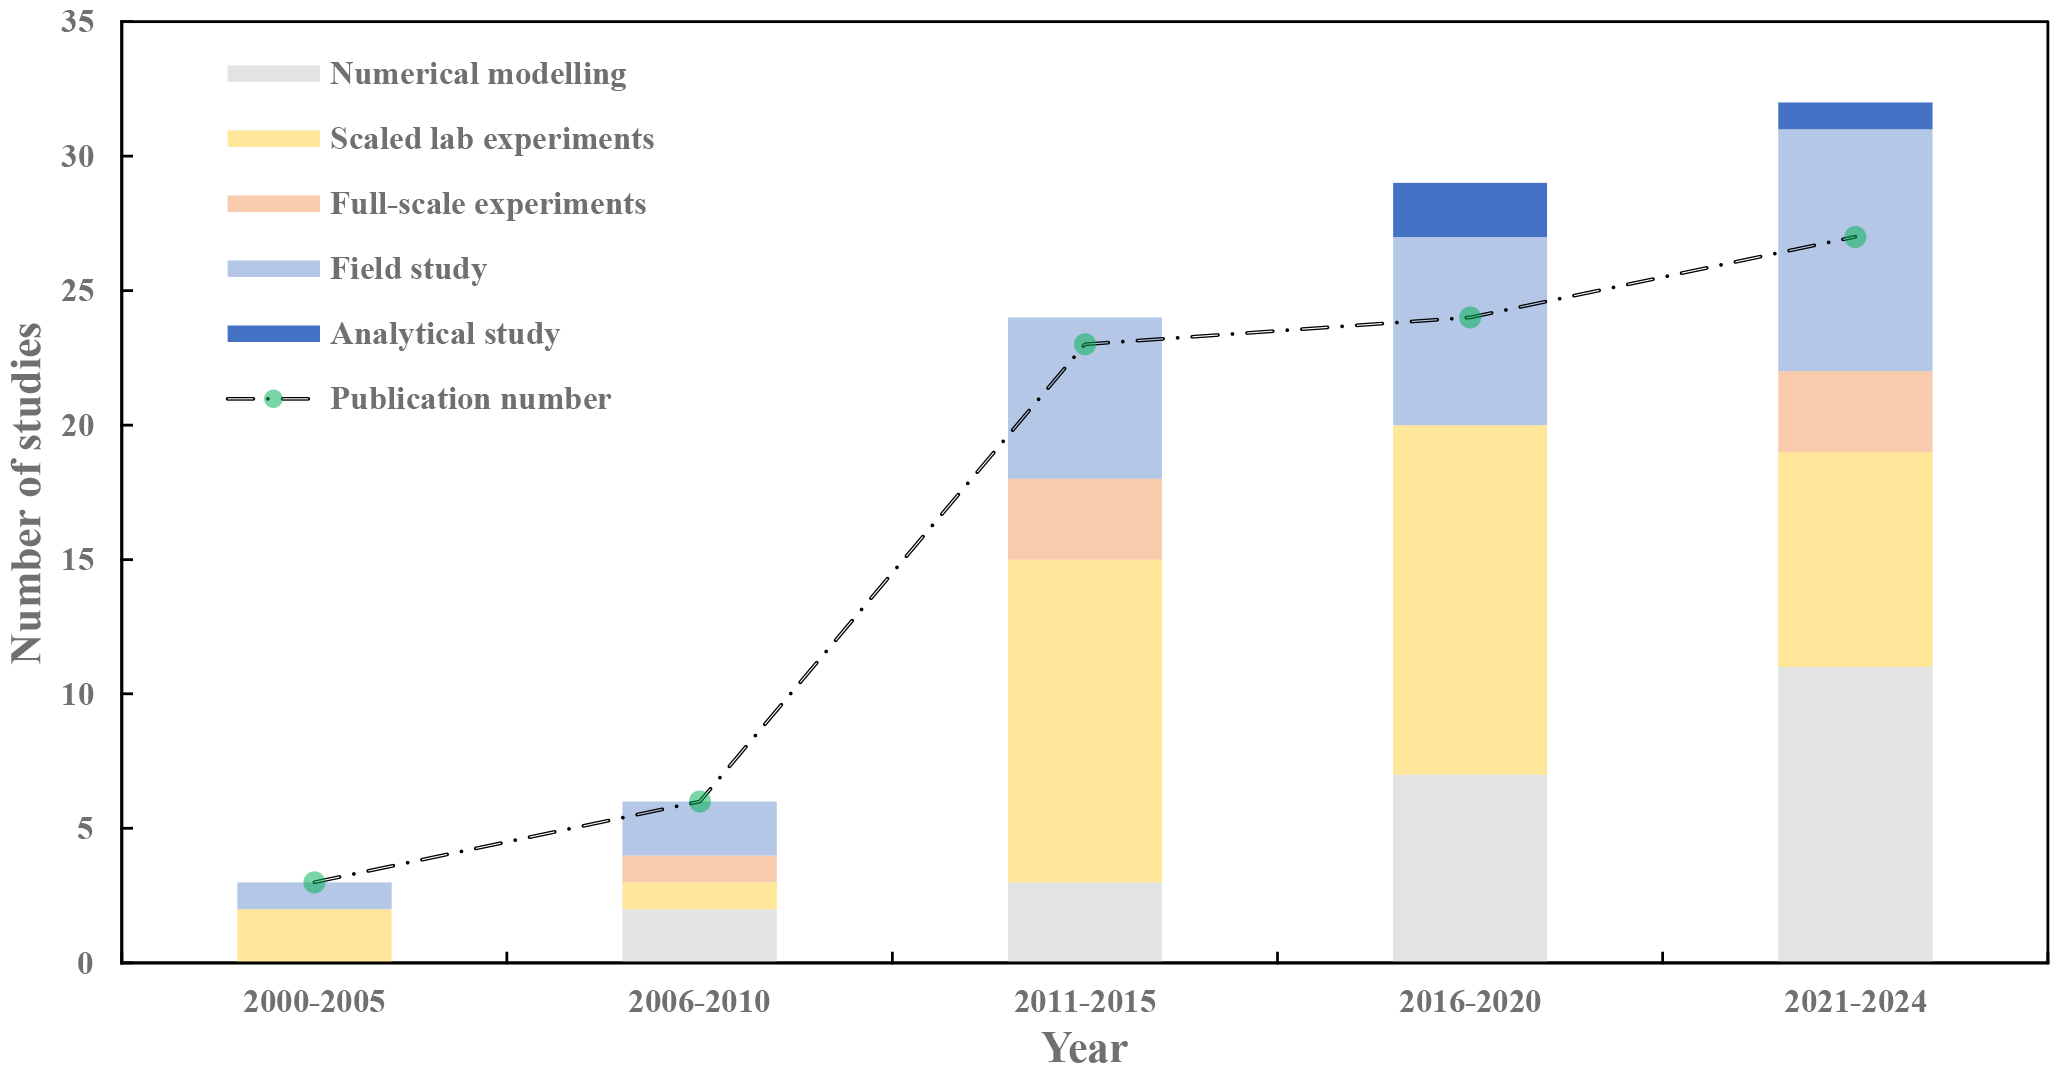
Number of publications and study types conducted every five years (Note: some publications report multiple study types; therefore, the total number of publications may be less than the total number of studies).
The number of peer-reviewed publications relevant to seagrass-induced wave attenuation from 2021 to March 2024 is nine times that of the publications between 2000 and 2005. Most of these studies are conducted in the laboratory, typically focusing on scaled experiments, with only a few dedicated to full-scale investigations. For example, Astudillo et al. (2022) conducted a full-scale experiment that examined the hydrodynamics and shoreline erosion response of seagrass meadows. Although field studies have historically been less common than laboratory experiments, their frequency has increased in recent years, now comprising one-third of the total publications since 2021. Numerical modelling has become a key approach for analysing the hydrodynamics of seagrass meadows, driven by advancements in computer science and increased computational power. As shown in Figure 2, the number of numerical studies conducted from 2021 to 2024 is over five times higher than those carried out between 2006 and 2010. Since 2011, there has been a growing acceptance in the scientific community for integrating experimental and numerical methods. For instance, Liu et al. (2023) performed a scaled experiment combined with Xbeach modelling to optimise the analysis of drag coefficients and predict wave height reduction for both rigid and flexible submerged vegetation.
Nevertheless, researchers have reported varying parameters to quantify wave attenuation, including the drag coefficient (Reis et al., 2024), wave transmission coefficient (Magdalena et al., 2022), wave attenuation coefficient (Beth Schaefer and Nepf, 2022), and wave energy dissipation (Zhang et al., 2018). This lack of consistency in evaluation indices and wave attenuation measurements hinders our ability to compare findings across different studies and fully understand how seagrass meadows contribute to coastal protection. Addressing this issue is crucial for maximizing the potential of these ecosystems in safeguarding our coastlines.
Three review works on the assessment of coastal protection services provided by seagrass meadows have been reported. For example, Ondiviela et al. (2014) discussed the seagrass's contribution to the coastal protection from ecological and engineering perspective, and found that incident energy flux, density, standing biomass and plant stiffness are the main factiors driving the efficiency of coastal protection provided by seagrass. Risandi et al. (2023) introduced hydrodynamics in the Indonesian seagrass ecosystems and its interaction with sediment transport and ecological processes. Twomey et al. (2020) synthesized the effects of various seagrass meadow features, such as meadow length, shoot density, shoot width, and canopy height, on wave attenuation by converting measurements from 11 laboratory and field experiments into a unified drag coefficient. However, a significant challenge arises from the lack of comprehensive reporting of original experimental data, including wave period and blade characteristics (Pinsky et al., 2013; Twomey et al., 2020). While past studies have contributed to the domain, there is a clear need for a thorough and critical analysis of the key factors and parameters used to measure and evaluate wave attenuation in seagrass meadows. A comprehensive review of several parameters could be a starting point for developing a unified evaluation framework, particularly given that there is a lack of previous workthat systematically outlines the various criteria used in experimental studies on wave attenuation caused by seagrass beds.
Therefore, the purpose of this study is not only to review existing modelling approaches but also to develop a unified framework for the first time, in order to assess the coastal protection services provided by seagrass meadows. The key research questions are: i) What are the main empirical formulas in assessing seagrass-induced wave attenuation? ii) Which parameters or coefficients are more important in assessing the coastal protection services of seagrass meadows? iii) Can the wave attenuation performance of seagrass meadows be evaluated using a unified evaluation framework?
By answering these questions, this review presents the most current and relevant information, as well as a novel unified framework for evaluating wave attenuation in seagrass meadows. Here, we include an overview of past research and recent developments in assessing wave attenuation in seagrass meadows using laboratory experiments, focusing on both empirical findings and key parameters. To assess the influence of canopy characteristics and wave conditions on wave attenuation, various parameters used to measure canopy-induced wave attenuation are summarised and analysed. The review identifies current challenges and future research opportunities for assessing the engineering benefits of seagrass beds.
2 Methodology
This study employs the Preferred Reporting Items for Systematic Reviews and Meta-Analyses (PRISMA) method (Page et al., 2021) to conduct a thorough and systematic review of the wave attenuation capabilities of seagrass meadows and seagrass blades. The selection of papers is based on defined keywords and specific exclusion and inclusion criteria, using the Web of Science and Scopus databases, which are widely recognised as two of the most comprehensive literature repositories for various topics (Pranckutė, 2021). During the initial phase of our search, we employed a selection of targeted keywords and search strings (as listed in Table 1) to identify relevant studies in the title, abstract, and keywords of published papers. The search covers publications from January 2000 to November 2024.
Table 1
| Search string for scopus dataset |
|---|
| • TITLE-ASB-KEY ({Seagrass meadow} OR {Seagrass bed} OR {Seagrass blades}) AND ({Wave dissipation} OR {Wave attenuation} OR {Wave energy dissipation} OR {Wave decay} OR {Wave height reduction}) • TITLE-ASB-KEY ({Seagrass meadow} OR {Seagrass bed} OR {Seagrass blades}) AND ({Drag coefficient}) • TITLE-ASB-KEY ({Seagrass meadow} OR {Seagrass bed} OR {Seagrass blades}) AND ({engineering benefits}) |
| Search string for web of science dataset |
| • TS = Seagrass meadow (All Fields) AND Wave attenuation (All Fields) • TS = Seagrass meadow (All Fields) AND Wave dissipation (All Fields) • TS = Seagrass meadow (All Fields) AND Wave energy dissipation (All Fields) • TS = Seagrass meadow (All Fields) AND Engineering benefits (All Fields) • TS = Seagrass meadow (All Fields) AND Wave decay (All Fields) • TS = Seagrass bed (All Fields) AND Wave attenuation (All Fields) • TS = Seagrass bed (All Fields) AND Wave dissipation (All Fields) • TS = Seagrass bed (All Fields) AND Wave energy dissipation (All Fields) • TS = Seagrass bed (All Fields) AND Engineering benefits (All Fields) • TS = Seagrass bed (All Fields) AND Wave decay (All Fields) • TS = Seagrass blades (All Fields) AND Wave attenuation (All Fields) • TS = Seagrass blades (All Fields) AND Wave dissipation (All Fields) • TS = Seagrass blades (All Fields) AND Wave energy dissipation (All Fields) • TS = Seagrass blades (All Fields) AND Engineering benefits (All Fields) • TS = Seagrass blades (All Fields) AND Wave decay (All Fields) |
A list of search strings considered within this study.
A total of 501 published articles were thoroughly selected through the initial search stage for further evaluation. A series of inclusion and exclusion criteria (as shown in Table 2) was applied to eliminate papers with low relevance. At this stage, only peer-reviewed articles that assess the wave attenuation performance of seagrass meadows based on experimental studies were selected for full-text review. Figure 3 illustrates the key steps involved in selecting the relevant papers. Finally, a total of 40 published works were included in the full-text analysis. The key characteristics (seagrass species, hydrodynamic conditions, and reported parameters) of these screened publications are listed in Supplementary Table S1. It is worth noting that in addition to the systematic review dataset, a small number of foundational studies identified through backward citation tracking were referenced to illustrate the historical development of wave attenuation models; however, these were not included in the dataset as they were not seagrass-specific or experimental in nature.
Table 2
| Inclusion criteria | Exclusion criteria |
|---|---|
| Papers published from Jan 2000 to 2024 | Papers published before Jan 2000 |
| Peer-reviewed journal papers | Non-peer-reviewed papers or conference papers |
| Papers written in English and not translated | Papers written in other languages |
| Studies in understanding the wave attenuation performance of seagrass meadow | Studies focusing on other topics, e.g., ecology, environment, suspended sediments, etc. |
| Experiment-based studies | Numerical methods, field study, or machine learning |
| Studies on natural seagrass or seagrass mimics | Other aquatic vegetations, e.g., kelp, saltmarsh, and seaweeds |
| Studies conducted in the oscillatory/combined flow | Studies only focus on the current-driven flow |
| Papers with full-text access | Only available for limited text |
Inclusion and exclusion criteria adopted in this study.
Figure 3
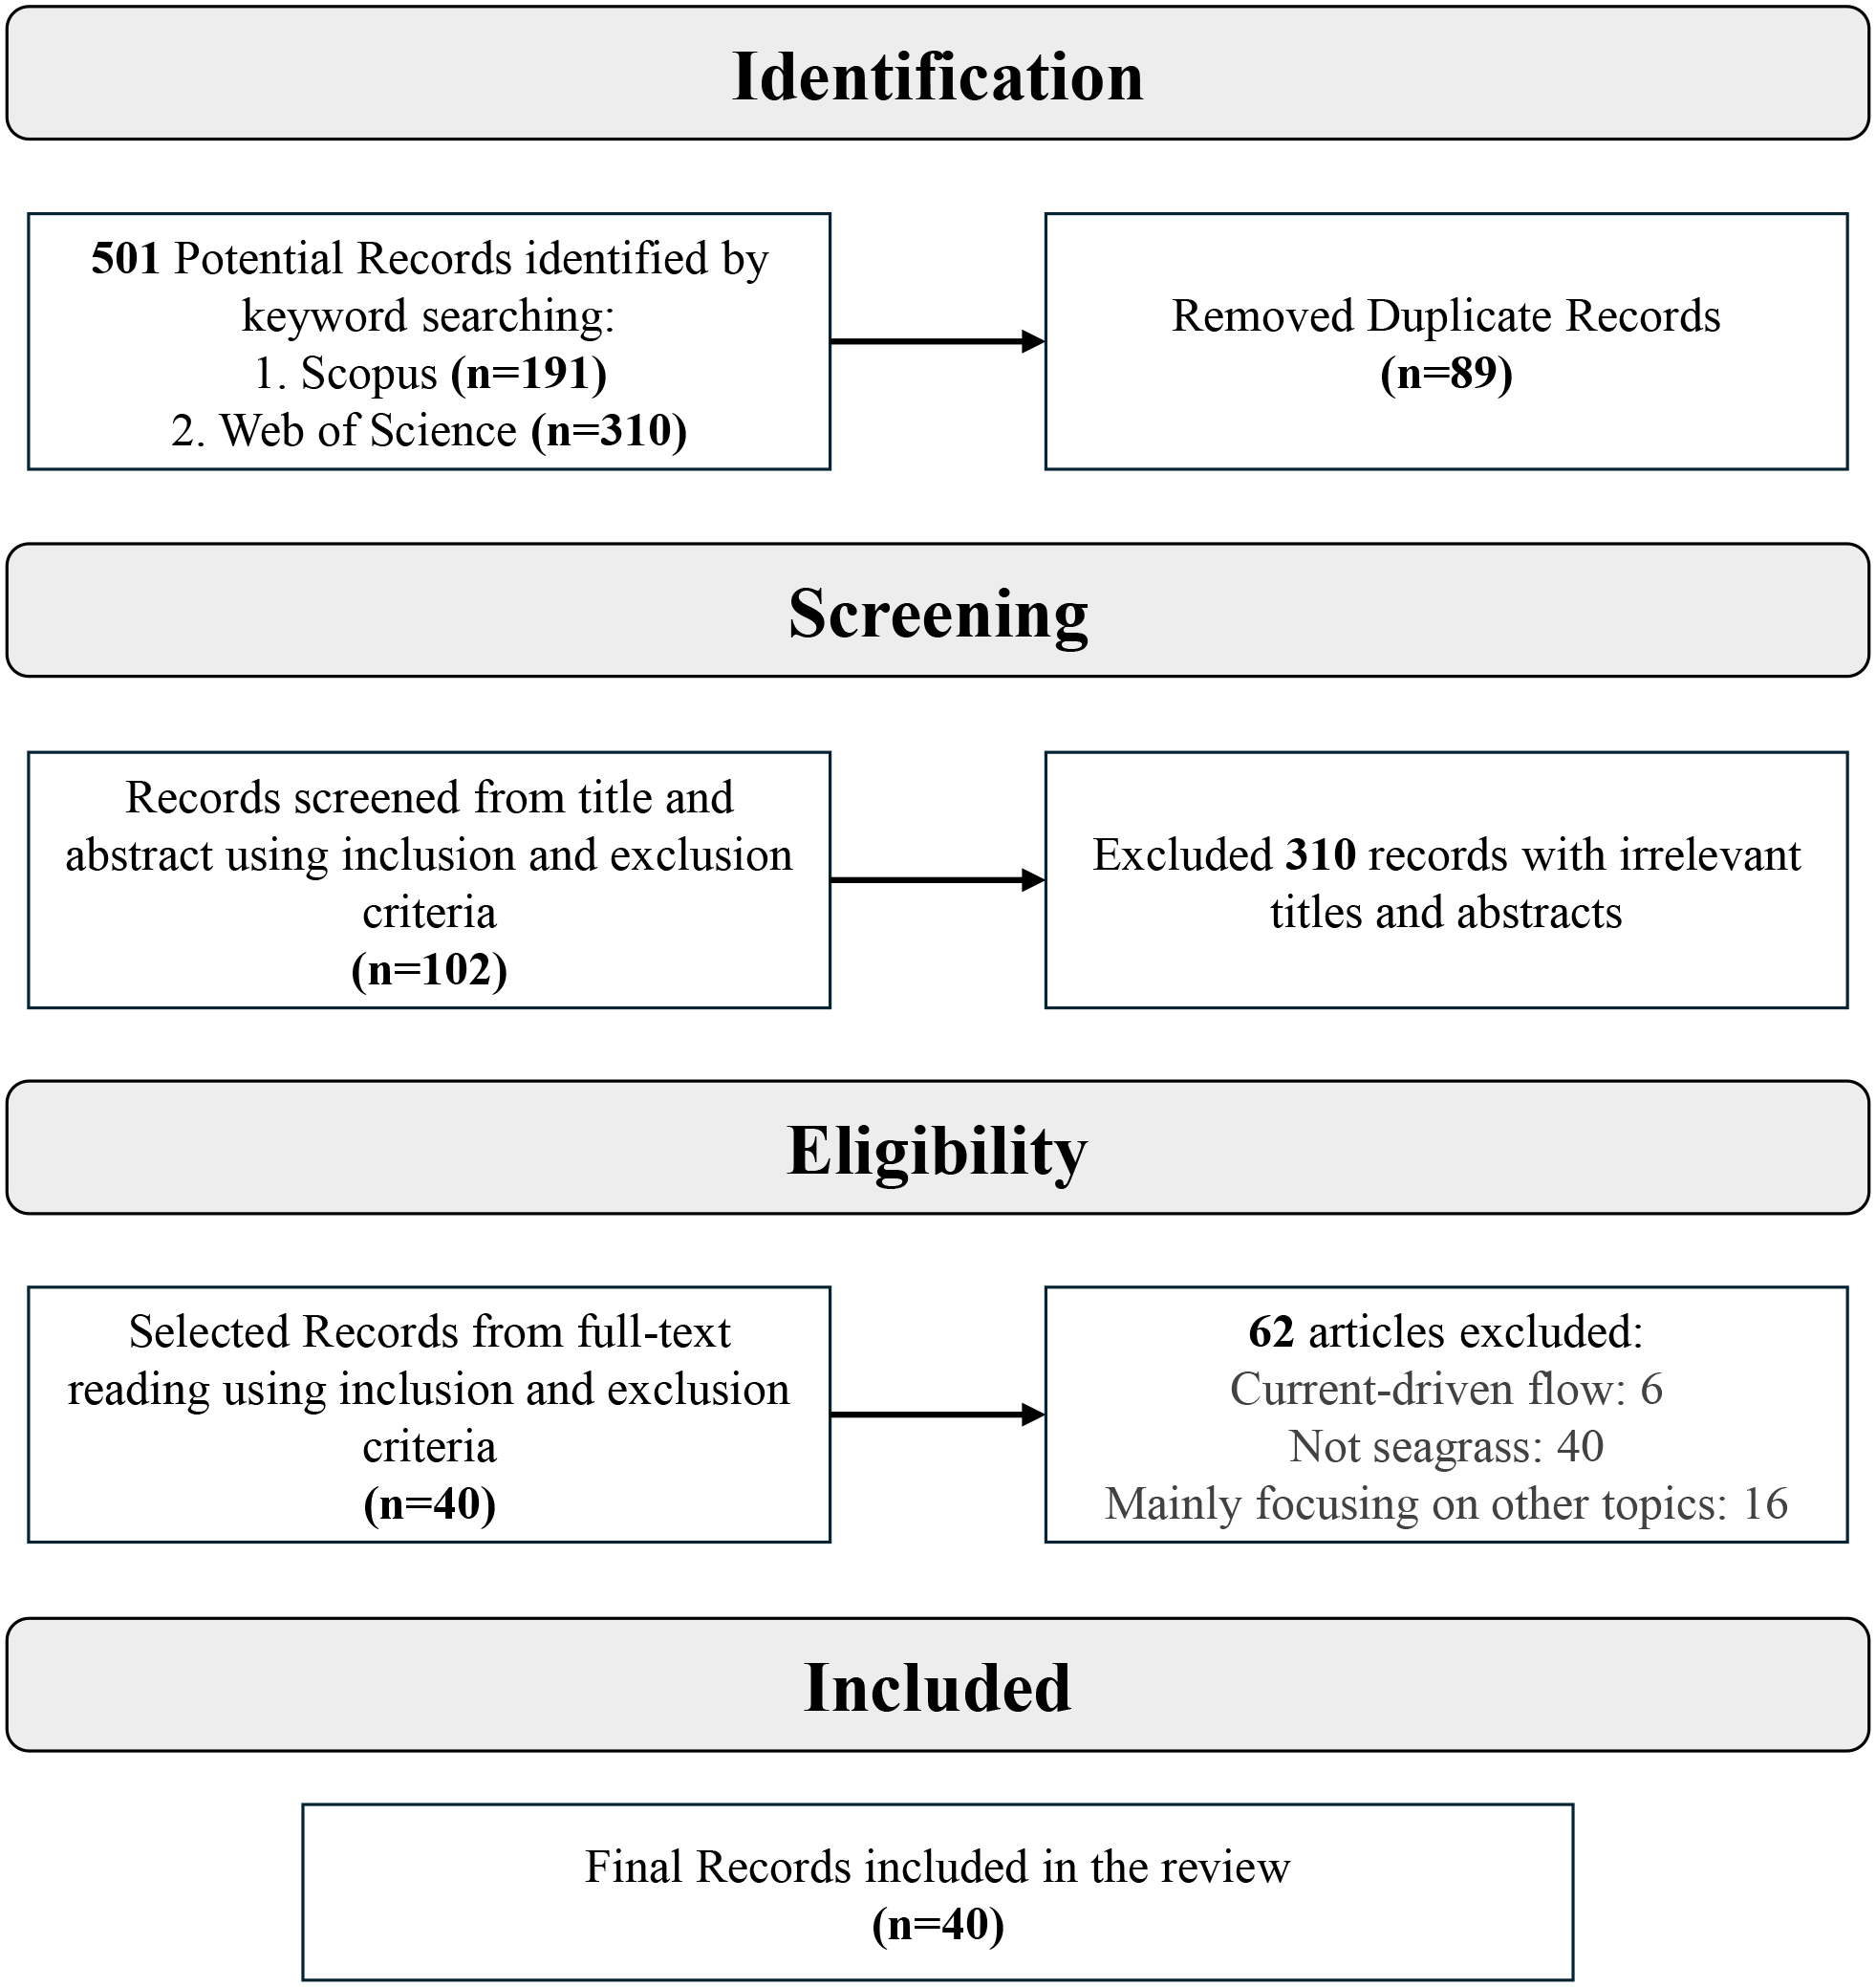
PRISMA approach as adopted in this study.
3 Results
3.1 Wave attenuation over seagrass meadow
Although the geometrical characteristics of seagrass shoots vary from species to species and change dynamically throughout the year, leading to instability in seagrass-induced wave attenuation, it is well known that wave energy dissipation is contributed by hydrodynamic drag, which depends on the relative motion between the seagrass blades and water particles. When waves engage with submerged seagrass meadows (Figure 4), the seagrass-induced wave attenuation performance is commonly associated with environmental features (e.g., water depth, incident wave height, and incident wave period) and canopy features (e.g., canopy height, shoot density, and blade flexibility). The wave energy dissipation over a certain length () of seagrass meadows can be generally expressed using the wave attenuation coefficient.
Figure 4

Wave transmission over a submerged seagrass meadow.
, which is a function of incident wave height , transmitted wave height , and transmission distance , as shown in Equation 1.
Several empirical formulas for seagrass-induced wave attenuation analysis have been developed over the past decades through a series of lab-scale experiments (see Table 3). With the assumptions of 1) linear wave theory; 2) all wave energy dissipation is contributed by seagrass hydrodynamic drag; 3) flat bottom; 4) ignoring the change of blade length by reconfiguration, Dalrymple et al. (1984) expressed as a function of incident wave parameters and canopy characteristics, as shown in Equation 2, where is the drag coefficient, is the vegetation frontal area per unit height, is the number of vegetation stands per unit horizontal area, is the wave number, is the mean canopy height, and is the water depth.
Table 3
| Empirical equations | Advances | Sources |
|---|---|---|
| (2) | First model | (Dalrymple et al., 1984) |
| (3) | Irregular wave condition | (Mendez and Losada, 2004) |
| (4) | Effective blade length | (Lei and Nepf, 2019a) |
| (5) | Incorporating shoot density | (Vettori et al., 2024) |
The developed empirical formulas for seagrass-induced wave attenuation.
Based on the wave attenuation model developed by Dalrymple et al. (1984); Mendez and Losada (2004); Lei and Nepf (2019a), and Vettori et al. (2024) further discussed several empirical relationships for predicting the wave attenuation over submerged seagrass meadows on the flat bottom by conducting a series of laboratory experiments. To evaluate the wave attenuation performance of submerged vegetation fields in non-breaking random wave conditions, Mendez and Losada (2004) developed Equation 3 and rewrote Equation 1 as Equation 6, in which represents the root-mean-square wave height.
Notably, the empirical formulas proposed by Dalrymple et al. (1984) and Mendez and Losada (2004) are primarily developed with the rigid blade assumption, which results in overestimating the wave attenuation ability of flexible seagrass meadows (Luhar et al., 2017). Compared with rigid blades, the blade motion of flexible blades leads to a lower relative velocity between blades and flow, reducing the seagrass meadow-induced drag and resulting in a lower wave attenuation (Luhar et al., 2017; Reis et al., 2024). Besides, the reconfiguration of the seagrass blades under wave effects reduces drag by reducing the frontal area of the blade and making the reconfigured shape more streamlined (Langre, 2008).
A lot of efforts have been made over the past decade to understand the flexible blade motion under the wave effect. When wave excursion () is significantly smaller than the blade length (), the blade is estimated to remain nearly vertical as it sways following the wave cycle, as shown in the case of in Figure 5. When the wave excursion is much larger than the blade length, the blade can be pushed over in the early stages of a wave-half cycle and remains bent until the oscillatory flow reverses its direction (see in Figure 5). More precisely, the blade motion is driven by the combined action of the hydrodynamic drag force (), restoring force due to buoyancy force () and restoring force () caused by the blade stiffness. Three essential dimensionless parameters, the wave Cauchy number () defining the hydrodynamic drag ratio to the restoring force due to blade stiffness as Equation 7, the buoyancy parameter () defining the ratio between the restoring forces due to buoyancy and blade stiffness as Equation 8, and the blade length ratio () comparing the blade length with wave excursion as Equation 9, are proposed by Lei and Nepf (2019a) to describe the degree of blade reconfiguration:
Figure 5
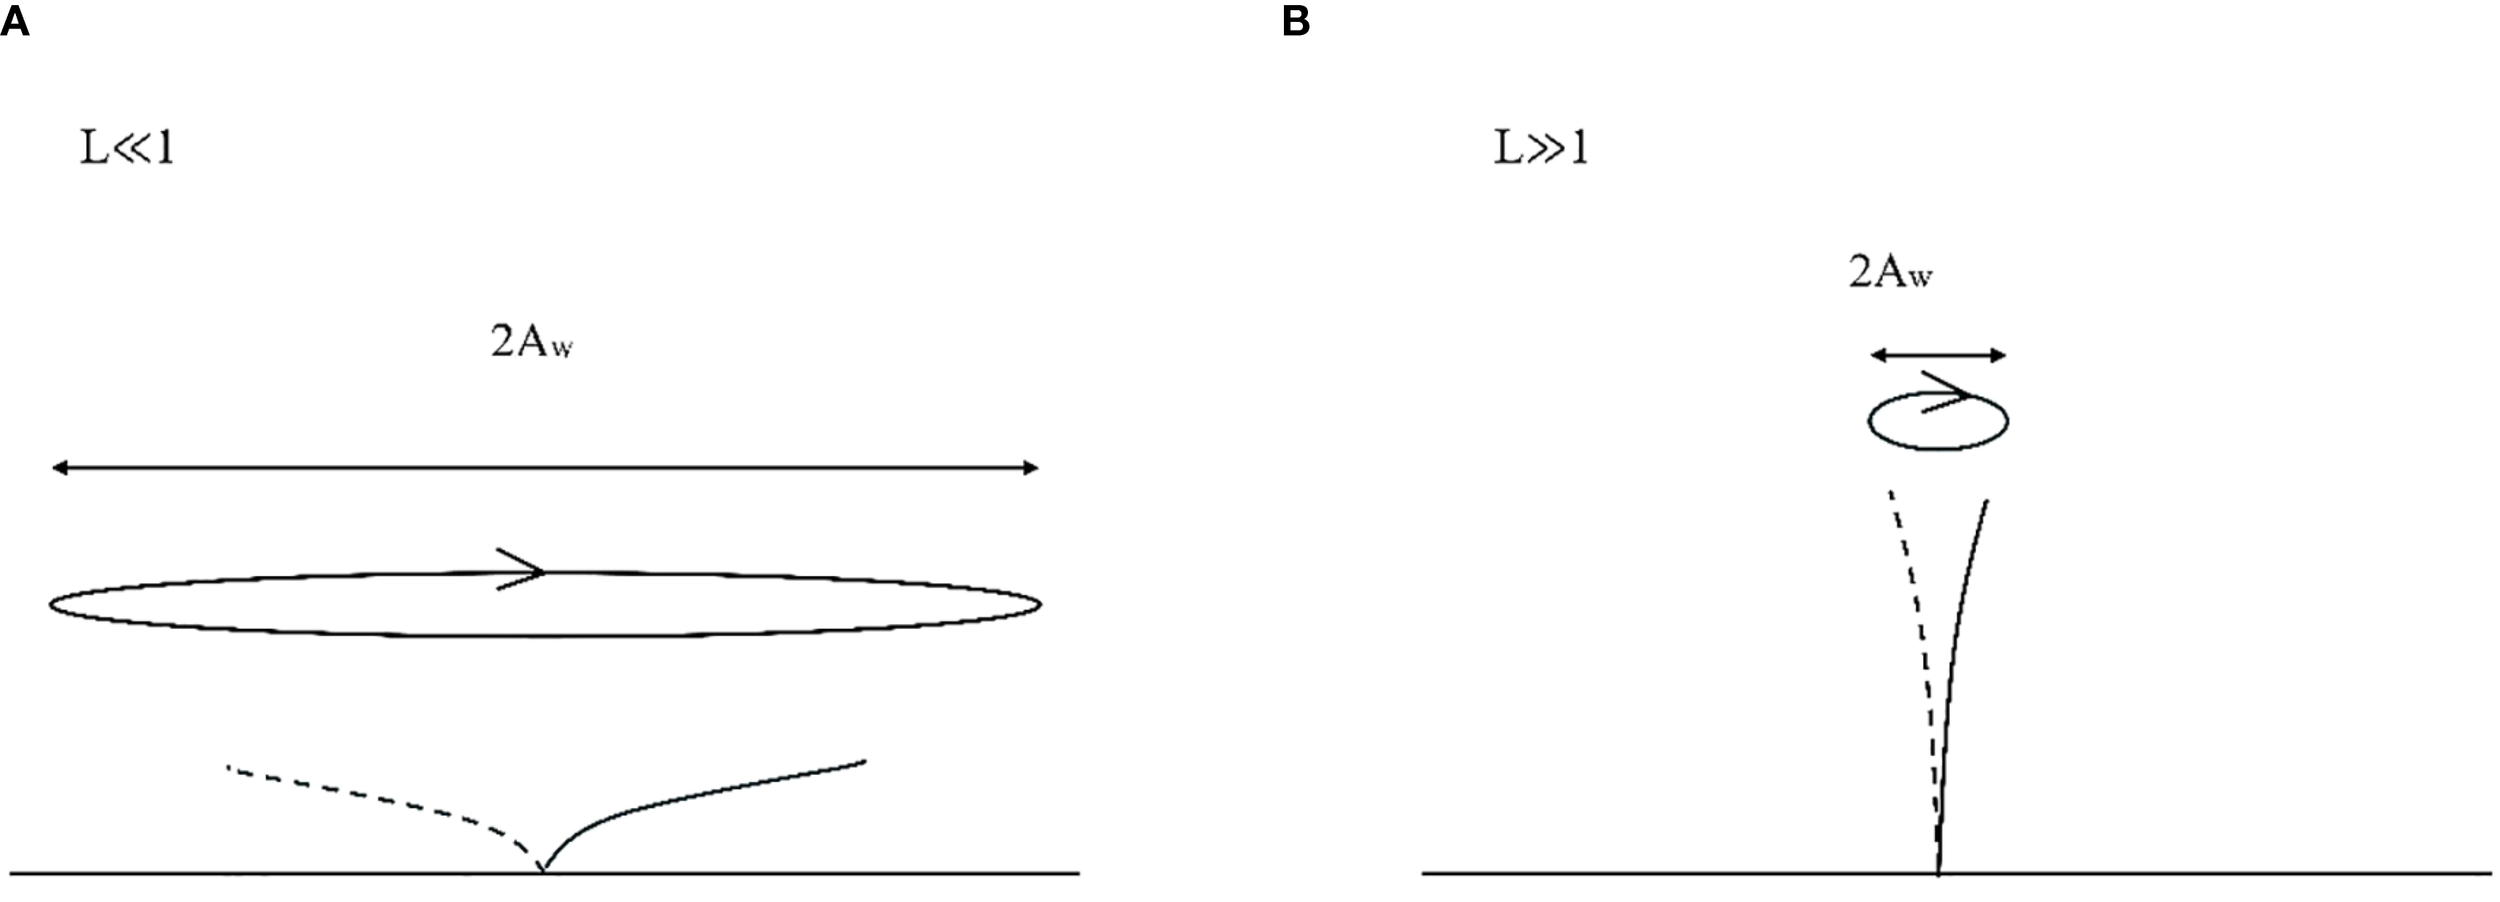
The difference in blade behaviour at the (A) large-excursion limit () and (B) small-excursion limit (), adapted from Luhar et al., 2010 with permission from Elsevier under the following license: http://www.elsevier.com/open-access/userlicense/1.0/.
in which, represents the second moment of inertia (assuming a rectangular cross-section).
It is well known that the buoyancy of seagrass does not significantly influence wave-induced oscillations, as the blades are nearly neutrally buoyant (Luhar and Nepf, 2016). Consequently, the reconfiguration of seagrass blades can be described using two parameters, and . These parameters have been adopted in various experimental studies to assess the effectiveness of artificial seagrass mimics by comparing their and values with those of real seagrass blades (e.g., Pujol et al., 2013; Liu et al., 2023).
To quantify the influences of blade motion on wave decay, especially referring to the blade reconfiguration, the effective blade length (), which represents the length of a rigid, vertical blade that has the same horizontal drag as a flexible blade of a specific length, is introduced (Luhar and Nepf, 2016). Based on these four key assumptions: 1) the blade length is significantly greater than the wave excursion (), 2) drag forces dominate over inertial forces (), 3) drag forces outweigh the blade's bending resistance (), and 4) skin friction is negligible compared to pressure drag forces. Lei and Nepf (2019a) proposed an empirical formula describing the effective blade length, as shown in Equation 10.
As seagrass shoots consist of several flexible blades that either emerge from or are attached to a rigid sheath with length (), Lei and Nepf (2019b) corrected the effective length of a seagrass meadow as the sum of the effective blade length and the rigid sheath length, and further proposed Equation 4 (in Table 3) for seagrass-induced wave attenuation prediction by incorporating the influences of blade reconfiguration.
More recently, a stratification of the wave attenuation coefficient on plant density was observed in contrast with the reporting from Lei and Nepf (2019b), which illustrated the existence of a significant effect of sheltering and blockage in the flexible seagrass meadow (Vettori et al., 2024). Therefore, Equation 5 in Table 3 is proposed to incorporate the sheltering/blockage effect in seagrass-induced wave attenuation analysis, in which an effective vegetation frontal area () per unit meadow volume was introduced as Equation 11:
where and are numerical coefficients, equalling 1.12 and 0.48, respectively. is named as roughness density. When , the blockage effect is dominant; when , the sheltering effect is more critical than the blockage effect.
3.2 Assessment of wave attenuation performance of seagrass meadows
It is evident from the literature that the drag generated by seagrass can lead to wave energy dissipation and damping of near-bed flow (e.g., Weitzman et al., 2015; Lowe et al., 2005). While numerous seagrass restoration and transplantation projects are currently underway worldwide, the mechanisms and quantification of seagrass-induced wave attenuation remain unclear. Generally, the seagrass-induced wave attenuation is affected by a combination of flow characteristics (such as the combined flow of wave and current, incident wave height, and wave period) (Chen et al., 2018), environmental conditions (e.g., submergence ratio) (Lei and Nepf, 2019a), characteristics of the seagrass species (including blade flexibility) (Houser et al., 2015), and the structure of seagrass meadows (such as shoot density and fragmentation) (El Allaoui et al., 2016; El Allaoui et al., 2015).
The complexity of wave-seagrass interactions, combined with the inconsistency of reported parameters, makes it challenging to generalise the impact of seagrass meadows on wave attenuation across multiple studies. Numerous parameters have been identified in the literature to assess the effectiveness of seagrass meadows in reducing wave energy and to shed light on the mechanisms involved. For instance, it is evident from Figure 6 that no single parameter is predominantly reported (over 50%). The parameter most frequently referenced is wave-induced flow, which accounts for 26.7% of the studies, followed by the wave transmission coefficient at 20%. In contrast, only six publications focused on turbulent kinetic energy to assess the wave attenuation services provided by seagrass meadows.
Figure 6
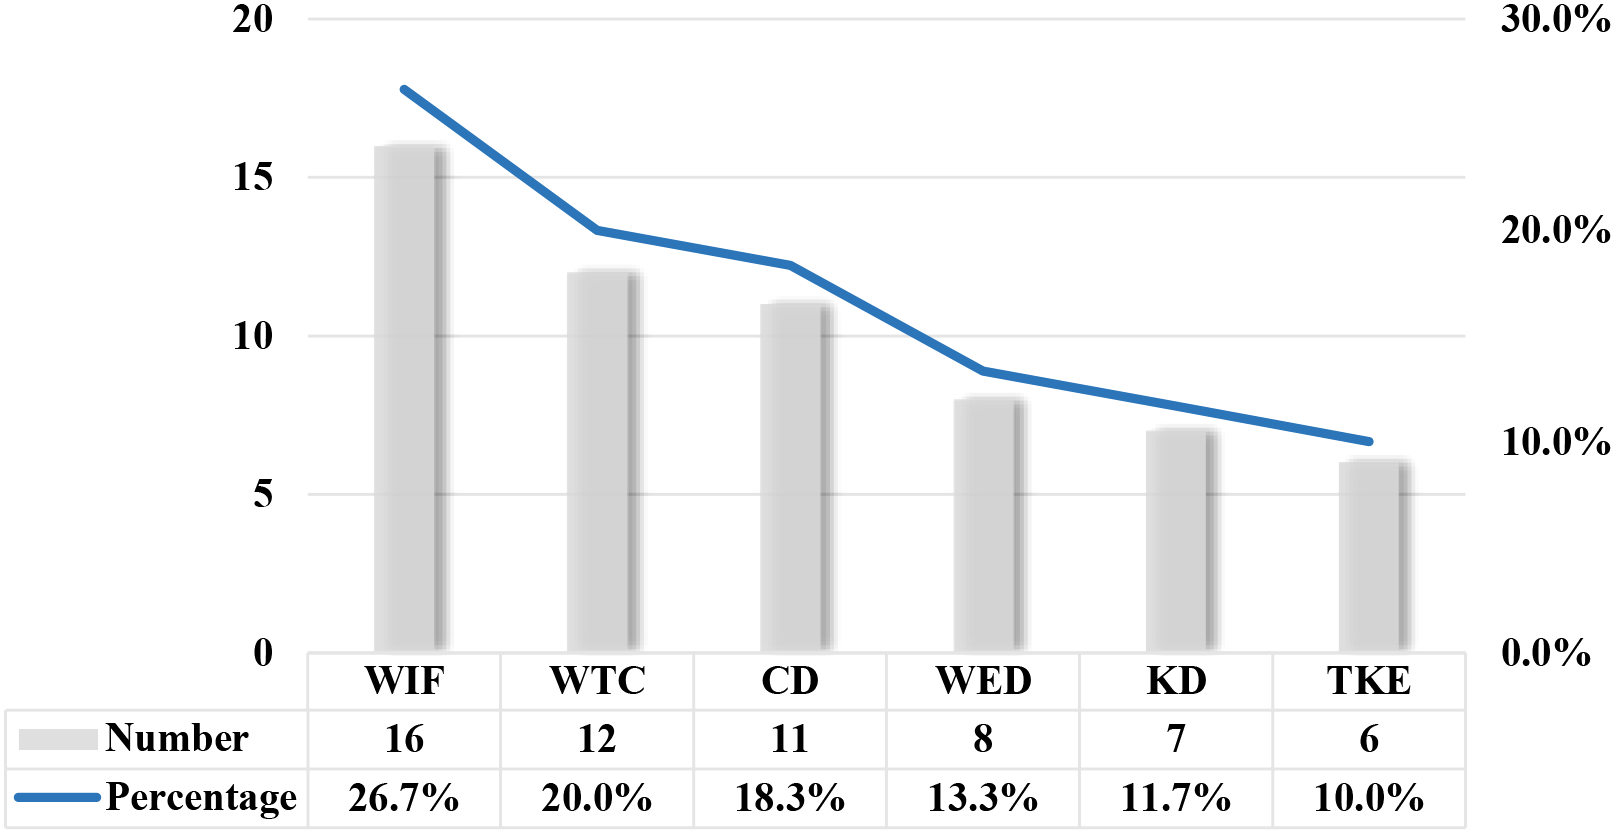
Key research parameters in assessing the seagrass-induced wave attenuation (WIF, Wave-induced flow; WTC, Wave transmission coefficient; CD, Drag coefficient; WED, Wave energy dissipation; KD, Wave attenuation coefficient; TKE, Turbulent kinetic energy). Noting that multiple parameters may be reported within one paper, the total number might exceed the number of reviewed papers.
To gain a comprehensive understanding of the complex hydrodynamic interactions between seagrass blades and flow structures, the factors categorised into two primary groups should be considered: canopy characteristics and environmental features (see Figure 7). Canopy characteristics refer to the physical properties of seagrass meadows and include elements such as shoot density, blade flexibility, vegetation area, stem arrangement, canopy fragmentation, blade length, and species diversity. Notably, shoot density and blade flexibility have been identified as the most significant factors in these studies, as shown in Figure 7. For instance, Stratigaki et al. (2011) measured wave orbital velocities within and above seagrass meadows with varying shoot densities. They found that increasing shoot density resulted in greater reductions in wave-induced flow and enhanced interactions between the canopy and waves near the top of the canopy. Cavallaro et al. (2018) observed varying trends in the drag coefficient relative to Cauchy's number for different levels of blade flexibility.
Figure 7
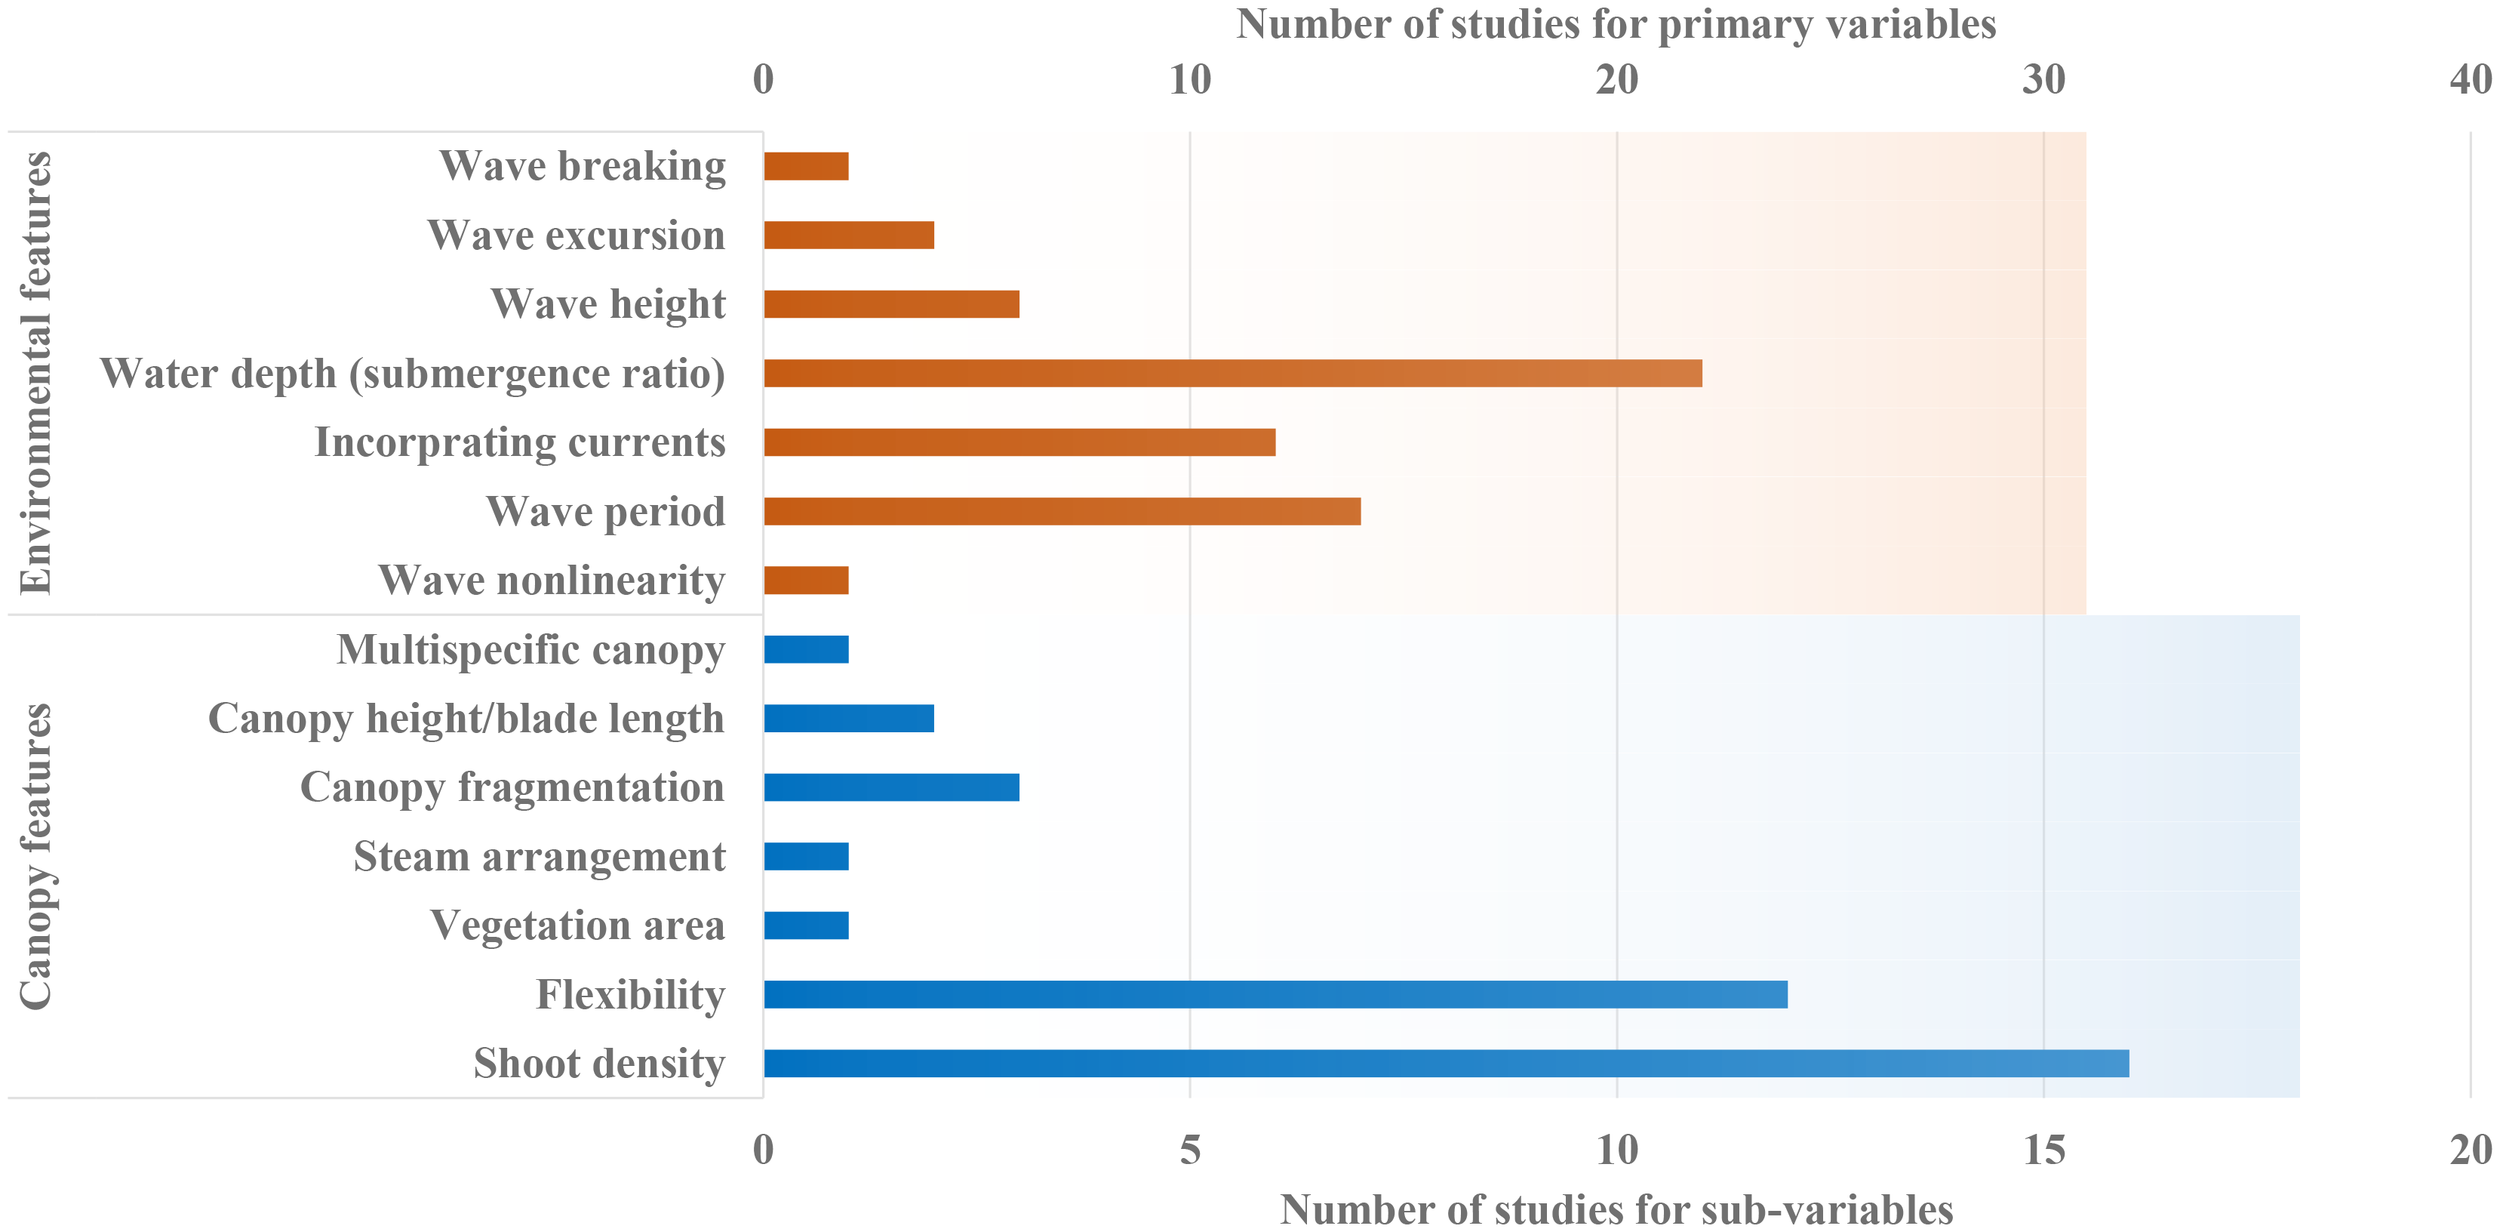
The number of variables reported in the systematic review dataset for assessing seagrass-induced wave attenuation.
The environmental features (Figure 7) that characterise flow types and wave conditions include aspects such as wave nonlinearity, wave period, the combined flow of waves and currents, water depth (which corresponds to the submergence ratio), wave height, wave excursion, and wave breaking. Among these factors, the influences of water depth, wave period, and the incorporation of currents are the most frequently reported. For example, (Hemavathi and Manjula, 2021; Hemavathi and Manjula, 2020a; Hemavathi and Manjula, 2020b; Hemavathi and Manjula, 2020c) found negative linear relationships between water depth and wave period with wave energy dissipation. Nevertheless, Koftis et al. (2013) demonstrated through large-scale experiments that submerged canopies primarily dissipate long waves rather than short ones. While past studies have made significant efforts in assessing seagrass-induced attenuation, the inconsistency of canopy features and environmental variables makes it very challenging to directly and quantitatively compare the findings of one study with another.
In experimental studies, creating realistic mimics that resemble seagrass in appearance or behavior is one of the most challenging aspects of researching seagrass-induced wave attenuation, as normally it is pretty tough to use the real seagrass. As discussed in Section 3, researchers typically use the wave Cauchy number and the blade length ratio to assess the realism of artificial blades by comparing them to natural seagrass species. Figure 8 illustrates the proportion of different seagrass species/mimics included in screened experimental studies, which is identified by dividing the number of specific seagrass species adopted in the screened publications by the total number of seagrass species used. Posidonia oceanica, the most important and well-studied seagrass species in the Mediterranean Sea (Chastel et al., 2020), has attracted the most research interest, comprising 30% of the studies. Zostera marina represents 10% of the research focus, while other seagrass species—such as Thalassia testudinum, Halophila spinulosa, Cymodocea serrulata, Posidonia australis, Zostera noltii, Vallisneria americana, and Enhalus acoroides—appear in the studies at relatively low proportions. 25% of the studies developed idealized rigid or flexible seagrass mimics, primarily contributing to parametric investigations of the effects of blade flexibility and length (Reis et al., 2024; Liu et al., 2023; El Allaoui et al., 2015).
Figure 8
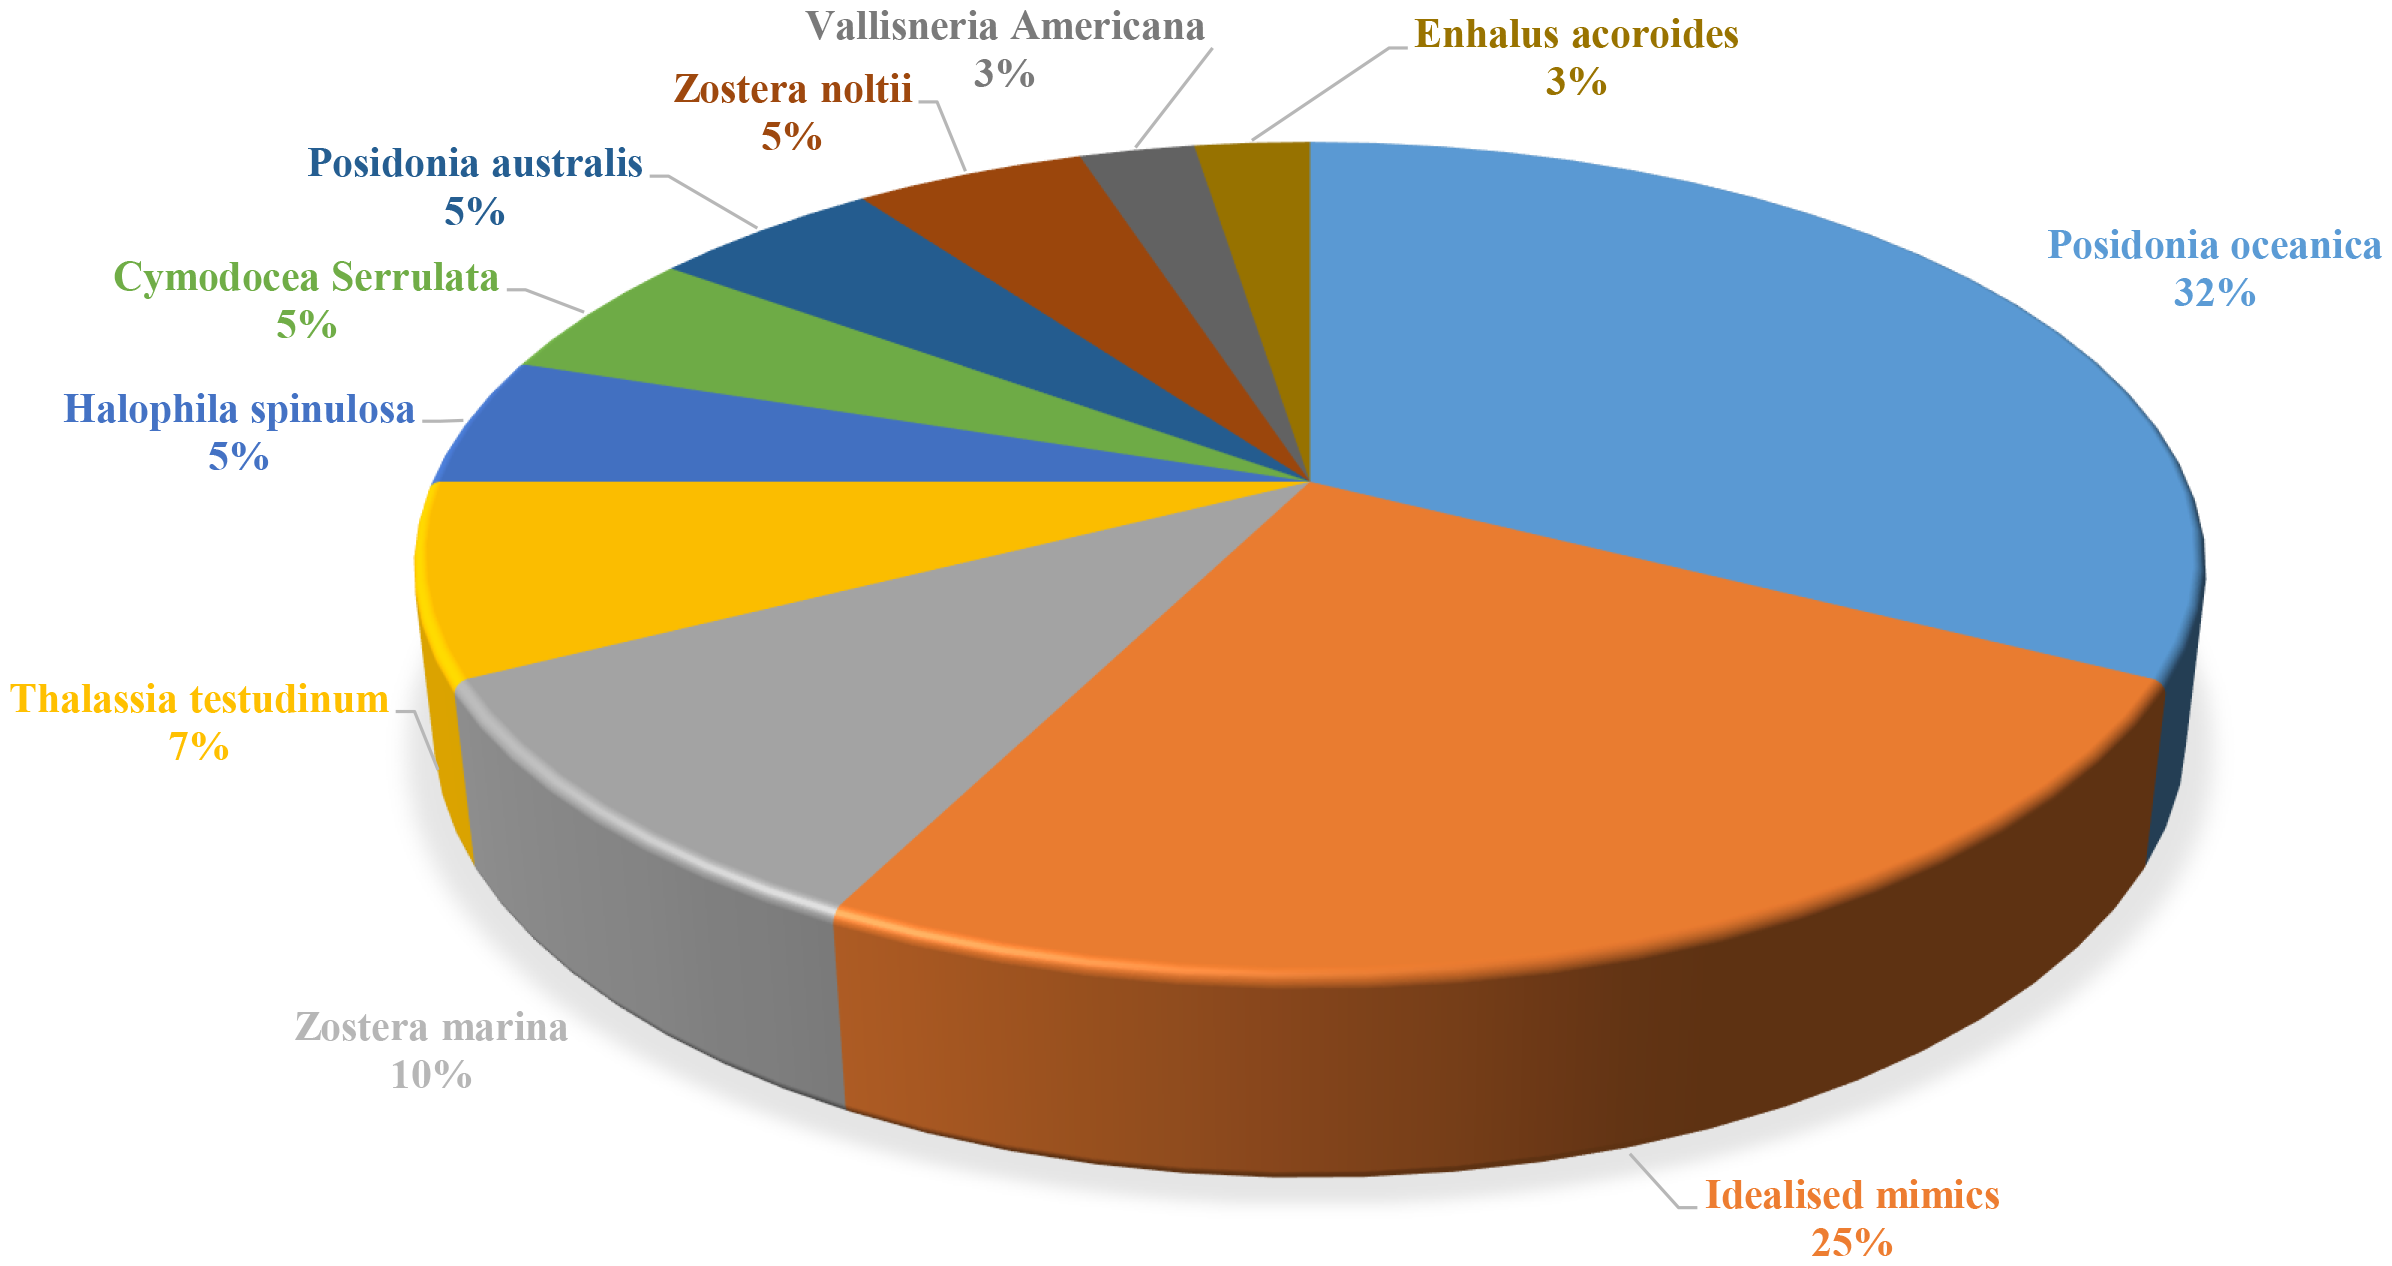
The proportion of seagrass species represented in wave attenuation experiments from the systematic review dataset.
Table 4 presents the typical measurements used to calculate each index in the experimental study. Apart from the drag force, the remaining five parameters require only wave height measurements or water velocity data. In the case of the drag coefficient, water velocities and measurements of the horizontal wave force acting on the seagrass blades are required. The accuracy of the drag force calculation heavily relies on the precision of the force transducer measurements and the calculation methods used, such as the direct method and the least squares method (LSM) (Hu et al., 2014; Chen et al., 2018). However, in many studies, the drag coefficient is typically estimated by calibrating wave attenuation coefficient models with experimental data, a method that has been widely validated and is considered accurate in the literature (Liu et al., 2023; Sánchez-González et al., 2011; Chastel et al., 2020). The following sections provide definitions, equations, and details on how these parameters assess seagrass-induced attenuation.
Table 4
| Evaluation parameters | Measurements required | ||||
|---|---|---|---|---|---|
| Wave induced flow | Instantaneous water velocity | ||||
| Wave transmission coefficient | Wave height/amplitude | ||||
| Drag Coefficient | Wave-induced force | Wave period | Water depth | Width of blades | Instantaneous water velocity |
| Wave energy dissipation | Wave height/amplitude | ||||
| Wave attenuation coefficient | Wave height/amplitude | ||||
| Turbulent kinetic energy | Instantaneous water velocity | ||||
Measurements required to calculate parameters for evaluating seagrass-induced wave attenuation (from the systematic review dataset).
3.2.1 Drag coefficient
The drag coefficient (CD), is a dimensionless parameter that quantifies the resistance caused by individual blades of aquatic vegetation (Houser et al., 2015). Several studies have reported the drag coefficient as a key factor in describing the wave attenuation performance of seagrass meadows (Reis et al., 2024; Chastel et al., 2020), which varies with changes in wave conditions and the characteristics of the vegetation, such as meadow length and canopy height. CD cannot be directly measured through experiments; instead, it can be calculated by fitting analytical wave attenuation models or similar formulations to measured wave attenuation data (Luhar and Nepf, 2016; Vettori et al., 2024). Since CD serves as the sole calibration parameter, accurately estimating the drag coefficient is crucial for evaluating the performance of wave attenuation formulae. The effectiveness of the numerical models used for predictions greatly relies on the precise determination of the drag coefficient (Mendez and Losada, 2004), known as the calibration method, assuming that vegetation drag contributes to the entire wave energy (Reis et al., 2024). However, the reliability of the drag coefficient is strongly influenced by the quality of the developed model compared to experimental measurements. Besides, this assumption can lead to an overestimation of the drag coefficient (Hu et al., 2014). Therefore, experimental force measurements are considered the most reliable sources for determining drag coefficients. Two methods can be used to estimate the drag coefficient from experimental measurements: the direct method and the least squares method (LSM). The direct method calculates CD directly from wave force measurements by evaluating the work done by the drag force. Unlike calibrating wave energy models, the direct method can estimate CD in various conditions, including wave-driven flow, current flow, or combined flow conditions (Hu et al., 2014). Chen et al. (2018) found that the direct method may provide a more accurate estimation of CD. Alternatively, Fourier analysis and the LSM (Sumer and Fredse, 2006) can also be employed to estimate the drag coefficient. Reis et al. (2024) evaluated both methods for rigid and flexible vegetation mimics, concluding that the direct method is more practical when inertial forces are negligible, while LSM offers a comprehensive approach by considering both drag and inertia terms.
To evaluate the wave attenuation caused by seagrass under various flow conditions, existing studies show that the drag coefficient can be expressed as an empirical function of either the Reynolds number or the Keulegan-Carpenter number, as seen in Equation 12.
The drag force is highly influenced by the geometrical and physical properties of seagrass meadows, as well as wave conditions. This makes it challenging to find consistent empirical values for the constants A (A'), B (B'), and C (C') in Equation 12. The limited number of studies provided original measurements, which complicates a thorough assessment of how drag coefficients respond to variations in seagrass properties and wave conditions.
Table 5 summarises the relationship between the drag coefficient, Reynolds number, and the range of reported drag coefficients. Table 6 outlines the relationship between and KC. The magnitude and sensitivity of the drag coefficient in relation to Re and KC vary significantly across different studies. These differences are likely due to variations in experimental setups and empirical formulae. However, a consistent trend can be noticed: the drag coefficient generally decreases as either Re or KC increases, indicating that seagrass may only have a limited wave attenuation performance under fully turbulent flow conditions, as illustrated in Figures 9, 10.
Table 5
| Reference | Flow type | Wave height (m) | Seagrass type | Species | Shoot density (shoot/m^2) | A | B | C | range | Note |
|---|---|---|---|---|---|---|---|---|---|---|
| (Koftis et al., 2013) | Irregular wave | 0.28-0.4 | Artificial (PVC foam, 0.903 GPa) | P. Oceanica | 180, 360 | 0 | 2400 | 0.77 | 0.8-1.96 | |
| (Hu et al., 2014) | Regular wave with current | 0.04-0.2 | Artificial rigid wooden cylinder | Not reported | 62-556 | 1.04 | 730 | 1.37 | 1.12-4.42 | |
| (Cavallaro et al., 2018) | Regular wave | 0.02-0.135 | Artificial (LDPE) | P. Oceanica | 1024 | 0.095 | 2550 | 3.05 | 0.2-16 | |
| (Chastel et al., 2020) | Irregular wave | 0.1-0.23 | Artificial (LDPE, 1.2 GPa) | P. Oceanica | 185, 370 | 1.56 | 1644 | 1.26 | 1-3 | |
| (Houser et al., 2015) | Regular wave | 0.05-0.2 | Artificial (Balsa wood, 5.3 GPa) | Thalassia testudinum | 405 | 1 | 7000 | 2.9 | 6-650 | |
| (Houser et al., 2015) | Regular wave | 0.05-0.2 | Artificial (Balsa wood, 3.3 GPa) | Thalassia testudinum | 405 | 0.001 | 7900 | 1.5 | 4-900 | |
| (Houser et al., 2015) | Regular wave | 0.05-0.2 | Artificial (Cable tie, 2.0 GPa) | Thalassia testudinum | 405 | 0.001 | 6900 | 1.6 | 3-50 | |
| (Houser et al., 2015) | Regular wave | 0.05-0.2 | Artificial (Polyethylene ribbon, 0.5 GPa) | Thalassia testudinum | 405 | 0.01 | 450 | 1.7 | 0.35-10 | |
| (Reis et al., 2024) | Regular wave | 0.08-0.16 | Artificial (Pine wood, 13.2 GPa) | – | 220, 440 | 0.82 | 1120 | 1.14 | 1.08-2.11 | Direct method |
| (Reis et al., 2024) | Regular wave | 0.08-0.16 | Artificial (Pine wood, 13.2 GPa) | – | 220, 440 | 0.79 | 1014 | 1.14 | 1.02-1.94 | LSM |
| (Reis et al., 2024) | Regular wave | 0.08-0.16 | Artificial (Sponged rubber, 0.00082 Gpa) | – | 220, 440 | 0 | 7735 | 0.13 | 1.13-1.24 | Direct method |
| (Reis et al., 2024) | Regular wave | 0.08-0.16 | Artificial (Sponged rubber, 0.00082 Gpa) | – | 220, 440 | 0 | 5265 | 0.33 | 1.2-1.51 | LSM |
Summary of empirical functions relating and Re (in the form of ) and the reported ranges of .
Table 6
| Reference | Flow type | Wave height | Seagrass type | Species | Shoot density (shoot/m^2) | A' | B' | C' | range | Note |
|---|---|---|---|---|---|---|---|---|---|---|
| (Sánchez-González et al., 2011) | regular/irregular wave | 0.03-0.13 | Artificial (polyethylene and polypropylene, 0.135-1.27 GPa) | Posidonia oceanica | 40000 | 0 | 17.68 | 1.09 | 0.01-1.1 | |
| (Chastel et al., 2020) | Irregular wave | 0.1-0.23 | Artificial (LDPE, 1.2 GPa) | P. Oceanica | 185, 370 | 2.23 | 30.1 | 1.37 | 0.7-3.2 | |
| (Reis et al., 2024) | Regular wave | 0.08-0.16 | Artificial (Pine wood, 13.2 GPa) | – | 220, 440 | 0.86 | 16.4 | 1.2 | 1.04-2.18 | Direct method |
| (Reis et al., 2024) | Regular wave | 0.08-0.16 | Artificial (Pine wood, 13.2 GPa) | – | 220, 440 | 0.83 | 14.8 | 1.24 | 0.98-2.0 | LSM |
| (Reis et al., 2024) | Regular wave | 0.08-0.16 | Artificial (Sponged rubber, 0.00082 Gpa) | – | 220, 440 | 1.09 | 22 | 5.56 | 1.09-2.09 | Direct method |
| (Reis et al., 2024) | Regular wave | 0.08-0.16 | Artificial (Sponged rubber, 0.00082 Gpa) | – | 220, 440 | 1.11 | 22.4 | 4.1 | 1.13-2.19 | LSM |
| (Hu et al., 2014) | Regular wave | 0.04-0.2 | Artificial rigid wooden cylinder | – | 62-556 | 0.87 | 14.74 | 0.72 | 1.09-2.42 | |
| (Hu et al., 2014) | Regular wave with current | 0.04-0.2 | Artificial rigid wooden cylinder | – | 62-556 | 1.17 | 7.77 | 1.25 | 1.2-2.13 |
Summary of empirical functions relating and KC (in the form of ) and the reported ranges of .
Figure 9
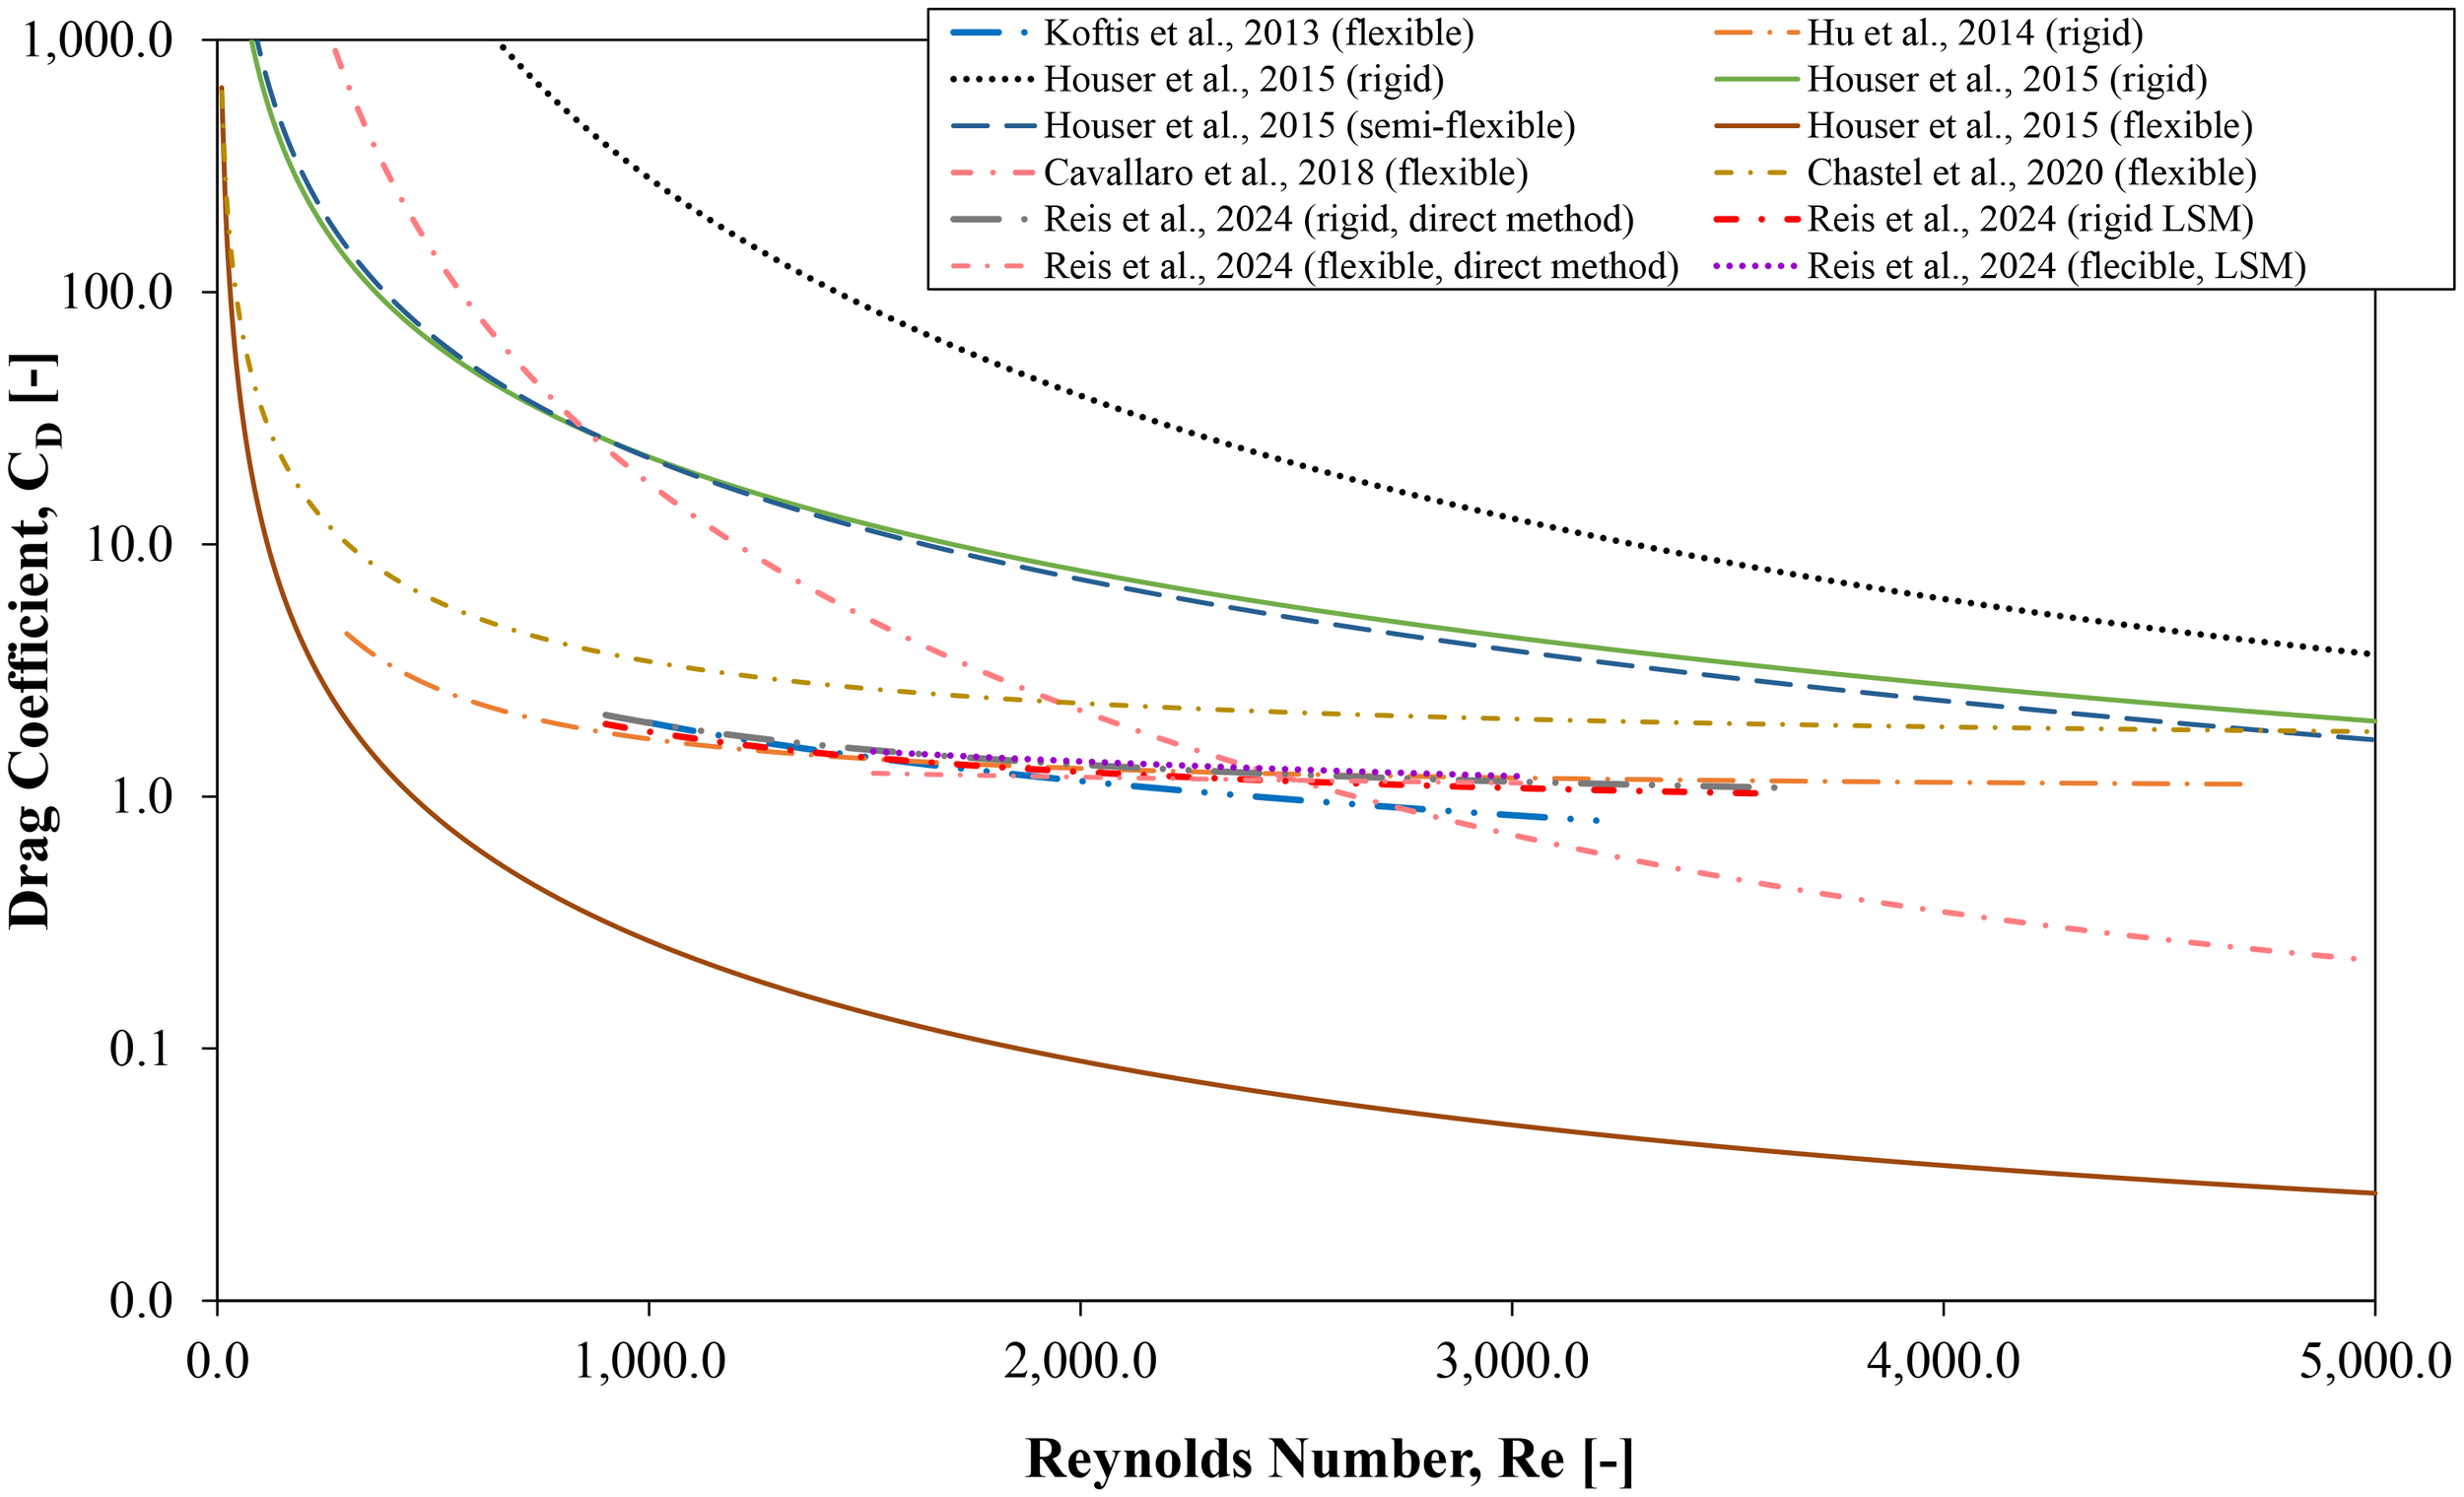
CD-Re relationship reported in the literature.
Figure 10
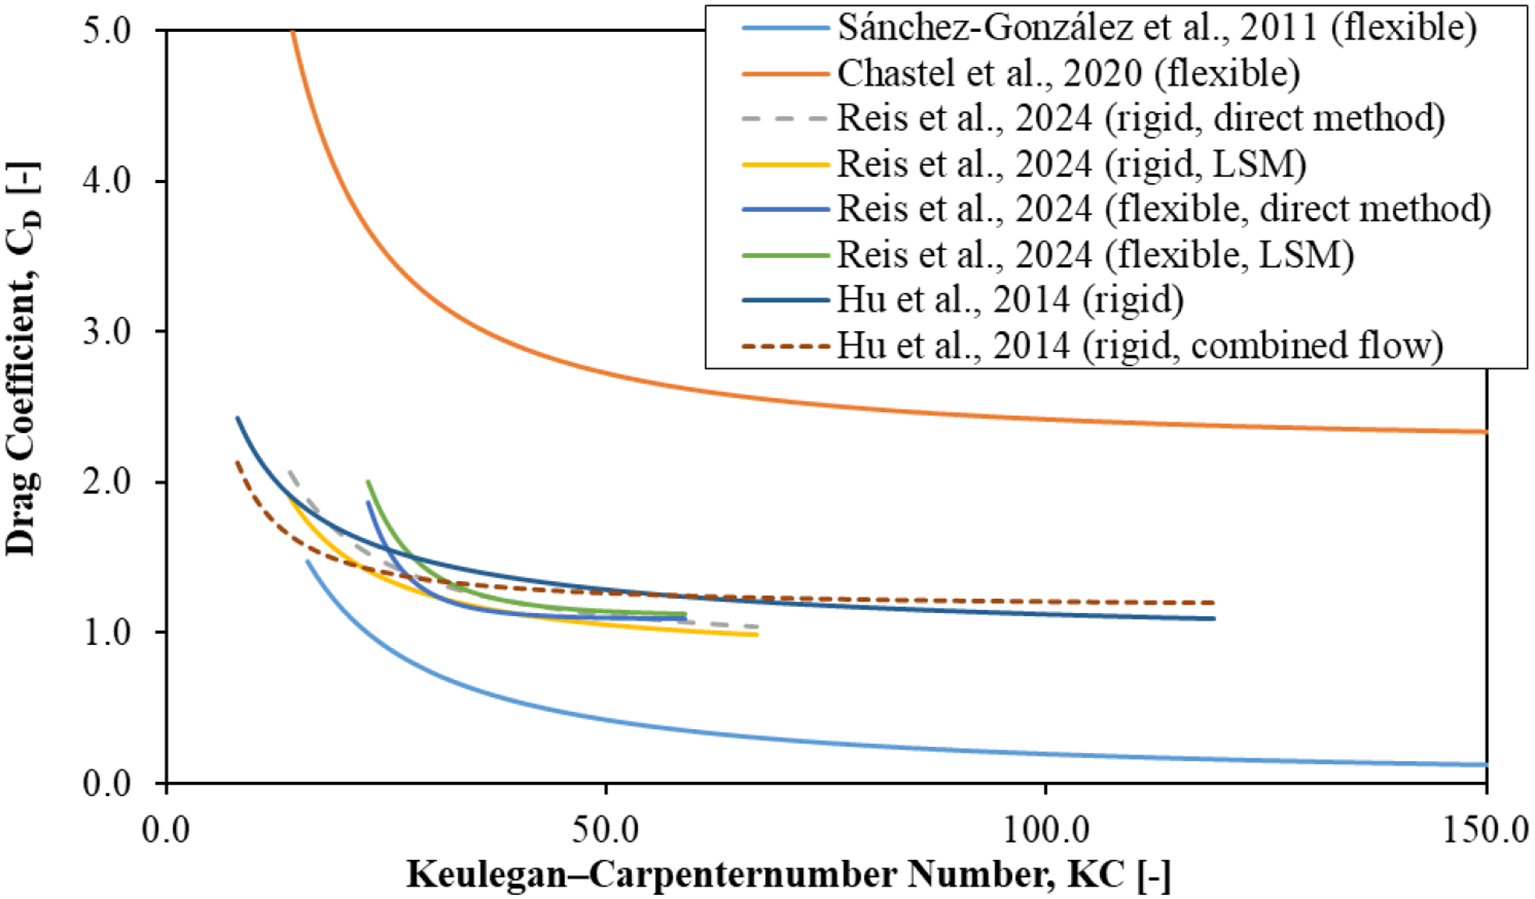
CD-KC relationship reported in the literature.
One of the shortages of Equation 12 is the lack of considering the internal properties of seagrass meadows, such as blade motion induced by wave action and blade flexibility. Several studies have attempted to incorporate these additional variables to provide a more comprehensive understanding. Zeller et al. (2014) defined a blade-bending excursion () as the length scale in KC to study the effects of blade bending. Then, the KC could be rewritten as , furthermore, a new formula is developed based on the numerical modelling and experiments, see Equation 13:
More recently, Liu et al. (2023) quantified the influences of wave nonlinearity, which could be expressed as Ursell number, on wave attenuation performance of submerged vegetation based on lab-scale experiments and numerical modelling and proposed a novel empirical formula for the drag coefficient and the modified Keulegan-Carpenter number () incorporating the influences of wave nonlinearity and vegetation flexibility, given as Equation 14:
in which, is the critical value separating the rigid and flexible elements; more specifically, represents the rigid mimics without swaying motion while represents the flexible mimics with reconfiguration under wave effects. The higher leads to more flexible elements. is expressed as Equation 15 to consider the influence of wave nonlinearity, and Table 7 gives the range of corresponding to the vegetation flexibility, which can then be applied to calculate the range of .
Table 7
| Reference | Flow type | Wave height | Vegetation type | Flexibility | Shoot density (shoot/m^2) | Range of | range |
|---|---|---|---|---|---|---|---|
| (Liu et al., 2023) | Regular wave | 0.08-0.16 | Artificial (Birch, 9.51 Gpa) | Rigid | 1012 | 75-230 | 1.08-2.11 |
| Artificial (PTFE, 1.34 Gpa) | Semi-flexible | 1012 | 75-230 | 1.05-7.64 | |||
| Artificial (PU, 0.16 Gpa) | Flexible | 1012 | 75-230 | 1.66-4.08 |
Range of the and for predicting drag coefficient with vegetation flexibility (Liu et al., 2023).
Twomey et al. (2020) analysed the drag coefficients from 11 published studies that provided sufficient original experimental data. They then used these drag coefficients to estimate the wave attenuation, specifically focusing on wave height reduction in various scenarios. Table 8 presents the calculated drag coefficients from four of these studies, as noted by Twomey et al. (2020). The research found that seagrass characteristics (such as canopy height, shoot density, and meadow length) and wave conditions, including water depth and wave period, significantly influence seagrass-induced wave attenuation. More specifically, an increase in wave period and a decrease in water depth contribute to more significant reductions in wave height. The increases in canopy height, shoot density, shoot width, and meadow length all lead to enhanced wave attenuation.
Table 8
| Reference | Flow type | Wave height (m) | Seagrass type | Species | Shoot density (shoot/m^2) | range |
|---|---|---|---|---|---|---|
| (John et al., 2015) | Regular wave | 0.08-0.16 | Artificial (Polyethylene, 0.6 gpa) | Enhalus acoroides | 10000 | 0.07-0.15 |
| (Weitzman et al., 2015) | Regular wave with/without current | Not reported | Artificial (LDPE) | Thalassia testudinum | Not reported | 0-0.09 |
| (Stratigaki et al., 2011) | Regular wave | 0.39-0.43 | Artificial (PVC foam, 0.903 gpa) | P. Oceanica | 180, 360 | 0.33-0.71 |
| (Manca et al., 2012) | Regular/irregular wave | 0.22-0.46 | Artificial (PVC foam, 0.9 gpa) | P. Oceanica | 180, 360 | 0.7-2.77 |
Summary of the range of calculated from laboratory-scale measurements of seagrass-induced wave attenuation in turbulent flow, (Twomey et al., 2020).
Reprinted from Twomey et al., 2020, with permission from Elsevier under license 6112140328770.
3.2.2 Wave attenuation coefficient
11.7% of experimental studies evaluate seagrass-induced wave attenuation by reporting the wave attenuation coefficient (), which could be calculated from wave height measurements. The definition and relevant empirical formulas have been introduced in Section 3. Therefore, this section is mainly focused on how the factors influence the seagrass-induced wave attenuation. Notably, the submergence ratio and shoot density are considered essential parameters affecting the wave attenuation (Figure 7). In general, higher stem density and a greater submergence ratio, indicating a larger portion of the water column occupied by seagrass, result in increased wave attenuation. However, the wave dissipation can be negligible when the submergence ratio is lower than 0.2 (Chastel et al., 2020).
Figure 11 shows the relationship between the wave attenuation coefficient and dimensionless water depth kh, including three types of seagrass mimics: regular and irregular wave conditions. Even though the seagrass species, meadow length, and wave characteristics differ from each other, in general, the wave attenuation coefficient decreases as the dimensionless water depth increases, i.e., the larger the dimensionless water depth, the lower the wave attenuation, which indicates that the seagrass-induced wave attenuation mainly happens in shallow water conditions (kh<1). This may be because the wave-induced characteristic velocity acting on seagrass blades drives the seagrass-induced drag, which is stronger in shallow water conditions, as the seagrass canopy could occupy a larger proportion of the water column (Manca et al., 2012).
Figure 11
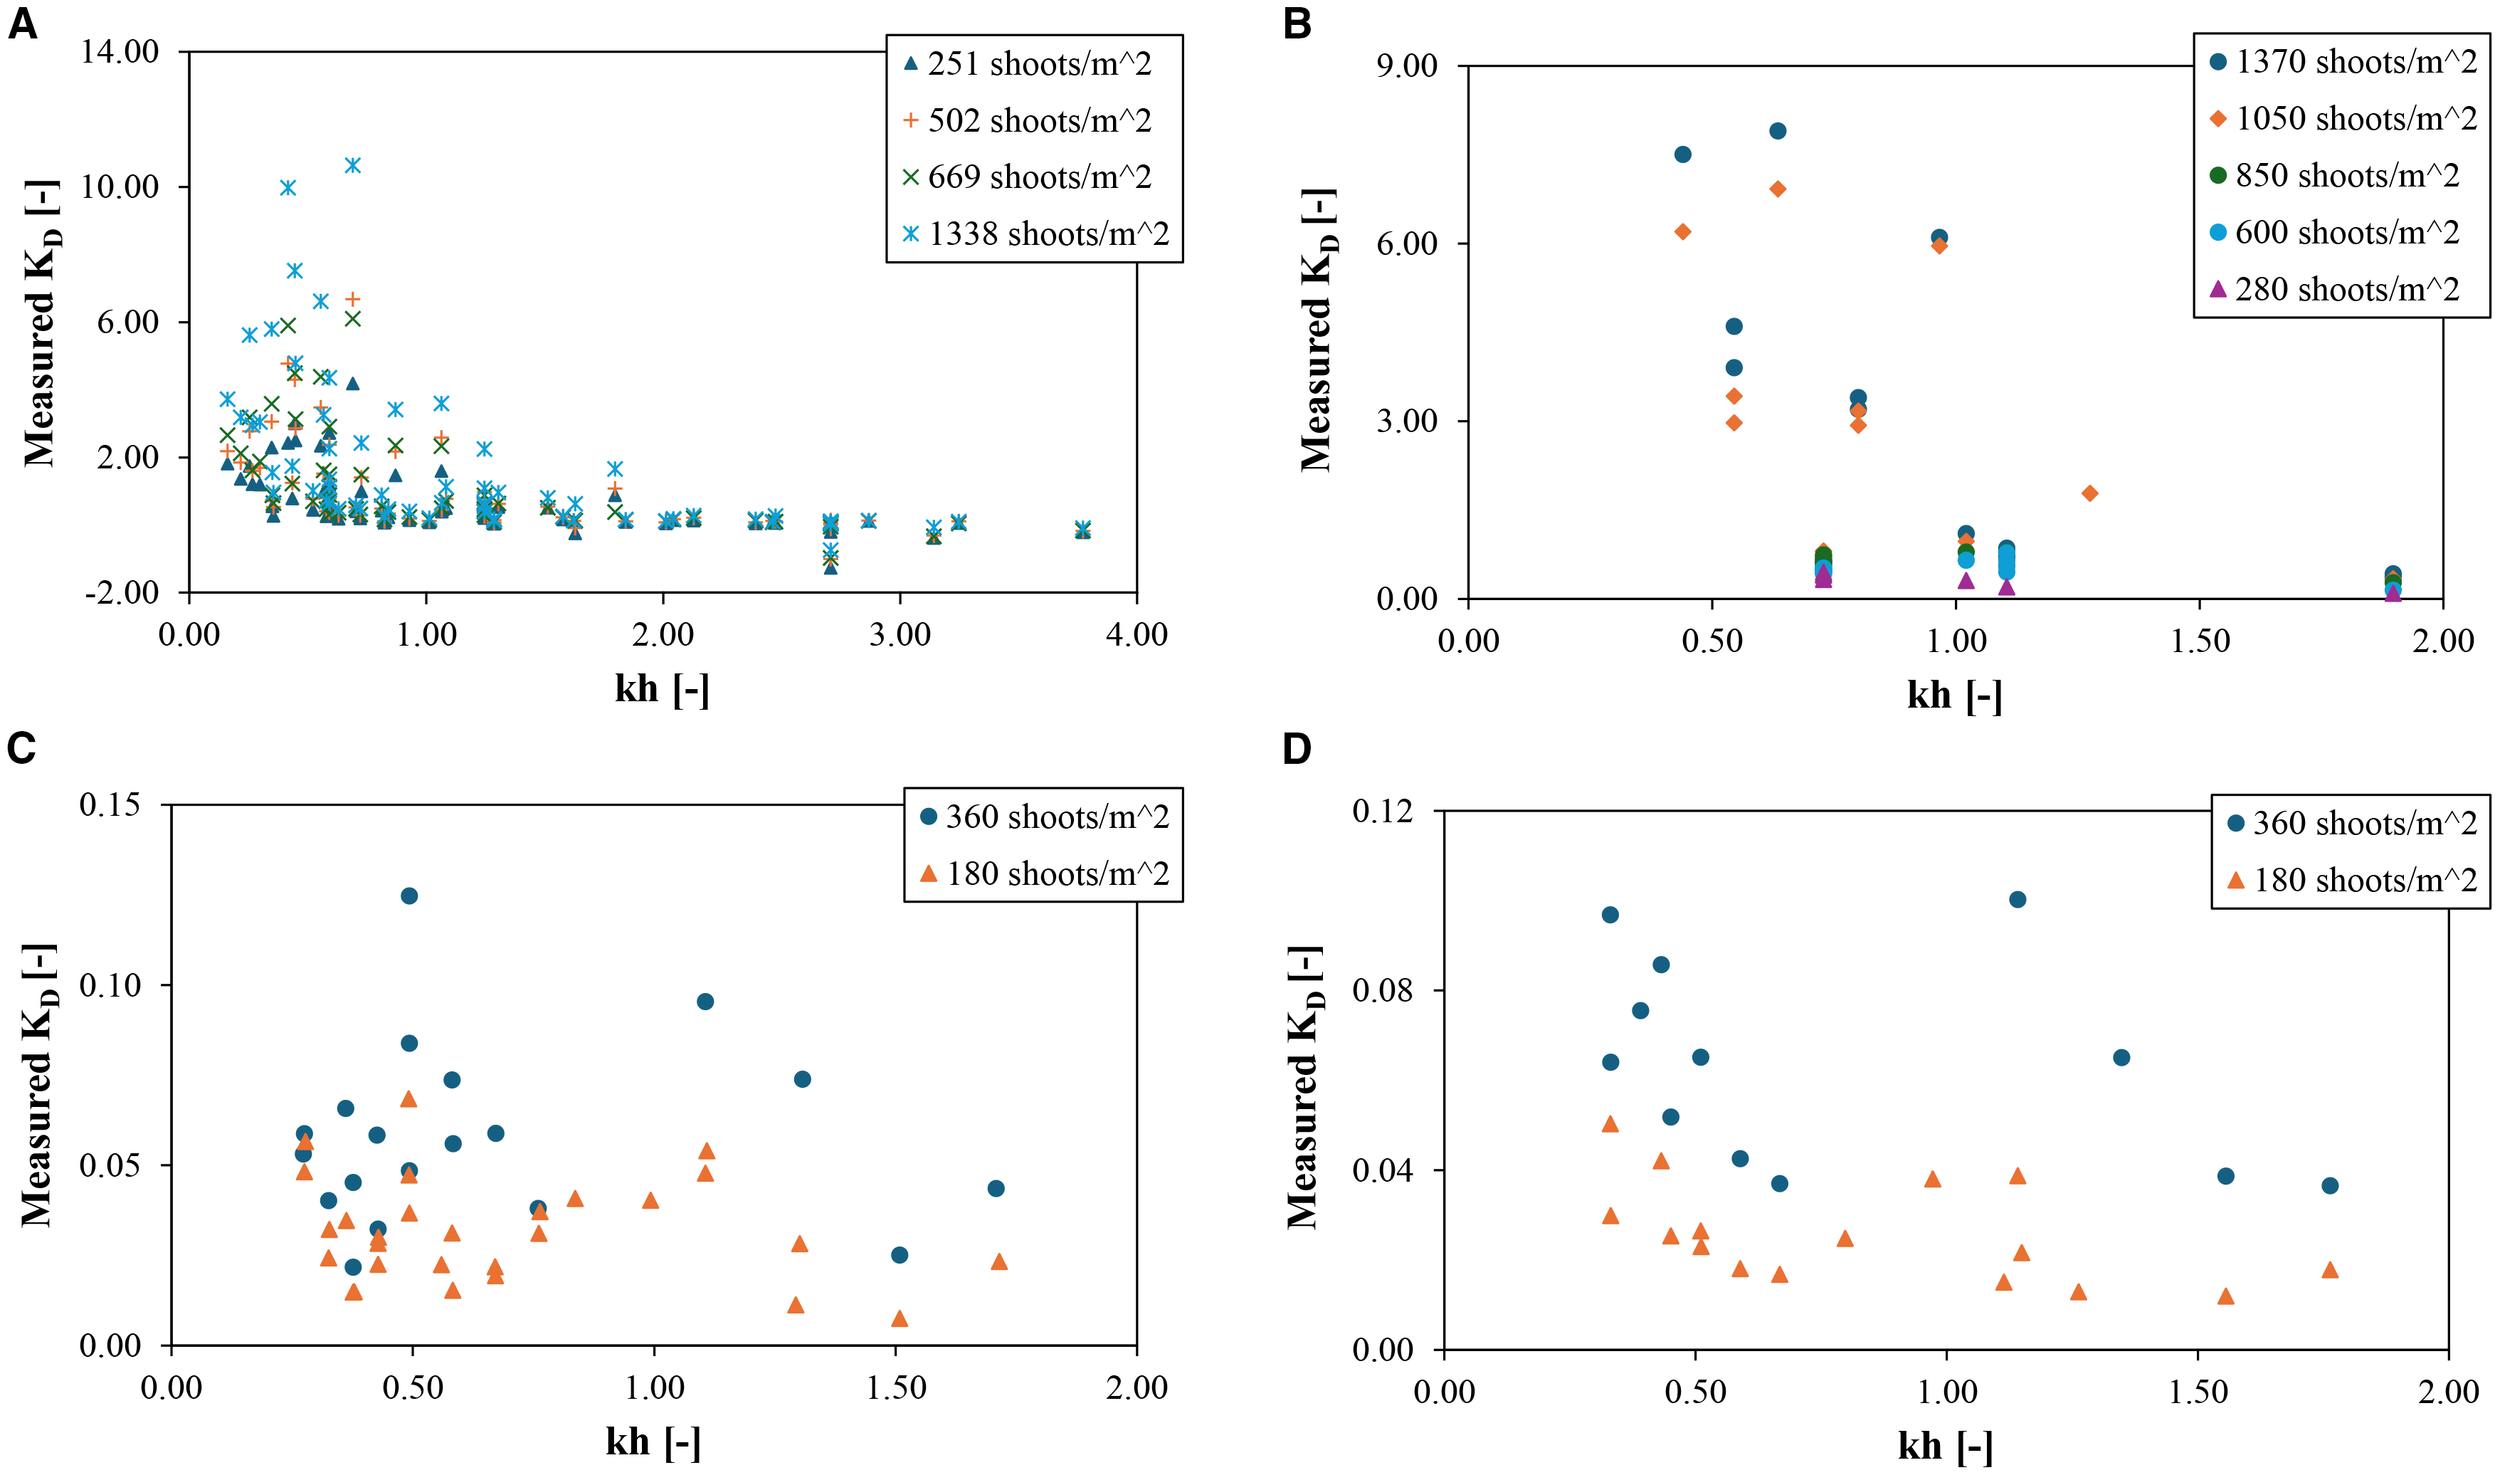
Relationship between KD and kh of seagrass meadow. (A) 4m seagrass meadow composed of idealised seagrass mimics (regular waves) (Vettori et al., 2024); (B) 5m seagrass meadow composed of idealised seagrass mimics (regular waves) (Lei and Nepf, 2019a); (C) 10.7m seagrass meadow composed of full-scale P.oceanica mimics (regular waves) (Manca et al., 2012); (D) 10.7m seagrass meadow composed of full-scale P.oceanica mimics (irregular waves) (Manca et al., 2012).
The influence of shoot density on wave attenuation can also be concluded (Figure 11). In general, the wave attenuation coefficient increases with the increase of shoot density; e.g., the higher shoot density contributes to a stronger wave attenuation coefficient. Notably, the influences of shoot density on seagrass-induced wave attenuation are much more significant in shallow than in deep water conditions. It is noted that the negative value of the wave attenuation coefficient appears when kh is between 2 and 3, which indicates that the existence of seagrass meadows increases wave height. This contradicts the existing conclusions and may be caused by experimental measurement errors.
By comparing the variation of the wave attenuation coefficient with the submergence ratio () of seagrass meadow, including two scaled experimental studies (Figures 12A, C) and a full-scale experimental study about P.oceanica (Figure 12B), it could be concluded that the wave attenuation coefficient positively correlates with the submergence ratio, i.e., the larger the submergence ratio leads to a higher the wave attenuation coefficient. However, it is important to note that the measured in full-scale experiments is significantly lower than that observed in scaled experiments. This disparity suggests that scaled laboratory experiments may substantially overestimate the seagrass-induced wave attenuation.
Figure 12
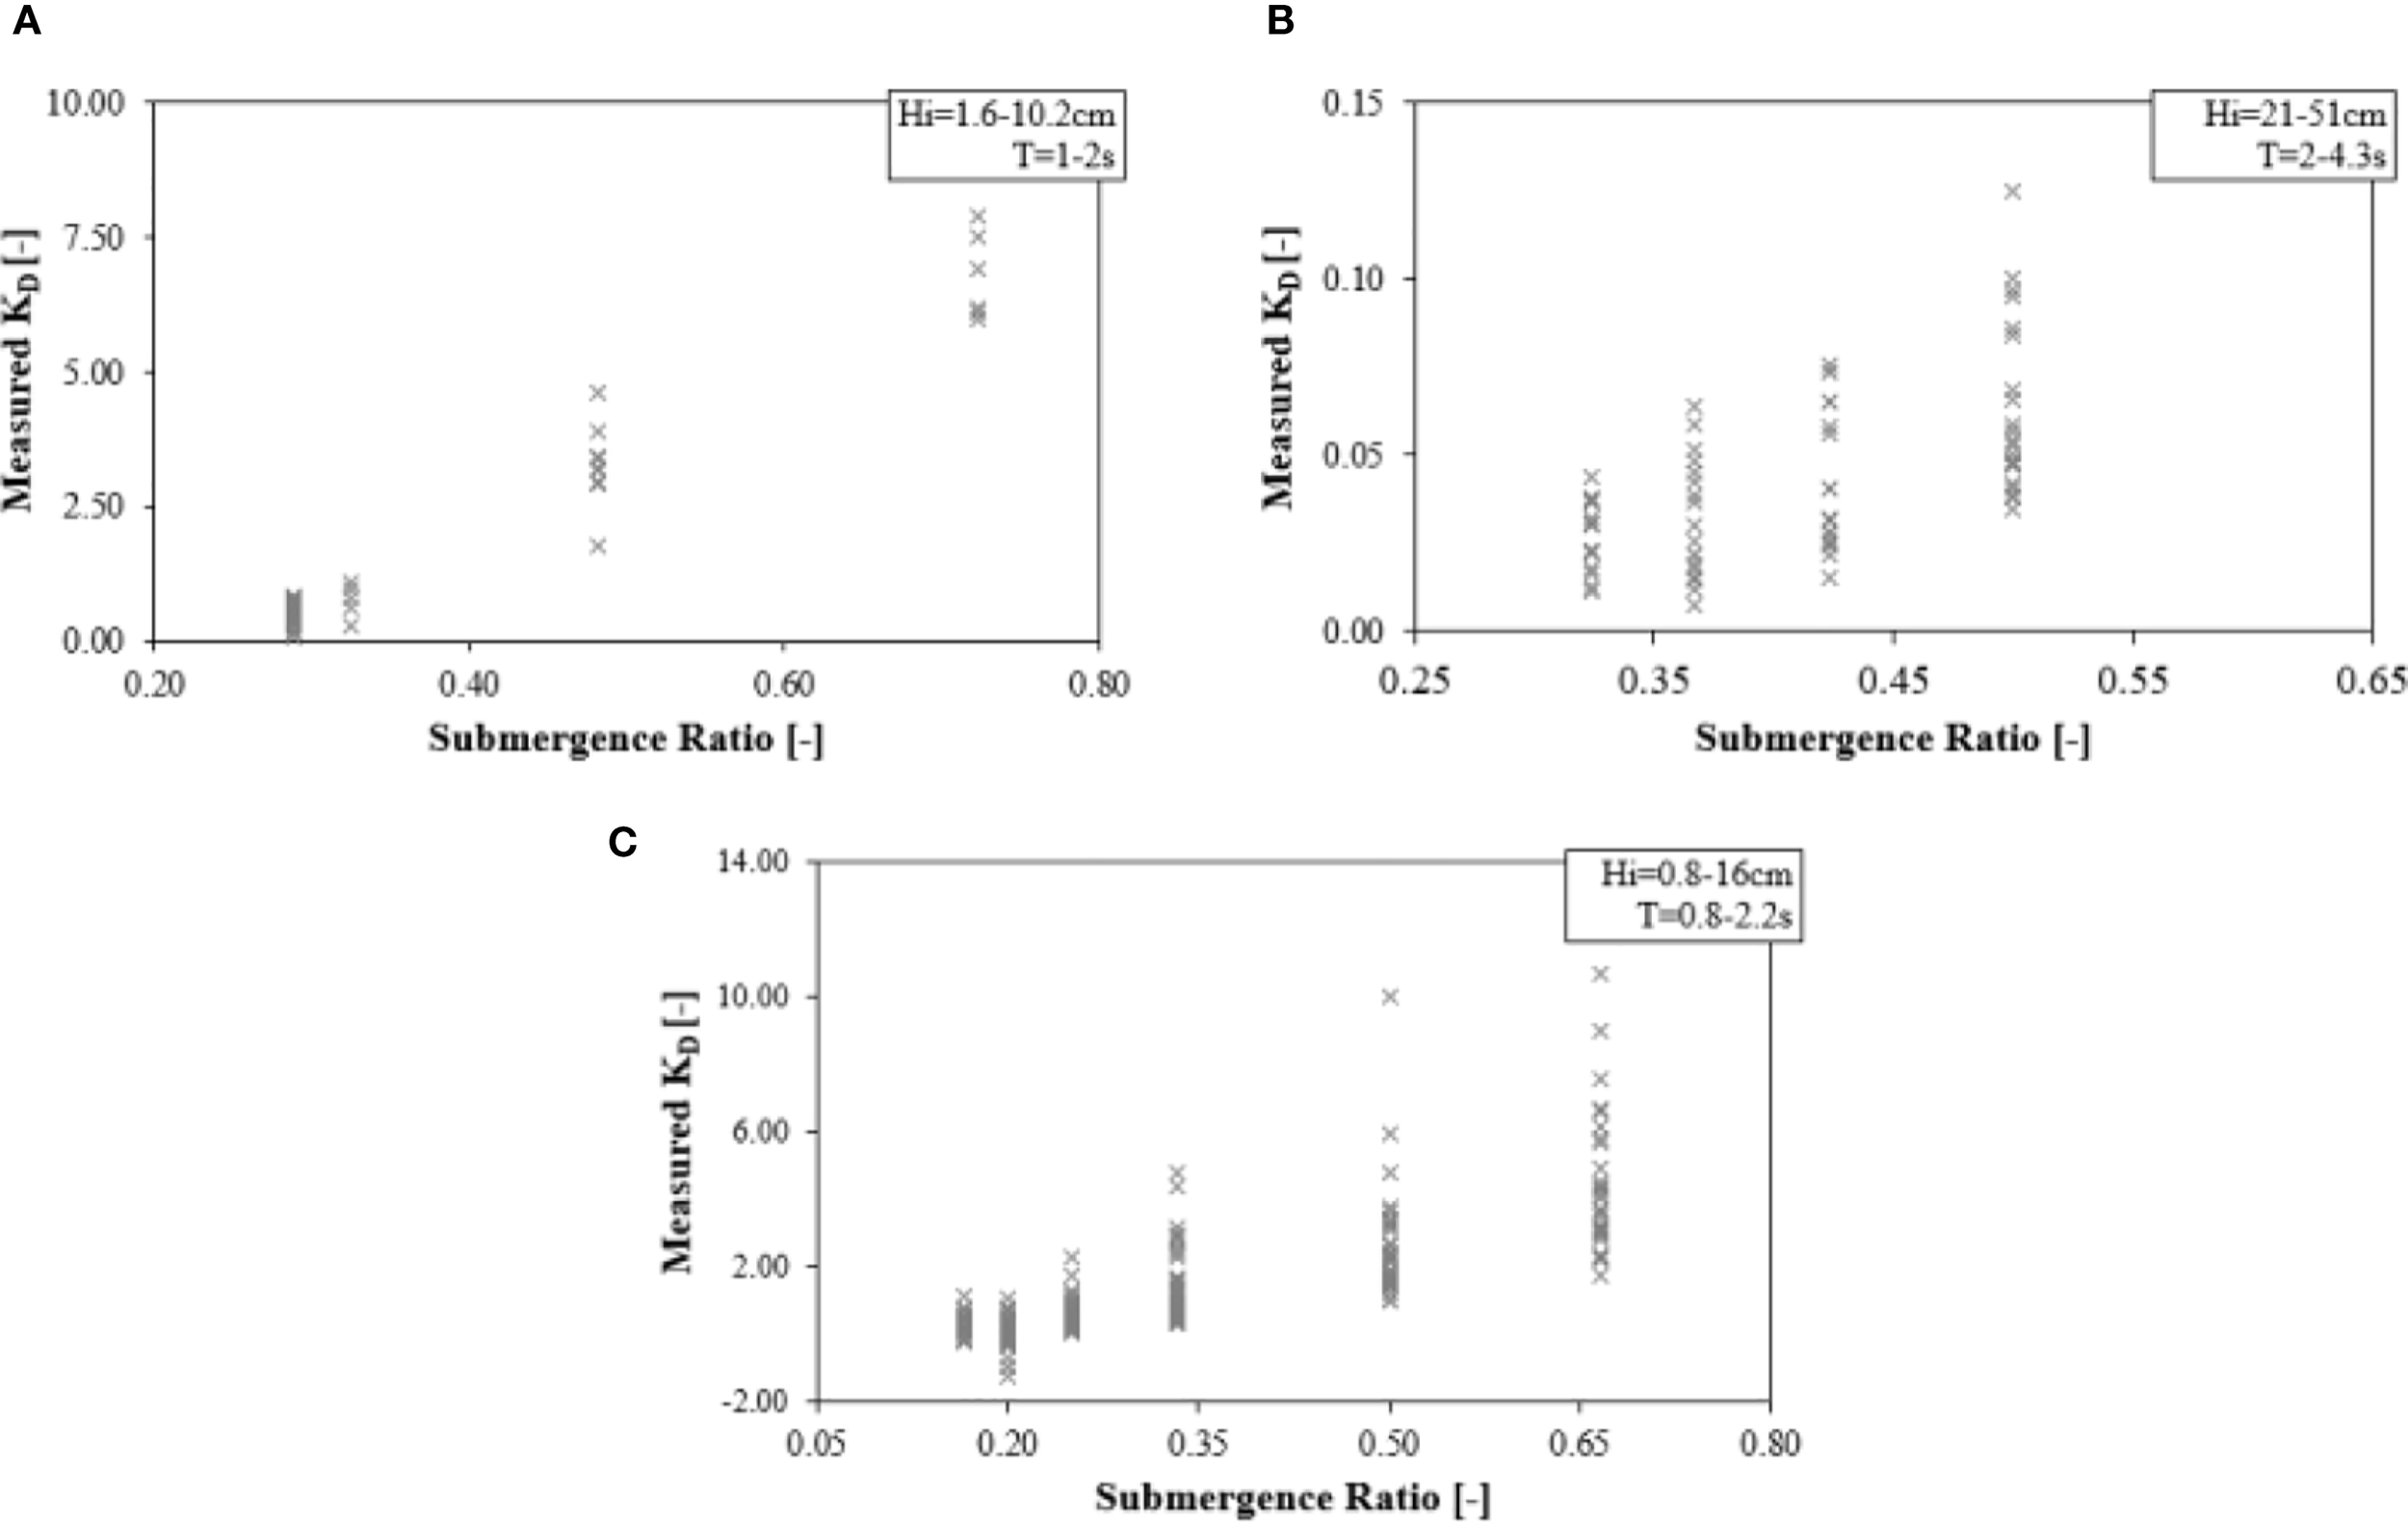
Relationship between the KD and submergence ratio. (A)Lei and Nepf (2019a); (B)Manca et al. (2012); (C)Vettori et al. (2024).
3.2.3 Wave transmission coefficient
The wave transmission coefficient is defined as the ratio between wave height (or amplitude) at x distance from the beginning of the meadow to the incident wave height (amplitude), as in Equation 16. The higher the transmission coefficient, the lower the wave decay of the canopy. Table 9 illustrates the wave transmission ratio reported in the literature.
Table 9
| Wave type | Wave height (m) | Shoot density (shoots/m^2) | Seagrass type | Species | Meadow length (m) | Lowest | Ref |
|---|---|---|---|---|---|---|---|
| Regular | 0.08-0.16 | 10000 | Artificial (polyethyne, 0.6GPa) | E.acoroides | 2 | 50% | (John et al., 2015) |
| Irregular | 0.28-0.4 | 180, 360 | Artificial (PVC, 0.903GPa) | P.oceanica | 10.7 | 65% | (Koftis et al., 2013) |
| Regular | 0.009-0.056 | 300-1800 | Artificial (LDPE, 0.32GPa) | Z.marina | 5 | 50% | (Luhar et al., 2017) |
| Regular and irregular | 0.21-0.51 | 180, 360 | Artificial (PVC foam, 0.9GPa) | P.oceanica | 10.7 | 75% | (Manca et al., 2012) |
| Regular | 0.08-0.16 | 220, 440 | Artificial (Pine wood and sponged rubber) | Idealised vegetation | 5 | 55% | (Reis et al., 2024) |
| Regular and irregular | 0.03-0.13 | 40000 | Artificial (polyethyne and polypropylene, 0.0135-1.27GPa) | P.oceanica | 9 | 33% | (Sánchez-González et al., 2011) |
| Regular | 0.39-0.43 | 180, 360 | Artificial (PVC foam, 0.903GPa) | P.oceanica | 10.7 | 65% | (Stratigaki et al., 2011) |
| Irregular | 0.1-0.23 | 185, 370 | Artificial (LDPE, 1.2GPa) | P.oceanica | 12.15 and 22.5 | 40% | (Chastel et al., 2020) |
| Regular | 0.04-0.12 | 1111 | Artificial | Idealized vegetation | 2 | 70% | (Magdalena et al., 2022) |
Wave transmission coefficient reported from different studies.
Additionally, the wave attenuation over seagrass meadow can also be described as the exponential function given by Kobayashi et al. (1993) or the expression introduced by Mendez and Losada (2004), as Equation 17:
in which, is recognised as the wave decay coefficient.
Based on the experimental study, Koftis et al. (2013) reported a range of from 0.005 to 0.035, and studied the influences of submergence ratio and stem density on wave decay over the canopy. It is found that the 50% increase in submergence ratio, the 100% increase in stem density and the 100% increase in peak wave period led to the 117%, 80% and 115% increases of , respectively. By applying the exponential function, Manca et al. (2012) reported the range of wave decay coefficient from 0.004 m–1 to 0.025 m–1 and 0.035 m–1 to 0.09 in irregular and regular wave conditions, respectively. It is found that the wave decay coefficient positively correlates with stem density, submergence ratio, and wave period both in irregular and regular wave conditions.
Additionally, Paul et al. (2012) defined a dissipated wave height per meter of the canopy by assuming the linear wave dissipation along the submerged canopy, as shown in Equation 18. It is found that the increase of submergence ratio leads to the higher wave dissipation for the shoot density higher than 2000 shoots per meter square. The existence of current is found to reduce the wave dissipation performance of the submerged canopy.
3.2.4 Wave energy dissipation
Wave energy dissipation ratio can be defined as the reduction in wave energy density through seagrass meadow, Hemavathi and Manjula (2020a), Hemavathi and Manjula, 2020b, Hemavathi and Manjula, 2020c adopted a standard formula (as Equations 19, 20) developed by Fonseca and Cahalan (1992) to calculate the wave energy dissipation ratio over a 1m length seagrass meadow and quantitively studied the influence of water depth, wave period, shoot density and bed roughness factor on wave energy dissipation ratio by employing response surface methodology (RSM). It is found that although all these four factors affect significantly, water depth is the most critical factor.
Hemavathi and Manjula (2021) observed that a seagrass meadow with an area of 0.3 m² was capable of absorbing an average of 25% (11-40%) of wave energy. This finding was based on an experimental study involving a Posidonia oceanica meadow situated on a 1:5 sloped sand bed under regular and irregular wave conditions.
Furthermore, based on the assumption of exponential wave height decay, the wave energy dissipation factor () calculated from the wave energy loss could be employed to describe the friction caused by the vegetated bed, which is considered a rough bed. Jonsson (1966) gives the expression of wave energy dissipation factor under regular wave conditions, as Equation 21.
in which, represents the theoretical stream velocity at the top of the submerged seagrass canopy according to the 2nd wave theory. is the rate of energy dissipation per unit area.
For irregular waves, it is challenging to calculate the wave dissipation factor directly because the wave dissipation rate varies amongst the different spectral components. To quantitatively assess the dissipation rate across different spectral components, Manca et al. (2012) analysed wave energy dissipation at all components of the wave spectrum, utilising the method developed by Madsen et al. (1988). Based on the assumptions of 1) all waves of all frequencies propagate in the same direction, 2) linear wave theory can be applied, the wave dissipation factor of jth spectral component () can be calculated as Equation 22:
in which, is the representative wave-induced velocity calculated from the local spectral densities and discrete frequency bandwidth (). is the horizontal wave-induced velocity of the jth spectral component.
It is found that the largest happens around the peak frequencies of the wave energy spectrum (Manca et al., 2012), which proves that the majority of wave energy is lost at the peak frequency; thus, to simplify the calculation, the wave energy dissipation factor at the peak frequency can be considered as the representative of the wave energy dissipation factor for irregular waves by applying the same method with . Manca et al. (2012) reported that a substantial portion of wave energy dissipation occurred within the first 17% of the seagrass meadow length (at the peak frequency), compared to the remaining extent of the meadow ( at the peak frequency), and the efficiency of P.oceanica meadow in reducing wave energy decreases as the wave height increases.
3.2.5 Turbulent kinetic energy
There has been growing interest in the evolution of turbulence across seagrass meadows to understand the local hydrodynamics and further discover the mechanism of wave attenuation, transport and residence of the dissolved particles and suspended sediments. Generally, the turbulent kinetic energy (TKE) can be directly calculated from the water velocity measurements. The Eulerian velocity field is defined as (u, v, w) in the (x, y, z) directions, respectively. The time-averaged turbulence energy, defined as the average across all phase bins, can be calculated as Equation 23:
It is widely acknowledged that vegetation drag dissipates wave energy as it propagates over the canopy (Dalrymple et al., 1984) by converting it to turbulent kinetic energy within the meadow (Pujol and Nepf, 2012). Two different scales of turbulence have been identified: stem-generated turbulence, which occurs in the wakes of plants when the Reynolds number based on the stem diameter (or blade width) is larger than 100 (Tanino and Nepf, 2008; Nepf, 1999); and canopy-scale turbulence, which is induced by the shear layer at the top of the canopy due to the drag discontinuity and transmitted downward (Ghisalberti and Nepf, 2002). Additionally, some studies also reported the transmission of turbulence generated above the canopy downward, which is damped by the canopy drag (Pujol et al., 2010; Pujol and Nepf, 2012). It has been reported that the damping of vegetation contributes to the faster dissipation of TKE generated by wave breaking (Pujol and Nepf, 2012). The stem-generated turbulence due to wave orbital velocity is found to strengthen the near-bed TKE, which can reach twice as high as the bare bed (Zhang et al., 2018). However, the effects of canopy characteristics on turbulent kinetic energy (TKE) and the relationship between wave attenuation and TKE remain to be discovered.
Recently, El Allaoui et al. (2016) experimentally studied the turbulence mixing level within a fragmented canopy (the ratio of TKE within the fragmented canopy to the untapped canopy) with different gap areas and proposed an empirical equation for estimating the TKE of a fragmented canopy (), see Equation 24:
in which, represents the total gap area in the fragmented canopy while represents the total vegetated area. It was found that the turbulence mixing level positively correlates with the ratio of gap areas to the vegetation area, and the larger gaps for the same total gap area lead to a higher turbulence mixing level.
Furthermore, to quantitively study the sheltering effects of the fragmented canopy on the particle and nutrient fluxes, El Allaoui et al. (2016) studied TKE at 5cm above the flume bed based on the experimental measurements. Two length scales were introduced to characterise the features of canopy fragmentation: the ratio between the minimum distance to the nearest canopy boundary () and the plant-to-plant spacing, and the ratio of wave excursion to the gap width (). The higher indicates the stronger sheltering due to the nearby vegetation, while the higher reflects the lower penetration, as shown in Figure 13. The turbulence mixing level was found to be negatively correlated to these two scales. More specifically, the Equation 25 was generated to describe the TKE at 5cm above the flume bed with seagrass meadow:
Figure 13
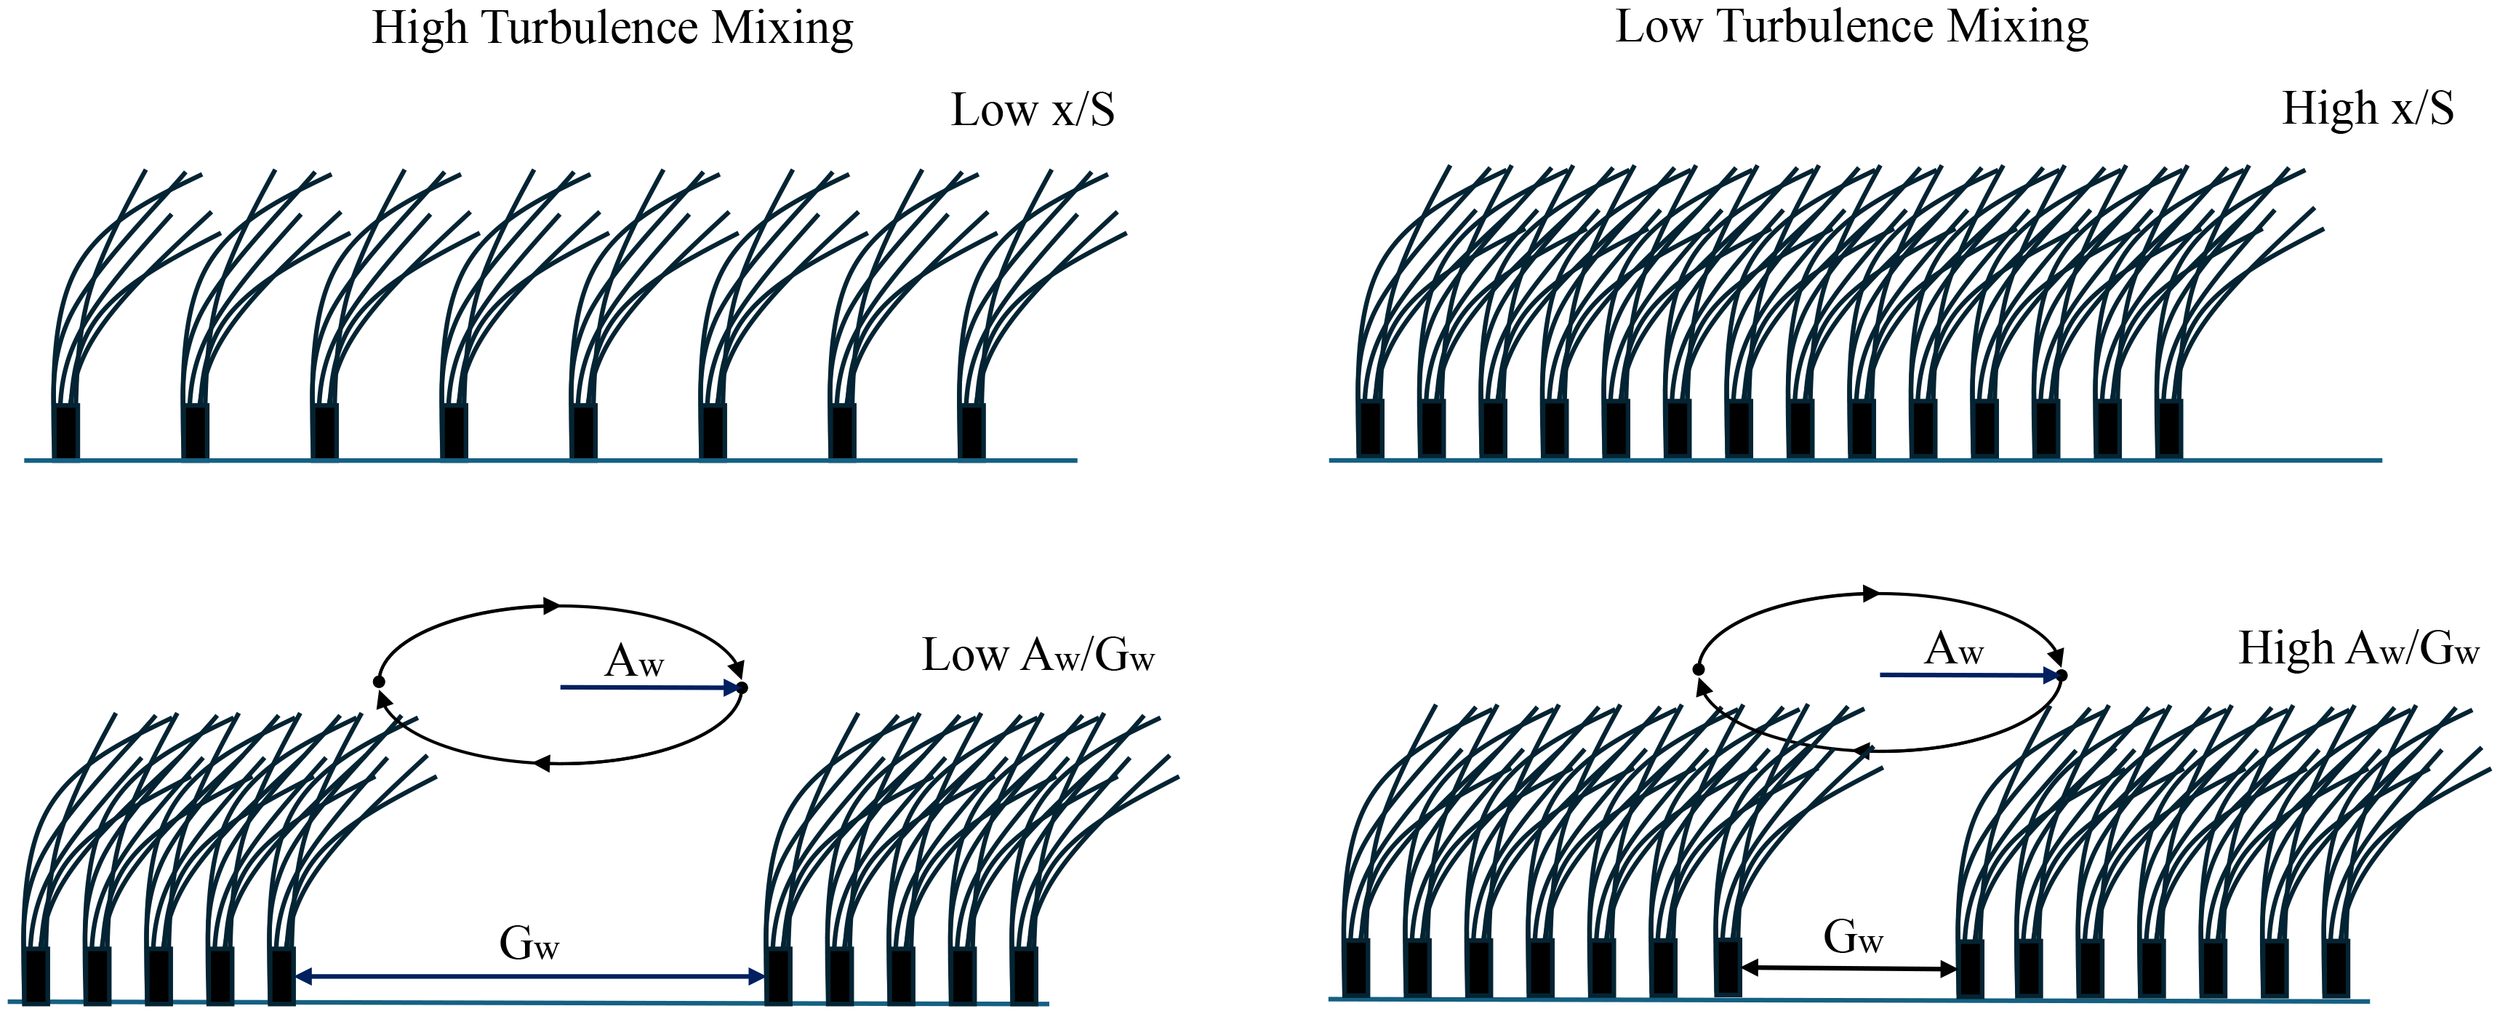
Schematic of the relationship between turbulence mixing and two length scales, adapted from El Allaoui et al. (2016), licensed under CC BY 4.0.
where represents the gap width, S represents the plant-to-plant distance, is wave orbital excursion length ().
Owing to the blades' motion, the relative velocity between flexible blades and the surrounding waves is reduced compared to the relative motion between the stem and the waves. This results in distinct turbulence characteristics in the blade and stem regions. In a more recent study, Zhang et al. (2018) conducted an experimental investigation to examine the turbulence characteristics within flexible Z.marina mimics in near-bed (stem) and canopy regions. It is found that the success of vegetation-induced turbulence in enhancing the turbulence level within the meadow is driven by the ratio () of wave excursion to the stem centre-centre spacing (). The authors developed two empirical equations by modifying the turbulent kinetic energy (TKE) model for unidirectional flow through an emergent rigid canopy, originally proposed by Tanino and Nepf (2008), to predict TKE in the blade and stem regions, respectively. For stem region, as Equation 26:
in which represents the spatial averaging operation. , the drag coefficient is set as 1.4 for KC=20 to 60. is a new scale constant for the stem region in oscillatory flow calculated by linear fitting, which is equal to in this case. is the solid volume fraction in the stem region. It was found that turbulence generated in the stem region can significantly affect the entire canopy volume when wave orbital excursions are sufficiently large (). Additionally, the intensity of turbulent kinetic energy (TKE) exhibits a positive correlation with both wave velocity and the stem's solid volume fraction. However, the stem-generated turbulence can only affect the water parcels nearest the stem region when , in this case, Equation 26 overestimates the turbulence.
Equation 27 is generated for the flexible blade region, where shoot density is replaced by blade density (six times the shoot density for Z.marina mimics), and stem diameter is replaced by blade width. as suggested by Luhar and Nepf (2016). Scale constant () is set as by linear fitting. The blade spacing is estimated from the shoot density setups as .
It was found that blade motion results in a lower relative velocity between blade and wave, which leads to a lower TKE level in the canopy region than in the stem region. TKE within the canopy can be enhanced by the vegetation when (, in which condition the wake generation is considerable.
Furthermore, Zhang et al. (2018) developed an empirical equation to estimate the canopy's TKE by wave attenuation measurements (see Equation 28). This model is based on several key assumptions: 1) the generation of plant wakes primarily drives meadow TKE, 2) wave energy dissipates in the form of turbulence within the meadow, 3) turbulent energy cascades locally to the dissipation scale, and 4) the viscous dissipation rate is equivalent to the wave energy dissipation rate.
It is worth pointing out that although the drag coefficient is not required for Equation 28, the wave attenuation measurements may not be feasible for very short meadows; in this situation, Equations 26, 27 may be more suitable, which requires an estimation of the drag coefficient and the characteristics of the canopy (density, canopy height, etc.).
3.2.6 Wave-induced flow reduction
Some studies also reported the flow attenuation parameter as the index in evaluating the wave attenuation performance of seagrass meadows. Manca et al. (2012) defined an in-canopy flow attenuation parameter in regular wave conditions as the ratio of the Root-mean-square value of the horizontal orbital velocity downstream of the canopy to the value at the beginning of the canopy, as Equation 29:
For irregular waves, the frequency-dependent flow attenuation parameter can be calculated for each frequency component of the spectrum, the sum of which is named the spectral orbital velocity (). The flow attenuation parameter can be obtained by the ratio of normalising spectral orbital velocity to the value measured at the beginning of the canopy, as Equation 30:
It was found that 1) the increase in canopy density leads to a higher flow attenuation, 2) the increase in wave amplitude contributes to the lower flow attenuation, and 3) the flow attenuation in irregular waves has the same trend as in regular waves. Serra et al. (2018) and Pujol et al. (2013) reported that the flexible seagrass mimics have lower flow attenuation than the rigid blades, which can reach a maximum of 40% reduction depending on the experimental setting.
Compared with velocity attenuation, more studies adopted the wave-induced mean velocity profile in the vertical direction to reveal the flow attenuation performance of seagrass meadows along the length of the canopy (van Rooijen et al., 2020; El Allaoui et al., 2015; Abdolahpour et al., 2018; Abdolahpour et al., 2017a; Abdolahpour et al., 2017b; Luhar et al., 2010), and to study the hydrodynamics of seagrass meadow in the oscillatory flow which is also contributes to discovering the behaviours of sediment resuspension and the transport of nutrients etc.
3.3 Seagrass-induced wave attenuation under the combined effect of waves and currents
Most studies focus on seagrass-induced wave attenuation under pure wave-driven flow, which helps to understand the fundamental interaction between seagrass and wave effects by simplifying the natural environment. However, most seagrass species are affected by the combined flow of waves and tidal flow in the real world (Paul et al., 2012; Paul and Gillis, 2015). In the past decade, a few studies (5 out of 43) were conducted to discover the wave attenuation performance of seagrass meadows under the combined effect of waves and currents.
Based on experimental studies and the direct force measurement method (see Section 4.1), Hu et al. (2014) investigated the effects of currents on wave attenuation induced by rigid plant mimics and reported the corresponding drag coefficient. Their findings indicate that the impact of background currents on wave energy dissipation depends on the ratio of current velocity to wave horizontal orbital velocity (hereafter referred to as RCW). Specifically, vegetation-induced wave attenuation is enhanced when RCW < 0.65 (indicating weak currents), while it decreases when RCW > 1.25 (indicating strong currents). Chen et al. (2018) reanalysed Hu et al (2014) experimental data using both direct and calibration methods, revealing that the relationship between the drag coefficient and the Keulegan–Carpenter (KC) number can be expressed in the form of Equation 12 and shows a similar decreasing trend to that observed in wave-driven flow.
More specifically, the presence of currents can affect the recognition of seagrass blades (Paul et al., 2012), subsequently altering the wave attenuation induced by seagrass. Under current-driven flow, flexible blades tend to adopt a mean streamwise deflection, reducing their frontal area and adopting a more streamlined shape, which results in a diminished drag effect (Beth Schaefer and Nepf, 2022; Luhar and Nepf, 2011). Under wave-driven flow, especially short waves (wave orbital excursion is equal to or smaller than the blade length), the flexible blades can move with the fluid motion, reducing the relative velocity between water and blade and then reducing the drag effect (Luhar and Nepf, 2016). Under the combined flow, however, these two types of blade deflection may influence each other and then limit or strengthen the seagrass-induced wave attenuation. Therefore, to consider the influence of current, Lei and Nepf (2019b) proposed a wave-current Cauchy number expressed as Equation 31:
in which the subscript 'wc', 'c', and 'w' represent combined wave-current conditions, current condition and wave condition, respectively. This equation is valid when vegetation-induced drag is significantly influenced by the waves and currents (0.25<RCW<2) (Beth Schaefer and Nepf, 2022). Therefore, the effective seagrass meadow height under the wave and current flow can be expressed by revising the effective blade length, as Equation 32:
Beth Schaefer and Nepf (2022) extended Paul et al. (2012)'s work to study the current effect on seagrass-induced wave attenuation. It is found that the current can be negligible when RCW<0.5 and when RCW>0.5; however, the addition of currents can reduce wave attenuation by up to 30%. Current-induced deflection significantly impacts wave attenuation for small wave amplitudes (), which is negligible when wave-induced deflection dominates (). Moreover, Beth Schaefer and Nepf (2022) prove the effectiveness of Equation 29 in estimating wave attenuation within the combined flow by applying a modified in-canopy time-averaged velocity.
It was found that the meadow drag reduces the current with seagrass meadow, Beth Schaefer and Nepf (2022) proposed an in-canopy time-averaged velocity (see Equation 33), which represents the relative velocity of reconfiguration, blade drag and wave damping, by considering current and wave-induced current based on the assumptions that 1) the wave does not influence the momentum exchange between meadow and overflow; 2) the background current cannot influence the wave-driven flow:
in which, represents the canopy solid volume fraction as listed in Table 10; is the coefficient characterising the turbulent stress at the top of the canopy. The wave-induced mean current, , can be calculated by Equation 9, replacing by .
Table 10
| Notation | Units | |
|---|---|---|
| Root-mean-square value of the horizontal orbital velocity | ||
| Steady velocity associated with the current | ||
| Current velocity | ||
| In-canopy time-averaged velocity (combined flow) | ||
| Unsteady wave velocity | ||
| Representative wave-induced velocity | ||
| Wave velocity | ||
| Instantaneous wave velocity | ||
| Turbulent velocity | ||
| Wave amplitude | m | |
| RMS wave amplitude | m | |
| Wave frequency | Hz | |
| Wave number | – | |
| Time | s | |
| Water depth | m | |
| Canopy height | m | |
| Mean canopy height | m | |
| Canopy maximum deflected height | m | |
| Wave height | m | |
| Depth-averaged in-canopy mean current | ||
| Drag coefficient associated with wave | – | |
| Drag coefficient associated with current | – | |
| Hydrodynamic mass coefficient | – | |
| Density of fluid | ||
| Blade's width | m | |
| Blade's thickness | m | |
| Second moment of inertia | ||
| Blade's length | m | |
| Mass density of blade | ||
| Gravitational acceleration | ||
| Young's modulus of blade | ||
| Maximum wave orbital excursion at the canopy top | m | |
| Wave Cauchy number | – | |
| Buoyancy parameter | – | |
| Blade length ratio | – | |
| Wavelength | m | |
| Effective blade length | m | |
| Rate of energy dissipation due to vegetation | ||
| Wave energy dissipation ratio | – | |
| Wave group velocity | ||
| Vegetation frontal area per unit meadow volume | ||
| Effective vegetation frontal area per unit meadow volume | ||
| Absolute water velocity | ||
| Wave amplitude at the beginning of the meadow | m | |
| The canopy frontal area per unit volume | ||
| Wave decay coefficient | – | |
| Ratio of in-canopy velocity to free-stream velocity | – | |
| Corrected effective length | m | |
| Rigid length | m | |
| Keulegan–Carpenter number | – | |
| Reynolds number | – | |
| Kinematic fluid viscosity | ||
| Horizontal wave orbital excursion at the canopy top | m | |
| Maximum mean current at the top of the canopy | ||
| Number of rigid blades per bed area | – | |
| Diameter of the rigid part of the seagrass model | m | |
| Shoot density | shoot | |
| Roughness density | – | |
| Numerical coefficient for roughness density | – | |
| Numerical coefficient for roughness density | – | |
| Number of vegetation stands per unit horizontal area | – | |
| Flow horizontal acceleration | ||
| Wave energy dissipation factor for regular wave | ||
| Wave energy dissipation factor for jth spectral component | ||
| Local spectral densities | ||
| Discrete frequency bandwidth | Hz | |
| Horizontal wave-induced velocity of jth spectral component | ||
| Stem centre‐centre spacing | m | |
| Blade spacing | m | |
| Solid volume fraction in the stem region | – | |
| Canopy solid volume fraction |
Notation.
4 Challenges and perspectives
4.1 Research gaps
The research on the engineering aspects of seagrass meadows is still in its early stages, and there are significant gaps in research that need to be addressed before referring to seagrass meadow restoration as a practical nature-based approach for coastal protection. Based on the systematic review and meta-analysis, key research gaps and potential study directions in this domain are summarised as follows:
-
Current studies mainly focus on the seagrass meadow with uniform properties, such as single species, which is unrealistic. Therefore, it is recommended that non-uniformity influences, such as multi-length blades (Cavallaro et al., 2018) and heterospecific seagrass canopies (Weitzman et al., 2015), be quantified.
-
The threshold value for seagrass meadows to effectively provide wave attenuation remains undetermined. Chastel et al. (2020) found that seagrass-induced wave dissipation becomes negligible when the submergence ratio is less than 0.2, but the threshold values for other influencing factors, including but not limited to shoot density, meadow length, and fragmentation, remain a research gap. Because of the spatial and temporal heterogeneity, the determination of these threshold values significantly contributes to the guidance of restoring or creating the seagrass meadows.
-
The canopy features and physical properties of seagrass meadows, such as meadow density, covering area, blade stiffness, and blade length, significantly vary with seasons, which further influences the wave attenuation ability of seagrass meadows. However, most studies focus on the influence of a single parameter. To comprehensively quantify the seasonal influences, it is essential to study the multi-factor influencing mechanism behind them.
-
Only limited studies have demonstrated the unsatisfactory performance of seagrass-induced wave dissipation during storm conditions (Elginoz et al., 2011; Chastel et al., 2020). Additionally, the resilience of seagrass during storms and its wave attenuation performance post-storms remain underexplored.
-
The interaction between seagrass meadows and existing artificial sea defences (e.g., breakwaters and seawalls) remains a research gap. Future studies could further contribute to discovering the possibility of combining seagrass with artificial sea defences to provide dual benefits of wave attenuation and ecological enhancement. Additionally, it is also recommended to discover the possibility of combining seagrass meadows with other natural elements, such as oyster reefs, to generate multi-line coastal defences.
-
While seagrass is frequently exposed to the combined effects of waves and currents in natural environments, relatively few studies have shown its ability to attenuate waves under such conditions (Beth Schaefer and Nepf, 2022; Hu et al., 2014). Therefore, additional research would be clearly desirable to investigate the hydrodynamics of seagrass in the presence of both wave and current flows. It will be essential not only for accurately predicting the wave attenuation capacity of seagrass meadows but also for improving our understanding of related processes such as nutrient transport, sediment resuspension, and other ecological dynamics.
-
Multidisciplinary collaboration should be fostered and expanded to develop a more comprehensive assessment and application framework encompassing the ecological, environmental, engineering, and other benefits and the living conditions of seagrass meadows. For instance, the successful establishment or restoration of seagrass habitats is influenced by complex environmental and hydrodynamic processes (Chang and Mori, 2021; Firth et al., 2020). Therefore, collaboration among biologists, ecologists, and engineers is the cornerstone to building sustainable and effective seagrass meadows that can provide long-term coastal protection.
It is worth noting that seagrass meadows can effectively dissipate wave energy and provide extra coastal protection services, including erosion control and carbon sequestration; however, they are easily destroyed under strong wave conditions (Oprandi et al., 2020). Therefore, the attenuating effect of seagrass on waves should not be exaggerated in areas with high wave energy. Seagrass meadows should be considered complementary components of enhancing the climate resilience of coastal regions.
4.2 A novel framework for designing and reporting seagrass studies
Based on this review, a basic design and report framework for establishing an experimental study quantifying the wave attenuation performance of seagrass meadows is proposed in Figure 14. The study can be divided into preparation and measurements/reports. As introduced before, seagrass-induced wave attenuation highly depends on the flow characteristics, environmental conditions, and seagrass species features. The establishment of seagrass mimics is regarded as the first step in conducting lab-scale experiments as an alternative to using full-scale natural seagrass species. It is important to report the geometrical and dynamic similarities between the seagrass mimics and the selected seagrass species. Key parameters to include are buoyancy, Cauchy number, and blade length ratio. The flow conditions and characteristics of the meadow, such as length, fragmentation, and shoot distribution, should be documented during the preparation stage. In the measurements and reports stage, the literature indicates that the primary measurements used in the study of seagrass-induced wave attenuation are wave height and instantaneous water velocity. In several studies, the wave force acting on seagrass blades was measured to calculate the drag coefficient using either direct or Least Squares methods, as described in Section 4.1. However, most research estimates the drag coefficient using the measured wave attenuation coefficient, considering either the undeflected blade length or the effective blade length. Data transparency is crucial for generalizing findings across various studies, especially when no unified evaluation criterion exists. All six parameters—wave attenuation coefficient, wave transmission coefficient, wave energy dissipation, turbulent kinetic energy, drag coefficient, and wave-induced flow reduction—play a role in the performance and mechanisms of seagrass-induced wave attenuation. However, only one or two of these parameters are often reported in a single study, and the transparency of original data is pretty low. Therefore, it would be clearly desirable for the authors to share the original measurement data if possible so that other researchers can calculate the relevant criteria.
Figure 14
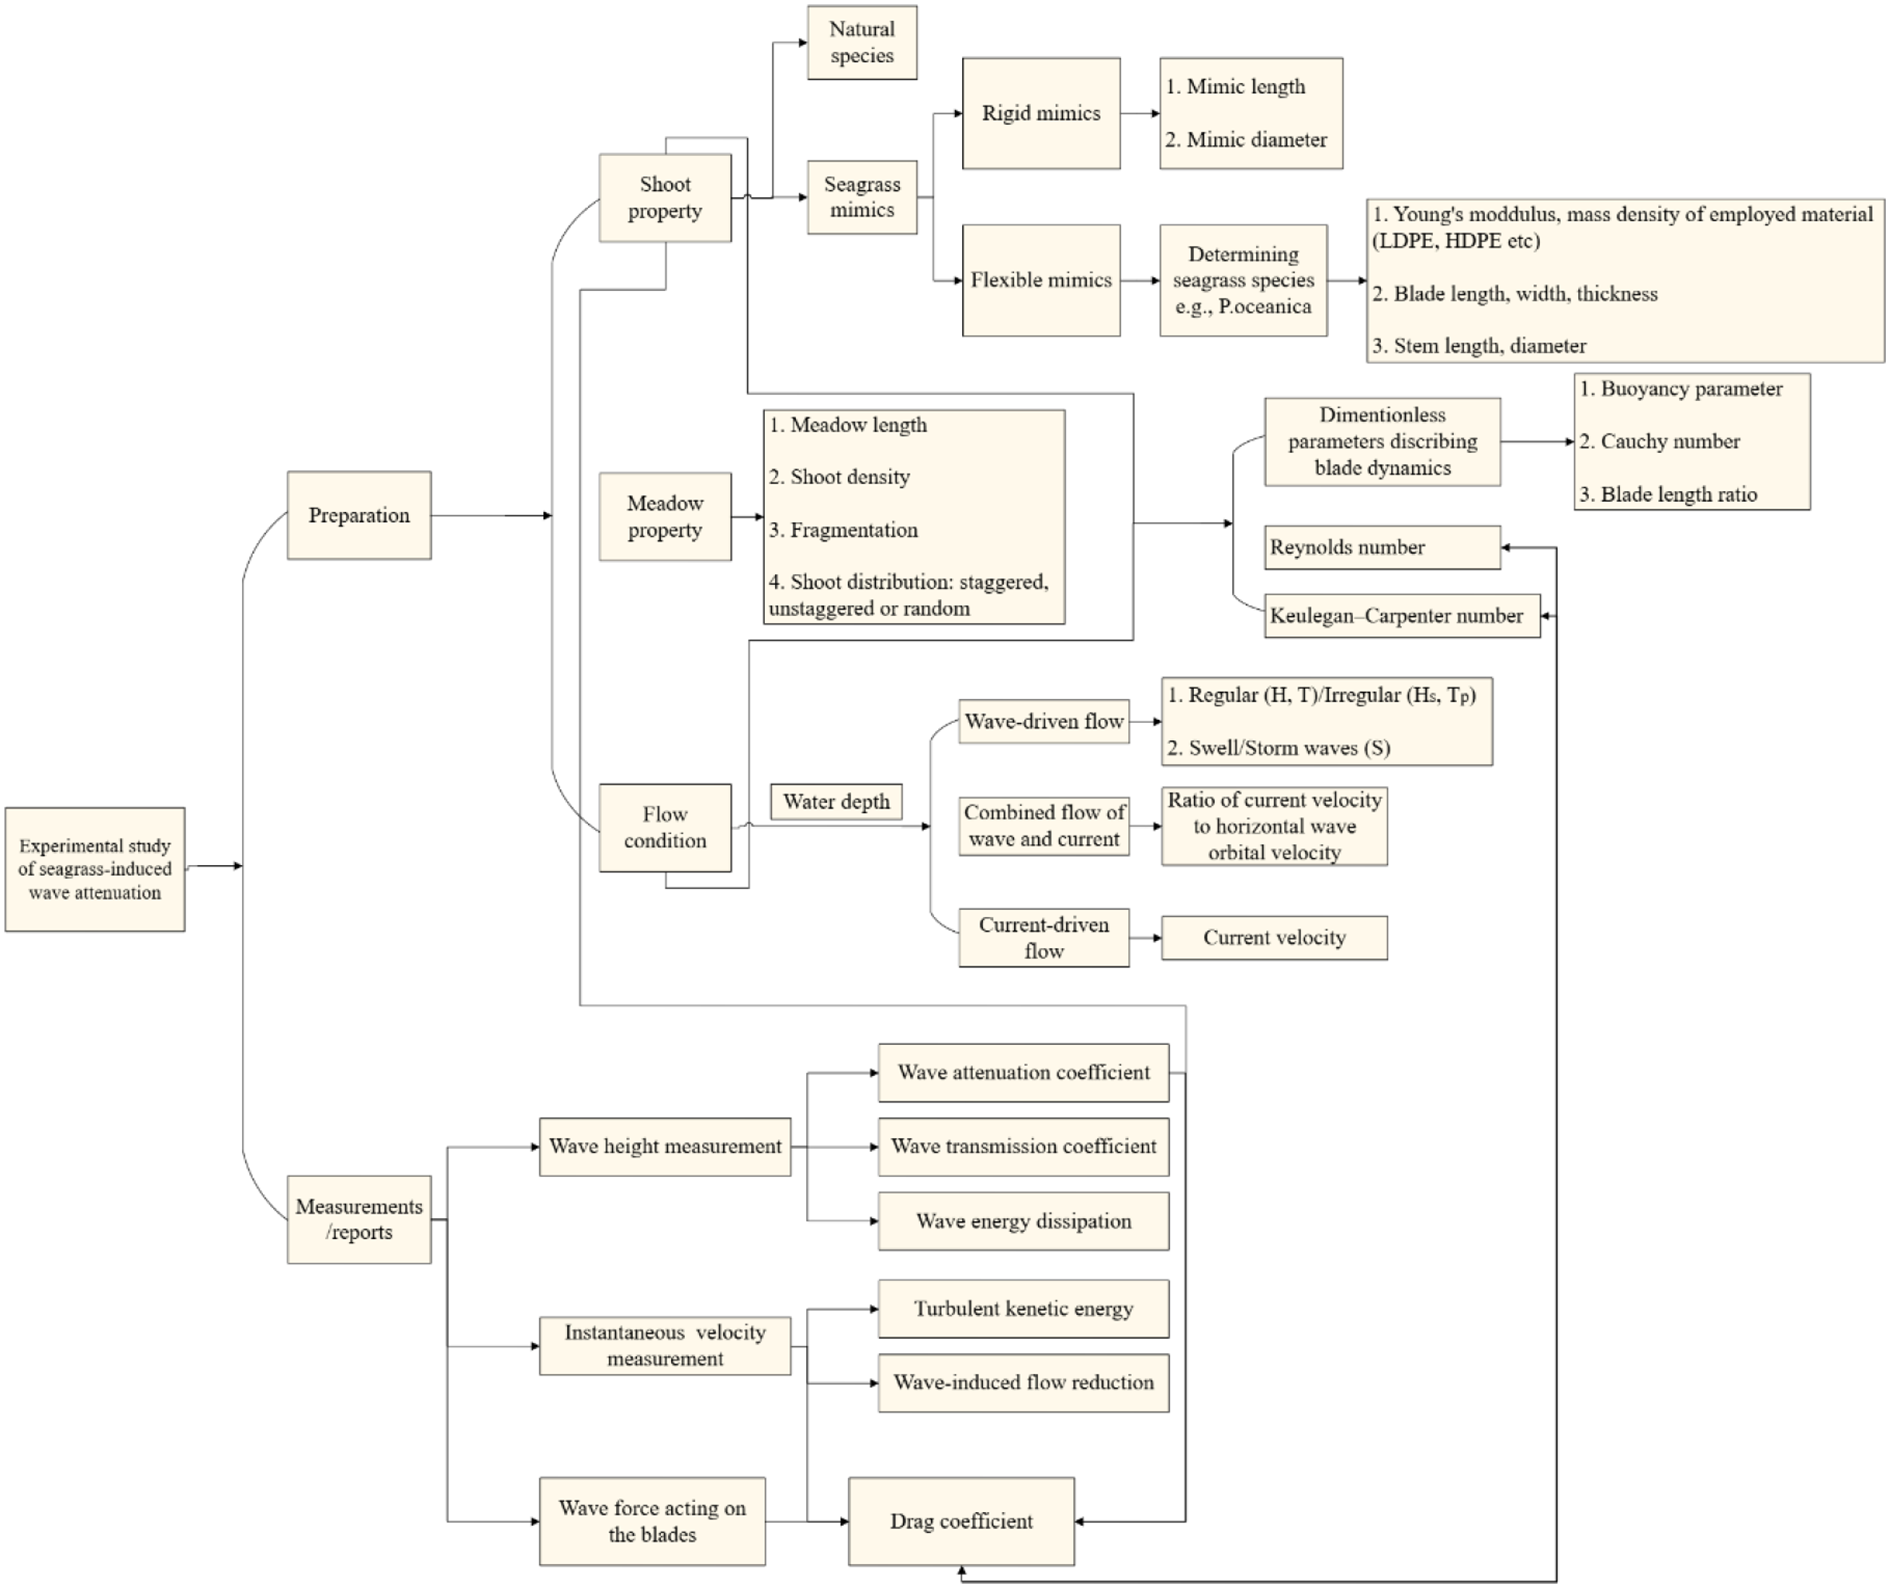
A conceptual framework for conducting an experimental study on seagrass-induced wave attenuation.
5 Conclusion
Nature-based solutions for coastal protection, such as restoring seagrass meadows, have gained attention in recent years as effective strategies for combating the threats posed by climate change, while also providing engineering and ecological benefits. A number of experimental studies have been conducted to assess how seagrass affects wave attenuation and to understand the hydrodynamic processes occurring within seagrass meadows. However, the lack of consistent evaluation criteria across different studies, along with limited data on experimental methodologies and measurements, makes it challenging to compare results and reach a consensus on the effects of seagrass on wave attenuation. This is highlighted by the meta-analysis, where we found that the approaches and empirical methods used by researchers across various studies in the literature are ambiguous.
To the best of the authors' knowledge, this study is one of the first to discuss the key factors and parameters used to measure and assess wave attenuation and local hydrodynamics in seagrass meadows, providing detailed knowledge on the global studies performed in this research domain. Wave-induced flow velocity within the seagrass meadow is the most common parameter (reported by 26.7% screened publications) to study and reveal the mechanism behind seagrass-induced wave attenuation to provide an intuitive hydrodynamic structure within the seagrass canopy, normally including the flow velocity attenuation along the seagrass meadow and the velocity profile in the vertical direction. On this basis, the turbulent kinetic energy analysis, showcasing the turbulence distribution at a microscopic level, improves the understanding of the local hydrodynamics and further reveals the transport and residence behaviours of the dissolved particles and suspended sediments. Despite the hydrodynamic structure, the wave height variation over the seagrass canopy has gained the majority of research interest (31.7% of the screened publications), as it can intuitively react to the effect of seagrass meadows on wave dissipation. In this context, the wave transmission coefficient and the wave attenuation coefficient provide a convenient index of the seagrass-induced wave attenuation on the basis of wave height measurements. Combined with the drag coefficient, a dimensionless parameter quantifying the resistance caused by the seagrass under various hydrodynamic conditions, several empirical equations have been developed for the prediction of wave attenuation coefficients. Wave energy dissipation, as the name implies, reflects the wave energy attenuation when the incident wave transmits over the seagrass meadow. Additionally, the influences of wave conditions and canopy characteristics on seagrass-induced wave attenuation and local hydrodynamics are summarised and discussed. Recognizing the urgent need for a unified evaluation framework based on meta-analysis, we propose a new framework for measuring and quantifying the wave attenuation performance of seagrass meadows in experimental studies. In conclusion, further experimental studies on wave attenuation and surrounding hydrodynamics are crucial to fully realise their potential as effective nature-based solutions. Comprehensive research is needed to address existing challenges and refine the empirical methods for assessing wave attenuation and local hydrodynamics of seagrass meadows. This will ultimately advance our understanding of the engineering benefits provided by seagrass beds and contribute to environmental sustainability in coastal management.
Statements
Data availability statement
The original contributions presented in the study are included in the article/Supplementary Material. Further inquiries can be directed to the corresponding author.
Author contributions
XX: Visualization, Formal Analysis, Data curation, Conceptualization, Software, Writing – original draft, Methodology, Investigation. MS: Project administration, Supervision, Methodology, Writing – review & editing, Validation, Funding acquisition, Resources, Conceptualization.
Funding
The author(s) declare financial support was received for the research and/or publication of this article. XX sincerely thanks the China Scholarship Council and University College Dublin for their support for this research (Grant No. 202106567019). This study was partly funded through the UCD Sustainability Seed Funding Programme (RECONCILE Project), which is supported by Performance Funding from the Higher Education Authority (HEA) Ireland.
Conflict of interest
The authors declare that the research was conducted in the absence of any commercial or financial relationships that could be construed as a potential conflict of interest.
Generative AI statement
The author(s) declare that no Generative AI was used in the creation of this manuscript.
Any alternative text (alt text) provided alongside figures in this article has been generated by Frontiers with the support of artificial intelligence and reasonable efforts have been made to ensure accuracy, including review by the authors wherever possible. If you identify any issues, please contact us.
Publisher’s note
All claims expressed in this article are solely those of the authors and do not necessarily represent those of their affiliated organizations, or those of the publisher, the editors and the reviewers. Any product that may be evaluated in this article, or claim that may be made by its manufacturer, is not guaranteed or endorsed by the publisher.
Supplementary material
The Supplementary Material for this article can be found online at: https://www.frontiersin.org/articles/10.3389/fmars.2025.1620592/full#supplementary-material
References
1
Abdolahpour M. Ghisalberti M. Lavery P. McMahon K. (2017a). Vertical mixing in coastal canopies. Limnology Oceanography62, 26–42. doi: 10.1002/lno.10368
2
Abdolahpour M. Ghisalberti M. McMahon K. Lavery P. S. (2018). The impact of flexibility on flow, turbulence, and vertical mixing in coastal canopies. Limnology Oceanography63, 2777–2792. doi: 10.1002/lno.11008
3
Abdolahpour M. Hambleton M. Ghisalberti M. (2017b). The wave-driven current in coastal canopies. J. Geophysical Research: Oceans122, 3660–3674. doi: 10.1002/2016JC012446
4
El Allaoui N. Serra T. Colomer J. Soler M. Casamitjana X. Oldham C. (2016). Interactions between fragmented seagrass canopies and the local hydrodynamics. PloS One11, e0156264. doi: 10.1371/journal.pone.0156264
5
Apine E. Stojanovic T. (2024). Is the coastal future green, grey or hybrid? Diverse perspectives on coastal flood risk management and adaptation in the UK. Cambridge Prisms: Coast. Futures2, e4. doi: 10.1017/cft.2024.4
6
Astudillo C. Gracia V. Cáceres I. Sierra J. P. Sánchez-Arcilla A. (2022). Beach profile changes induced by surrogate Posidonia Oceanica: Laboratory experiments. Coast. Eng.175, 104144. doi: 10.1016/j.coastaleng.2022.104144
7
Beth Schaefer R. Nepf H. (2022). Wave damping by seagrass meadows in combined wave-current conditions. Limnology Oceanography67, 1554–1565. doi: 10.1002/lno.12102
8
Bos A. R. Bouma T. J. de Kort G. L. J. van Katwijk M. M. (2007). Ecosystem engineering by annual intertidal seagrass beds: Sediment accretion and modification. Estuarine Coast. Shelf Sci.74, 344–348. doi: 10.1016/j.ecss.2007.04.006
9
Bouma T. J. van Belzen J. Balke T. Zhu Z. Airoldi L. Blight A. J. et al . (2014). Identifying knowledge gaps hampering application of intertidal habitats in coastal protection: Opportunities & steps to take. Coast. Eng.87, 147–157. doi: 10.1016/j.coastaleng.2013.11.014
10
Bulleri F. Chapman M. G. (2010). The introduction of coastal infrastructure as a driver of change in marine environments. J. Appl. Ecol.47, 26–35. doi: 10.1111/j.1365-2664.2009.01751.x
11
Carus J. Arndt C. Bouma T. J. Schröder B. Paul M. (2022). Effect of artificial seagrass on hydrodynamic thresholds for the early establishment of Zostera marina. J. Ecohydraulics7, 17–27. doi: 10.1080/24705357.2020.1858197
12
Cavallaro L. Viviano A. Paratore G. Foti E. (2018). Experiments on surface waves interacting with flexible aquatic vegetation. Ocean Sci. J.53, 461–474. doi: 10.1007/s12601-018-0037-8
13
Chang C.-W. Mori N. (2021). Green infrastructure for the reduction of coastal disasters: A review of the protective role of coastal forests against tsunami, storm surge, and wind waves. Coast. Eng. J.63, 370–385. doi: 10.1080/21664250.2021.1929742
14
Chastel T. Botten K. Durand N. Goutal N. (2020). Bulk drag coefficient of a subaquatic vegetation subjected to irregular waves: Influence of Reynolds and Keulegan-Carpenter numbers. La Houille Blanche106, 34–42. doi: 10.1051/lhb/2020015
15
Chen H. Ni Y. Li Y. Liu F. Ou S. Su M. et al . (2018). Deriving vegetation drag coefficients in combined wave-current flows by calibration and direct measurement methods. Adv. Water Resour.122, 217–227. doi: 10.1016/j.advwatres.2018.10.008
16
Dalrymple R. A. Kirby J. T. Hwang P. A. (1984). Wave diffraction due to areas of energy dissipation. J. Waterway Port Coastal Ocean Eng.110, 67–79. doi: 10.1061/(ASCE)0733-950X(1984)110:1(67
17
De Dominicis M. Wolf J. van Hespen R. Zheng P. Hu Z. (2023). Mangrove forests can be an effective coastal defence in the Pearl River Delta, China. Commun. Earth Environ.4, 1–13. doi: 10.1038/s43247-022-00672-7
18
de los Santos C. B. Olivé I. Moreira M. Silva A. Freitas C. Araújo Luna R. et al . (2020). Seagrass meadows improve inflowing water quality in aquaculture ponds. Aquaculture528, 735502. doi: 10.1016/j.aquaculture.2020.735502
19
do Amaral Camara Lima M. Bergamo T. F. Ward R. D. Joyce C. B. (2023). A review of seagrass ecosystem services: Providing nature-based solutions for a changing world. Hydrobiologia850, 2655–2670. doi: 10.1007/s10750-023-05244-0
20
Duarte C. M. (1999). Seagrass ecology at the turn of the millennium: Challenges for the new century. Aquat. Bot.65, 7–20. doi: 10.1016/S0304-3770(99)00027-3
21
El Allaoui N. Serra T. Soler M. Colomer J. Pujol D. Oldham C. (2015). Modified hydrodynamics in canopies with longitudinal gaps exposed to oscillatory flows. J. Hydrology531, 840–849. doi: 10.1016/j.jhydrol.2015.10.041
22
Elginoz N. Kabdasli M. S. Tanik A. (2011). Effects of posidonia oceanica seagrass meadows on storm waves. J. Coast. Res., 373–377. https://www.jstor.org/stable/26482196.
23
El Rahi J. Martínez-Estévez I. Tagliafierro B. Domínguez J. M. Crespo A. J. C. Stratigaki V. et al . (2023). Numerical investigation of wave-induced flexible vegetation dynamics in 3D using a coupling between DualSPHysics and the FEA module of Project Chrono. Ocean Eng.285, 115227. doi: 10.1016/j.oceaneng.2023.115227
24
Familkhalili R. Tahvildari N. (2022). Computational modeling of coupled waves and vegetation stem dynamics in highly flexible submerged meadows. Adv. Water Resour.165, 104222. doi: 10.1016/j.advwatres.2022.104222
25
Firth L. B. Airoldi L. Bulleri F. Challinor S. Chee S. Evans A. J. et al . (2020). Greening of grey infrastructure should not be used as a Trojan horse to facilitate coastal development. J. Appl. Ecol.57, 1762–1768. doi: 10.1111/1365-2664.13683
26
Folkard A. M. (2005). Hydrodynamics of model Posidonia oceanica patches in shallow water. Limnology Oceanography50, 1592–1600. doi: 10.4319/lo.2005.50.5.1592
27
Fonseca M. S. Cahalan J. A. (1992). A preliminary evaluation of wave attenuation by four species of seagrass. Estuarine Coast. Shelf Sci.35, 565–576. doi: 10.1016/S0272-7714(05)80039-3
28
Forrester J. Leonardi N. Cooper J. R. Kumar P. (2024). Seagrass as a nature-based solution for coastal protection. Ecol. Eng.206, 107316. doi: 10.1016/j.ecoleng.2024.107316
29
Ghisalberti M. Nepf H. M. (2002). Mixing layers and coherent structures in vegetated aquatic flows. J. Geophysical Research: Oceans107, 3-1-3–3-111. doi: 10.1029/2001JC000871
30
Heck K. L. Carruthers T. J. B. Duarte C. M. Hughes A. R. Kendrick G. Orth R. J. et al . (2008). Trophic transfers from seagrass meadows subsidize diverse marine and terrestrial consumers. Ecosystems11, 1198–1210. doi: 10.1007/s10021-008-9155-y
31
Hemavathi S. Manjula R. (2020a). Reduction of wave energy due to monotypic coastal vegetation using response surface methodology (RSM). Nat. Environ. pollut. Technol.19, 1965–1971. doi: 10.46488/NEPT.2020.v19i05.021
32
Hemavathi S. Manjula R. (2020b). Wave attenuation by coastal vegetation – An Empirical study on synthetic models. IJMS49, 1143–1152. Available online at: http://nopr.niscpr.res.in/handle/123456789/55105 (Accessed July 2020).
33
Hemavathi S. Manjula R. (2020c). Wave attenuation by heterospecific coastal vegetation-modelling through response surface methodology on synthetic plant meadows. Curr. Sci.119, 497–506. doi: 10.18520/cs/v119/i3/497-506
34
Hemavathi S. Manjula R. (2021). Wave attenuation by coastal heterospecific vegetation—Modeling of synthetic plant meadows by Response Surface Methodology (RSM). IJMS50, 193–202. Available online at: https://nopr.niscpr.res.in/handle/123456789/56574 (Accessed March 2021).
35
Hosseinzadeh N. Ghiasian M. Andiroglu E. Lamere J. Rhode-Barbarigos L. Sobczak J. et al . (2022). Concrete seawalls: A review of load considerations, ecological performance, durability, and recent innovations. Ecol. Eng.178, 106573. doi: 10.1016/j.ecoleng.2022.106573
36
Houser C. Trimble S. Morales B. (2015). Influence of blade flexibility on the drag coefficient of aquatic vegetation. Estuaries Coasts38, 569–577. doi: 10.1007/s12237-014-9840-3
37
Hu Z. Suzuki T. Zitman T. Uittewaal W. Stive M. (2014). Laboratory study on wave dissipation by vegetation in combined current–wave flow. Coast. Eng.88, 131–142. doi: 10.1016/j.coastaleng.2014.02.009
38
Jacob B. Dolch T. Wurpts A. Staneva J. (2023). Evaluation of seagrass as a nature-based solution for coastal protection in the German Wadden Sea. Ocean Dyn.73 (11), 699–727. doi: 10.1007/s10236-023-01577-5
39
James R. K. Lynch A. Herman P. M. J. van Katwijk M. M. van Tussenbroek B. I. Dijkstra et al (2021). Tropical Biogeomorphic Seagrass Landscapes for Coastal Protection: Persistence and Wave Attenuation During Major Storms Events. Ecosystems.24 (2), 301–318. doi: 10.1007/s10021-020-00519-2
40
John B. M. Shirlal K. G. Rao S. (2015). Effect of artificial sea grass on wave attenuation- an experimental investigation. Aquat. Proc.4, 221–226. doi: 10.1016/j.aqpro.2015.02.030
41
Jonsson I. G. (1966). Wave boundary layers and friction factors. American Society of Civil Engineers, 127–148. doi: 10.1061/9780872620087.010
42
Kamil E. A. Takaijudin H. Hashim A. M. (2021). Mangroves as coastal bio-shield: A review of mangroves performance in wave attenuation. Civil Eng. J.7, 11. doi: 10.28991/cej-2021-03091772
43
Kobayashi N. Raichle A. W. Asano T. (1993). Wave attenuation by vegetation. J. Waterway Port Coastal Ocean Eng.119, 30–48. doi: 10.1061/(ASCE)0733-950X(1993)119:1(30
44
Koftis T. Prinos P. Stratigaki V. (2013). Wave damping over artificial Posidonia oceanica meadow: A large-scale experimental study. Coast. Eng.73, 71–83. doi: 10.1016/j.coastaleng.2012.10.007
45
Kumar P. Debele S. E. Sahani J. Rawat N. Marti-Cardona B. Alfieri S. M. et al . (2021). An overview of monitoring methods for assessing the performance of nature-based solutions against natural hazards. Earth-Science Rev.217, 103603. doi: 10.1016/j.earscirev.2021.103603
46
Kummu M. Moel H. Salvucci G. Viviroli D. Ward P. J. Varis O. (2016). Over the hills and further away from coast: Global geospatial patterns of human and environment over the 20th–21st centuries. Environ. Res. Lett.11, 34010. doi: 10.1088/1748-9326/11/3/034010
47
Langre E. (2008). Effects of wind on plants. Annu. Rev. Fluid Mechanics40, 141–168. doi: 10.1146/annurev.fluid.40.111406.102135
48
Lansu E. M. Reijers V. C. Höfer S. Luijendijk A. Rietkerk M. Wassen M. J. et al . (2024). A global analysis of how human infrastructure squeezes sandy coasts. Nat. Commun.15 (1), 1. doi: 10.1038/s41467-023-44659-0
49
La Peyre M. K. Buie S. C. L. Rossi R. E. Roberts B. J. (2022). Long-term assessments are critical to determining persistence and shoreline protection from oyster reef nature-based coastal defenses. Ecol. Eng.178, 106603. doi: 10.1016/j.ecoleng.2022.106603
50
Lei J. Nepf H. (2019a). Blade dynamics in combined waves and current. J. Fluids Structures87, 137–149. doi: 10.1016/j.jfluidstructs.2019.03.020
51
Lei J. Nepf H. (2019b). Wave damping by flexible vegetation: Connecting individual blade dynamics to the meadow scale. Coast. Eng.147, 138–148. doi: 10.1016/j.coastaleng.2019.01.008
52
Liu S. Xu S. Yin K. (2023). Optimization of the drag coefficient in wave attenuation by submerged rigid and flexible vegetation based on experimental and numerical studies. Ocean Eng.285, 115382. doi: 10.1016/j.oceaneng.2023.115382
53
Lopez-Arias F. Maza M. Lara J. L. Losada I. J. (2023). A new predictive tool for modeling wave attenuation produced by saltmarshes in SWAN based on standing biomass. Coast. Eng.185, 104380. doi: 10.1016/j.coastaleng.2023.104380
54
Lowe R. J. Koseff J. R. Monismith S. G. (2005). Oscillatory flow through submerged canopies: 1. Velocity structure. J. Geophysical Research: Oceans, 110. doi: 10.1029/2004JC002788
55
Luhar M. Coutu S. Infantes E. Fox S. Nepf H. (2010). Wave-induced velocities inside a model seagrass bed. . J. Geophysical Research: Oceans115. doi: 10.1029/2010JC006345
56
Luhar M. Infantes E. Nepf H. (2017). Seagrass blade motion under waves and its impact on wave decay. J. Geophys. Res. Oceans122 (5), 3736–3752. doi: 10.1002/2017JC012731
57
Luhar M. Nepf H. M. (2011). Flow-induced reconfiguration of buoyant and flexible aquatic vegetation. Limnology Oceanography56, 2003–2017. doi: 10.4319/lo.2011.56.6.2003
58
Luhar M. Nepf H. M. (2016). Wave-induced dynamics of flexible blades. J. Fluids Structures61, 20–41. doi: 10.1016/j.jfluidstructs.2015.11.007
59
Madsen J. D. Chambers P. A. James W. F. Koch E. W. Westlake D. F. (2001). The interaction between water movement, sediment dynamics and submersed macrophytes. Hydrobiologia444, 71–84. doi: 10.1023/A:1017520800568
60
Madsen O. S. Poon Y.-K. Graber H. C. (1988). Spectral wave attenuation by bottom friction: theory. American Society of Civil Engineers, 492–504. doi: 10.1061/9780872626874.035
61
Magdalena I. Andadari G. R. Reeve D. E. (2022). An integrated study of wave attenuation by vegetation. Wave Motion110, 102878. doi: 10.1016/j.wavemoti.2021.102878
62
Manca E. Cáceres I. Alsina J. M. Stratigaki V. Townend I. Amos C. L. (2012). Wave energy and wave-induced flow reduction by full-scale model Posidonia oceanica seagrass. Continental Shelf Res.50–51, 100–116. doi: 10.1016/j.csr.2012.10.008
63
Manousakas N. Salauddin M. Pearson J. Denissenko P. Williams H. Abolfathi S. (2022). Effects of seagrass vegetation on wave runup reduction – A laboratory study. IOP Conf. Series: Earth Environ. Sci.1072, 12004. doi: 10.1088/1755-1315/1072/1/012004
64
Mazarrasa I. Samper-Villarreal J. Serrano O. Lavery P. S. Lovelock C. E. Marbà N. et al . (2018). Habitat characteristics provide insights of carbon storage in seagrass meadows. Mar. pollut. Bull.134, 106–117. doi: 10.1016/j.marpolbul.2018.01.059
65
Mendez F. J. Losada I. J. (2004). An empirical model to estimate the propagation of random breaking and nonbreaking waves over vegetation fields. Coast. Eng.51, 103–118. doi: 10.1016/j.coastaleng.2003.11.003
66
Merkens J.-L. Reimann L. Hinkel J. Vafeidis A. T. (2016). Gridded population projections for the coastal zone under the Shared Socioeconomic Pathways. Global Planetary Change145, 57–66. doi: 10.1016/j.gloplacha.2016.08.009
67
Morris R. L. Konlechner T. M. Ghisalberti M. Swearer S. E. (2018). From grey to green: Efficacy of eco-engineering solutions for nature-based coastal defence. Glob. Chang. Biol.24 (5), 1827–1842. doi: 10.1111/gcb.14063
68
nácio M. Karnauskaitė D. Mikša K. Gomes E. Kalinauskas M. Pereira P. (2022). Nature-based solutions to mitigate coastal floods and associated socioecological impacts ( C. S. S.Springer International Publishing). doi: 10.1007/698_2020_675
69
Nepf H. M. (1999). Drag, turbulence, and diffusion in flow through emergent vegetation. Water Resour. Res.35 (2), 479–489. doi: 10.1029/1998WR900069
70
Ondiviela B. Losada I. J. Lara J. L. Maza M. Galván C. Bouma T. J. et al . (2014). The role of seagrasses in coastal protection in a changing climate. Coast. Eng.87, 158–168. doi: 10.1016/j.coastaleng.2013.11.005
71
Oprandi A. Mucerino L. De Leo F. Bianchi C. N. Morri C. Azzola A. et al . (2020). Effects of a severe storm on seagrass meadows. Sci. Total Environ.748, 141373. doi: 10.1016/j.scitotenv.2020.141373
72
Osorio-Cano J. D. Osorio A. F. Peláez-Zapata D. S. (2019). Ecosystem management tools to study natural habitats as wave damping structures and coastal protection mechanisms. Ecol. Eng.130, 282–295. doi: 10.1016/j.ecoleng.2017.07.015
73
Page M. J. McKenzie J. E. Bossuyt P. M. Boutron I. Hoffmann T. C. Mulrow C. D. et al . (2021). The PRISMA 2020 statement: An updated guideline for reporting systematic reviews. Int. J. Surg.88. Scopus. doi: 10.1016/j.ijsu.2021.105906
74
Paul M. Bouma T. J. Amos C. L. (2012). Wave attenuation by submerged vegetation: -combining the effect of organism traits and tidal current. Mar. Ecol. Prog. Ser.444, 31–41. doi: 10.3354/meps09489
75
Paul M. Gillis L. G. (2015). Let it flow: How does an underlying current affect wave propagation over a natural seagrass meadow? Mar. Ecol. Prog. Ser.523, 57–70. doi: 10.3354/meps11162
76
Phan K. L. Stive M. J. F. Zijlema M. Truong H. S. Aarninkhof S. G. J. (2019). The effects of wave non-linearity on wave attenuation by vegetation. Coast. Eng.147, 63–74. doi: 10.1016/j.coastaleng.2019.01.004
77
Pinsky M. L. Guannel G. Arkema K. K. (2013). Quantifying wave attenuation to inform coastal habitat conservation. Ecosphere4, art95. doi: 10.1890/ES13-00080.1
78
Pranckutė R. (2021). Web of Science (WoS) and Scopus: The Titans of Bibliographic Information in Today’s Academic World. Publications9 (1), 1. doi: 10.3390/publications9010012
79
Pujol D. Colomer J. Serra T. Casamitjana X. (2010). Effect of submerged aquatic vegetation on turbulence induced by an oscillating grid. Continental Shelf Res.30, 1019–1029. doi: 10.1016/j.csr.2010.02.014
80
Pujol D. Nepf H. (2012). Breaker-generated turbulence in and above a seagrass meadow. Continental Shelf Res.49, 1–9. doi: 10.1016/j.csr.2012.09.004
81
Pujol D. Serra T. Colomer J. Casamitjana X. (2013). Flow structure in canopy models dominated by progressive waves. J. Hydrology486, 281–292. doi: 10.1016/j.jhydrol.2013.01.024
82
Reimann L. Vafeidis A. T. Honsel L. E. (2023). Population development as a driver of coastal risk: Current trends and future pathways. Cambridge Prisms: Coast. Futures1, e14. doi: 10.1017/cft.2023.3
83
Reis R. A. Fortes C. J. E. M. Rodrigues J. A. Hu Z. Suzuki T. (2024). Experimental study on drag coefficient of flexible vegetation under non-breaking waves. Ocean Eng.296, 117002. doi: 10.1016/j.oceaneng.2024.117002
84
Rella A. Perkol-Finkel S. Neuman A. Sella I. (2018). “ Challenges in applying ecological enhancement factors into coastal and marine concrete construction,” in Coasts, marine structures and breakwaters 2017 ( ICE Publishing), 823–832. doi: 10.1680/cmsb.63174.0823
85
Risandi J. Rifai H. Lukman K. M. Sondak C. F. A. Hernawan U. E. Quevedo J. M. D. et al . (2023). Hydrodynamics across seagrass meadows and its impacts on Indonesian coastal ecosystems: A review. Front. Earth Sci.11. doi: 10.3389/feart.2023.1034827
86
Sachithanandam V. Bonthu S. Mageswaran T. Singh K. S. Vimala J. Sridhar R. et al . (2022). Effect of hydrodynamic conditions on seagrass ecosystems during Cyclone Lehar in the South Andaman Islands, India. Ecohydrology Hydrobiology22, 640–659. doi: 10.1016/j.ecohyd.2022.07.006
87
Sachithanandam V. Mageswaran T. Sridhar R. Purvaja R. Ramesh R. (2014). Assessment of Cyclone Lehar's impact on seagrass meadows in Ross and Smith Islands, North Andaman. Natural Hazards72, 1253–1258. doi: 10.1007/s11069-014-1040-8
88
Salauddin M. O'Sullivan J. J. Abolfathi S. Pearson J. M. (2021). ). Eco-engineering of seawalls—An opportunity for enhanced climate resilience from increased topographic complexity. Front. Mar. Sci.8. doi: 10.3389/fmars.2021.674630
89
Sánchez-González J. F. Sánchez-Rojas V. Memos C. D. (2011). Wave attenuation due to Posidonia oceanica meadows. J. Hydraulic Res.49, 503–514. doi: 10.1080/00221686.2011.552464
90
Schaefer R. Nepf H. (2024). Movement of and drag force on slender flat plates in an array exposed to combinations of unidirectional and oscillatory flow. J. Fluids Struct.124, 104044. doi: 10.1016/j.jfluidstructs.2023.104044
91
Serra T. Oldham C. Colomer J. (2018). Local hydrodynamics at edges of marine canopies under oscillatory flows. PloS One13, e0201737. doi: 10.1371/journal.pone.0201737
92
Sevim O. Otay E. N. (2024). Effects of fallen posidonia oceanica seagrass leaves on wave energy at sandy beaches. Water16, 16. doi: 10.3390/w16162261
93
Shukla J. B. Arora M. S. Verma M. Misra A. K. Takeuchi Y. (2021). The impact of sea level rise due to global warming on the coastal population dynamics: A modeling study. Earth Syst. Environ.5, 909–926. doi: 10.1007/s41748-021-00246-1
94
Singhvi A. Luijendijk A. P. van Oudenhoven A. P. E. (2022). The grey – green spectrum: A review of coastal protection interventions. J. Environ. Manage.311, 114824. doi: 10.1016/j.jenvman.2022.114824
95
Stratigaki V. Manca E. Prinos P. Losada I. J. Lara J. L. Sclavo M. et al . (2011). Large-scale experiments on wave propagation over Posidonia oceanica. J. Hydraulic Res.49, 31–43. doi: 10.1080/00221686.2011.583388
96
Sumer B. M. Fredse J. (2006). Hydrodynamics around cylindrical strucures. World Scientific26.
97
Tanino Y. Nepf H. M. (2008). Lateral dispersion in random cylinder arrays at high Reynolds number. J. Fluid Mechanics600, 339–371. doi: 10.1017/S0022112008000505
98
Temmerman S. Meire P. Bouma T. J. Herman P. M. J. Ysebaert T. De Vriend H. J. (2013). Ecosystem-based coastal defence in the face of global change. Nature504, 7478. doi: 10.1038/nature12859
99
Twomey A. J. Callaghan D. P. O'Brien K. R. Saunders M. I. (2022). Contextualising shoreline protection by seagrass using lessons from submerged breakwaters. Estuarine Coast. Shelf Sci.276, 108011. doi: 10.1016/j.ecss.2022.108011
100
Twomey A. J. O'Brien K. R. Callaghan D. P. Saunders M. I. (2020). Synthesising wave attenuation for seagrass: Drag coefficient as a unifying indicator. Mar. pollut. Bull.160, 111661. doi: 10.1016/j.marpolbul.2020.111661
101
van Hespen R. Hu Z. Borsje B. De Dominicis M. Friess D. A. Jevrejeva S. et al . (2023). Mangrove forests as a nature-based solution for coastal flood protection: Biophysical and ecological considerations. Water Sci. Eng.16, 1–13. doi: 10.1016/j.wse.2022.10.004
102
van Rooijen A. Lowe R. Rijnsdorp D. P. Ghisalberti M. Jacobsen N. G. McCall R. (2020). Wave-driven mean flow dynamics in submerged canopies. J. Geophysical Research: Oceans125, e2019JC015935. doi: 10.1029/2019JC015935
103
Vettori D. Pezzutto P. Bouma T. J. Shahmohammadi A. Manes C. (2024). On the wave attenuation properties of seagrass meadows. Coast. Eng.189, 104472. doi: 10.1016/j.coastaleng.2024.104472
104
Vierros M. (2017). Communities and blue carbon: The role of traditional management systems in providing benefits for carbon storage, biodiversity conservation and livelihoods. Climatic Change140, 89–100. doi: 10.1007/s10584-013-0920-3
105
Vozzo M. L. Bishop M. J. Dafforn K. A. Steinberg P. D. Strain E. M. A. Pinto M. M. (2024). From experiment to intervention: A case study of scaling up marine eco-engineering from research to application. Environ. Sci. Policy158, 103800. doi: 10.1016/j.envsci.2024.103800
106
Wei W. Malekjafarian A. Salauddin M. (2024). Scour protection measures for offshore wind turbines: A systematic literature review on recent developments. Energies17, 5. doi: 10.3390/en17051068
107
Weitzman J. S. Zeller R. B. Thomas F. I. M. Koseff J. R. (2015). The attenuation of current- and wave-driven flow within submerged multispecific vegetative canopies. Limnology Oceanography60, 1855–1874. doi: 10.1002/lno.10121
108
Xu X. O'Sullivan J. J. Abolfathi S. Keenahan J. Pearson J. M. Salauddin M. (2025). Advances in understanding the challenges and opportunities of hybrid sea defence approaches for coastal resilience. Environ. Challenges19, 101130. doi: 10.1016/j.envc.2025.101130
109
Zeller R. B. Weitzman J. S. Abbett M. E. Zarama F. J. Fringer O. B. Koseff J. R. (2014). Improved parameterization of seagrass blade dynamics and wave attenuation based on numerical and laboratory experiments. Limnology Oceanography59, 251–266. doi: 10.4319/lo.2014.59.1.0251
110
Zhang Y. Tang C. Nepf H. (2018). Turbulent kinetic energy in submerged model canopies under oscillatory flow. Water Resour. Res.54, 1734–1750. doi: 10.1002/2017WR021732
Summary
Keywords
seagrass meadows, wave attenuation coefficient, drag coefficient, wave energy dissipation, wave transmission, turbulence kinetic energy, nature-based solutions
Citation
Xu X and Salauddin M (2025) Quantifying wave attenuation by seagrass: a comprehensive review of assessment techniques. Front. Mar. Sci. 12:1620592. doi: 10.3389/fmars.2025.1620592
Received
29 April 2025
Accepted
01 September 2025
Published
25 September 2025
Volume
12 - 2025
Edited by
Riccardo Briganti, University of Nottingham, United Kingdom
Reviewed by
Sachithanandam Veeraragavan, National Institute of Ocean Technology, India; Mariana Lima, University of Salford, United Kingdom
Updates
Copyright
© 2025 Xu and Salauddin.
This is an open-access article distributed under the terms of the Creative Commons Attribution License (CC BY). The use, distribution or reproduction in other forums is permitted, provided the original author(s) and the copyright owner(s) are credited and that the original publication in this journal is cited, in accordance with accepted academic practice. No use, distribution or reproduction is permitted which does not comply with these terms.
*Correspondence: M. Salauddin, md.salauddin@ucd.ie
Disclaimer
All claims expressed in this article are solely those of the authors and do not necessarily represent those of their affiliated organizations, or those of the publisher, the editors and the reviewers. Any product that may be evaluated in this article or claim that may be made by its manufacturer is not guaranteed or endorsed by the publisher.