Abstract
Norway mandates protocols to manage salmon aquaculture’s impact on the seabed, with B-assessments for directly beneath the cages and C-assessments for the broader surrounding seabed with more chemical and biological variables. This study aimed to utilize existing data of C-assessments to synthesize findings on the spatial impacts of organic enrichment and associated biogeochemical processes. We analyzed a total of 27 assessments from 16 sites of commercial salmon farms from 2016 to 2022 at Sulfjorden on the coast of Central Norway. Each assessment measured both biological and chemical variables at the local impact zone (~30 meters from sea cages), intermediate zone (30–500 m from sea cages), and the edge of intermediate zone (~ 500m from sea cages). The main finding was that C-assessments can detect subtle impacts of organic enrichment, even when B-assessments rate the benthic environment beneath the farms as very good. The levels of Carbon (C), Nitrogen (N), Zinc (Zn), Copper (Cu), and the biodiversity of benthic macrofauna varied significantly in the different zones (p< 0.05). Chemical variables showed the highest influence in the local impact zone, with levels decreasing promptly with distance from the cages. At the boundary of the intermediate zone, the levels were no longer different from those at the reference site. Furthermore, chemical support variables were negatively correlated with benthic biodiversity (all p< 0.05), supporting that these variables can reveal subtle changes and spatial variations in the state of the benthic ecosystem. Thus, we suggest that C-assessments are a reliable approach for detecting benthic changes beyond the immediate impact zone while also confirming whether these effects are limited to areas near the facility. While the C-assessment primarily relies on benthic fauna analyses to evaluate environmental conditions, our findings suggest that supporting variables play a crucial role in predicting the spatial dynamics of organic enrichment from cage aquaculture.
1 Introduction
Considering the stagnation of captured fisheries and the limited availability of land resources, marine aquaculture is expected to meet the increasing demand for seafood in the future while expanding in a more sustainable manner (Dong et al., 2022; FAO, 2022). The implementation of sustainable environmental development in marine aquaculture in Europe is among others regulated by the EU’s Water Framework Directive (WFD; EU Directive 2000/60/EC) and the Marine Strategy Framework Directive (MSFD; EU Directive 2008/56/EC). These legislations prioritize the protection and restoration of aquatic ecosystems, advocate for sustainable management, and long-term ecological well-being (Lambert et al., 2017).
The principles of environmental sustainability in marine aquaculture in Norway are embedded within national Norwegian regulations and policies (Bailey and Eggereide, 2020; Moe Føre et al., 2022). The Norwegian Government has implemented regulations for legally required Environmental Monitoring of Benthic Impact from Aquaculture, known as B- and C- assessment (hereafter called NS 9410). These assessments were based on the Monitoring-On-growing Fish Farm-Modelling (MOM) approach and compliance with the requirements outlined in the Water Framework Directive (Ervik et al., 1997; EU Water Framework Directive, 2000; Standards Norway, 2016). The B-assessment focuses specifically on the seabed of the production zone directly beneath the cage facility and is conducted during each production cycle (Standards Norway, 2016; Broch et al., 2017; Wang and Olsen, 2024). Its variables include pH, redox potential and sensory attributes, while the presence of benthic macrofauna is required, but is not decisive for assessing environmental conditions. To account for potential benthic impacts extending beyond the facility, NS 9410 also includes the C-assessment, which specifically targets the seabed of the intermediate zone, typically located at 30–500 meters from the sea cages. In contrast to the B-assessment, C-assessment focuses on in-depth analyses of macrofauna composition and includes additional variables such as measurements of organic matter, Cu, and Zn levels. While the B-assessment is mandatory at least once per production cycle during the period of maximum load (feed consumption), the C-assessment is undertaken at least once every three production cycles. The frequency may be increased based on the results of the preceding assessment or in response to requests for changes in production or facility construction (Standards Norway, 2016; Wang and Olsen, 2024). It is mandatory to publicly disclose the results of these assessments. In addition, for farms certified by the Aquaculture Stewardship Council (ASC), follow-up is carried out for each generation of fish (ASC, 2022).
Both the Norwegian regulation NS 9410 and the ASC Salmon Standard emphasize the sustainable production in accordance with the criteria of the EU Water Framework Directive. NS 9410 requires that the Ecological Quality Status (EQS) of the benthic environment outside the local impact zone be maintained at a status of ‘Good’ or better (Standards Norway, 2016). Similarly, the ASC Salmon Standard mandates that the EQS outside the Allowable Zone of Effect (AZE) must also be ‘Good’ or better, while within the AZE, it requires the presence of at least two benthic macrofaunal species that are not considered pollution indicators (ASC, 2024).
Flows of biogenic wastes can be quantified using simple mass balance methods (Olsen et al., 2008; Wang et al., 2013; Aas et al., 2020). Studies have revealed that approximately 58% of the carbon (C), 60% of the nitrogen (N), and 80% of the phosphorus (P) from the feed were not assimilated into the tissues of salmon; instead, these nutrients were released into the environment as either inorganic nutrients entering the surface water or particulate organic wastes that primarily settle to the seabed (Wang and Olsen, 2023). The majority of N (~47% of feed N) was released as its inorganic form affecting the surface waters ecosystem, while the majority of P (~61% of feed P) was released as particulate organic P mainly affecting mainly the seafloor ecosystem (Wang et al., 2013; Wang and Olsen, 2023).
Many studies have reported the increased presence of zinc (Zn) and copper (Cu) in the benthic environment exposed to salmon production wastes (Lewis and Metaxas, 1991; ASC, 2022). Zn primarily originates from fish feed, supporting growth and physiological functions, while Cu mainly originate from antifouling coatings applied to the cage nets (Lewis and Metaxas, 1991; Maage and Julshamn, 1993; Maage et al., 2001; Braithwaite and McEvoy, 2004). The bioavailability after discharge from aquaculture production activities remains unclear, and site-specific field studies are needed to assess their impacts on benthic macrofauna (Matthiessen et al., 1999).
The deposition of particulate organic matter, which can be resuspended and distributed up to 500 meters away from the cage facility, may lead to levels of enrichment that cause harm if levels exceed the environmental carrying capacity (Keeley et al., 2013; Broch et al., 2017). Carrying capacity can vary pronouncedly from site to site and are influenced by various biophysical conditions (Carroll et al., 2003; Holmer et al., 2005; Kalantzi and Karakassis, 2006; Hargrave et al., 2022; Bannister et al., 2014). Nevertheless, the area’s capacity to disperse and resuspend particles, along with the benthic fauna’s ability to break down residual matter, enables recovery in areas exposed to moderate organic loading. Environmental factors such as sea surface temperature (SST), water current velocity, water depth, farm size, maximum allowed biomass, and operational specifics (production cycles) play a crucial role for the recovery process (Borja et al., 2010; Hale et al., 2023; Karakassis et al., 1999; Macleod et al., 2004, 2007). Wang and Olsen (2024) found that more effective recovery rates have been observed in the early stages of seafloor degradation compared to later stages, suggesting that early detection of benthic environmental degradation is important for ensuring sustainable aquaculture activity. Benthic macrofauna data from C-assessments provide valuable insights into species biodiversity and sensitivity, and previous studies indicated that macrofauna community analysis is more sensitive to detecting subtle effects of organic enrichment than analysis of chemical compounds (Kutti et al., 2007; Salvo et al., 2017; Keeley et al., 2019).
The main objective of the study was to conduct a comprehensive analysis of data from C-assessments across multiple salmon farms to validate the effectiveness of the monitoring program and provide broader, more reliable insights into the impacts of salmon farming on the seabed. Specifically, we aimed compile and analyze nationally collected data on chemical and biological variables from C-assessments in an area with a high density of fish farms and similar environmental conditions to assess the spatial impacts of aquaculture on the recipient seafloor. Selecting such area helps minimize the influence of other environmental and anthropogenic variables, as chemical and biological parameters may otherwise be affected by a wide range of external factors.
We analyzed chemical and biological variables from C-assessments conducted within the four distinct zones surrounding salmon farms in our study area. These zones represented different distances from the sea cages, allowing for analysis of a broader representative spatial variations in potential impact. A total of 27 C-assessments from 16 sites of commercial salmon farms from 2016 to 2022 in above study areas were included in the present study.
2 Materials and methods
2.1 Study area
We analyzed chemical and biological variables from C-assessments from Sulfjorden, a relatively small area with a high density of large salmon cage farms, situated in the archipelago of the Frøya island on the coast of Central Norway (Figure 1). The average velocity of the water current (measured 4m above the seabed) ranges from 3 to 8 cm/s, with frequent occurrences of maximum water current higher than 25 cm/s (Keeley et al., 2019). According to the individual C-assessment reports and Keeley et al. (2019), the sediments is relatively uniform, consisting of firm, noncohesive medium to coarse sand, with some unconsolidated shell fragments of irregular form. A total of 27 C-assessments reported from 16 commercial Atlantic salmon farms that operated within this region from 2016 to 2022 were available (Table 1).
Figure 1
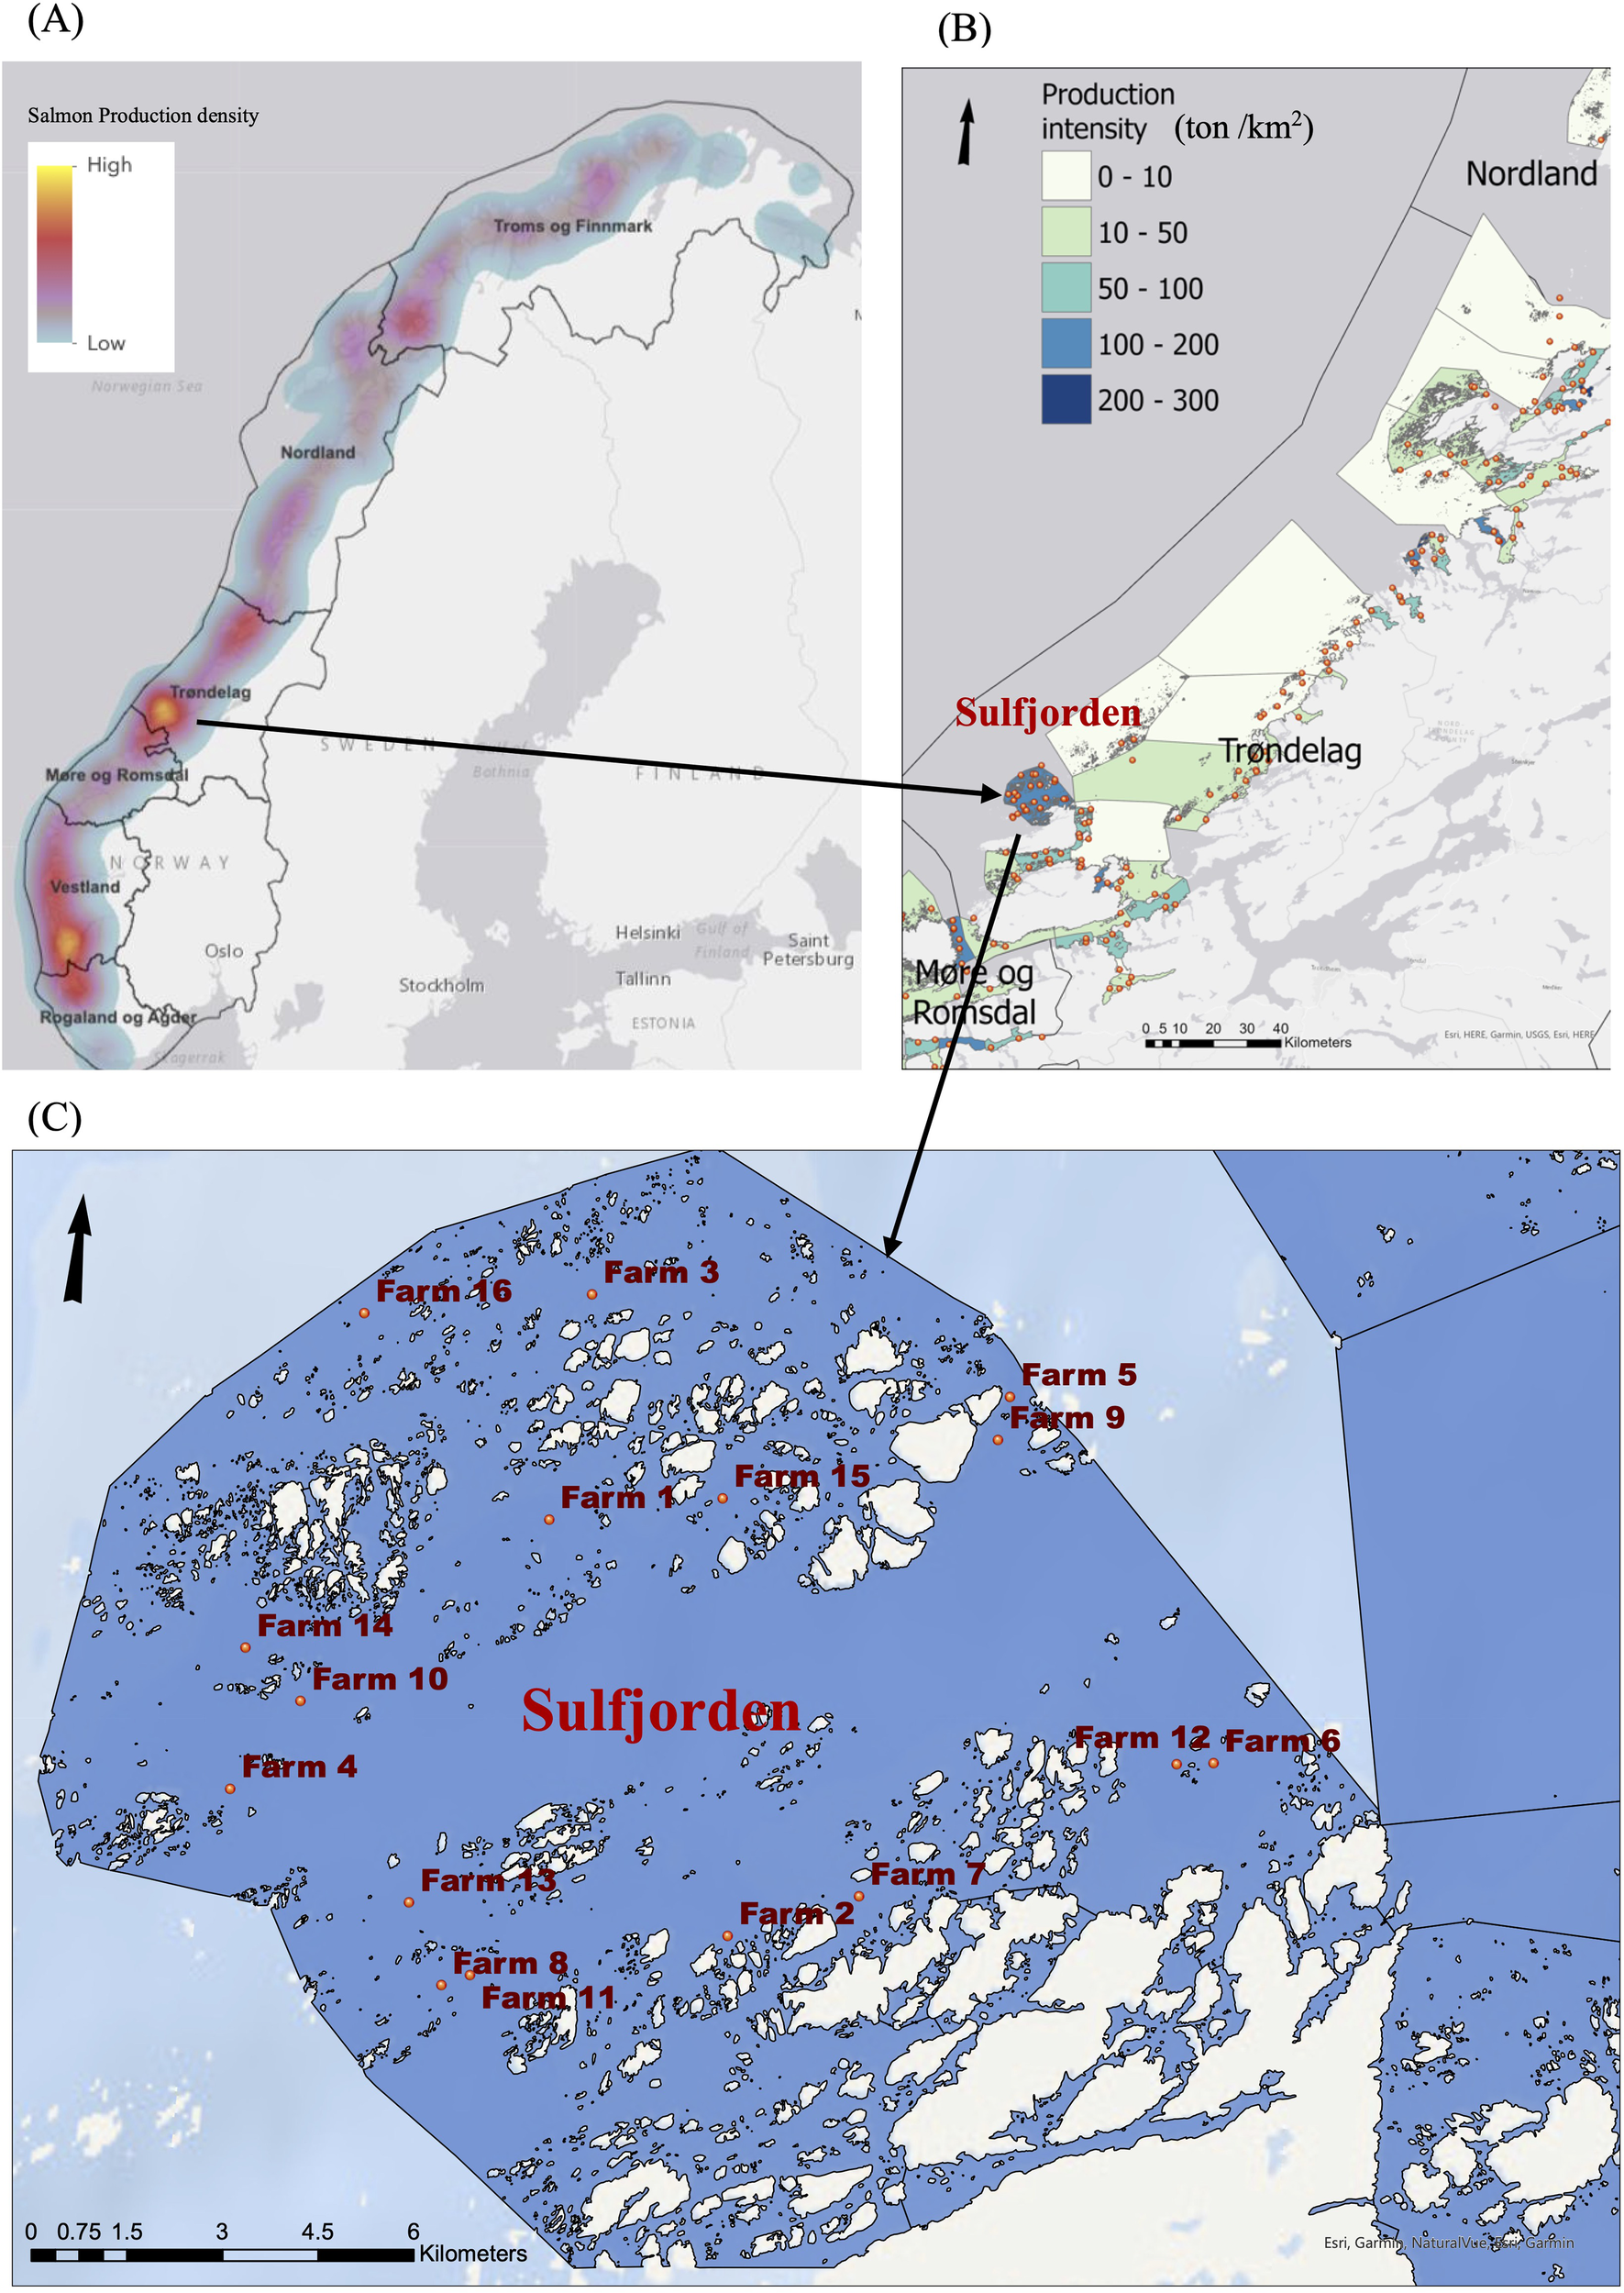
Study area in Norway with surveys from 2016 to 2022. (A) Heatmap of salmon production density (ton/km2). (B) Location of salmon farms and production density of Trøndelag county, central Norway. Orange dot: locations of salmon farms; (C) Location of salmon farms in Sulfjorden in Frøya region. Number: the identification of individual farms.
Table 1
| Farm | Survey time | Operating time (month) | Number of sampling stations | Accumulated given feed (ton) | Recent b-assessment |
|---|---|---|---|---|---|
| Farm 1 | 2020/8/17 | 19.8 | 6 | 8601 | 1 (Very good) |
| 2022/7/26 | 19 | 6 | 10368 | 1 (Very good) | |
| Farm 2 | 2018/8/2 | 16.3 | 4 | 2075 | 1 (Very good) |
| Farm 3 | 2020/8/12 | 18.6 | 6 | 10093 | 1 (Very good) |
| Farm 4 | 2020/8/17 | 15.8 | 6 | 8450 | 1 (Very good) |
| Farm 5 | 2018/6/26 | 16.1 | 4 | 9789 | 1 (Very good) |
| 2020/3/21 | 10.8 | 8 | 8450 | 1 (Very good) | |
| Farm 6 | 2016/11/3 | 0 | 6 | 0 | 1 (Very good) |
| 2019/7/18 | 7.6 | 5 | 1013 | 1 (Very good) | |
| 2020/5/13 | 17.6 | 7 | 6449 | Not Available | |
| 2022/5/6 | 17.4 | 8 | 5899 | 1 (Very good) | |
| Farm 7 | 2022/5/13 | 23.7 | 5 | 4802 | 1 (Very good) |
| Farm 8 | 2018/9/3 | 0 | 9 | 0 | 1 (Very good) |
| 2020/5/4 | 14.3 | 8 | 6548 | 1 (Very good) | |
| 2022/3/22 | 15.9 | 9 | 6260 | 1 (Very good) | |
| Farm 9 | 2017/6/21 | 3.7 | 4 | 3326 | Not Available |
| Farm 10 | 2020/8/20 | 15.9 | 6 | 8032 | 1 (Very good) |
| Farm 11 | 2018/9/3 | 0 | 9 | 0 | 1 (Very good) |
| 2020/5/4 | 14.3 | 8 | 6548 | 1 (Very good) | |
| 2022/3/22 | 15.9 | 9 | 6260 | 1 (Very good) | |
| Farm 12 | 2018/11/14 | 0 | 7 | 0 | 1 (Very good) |
| 2022/5/6 | 17.4 | 8 | 5899 | 1 (Very good) | |
| Farm 13 | 2019/11/6 | 0 | 8 | 0 | 1 (Very good) |
| 2022/7/28 | 16.0 | 8 | 3076 | 1 (Very good) | |
| Farm 14 | 2020/6/30 | 15.2 | 8 | 5621 | 1 (Very good) |
| Farm 15 | 2020/8/5 | 16.4 | 4 | 2411 | 1 (Very good) |
| Farm 16 | 2022/3/11 | 13.0 | 6 | 3768 | 1 (Very good) |
| Total 16 Farms | 27 times of survey |
182 sites of stations |
C-assessments from 16 salmon cage farms at Sulfjorden from 2016 to 2022.
Survey time: The time when the c-assessment was conducted. Operating time (month): The estimated duration from the beginning of the production cycle to the survey time. Number of Sampling Stations: The total number of sampling stations for this c-assessment. Accumulated feed given: The total feed consumption for the salmon cage throughout the production cycle. The result of a recent b-assessment is defined as the b-assessment survey conducted in the same year, usually within 3 months.
2.2 Benthic environmental assessment
C-assessments were carried out by accredited companies in accordance with Norwegian regulation NS 9410, which governs the monitoring of benthic impacts from salmon cage farms (Standards Norway, 2016). Triplicate sampling was conducted at each station. The results were recorded in the Norwegian Directorate of Fisheries database (https://www.fiskeridir.no/Tall-og-analyse/AApne-data). The environmental variables derived from multiple C-assessment reports were comprehensively analyzed in the present study.
Sediment samples were collected using a Van Veen grab (0.1m2) at multiple locations beneath and at varying distances from the fish farm. Locations included the local impact zone (about 30 meters from the net pens), the intermediate zone (30 to 500 meters from the sea cages), and the edge of intermediate zone (approximately 500 meters from the sea cages) (Figure 2). Each sample were analyzed to determine the selected environmental variables, including pH, redox potential (Eh), organic matter content, carbon (C), phosphorus (P), nitrogen (N), copper (Cu), zinc (Zn), and benthic macrofauna richness and abundance.
Figure 2
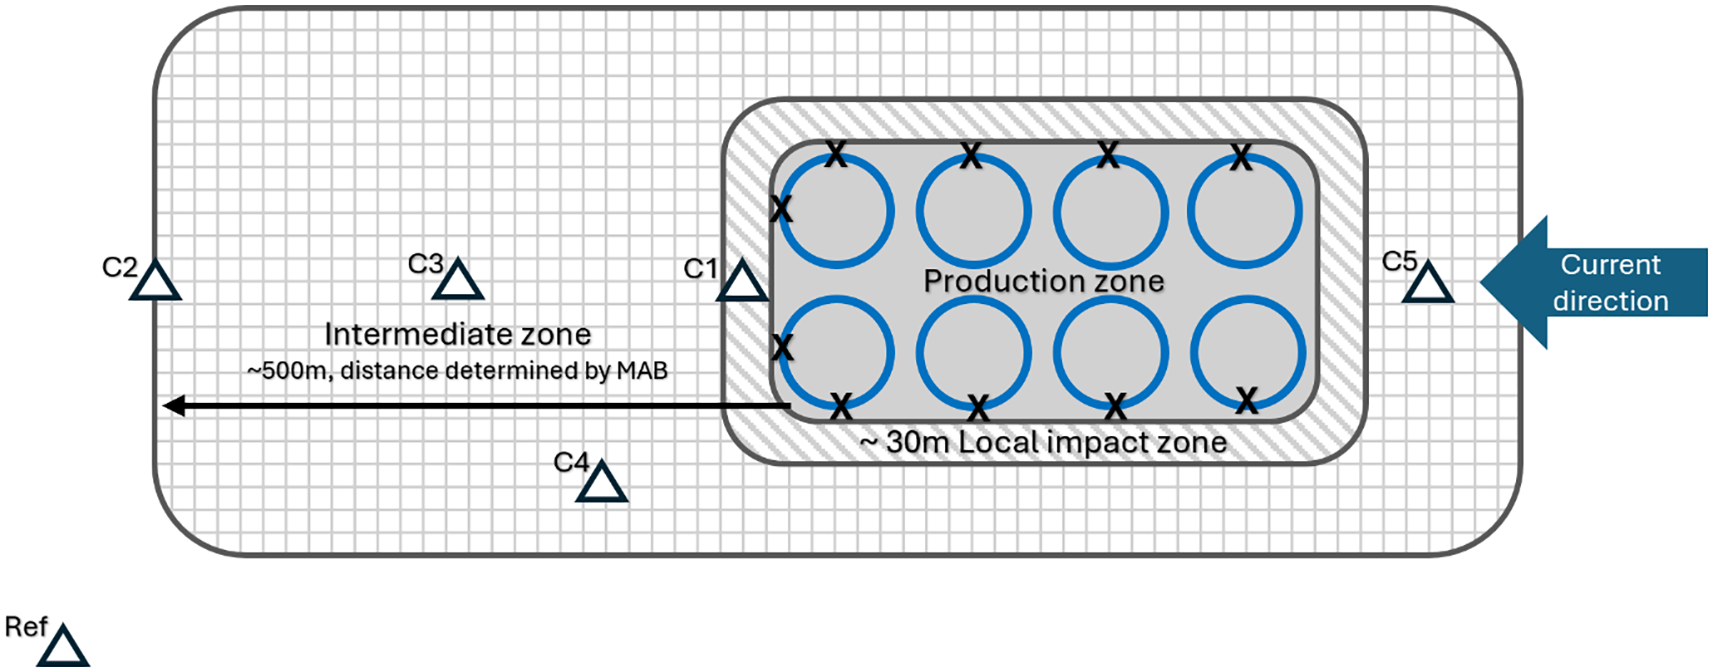
Schematic illustration of sampling locations (triangles) for C-assessment, adapted and revised from after NS 9410 (Standard Norge, 2016). The radius distance of the intermediate zone is determined by the MAB (Maximum allowable biomass). If the MAB is less than 2000 tons, the radius is 300 meters. For MAB values between 2000 and 3600 tons, the radius is 400 meters. If the MAB exceeds 3600 tons, the radius is 500 meters. The sampling stations should be placed based on information on currents and topography, preferably in the primary direction of the dispersion flow. If there are limited deep areas nearby, samples should be taken there (C4) and also consider samples in the return flow direction (C5). For illustrative purposes, crosses have been inserted to show the sampling area in a B survey, at the edge of each cage.
The pH and Eh were measured on board using platinum electrodes and either glass electrodes or ISFET (Ion Sensitive Field Effect Transistor), respectively. The level of C, N, P were analyzed according to Norwegian standard NS-EN ISO 16665 and NS-EN ISO 5667-19, while the Zn and Cu were analyzed according to Norwegian standard 11885. The macrofauna were sorted and kept by utilizing sieves with circular apertures varying in diameter from 1.0mm (Standards Norway, 2016).
The accumulated feed consumption is also presented in the C-assessment report, which refers to the total feed use from the start of the production cycle (fish release) to the sampling day.
2.3 Taxa classification and calculation of faunal index scores
All organisms were quantified and identified to the lowest taxonomic level possible by bodies certified for making C-assessment. Their taxonomic classification was confirmed using the World Register of Marine Species (WoRMS) database (WoRMS Editorial Board, 2023). At each sampling station, both richness and abundance were analyzed. Richness refers to the number of different species, while abundance represents the total number of individuals.
Macrofaunal species were classified using Norwegian sensitivity Index (NSI) into five ecological groups (EG): sensitive species (EG 1), indifferent species (EG 2), tolerant species (EG 3), opportunistic species (EG 4), and pollution indicating species (EG 5) (Borja et al., 2000).
This study uses taxa data from C-assessments to calculate various faunal index scores, including the Shannon–Wiener Index (H’), Hurlbert Index (ES100), AZTI Marine Biotic Index (AMBI), and Norwegian Sensitivity Index (NSI). The corresponding scores and Ecological Quality Status (EQS) classifications: High, Good, Moderate, Poor, and Bad, as described in Table 2.
Table 2
| Faunal Index | EQS Classification | ||||
|---|---|---|---|---|---|
| High | Good | Moderate | Poor | Bad | |
| H’ | 3.7- 5.5 | 2.9 – 3.7 | 1.8 – 2.9 | 0.9 – 1.8 | < 0.9 |
| ES100 | 23 - 46 | 16 -23 | 9 -16 | 5 - 9 | 0 - 5 |
| AMBI | < 1.2 | 1.2 - 3 | 3 – 3.9 | 3.9 – 4.8 | > 4.8 |
| NSI | >27.4 | 23.1 – 27.4 | 18.8 – 23.1 | 10.4 – 18.8 | < 10.4 |
Faunal Index Scores and Ecological Quality Status (EQS) evaluating the impacts of organic enrichment on macrofaunal communities for Norwegian Sea Norskehavet Sør region. H’: Shannon–Wiener index.
ES100, Hurlbert index; AMBI, AZTI Marine Biotic Index; NSI, Norwegian Sensitivity Index (Direktoratsguppen vanndirektivet, 2018; Standards Norway, 2016).
2.3.1 Shannon–Wiener index (H’)
H’ (Shannon-Wiener Diversity Index) measures species diversity by accounting for both richness and evenness. It quantifies the uncertainty in predicting the species identity of a randomly chosen individual from a sample (Shannon and Weaver, 1949). Higher values indicate greater diversity. H’ was calculated as:
Where:
-
S is the species richness, representing the total number of different species.
-
Pi is the proportion of individuals belonging to the species, defined as Pi = Ni/N.
-
Ni is the abundance of species i.
-
N is the total abundance of all species.
2.3.2 Hurlbert index (ES100)
ES100 (Hurlbert’s Expected Number of Species for 100 Individuals) estimates species richness standardized to a sample size of 100, allowing comparisons across samples of different sizes (Hurlbert, 1971). It represents the expected number of species in a random subset of 100 individuals. ES100 was calculated using:
Where:
-
S is the species richness, representing the total number of different species.
-
Ni is the abundance of species i.
-
N is the total abundance of all species.
2.3.3 AZTI marine biotic index
AZTI Marine Biotic Index (AMBI) assesses environmental quality based on the relative abundance of species classified by their sensitivity to pollution. Higher values indicate greater ecological disturbance. AMBI value was calculated as:
Where:
-
Ni is the abundance of species i.
-
S is the species richness, representing the total number of different species.
-
NAMBI is the total abundance of all species classified in ecological groups.
-
AMBIi is the sensitivity value of species i.
The assigned sensitivity values (AMBIi) for each ecological group (EG) in Equation 3 are as follows: EG1: 0, EG2: 1.5, EG3: 3, EG4: 4.5, and EG5: 6.
2.3.4 Norwegian sensitivity index
The Norwegian Sensitivity Index (NSI) evaluates environmental conditions based on species abundance, with each species assigned a sensitivity value, which also incorporates the average ES100 values from all individuals in the sample. While developed on principles similar to AMBI, NSI uses a reversed sensitivity ranking, assigning the highest values to the most sensitive species and demonstrates stronger correlations with various environmental pressures in Norway’s coastal areas (Rygg and Norling, 2013). Higher values indicate a community dominated by sensitive species, reflecting better environmental quality. NSI value was calculated using:
Where:
-
Ni is the abundance of species i.
-
S is the species richness, representing the total number of different species.
-
NNSI is the total abundance of all species classified in ecological groups.
-
NSIi is the sensitivity value of species i.
2.4 Statistics and data processing
All spatial and statistical analyses were conducted in the Python 3.9 programming environment (Van Rossum and Drake, 2009), using the pandas (McKinney, 2010), GeoPandas (Jordahl, 2014), SciPy (Virtanen et al., 2020), and statsmodels (Seabold and Perktold, 2010) software library. The plots were performed using ArcGIS Pro (Version 2.7, release 2021), Python Matplotlib (Hunter, 2007), and seaborn (Waskom, 2021) software library. The results of variables are reported as means ± 1 standard error (SE). Differences in variables among sampling stations were assessed using Kruskal–Wallis test, followed by Dunn’s post-hoc test for multiple comparisons, with a significance level set at 0.05.
We used Principal Component Analysis (PCA) to investigate the relationship between chemical variables and benthic macrofaunal communities across different EQS. Regression analysis was then applied to assess correlations between the variables, while correlation strength and significance were assessed using Spearman’s nonparametric correlation coefficient (rho) and its corresponding p-value. The significance limits were set at 0.05. Regression curves were fitted using linear regression, with the model determined based on the best R2 value.
3 Result
3.1 Spatial variations
Our data analysis revealed pronounced spatial variations in chemical and biological variables among the assessed zones ranging from 30m to 500m from the cages in our study area (Figures 1, 3). Significant differences were observed among the three zones in levels of N, P, Zn and Cu in sediments, as well as the richness and abundance of benthic macrofauna (all p< 0.01; Figures 3D–I). The mean molecular N:P ratio of sediments was found to be 3.10, 4.45, 5.78, and 5.84 at local impact zone (~30 m), intermediate zone (~200 m), edge of intermediate zone (~500 m), and the Reference station (~ 1000m), respectively. The ratio showed significant difference among all zones (Kruskal–Wallis test; p< 0.001). Specifically, the levels of N, P, Zn, Cu and the N:P ratio were found to be significantly different between the local impact zone (~ 30m) and the intermediate zone (~ 200m). However, no significant differences between the intermediate zone (~ 200m) and the edge of intermediate zone (~ 500m) were found (all p > 0.05) as well as between the edge of intermediate zone (~ 500m) and the reference station (~ 1000m) (all p > 0.05; Figure 3).
Figure 3
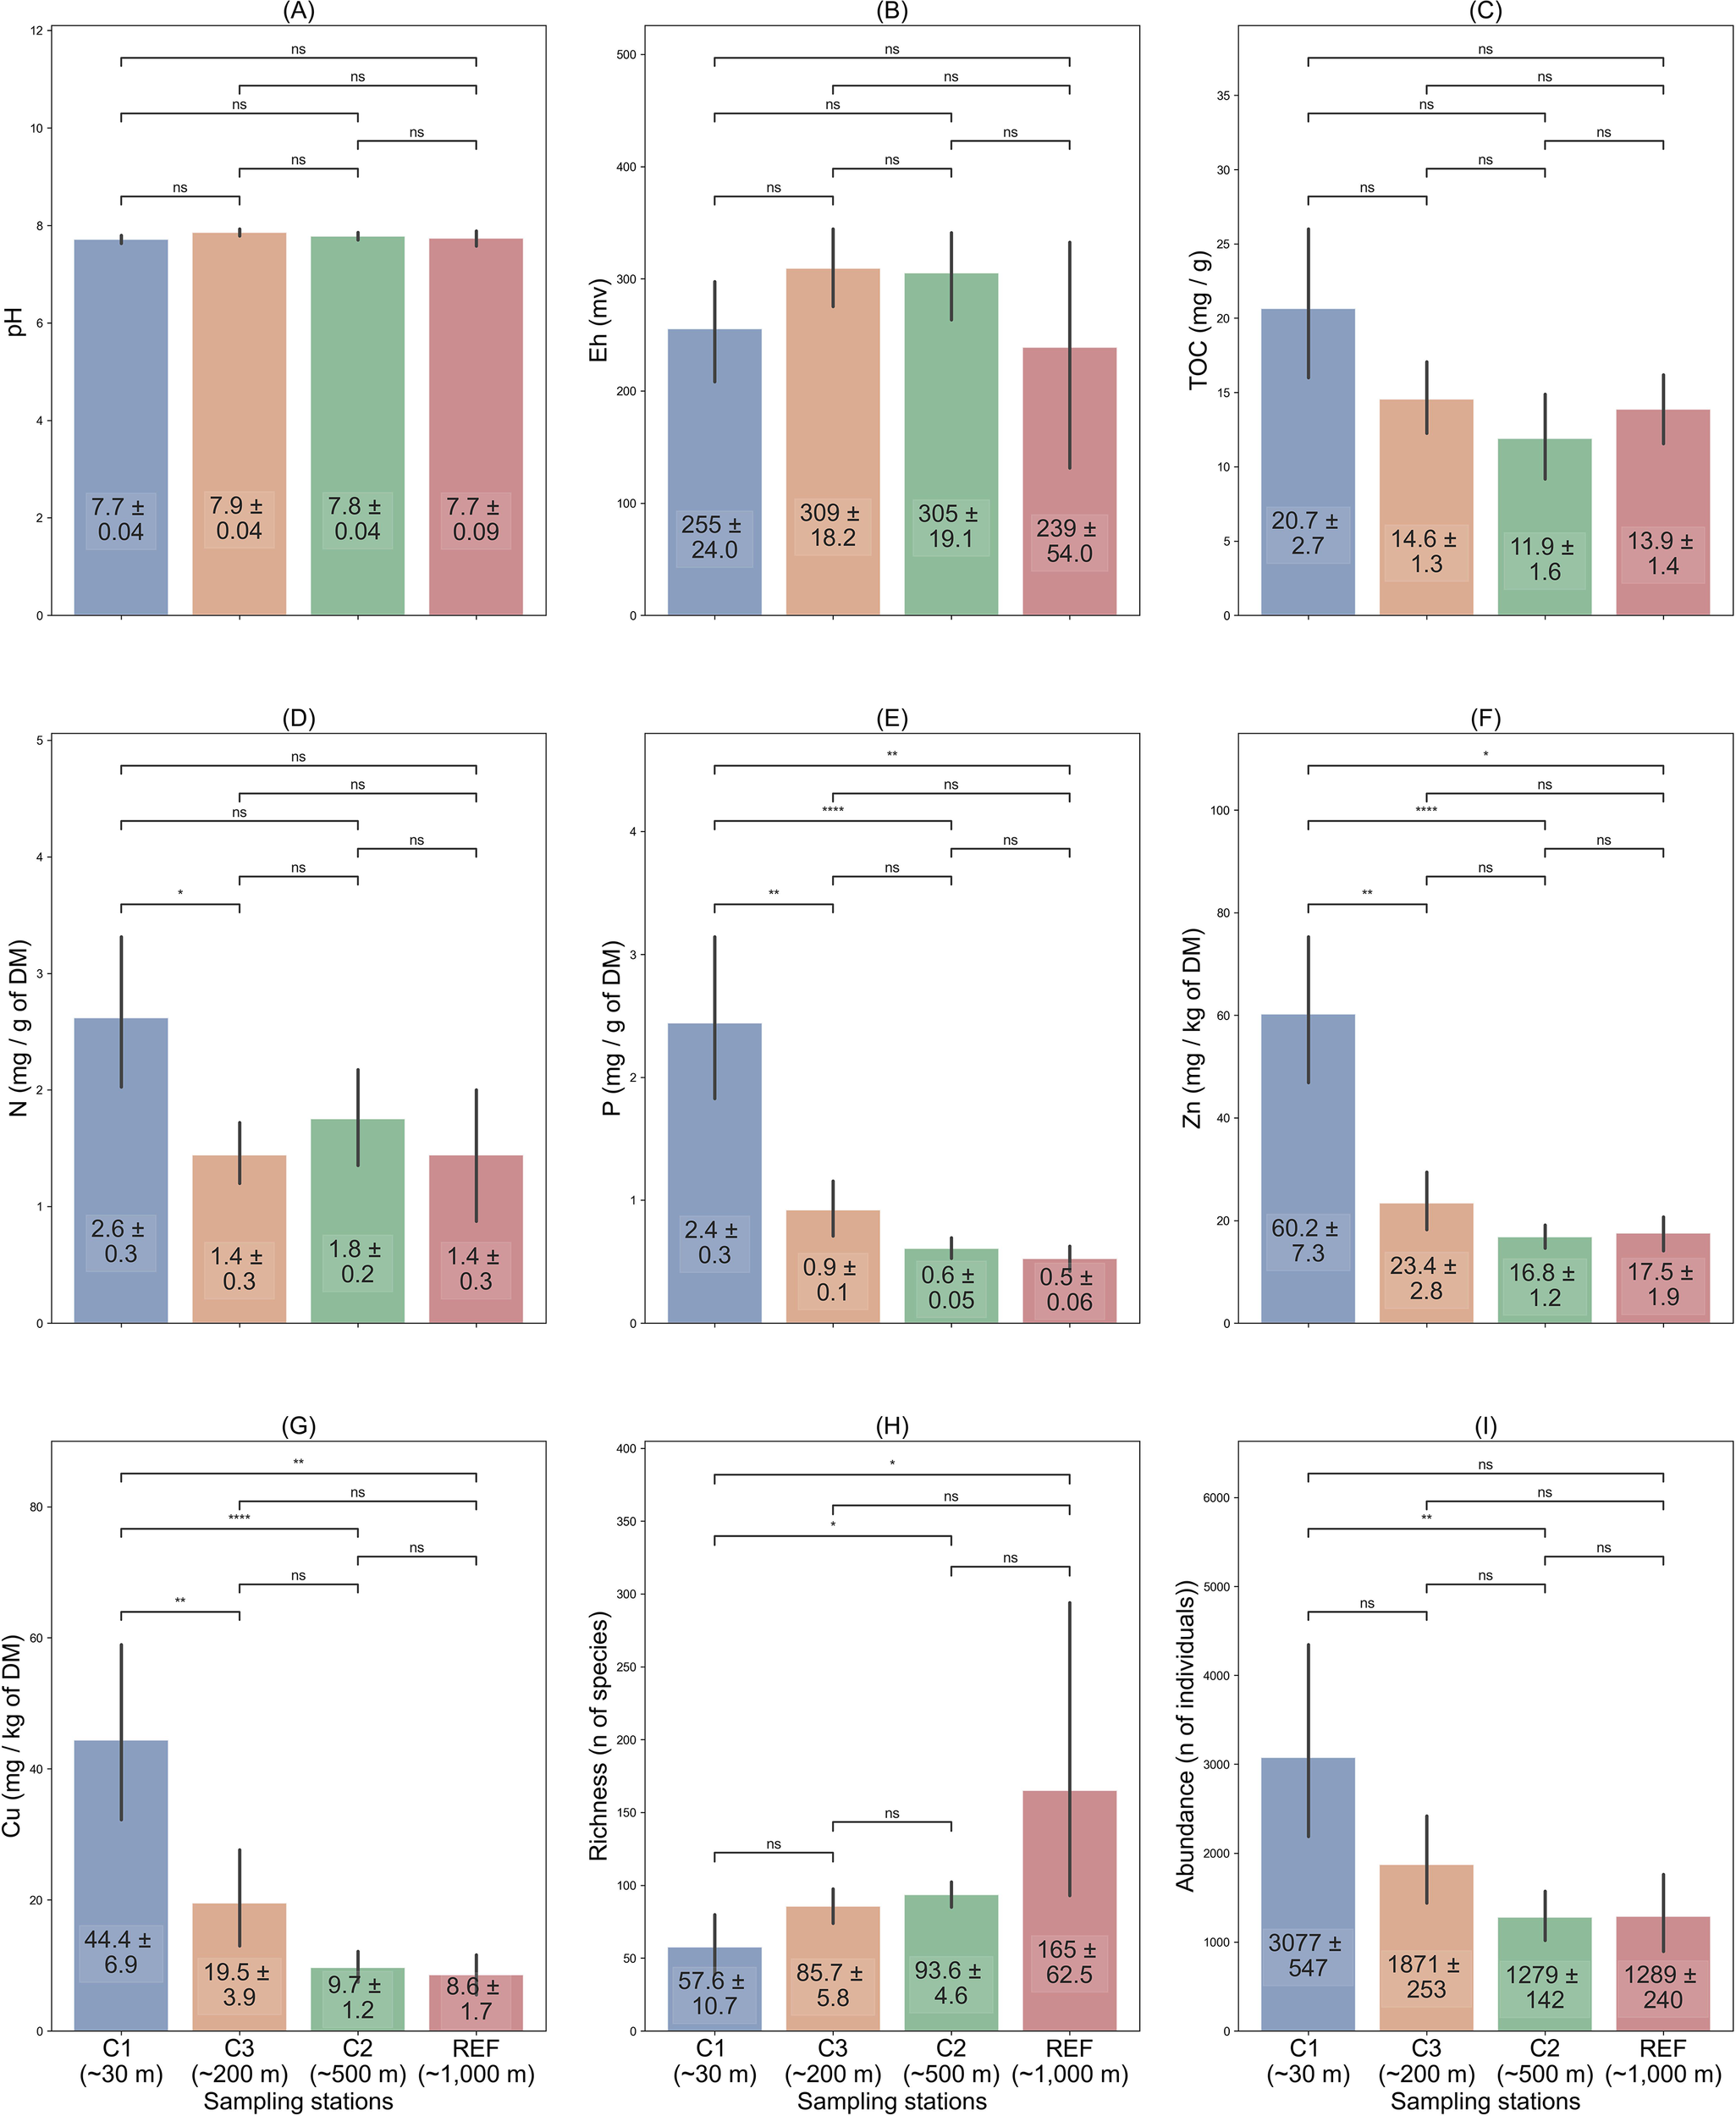
Mean values ( ± SE) for chemical and biological variables from various sampling locations from sea cage from salmon cage farms in Sulfjorden from 2016 to 2022. (A) pH, (B) Eh (oxidation-reduction potential), (C) Particulate Organic Carbon (C mg/g of DM), (D) Particulate Organic Nitrogen (N mg/g of DM), (E) Particulate Organic Phosphorus (P mg/g of DM), (F) Zinc (Zn mg/kg of DM), (G) Copper (Cu, mg/kg of DM), (H) Richness of benthic macrofauna (number of total species), and (I) Abundance of benthic macrofauna (number of total individuals). *Significant at p< 0.05, **Significant at p< 0.01, ***Significant at p< 1 × 10⁻³, ****Significant at p< 1 × 10⁻⁴, ns: not significant.
However, the variables pH (Kruskal–Wallis test, p = 0.11, Figure 3A) and Eh (Kruskal–Wallis test, p = 0.3, Figure 3B) did not show significant differences among any of the three sampling stations. It is noteworthy that the average C levels showed decreasing values with increasing distance from the sea cages, but this difference was not statistically significant (Kruskal–Wallis test, p = 0.04, Figure 3C). The statistical analysis suggested relatively good state of the benthic environments, when pH or Eh proved inadequate in detecting differences, the level of N (Kruskal–Wallis test, p = 0.02, Figure 3D), P (Kruskal–Wallis test, p< 0.001, Figure 3E)), Zn (Kruskal–Wallis test, p< 0.001, Figure 3G), and Cu (Kruskal–Wallis test, p< 0.001, Figure 3E) may have greater potential for detecting the subtle impact of organic enrichment on benthic chemistry.
3.2 Variations across production phases
Each C-assessment included information on the sampling time, the start time of each production cycle and the estimated accumulated use of feed during the corresponding production cycles (c.f., Table 1). These data, along with the assessment results, enabled us to investigate spatial variations and variations across production phases in benthic environments. The statistical analysis revealed a pronounced correlation between feed consumption and the level of N and P in the benthic environments across multiple sampling locations (Figure 4).
Figure 4
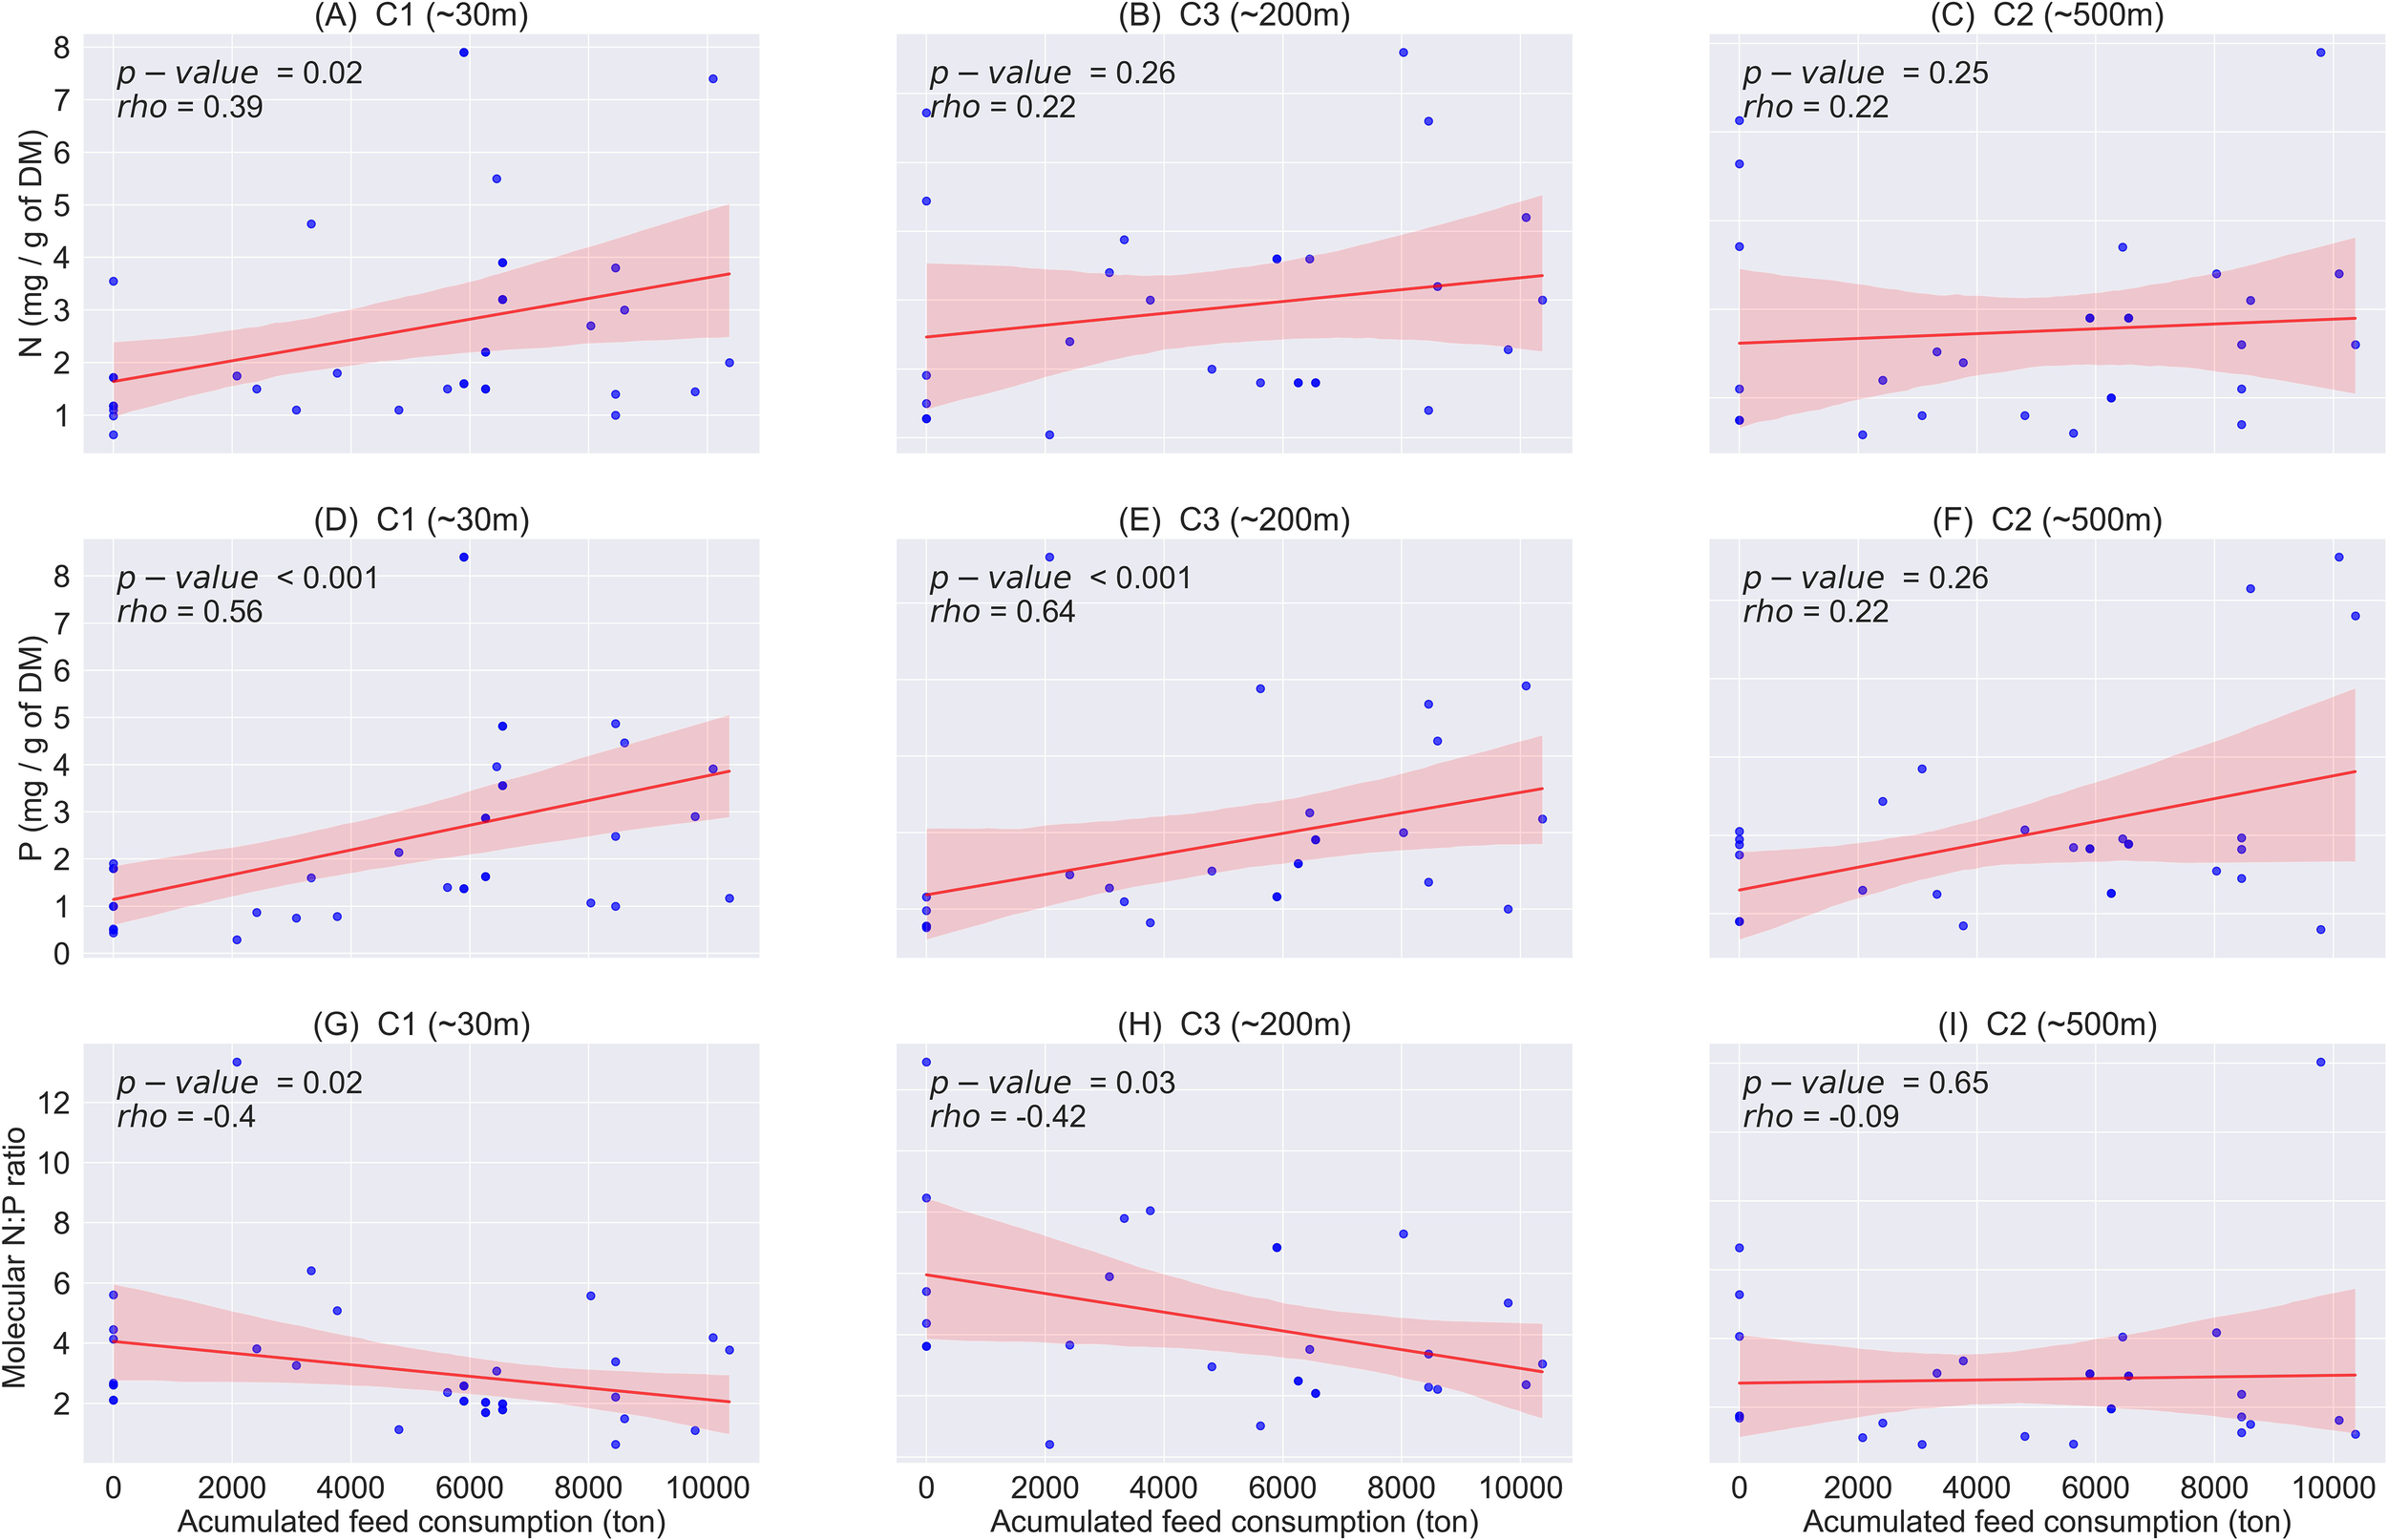
Correlation between accumulated feed consumption vs Nitrogen and Phosphors levels on the benthic environment at sampling locations from salmon cage farms in Sulfjorden from 2016 to 2022, with the shaded area representing the standard deviation of the error bounds. Correlation strength was assessed using Spearman’s rank correlation coefficient (rho) (A) N level at C1 (~30m), (B) N level at C3 (~200m), (C) N level at C2 (~500m), (D) P level at C1 (~30m), (E) P level at C3 (~200m), (F) P level at C2 (~500m), (G) N:P ratio at C1 (~30m), (H) N:P ratio at C3 (~200m), (I) N:P ratio at C2 (~500m). N, Nitrogen; P, Phosphors.
In the local impact zones (~30 m, C1), the levels of N (p = 0.02; Figure 4A) and P (p< 0.001; Figure 4D) in the benthic environment significantly increased as the accumulated use of feed increased. However, in the intermediate zones (~200 m, C3) and the edge of intermediate zone (~500 m, C2), there was no significant correlation found between the accumulated feed use on and the level of N (both p > 0.05; Figures 4B, C). In contrast, a significant correlation (p< 0.001) was observed between the accumulated feed use and the level of P in the intermediate zones (~200 m, C3) (Figure 4E), although no significant correlation was found at the edge of intermediate zone (~500 m, C2) (Figure 4D).
The molecular N:P ratios were found to decrease with the increasing accumulated feed consumption (Figures 4G–I). This trend was found statistically significant in the local impact zones (~30 m, C1) and the intermediate zone (~200 m, C3) (p< 0.05; Figures 4G, H), though no significant correlation was found at the edge of intermediate zone (~500 m, C2) (Figure 4I).
To sum up, the statistical analysis indicated a positive correlation between accumulated feed consumption and the presence of biogenic wastes in the benthic environment within the production zone (< 30m).
3.3 Benthic macrofaunal community
The biological state of the benthic environment in the study areas was assessed using various faunal index scores, including the Shannon–Wiener Index (H’, Equation 1), Hurlbert Index (ES100, Equation 2), AZTI Marine Biotic Index (AMBI, Equation 3), and the Norwegian Sensitivity Index (NSI, Equation 4). The resulting scores were classified into Ecological Quality Status (EQS) categories—High, Good, Moderate, Poor, and Bad—according to the EU Water Framework Directive (EU Directive, 2000/60/EC).
Spearman’s nonparametric correlation analysis was used to assess the correlations between individual faunal index scores (Figure 5). The statistical analysis revealed that all faunal index scores were significantly correlated with each other (p< 0.001), with the NSI (Figures 5B, F) exhibiting a slightly higher Spearman’s correlation (rho) value compared to AMBI (Figures 5A, E). Additionally, we calculated the faunal index scores for each sampling station and classified EQS (as defined in Table 2) across three sampling stations, as presented in Table 3. The results indicated that in the local impact zone (~30 m, C1), the EQS ranged from Moderate to Good, whereas in the intermediate zone (~200 m, C3) and at the edge of the intermediate zone (~500 m, C2), the EQS ranged from Good to High (Table 3). Furthermore, the coefficient of variation (CV) for the faunal index score exhibited a decreasing trend with increasing distance from the cage facility. In the local impact zone (~30 m, C1), the CV ranged from 44.8% to 73.6%; in the intermediate zone (~200 m, C3), it ranged from 22% to 55%; and at the edge of the intermediate zone (~500 m, C2), it ranged from 12.7% to 46%.
Figure 5
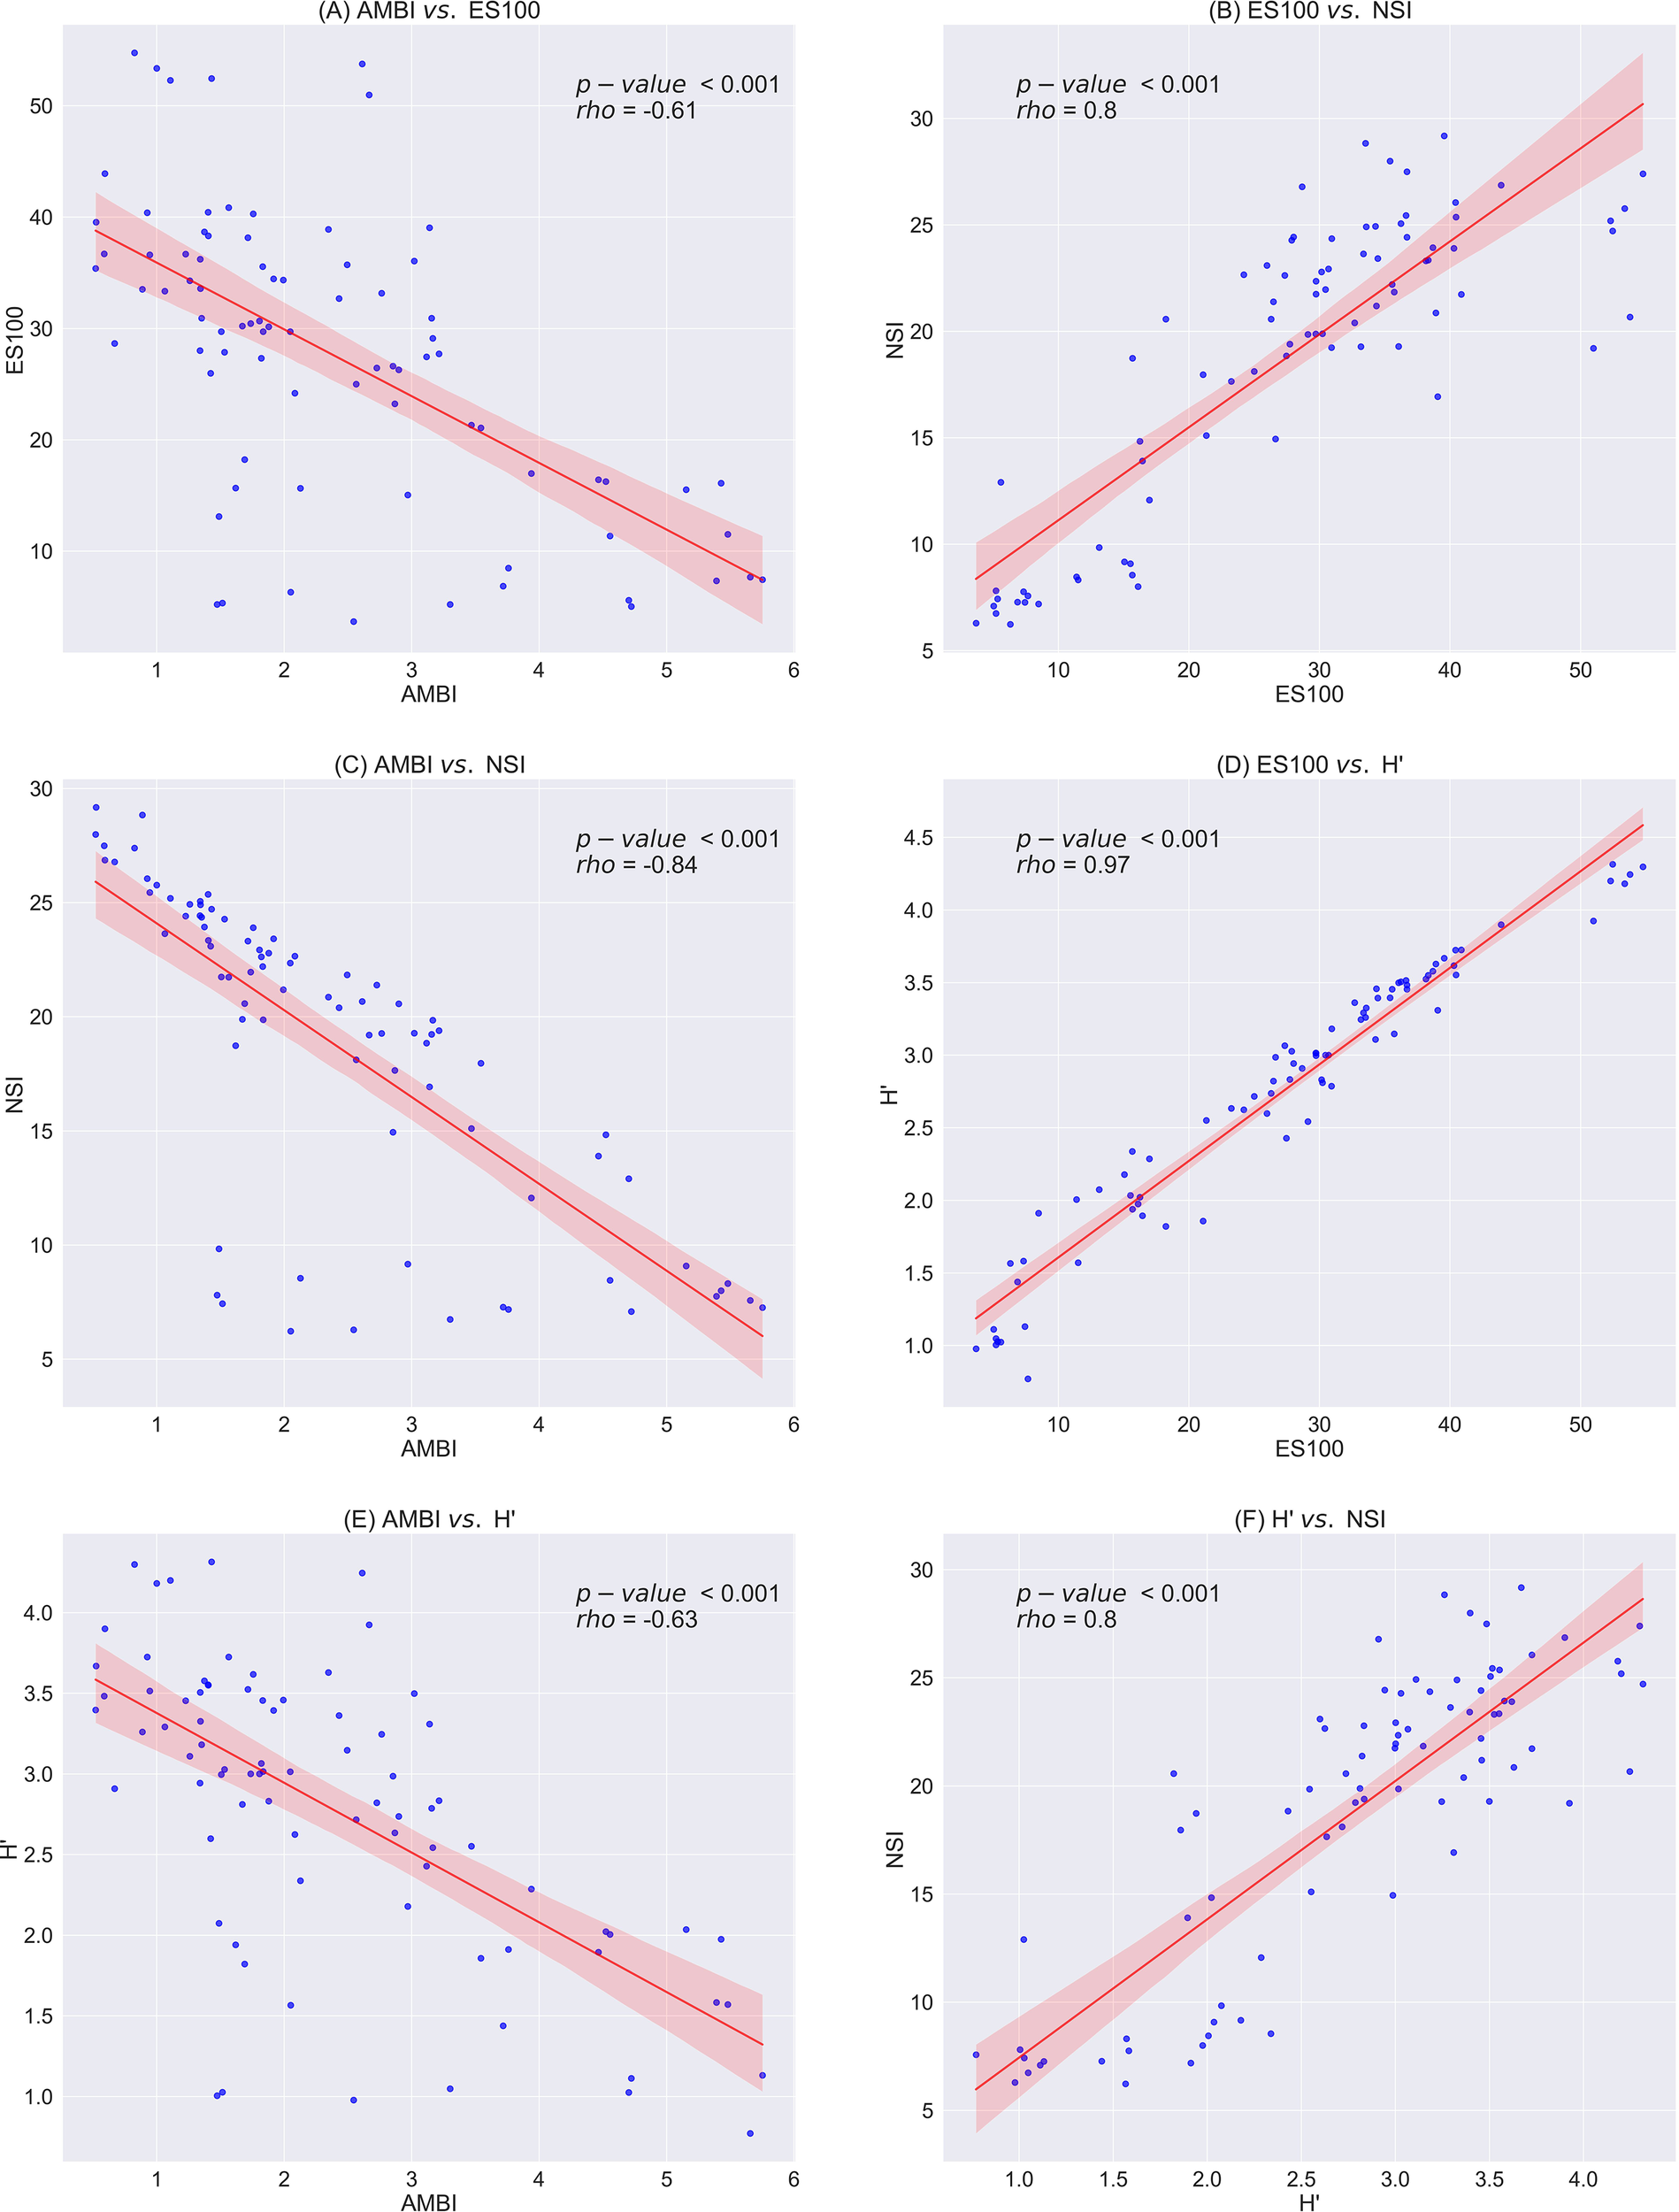
Correlation between biological indices in the benthic environment at salmon cage farms in Sulfjorden (2016–2022), with the shaded area representing the standard deviation of the error bounds. Correlation strength was assessed using Spearman’s rank correlation coef cient (rho). (A) AMBI vs. ES100, (B) ES100 vs. NSI, (C) AMBI vs. NSI, (D) ES100 vs. H’, (E) AMBI vs. H’, (F) H’ vs. NSI. H’, Shannon–Wiener index; ES100, Hurlbert index; AMBI, AZTI Marine Biotic Index; NSI, Norwegian Sensitivity Index.
Table 3
| Station | Faunal index | Score (Mean ± SD) | EQS | Coefficient of variance |
|---|---|---|---|---|
| C1 (~ 30m) |
H’ | 2.05 ± 0.88 | Moderate | 48.3% |
| ES100 | 16.17 ± 11.09 | Good | 73.6% | |
| AMBI | 3.28 ± 1.47 | Moderate | 44.8% | |
| NSI | 12.09 ± 5.84 | Poor | 48.3% | |
| C3 (~ 200m) |
H’ | 2.98 ± 0.69 | Good | 23.2% |
| ES100 | 30.63 ± 8.09 | High | 26.4% | |
| AMBI | 2.20 ± 1.21 | Good | 55% | |
| NSI | 21.13 ± 4.7 | Good | 22% | |
| C2 (~ 500m) |
H’ | 3.23 ± 0.53 | Good | 16.4% |
| ES100 | 34.67 ± 8.25 | High | 23.8% | |
| AMBI | 1.75 ± 0.81 | Good | 46.2% | |
| NSI | 23.16 ± 2.94 | Good | 12.7% |
Faunal index scores from various sampling locations from sea cage from salmon cage farms in Sulfjorden from 2016 to 2022.
As the findings suggest that NSI may better represent the Norwegian benthic environment, we used this index for further analysis of macrofauna distribution among ecological groups (EG) across different zones. A total of 895 species of benthic macrofauna were identified in the study area, of which 397 have been grouped into five EG based on the Norwegian Sensitivity Index (NSI). These groups include Sensitive- species (EG 1), Indifferent species- (EG 2), Tolerant species- (EG 3), Opportunistic species- (EG 4), and Pollution-indicating species (EG 5), as presented in Table 4. Additionally, Table 5 summarizes the top 50 taxa in terms of abundance and their distribution across multiple sampling locations. In the local impact zone (~30 m), the benthic macrofauna was dominated by EG 5, primarily Tubificoides benedii and Capitella capitata. In the intermediate zone (~ 200m), there was a noticeable decline in EG 5, while EG 4 species, mostly polychaetes, became dominant. Approaching the edge of the intermediate zone (~ 500m), both EG 4 and EG 5 continued to decline, while the population of EG 1 and EG 2 species increased, resembling the species composition at the reference site where the abundance of all EG were relatively equal, with EG 1 and EG 2 becoming dominant.
Table 4
| Taxonomic classification | Number of species in NSI Ecological Group | |||||||
|---|---|---|---|---|---|---|---|---|
| Phylum | Class | EG 1 | EG 2 | EG 3 | EG 4 | EG 5 | NC | All |
| Annelida | Clitellata | 0 | 0 | 0 | 0 | 2 | 2 | 4 |
| Polychaeta | 74 | 70 | 41 | 20 | 5 | 183 | 393 | |
| Sipuncula | 2 | 5 | 0 | 0 | 0 | 4 | 11 | |
| Arthropoda | – | 0 | 0 | 0 | 0 | 0 | 1 | 1 |
| Copepoda | 0 | 0 | 0 | 0 | 0 | 4 | 4 | |
| Malacostraca | 31 | 9 | 3 | 2 | 1 | 95 | 141 | |
| Ostracoda | 2 | 2 | 0 | 0 | 0 | 1 | 5 | |
| Pycnogonida | 1 | 0 | 0 | 0 | 0 | 3 | 4 | |
| Thecostraca | 0 | 0 | 0 | 0 | 0 | 5 | 5 | |
| Brachiopoda | – | 0 | 0 | 0 | 0 | 0 | 1 | 1 |
| Craniata | 0 | 0 | 0 | 0 | 0 | 1 | 1 | |
| Rhynchonellata | 0 | 0 | 0 | 0 | 0 | 3 | 3 | |
| Bryozoa | - | 0 | 0 | 0 | 0 | 0 | 1 | 1 |
| Chaetognatha | – | 0 | 0 | 0 | 0 | 0 | 1 | 1 |
| Chordata | - | 0 | 0 | 0 | 0 | 0 | 2 | 2 |
| Ascidiacea | 0 | 0 | 0 | 0 | 0 | 9 | 9 | |
| Leptocardii | 0 | 0 | 0 | 0 | 0 | 1 | 1 | |
| Teleostei | 0 | 0 | 0 | 0 | 0 | 1 | 1 | |
| Anthozoa | 2 | 3 | 2 | 0 | 0 | 2 | 9 | |
| Hydrozoa | 0 | 0 | 0 | 0 | 0 | 6 | 6 | |
| Echinodermata | - | 0 | 0 | 0 | 0 | 0 | 1 | 1 |
| Asteroidea | 1 | 0 | 2 | 0 | 0 | 2 | 5 | |
| Echinoidea | 4 | 1 | 1 | 0 | 0 | 7 | 13 | |
| Holothuroidea | 3 | 4 | 0 | 0 | 0 | 13 | 20 | |
| Ophiuroidea | 3 | 6 | 2 | 0 | 0 | 8 | 19 | |
| Foraminifera | – | 0 | 0 | 0 | 0 | 0 | 1 | 1 |
| Hemichordata | Enteropneusta | 0 | 0 | 0 | 0 | 0 | 1 | 1 |
| Graptolithoidea | 0 | 0 | 0 | 0 | 0 | 1 | 1 | |
| Mollusca | Bivalvia | 26 | 12 | 14 | 7 | 0 | 54 | 113 |
| Caudofoveata | 0 | 2 | 0 | 0 | 0 | 0 | 2 | |
| Gastropoda | 3 | 11 | 4 | 2 | 0 | 66 | 86 | |
| Polyplacophora | 2 | 0 | 0 | 0 | 0 | 7 | 9 | |
| Scaphopoda | 1 | 1 | 0 | 0 | 0 | 2 | 4 | |
| Solenogastres | 0 | 0 | 0 | 0 | 0 | 3 | 3 | |
| Nematoda | - | 0 | 0 | 0 | 0 | 0 | 1 | 1 |
| Nemertea | – | 0 | 0 | 1 | 0 | 0 | 0 | 1 |
| Hoplonemertea | 0 | 0 | 0 | 0 | 0 | 1 | 1 | |
| Pilidiophora | 0 | 0 | 0 | 0 | 0 | 1 | 1 | |
| Phoronida | - | 1 | 1 | 0 | 0 | 0 | 0 | 2 |
| Platyhelminthes | – | 0 | 1 | 0 | 0 | 0 | 0 | 1 |
| Turbellaria | 1 | 0 | 0 | 0 | 0 | 0 | 1 | |
| Porifera | – | 1 | 0 | 0 | 0 | 0 | 0 | 1 |
| Demospongiae | 0 | 0 | 0 | 0 | 0 | 2 | 2 | |
| Priapulida | Priapulomorpha | 0 | 0 | 1 | 0 | 0 | 0 | 1 |
| Rhodophyta | Florideophyceae | 0 | 0 | 0 | 0 | 0 | 1 | 1 |
| Tracheophyta | Magnoliopsida | 0 | 0 | 0 | 1 | 0 | 0 | 1 |
| All | 158 | 128 | 71 | 32 | 8 | 498 | 895 | |
Taxonomic identification at the class level of all species of benthic macrofauna found in 27 C-assessments from all salmon cage farms in Sulfjorden from 2016 to 2022.
EG 1, Sensitive species; EG 2, Indifferent species; EG 3, Tolerant species; EG 4, Opportunistic species; EG 5, Pollution indicating species; NC, Non-classified species. Benthic macrofauna were classified into EGs using NSI. EG, Ecological group, NSI, Norwegian sensitivity index.
Table 5
| Phylum | Class | Scientific name | NSI ecological group | C1 (~30 m) | C3 (~200 m) | C2 (~500 m) | REF (>1000m) | % * |
|---|---|---|---|---|---|---|---|---|
| Annelida | Clitellata | Tubificoides benedii | 5 | 14256 | 142 | 208 | 128 | 2.09% |
| Oligochaeta | 5 | 193 | 1292 | 725 | 107 | 0.33% | ||
| Polychaeta | Ophryotrocha sp. | 4 | 5983 | 715 | 11 | 2 | 0.95% | |
| Protodorvillea kefersteini | 4 | 4376 | 5293 | 3840 | 478 | 1.98% | ||
| Glycera lapidum | 1 | 102 | 742 | 379 | 199 | 0.20% | ||
| Eteone spp. | 4 | 495 | 329 | 115 | 35 | 0.14% | ||
| Phyllodoce mucosa | 5 | 2187 | 238 | 61 | 1 | 0.35% | ||
| Pholoe baltica | 3 | 304 | 372 | 409 | 112 | 0.17% | ||
| Sphaerosyllis hystrix | 1 | 25 | 346 | 313 | 12 | 0.10% | ||
| Sphaerosyllis taylori | 1 | 92 | 385 | 164 | 43 | 0.10% | ||
| Syllis cornuta | 3 | 374 | 404 | 266 | 51 | 0.15% | ||
| Chone spp. | 1 | 133 | 855 | 397 | 404 | 0.25% | ||
| Jasmineira sp. | 2 | 94 | 1701 | 1576 | 424 | 0.54% | ||
| Jasmineira caudata | 2 | 59 | 220 | 548 | 548 | 0.19% | ||
| Sabellidae | 2 | 51 | 1479 | 306 | 29 | 0.26% | ||
| Hydroides norvegica | 1 | 323 | 657 | 663 | 121 | 0.25% | ||
| Spirorbinae | NC | 716 | 966 | 1443 | 737 | 0.55% | ||
| Aonides paucibranchiata | 1 | 351 | 602 | 432 | 281 | 0.24% | ||
| Dipolydora | NC | 366 | 144 | 261 | 74 | 0.12% | ||
| Malacoceros vulgaris | 5 | 4919 | 246 | 2 | 1 | 0.73% | ||
| Pseudopolydora nordica | 4 | 2042 | 1468 | 342 | 0.55% | |||
| Pseudopolydora paucibranchiata | 4 | 6 | 557 | 1156 | 15 | 0.25% | ||
| Spio sp. | 2 | 188 | 166 | 567 | 10 | 0.13% | ||
| Spio decorata | NC | 253 | 80 | 182 | 41 | 0.08% | ||
| Spio filicornis | 3 | 288 | 106 | 125 | 42 | 0.08% | ||
| Ampharete octocirrata | 1 | 1 | 292 | 305 | 46 | 0.09% | ||
| Chaetozone setosa | 4 | 217 | 638 | 810 | 86 | 0.25% | ||
| Chaetozone zetlandica | NC | 777 | 1515 | 423 | 71 | 0.39% | ||
| Cirratulus cirratus | 4 | 417 | 759 | 423 | 36 | 0.23% | ||
| Pista | NC | 45 | 283 | 153 | 105 | 0.08% | ||
| Polycirrus norvegicus | 4 | 267 | 342 | 263 | 174 | 0.15% | ||
| Capitella capitata | 5 | 63825 | 7554 | 355 | 8 | 10.15% | ||
| Mediomastus fragilis | 4 | 773 | 363 | 265 | 96 | 0.21% | ||
| Notomastus latericeus | 1 | 162 | 355 | 347 | 219 | 0.15% | ||
| Scoloplos armiger | 3 | 702 | 425 | 618 | 61 | 0.26% | ||
| Galathowenia oculata | 3 | 40 | 94 | 307 | 140 | 0.08% | ||
| Owenia borealis | 2 | 86 | 173 | 291 | 152 | 0.10% | ||
| Paradoneis lyra | 2 | 164 | 891 | 426 | 483 | 0.28% | ||
| Scalibregma inflatum | 3 | 133 | 296 | 245 | 19 | 0.10% | ||
| Sipuncula | Sipuncula | 2 | 86 | 428 | 285 | 101 | 0.13% | |
| Arthropoda | Copepoda | Calanoida | NC | 879 | 660 | 373 | 45 | 0.28% |
| Cnidaria | Anthozoa | Actiniaria | 1 | 25 | 291 | 219 | 33 | 0.08% |
| Echinodermata | Ophiuroidea | Amphipholis squamata | 1 | 11 | 636 | 408 | 41 | 0.16% |
| Ophiura | 2 | 706 | 34 | 35 | 14 | 0.11% | ||
| Mollusca | Bivalvia | Thyasira flexuosa | 3 | 38 | 308 | 1071 | 289 | 0.24% |
| Thyasira sarsii | 4 | 156 | 655 | 273 | 46 | 0.16% | ||
| Modiolula phaseolina | 1 | 47 | 434 | 712 | 10 | 0.17% | ||
| Polyplacophora | Leptochiton asellus | 1 | 195 | 358 | 795 | 123 | 0.21% | |
| Nematoda | Nematoda | 41497 | 4554 | 2321 | 313 | 6.89% | ||
| Nemertea | Nemertea | 3 | 137 | 219 | 192 | 43 | 0.08% |
Top 50 taxa in terms of abundance at various sampling locations from 16 salmon cage farms in Sulfjorden from 2016 to 2022.
NSI, Norwegian sensitivity Index; EG 1, Sensitive species; EG 2, Indifferent species; EG 3, Tolerant species; EG 4, Opportunistic species; EG 5, Pollution indicating species; NC, Non-classified species. Benthic macrofauna were classified into EGs using NSI. EG, Ecological group; NSI, Norwegian sensitivity index.
*The percentage of individual taxa in total abundance benthic macrofauna.
Figure 6 shows the spatial variations in the level of phosphorus (P) and benthic macrofauna, categorized into EG, at each sampling station across 16 salmon farms within the study area from 2016 to 2022. EG5 species were primarily concentrated in the local impact zone (~30 m), accounting for about 80% of the total abundance. They were also slightly present in the intermediate zones (~200 m) during the post-stage, accounting for 4% of the total abundance. The variation in EG5 abundance was positively correlated with the level of P in the sediments (p< 0.001), whereas EG1 (p = 0.003) and EG2 (p = 0.012), were negatively correlated with P level. By comparison, EG3 (p = 0.55) and EG4 (p = 0.07) showed no significant correlation with sediment P levels. For EG1 and EG2 species, pronounced differences were observed between the local impact zone (3% of the total abundance) and the intermediate zones (23-27% of the total abundance). However, there was no apparent difference in distribution of EGs between the edge of the intermediate zone and the reference zone.
Figure 6
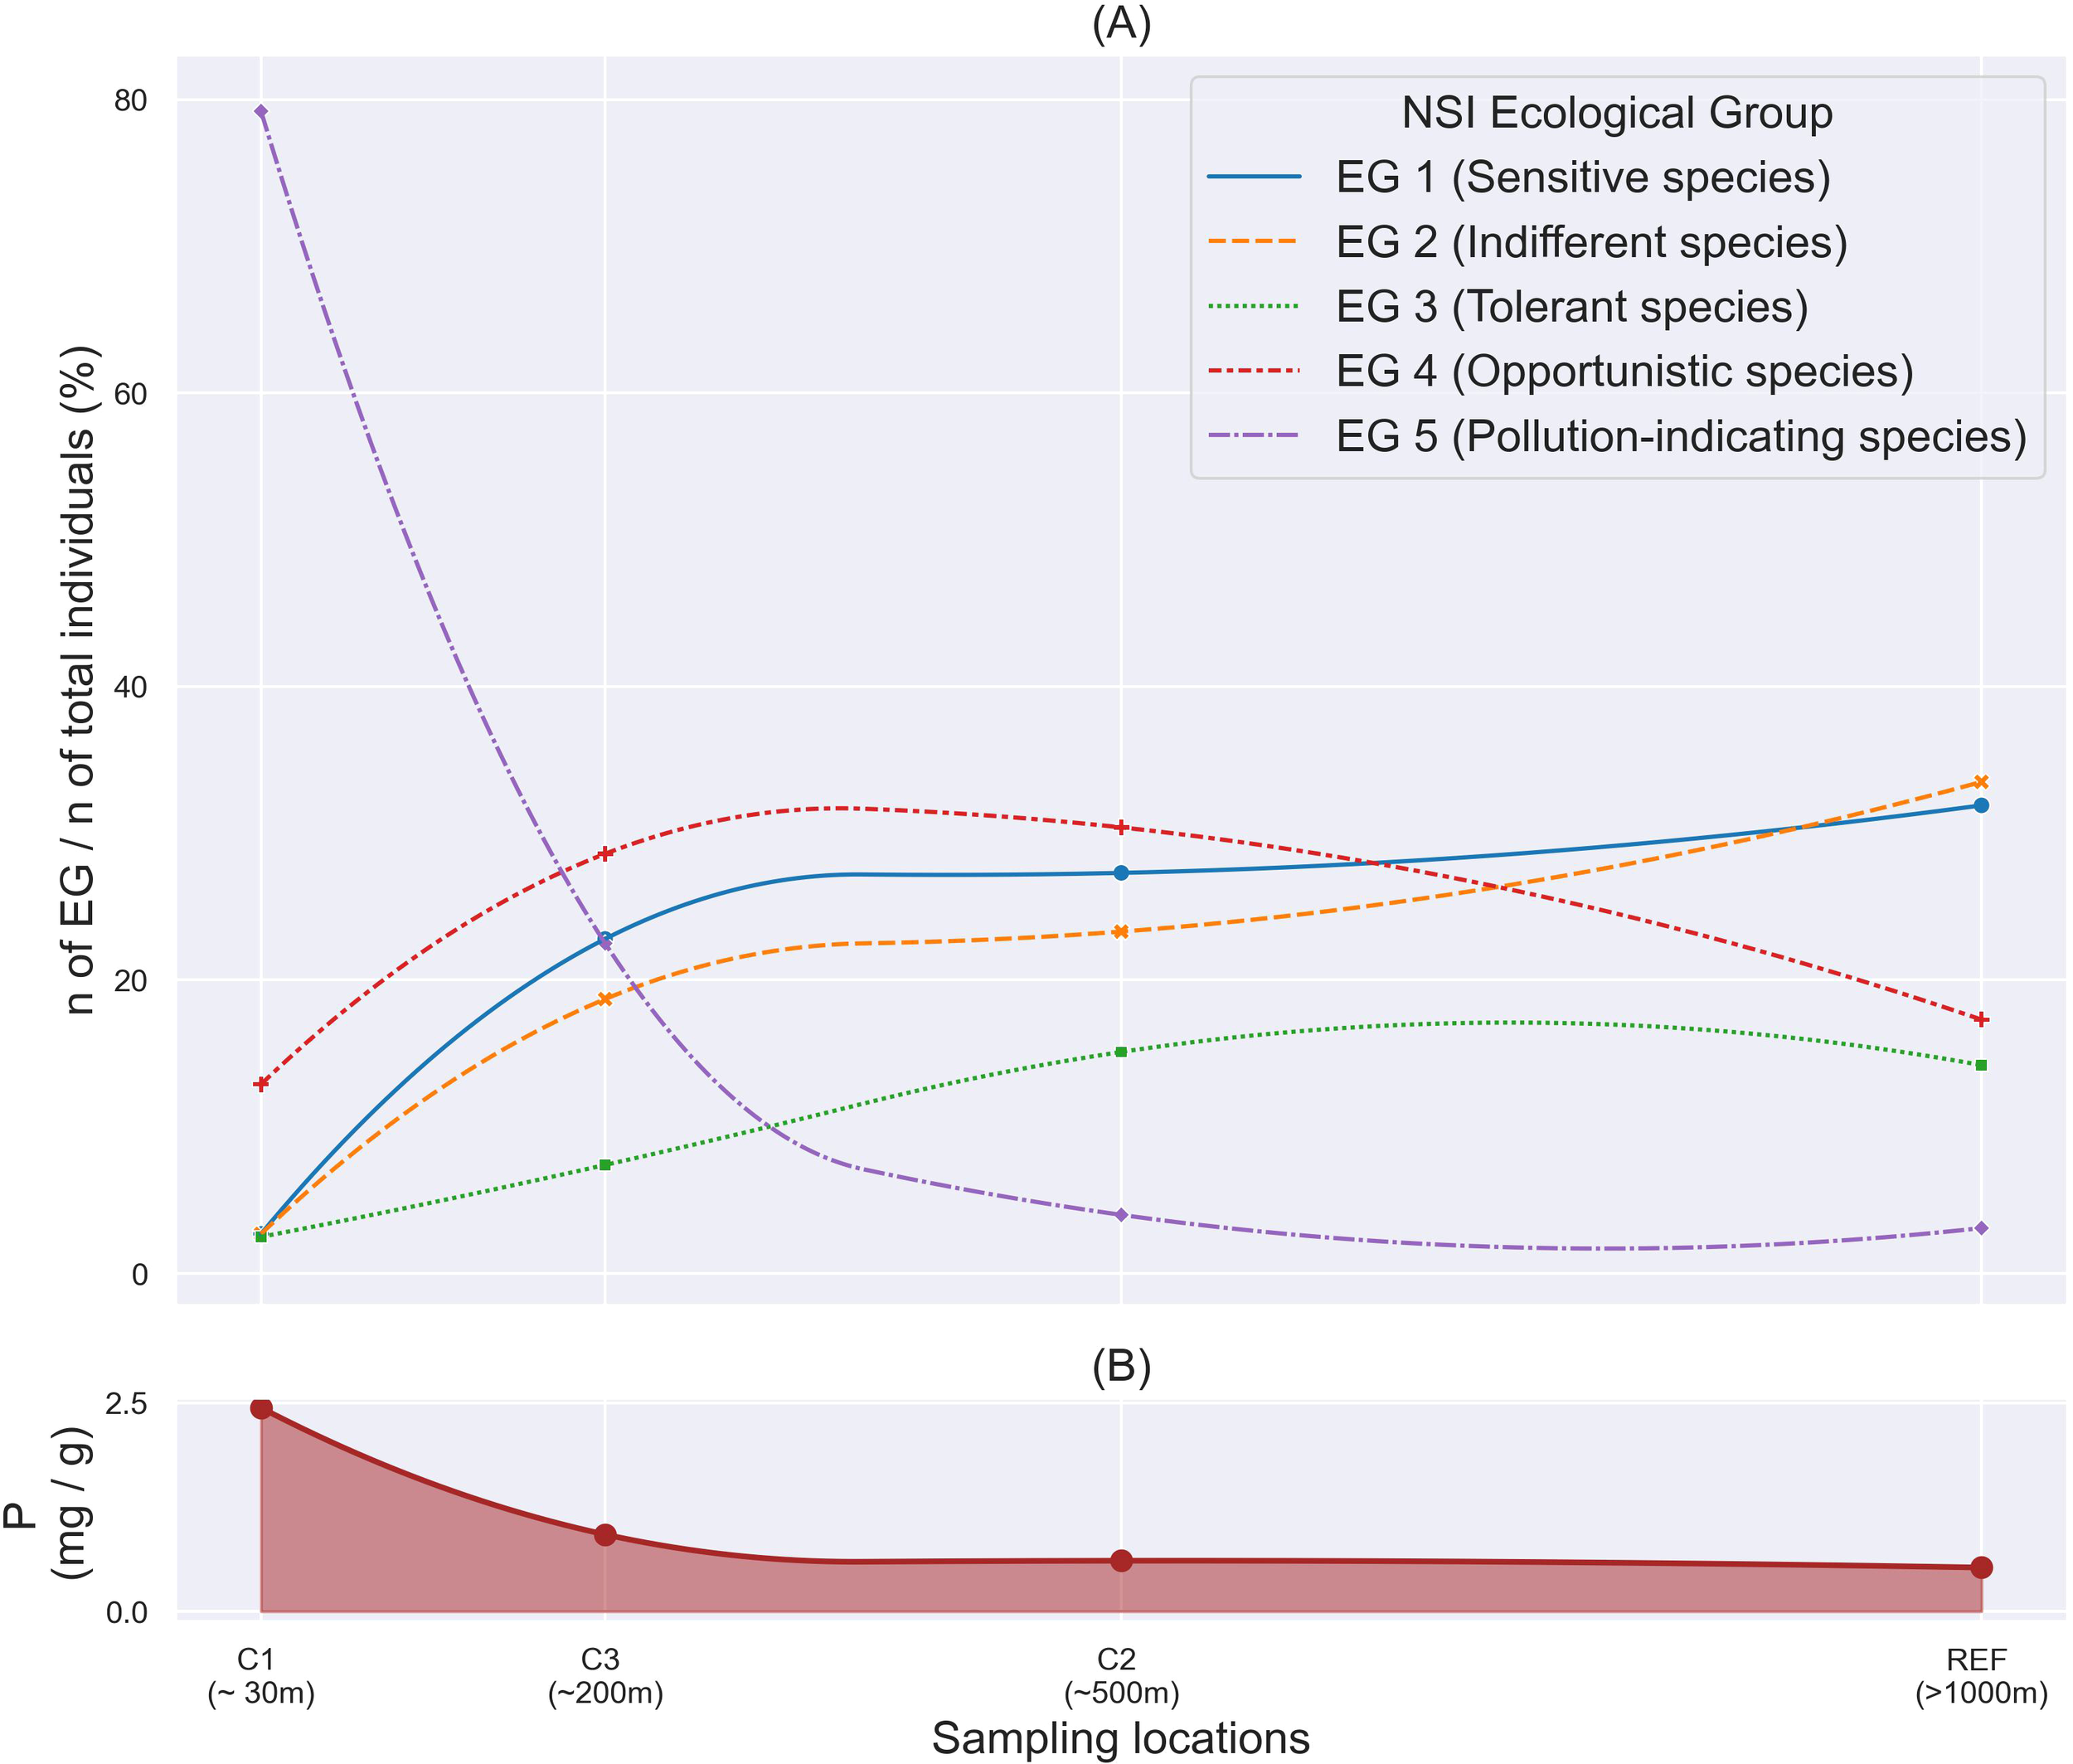
Spatial variation of variables from 16 Norwegian salmon cage farms in Sulfjorden (2016 – 2020). (A) Benthic macrofaunal communities by different ecological groups; (B) Particulate Organic Phosphorus (P mg/g of DM). EG 1, Sensitive species; EG 2, Indifferent species; EG 3, Tolerant species; EG 4, Opportunistic species; EG 5, Pollution indicating species. Benthic macrofauna were classified into EGs using NSI. EG, Ecological group; NSI, Norwegian sensitivity index.
3.4 Influence chemical condition on the benthic macrofaunal community
We used Spearman’s nonparametric correlation to analyze the relationship between biological and chemical variables among all sampling locations in the study regions (Figure 7). Spearman’s correlation (rho) (as shown by the values in the Figure 7) revealed that the species richness and individual abundance of macrofauna in the benthic ecosystem was significantly correlated with the contents of P, Cu and Zn in the sediments. Statistical analysis indicated a significant decrease in richness with increasing levels of P, Cu, and Zn, while the abundance showed a significant increase (all p< 0.05; Figure 7). Despite the statistically significant relationship, the low absolute values of the correlation coefficients (rho) value suggest weak correlations between the level of C, N, P, Cu, and Zn and biodiversity. There are therefore also other factors that have affected richness not considered in the present study.
Figure 7
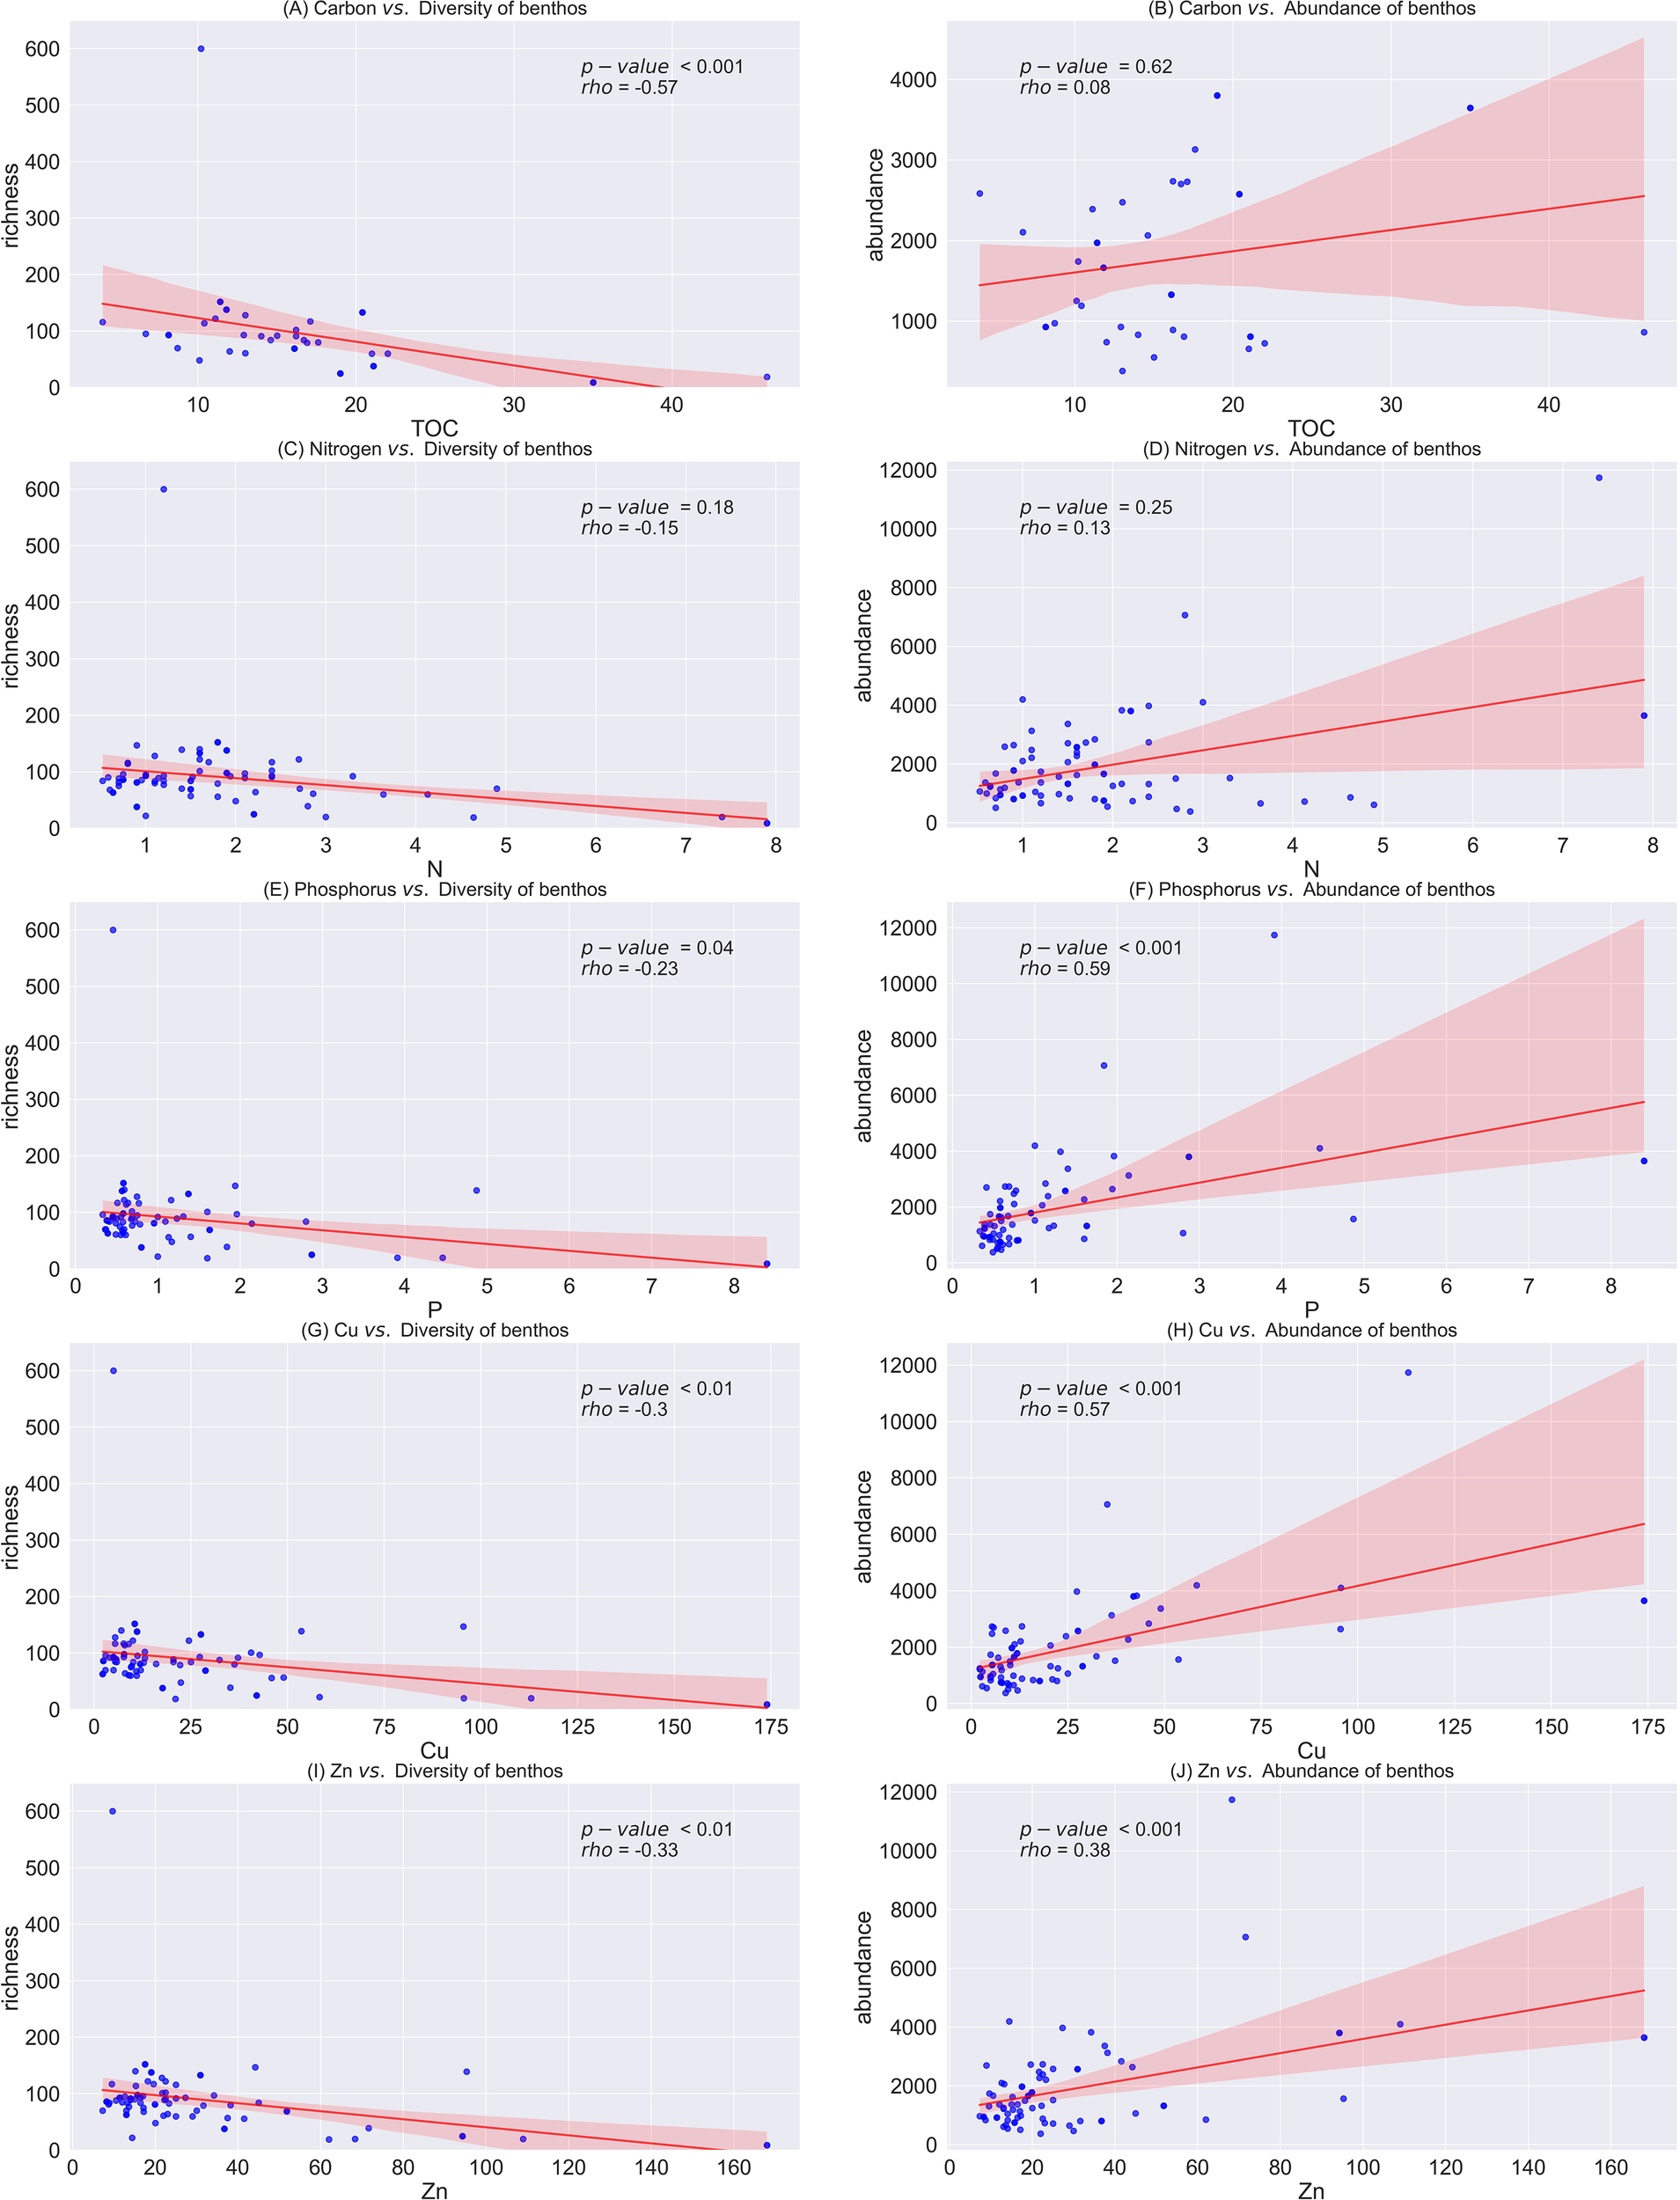
Correlation between biodiversity of benthic macrofauna vs chemical variables on benthic environment from salmon cage farms in Sulfjorden from 2016 to 2022, with the shaded area representing the standard deviation of the error bounds. Correlation strength was assessed using Spearman’s rank correlation coefficient (rho). (A) Carbon vs. Diversity of benthos (B) Carbon vs. Abundance of benthos, (C) Nitrogen vs. Diversity of benthos (D) Nitrogen vs. Abundance of benthos, (E) Phosphorus vs. Diversity of benthos (F) Phosphorus vs. Abundance of benthos, (G) Copper vs. Diversity of benthos (H) Copper vs. Abundance of benthos, (I) Zinc vs. Diversity of benthos (J) Zinc vs. Abundance of benthos.
We applied Principal Component Analysis (PCA) to analyze the correlation between chemical and biological states across a dataset of 110 sampling locations collected between 2016 and 2022. The biological states were assessed using the NSI method and categorized into five EQS levels, as described in Section 2.3 (Table 2). The result revealed that the first two components (PC) accounted for a substantial portion of the total variance, explaining 93% of the EQS. PC1, which represented 79% of the variance, was primarily influenced by P, with a minor influence from Zn. PC2, responsible for 14% of the variance, was mainly influenced by N, with a slight influence from Cu (Figure 8).
Figure 8
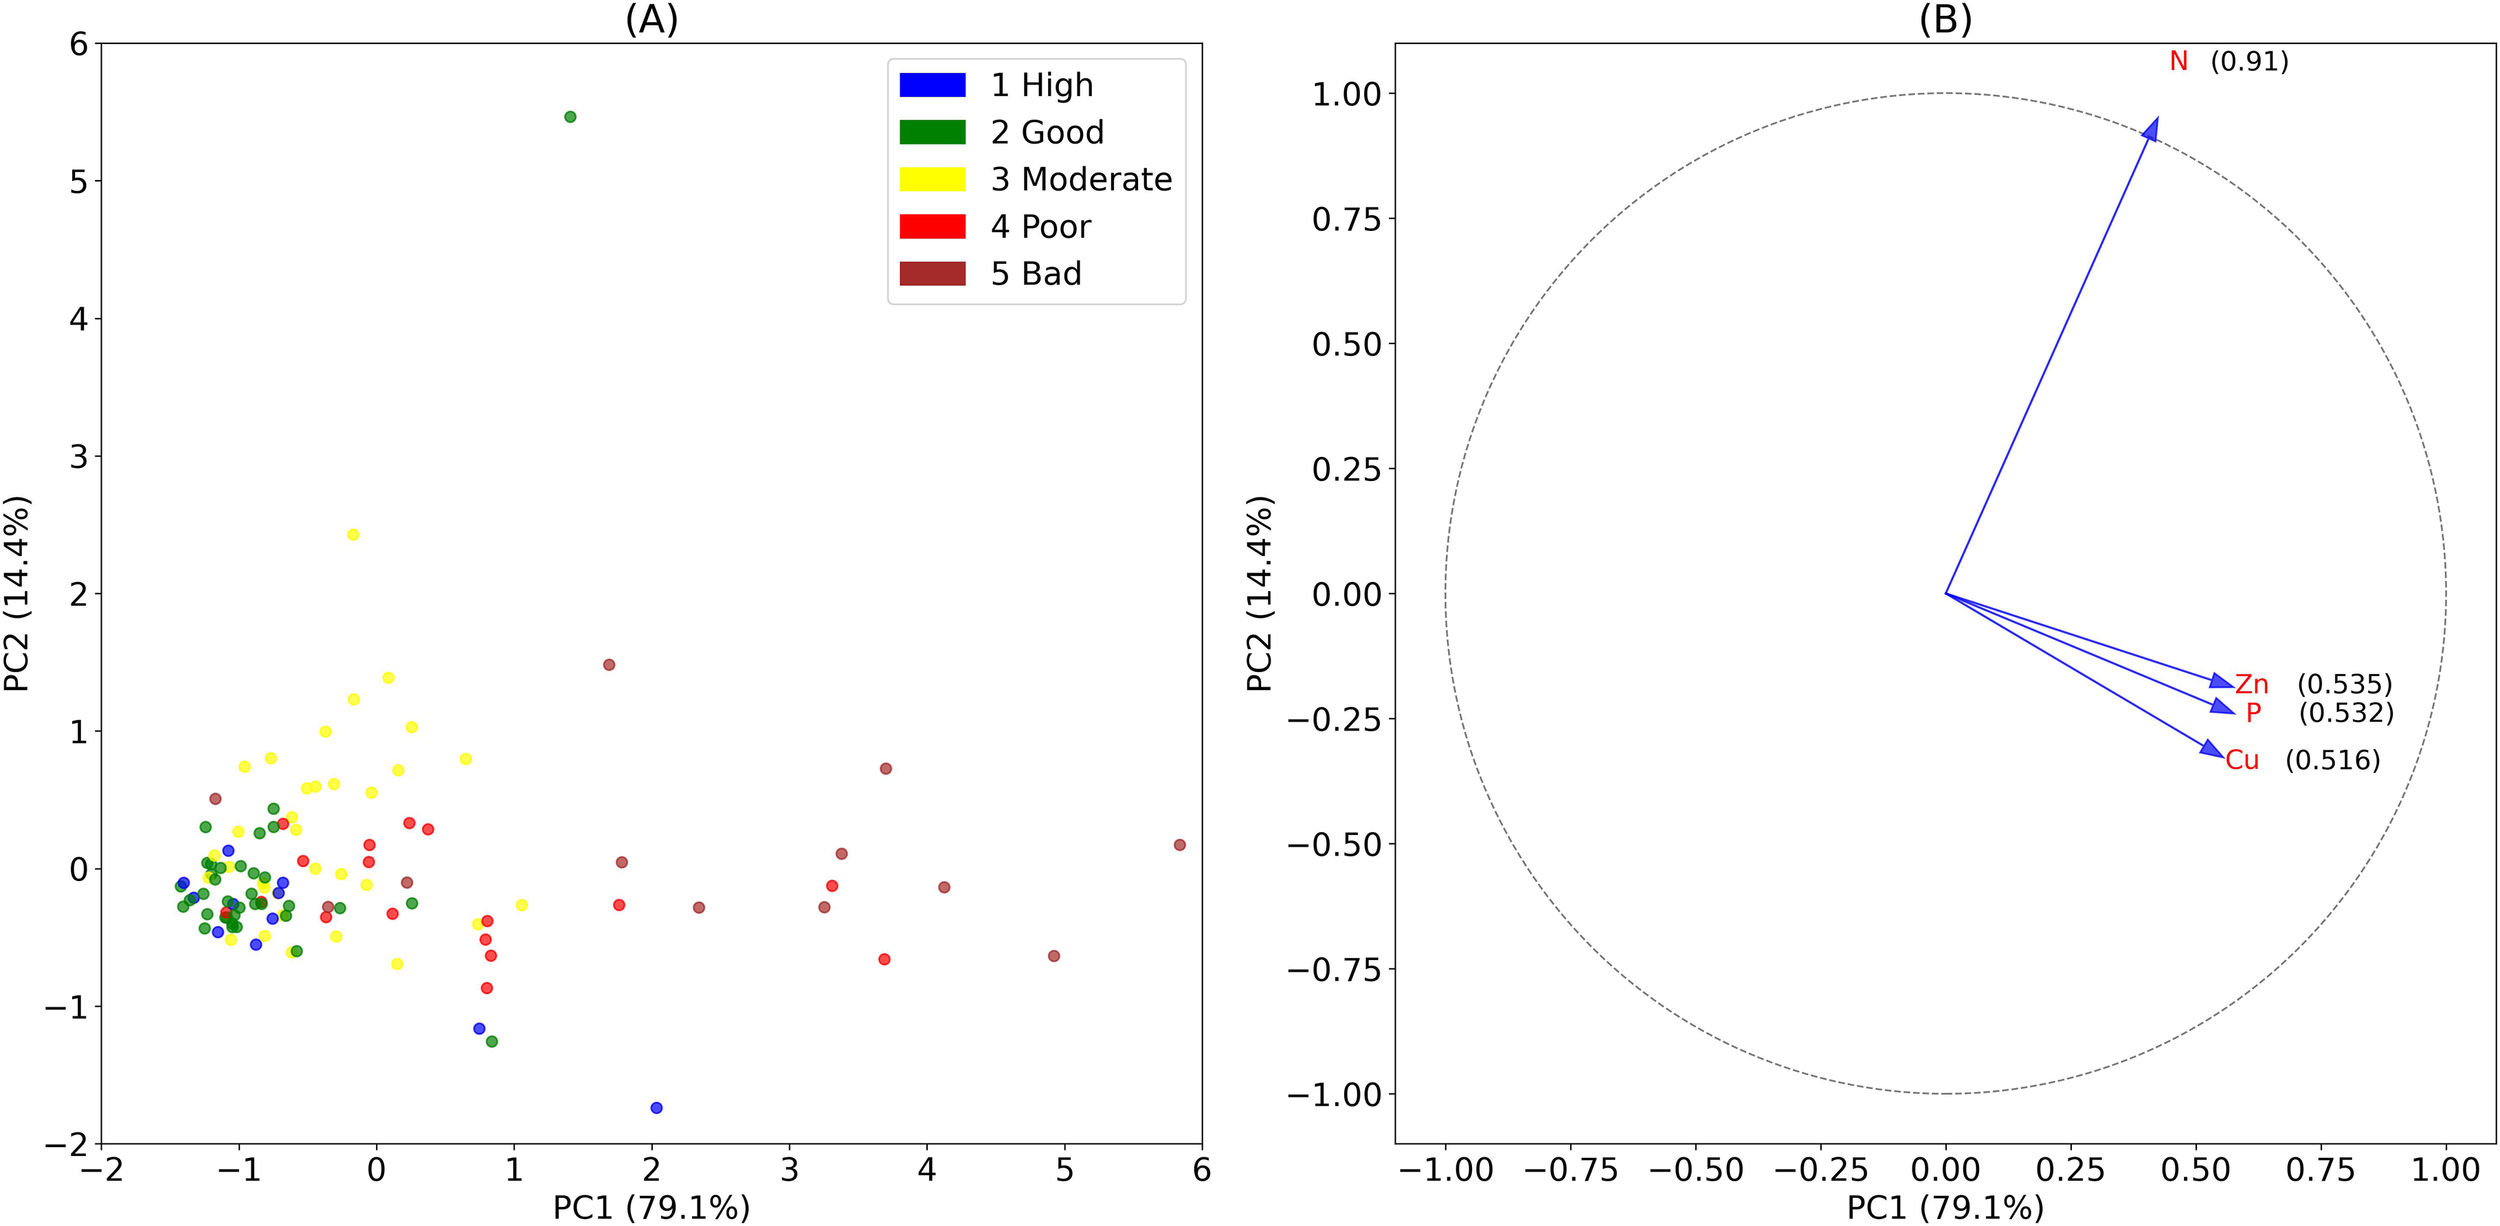
Principal components analysis (PCA) with two principal components (PC 1 & PC2) of 110 sampling locations from Norwegian salmon cage farms (2016 – 2022) assessing the relationship between Ecological Quality Status (EQS) and multiple chemical variables. (A) The variation in the data that was explained by PC 1, which was plotted on the x-axis, accounted for 79%, followed by PC 2, plotted on the y-axis, explaining 14% of the variation. (B) Contribution of the variables to the PCA scores illustrated with a correlation circle.
4 Discussion
C-assessments are legally required for benthic environmental monitoring open cage farming of salmon in Norway (Standard Norway, 2016). The present study included 27 such assessments conducted at 16 farms, spanning multiple production cycles from 2016 to 2022. The main finding is that analyzing several selected chemical and biological variables used in C-assessments can identify subtle impacts, as well as spatial variations in aquaculture operations across zones ranging from 30m to 500m from the cages. The distribution of benthic epifauna exhibited variation across production phases in each zone throughout the aquaculture production cycle, corresponding to different amounts of feed loading. The level of N, P, Zn and Cu in sampled sediments showed a gradient distribution across different zones. The local impact zone (~30 m away from cage) had the highest levels of these variables. In the intermediate zone (~200 m), levels dropped by 30-60%, and at the edge (~500 m) values became similar to those at the reference site (~1,000 m). This suggested that the primary impact on the benthic environment in our study area was confined within the local impact zone. Furthermore, our analysis revealed a significant positive correlation between accumulated feed use vs N and P levels in benthic ecosystems (all p< 0.05). By revealing subtle changes, the comprehensive analysis of C-assessment data enhanced the understanding of aquaculture-environmental interactions and might support sustainable farming practices.
4.1 Reliability and effectiveness of benthic assessments
The Norwegian regulation NS 9410 includes both B- and C-assessments. B-assessments are conducted in the production zone (< 30m), while C-assessments are carried out at multiple sampling stations ranging from 30m to 500m, with additional supporting variables (Figure 2; Standard Norge, 2016). All environmental surveys conducted in the production zone of farms within our study area (< 30m; Figure 2), using B-assessments, consistently reported favorable conditions classified as State 1 (Very good; Table 1). Given this, we might not have expected signs of organic impact in the transition zone (30–500 m; Figure 2) with C-assessments. However, data analyses from C-surveys still revealed subtle indications of organic load, despite the pH and Eh variables suggesting otherwise. This could be due to the effective dispersion of particles away from the production zone, preventing accumulation directly beneath the plant, but allowing deposition further away. However, none of the individual C-assessments did result in a lower classification in the original surveys whereas our analyses, which look more at a holistic assessment of all variables, could find subtle signs of organic enrichment. Finding more ways to assess the health of the bottom ecosystem is useful, as analyzing benthic fauna manually is costly and time consuming.
Our data analysis of chemical and biological variables revealed a notable correspondence, with similar spatial variation across sampling locations (Figures 3, 4). This finding suggests that the results are reliable and further indicates that C-assessments—which combines multiple chemical and biological variables—provided a reliable method for monitoring aquaculture operations’ impact on benthic environmental conditions. The sediment contents of C, N, P, Cu, and Zn were identified as principal components for Ecological Quality Status (EQS; Figure 8), although it is noted that Cu is typically associated with antifouling coatings rather than organic enrichment from feed. However, previous studies have found sulphide- and O2 levels, often in combination with Cu and lice treatment chemicals, as the main drivers of macrofauna inhabitability (Gray et al., 2002; Hargrave et al., 2008; Mayor et al., 2009).
Our study revealed that salmon farming in our study area primarily influenced the benthic environment within a local impact zone extending up to 30 meters from the facility, with the effects diminishing as the distance from the salmon cages increased. At the edge of the intermediate zone, the impact may become statistically indistinguishable from the reference site (all p > 0.05). Our study suggested that using N, P, Cu, and Zn, and biological variables can enhance the ability to detect changes in benthic ecosystems, which may vary dependent on the distance from salmon farms. The above chemical variables from the C-assessment detected spatial benthic impacts beyond the immediate impact zone, enabling the observation of a diminishing impact gradient with increasing distance from the cage facility. The benthic macrofaunal communities exhibited pronounced spatial shifts in the benthic environment, and such changes were detectable at varying distances, up to 500m from the salmon cage, throughout the production cycle (Figure 6). These findings aligned well with the observations on nitrogen (N) and phosphorus (P) levels, as mentioned in Sections 3.1–3.2 (Figures 3, 4).
Considering the potential dispersion and resuspension of particles beyond the production zone, the B-assessment, which is confined within 30m and ideally conducted near the cage edge, may be insufficient for monitoring the full extent of organic enrichment impacts (Keeley et al., 2013; Broch et al., 2017). Nevertheless, although the B-assessment protocol includes fewer measurements than the C-assessment, it involves a combination of multiple variables, such as pH, redox potential (Eh) and sensory measurements which have been established as responsive and reliable variables for assessing benthic condition under heavier loads (Standards Norway, 2016; Wang and Olsen, 2024). The B-assessment, with its higher survey frequency and focus on the construction zone, provides a cost-effective means of quickly detecting environmental changes. In contrast, the C-assessment, incorporating a broader range of chemical and biological variables, can detect subtle impacts further from the impact zone (30–500 m from the cage facilities). It can also help identify the actual impact zone more accurately, while offering both spatial and production-phase data to assess the interactions between aquaculture operations and the benthic environment.
Therefore, combining B- and C-assessments provide useful information for evaluating and following up the ecological assimilation efficiency of biogenic wastes at farming sites. However, since C-assessments is sometimes seen as time-consuming and costly, it may be worth considering whether the sampling distance should be reduced if long-term environmental conditions show only minor changes, with most occurring near the facility.
4.2 Recoverability of benthic ecosystem
In our study area, there are 16 farms operating with multiple production cycles, and the accumulated feed is reset to zero and recalculated when a new production cycle begins (as shown in Table 1). Each production cycle typically lasted 1–2 years, with a time gap occurring between two consecutive cycles (Wang and Olsen, 2024). It should be noted that none of the 16 farms were newly established; all had been operating commercially for several years prior to our study. The positive correlation between accumulated feed usage and nitrogen and phosphorus levels on the seafloor (as shown in Figure 4) suggests that the benthic impact on the seafloor was significantly lower when accumulated feed was minimal (i.e., at the beginning of a new production cycle). This pattern suggested that the benthic environment had the capacity to recover during the time gap between production cycles, aligning with the findings of Wang and Olsen (2024), which demonstrated the recoverability of the benthic ecosystem influenced by aquaculture.
Wang and Olsen (2024) found that environmental recoverability was more rapid in the early stages of seafloor ecosystem degradation. They emphasized the importance of early detection of environmental changes, which enable more timely intervention. Our study demonstrated the potential of C-assessments to detect subtle changes in the seafloor ecosystem, which may facilitate the early detection of environmental degradation and make informed adaptive aquaculture practices.
4.3 Responsiveness of variables
Our study revealed that several variables used in the environmental C-assessment protocol can detect changes in the benthic environment, although their responsiveness may vary among distance from the cages. Among the supporting variables, the content of phosphorus (P) exhibited the strongest response with a consistent decrease from the facility to the intermediate zone (~ 200m) while maintaining a correlation with the accumulated feed consumption (p< 0.001, Figure 4F).
This is consistent with previous studies reporting that approximately 60% of phosphorus in feed for farmed salmon is excreted as particulate organic P, mostly feces, resulting in a low molecular N:P ratio estimated at ~2 for POM (Wang et al., 2013; Wang and Olsen, 2023). Our data analysis has confirmed these estimates, revealing that the N:P ratio was approximately 3.1 in the local impact zone (~30 m), compared with 4.45 in the intermediate zone (~200 m) and 5.78 at the outer edge of intermediate zone (~500 m). Additionally, the N:P ratio was found to increase with accumulated feed consumption, as shown in Figures 4G, H. We have therefore suggested that the P contents of sediments can be used to detect environmental impacts of aquaculture and assessing benthic community recovery. Previous studies have also identified P as a reliable variable for assessing the impact zone of seafloor ecosystems of cage aquaculture, although its effectiveness may be limited due to its solubility and sensitivity to biochemical factors (Islam, 2005; Sanz-Lázaro et al., 2011; Porrello et al., 2003). Thus, incorporating additional variables is recommended for more robust assessments.
All faunal index scores were significantly correlated with each other, with NSI showing a slightly higher Spearman’s correlation (rho) value than AMBI (p< 0.001, Figure 5). This supported the use of NSI as a more effective indicator for assessing benthic conditions in Norwegian waters, aligning with previous findings by Rygg and Norling (2013). The data analysis of NSI revealed clear distributions for different species of ecological functional groups (EG), as shown in Figure 6. In the local impact zone (C1), Pollution-indicating (EG5) species dominated, suggesting influence from organic enrichment. In the intermediate zone (C3, ~200 m), Pollution-indicating species (EG5) markedly declined while Opportunistic (EG4) species increased, indicating a transitional state under moderate influence from organic enrichment. At the edge of the intermediate zone (C2, ~500 m) and at the reference station (>1,000 m), Sensitive (EG1) and Indifferent (EG2) species gradually became dominant, suggesting condition close to natural community conditions. Phosphorus exhibited a similar spatial trend, supporting this ecological succession along the distance gradient. Additionally, the PCA and correlation analysis demonstrated that these distributions were related to the levels of C, N, P, Cu, and Zn in the benthic environment (Figures 6, 7). The coefficient of variation (CV) for the faunal index scores was found to decrease with increasing distance from the facility (Table 5). This finding suggested that the benthic environment closer to the cages was more heavily impacted by farming operations and recovers dynamically, while the impact significantly diminished at ~200 m in the study area. This confirmed that, for some locations, it may be beneficial to use smaller sampling areas if there are no signs of pollution at greater distances. This is coherent when considering that the impact of aquaculture operations can be influenced by various biophysical factors, such as current velocity, water depth, fish density, and the length of the production cycle (Holmer et al., 2005; Kalantzi and Karakassis, 2006; Bannister et al., 2014; Wang and Olsen, 2024).
4.4 Recommendations
Our study has focused on a relatively small geographic area to control for environmental variables including current velocity, water depth and water temperature. While our findings may not be representative of all Norwegian salmon aquaculture operations, the data analysis approach is applicable to other regions and aquaculture species. With the potential for early detection of subtle effects of aquaculture operations on the benthic environment, this approach could benefit industry in terms of optimizing operations and site selection, ultimately enhancing sustainability.
The future of aquaculture entails expanding cage farming to more exposed ocean areas (Holmer, 2010; Hvas et al., 2021; Moe Føre et al., 2022). However, conducting environmental surveys in remote and deep-water areas can be expensive and present technical challenges for the aquaculture industry. Considering the importance of economic feasibility in implementing regular and continuous assessments, there is a pressing need to explore alternative assessment approaches that are equally reliable. The current methodology of macrofauna analyses is time-consuming, typically taking about six months in Norway, and often longer. This timeline is widely recognized as inappropriate for effective management. In addition to the potential for reducing the scope of traditional C-assessments based on our findings, there are opportunities for further advances. For example, ongoing research using seafloor species detection by hyperspectral imaging or analyzing environmental DNA offer other promising avenues for assessing the ecological state of the benthic ecosystem (Stoeck et al., 2018; Montes-Herrera et al., 2021).
Previous studies have shown that among the total nutrient wastes from salmon cage farming, about one-third is released as particulate organic waste, mainly impacting the benthic environment up to 500m from cages, while the remaining two-thirds are released as inorganic nutrient waste, primarily affecting the marine ecosystem of the water body and potentially reaching up to around 1,000 m (Broch et al., 2017; Jansen et al., 2018; Wang et al., 2013; Wang and Olsen, 2023). Norwegian regulations already provide a comprehensive and robust assessment of the benthic environment, covering the construction zone and the intermediate zone within ~ 500m (Standards Norway, 2016). However, there is still no requirement for monitoring of the water body. We therefore suggest establishing a regulatory assessment to improve the overall environmental assessment.
Statements
Data availability statement
Publicly available datasets were analyzed in this study. This data can be found here: https://www.fiskeridir.no/Tall-og-analyse/AApne-data.
Author contributions
CW: Conceptualization, Data curation, Formal Analysis, Investigation, Methodology, Software, Validation, Visualization, Writing – original draft, Writing – review & editing. DS: Conceptualization, Formal Analysis, Investigation, Methodology, Validation, Visualization, Writing – original draft, Writing – review & editing. YO: Conceptualization, Formal Analysis, Investigation, Methodology, Project administration, Supervision, Validation, Writing – original draft, Writing – review & editing.
Funding
The author(s) declare financial support was received for the research and/or publication of this article. Financial support for the publication of this article was received from the Norwegian University of Science and Technology (NTNU).
Acknowledgments
This study was supported by the Department of Biology, Norwegian University of Science and Technology (NTNU). The authors would like to acknowledge financial support from the Ministry of Agriculture of Taiwan for providing financial support to Chun-Deng Wang for his Ph.D. study. We also acknowledge Fiskeridirektoratet (Norwegian Directorate of Fisheries) for providing access to the salmon cage sites and NS 9410 database, the Kartverket (Norwegian Mapping Authority) for providing access to the geospatial data. We also thank the two reviewers for their constructive feedback, which significantly enhanced the clarity of the manuscript.
Conflict of interest
At the time of writing this article, author CW was employed by BioMar AS, and author DS was employed by STIM AS. Neither company provided financial support for the research or the writing of the paper.
The remaining author declares that the research was conducted in the absence of any commercial or financial relationships that could be construed as a potential conflict of interest.
The author(s) declared that they were an editorial board member of Frontiers, at the time of submission. This had no impact on the peer review process and the final decision.
Generative AI statement
The author(s) declare that Generative AI was used in the creation of this manuscript. Generative AI tools were used only for language editing, grammar correction, and assistance with Python coding. No AI tools were used for data analysis, scientific interpretation, or content generation related to the research findings.
Any alternative text (alt text) provided alongside figures in this article has been generated by Frontiers with the support of artificial intelligence and reasonable efforts have been made to ensure accuracy, including review by the authors wherever possible. If you identify any issues, please contact us.
Publisher’s note
All claims expressed in this article are solely those of the authors and do not necessarily represent those of their affiliated organizations, or those of the publisher, the editors and the reviewers. Any product that may be evaluated in this article, or claim that may be made by its manufacturer, is not guaranteed or endorsed by the publisher.
References
1
Aas T. S. Sixten H. J. Hillestad M. Ytrestøyl T. Sveier H. Åsgård T. (2020). Feed intake, nutrient digestibility and nutrient retention in Atlantic salmon (Salmo salar L.) fed diets with different physical pellet quality. J. Fisheries8, 768–776. doi: 10.17017/j.fish.133
2
ASC (2022). Whitepaper on Standards for Aquaculture impacts on Benthic Habitat Biodiversity and Function (Utrecht, the Netherlands: ASC).
3
ASC (2024). ASC salmon standard. Version1. 4.1 (Utrecht, the Netherlands: Aquaculture Stewardship Council).
4
Bailey J. L. Eggereide S. S. (2020). Indicating sustainable salmon farming: The case of the new Norwegian aquaculture management scheme. Mar. Policy117, 103925. doi: 10.1016/j.marpol.2020.103925
5
Bannister R. J. Valdemarsen T. Hansen P. K. Holmer M. Ervik A. (2014). Changes in benthic sediment conditions under an Atlantic salmon farm at a deep, well-flushed coastal site. Aquaculture Environ. Interact.5, 29–47. doi: 10.3354/aei00092
6
Borja Á. Dauer D. M. Elliott M. Simenstad C. A (2010). Medium- and long-term recovery of estuarine and coastal ecosystems: patterns, rates and restoration effectiveness. Estuaries Coasts33, 1249–1260. doi: 10.1007/s12237-010-9347-5
7
Borja A. Franco J. Pérez V. (2000). A marine biotic index to establish the ecological quality of soft-bottom benthos within European estuarine and coastal environments. Mar. pollut. Bull.40, 1100–1114. doi: 10.1016/S0025-326X(00)00061-8
8
Braithwaite R. A. McEvoy L. A. (2004). “ Marine biofouling on fish farms and its remediation,” in Advances in Marine Biology, vol. 47. (Amsterdam, Netherlands: Elsevier), 215–252. doi: 10.1016/S0065-2881(04)47003-5
9
Broch O. J. Daae R. L. Ellingsen I. H. Nepstad R. Bendiksen E.Å. Reed J. L. et al . (2017). Spatiotemporal dispersal and deposition of fish farm wastes: a model study from central Norway. Front. Mar. Sci.4, 199. doi: 10.3389/fmars.2017.00199
10
Carroll M. L. Cochrane S. Fieler R. Velvin R. White P. (2003). Organic enrichment of sediments from salmon farming in Norway: Environmental factors, management practices, and monitoring techniques. Aquaculture226, 165–180. doi: 10.1016/S0044-8486(03)00475-7
11
Direktoratsguppen vanndirektivet (2018). Guide 02:2018 Classification of environmental conditions in water. Ecological and chemical classification system for coastal waters, groundwater, lakes and rivers. Available online at: https://www.vannportalen.no/veiledere/klassifiseringsveileder/ (Accessed June 11, 2023).
12
Dong S. Dong Y. Cao L. Verreth J. Olsen Y. Liu W. et al . (2022). Optimization of aquaculture sustainability through ecological intensification in China. Rev. Aquaculture14, 1249–1259. doi: 10.1111/raq.12648
13
EC (2008). Directive 2008/56/EC of the European Parliament and of the Council of 17 June 2008 establishing a framework for community action in the field of marine environmental policy (Marine Strategy Framework Directive). Off. J. Eur. Union164, 19–40.
14
Ervik A. Hansen P. K. Aure J. Stigebrandt A. Johannessen P. Jahnsen T. (1997). Regulating the local environmental impact of intensive marine fish farming I. The concept of the MOM system (Modelling-Ongrowing fish farms-Monitoring). Aquaculture158, 85–94. doi: 10.1016/S0044-8486(97)00186-5
15
EU Directive 2000/60/EC (2000). Directive 2000/60/EC of the European Parliament and of the Council of 23 October 2000 establishing a framework for Community action in the field of water policy (Water Framework Directive). Off J Eur CommunitiesL327.
16
FAO (2022). “ The state of world fisheries and aquaculture 2022,” in Towards Blue Transformation (Rome: Food and Agriculture Organization of the United Nations).
17
Gray J. S. Wu R. S. S. Or Y. Y. (2002). Effects of hypoxia and organic enrichment on the coastal marine environment. Mar. Ecol. Prog. Ser.238, 249–279. doi: 10.3354/meps238249
18
Hale R. Depree C. Broekhuizen N. (2023). Simulating fish farm enrichment and fallowing impacts reveals unequal biogeochemical recovery of benthic variables. Aquacult Environ. Interact.15, 115–131. doi: 10.3354/aei00456
19
Hargrave B. T. Filgueira R. Grant J. Law B. A. (2022). Combined models of growth, waste production, dispersal and deposition from cage-cultured Atlantic salmon to predict benthic enrichment. Aquacult Environ. Interact.14, 309–328. doi: 10.3354/aei00445
20
Hargrave B. T. Holmer M. Newcombe C. P. (2008). Towards a classification of organic enrichment in marine sediments based on biogeochemical indicators. Mar. pollut. Bull.56, 810–824. doi: 10.1016/j.marpolbul.2008.02.006
21
Holmer M. (2010). Environmental issues of fish farming in offshore waters: Perspectives, concerns and research needs. Aquaculture Environ. Interact.1, 57–70. doi: 10.3354/aei00007
22
Holmer M. Wildish D. Hargrave B. (2005). Water pollution environmental effects of marine finfish aquaculture. Handb. Environ. Chem.5, 181–206. doi: 10.1007/b136010
23
Hunter J. D. (2007). Matplotlib: A 2D graphics environment. Computing Sci. Eng.9, 90–95. doi: 10.1109/MCSE.2007.55
24
Hurlbert S. H. (1971). The nonconcept of species diversity: A critique and alternative parameters. Ecology52, 577–586. doi: 10.2307/1934145
25
Hvas M. Folkedal O. Oppedal F. (2021). Fish welfare in offshore salmon aquaculture. Rev. Aquaculture13, 836–852. doi: 10.1111/raq.12501
26
Islam M. S. (2005). Nitrogen and phosphorus budget in coastal and marine cage aquaculture and impacts of effluent loading on ecosystem: review and analysis towards model development. Mar. pollut. Bull.50, 48–61. doi: 10.1016/j.marpolbul.2004.08.008
27
Jansen H. M. Broch O. J. Bannister R. Cranford P. Handå A. Husa V. et al . (2018). Spatio-temporal dynamics in the dissolved nutrient waste plume from Norwegian salmon cage aquaculture. Aquaculture Environ. Interact.10, 385–399. doi: 10.3354/aei00276
28
Jordahl K. (2014). GeoPandas: Python tools for geographic data. Available online at: https://github.com/geopandas/geopandas (Accessed June 11, 2023).
29
Kalantzi I. Karakassis I. (2006). Benthic impacts of fish farming: Meta-analysis of community and geochemical data. Mar. pollut. Bull.52, 484–493. doi: 10.1016/j.marpolbul.2005.09.034
30
Karakassis I. Hatziyanni E. Tsapakis M. Plaiti W. (1999). Benthic recovery following cessation of fish farming: a series of successes and catastrophes. Mar. Ecol. Prog. Ser.184, 205–218. doi: 10.3354/meps184205
31
Keeley N. B. Cromey C. J. Goodwin E. O. Gibbs M. T. Macleod C. M. (2013). Predictive depositional modelling (DEPOMOD) of the interactive effect of current flow and resuspension on ecological impacts beneath salmon farms. Aquaculture Environ. Interact.3, 275–291. doi: 10.3354/aei00068
32
Keeley N. Valdemarsen T. Woodcock S. Holmer M. Husa V. Bannister R. (2019). Resilience of dynamic coastal benthic ecosystems in response to large-scale finfish farming. Aquaculture Environ. Interact.11, 161–179. doi: 10.3354/aei00301
33
Kutti T. Ervik A. Hansen P. K. (2007). Effects of organic effluents from a salmon farm on a fjord system. I. Vertical export and dispersal processes. Aquaculture262, 367–381. doi: 10.1016/j.aquaculture.2006.10.010
34
Lambert G. I. Murray L. G. Hiddink J. G. Hinz H. Lincoln H. Hold N. et al . (2017). Defining thresholds of sustainable impact on benthic communities in relation to fishing disturbance. Sci. Rep.7, 5440. doi: 10.1038/s41598-017-04715-4
35
Lewis A. G. Metaxas A. (1991). Concentrations of total dissolved copper in and near a copper-treated salmon net pen. Aquaculture99, 269–276. doi: 10.1016/0044-8486(91)90247-5
36
Maage A. Julshamn K. (1993). Assessment of zinc status in juvenile Atlantic salmon (Salmo salar) by measurement of whole body and tissue levels of zinc. Aquaculture117, 179–191. doi: 10.1016/0044-8486(93)90134-K
37
Maage A. Julshamn K. Berge G. E. (2001). Zinc gluconate and zinc sulphate as dietary zinc sources for Atlantic salmon. Aquaculture Nutr.7, 183–187. doi: 10.1046/j.1365-2095.2001.00170.x
38
Macleod C. K. Crawford C. M. Moltschaniwskyj N. A. (2004). Assessment of long term change in sediment condition after organic enrichment: defining recovery. Mar. pollut. Bull.49, 79–88. doi: 10.1016/j.marpolbul.2004.01.010
39
Macleod C. K. Moltschaniwskyj N. A. Crawford C. M. Forbes S. E. (2007). Biological recovery from organic enrichment: some systems cope better than others. Mar. Ecol. Prog. Ser.342, 41–53. doi: 10.3354/meps342041
40
Matthiessen P. Reed J. Johnson M. (1999). Sources and potential effects of copper and zinc concentrations in the estuarine waters of Essex and Suffolk, United Kingdom. Mar. pollut. Bull.38, 908–920. doi: 10.1016/S0025-326X(99)00090-9
41
Mayor D. J. Solan M. McMillan H. Killham K. Paton G. I. (2009). Effects of copper and the sea lice treatment Slice® on nutrient release from marine sediments. Mar. pollut. Bull.58, 552–558. doi: 10.1016/j.marpolbul.2008.11.015
42
McKinney W. (2010). Data structures for statistical computing in Python. Proc 9th Python in Science Conf.56–61.
43
Moe Føre H. Thorvaldsen T. Osmundsen T. C. Asche F. Tveterås R. Fagertun J. T. et al . (2022). Technological innovations promoting sustainable salmon (Salmo salar) aquaculture in Norway. Aquaculture Rep.24, 101115. doi: 10.1016/j.aqrep.2022.101115
44
Montes-Herrera J. C. Cimoli E. Cummings V. Hill N. Lucieer A. Lucieer V. (2021). Underwater hyperspectral imaging (UHI): A review of systems and applications for proximal seafloor ecosystem studies. Remote Sens.13, 3451. doi: 10.3390/rs13173451
45
Olsen L. Holmer M. Olsen Y. (2008). Perspectives of nutrient emission from fish aquaculture in coastal waters: Literature review with evaluated state of knowledge. ( FHF project). doi: 10.13140/RG.2.1.1273.8006
46
Porrello S. Lenzi M. Persia E. Tomassetti P. Finoia M. G. (2003). Reduction of aquaculture wastewater eutrophication by phytotreatment ponds system: I. Dissolved and particulate nitrogen and phosphorus. Aquaculture219, 515–529. doi: 10.1016/S0044-8486(02)00656-7
47
Rygg B. Norling K. (2013). Norwegian Sensitivity Index (NSI) for marine macroinvertebrates, and an update of Indicator Species Index (ISI). Norwegian Institute for Water Research.
48
Salvo F. Mersereau J. Hamoutene D. Belley R. Dufour S. C. (2017). Spatial and temporal changes in epibenthic communities at deep, hard bottom aquaculture sites in Newfoundland. Ecol. Indic.76, 207–218. doi: 10.1016/j.ecolind.2017.01.019
49
Sanz-Lázaro C. Belando M. D. Marín-Guirao L. Navarrete-Mier F. Marín A. (2011). Relationship between sedimentation rates and benthic impact on Maërl beds derived from fish farming in the Mediterranean. Mar. Environ. Res.71, 22–30. doi: 10.1016/j.marenvres.2010.09.005
50
Seabold S. Perktold J. (2010). Statsmodels: econometric and statistical modeling with Python. Proceedings of the 9th Python in Science Conference. 92–96. doi: 10.25080/issn.2575-9752
51
Shannon C. E. Weaver W. (1949). The mathematical theory of communication. University of Illinois Press.
52
Standards Norway (2016). Environmental monitoring of benthic impact from marine fish farms. NS 9410:2016Standards Norway.
53
Stoeck T. Frühe L. Forster D. Cordier T. Martins C. I. M. Pawlowski J. (2018). Environmental DNA metabarcoding of benthic bacterial communities indicates the benthic footprint of salmon aquaculture. Mar. pollut. Bull.127, 139–149. doi: 10.1016/j.marpolbul.2017.11.065
54
Van Rossum G. Drake F. L. (2009). Python 3 reference manual (Scotts Valley, CA, United States: CreateSpace).
55
Virtanen P. Gommers R. Oliphant T. E. Haberland M. Reddy T. Cournapeau D. et al . (2020). SciPy 1.0 contributors. SciPy1, 261–272. doi: 10.1038/s41592-019-0686-2
56
Wang X. Andresen K. Handå A. Jensen B. Reitan K. I. Olsen Y. (2013). Chemical composition and release rate of waste discharge from an Atlantic salmon farm with an evaluation of IMTA feasibility. Aquaculture Environ. Interact.4, 147–162. doi: 10.3354/aei00079
57
Wang C.-D. Olsen Y. (2023). Quantifying regional feed utilization, production and nutrient waste emission of Norwegian salmon cage aquaculture. Aquaculture Environ. Interact. 15, 231–249. doi: 10.3354/aei00463
58
Wang C.-D. Olsen Y. (2024). Monitoring regional benthic environment of Norwegian salmon cage farms. Aquaculture Environ. Interact. 16, 71–90. doi: 10.3354/aei00474
59
Waskom M. L. (2021). seaborn: Statistical data visualization. J. Open Source Software6, 3021. doi: 10.21105/joss.03021
60
WoRMS Editorial Board (2023). WoRMS - World Register of Marine Species. Available online at: https://www.marinespecies.org/ (Accessed June 11, 2023).
Summary
Keywords
Atlantic salmon, organic enrichment, environmental monitoring, benthic ecosystem, benthic macrofauna, sustainability
Citation
Wang C-D, Skomsø DB and Olsen Y (2025) Environmental assessments for seabed impact and resilience from aquaculture: a case study in an intensive production area (Frøya, Norway). Front. Mar. Sci. 12:1621315. doi: 10.3389/fmars.2025.1621315
Received
30 April 2025
Accepted
27 October 2025
Published
13 November 2025
Volume
12 - 2025
Edited by
Fabio Carneiro Sterzelecki, Federal Rural University of the Amazon, Brazil
Reviewed by
Nafsika Papageorgiou, National and Kapodistrian University of Athens, Greece
Mbaye Tine, Gaston Berger University, Senegal
Updates
Copyright
© 2025 Wang, Skomsø and Olsen.
This is an open-access article distributed under the terms of the Creative Commons Attribution License (CC BY). The use, distribution or reproduction in other forums is permitted, provided the original author(s) and the copyright owner(s) are credited and that the original publication in this journal is cited, in accordance with accepted academic practice. No use, distribution or reproduction is permitted which does not comply with these terms.
*Correspondence: Chun-Deng Wang, chun-deng.wang@ntnu.no
Disclaimer
All claims expressed in this article are solely those of the authors and do not necessarily represent those of their affiliated organizations, or those of the publisher, the editors and the reviewers. Any product that may be evaluated in this article or claim that may be made by its manufacturer is not guaranteed or endorsed by the publisher.