Abstract
Blue carbon ecosystems, such as mangroves, tidal marshes, and seagrasses, are important for climate mitigation. As carbon sinks, they often exhibit higher per hectare carbon storage capacity and sequestration rates than terrestrial systems. These ecosystems provide additional benefits, including enhancing water quality, sustaining biodiversity, and maintaining coastal resilience to climate change impacts. The widespread loss of blue carbon ecosystems due to anthropogenic activities can contribute to increasing carbon emissions globally. Monetizing blue carbon through carbon credits offers an avenue to generate revenue and incentivize conservation and restoration efforts. However, limited data on project costs and carbon benefits make prioritization of blue carbon projects challenging. To address these challenges, we have developed, in collaboration with blue carbon experts, the Blue Carbon Cost Tool. This is a user-friendly interface enabling comparison of three core market project components – 1) carbon credit estimation, 2) project cost estimation, and 3) a qualitative, non-economic feasibility assessment – to assess and compare potential for blue carbon projects. Tool simulations with data available from nine countries demonstrate (a) how factors such as country, ecosystem type and project scale drive variability, (b) the need for local or project-specific data to enhance accuracy and reduce uncertainty, particularly in tidal marsh and seagrass systems, and (c) that higher price tolerance or upfront capital is needed to bridge implementation and maintenance cost gaps. The Blue Carbon Cost Tool can aid project developers and investors to better understand market opportunity and the resources needed to develop high quality blue carbon market projects.
1 Introduction
Coastal blue carbon ecosystems (BCEs), namely mangrove forests, tidal marshes and seagrass meadows, have been recognized by the Intergovernmental Panel on Climate Change (IPCC) as highly effective carbon sinks (IPCC, 2014). When undisturbed, conserved, or effectively managed, these ecosystems often sequester carbon at higher rates per hectare than terrestrial ecosystems (Pendleton et al., 2012; Howard et al., 2023). Furthermore, such sequestration is ongoing over the long-term as organic matter continually builds up in carbon-rich saline soils, whereas most terrestrial ecosystems reach an equilibrium state. Protection and restoration of BCEs can help mitigate climate change (Howard et al., 2023), with the potential to mitigate approximately 3% of global greenhouse gas (GHG) emissions (Macreadie et al., 2021). In addition, BCEs also provide a suite of co-benefits including improved water quality, increased biodiversity, strengthened local economies (e.g., through fisheries enhancement, recreation and tourism), and greater coastal resilience to storms and climate change impacts (Barbier et al., 2011; Ouyang et al., 2024).
Despite their significance, BCEs face a multitude of threats that impact their continued ability to sequester carbon (Lovelock et al., 2017a; Adame et al., 2021). With over half of the world’s population situated along the coast, rapid urban development and agricultural expansion have resulted in the destruction and fragmentation of BCEs globally (Allan et al., 2023; Reimann et al., 2023). Climate change causes additional impacts from rising sea-level and increased storm intensity (Knutson et al., 2010), which can erode and inundate coastal wetlands (Saintilan et al., 2020, 2022; Li et al., 2018). These factors collectively threaten the biodiversity and ecosystem services that BCEs support.
Coastal wetlands are dynamic ecosystems, and projects that aim to restore and conserve them encounter an array of barriers. Among these are limited technical capacity to understand physical processes such as tidal patterns and sediment movements, and socio-political factors such as competing land uses (e.g., fishing and aquaculture, cultural or indigenous practices, urban development, or recreation and tourism) and often ambiguous land ownership (e.g., overlapping claims, lack of formal titles, customary or informal tenure systems; Friess et al., 2022). Projects require a multidisciplinary approach to overcome these barriers, integrating ecology, hydrology, engineering and social sciences (Moore and Kumble, 2024; Saunders et al., 2024). Additionally, effective restoration demands long-term monitoring and adaptive management to respond to changing conditions and ensure the sustainability of restored and protected habitats. However, many coastal wetland projects globally struggle to fund longer-term project management and monitoring activities necessary for project success (Zhao et al., 2016). Blue carbon market projects, wherein projects generate tradeable carbon credits, can provide a source of sustainable financing to support long-term project success; however, this adds another layer to the project development process to meet the criteria required by international carbon standards (Perera et al., 2024). Due to the complexity of implementing blue carbon market projects, there is typically significant upfront capital required for building the enabling conditions, which makes financing these projects challenging (Macreadie et al., 2022).
The science on BCEs has evolved rapidly over the past two decades, enough for inclusion in the Intergovernmental Panel on Climate Change (IPCC) 2013 Wetlands Supplement and the development of methodologies under the Clean Development Mechanism and then under internationally recognized voluntary carbon offset standards (e.g. American Carbon Registry, Australia’s Clean Energy Regulator, and Verra’s Verified Carbon Standard). However, many project-level science and finance data gaps remain (Howard et al., 2023). Due to the complexity and high cost of these projects, available data is often skewed towards smaller projects. Existing data is not easily extrapolated due to cost variances of labor, restoration types (e.g., plantings vs hydrological improvement), and the variability of climate mitigation values. Blue carbon ecosystems’ climate mitigation can be highly influenced by local or site-level environmental characteristics (e.g., soil type, erosion rates, freshwater inputs, etc.). Data deficiencies on project costs (particularly implementation costs) and variability in ecosystem carbon sequestration and storage have hindered our understanding of the full cost and mitigation potential of projects.
Despite these challenges, there is growing recognition that the revenue generated through blue carbon credits, which monetize carbon storage of these ecosystems, can play a partial role in funding these initiatives (Hagger et al., 2022). In 2023, average mangrove restoration credits traded on the global voluntary carbon market (VCM) sold at a price of $26.03 USD per credit, measured in metric tons of carbon dioxide equivalent (tCO2e) (Agardy and Bennett, 2024), and recent reported trades were sold at a value of $32 per tCO2e in 2024 (OPIS, Nov 2024). In comparison, for 2023, the overall average price of all carbon credits sold on the VCM was $6.63 per tCO2e, with the average forestry and land-use carbon credit sold at a price of $9.91 per tCO2e. This difference indicates a premiumization of these blue carbon credits. Higher prices are likely due to the high demand and low supply of blue carbon credits, the development of high-quality best practices (Beeston et al., 2024), and the multitude of benefits such projects provide. Demand is only expected to increase as industries like shipping and port authorities explore offset potential with particular interest for marine-based credits, and private sector coalitions make large commitments to nature-based carbon removals (Agardy and Bennett, 2024). Accurately evaluating costs and potential market revenues can help project developers attract essential funding from donors and investors (Vanderklift et al., 2019), determine the suitability of market project development, and understand how market finance can support long-term project sustainability. Clear financial planning also helps to set realistic goals and timelines and ensures projects can deliver their intended environmental and economic community benefits.
Given the potential for revenue generation through the sale of blue carbon credits and the complexities associated with market project development, we developed the Blue Carbon Cost Tool (BCCT) to encourage and support a deeper understanding of the costs and benefits of developing high-quality blue carbon market projects (Beeston et al., 2024). The BCCT model estimates, at the project scale, the abatement potential and subsequent carbon credit generation potential, the costs related to developing and implementing project activities, and other qualitative metrics such as legal and social feasibility that impact a project’s success. This model is the first of its kind and will contribute to the growing evidence base on blue carbon climate mitigation potential, investment requirements, and carbon credit return potential.
2 Methods
We developed a model to estimate critical components that are required for development of blue carbon market projects, defined as projects that meet international carbon standards (e.g. Verra’s Verified Carbon Standard, www.verra.org) and methodology requirements to be eligible for carbon credit sales on the VCM. These components include: (1) abatement potential and associated carbon credit generation; (2) costs including capital expenditures, operating expenditures, and potential revenues (resulting from the sale of credits at predefined prices); and (3) non-economic (e.g., social, legal, and political) feasibility. To parameterize the model, data were gathered across nine countries for the three BCEs (mangroves, tidal marsh, and seagrass) included in international voluntary carbon offset accounting standards to-date, and two intervention activities (conservation/avoided loss and restoration/removals). The model underpins a data visualization platform that makes up the BCCT, which facilitates comparisons among different project types across geographies and provides an overview of cost components to consider when developing a high-quality project. This tool offers a snapshot of blue carbon project financials over a user-selected timeframe of up to 30-years.
Due to the lack of peer-reviewed literature on the topic of interest, key parameters and cost components for the BCCT were selected through expert consultations identified from environmental nonprofits and carbon firms with relevant expertise. Through a combination of 41 one-on-one semi-structured interviews and 19 group meetings, we elicited feedback from 62 leaders in the field whose expertise spanned multiple disciplines (Supplementary Tables S1 and S2). Through this consultation process, we identified three primary components of project modeling (Figure 1): (1) blue carbon abatement and associated carbon credit generation estimations; (2) total project costs including both capital expenditures (CAPEX) and operating expenditures (OPEX); and (3) a qualitative score derived from non-economic metrics (social, legal, and political factors) associated with enabling conditions that play a pivotal role in project development and feasibility.
Figure 1
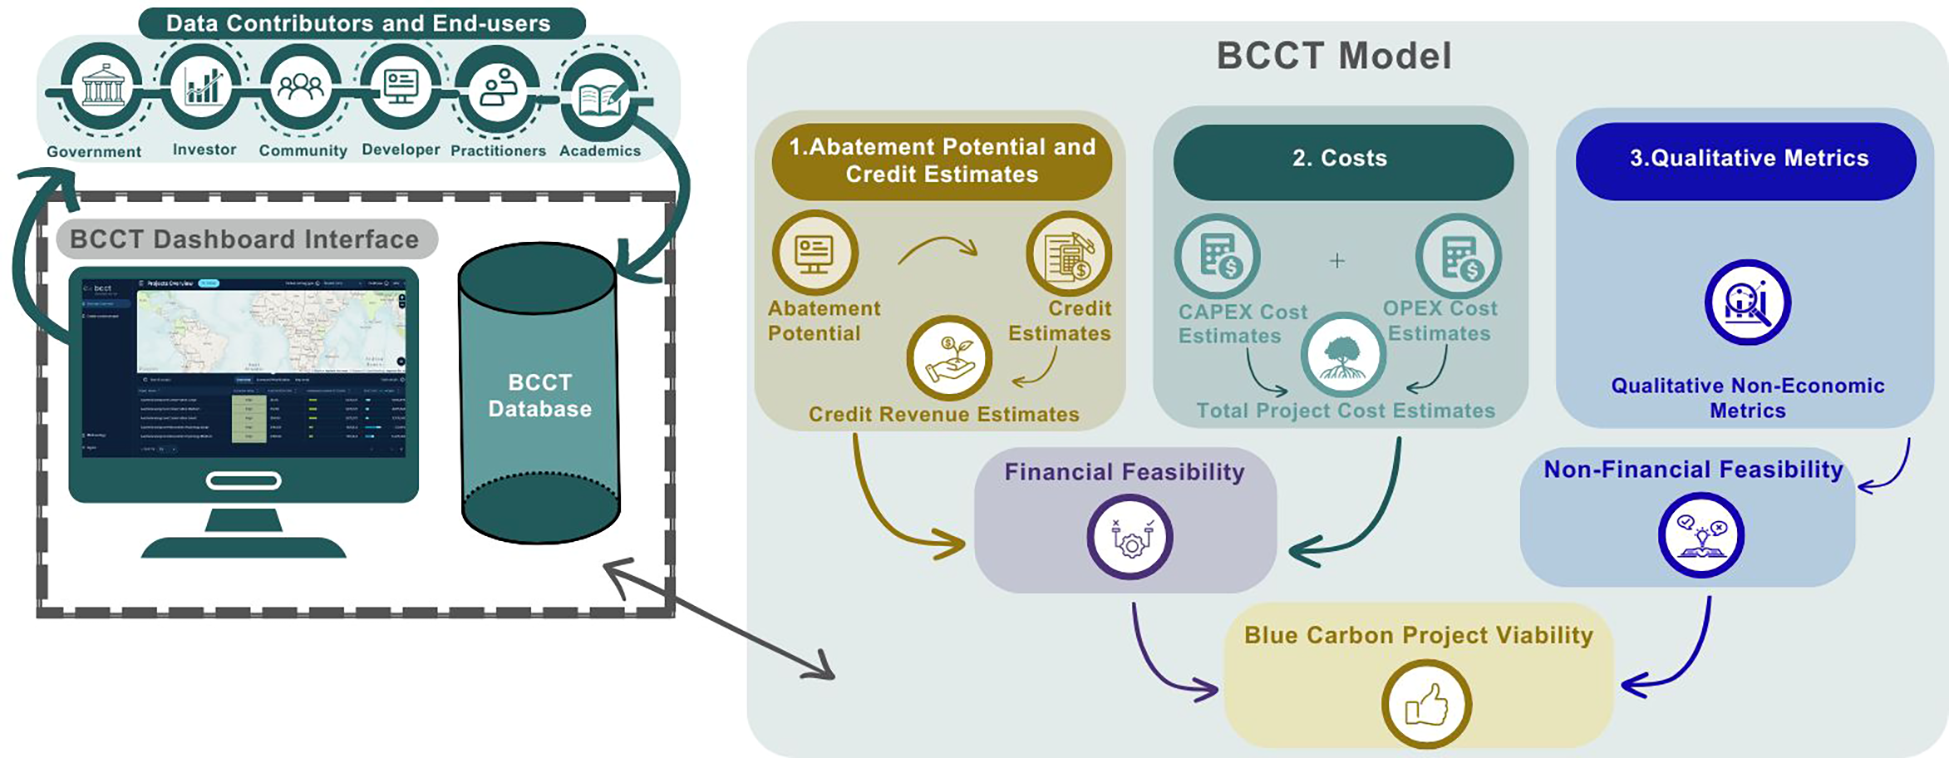
The three primary components that make up the Blue Carbon Cost Tool. 1) Abatement Potential and Credit Estimates relates to the estimated carbon credits and subsequent carbon revenue potential; 2) Costs are the capital and operational expenditures (CAPEX and OPEX, respectively) that make up the total project costs; and 3) Qualitative Metrics are the non-economic metrics that provide additional context for project feasibility.
2.1 Geographic scope, ecosystems and activities
The current version of the BCCT includes data from nine countries, together representing the major blue carbon regions. They were selected based on both their significant blue carbon mitigation potential, combined representing over 61% of the global blue carbon mitigation potential (Roe et al., 2021), and the availability of blue carbon data. These countries were Australia, The Bahamas, China, Colombia, India, Indonesia, Kenya, Mexico, and the United States of America.
Blue carbon market projects are separated into two carbon project intervention types for mangroves, tidal marshes, and seagrass – ecosystem conservation (avoided loss of habitat and subsequent carbon stores at threat) and ecosystem restoration (reestablishment of native habitat resulting in carbon removals via sequestration; Griscom et al., 2017). Based on consultations with coastal ecosystem project managers and developers, we further divided restoration projects into three types of activities due to the cost variability of each activity type: (1) hydrological modification, which includes activities such as erosion reduction, excavation, filling, construction or modification of structures like culverts and breakwaters, and the opening or modification of channels to improve water flow and overall ecosystem function in approaches which allow for natural vegetative re-colonization from surrounding areas; (2) revegetation, which includes activities such as establishing nurseries and planting seeds or seedlings to promote the regeneration and expansion of coastal vegetation; and (3) hybrid approaches, which combine elements of both revegetation and hydrological modifications. Although this is a simplification of the broad range of restoration techniques used in coastal systems, these three activity types attempt to streamline the model while still capturing the wide range of implementation costs for the various restoration techniques. For example, revegetation often requires less capital than hydrological modification because the latter can involve heavy machinery, earthwork, and sometimes infrastructure modifications. It should be noted that some blue carbon market projects use planting as an afforestation activity, where planting occurs on previously unvegetated tidal flats. While this approach to restoration is allowable under VM0033, the carbon sequestration benefits of such activities are often low (Song et al., 2023; Ouyang et al., 2024). Therefore, afforestation was not considered a viable restoration activity for the purposes of this study.
2.2 Abatement potential and carbon credit estimations
2.2.1 Conservation abatement potential
The conservation abatement potential (e.g., avoided loss) is a function of the ecosystem extent within a defined project area, fluxes (calculated using emission factors and carbon stocks) from relevant carbon pools (e.g., aboveground, belowground, and soil), the time frame being considered, and ecosystem loss rates. Using country-specific loss rates for mangroves (Bunting et al., 2022) and tidal marshes (Campbell et al., 2022), and global loss rates for seagrasses (Dunic et al., 2021; Supplementary Table S3), the annual avoided loss and cumulative avoided loss areas in year t was calculated using Equations 1, 2:
These area loss estimates were used to calculate the potential emissions of existing carbon stocks in different pools, and the forgone sequestration expected in the absence of the conservation activity. All values were converted from carbon to tons of carbon dioxide equivalent (tCO2e) using a conversion factor of 3.67. Our estimates do not currently incorporate other potential greenhouse gas emissions like methane or nitrous oxide due to lack of data. Country-specific emission factors were used where possible. However, due to limited data availability, some countries and ecosystems (e.g., seagrass) required the use of global averages from the IPCC Wetlands Supplement (IPCC, 2014) for the different carbon pools. For some geographies and ecosystems, both country-specific and IPCC data were available. In these cases, country-specific data were used for model simulations, but both data sets are available for custom use in the tool (Figure 2; Supplementary Table S4).
Figure 2
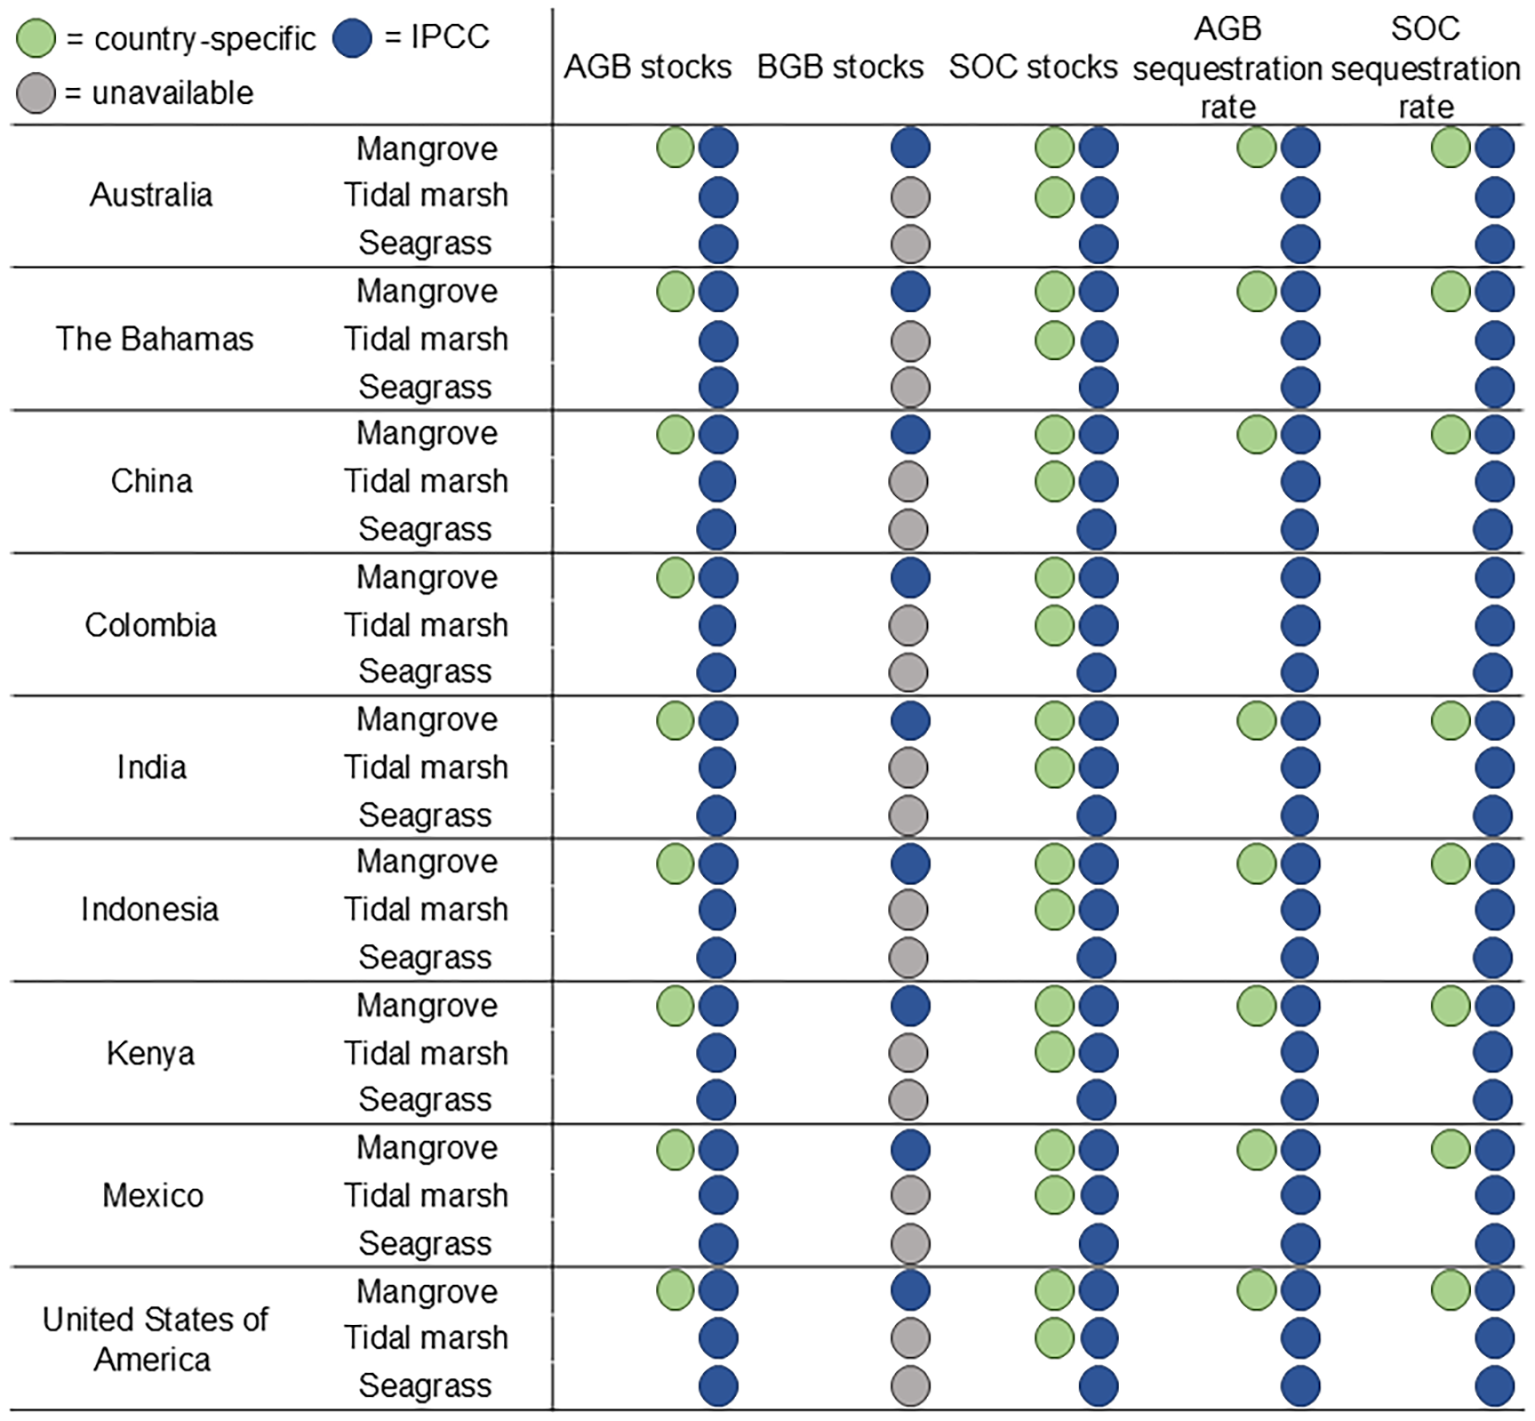
Data used to derive carbon emissions or sequestration for each carbon pool (aboveground biomass = AGB, belowground biomass = BGB, soil organic carbon = SOC), within the three coastal ecosystems (mangrove, tidal marsh, seagrass) across the nine countries included in the Blue Carbon Cost Tool. Color indicates whether data included is country-specific (green), from the Intergovernmental Panel on Climate Change (IPCC) Wetlands Supplement (IPCC, 2014; blue) or was unavailable (grey) in the current model. Data sources are available in Supplementary Tables S3, S4 and S5. Note: for tidal marshes and seagrasses, SOC values may, in fact, include BGB so it is not reported separately from SOC for these ecosystems.
In geographies and ecosystems without country-specific values, avoided emissions were estimated using IPCC global averages (provided as a yearly rate) distributed evenly throughout the project life cycle and additional sequestration was estimated on a yearly basis. For countries or ecosystems using IPCC global averages (this includes mangroves, tidal marshes, and seagrasses), the abatement potential was calculated using the Equation 3:
In geographies and ecosystems with country-specific standing stock values, avoided emissions from aboveground biomass (AGB), belowground biomass (BGB) and soil organic carbon (SOC) were accounted for differently. This more accurately allocated the benefits and revenues across the project period’s annualized calculations. The avoided emissions from AGB and BGB were allocated in the year the conversion was averted. We assumed 82% (fraction emitted) of AGB and BGB are emitted at the time of conversion (Sasmito et al., 2019). Avoided emissions from AGB and BGB (only for mangroves) were calculated according to Equation 4:
SOC emissions were assumed to be released gradually, with 54% of the SOC stocks to 1m depth (Sasmito et al., 2019) released or distributed over a 10-year period, the time frame when most SOC emissions tend to occur (Lovelock et al., 2017b). Emissions from SOC (only for tidal marshes and mangroves) were calculated according to Equation 5:
Forgone sequestration was calculated using country-specific sequestration rates when available, otherwise, global sequestration rates were used (IPCC, 2014). The total conservation abatement potential was calculated according to Equation 6:
2.2.2 Restoration abatement potential
The restoration abatement potential is a function of the extent of restoration in a defined project area, sequestration rates for different carbon pools, and the time frame under consideration. As a conservative approach, carbon emissions in the baseline are assumed zero; this follows carbon-standard-approved methodologies (e.g. VM0033 v2.1). Because sequestration rates vary significantly depending on ecosystem characteristics and geographic location, country-specific sequestration rates were assigned if the data were available in the peer-reviewed literature or via organizations’ feasibility studies (Figure 2; Supplementary Table S5). For mangroves, live biomass sequestration rates are not linear, with slow rates initially, a peak between 5 and 20 years (which varies by species and environmental conditions), and a general plateau as trees reach maturity (Okimoto et al., 2008; Azman et al., 2021). To account for this in a simplified but conservative way, a fixed sequestration rate was applied for mangrove ecosystems, averaged over time, for the first 10 years of the project period (Okimoto et al., 2008; Azman et al., 2021). After those 10 years, only yearly sequestration from the soil carbon pool was included. Because live biomass is a small component of the carbon accounting for tidal marshes and seagrasses, and because many of the plant species in these ecosystems have annual life cycles, no default values for live biomass are included. However, live biomass sequestration can be accounted for in the tool if the data are available, but only in the first year of the restoration project. In subsequent years, only sequestration rates from the soil/sediment carbon pool are used. As a default, the tool assumes that the full extent of the project area is restored in year 1, however, the user can customize their restoration plan (e.g., if they only restore half of their project area in year 1) so that the carbon credits resulting from the restoration can be accounted for more accurately in the annual reporting interval. A default revegetation success rate of 60% (based on expert consultation), which can be adjusted by a tool user, was used in the calculations for revegetation or hybrid (revegetation plus hydrologic modification) restoration activities. Restoration abatement potential (for mangroves, tidal marshes, and seagrasses) was calculated according to Equation 7:
2.2.3 Carbon credit and revenue estimates
Carbon credits and carbon credit revenues were estimated using the abatement potential from either conservation (Equations 3 or 6) or restoration estimates (Equation 7). Carbon credit and revenue calculations included a buffer deduction that accounted for uncertainty, leakage, and non-permanence risks associated with the project. A default deduction, which can be adjusted by a tool user, of 20% was applied, based on expert consultation, feasibility studies and Perera et al., 2024 reporting that most registered blue carbon project buffers were between 10 and 30%. A 20% buffer also aligns with the Integrity Council for the Voluntary Carbon Market’s Core Carbon Principles (International Carbon Verification and Certification Mechanism, 2024). Carbon credits were calculated according to Equation 8:
And carbon revenues were calculated according to Equation 9:
Two carbon credit prices were modeled: (a) the market price, assumed at $30/tCO2e based on the premiumization of blue carbon credits reported above (OPIS, 2024), and (b) the OPEX breakeven price, based on the modeled cost required to cover all operational costs. Both prices assumed a 1.5% annual carbon price increase and 4% discount rate, based on expert consultation.
2.3 Cost estimations
Costs were captured throughout the entire life cycle of a blue carbon market project (project length can be customized by the user, but the default project length is 20 years), starting from project origination (up to 4 years before implementation) through issuance of carbon credits and projected for project maintenance (Figure 3).
Figure 3
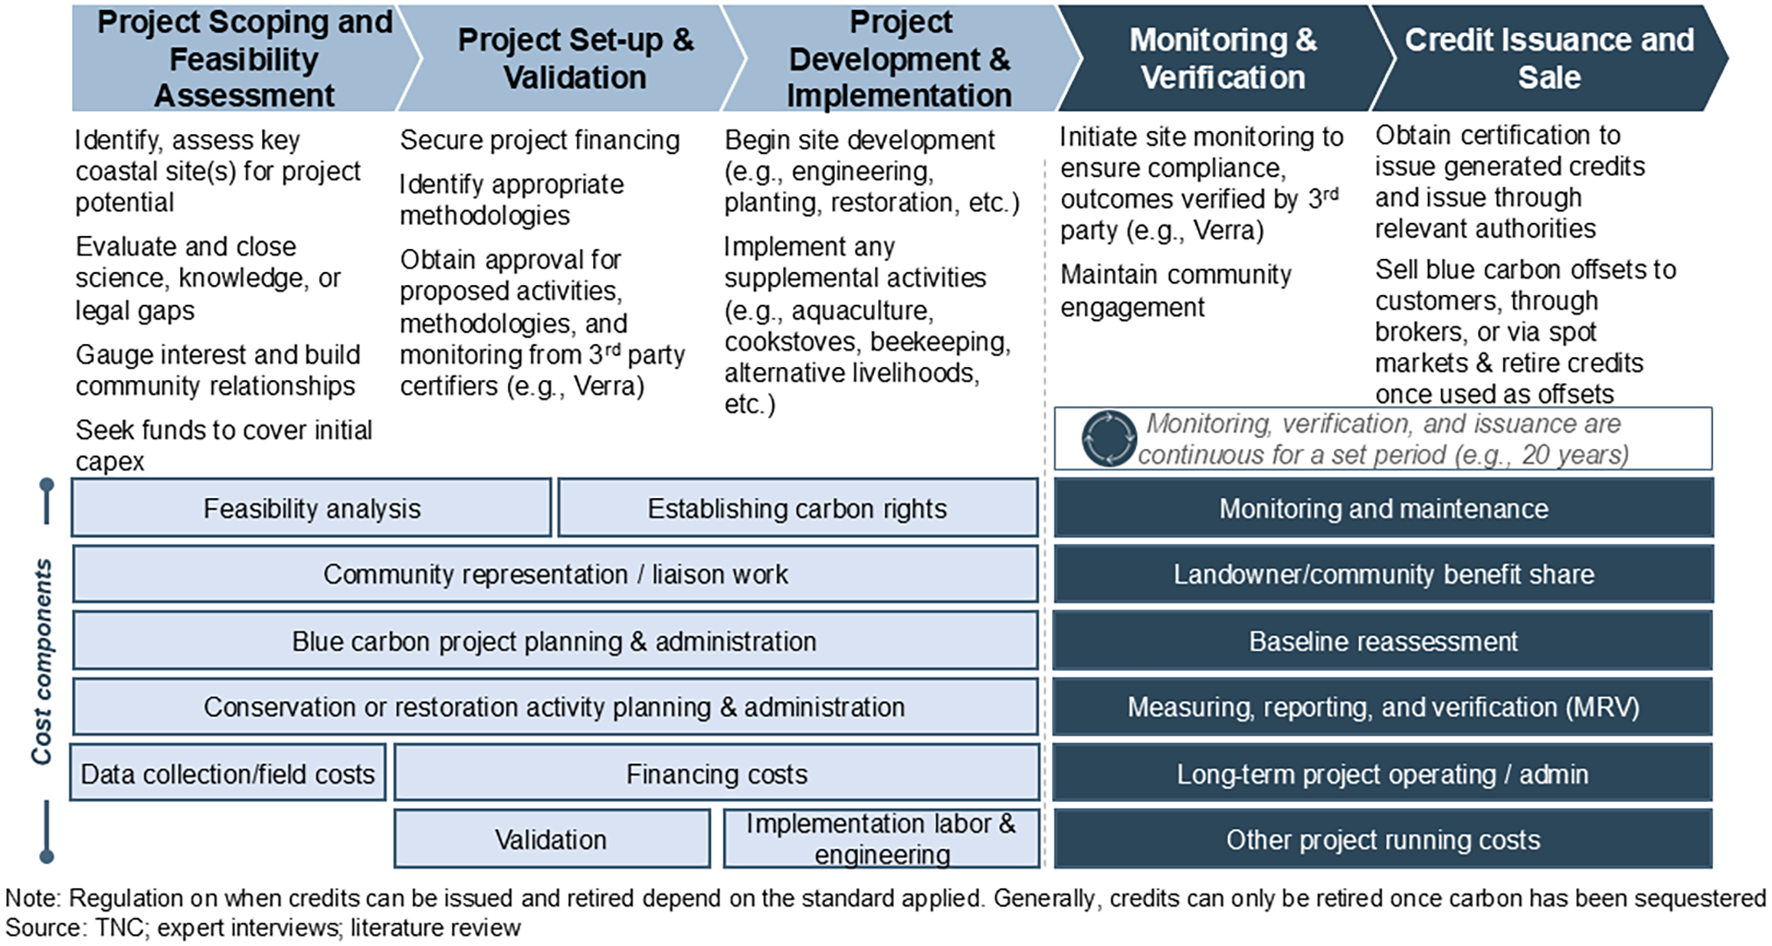
Descriptions of capital expenditures (light blue) and operational expenditures (dark blue) that are included as cost components in the Blue Carbon Cost Tool.
To evaluate project development costs, we assessed existing cost datasets through practitioner consultations, reviews of blue carbon feasibility studies and publicly available project information from market-listed projects and reviewed general restoration cost data referenced in Bayraktarov et al. (2020) and Herrera-Silveira et al. (2022). We reviewed additional literature cited within these studies when more specific data were needed. Following this review, data gathered from experts were compared with the data presented in Bayraktarov et al., 2020, revealing significant differences between the costs (Supplementary Figure S1). These differences arose primarily due to inconsistency in cost data reporting and the inclusion of costs for unique and rare events (e.g. oil spillage, airport development, etc.). These atypical restoration projects incurred disproportionally high costs due to compliance requirements and other factors. For this reason, cost data referenced in Bayraktarov and Herrera-Silveira were deemed not fit for purpose, and cost estimates gathered from expert consultations and feasibility studies were deemed more accurate in consistency and relevance for inclusion in the BCCT. All costs were appropriately converted to current USD based on 2024 conversion rates using the online XE Currency Converter tool (Pfiester et al., 2021).
2.3.1 CAPEX and OPEX
Costs were divided into CAPEX and OPEX in the model (Figure 3). CAPEX represent the scoping and planning activities supporting project implementation, which include the feasibility analysis, project planning, data collection, community engagement, project design, carbon rights establishment, carbon project validation, and implementation labor (Figure 3). OPEX included costs related to monitoring, maintenance, some landowner/community benefit share, baseline reassessment, measuring, reporting, and verification (MRV), long-term project operating costs, and fees for the carbon standard (see Supplementary Table S6 for the full description of each cost considered and Supplementary Table S7 for methodologies used in the derivation and application of these costs).
2.3.2 Landowner/community benefit share
It is important to note the addition of a separate line item for “landowner/community benefit share”, which was identified by practitioners and expert consultants as an often overlooked but critical best practice. The landowner/community benefit share is a separate budgetary component that should reflect benefit-sharing agreements to meet community socioeconomic and financial priorities for long term project success and community benefit. In the model, the benefit share is separated into two components: 10% of revenue is included in the OPEX, and 50% of profit (revenue – OPEX) only when revenues are equal or greater than OPEX; thus a total benefit share of 60% (PV Climate Project Requirements, v5.2) is possible. While authors acknowledge a fixed percentage will not always be appropriate (Wharton et al., 2023), for the purpose of this tool, the landowner/community benefit share cost component ensures a placeholder for benefit sharing costs that should be accounted for in project cost estimations. A tool user can customize this field per their project-specific benefit sharing agreement. Limiting the cost to be recovered to OPEX is indicative of the expectation that carbon revenues will likely not be enough to cover full project cost (CAPEX + OPEX) but can be a means to funding long-term project maintenance and monitoring (OPEX) costs. Because the benefit share is budgeted as a percentage of carbon revenues, its cost will be dependent on the price of the carbon credits.
2.4 Qualitative, non-economic metrics
In addition to carbon and cost estimations, a qualitative score was developed and assigned to each region, accounting for non-economic, qualitative factors known to influence blue carbon market project feasibility (Wylie et al., 2016). We used publicly available datasets to develop proxies for metrics like legal and social feasibility (e.g., World Bank, projects listed on registries, etc.), security rating (e.g., US Travel Risk Rating), and implementation risks (e.g., World Risk Report). We weighted the individual metrics based on their relative influence on overall blue carbon market feasibility, as determined by literature review and expert consultation, to generate an overall non-economic feasibility score (see Supplementary Table S8 for list of metrics and descriptions and Supplementary Table S9 for the methodology and sources used to calculate these).
2.5 Project simulations
To understand the influence of different project characteristics on carbon credits, costs, and revenues, we developed 456 scenarios (Supplementary Table S10) at market price and OPEX breakeven price for all possible combinations of country, ecosystem, activity, and project size. Project size assumptions were based on expert consultations and review of feasibility studies, where restoration project size ranged from 100–1000 ha and conservation project size ranged from 400-40,000 ha (see Table 1 for further breakdown of project size assumptions). Even though we evaluated both OPEX breakeven price and market price, all results are provided for the market price of $30/tCO2e (this only affects the landowner/community benefit share since that cost component is integrated into OPEX as a percentage of the carbon credit revenue, which is influenced by the market price assumption) using the default project length of 20 years.
Table 1
| Project size assumptions for simulated projects | Mangrove | Tidal marsh | Seagrass |
|---|---|---|---|
| Small project size | Conservation: 4,000 ha Restoration: 100 ha |
Conservation: 800 ha Restoration: 100 ha |
Conservation: 400 ha Restoration: 100 ha |
| Medium project size | Conservation: 20,000 ha Restoration: 500 ha |
Conservation: 4,000 ha Restoration: 500 ha |
Conservation: 2,000 ha Restoration: 500 ha |
| Large project size | Conservation: 40,000 ha Restoration: 1,000 ha |
Conservation: 8,000 ha Restoration: 1,000 ha |
Conservation: 4,000 ha Restoration: 1,000 ha |
For the scenarios run in the tool, three typical project sizes (small, medium, large) for both conservation and restoration activities were defined based on conversations with experts and practitioners.
To ensure real-life feasibility and facilitate meaningful comparisons between projects, project sizes were selected based on their carbon equivalency and representativeness. Actual creditable hectares for conservation projects are calculated based on ecosystem loss rate to give equivalent carbon impact.
3 Results
All costs are presented as net present value (NPV). Credit potential is presented as tCO2e and includes the 20% default deduction, and cost per credit is reported as USD/tCO2e. Total project costs and the distribution of costs across the different stages of the project life cycle differed between conservation and restoration projects. For conservation projects, total project costs ranged from $1.78M to $15.79M (NPV, across all project sizes, geographies, and ecosystems) with, on average, 61% of the total costs incurred post project development stage (e.g., OPEX, during monitoring and credit issuance). Restoration project costs ranged between $2.01M and $260.58M, with 77% of total costs incurred during the project development and implementation stage (CAPEX; Figure 4).
Figure 4
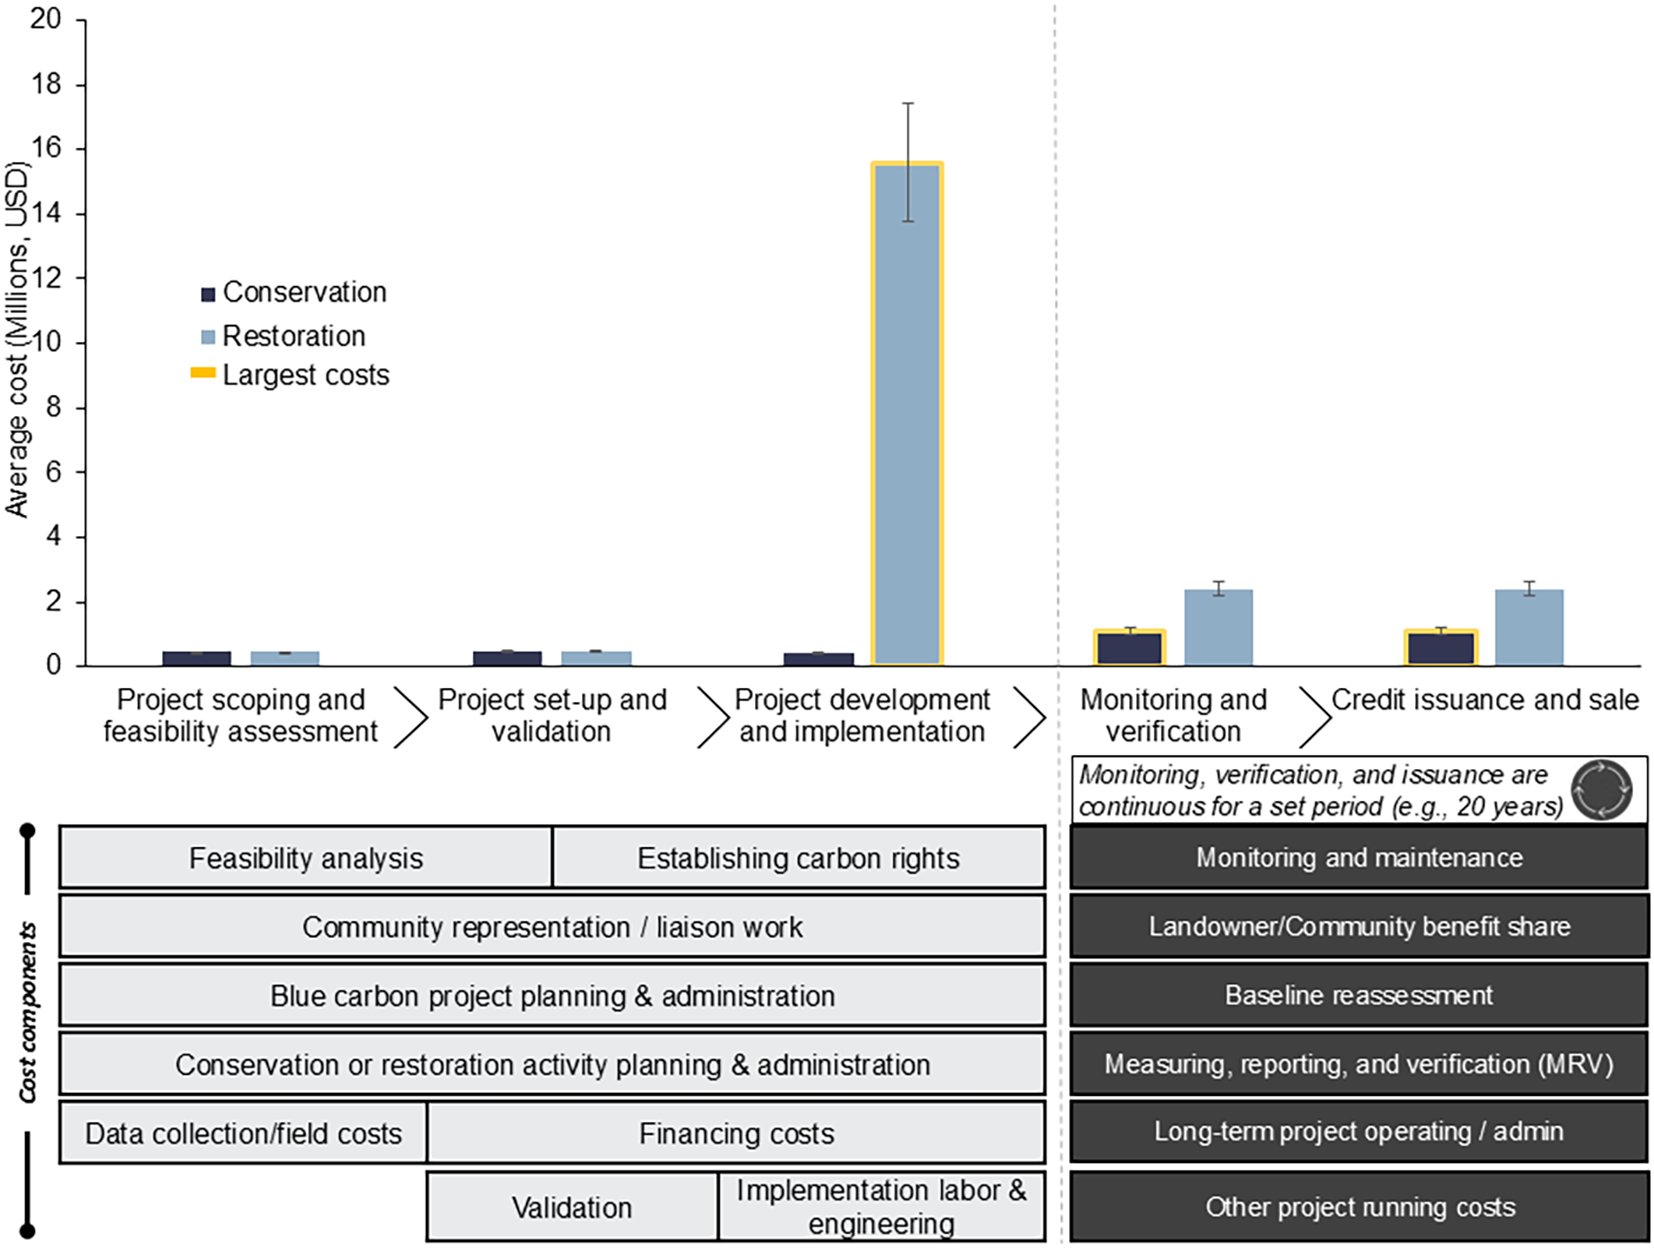
Distribution of project costs (measured as average investment in millions USD) and associated standard errors across project life cycle stages for all blue carbon conservation and restoration project scenarios (at the market price of $30/tCO2e). Project stages with the highest costs for both conservation and restoration projects have been highlighted in yellow. Cost components attributed to each project phase are included below the figure (e.g., feasibility analysis is split between the project scoping and feasibility assessment phase as well as the project set-up and validation phase whereas community representation/liaison work costs are distributed across all three project development phases).
The highest percent of investment for conservation projects resulted from OPEX (Figure 5), with the landowner/community benefit share as the primary contributor (on average 30%), followed by conservation planning and admin and long term project operating costs. Investments for landowner/community benefit share were, on average, $969,600 (median = $30,000) over the project lifetime of 20 years. Conversely, for restoration projects, the majority of investments were due to CAPEX, namely implementation labor costs (on average 71% of total restoration costs), followed by maintenance. For restoration projects, implementation labor costs, on average, were $15.16M (median= $3.42M).
Figure 5
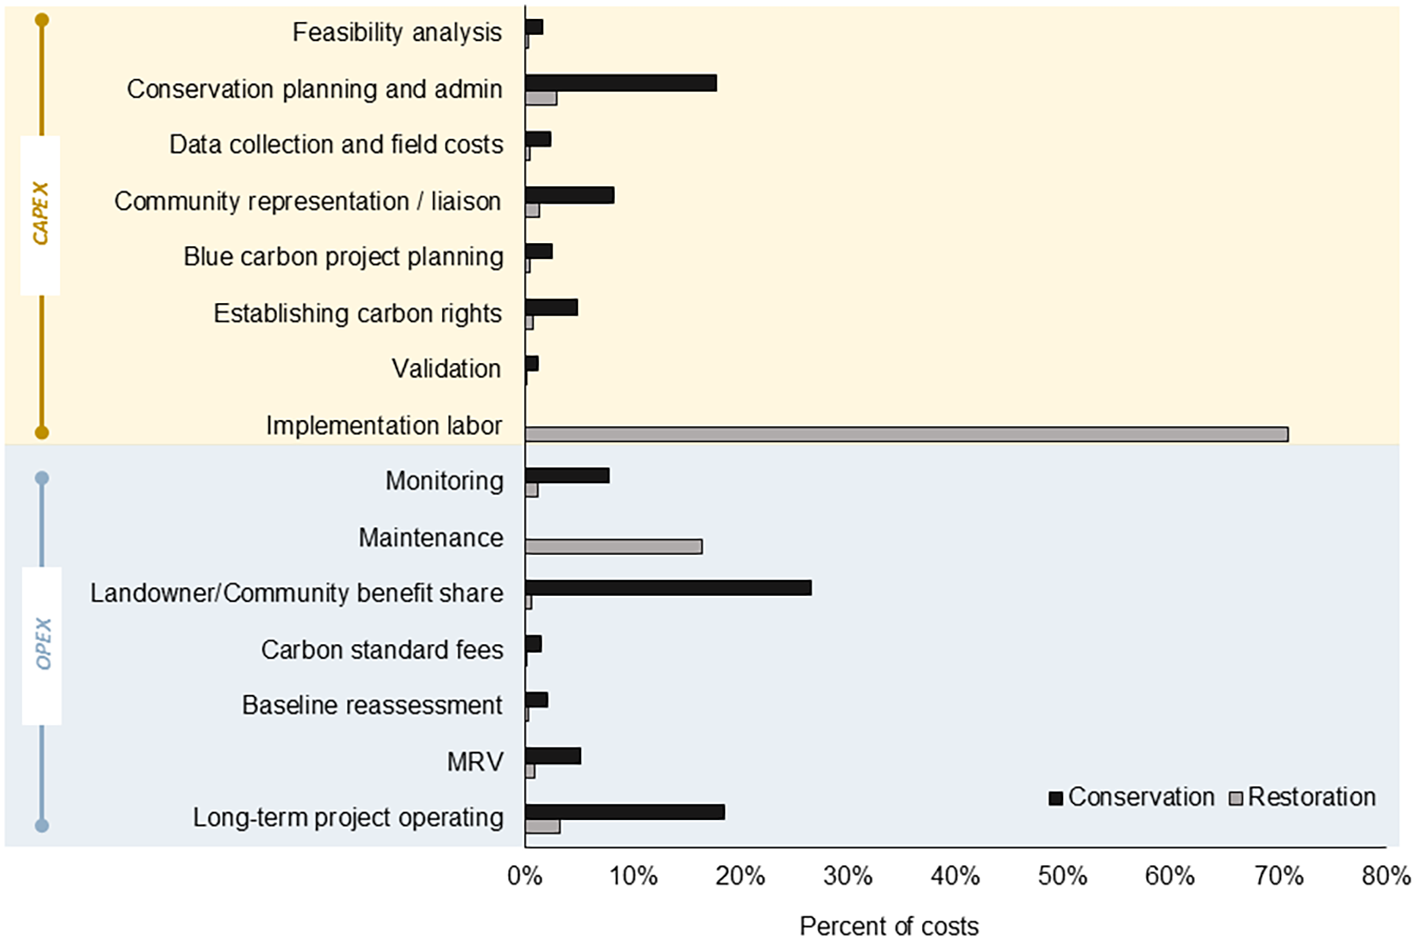
Distribution of project costs (represented as a percentage of total restoration or conservation costs) across all cost components for all project scenarios, with a default project length of 20 years. (Notes: landowner/community benefit share is a percentage of credit revenue, which is based on a market price of $30/tCO2e. MRV= measuring, reporting, and verification).
When comparing the use of country-specific or globally-derived emissions values to potential credit generation, there was high variability between countries. For example, country-derived estimates resulted in a lower estimate of credit potential for The Bahamas and Kenya and a higher credit potential for Indonesia, compared to simulations using globally-derived data (Figure 6).
Figure 6
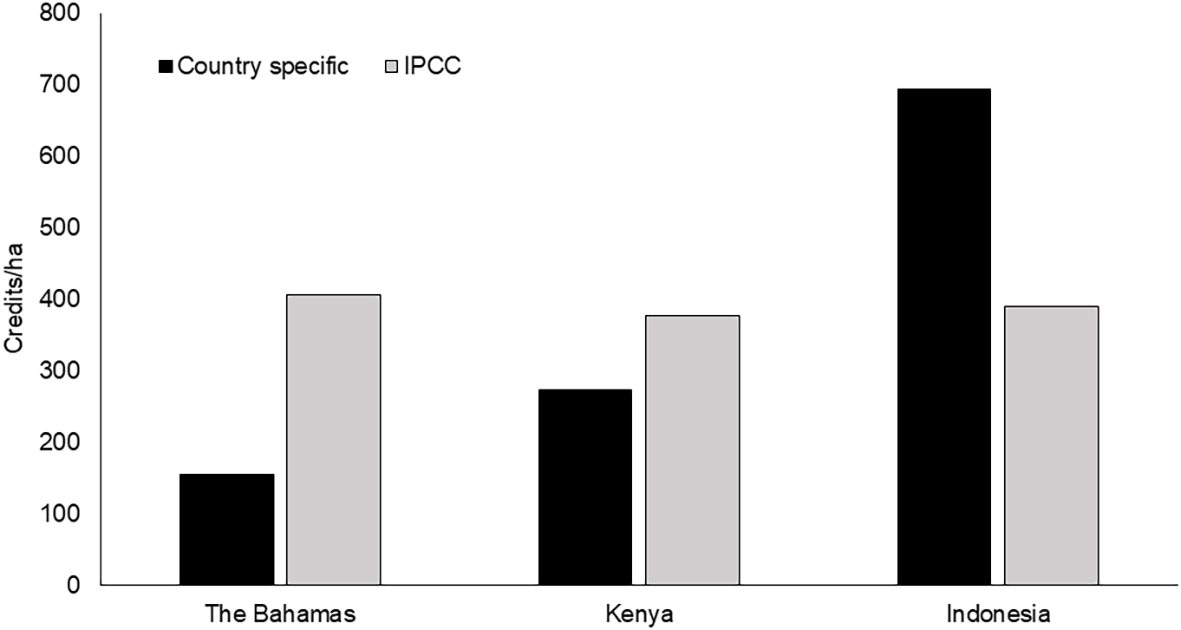
Credit potential (credits per hectare) for hypothetical mangrove restoration projects (across all project sizes) in a subset of focal countries using either country-specific sequestration or global average (IPCC, 2014) rates.
Restoration activities had, on average, higher credit potential per hectare (160 credits/ha) than conservation activities (24 credits/ha; Figure 7A) but conservation activities generally had lower costs per tCO2e than restoration activities (Figure 7B). On average, activities in mangroves incurred the lowest costs per tCO2e of all three ecosystems (conservation mean = $12/tCO2e, restoration mean = $270/tCO2e), followed by tidal marshes (conservation mean = $400/tCO2e, restoration mean = $1,300/tCO2e), and seagrasses (conservation mean = $2,370/tCO2e, restoration mean = $2,430/tCO2e; Figure 7B).
Figure 7
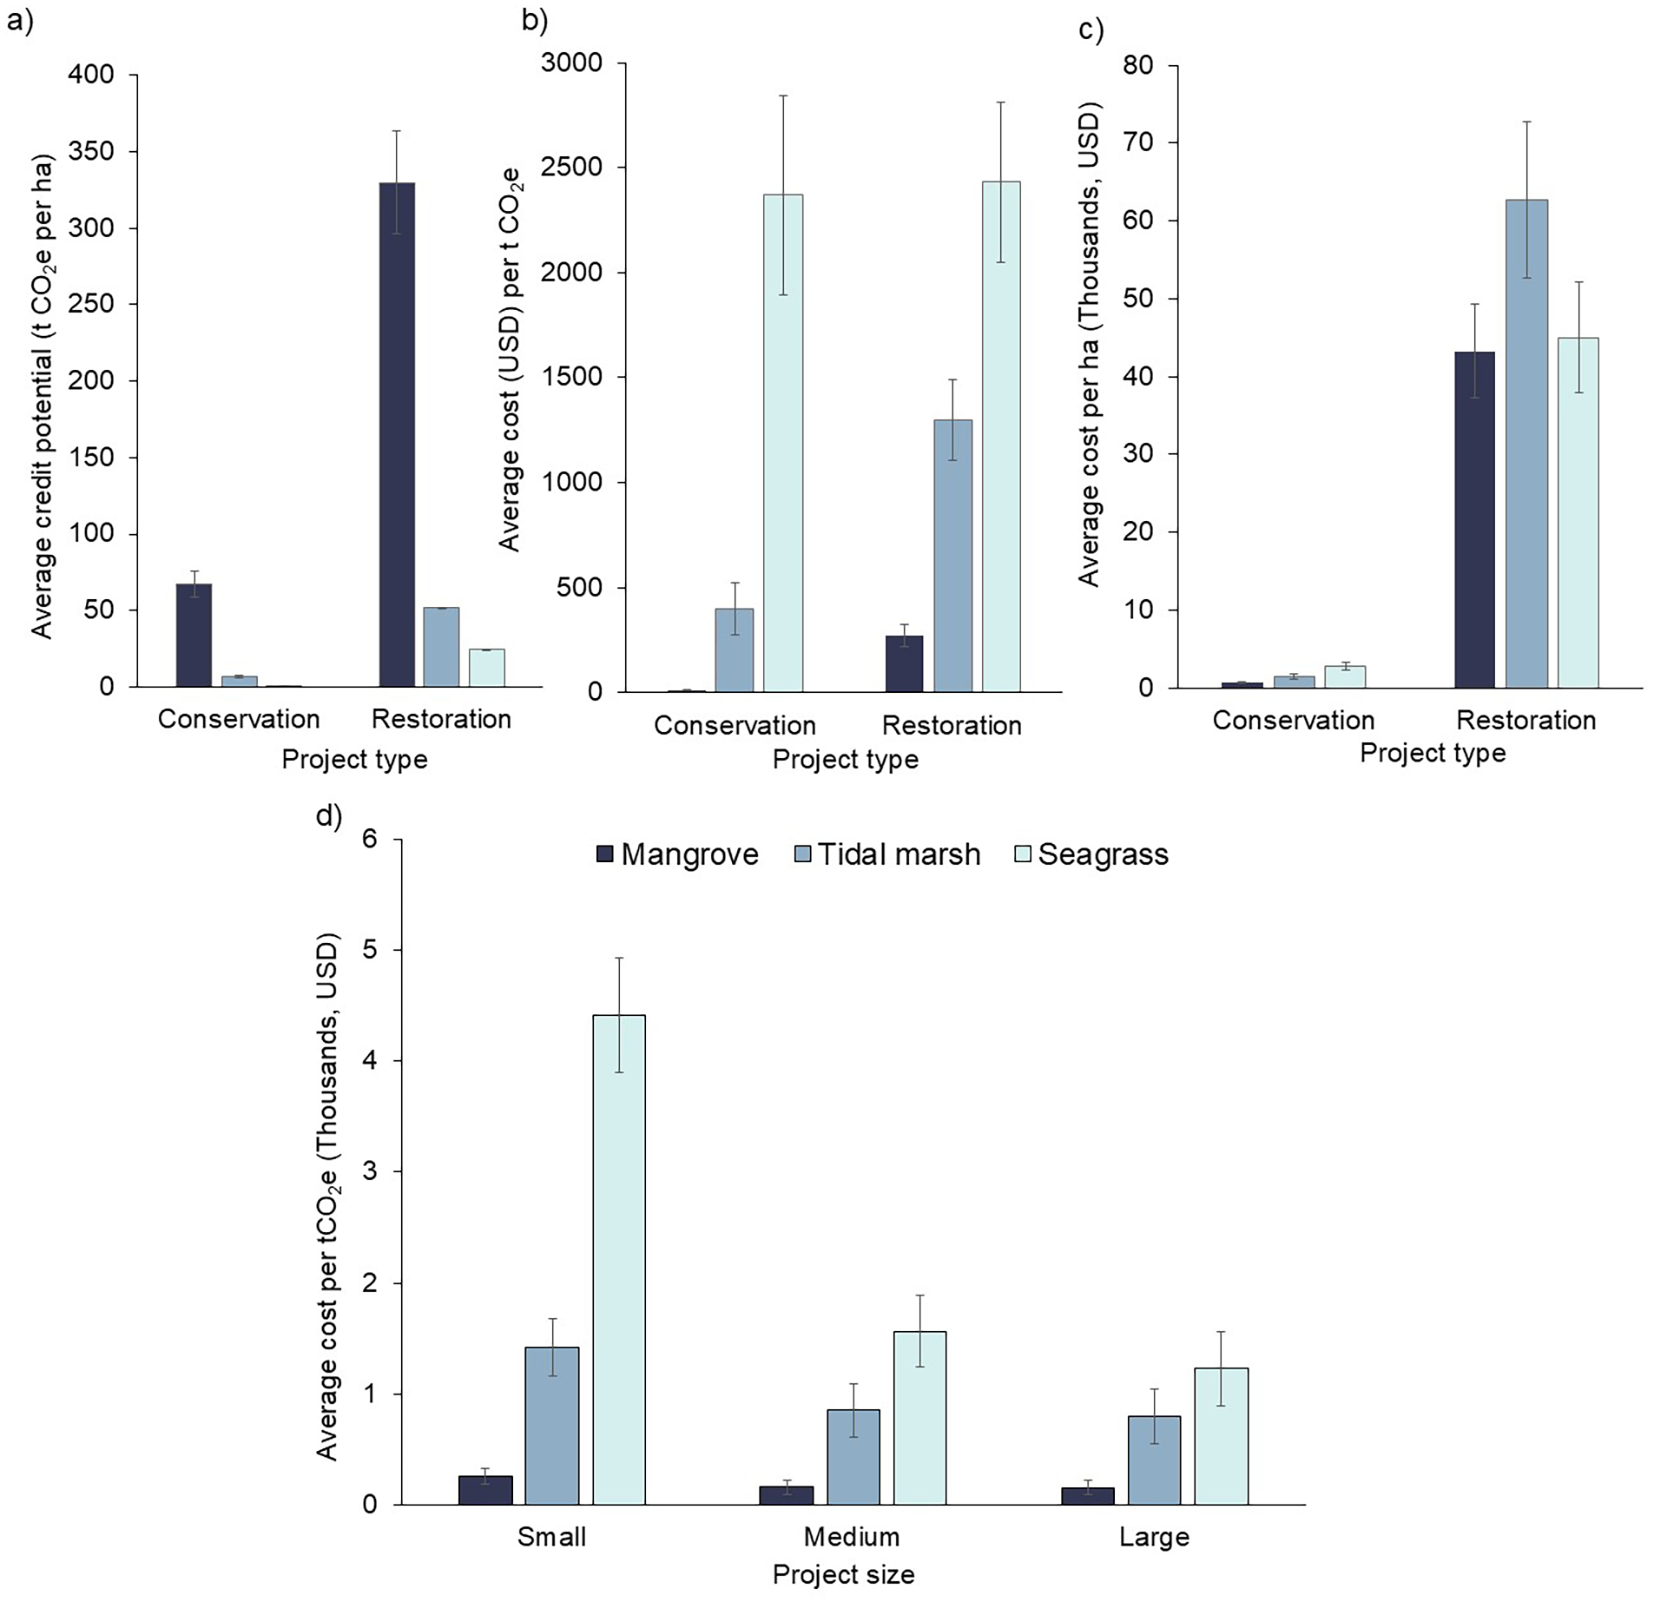
Economic metrics for conservation and restoration (revegetation, hybrid, and hydrology) activities for the three blue carbon ecosystems (mangroves, tidal marshes, and seagrasses), assuming a default project length of 20 years (A) Average credit potential (measured as tCO2e per ha) and standard errors across all project size classes (small, medium, large; see Table 1 for class sizes). Note: Very low carbon credit potential for seagrass conservation may be due to data limitations and uncertainties (B) Average cost (NPV in USD) per credit (measure as tCO2e) and associated standard error across all project size classes (small, medium, large). (C) Average cost per hectare (NPV in USD). Additionally, due to no applicable hydrology activities in seagrass ecosystems, average costs for restoration are lower than tidal marshes. (D) Average cost (NPV in USD) per credit (measured as tCO2e) by scale for the three project size classes (small, medium, and large). (landowner/community benefit share is a percentage of credit revenue, which is based on a market price of $30/tCO2e).
Average costs per hectare were much lower for conservation activities than restoration activities, across all ecosystems (Figure 7C). Across both conservation and restoration projects, costs (presented as NPV) ranged from a low of $90/ha for mangroves up to $297,000/ha for tidal marshes. For conservation activities, mangroves had the lowest costs (mean = $420/ha, median=$290/ha), followed by tidal marshes (mean = $1,388/ha, median=$528/ha), then seagrasses (mean = $2,750/ha, median=$1,000/ha). For restoration activities, costs were much higher, with mangroves remaining the lowest cost ecosystem (mean=$45,900/ha, median=$29,200/ha). On the contrary, for restoration activities, tidal marshes had the highest costs (mean=$67,400/ha, median=$34,800/ha), with mean restoration costs in seagrass ecosystems (mean=$59,700/ha, median= $48,700/ha) falling between those for mangroves and tidal marshes.
Cost was also highly dependent on project scale, with a larger reduction in costs when scaling from small- to medium-sized projects, than when scaling from medium- to large-sized projects (Figure 7D; for project size definitions, see Table 1).
Across all focal countries, conservation or restoration activities in mangrove ecosystems required the lowest investments per tCO2e (Figure 8, see Supplementary Figure S2 for inset for more detailed breakdown of those ecosystems and geographies requiring the lowest investments). Generally, activities in seagrass ecosystems had the highest investment requirements per tCO2e, except for in China where tidal marsh costs per tCO2e were the highest. For each ecosystem, Kenya, Indonesia, and Colombia had some of the lowest investment requirements per tCO2e.
Figure 8
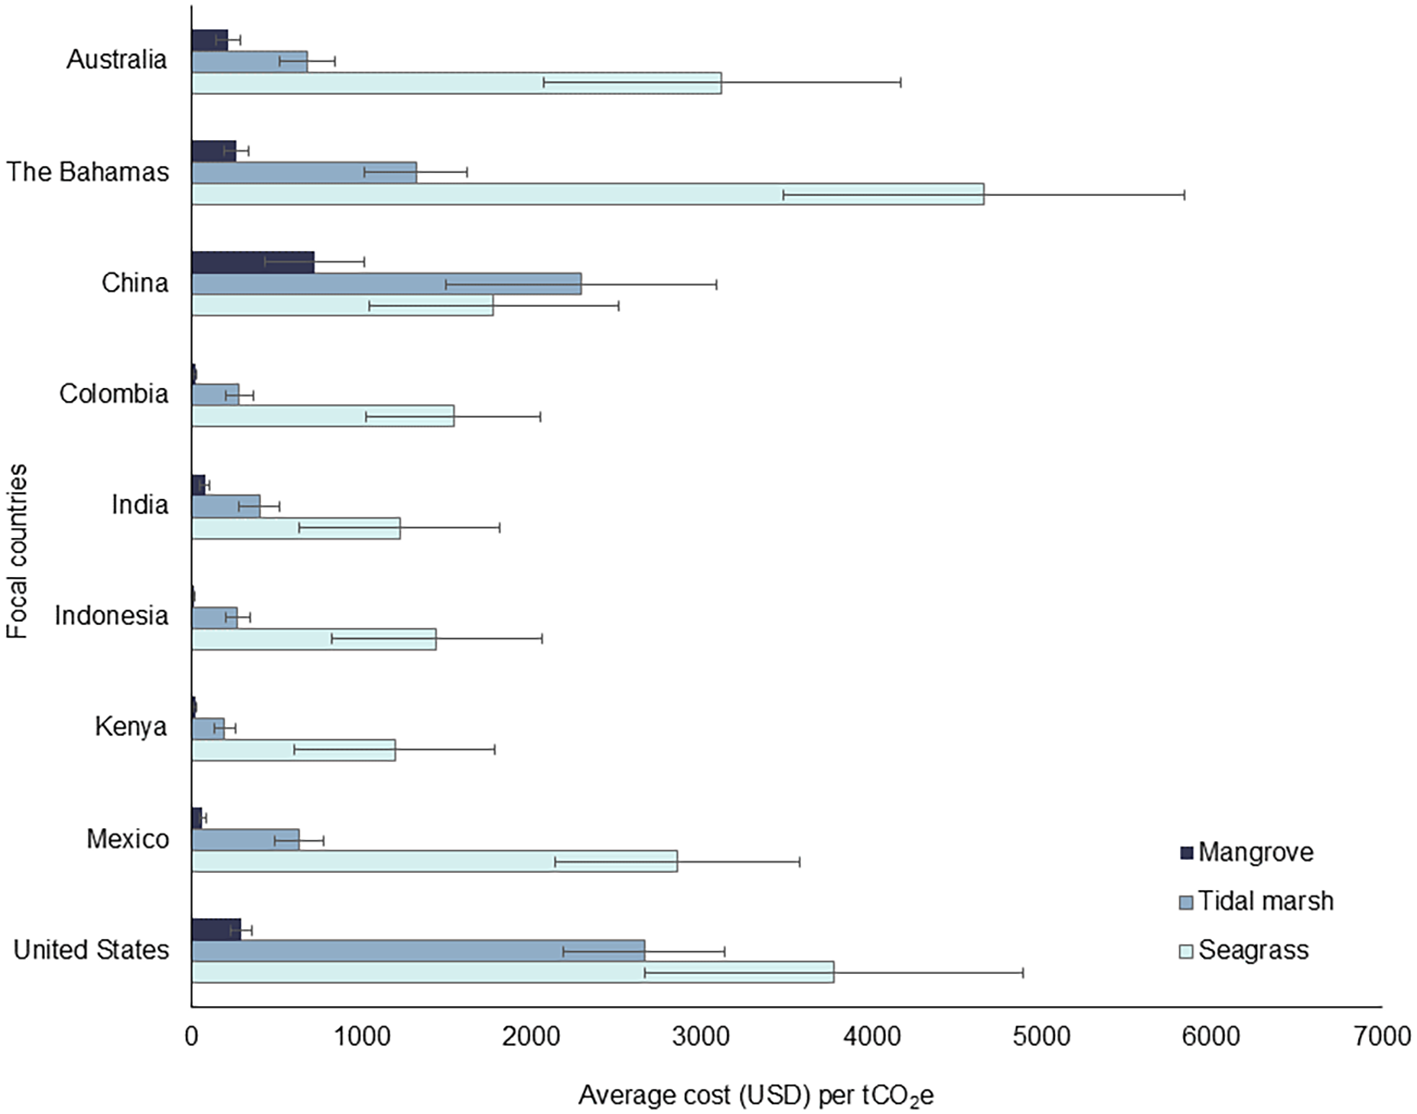
Average cost (USD, NPV) per credit (measure as tCO2e) and associated standard errors by country and blue carbon ecosystem (mangroves, tidal marshes, or seagrasses) across all scenario combinations of project sizes (small, medium, large) and activity types, assuming a default project length of 20 years. (Note: landowner/community benefit share, as a component of OPEX, is a percentage of credit revenue, which is based on a market price of $30/tCO2e).
Results show geographical variability regarding when carbon revenues were enough to cover cost and whether additional landowner/community benefit sharing was achieved (Figure 9).
Figure 9
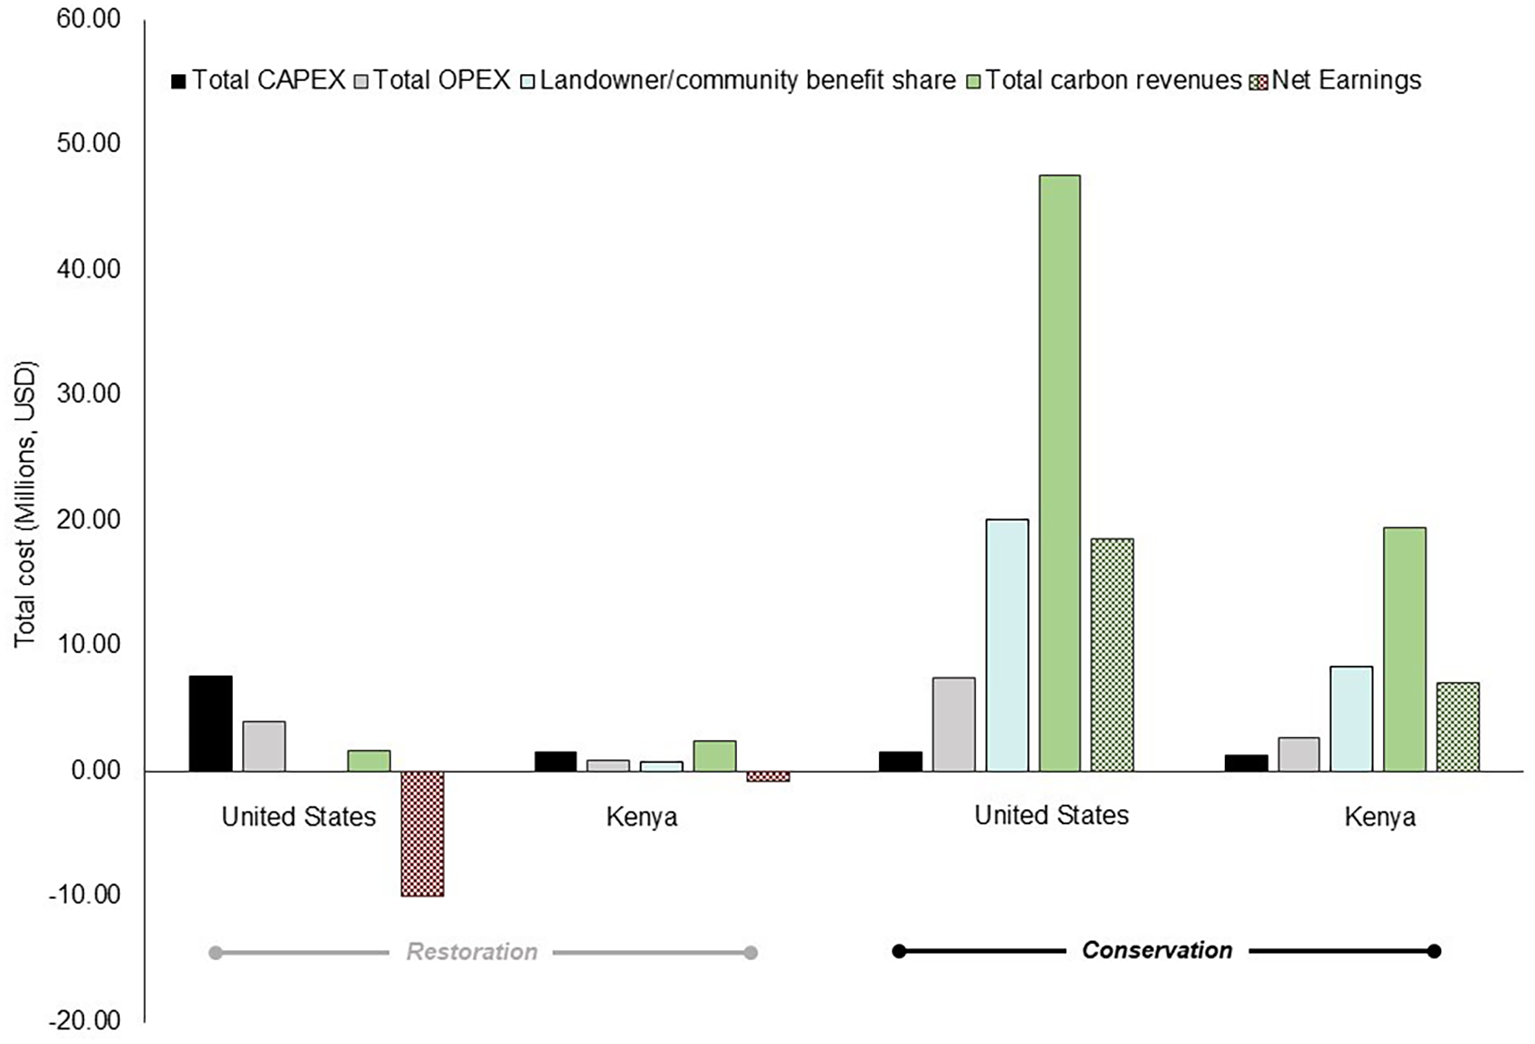
Capital expenditures, CAPEX (black), operating expenditures, OPEX (grey), landowner/community benefit share (blue), carbon revenues (green), and net earnings (USD, NPV; hashed green or red) for a medium-sized hypothetical project activity (500 ha for restoration and 20,000 ha for conservation) in mangrove ecosystems for two of the focal countries, the United States and Kenya, assuming a project length of 20 years. Note: Landowner/community benefit share shown is included only when project revenues exceed OPEX.
Only 12% of simulated projects were able to entirely offset total project costs (CAPEX and OPEX) by leveraging carbon revenues at the market rate of $30/tCO2e (Figure 10, see Supplementary Figure S3 for project cost coverage at alternate market prices). All 12% were mangrove projects and among these, 80% were conservation projects. Approximately 24% of simulated projects covered their OPEX costs through carbon revenues at the market rate of $30/tCO2e. Here again, the majority (87%) were mangrove projects, of which approximately 56% were conservation projects.
Figure 10
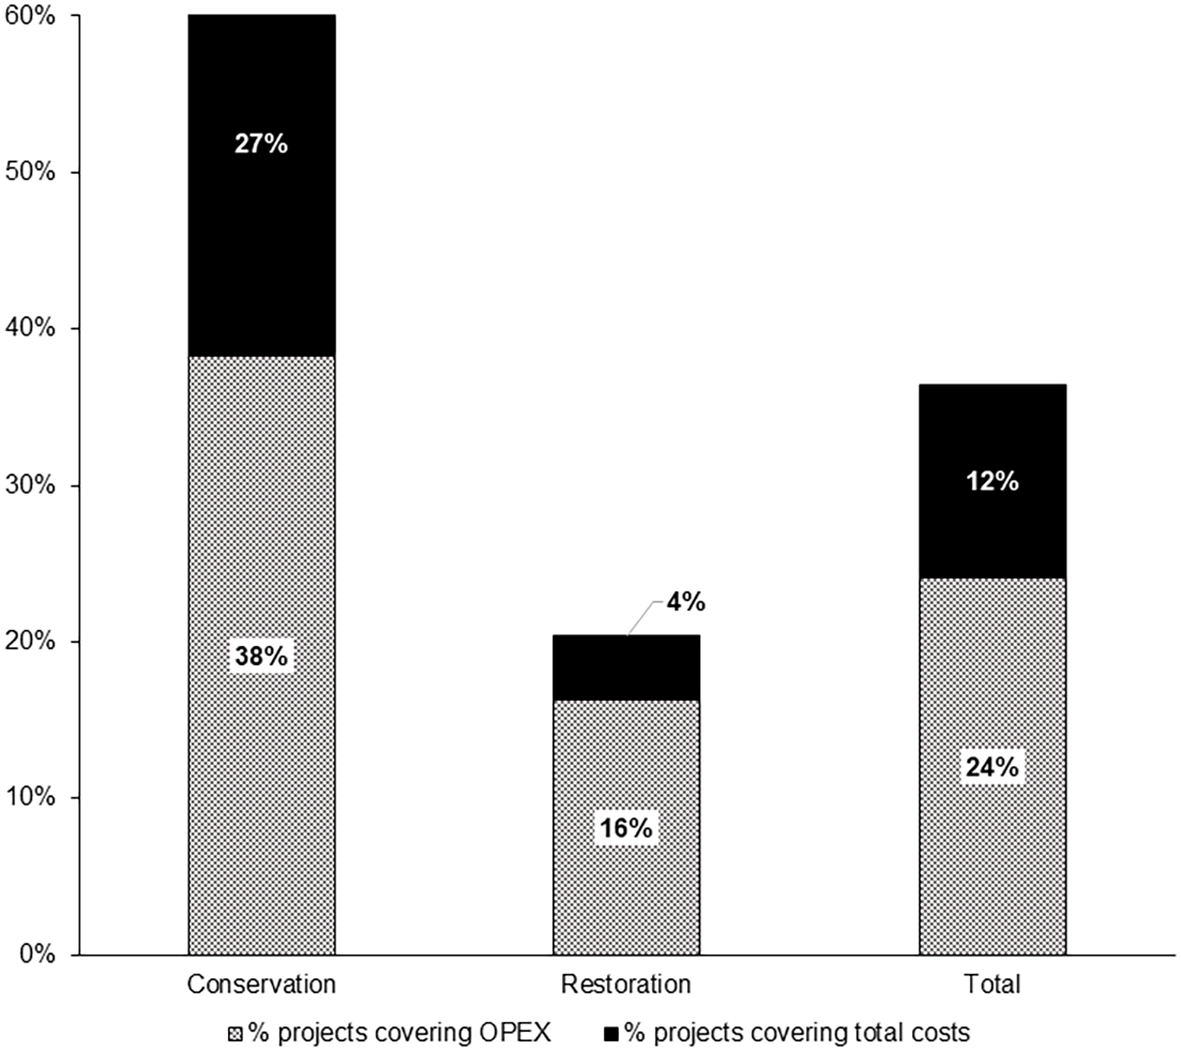
Percent of simulated projects that can cover OPEX and total costs for conservation, restoration, and all projects combined, at a market price of $30/tCO2e.
4 Discussion
The BCCT was developed to quantitatively assess the financial feasibility of diverse blue carbon market projects, enhance transparency in cost and revenue estimates, and support the prioritization of high-impact climate projects in the market. These results can be used by a diverse set of stakeholders, including potential project developers and investors at the early stage of market project consideration (often referred to as the feasibility phase). Scenarios run by using the tool highlight the variability in outcomes across geographies, ecosystems, and project types but show that in most cases, current typical carbon market prices (e.g., $30/tCO2e) will not cover total project costs. In tandem with other best practices, the BCCT can be used to prioritize implementation of high-quality blue carbon market projects and adjust expectations on investment, credit pricing and revenue potential. Though the current results are limited by national and local data availability, this model can help to prioritize where to focus blue carbon efforts globally and support expectations for project development cost and carbon revenues.
The modelled analysis of over 400 project scenarios showed a large range of costs and returns across geographies, ecosystems, and project activities. The significant cost range across these factors resulted in a substantial disparity between median and mean values, with the median values much lower. Some costs vary little between conservation and restoration projects, like MRV and validation activities, because these tend to be per project costs and aren’t as dependent on the activity type or scale (and largely only vary based on socio-economic characteristics of the geography in which the project is located). Other costs vary substantially, likely driven by other factors like different socio-economic, environmental, and governance situations. For example, variation in biophysical context between the three blue carbon ecosystems can drive a wide range of implementation costs, with higher implementation costs frequently associated with subtidal environments (e.g., seagrasses), due to access challenges and the need for sophisticated equipment and resources like boats and snorkel/scuba equipment. This was evidenced in our results, which showed that compared to mangroves and tidal marsh projects, seagrass projects were more expensive. Similar results have been found in cost-benefit-analysis studies (Stewart-Sinclair et al., 2021). Restoration activities, in general, were more expensive than conservation activities and had a wider cost range overall. Costs also varied across the different restoration activity sub-types, with revegetation being the least expensive (mean = $46,123/ha) and hybrid activities being the most expensive ($93,500/ha). Generally, a holistic approach to restoration is recommended, one that seeks to return natural hydrologic regimes to the system. While restoration projects that address hydrologic and/or sediment impairments to degraded or converted systems involve activities that are more costly than revegetation alone, they have a higher likelihood of success than revegetation alone (which frequently doesn’t resolve the root cause of degradation; Saunders et al., 2024). These complexities (and subsequent increased costs) associated with both the ecosystem characteristics themselves, and the restoration activities required for long-term project success, highlight the need to think innovatively about leveraging potential emergent technologies for activities in subtidal ecosystems and for restoration approaches in general, to lower barriers for implementation and scaling.
Project simulations showed restoration projects cost more per credit (measured in tCO2e) than conservation projects. Restoration costs are primarily driven by implementation cost (a component of CAPEX). This is to be expected as wetland restoration projects often involve hydrological and/or sediment modifications which can involve heavy machinery and mitigating impacts to existing infrastructure. Conversely, conservation projects incur a higher portion of cost from maintenance and enforcement costs (components of OPEX). Some conservation costs, such as alternative livelihoods, may not be fully covered in the model but are partially included under landowner/community benefit share in the BCCT. Despite higher cost per credit, restoration (removal) projects are in greater demand due to perceived reputational risks associated with conservation (avoided loss) projects (Forest Trends’ Ecosystem Marketplace, 2024). These risks stem from challenges in meeting carbon standard requirements for additionality, demonstrating the necessity and urgency of the project (Pan et al., 2022).
Even though restoration projects generally cost more, simulation results show they also have much higher credit potential per hectare than conservation projects. For conservation projects, credit potential is heavily influenced by the country’s loss rates, which in turn, impact the area within a project boundary that is creditable. However loss rates are not necessarily adequate to establish project additionality, which is a key market requirement. Another influencing factor is the way project boundaries are conceptualized in practice. In conservation efforts, larger areas are often considered, while in reality, only a smaller portion of these areas are at significant risk of conversion. Conversely, restoration projects tend to focus on specific areas that have already been degraded, leading to a more narrow (and often smaller) defined project area, and thus resulting in higher credit generation per hectare. This highlights a fundamental difference in how conservation and restoration projects are typically conceptualized in terms of scale and impact.
Results show varying cost differences across geographies. This is likely driven by socio-economic differences between the focal geographies. Geography and socio-economic characteristics can influence (a) implementation costs, which are more expensive where wages are higher and/or where locations are more remote; and (b) scale, where certain geographies tend to have greater opportunities (due to high loss rates, for example), resulting in the potential for larger projects, which are generally more cost-efficient (Canning et al., 2021). However, scale has some limitations, particularly as size can lead to higher capital requirements or heightened complexity (Pan et al., 2022; Perera et al., 2024). Hence, developers must evaluate these trade-offs to determine the optimal project size. A substantial set of carbon project development costs are fixed at the project-level (e.g., feasibility analysis, project validation and verification) or increase slightly when projects scale up (e.g., conservation planning and administration, long-term project operating), creating savings per unit area for larger projects (Bayraktarov et al., 2020). Recognizing this cost efficiency, some project developers have been able to leverage jurisdictional approaches (the grouping of similar projects under one blue carbon project) to enhance the likelihood of their blue carbon market project success (e.g. Blue Heart Sunshine Coast Blue Carbon Pilot Project, Project ID ERF188599).
A common theme that recurred during the expert consultations and interviews was the importance of community engagement and buy-in throughout project development for long-term project success. This echoes the message presented at international forums such as the United Nations Conventions. It is also provided by guidance such as the High-Quality Blue Carbon Principles and Guidance report (Beeston et al., 2024). It takes time to develop high-quality projects that have long-term/sustainable impact on ecosystems and community wellbeing (Kenny et al., 2023). Our model attempts to integrate community engagement-related expenditures through community representation and liaison in CAPEX. While community participation in implementation can be captured under the monitoring cost component, there was a need for a separate cost component to include benefit sharing. This benefit sharing component was split into two parts: 1) under OPEX as 10% of revenue, and 2) as a separate component which equals 50% of revenue only once OPEX have been covered. These are default percentages and can be modified by users of the tool on a case-by-case basis, in consultation with the communities involved. With the approach implemented in the model, the community would conceivably benefit from the project as an operational cost, and the community benefit can increase if the project is successful. Because the BCCT assigns the benefit share as percentages of revenue, these payments would vary depending on the carbon credit price used (Figure 9); thus, the portion of the benefit share that is included as an OPEX cost component influences the total cost. Having the majority of benefit share increase only after OPEX are met helps to ensure downside protection of long-term project costs, such as project maintenance and monitoring. Ideally, projects are community-led in design and implementation, supporting community priorities, and honoring the right of self-determination, which fosters community rights and enhances transparency, accountability, and sustainability (Beeston et al., 2024).
Investing in local blue carbon science is a key factor in building the enabling conditions for blue carbon market projects. Our results show that the use of either country-level data or global values can produce large differences in credit potential (Figure 6). If we assume that higher-resolution and locally-relevant data serve as more accurate inputs for the model (however, this is not always the case), using global data may over- or under-estimate credit potential. We demonstrate this with an example from The Bahamas and Indonesia, where national values are available to compare with global values. From an ecomorphological context, The Bahamas have a low diversity (with three species of true mangroves dominant; Buchan, 2000) of smaller, more scrub- and dwarf-type mangroves with shallower soil depth (Barreto et al., 2015), compared to Indonesian mangrove forests which are very diverse (having a reported 52 different species of true mangroves; Suhardi et al., 2024), with mangroves that can reach canopy heights comparable to the adjacent lowland rainforests, and soil depths that can be a meter or greater (Murdiyarso et al., 2015). Using a global average default value to estimate credit potential in these two geographies may then overestimate credit potential in The Bahamas and underestimate credit potential in Indonesia. These results would challenge the appropriateness of using global data, as allowed by some carbon methodologies (e.g., VM0033 under VCS and PM001 under PV Climate), especially since carbon standards favor conservative accounting methodologies. It also highlights that due to the high variability of ecosystem characteristics across geographies, robust locally-relevant data really is key to reducing uncertainties in carbon market potential.
Overall, our study highlights the limited blue carbon data available across geographies. While global default values can facilitate market access in data-limited geographies, there is an urgent need for the collection and analysis of local data to more accurately assess and monitor carbon sequestration and storage potential, leading to more reliable estimation of carbon credits (Stewart-Sinclair et al., 2024; Ewane et al., 2025). This initial investment in local science not only optimizes market project outcomes but also provides multiple benefits by: reducing implementation barriers for future projects, providing local job and capacity building opportunities, and facilitating the integration of blue carbon habitats into broader climate policy mechanisms (e.g. national greenhouse gas inventories and Nationally Determined Contributions in compliance with the Framework Convention on Climate Change and the Paris Agreement.). By providing robust, localized scientific evidence, these projects can influence policy decisions, ensuring that blue carbon ecosystems are recognized and protected within environmental regulations and climate strategies.
Modelled outputs indicated that carbon finance at current average prices will not be enough to cover total or operational costs of most blue carbon market projects, indicating a need for higher price tolerance or more upfront capital. While a goal of carbon revenues is to help support projects long-term, only 12% of projects modelled were able to recover full project costs at a $30 per/tCO2e market price. Notably, the simulated projects that were financially viable at this price were all mangrove initiatives and 80% of them were conservation projects. Although this study utilized a market price of $30 per ton, there is a compelling case for negotiating higher prices for blue carbon projects to more adequately cover project costs. The modelled averages of cost per tCO2e can depict a more realistic range for pricing blue carbon projects: $12-270/ton for mangrove projects, $400-1,300/ton for tidal marsh projects, and $2,400/ton for seagrass projects, while exact costs will depend on country, ecosystem type, project scale, and availability of data. If higher prices cannot be met, then other sources of capital are required, such as pre-purchase agreements, grants, or concessionary capital.
Project developers can also explore approaches to reduce overall project cost through enhancing enabling conditions (e.g., project planning and design, data collection, community engagement, etc.) and supporting project scaling (e.g., from small to medium project size), thereby reducing the per-unit-area cost (Figure 7C). Investment funding for enabling conditions can have benefits beyond the initial project by decreasing the barriers to entry and allowing some pre-development and maintenance costs to be reduced. For example, building up regional blue carbon data and models (Macreadie et al., 2019, 2021; Dahl et al., 2025), investing in remote-sensing technologies (Malerba et al., 2023), and clarifying jurisdictional land tenure and carbon rights (Unruh, 2008 and Corbera et al., 2011), would increase the cost-effectiveness of developing blue carbon projects for the VCM.
Furthermore, as regulated markets emerge—typically setting higher prices— and blue carbon methodologies are adopted into these regulated markets, this could enhance the market feasibility of such projects. The Australia Carbon Credit Unit (ACCU) Scheme is one of the few national markets that currently includes opportunity for blue carbon project development. Another influencing factor for future financial feasibility is the profitability of the land use sector and the corresponding foregone revenue from habitat restoration. For example, a cost-benefit analysis from northern Queensland in Australia found that tidal restoration of low-lying sugarcane land to mangrove and tidal marsh would be profitable using ACCU prices of AU$13.85 per tCO2e (USD$8.86 per tCO2e), but only with high estimates of avoided emissions and low restoration costs (Hagger et al., 2022). Another study examining three large coastal catchments in Australia revealed that two of these regions had 60% and 92% of the potential restoration area profitable at an ACCU price of AU$57 per tCO2e (USD$36 per tCO2e), assuming low restoration costs primarily involving hydrological modifications of drains and bunds. However, with higher restoration costs and higher farm gross margin returns for beef production, none of the sites were profitable (Hagger et al., 2024). These findings underscore the critical balance between project costs and market prices in determining the financial feasibility of blue carbon projects.
Currently, climate mitigation benefits stand out as one of the most extensively monetized ecosystem services associated with BCEs (Bertram et al., 2021). However other innovative finance mechanisms are being explored, including mangrove insurance, biodiversity credits, and coastal resilience credits (Ring et al., 2023). Practitioners are optimistic that further research and investments to monetize other ecosystem services (sometimes referred to as co-benefits) would be beneficial for blue carbon projects. Considering a comprehensive list of ecosystem services beyond carbon sequestration in BCEs, which are often not quantified or monetized due to the lack of standardized accounting tools or methods, could increase the net return from those projects (Lau, 2013) and improve the financial feasibility of blue carbon projects when considering more than just carbon credits alone. Additionally, developing methods to understand and communicate other community benefits without the need for monetizing, particularly for those benefits of BCEs related to cultural heritage, spirituality, or sense of place (e.g., Smart et al., 2021), could also enhance demand or desirability of blue carbon projects in ways that don’t require specific accounting methods or tools.
4.1 Limitations and future research
Currently, the BCCT relies on limited cost data and expert assumptions but provides a framework for data expansion. First, more country-level data across project activities and geographies would increase accuracy and scope of projections beyond the nine countries currently included. Local or project-specific data would enhance accuracy and reduce uncertainty for carbon and financial estimates. The wide cost ranges observed, driven by limited data, reduce the accuracy of comparisons across geographies and ecosystems. As more localized cost data are integrated, we expect the accuracy of the modeled scenarios and the reliability of the average cost per ton estimates to improve. The tool also serves as a database where users, if they choose, can upload and store their own locally-relevant cost data, which provides a systematic approach for recording and reporting these types of data, increasing standardization, comparability, accuracy, and overall utility for investment decisions.
Second, only CO2 fluxes were included due to data limitations and model complexity. Future model iterations could include additional GHGs such as methane and nitrous oxide. This limitation is particularly relevant for tidal marsh ecosystems, where methane fluxes can be highly variable (e.g., low-salinity environments) and may offset CO2 sequestration. As a result, the estimated GHG benefits and credit potential may be under or over estimated. Site-specific characteristics like allochthonous carbon contributions and sea-level rise were also not explicitly accounted for in the model, although they are indirectly accounted for in the modeled scenarios via the buffer parameter. However, users exploring project-specific scenarios, can account for other GHG emissions as well as allochthonous carbon and sea-level rise deductions by adjusting the default parameters in the tool, if they have the site-specific data to do so. Accounting for sea-level rise and allochthonous carbon, along with including non-CO2 GHGs, especially in scenarios where these impacts may be substantial, would further increase accuracy of the total abatement potential and revenue estimates.
While we attempted to be inclusive of cost components for developing blue carbon projects for the VCM, some costs are difficult to incorporate and may not be represented in the BCCT (e.g. costs incurred beyond the project boundary or identified timeframe). Opportunity costs (e.g., lost agricultural revenue) and land-purchase costs were not included in this analysis, both of which have the potential to further increase project costs. The exclusion of these costs likely results in an underestimation of total project cost and overestimation of financial feasibility in certain contexts, especially where land values are high or opportunity costs are significant. The BCCT also does not currently account for inflation or other cost increases, apart from a default yearly carbon price increase of 1.5%. Including these factors in future iterations would further enhance the accuracy of cost estimations. Data availability limitations also made it impossible to account for uncertainties across all input parameters. Collectively, these limitations highlight the need to invest in local and project-specific data collection and encourage the sharing of data. This is especially true for blue carbon data in seagrass and tidal marsh ecosystems, which have been less studied in comparison to mangroves (Macreadie et al., 2019; Howard et al., 2023; Stankovic et al., 2023).
While evaluating cost data, this study identified a notable shortage of relevant restoration cost data for blue carbon projects. While some published sources (e.g. Bayraktarov et al., 2016; Bayraktarov et al., 2020) cite “total restoration cost” data, detailed costs for specific project activities are missing, making it challenging to robustly estimate the cost-benefit outcomes of these projects. To make the tool scalable at the appropriate temporal and spatial resolution, it is crucial to standardize data collection for blue carbon projects. Such comprehensive and standardized collection is increasingly being encouraged, for example through the Mangrove Restoration Tracker Tool (Gatt et al., 2024). The BCCT tool can also now serve as a framework for standardized data collection efforts, not only for total costs associated with blue carbon projects, but also for those relevant cost components that we found vary significantly across geographies, ecosystems, and project activities.
While the BCCT separates projects into categories by ecosystem and activity type, some projects may include multiple ecosystem types and a combination of restoration and conservation activities. This level of project complexity is not currently represented in the BCCT but would likely have additional implications for both project cost and climate mitigation benefits.
Finally, we acknowledge that beyond cost and data limitations, several other challenges impede the development of blue carbon market projects. These include issues of additionality, permanence, land tenure and property rights, and the risk of double-counting (Macreadie et al., 2022; Pan et al., 2022), which are exacerbated by scientific and policy uncertainties. Despite these risks, there is a significant and growing demand for market-ready and high-quality blue carbon credits. This work, along with future refinements, aims to enhance data availability and reporting, and underscores the necessity for higher price tolerance to support the development of blue carbon market projects, thereby addressing market demand and community needs.
The BCCT establishes a foundation for standardizing blue carbon market data collection (particularly for restoration and conservation costs) and for evaluating cost-benefit ratios for blue carbon market projects. As adoption grows, we have outlined a roadmap centered on user-driven refinements to maintain the tool’s relevance over time. Key features include the ability for users to voluntarily contribute cost data, which, after a thorough review by tool administrators can be used to update default values and address critical data gaps. As the database expands, the tool will incorporate uncertainty analyses across all cost and ecosystem components. While a sensitivity analysis is already available on the online tool to help users assess the impact of key parameters, additional data will improve its accuracy. User input will also help to identify additional cost categories that may be currently missing from the tool. By explicitly incorporating cost components such as opportunity costs or foregone agricultural revenue, the tool will offer a more complete picture of the total investment required for a project. While users can currently include these costs in other cost components, having them as explicit categories in the tool will ultimately enhance cost reporting. Lastly, the roadmap considers explicit accounting for non-CO2 GHGs (e.g. CH4 and N2O). While users can input these through the custom project feature if local data is available, fully integrating multi-gas accounting would require significant model updates and scientific advancements to support geographically relevant default values.
4.2 Conclusion
Developing blue carbon projects for the VCM requires coordinated stakeholder support with a role for communities, developers, governments, buyers, and philanthropy to work together to support the growth of this critical nature-based climate solution (Merk et al., 2022). As the opportunity for blue carbon projects to be effective climate-mitigation strategies grows, it is essential to develop a comprehensive understanding of the costs involved. The BCCT can serve as a database and decision-support tool to advance data uptake in a standardized manner and set cost/benefit and pricing expectations for blue carbon project investment. By bridging knowledge gaps and providing data visualizations via efforts like the BCCT, the barriers for developing successful blue carbon market projects that deliver high impact for habitats, communities, and climate change can be greatly reduced.
Statements
Data availability statement
The original contributions presented in the study are included in the article/Supplementary Material. Information specific to the expert consultation process can be found in the Supplementary Material Tables S1-S2. The Blue Carbon Cost Tool web platform can be found at: http://bcct.naturebase.org/. The underling code for the platform can be found in the following GitHub repository: https://github.com/Vizzuality/tnc-blue-carbon-cost-tool. Further inquires can be directed to the corresponding author/s.
Author contributions
SS: Methodology, Supervision, Writing – original draft, Project administration, Formal Analysis, Writing – review & editing, Visualization, Investigation, Validation, Conceptualization. LS: Software, Writing – review & editing, Investigation, Data curation, Methodology, Validation, Writing – original draft, Visualization, Formal Analysis, Conceptualization. EL: Funding acquisition, Writing – review & editing, Writing – original draft, Supervision, Conceptualization. SL: Visualization, Investigation, Writing – review & editing, Formal Analysis, Writing – original draft. AK: Visualization, Investigation, Data curation, Writing – review & editing, Validation, Formal Analysis. OA: Writing – review & editing, Data curation. MB: Writing – review & editing. CL: Writing – review & editing, Data curation. RIM: Data curation, Writing – review & editing, Methodology. RPM: Writing – review & editing. TW: Writing – review & editing, Data curation. TM: Writing – review & editing, Data curation. PS-S: Writing – review & editing. MS: Writing – review & editing.
Funding
The author(s) declare financial support was received for the research and/or publication of this article. Funding was provided by Builders Vision. The funder was not involved in the study design, collection, analysis, interpretation of data, the writing of this article, or the decision to submit it for publication.
Acknowledgments
Our work was only made possible through the generous contributions of data, guidance, and feedback from our blue carbon partners. A special thanks to Sam Israelit, David Lipman, Anna Geyler and Doris Mbabu, from Bain and Company, for their exceptional contributions, which were instrumental to the development of this tool and manuscript. We would also like to express our heartfelt thanks to individuals from the following organizations for their assistance: Blue Ventures, Conservation International, IUCN, Salesforce, Silvestrum Climate Associates, TerraCarbon and Wetlands International.
Conflict of interest
Author RPM was employed by the company TerraCarbon LLC.
The handling editor RR declared a past co-authorship with the author TW.
The remaining authors declare that the research was conducted in the absence of any commercial or financial relationships that could be construed as a potential conflict of interest.
Generative AI statement
The author(s) declare that Generative AI was used in the creation of this manuscript. During the preparation of this work the author(s) used Microsoft CoPilot in order draft some writing sections. After using this tool, the author(s) reviewed and edited the content as needed and take full responsibility for the content of the published article.
Any alternative text (alt text) provided alongside figures in this article has been generated by Frontiers with the support of artificial intelligence and reasonable efforts have been made to ensure accuracy, including review by the authors wherever possible. If you identify any issues, please contact us.
Publisher’s note
All claims expressed in this article are solely those of the authors and do not necessarily represent those of their affiliated organizations, or those of the publisher, the editors and the reviewers. Any product that may be evaluated in this article, or claim that may be made by its manufacturer, is not guaranteed or endorsed by the publisher.
Supplementary material
The Supplementary Material for this article can be found online at: https://www.frontiersin.org/articles/10.3389/fmars.2025.1622255/full#supplementary-material
Glossary
- Abatement potential
The technical capacity of a project or activity to reduce greenhouse gas emissions or mitigate their impact
- Blue carbon
Refers to the carbon captured and stored by ocean and coastal ecosystems, which in this work is restricted to mangroves, salt marshes, and seagrasses
- Carbon credit potential
The capacity of a project or activity to reduce greenhouse gas emissions or mitigate their impact, which follows carbon accounting standards, including a deduction applied to account for reversal risk and other project-level uncertainties
- Carbon sequestration (rate)
The process of capturing and storing carbon dioxide from the atmosphere, typically through natural or artificial means
- Discount rate
The rate used to adjust future cash flows to their present value (NPV), taking into account the time value of money and investment risk
- Ecosystem loss rate
The rate at which ecosystems are being degraded, destroyed, or converted to non-ecosystem uses due to human activities, measured as a percentage or area of loss over time
- Emission factor
A coefficient that quantifies the emissions or removals of a gas per unit activity. Emission factors are often based on a sample of measurement data, averaged to develop a representative rate of emission for a given activity level under a given set of operating conditions.
- Feasibility study
An assessment conducted to evaluate the viability and potential success of a project or initiative, considering various factors such as technical, economic, and legal aspects
- GHG
Greenhouse Gas emissions, which are gases that contribute to the greenhouse effect and global warming, such as carbon dioxide (CO2), methane (CH4), and nitrous oxide (N2O)
- Intergovernmental Panel on Climate Change (IPCC)
A scientific body established by the United Nations to provide objective and comprehensive information on climate change, its impacts, and potential solutions.
- Mangrove
A salt-tolerant coastal tree or shrub species that grows in tropical to warm temperate regions, known for its ability to capture and store large amounts of carbon in its soils and biomass
- Non-permanence
Non-permanence refers to the risk that the project activity fails and carbon that has been stored in vegetation and soils is released back into the atmosphere
- NPV
Net Present Value, a financial indicator used to assess the profitability and economic viability of an investment or project, considering the time value of money
- Revegetation success
The rate or percentage of successfully established vegetation or trees in a reforestation or afforestation project
- Seagrass
Flowering plants that grow in shallow coastal waters, typically forming extensive beds or meadows, known for their ability to sequester carbon and provide important ecosystem services
- Tidal marsh
A type of coastal wetland ecosystem that is influenced by tides, characterized by the presence of grasses, reeds, and herbs. Most occur in saline to brackish water (saltmarsh) however in some estuarine locations they may be largely freshwater
- Verified Carbon Standard (VCS)
A leading greenhouse has crediting program, administered by Verra
- Verra
A not-for-profit organization that develops and manages standards for climate action and sustainable development, including the Verified Carbon Standard (VCS)
- Voluntary Carbon Market
A marketplace where private actors voluntarily buy and sell carbon credits representing emissions reductions or removals, enabling companies and individuals to offset their emissions and support climate projects
References
1
Adame M. F. Connolly R. M. Turschwell M. P. Lovelock C. E. Fatoyinbo T. Lagomasino D. et al . (2021). Future carbon emissions from global mangrove forest loss. Global Change Biol.27, 2856–2866. doi: 10.1111/gcb.15571
2
Agardy T. Bennett G. (Eds.) (2024). “ State of the Blue Carbon Market: An ocean of potential,” in Ecosystem marketplace, A forest trends initiative (Washington DC: Forest Trends Association). Available online at: https://www.ecosystemmarketplace.com/wp-content/uploads/2024/10/StateoftheBlueCarbonMarketFINAL-with-box.pdf.
3
Allan H. Levin N. Kark S. (2023). Quantifying and mapping the human footprint across Earth's coastal areas. Ocean Coast. Manage.236, 106476. doi: 10.1016/j.ocecoaman.2023.106476
4
Azman M. S. Sharma S. Shaharudin M. A. M. Hamzah M. L. Adibah S. N. Zakaria R. M. et al . (2021). Stand structure, biomass and dynamics of naturally regenerated and restored mangroves in Malaysia. For. Ecol. Manage.482, 118852. doi: 10.1016/j.foreco.2020.118852
5
Barbier E. B. Hacker S. D. Kennedy C. Koch E. W. Stier A. C. Silliman B. R. (2011). The value of estuarine and coastal ecosystem services. Ecol. Monogr.81, 169–193. doi: 10.1890/10-1510.1
6
Barreto C. R. Daneshgar P. P. Tiedemann J. A. (2015). “ Carbon sequestration of dwarf red mangrove in the Bahamas,” in American fisheries society symposium(New York, NY, USA).
7
Bayraktarov E. Brisbane S. Hagger V. Smith C.S. Wilson K.A. Lovelock C.E. et al (2020). Priorities and motivations of marine coastal restoration research. Frontiers in Marine Science, 7, 484.
8
Bayraktarov E. Saunders M. I. Abdullah S. Mills M. Beher J. Possingham H. P. et al . (2016). The cost and feasibility of marine coastal restoration. Ecol. Appl.26, 1055–1074. doi: 10.1890/15-1077
9
Beeston M. et al . (2024). The high quality blue carbon principles and guidance: A guide for practitioners ( Ocean Risk and Resilience Action Alliance). Available online at: https://oceanriskalliance.org/wp-content/uploads/High-Quality-Blue-Carbon-Principles-Guidance-9-November-2022.pdf (Accessed January 21, 2025).
10
Bertram C. Quaas M. Reusch T. B. H. Vafeidis A. T. Wolff C. Rickels W. (2021). The blue carbon wealth of nations. Nat. Climate Change11, 704–709. doi: 10.1038/s41558-021-01089-4
11
Blue Heart Sunshine Coast Blue Carbon Pilot Project, ID ERF188599 Sunshine coast regional council, Australian carbon credit unit scheme. Available online at: https://cer.gov.au/schemes/Australian-carbon-credit-unit-scheme/accu-project-and-contract-register/project/ERF188599 (Accessed March 31, 2025).
12
Buchan K.C. (2000). The Bahamas. Marine Pollution Bulletin, 41, pp.94–111.
13
Bunting P. Rosenqvist A. Hilarides L. Lucas R. M. Thomas N. Tadono T. et al . (2022). Global mangrove extent change 1996–2020: global mangrove watch version 3.0. Remote Sens.14, 3657. doi: 10.3390/rs14153657
14
Campbell A. D. Fatoyinbo L. Goldberg L. Lagomasino D. (2022). Global hotspots of salt marsh change and carbon emissions. Nature612, pp.701–pp.706. doi: 10.1038/s41586-022-05355-z
15
Canning A. D. Jarvis D. Costanza R. Hasan S. Smart J. C. R. Finisdore J. et al . (2021). Financial incentives for large-scale wetland restoration: Beyond markets to common asset trusts. One Earth4, 848–861. doi: 10.1016/j.oneear.2021.06.006
16
Corbera E. Estrada M. May P. Navarro G. Pacheco P. (2011). Rights to land, forests and carbon in REDD+: insights from Mexico, Brazil and Costa Rica. Forests2, 301–342. doi: 10.3390/f2010301
17
Dahl M. Lavery P. S. Mazarrasa I. Samper-Villarreal J. Adame M. F. Crooks S. et al . (2025). Recommendations for strengthening blue carbon science. One Earth.8(3). doi: 10.1016/j.oneear.2025.101175
18
Dunic J. Brown C. Connolly R. Turschwell M. Côté I. (2021). Long-term declines and recovery of meadow area across the world’s seagrass bioregions. Global Change Biol.27, 4096–4109. doi: 10.1111/gcb.15684
19
Ewane E. B. Selvam P. P. AlMealla R. Watt M. S. Arachchige P. S. P. Bomfim B. et al . (2025). Mangrove-based carbon market projects: What stakeholders need to address during pre-feasibility assessment. J. Environ. Manage.374, 124074. doi: 10.1016/j.jenvman.2025.124074
20
Forest Trends’ Ecosystem Marketplace State of the voluntary carbon market 2024 ( Forest Trends Association2024). Available online at: https://www.ecosystemmarketplace.com/wp-content/uploads/2024/10/State_of_the_Blue_Carbon_Market_FINAL-with-box.pdf (Accessed January 12, 2025).
21
Friess D. A. Gatt Y. M. Ahmad R. Brown B. M. Sidik F. Wodehouse D. (2022). Achieving ambitious mangrove restoration targets will need a transdisciplinary and evidence-informed approach. One Earth5, 456–460. doi: 10.1016/j.oneear.2022.04.013
22
Gatt Y. M. Walton R. W. Andradi-Brown D. A. Spalding M. D. Acosta-Velázquez J. Adame M. F. et al . (2024). The Mangrove Restoration Tracker Tool: Meeting local practitioner needs and tracking progress toward global targets. One Earth. 7(11), 2072–2085. doi: 10.1016/j.oneear.2024.09.004
23
Griscom B. W. Adams J. Ellis P. W. Houghton R. A. Lomax G. Miteva D. A. et al . (2017). Natural climate solutions. Proc. Natl. Acad. Sci.114, 11645–11650. doi: 10.1073/pnas.1710465114
24
Hagger V. Stewart-Sinclair P. Rossini R. A. Adame M. F. Glamore W. Lavery P. et al . (2024). Lessons learned on the feasibility of coastal wetland restoration for blue carbon and co-benefits in Australia. J. Environ. Manage.369, 122287. doi: 10.1016/j.jenvman.2024.122287
25
Hagger V. Waltham N. Lovelock C. (2022). Opportunities for coastal wetland restoration for blue carbon with co-benefits for biodiversity, coastal fisheries, and water quality. Ecosystem Serv.55, 101423. doi: 10.1016/j.ecoser.2022.101423
26
Herrera-Silveira J. A. Teutli-Hernandez C. Secaira-Fajardo F. Braun R. Bowman J. Geselbracht L. et al . (2022). “ Hurricane damages to mangrove forests and post-storm restoration techniques and costs,” in The nature conservancy(Arlington, VA).
27
Howard J. Sutton-Grier A. E. Smart L. S. Lopes C. C. Hamilton J. Kleypas J. et al . (2023). Blue carbon pathways for climate mitigation: Known, emerging and unlikely. Mar. Policy156, 105788. doi: 10.1016/j.marpol.2023.105788
28
International Carbon Verification and Certification Mechanism (2024). Carbon credit principles: version 1.1 Available online at: https://icvcm.org/wp-content/uploads/2024/02/CCP-Book-V1.1-FINAL-LowRes-15May24.pdf (Accessed April 2025).
29
IPCC (2014). 2013 supplement to the 2006 IPCC guidelines for national greenhouse gas inventories. Eds. HiraishiT.KrugT.TanabeK.SrivastavaN.BaasansurenJ.FukudaM.TroxlerT. G. (Wetlands: IPCC, Switzerland).
30
Kenny I. Connell S. D. Drew G. Wright A. Carruthers S. McAfee D. (2023). Aligning social and ecological goals for successful marine restoration. Biol. Conserv.288, 110357. doi: 10.1016/j.biocon.2023.110357
31
Knutson T. R. McBride J. L. Chan J. Emanuel K. Holland G. Landsea C. et al . (2010). Tropical cyclones and climate change. Nat. Geosci.3, 157–163. doi: 10.1038/ngeo779
32
Lau W. W. Y. (2013). Beyond carbon: Conceptualizing payments for ecosystem services in blue forests on carbon and other marine and coastal ecosystem services. Ocean Coast. Manage.83, 5–14. doi: 10.1016/j.ocecoaman.2012.03.011
33
Li X. Bellerby R. Craft C. Widney S. E. (2018). Coastal wetland loss, consequences, and challenges for restoration. Anthropocene Coasts1, 1–15. doi: 10.1139/anc-2017-0001
34
Lovelock C. E. Atwood T. Baldock J. Duarte C. M. Hickey S. Lavery P. S. et al . (2017a). Assessing the risk of carbon dioxide emissions from blue carbon ecosystems. Front. Ecol. Environ.15, 257–265. doi: 10.1002/fee.1491
35
Lovelock C. Fourqurean J. Morris J. (2017b). Modeled CO2 emissions from coastal wetland transitions to other land uses: tidal marshes, mangrove forests, and seagrass beds. Front. Mar. Sci.4. doi: 10.3389/fmars.2017.00143
36
Macreadie P. I. Anton A. Raven J. A. Beaumont N. Connolly R. M. Friess D. A. et al . (2019). The future of Blue Carbon science. Nat. Commun.10, 3998. doi: 10.1038/s41467-019-11693-w
37
Macreadie P. I. Costa M. D. P. Atwood T. B. Friess D. A. Kelleway J. J. Kennedy H. et al . (2021). Blue carbon as a natural climate solution. Nat. Rev. Earth Environ.2, 826–839. doi: 10.1038/s43017-021-00224-1
38
Macreadie P. I. Robertson A. I. Spinks B. Adams M. P. Atchison J. M. Bell-James J. et al . (2022). Operationalizing marketable blue carbon. One Earth5, 485–492. doi: 10.1016/j.oneear.2022.04.005
39
Malerba M. E. Duarte de Paula Costa M. Friess D. A. Schuster L. Young M. A. Lagomasino D. et al . (2023). Remote sensing for cost-effective blue carbon accounting. Earth-Science Rev.238, 104337. doi: 10.1016/j.earscirev.2023.104337
40
Merk C. Grunau J. Riekhof M. C. Rickels W. (2022). The need for local governance of global commons: The example of blue carbon ecosystems. Ecol. Econ201, 107581. doi: 10.1016/j.ecolecon.2022.107581
41
Moore A. C. Kumble S. (2024). Community-based conservation and restoration in coastal wetlands: A review. Wetlands44, 62. doi: 10.1007/s13157-024-01818-3
42
Murdiyarso D. Purbopuspito J. Kauffman J. B. Warren M. W. Sasmito S. D. Donato D. C. et al . (2015). The potential of Indonesian mangrove forests for global climate change mitigation. Nat. Climate Change5, 1089–1092. doi: 10.1038/nclimate2734
43
Oil Price Information Service (OPIS), LLC Global carbon offset report. Available online at: https://www.opisnet.com/product/pricing/spot/carbon-offsets-report/ (Accessed November 13, 2024).
44
Okimoto Y. Nose A. Ikeda K. Agarie S. Oshima K. Tateda Y. et al . (2008). An estimation of CO2 fixation capacity in mangrove forest using two methods of CO2 gas exchange and growth curve analysis. Wetlands Ecol. Manage.16, 155–171. doi: 10.1007/s11273-007-9062-6
45
Ouyang X. Maher D. T. Santos I. R. (2024). Climate change decreases groundwater carbon discharges in global tidal wetlands. One Earth7, 1442–1455. doi: 10.1016/j.oneear.2024.07.009
46
Pan C. Shrestha A. Innes J. L. Zhou G. Li N. Li J. et al . (2022). Key challenges and approaches to addressing barriers in forest carbon offset projects. J. Forestry Res.33, 1109–1122. doi: 10.1007/s11676-022-01488-z
47
Pendleton L. Donato D. C. Murray B. C. Crooks S. Jenkins W. A. Sifleet S. et al . (2012). Estimating global “blue carbon” emissions from conversion and degradation of vegetated coastal ecosystems. PloS One7, e43542. doi: 10.1371/journal.pone.0043542
48
Perera N. S. Costa M. D. P. Macreadie P. I. Wartman M. (2024). Trends in market-based blue carbon projects. Sustain. Dev. 33(3), 3377–3402. doi: 10.1002/sd.3293
49
Pfiester E. Braune K. Thieffry A. Ballhausen H. Gajewska K. A. O'Donnell S. (2021). Costs and underuse of insulin and diabetes supplies: findings from the 2020 T1International cross-sectional web-based survey. Diabetes Res. Clin. Pract.179, 108996. doi: 10.1016/j.diabres.2021.108996
50
PV Climate Project Requirements, v5.2 Available online at: https://www.planvivo.org/Handlers/Download.ashx?IDMF=1d85bdc8-163f-4a26-921c-35c8ea684708 (Accessed January 2025).
51
Reimann L. Vafeidis A. T. Honsel L. E. (2023). Population development as a driver of coastal risk: Current trends and future pathways ( Cambridge Prisms: Coastal Futures). doi: 10.1017/cft.2023.3
52
Ring J. Stefanova M. Roebiono R. Stodulka K. (2023). The Mangrove Breakthrough Financial Roadmap: unlocking investment at scale in critical coastal ecosystems. Systemiq. Available online at: https://www.mangrovealliance.org/wp-content/uploads/2023/11/SY031MangroveBreakthrough2023_v8.pdf (Accessed January 15, 2024).
53
Roe S. Streck C. Beach R. Busch J. Chapman M. Daioglou V. et al . (2021). Land-based measures to mitigate climate change: Potential and feasibility by country. Global Change Biol.27, 6025–6058. doi: 10.1111/gcb.15873
54
Saintilan N. Khan N. S. Ashe E. Kelleway J. J. Rogers K. Woodroffe C. D. et al . (2020). Thresholds of mangrove survival under rapid sea level rise. Science368, 1118–1121. doi: 10.1126/science.aba2656
55
Saintilan N. Kovalenko K. E. Guntenspergen G. Rogers K. Lynch J. C. Cahoon D. R. et al . (2022). Constraints on the adjustment of tidal marshes to accelerating sea level rise. Science377, 523–527. doi: 10.1126/science.abo7872
56
Sasmito S. D. Taillardat P. Clendenning J. N. Cameron C. Friess D. A. Murdiyarso D. and Hutley L. B. (2019). Effect of land-use and land-cover change on mangrove blue carbon: A systematic review. Global Change Biol.25, 4291–4302. doi: 10.1111/gcb.14774
57
Saunders M. I. Cannard T. Fischer M. Sheppard M. Twomey A. Morris R. et al . (2024). A roadmap to coastal and marine ecological restoration in Australia. Environ. Sci. Policy159, 103808. doi: 10.1016/j.envsci.2024.103808
58
Smart L. S. Vukomanovic J. Sills E. O. Sanchez G. (2021). Cultural ecosystem services caught in a ‘coastal squeeze’ between sea level rise and urban expansion. Global Environ. Change66, 102209. doi: 10.1016/j.gloenvcha.2020.102209
59
Song S. Ding Y. Li W. Meng Y. Zhou J. Gou R. et al . (2023). Mangrove reforestation provides greater blue carbon benefit than afforestation for mitigating global climate change. Nat. Commun.14, Article no. 756. doi: 10.1038/s41467-023-36477-1
60
Stankovic M. Mishra A. K. Rahayu Y. P. Lefcheck J. Murdiyarso D. Friess D. A. et al . (2023). Blue carbon assessments of seagrass and mangrove ecosystems in South and Southeast Asia: Current progress and knowledge gaps. Sci. Total Environ.166618. doi: 10.1016/j.scitotenv.2023.166618
61
Stewart-Sinclair P. J. Bulmer R. H. Macpherson E. Lundquist C. J. (2024). Enabling coastal blue carbon in Aotearoa New Zealand: opportunities and challenges. Front. Mar. Sci.11, 1290107. doi: 10.3389/fmars.2024.1290107
62
Stewart-Sinclair P. Klein C. Bateman I. Lovelock C. (2021). Spatial cost–benefit analysis of blue restoration and factors driving net benefits globally. Conserv. Biol.35. doi: 10.1111/cobi.13742
63
Suhardi R. M. Rahardi W. Shih H. C. Mantiquilla J. A. Wu Y. H. Shiao M. S. et al . (2024). A review of the mangrove ecosystem in Indonesia: biodiversity, conservation, and challenges in sustainable management. Ecol. Genet. Genomics32, 100282. doi: 10.1016/j.egg.2024.100282
64
Unruh J. D. (2008). Carbon sequestration in Africa: The land tenure problem. Global Environ. Change18, 700–707. doi: 10.1016/j.gloenvcha.2008.07.008
65
Vanderklift M. A. Marcos-Martinez R. Butler J. R. A. Coleman M. Lawrence A. Prislan H. et al . (2019). Constraints and opportunities for market-based finance for the restoration and protection of blue carbon ecosystems. Mar. Policy107, 103429. doi: 10.1016/j.marpol.2019.02.001
66
Wharton K. Martins M. Livet C. Krause and M. Boutar L. (2023). “ Carbon Finance Playbook: Demystifying the capital raising process for Nature-based Carbon Projects in Emerging Markets,” in Cross boundary, LLC. pp 1–120. ( PLANETA Program). Available online at: https://crossboundary.com/wp-content/uploads/2023/12/PLANETA-Carbon-Finance-Playbook.pdf (Accessed January 15, 2025).
67
Wylie L. Sutton-Grier A. E. Moore A. (2016). Keys to successful blue carbon projects: lessons learned from global case studies. Mar. Policy65, pp.76–pp.84. doi: 10.1016/j.marpol.2015.12.020
68
Zhao Q. Bai J. Huang L. Gu B. Lu Q. Gao Z. (2016). A review of methodologies and success indicators for coastal wetland restoration. Ecol. Indic.60, 442–452. doi: 10.1016/j.ecolind.2015.07.003
Summary
Keywords
blue carbon, mangrove, seagrass, tidal marsh, ecosystem restoration, voluntary carbon market, carbon credits
Citation
Simpson S, Smart LS, Landis E, Van Laere S, Kibria ASMG, Albot O, Beeston M, Lovelock CE, McDonald RI, Moyer RP, Worthington TA, Maxwell TL, Stewart-Sinclair P and Spalding M (2025) The Blue Carbon Cost Tool – understanding market potential and investment requirements for high-quality coastal wetland projects. Front. Mar. Sci. 12:1622255. doi: 10.3389/fmars.2025.1622255
Received
02 May 2025
Accepted
09 October 2025
Published
04 November 2025
Volume
12 - 2025
Edited by
Raghab Ray, The University of Tokyo, Japan
Reviewed by
Uma Sankar Panda, National Centre for Coastal Research, India; Xiaoguang Ouyang, Southern Marine Science and Engineering Guangdong Laboratory (Guangzhou), China
Updates
Copyright
© 2025 Simpson, Smart, Landis, Van Laere, Kibria, Albot, Beeston, Lovelock, McDonald, Moyer, Worthington, Maxwell, Stewart-Sinclair and Spalding.
This is an open-access article distributed under the terms of the Creative Commons Attribution License (CC BY). The use, distribution or reproduction in other forums is permitted, provided the original author(s) and the copyright owner(s) are credited and that the original publication in this journal is cited, in accordance with accepted academic practice. No use, distribution or reproduction is permitted which does not comply with these terms.
*Correspondence: Stefanie Simpson, stefanie.simpson@tnc.org
†These authors have contributed equally to this work and share first authorship
Disclaimer
All claims expressed in this article are solely those of the authors and do not necessarily represent those of their affiliated organizations, or those of the publisher, the editors and the reviewers. Any product that may be evaluated in this article or claim that may be made by its manufacturer is not guaranteed or endorsed by the publisher.