Abstract
The southwestern South Atlantic Ocean is an important global sink of atmospheric carbon dioxide (CO2), driven by increased primary productivity in a nearby region where oligotrophic warm currents converge with nutrient-rich cold waters. However, uncertainties remain regarding CO2 dynamics and the role of physical processes in CO2 uptake across this region. Here, we assess variations in surface partial pressure of CO2 (pCO2) and air–sea CO2 fluxes in the Southwest Atlantic, along a transect from the continental shelf to the open ocean at 34.5°S during austral autumn 2018 and winter 2019. High-resolution spatial measurements of the temperature, salinity, and molar fraction of surface CO2 were conducted. In autumn 2018, the shelf region acted as a source of CO2 to the atmosphere (median of 3.2 mmol CO2 m-2 d-1), which was partially offset by a sink (median of –2.5 mmol CO2 m-2 d-1) in the open ocean. In contrast, the entire transect in winter 2019 presented median CO2 emissions of ~1.5 mmol CO2 m-2 d-1, which differs from climatological estimates. The spatial and seasonal variations in surface ocean pCO2 were linked to variable hydrodynamic processes, including water masses and mesoscale structures. Our findings reveal that, in one of the most productive oceanic waters worldwide, pCO2 may be influenced by distinct continental inputs (e.g., rivers, runoff, and groundwater discharge) and water masses (e.g., Tropical Water, Plata Plume Water and Subtropical Shelf Water). Therefore, the local hydrodynamic processes can modulate high spatial and seasonal variability in CO2 exchange at the ocean–atmosphere interface, with potential implications for regional and global carbon budgets. General results, such as climatological, cannot fully capture the influence of regional upwelling and continental water input, which highlights the importance of high-resolution regional observations.
1 Introduction
Globally, the ocean is a net sink of carbon dioxide (CO2) in the atmosphere with a global average CO2 flux of ~2.9 ± 0.4 Pg C yr−1 from 2014 to 2023 (Friedlingstein et al., 2025). The coastal ocean accounts for a net CO2 sink with estimates ranging from –0.44 Pg C yr−1 to –0.72 Pg C yr−1 (Resplandy et al., 2024), but it presents a more spatially heterogeneous pattern, acting as either a source or sink associated with local processes, such as river plumes (Parc et al., 2024) and coastal upwelling (e.g., Lefèvre et al., 2023; Siddiqui et al., 2023).
The Atlantic Ocean, which includes both the continental shelf and open-ocean regions, accounts for ~25% of the global oceanic CO2 sink, corresponding to –393 ± 29 Tg C yr−1 (Roobaert et al., 2019). However, these estimates may be biased due to the lower frequency of high resolution spatial measurements in the South Atlantic Ocean than in the North portion (Bakker et al., 2016, 2024; Liu et al., 2025). The CO2 sink in the Southwest Atlantic Ocean (SWAO) is particularly intense, with estimates of −3.7 mmol m-² d-¹ south of 40°S (Bianchi et al., 2009). More recent climatologies for the broader SWAO report fluxes of ~–3 to –5 mmol m-² d-¹ for April and June, respectively near 35°S/54–44°W (Fay et al., 2024), where the circulation patterns influence sea surface temperature (SST) variability and subsequent physical processes, e.g., upwelling (Takahashi et al., 2009; Ito et al., 2016), fronts and eddies (Pezzi et al., 2005; Ito et al., 2016; Orselli et al., 2019).
In this context, the South Atlantic Meridional Overturning Circulation (SAMOC) is an important feature of the SWAO and redistributes mass, heat, salt, oxygen, nutrients and carbon across the ocean (Kersalé et al., 2020). It presents a dynamic and complex water mass structure, characterized by intense boundary currents and mesoscale eddies (Manta et al., 2021). In the SWAO, around 34.5°S, there is still limited data coverage (Meinen et al., 2018). Thus, in 2009 the SAMOC array was initially deployed at 34.5°S to monitor the meridional flow of the western boundary currents (Meinen et al., 2013, 2017). Additionally, the Brazil– Malvinas Confluence (BMC), around 38°S, introduces further variability by facilitating vertical mixing and supporting high biological productivity (Chelton et al., 1990; Moura-Falcão et al., 2024).
The SAMOC system directly influences the spatial and temporal variability of the partial pressure of CO2 (pCO2) at the sea surface (Boot et al., 2022), as it regulates the transport and distribution of different water masses, each with distinct physical−chemical properties. Fluxes of CO2 (FCO2) variability is known to be controlled primarily by pCO2; thus, understanding the drivers of pCO2 is crucial for determining the ocean carbon sink (e.g., Landschützer et al., 2016). In the SWAO shelf break and continental slope regions, the upper layer of the water column is dominated by two main water masses: the Tropical Water (TW) and South Atlantic Central Water (SACW) (Campos et al., 1995; Castro and Miranda, 1998; Silveira et al., 2000). The surface layer (0–100 m) of the tropical southwestern South Atlantic is dominated by the TW, a relatively warm and salty water mass with SST greater than 18.5°C and sea surface salinity (SSS) values greater than 36. It is characterized by being nutrient poor (Campos et al., 1995; Möller et al., 2008) and typically has high pCO2 values due to lower CO2 solubility and limited biological drawdown. The SACW occupies the central layer of the South Atlantic Gyre and upwells to the surface at ~23°S 42°W, exhibiting cooler and more saline characteristics than the surrounding water, with average SSS and SST values of ~35°C and 16–18°C, respectively. In contrast, this water mass is nutrient-rich (De Souza et al., 2018; Azar et al., 2021), increasing the pCO2 values. Two other important water masses are the Plata Plume Water (PPW) and Subtropical Shelf Water (STSW). Surface waters with a salinity of ~32.5 indicate the presence of PPW, which originates from the Plata River and reaches southern Brazil via wind-driven transport. The PPW, being freshwater diluted and nutrient rich, tends to promote high biological activity and CO2 uptake, reducing surface pCO2 (Lencina-Avila et al., 2016). In turn, the STSW consists of modified warm TW and SACW diluted by the PPW, which is characterized by SSTs less than 18°C and SSS values between 33 and 36 (Möller et al., 2008).
Despite global predictions of changes in ocean biogeochemistry under climate change (Sabine et al., 2004; Gallego et al., 2020; Matthews et al., 2020; Pérez et al., 2024), regional responses in the SWAO remain poorly understood. There is still a gap in the information needed to assess the regional impacts of climate change along the SWAO areas. Here, we present a unique high resolution dataset of underway surface pCO2 observations obtained during two oceanographic cruises in the austral autumn of 2018 and winter of 2019 — seasons that remain underrepresented in the literature. The temporal resolution and spatial coverage across the SWAO shelf and slope provide unprecedented detail on short-term variability in surface CO2 dynamics during cooler months, which are critical for understanding carbon fluxes driven by physical processes such as deep-water ventilation and mesoscale activity. By integrating continuous pCO2, SST, and SSS data with hydrographic and regional circulation patterns, this study extends the findings of Moura-Falcão et al. (2024) by offering new insight with high−resolution into the seasonal drivers of surface ocean pCO2 variability in a region of high biogeochemical and dynamic complexity. Furthermore, we discussed the regional hydrographic conditions, the air–sea CO2 fluxes, the mesoscale dynamics and their implications.
2 Materials and methods
2.1 Sampling strategy
The study area comprises the SWAO, over a longitudinal transect along 34.5°S latitude, from the coast of Brazil to 44.5° W (Figure 1). Data were acquired during two oceanographic campaigns onboard RV Alpha Crucis (Universidade de São Paulo, Brazil) between 23–30 April 2018 (austral autumn) and 17 June–2 July 2019 (austral winter) as part of the ‘South Atlantic Meridional Overturning Circulation Basin-wide Array’ project (Fundação de Amparo à Pesquisa do Estado de São Paulo - FAPESP; FAPESP; Chidichimo et al., 2021).
Figure 1
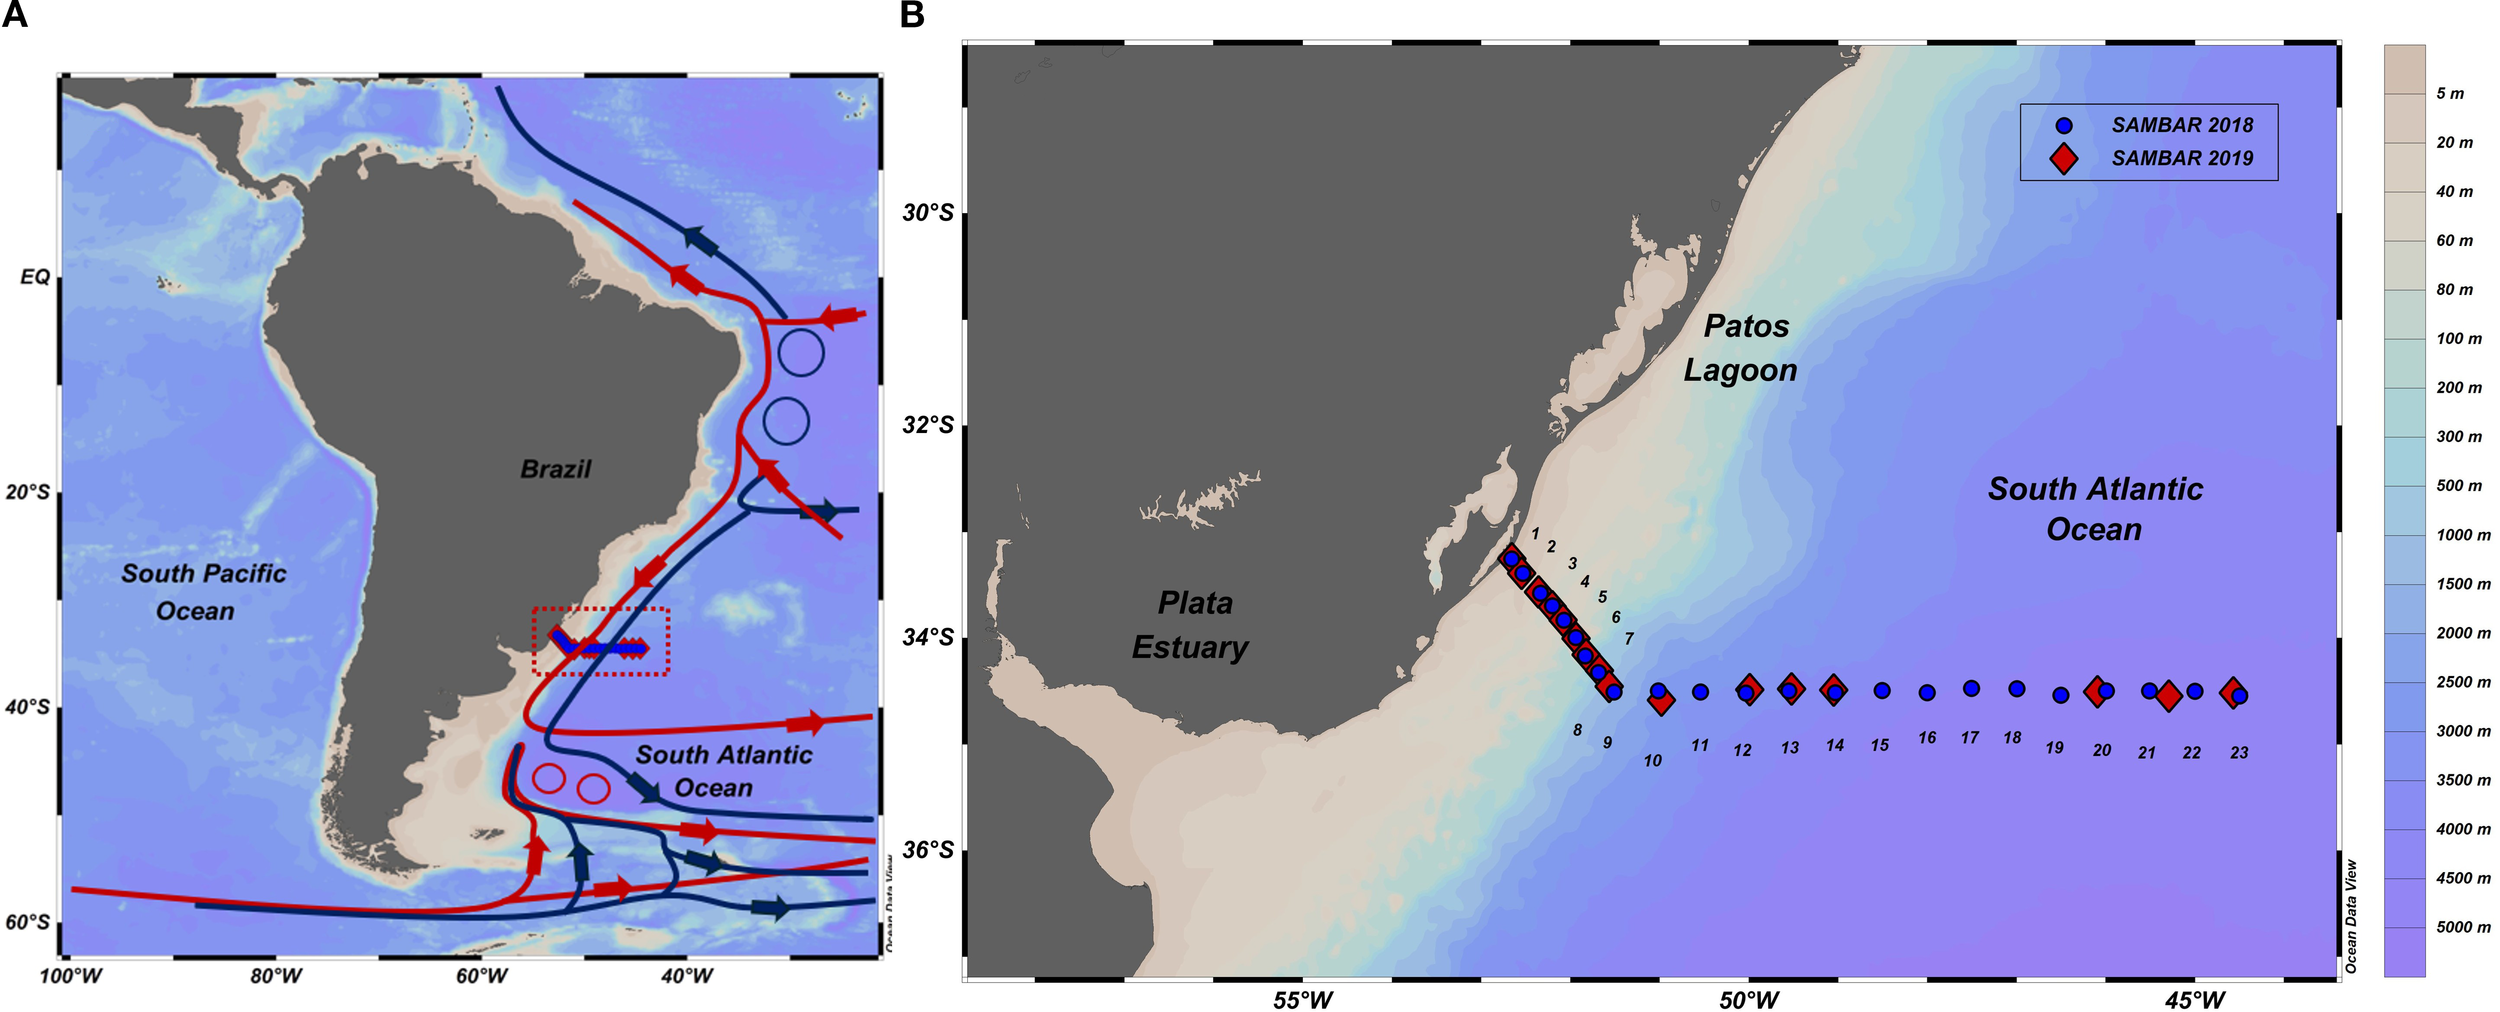
(A) Idealized schematic of the overturning circulation in the Southwestern Atlantic Ocean with the location of the study area marked with a red-dotted rectangle. The lines, circles and arrows represent the pathways of the surface (red) and deep waters (blue) based on Chidichimo et al. (2023). (B) Map of the CTD sampling stations along the southwestern South Atlantic Ocean margin off the Brazilian coast. The sampling stations from the autumn of 2018 are represented by blue dots, and the sampling stations from the winter of 2019 are represented by red diamonds.
2.2 Surface seawater sampling
The surface hydrographic properties were measured using a Sea-Bird Electronics (SBE) 9plus conductivity–temperature–depth (CTD) profiler equipped with sensors for temperature, conductivity and pH during campaigns aboard the RV Alpha Crucis.
In the study area, SSS and SST data from the ship’s thermosalinograph (SBE 45 MicroTSG) were integrated into the continuous pumping system to determine the high-resolution spatial distribution of seawater pCO2 (pCO2SW) (Section 2.3). The SST and SSS errors of the CTD are ±0.00014 °C for SST and ± 0.002 for SSS. The pCO2 error is ± 2 µatm, according to Fernandes et al. (2025). We have named “continental shelf” all sampling stations where local bottom depth was equal or shallower than 200 m (region corresponding to stations 1 to 7) and the other sampling stations (8 to 23) are referred to as “open ocean”.
2.3 CO2 partial pressure calculations
For the acquisition of the ongoing molar fraction of CO2, a water–air equilibrator coupled to an infrared gas analyzer (IRGA)-type CO2 detector (EGM-4 Environmental Gas Monitor for CO2, PP Systems) was used along the entire trajectory of the ship. After data acquisition, we applied a treatment routine to correct for atmospheric pressure and water vapor partial pressure according to Weiss and Price (1980). In situ variations in temperature and internal equilibrator temperature were corrected following the methods of Takahashi et al. (2009). The initial results generated by the IRGA readings are in xCO2, which refers to the number of CO2 molecules in each number of air molecules. This estimate is generally used because a gas molecule in dry air tends not to change when there are variations in temperature and pressure.
There is also a necessary adjustment in relation to the in-situ temperature, as suggested by Takahashi et al. (1993). The value of 0.0423°C in Equation 1 is considered a constant and was determined by Takahashi et al. (2009).
where Tin situ= in situ surface temperature; Teq = seawater temperature in the balancer; (pCO2)eq = pCO2 in the balancer.
To remove the effect of the SST on the sampled pCO2 data, the data were normalized to the average SST during the sampling periods (autumn and winter). The average observed SST value for 2018 was 22.54°C (autumn), and in 2019, it was 17.88 °C (winter). The calculations follow the precepts indicated by Takahashi et al. (2002) and Takahashi et al. (2009) according to Equation 2:
where SSTM = average temperature (°C) observed at the sea surface.
To calculate the CO2 diffusion rate at the ocean–atmosphere interface, FCO2 were calculated (Equation 3):
where k = the gas transfer speed as a function of the wind speed; ko = the solubility of CO2 in sea water (according to Weiss, 1974); and (ΔpCO2)oc-atm = the difference between ocean pCO2 and atmosphere pCO2. The pCO2 in atmospheric equilibrium was assumed to be 405.295 μatm in autumn 2018 and 408.186 μatm in winter 2019. These values correspond to the monthly averages of the estimated atmospheric concentration in the mid-latitude range of the sampling, with uncertainty values of 0.178 μatm in 2018 and 0.075 μatm in 2019. These estimates were taken from the database of the U.S. agency National Oceanic and Atmospheric Administration (NOAA) for Greenhouse Gas Reference - Atmospheric Carbon Dioxide. Wind speed data were obtained continuously onboard from the Alpha Crucis meteorological station.
The difference in pCO2 (ΔpCO2) between the two compartments determines the direction of net transfer between the ocean and the atmosphere. The ratio between the viscosity and molecular diffusion rate is represented by k (Weiss, 1974). In this study, the calculated coefficients of k were compared between 3 works: Wanninkhof (1992); Nightingale et al. (2000); Wanninkhof (2014), which are represented as W92, N00 and W14, respectively. The equations used for k calculations are summarized in Supplementary Table S1. Although W14 is a central choice, we also include other parameterizations (such as N00 and W92) (Supplementary Tables S2, S3) to provide different perspectives/scenarios of the flux given the complexity of the region and to compare with other studies that might have used different parametrizations. The wind speed data fit these k and they have already been used in previous studies and have shown good representation for the region. The figures was performed in Ocean Data View software (ODV - Schlitzer, 2021).
2.4 Statistical analysis
Normality was not achieved, as indicated by the D'Agostino and Pearson (1973), even after data transformation. Therefore, non-parametric statistical methods were applied. Seasonal differences between autumn and winter within each region (continental shelf and open ocean) were assessed using multiple Mann–Whitney U tests (p < 0.05), resulting in six pairwise comparisons (Supplementary Table S4; Supplementary Figure S1). To evaluate differences across both seasons and regions (four groups), the Kruskal–Wallis test was applied, followed by the two-stage linear step-up procedure of Benjamini, Krieger, and Yekutieli to control the false discovery rate (FDR), totaling 18 comparisons (Supplementary Table S5; Supplementary Figure S2). In addition, Spearman’s rank correlation analysis (p < 0.05) was conducted to examine the relationships among pCO2, SST, and SSS (Supplementary Table S6; Supplementary Figure S3).
2.5 Oceanographic modelling data
Oceanographic modelling data of surface anomalies (SSH) and current velocity derived from satellite images were used to understand and compare ocean conditions and identify mesoscale structures between the autumn (2018) and winter (2019) periods in the southwestern Atlantic Ocean.
To investigate ocean dynamics and physical properties during the transect periods, we utilized global ocean physics reanalysis data from the Copernicus Marine Environment Monitoring Service (CMEMS) (https://resources.marine.copernicus.eu/). The dataset is derived from version v3.6_STABLE of the Nucleus for European Modelling of the Ocean (NEMO) model, which features a 1/12⤐ horizontal resolution (~9 km) and 50 vertical levels. Although only data from the SAMBAR transect periods were analyzed, reanalysis data are available from 1993 to 2019. The model’s initial conditions were obtained from the European Centre for Medium-Range Weather Forecasts (ECMWF) ERA-Interim and ERA5 reanalysis datasets, which incorporate data assimilation from altimetry, satellite-derived sea surface temperature, sea ice concentration, and in situ vertical profiles of temperature and salinity. In this study, we specifically used daily mean fields of sea surface temperature, sea surface height, and velocity. The selected model domain extends from 44°W to 59°W longitude and 30°S to 37°S latitude.
The CMEMS reanalysis dataset was selected due to its robustness, global coverage (e.g., Wang et al., 2023), and widespread use within the oceanographic research community. As described previously, the product is based on the NEMO model (v3.6_STABLE), which provides daily mean physical fields with sufficient resolution to analyze mesoscale ocean dynamics in the southwestern Atlantic Ocean. Notably, no interpolation or spatial resampling of the model output was performed. In addition, no direct validation was conducted compare the in-situ measurements and model data, as the primary objective of this study was not to assess model performance but rather to utilize the modeled fields as contextual support for interpreting the oceanographic patterns observed during the SAMBAR transect campaigns. Nevertheless, we recognize the limitations of the reanalysis product, such as the smoothing of fine-scale variability and the inability to resolve submesoscale processes, which were considered during the analysis and discussion of the results.
3 Results
3.1 Spatial and temporal distributions of physical–chemical parameters
Warmer (>21°C) waters during autumn 2018 dominated continental and open ocean areas up to approximately 47°W, and we found colder surface waters in the open ocean area (stations 18 and 21) (Figure 2A). On the other hand, during the winter of 2019, the SST in the open ocean area were patchy, with colder water intrusions. In addition, prominent cooler (<19°C) and fresher (<30) (Figure 3B) water extended over the continental shelf, identified as the PPW (Figure 3B). The CMEMS data clearly revealed a difference in the distribution of SSTs between autumn 2018 and winter 2019 across the study region (Figure 2). Similarly, the SST and SSS data from the thermosalinograph (Supplementary Tables S2, S3) showed significant spatial and seasonal differences between the continental shelf and open ocean (Mann–Whitney, p < 0.05). Along these transects, the SST and SSS reached higher median values in autumn 2018 (22.5°C and 36.2) than in winter 2019 (20.5°C and 35.5) (Supplementary Tables S2, S3).
Figure 2
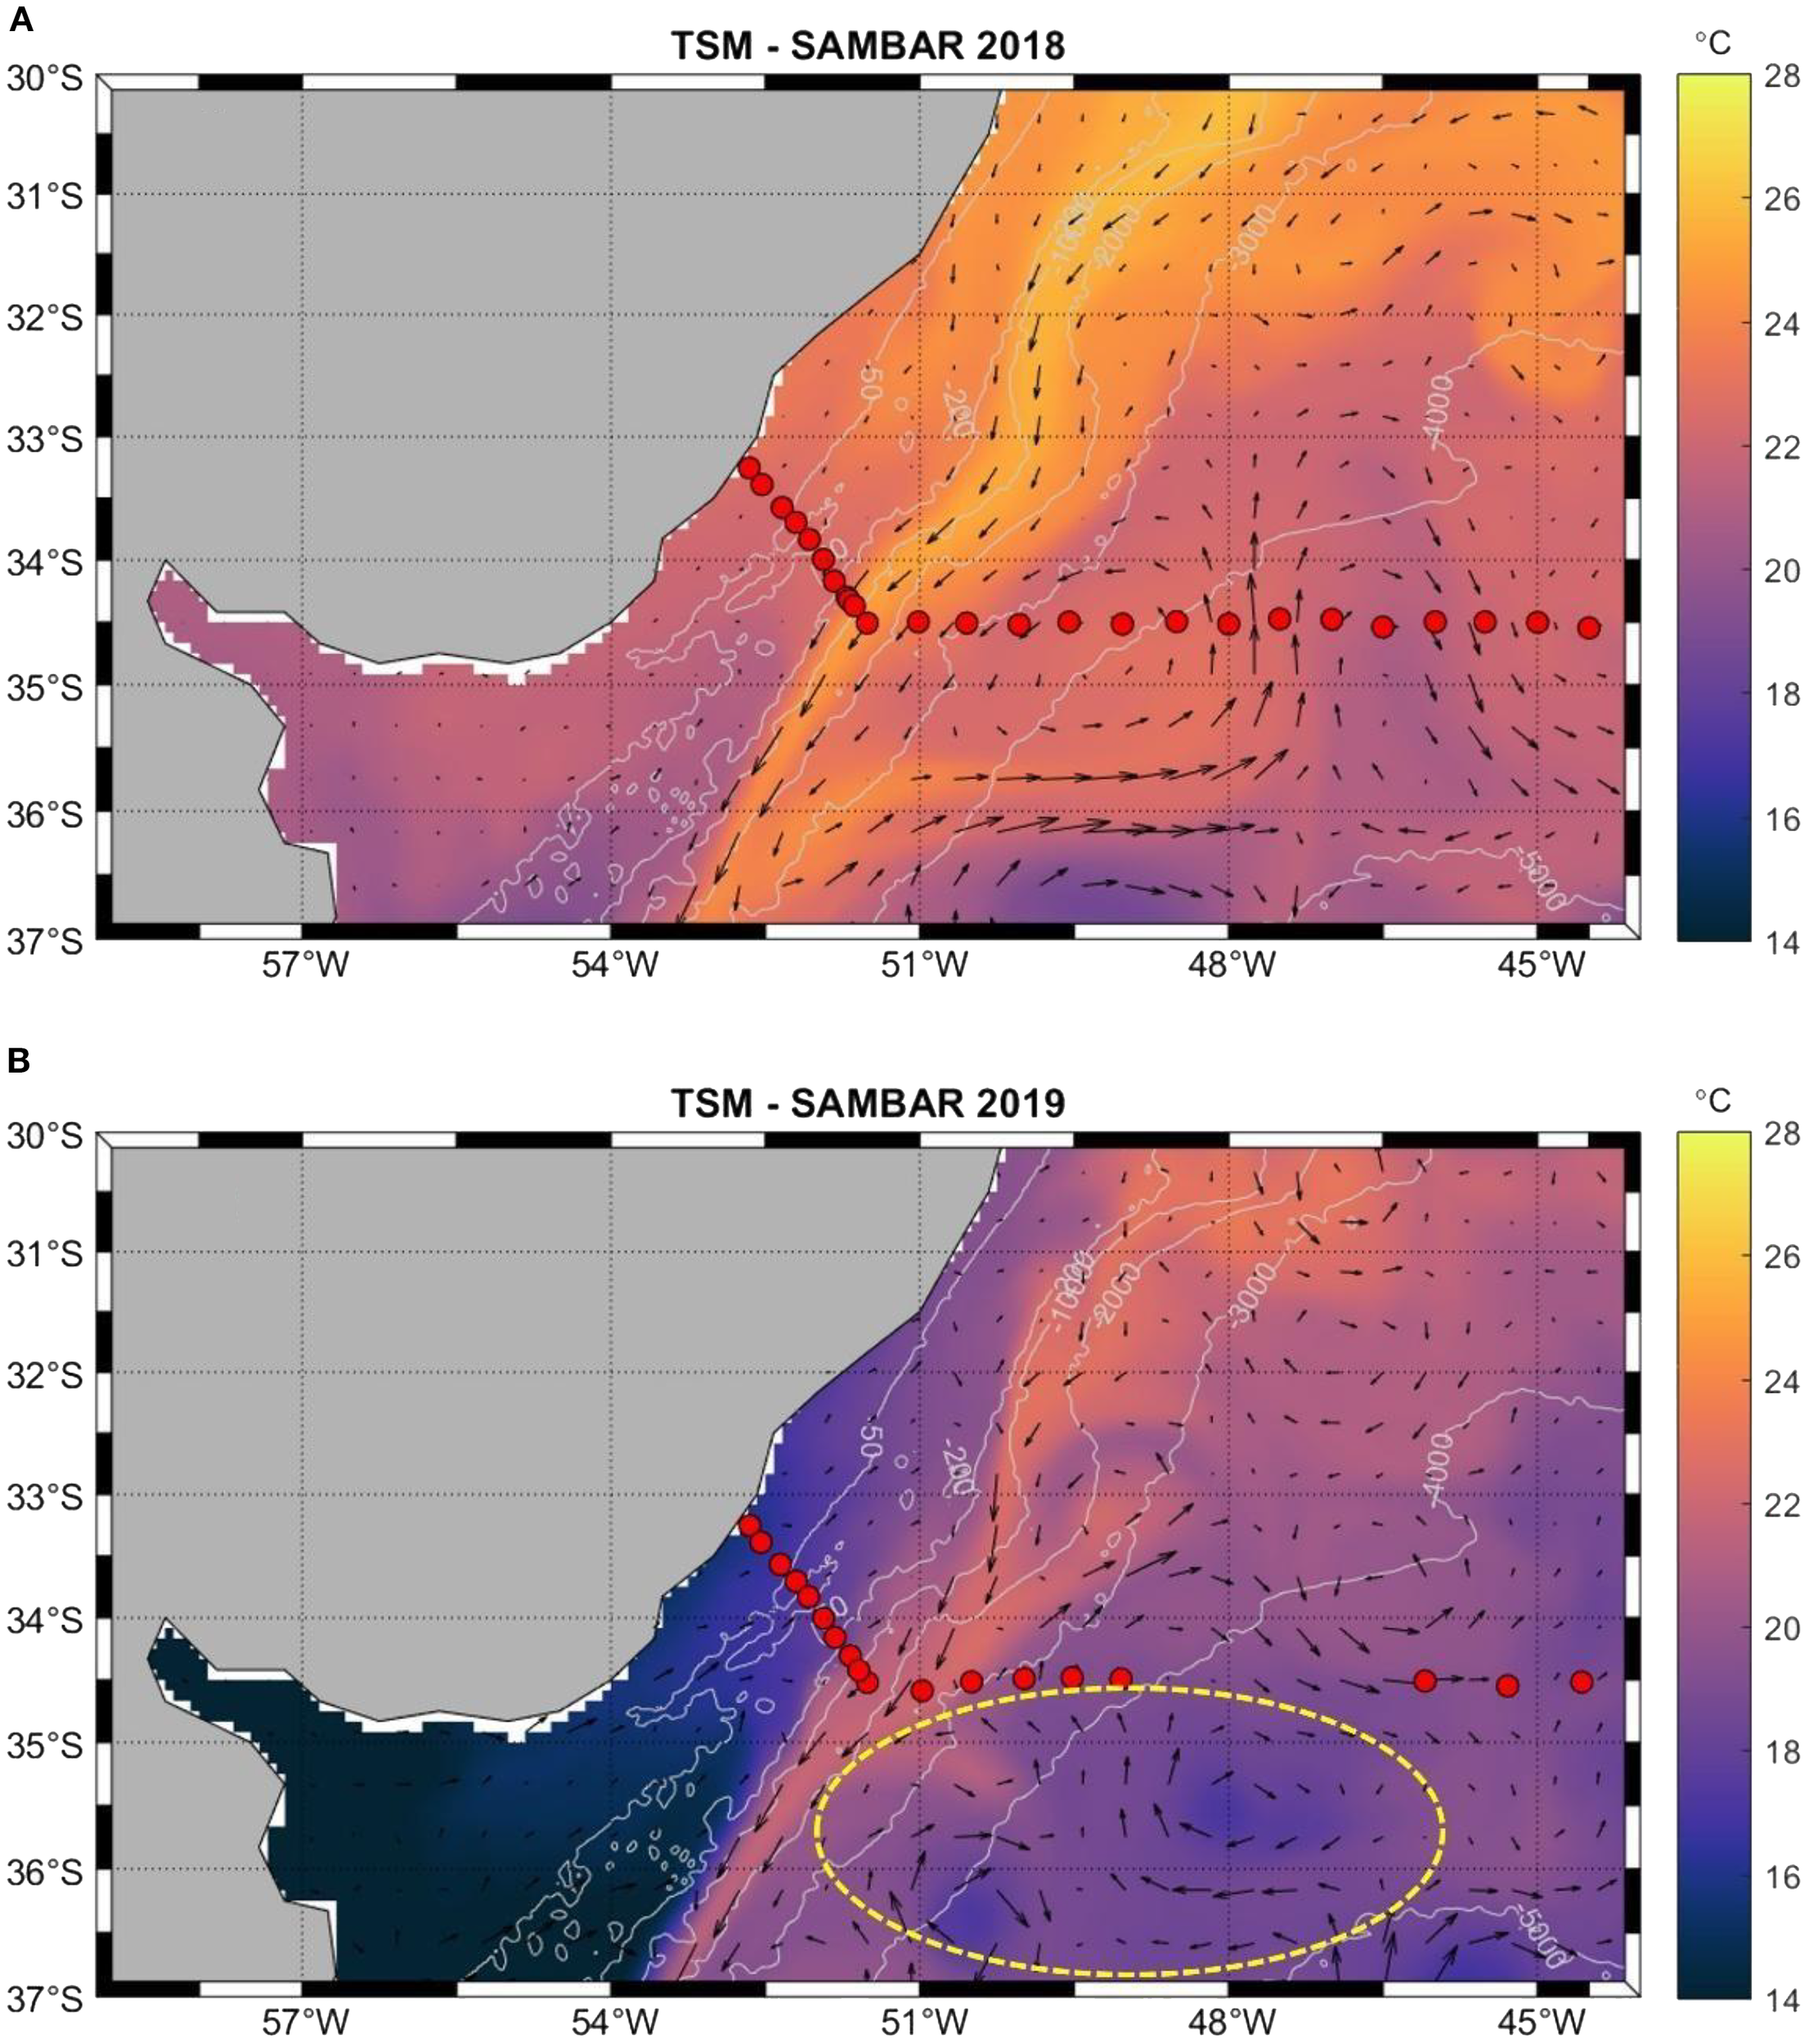
Sea surface temperature (SST; °C) in the southwestern Atlantic Ocean during the (A) 2018 and (B) 2019 campaigns, derived from the CMEMS reanalysis. The SST data have a 9 km resolution and represent an 8-day average (April 23–May 1, 2018, and June 18–26, 2019). The grey contours indicate isobaths, whereas the red dots represent sampling stations from both campaigns over the continental shelf and open ocean. The arrows indicate the currents. The yellow circle indicates the presence of eddies.
Figure 3
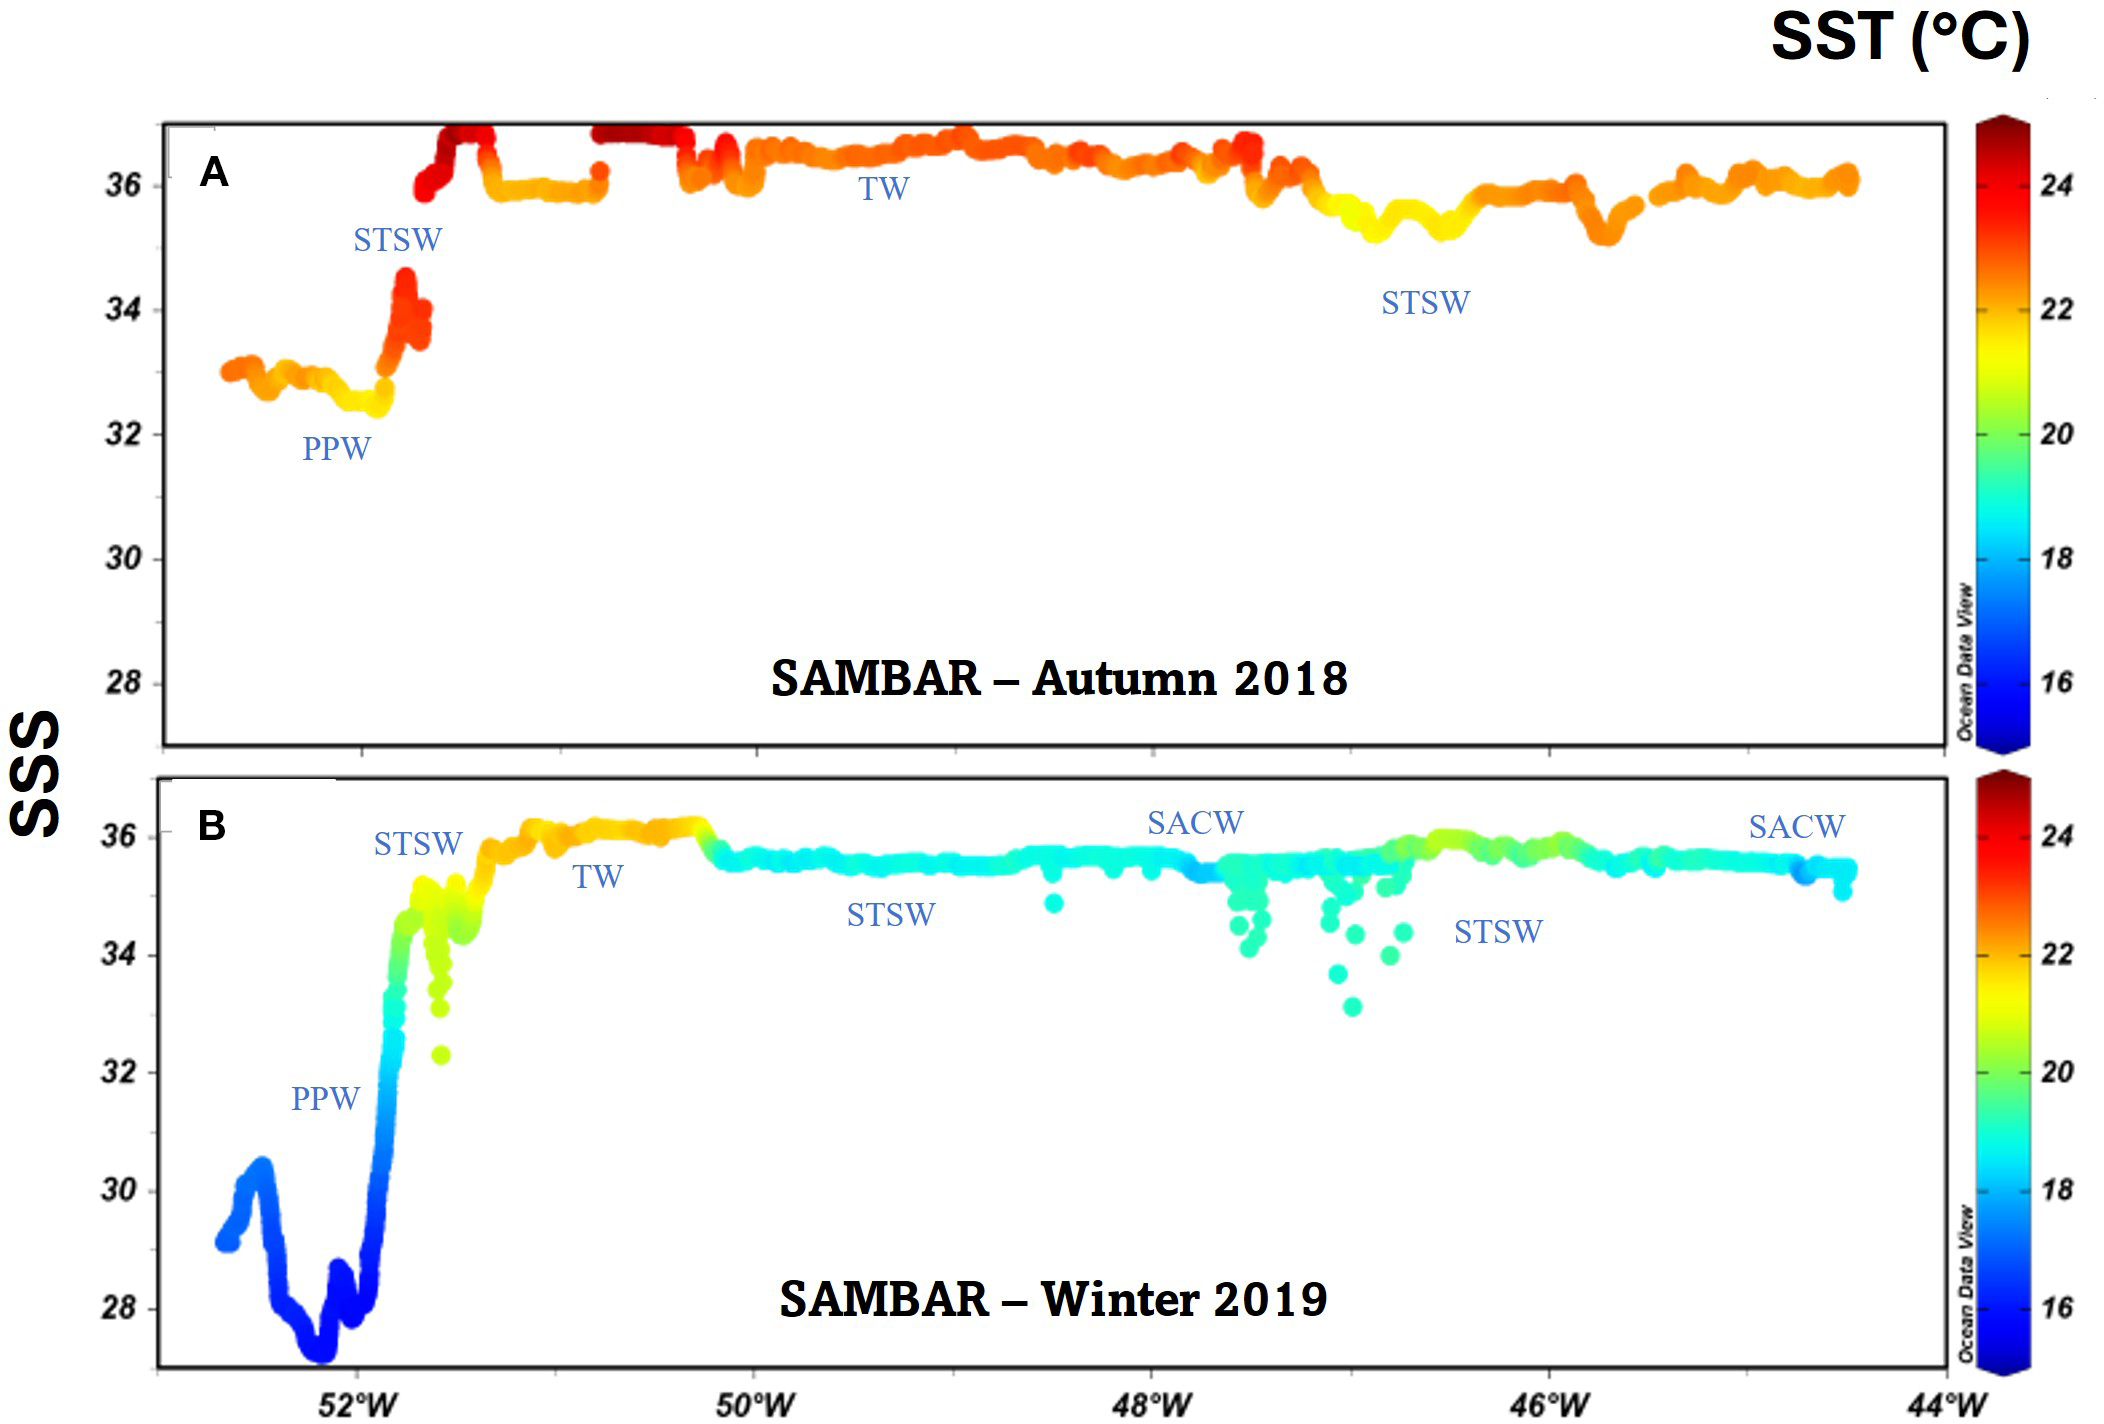
Continuous salinity (SSS) and sea surface temperature (SST; °C) data from the vessel’s thermosalinograph in the transect region during campaigns (A) in the autumn of 2018 and (B) winter of 2019. The water masses are indicated in the figure: Plata Plume Water (PPW), Subtropical Shelf Water (STSW), Tropical Water (TW) and South Atlantic Central Water (SACW).
For the SST and SSS, the surface seawater pCO2 significantly differed between the autumn of 2018 and winter of 2019 (Mann–Whitney, p < 0.05). The median pCO2 value in the winter 2019 (434 μatm) was higher (Supplementary Table S3) than that in the autumn of 2018 (380 μatm) (Supplementary Table S2). Moreover, there was a clear division (p<0.05) between the relatively higher (>450 μatm) pCO2 values on the continental shelf and the relatively lower (<400 μatm) pCO2 values in the open ocean waters at the continental slope in the autumn of 2018 (Figure 4A), with higher median in shelf waters (445 μatm) (Supplementary Table S2). On the other hand, during winter 2019, the pCO2 did not significantly differ spatially (p > 0.05), and both areas presented the same median (433 μatm) (Supplementary Tables S2, S3). The same features are observed for the spatial variation in ΔpCO2 values (Figures 4C, D). In 2019 (winter), the median ΔpCO2 was 28 μatm both on the shelf and in the open ocean. During 2018 (autumn), the shelf region had a median ΔpCO2 of 39 μatm, whereas in the open ocean, it was –28 μatm. These results highlight strong seasonal and spatial patterns in the SST, SSS, and pCO2, while also indicating continental freshwater mixing — particularly in autumn—when cross-shelf gradients become less pronounced. Spearman correlation analyses indicated a negative correlation between pCO2 and the SST, as well as between pCO2 and the SSS. Both correlations were statistically significant at α = 0.05.
Figure 4
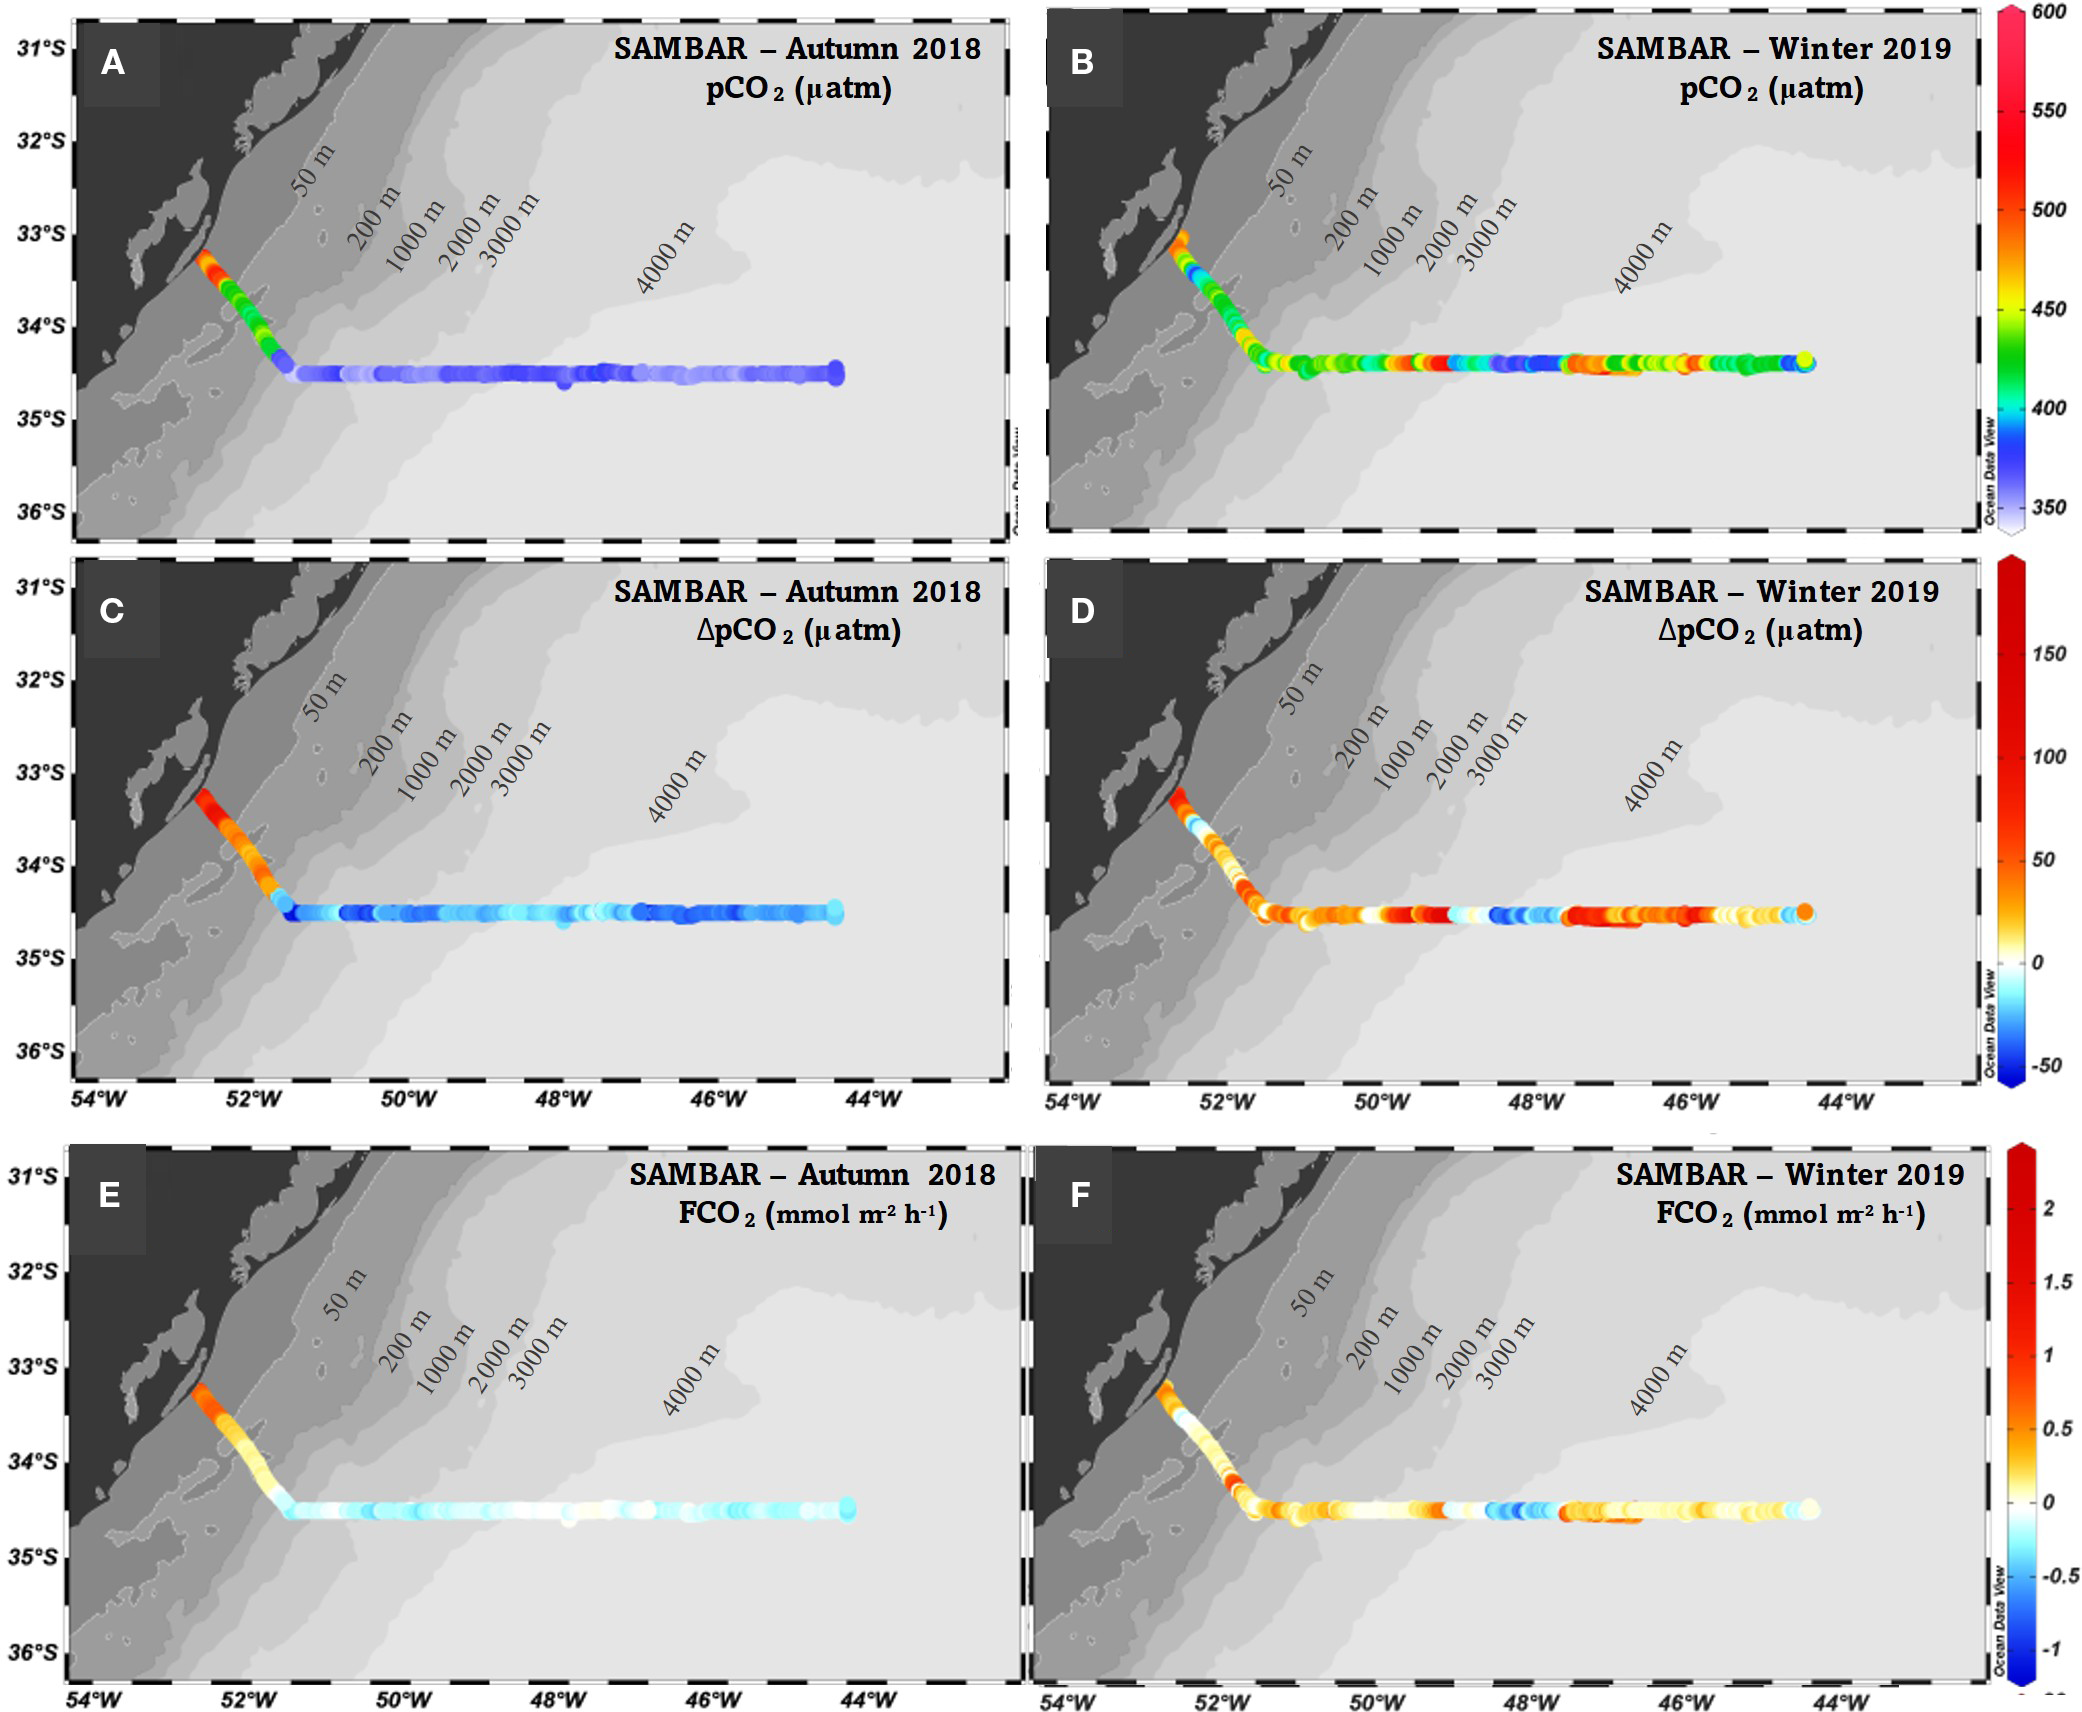
Continuous (A, B) partial pressure of CO2 (pCO2; µatm), (C, D) difference between ocean pCO2 and atmospheric pCO2 (ΔpCO2; μatm) and (E, F) fluxes of CO2 (FCO2; mmol m–2 h–1) data in the transect region during the campaigns in the (A, C, E) autumn of 2018 and (B, D, F) winter of 2019. The grayscale shading represents the variation in bathymetry, with the shallowest areas being identified by darker grey and the deepest areas represented by lighter grey. The lines represent the isobaths.
3.2 SSH and ΔpCO2
The spatial distributions of the SSH and ΔpCO2 values significantly differed between the 2018 and 2019 campaigns (Figure 5). In 2018, a well-defined gradient was observed along the transect, with strongly positive (reddish tones) and negative (bluish tones) ΔpCO2 values. Notably, the westernmost portion of the transect predominantly indicated CO2 release to the atmosphere, whereas the eastern portion was characterized by CO2 uptake by the ocean. In contrast, during the winter of 2019, the ΔpCO2 gradient was less pronounced, with a predominance of positive values and near-equilibrium conditions with the atmosphere (white tones).
Figure 5
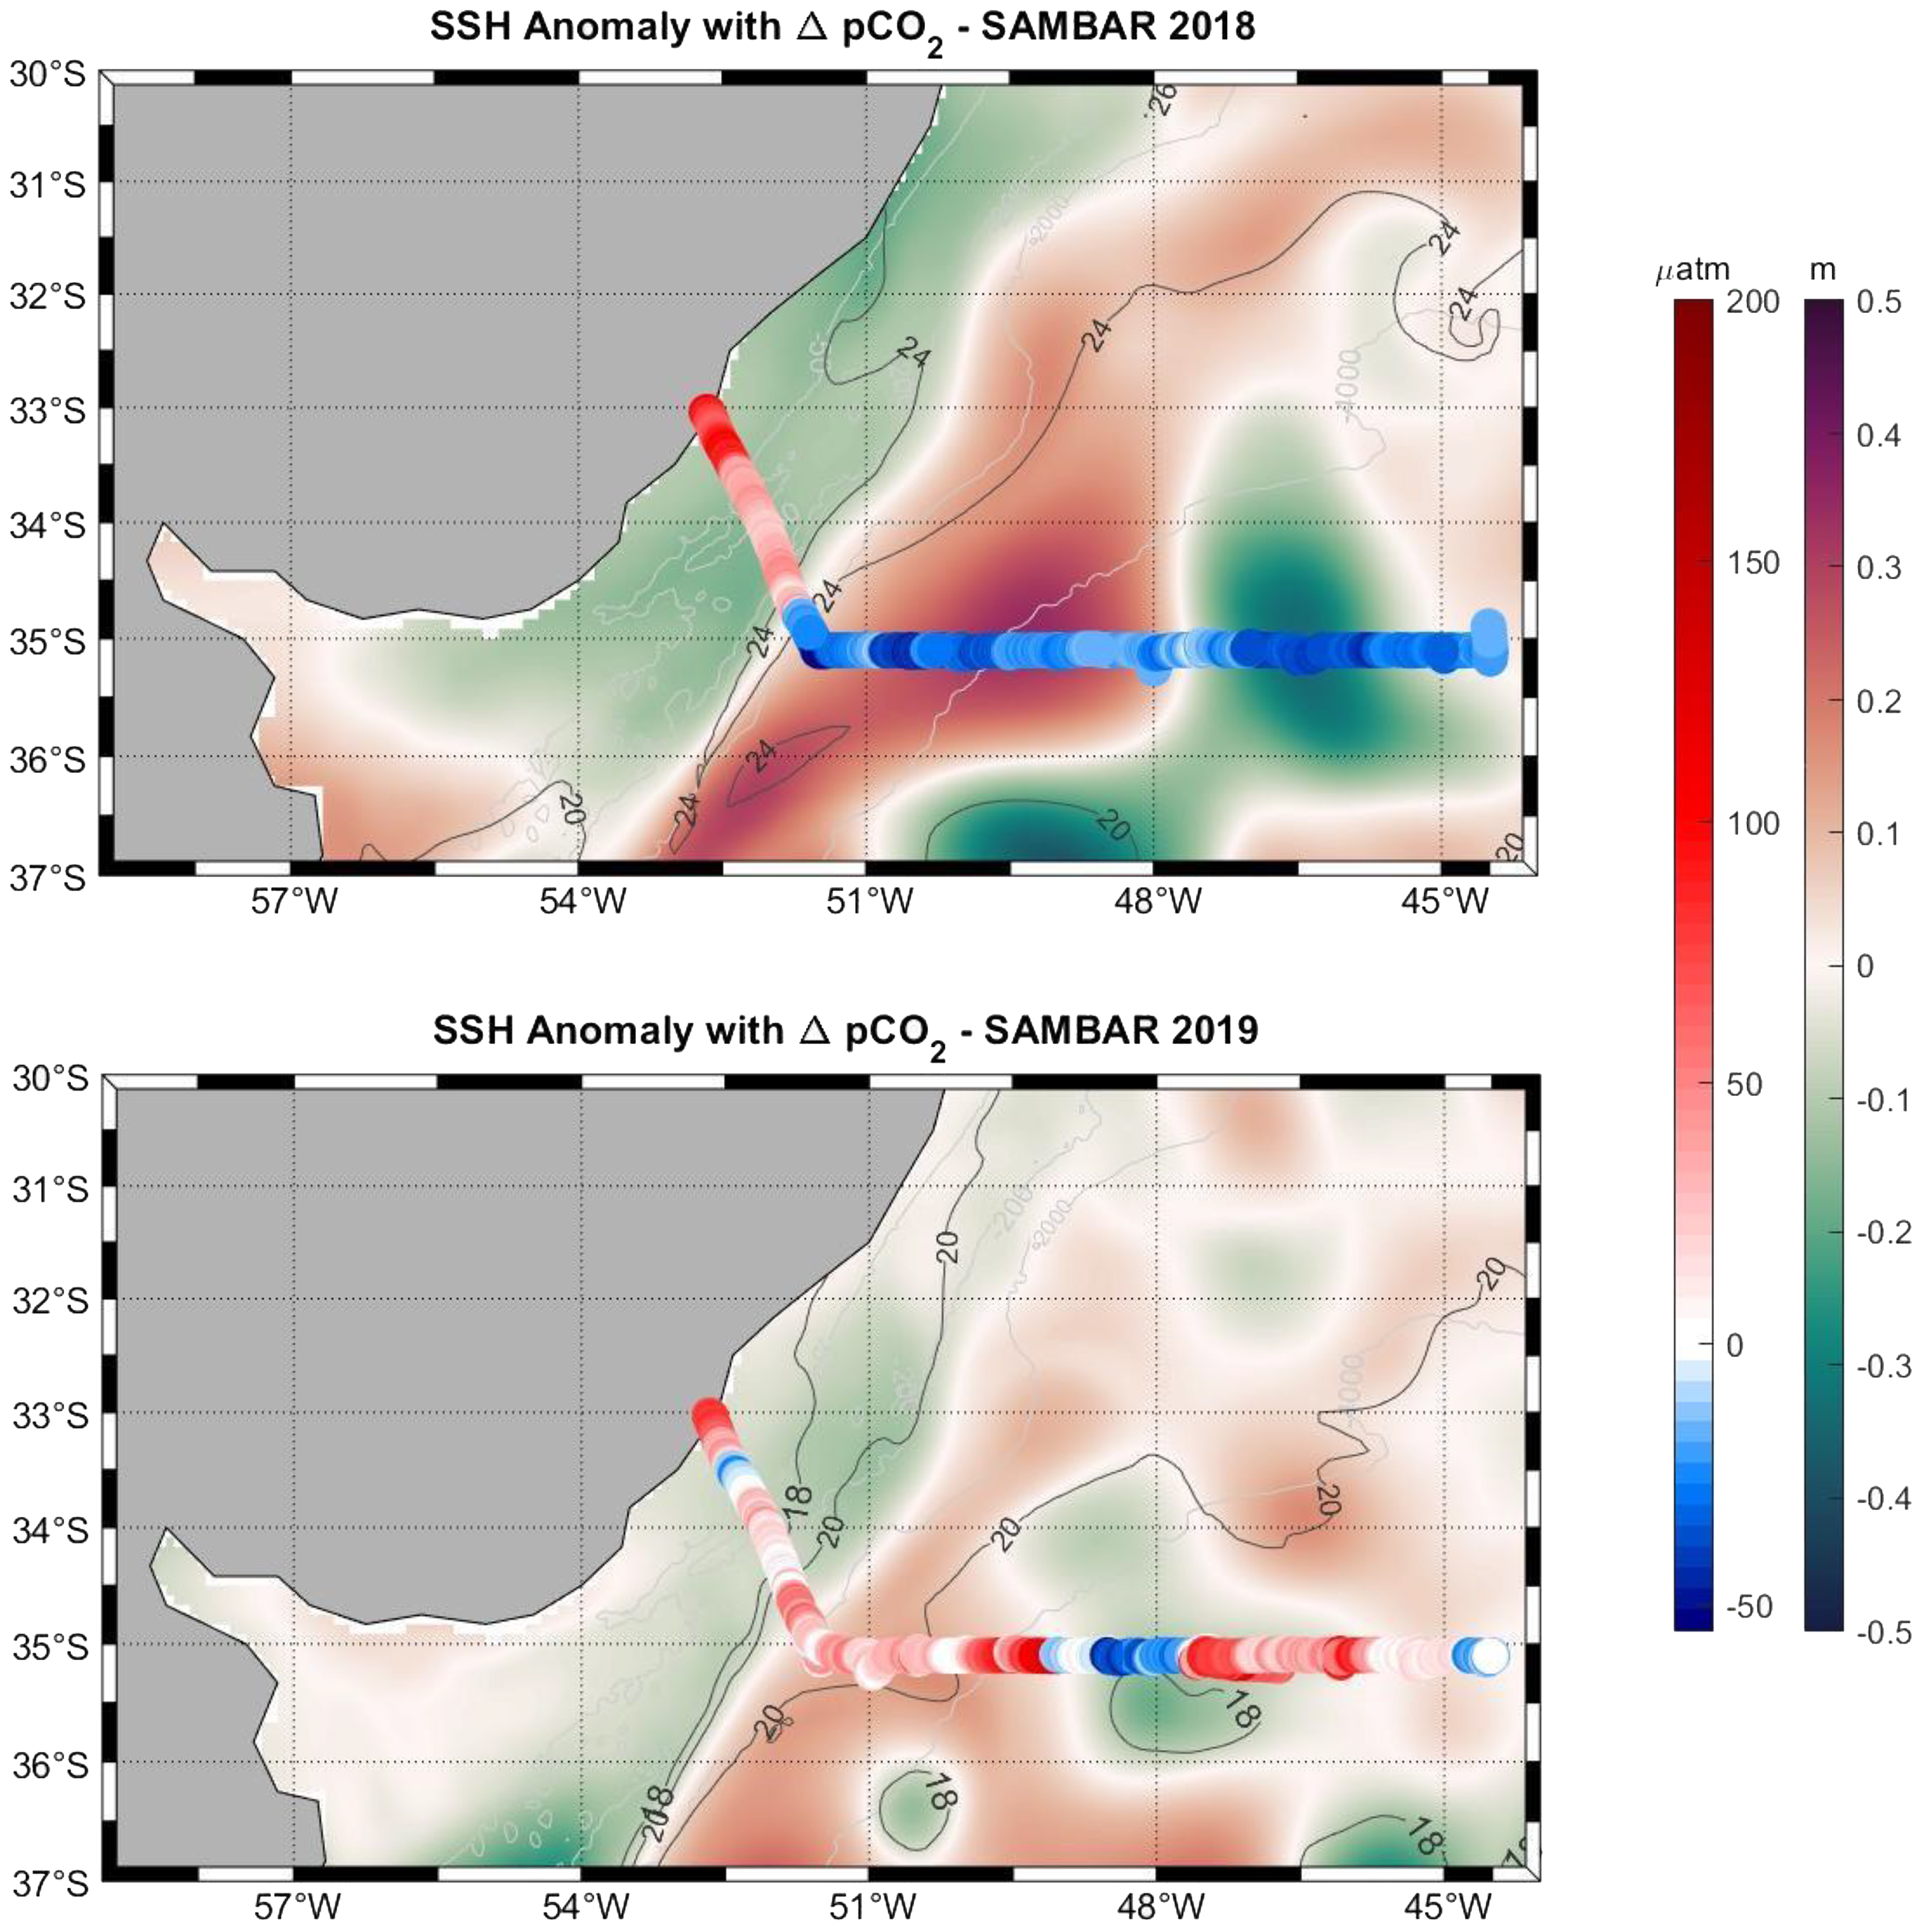
Map of the study region, showing the surface height anomaly (SSH; m) and continuous data of the difference between ocean and atmospheric pCO2 (ΔpCO2; μatm; https://resources.marine.copernicus.eu). The top map refers to the 2018 campaign (autumn), whereas the bottom map refers to the 2019 campaign (winter). The first bar indicates the variation in ΔpCO2 values along the transect (red, white, and blue), where red tones represent CO2 sources to the atmosphere, white tones indicate equilibrium, and blue tones denote CO2 uptake. The second color bar (orange, white and green) corresponds to SSH variations across the study area. The black contour lines represent temperature isolines (°C).
The variation in SSH, represented by green and red tones, suggests distinct ocean circulation patterns between the two analyzed years. In 2018, a positive SSH anomaly (> 0.2 m) east of the transect may have been associated with the influence of an oceanic feature, such as an anticyclonic eddy. In 2019, the more uniform SSH distribution indicated a weaker influence of mesoscale structures in the study area. Mesoscale dynamics, defined here as features with horizontal scales of ~10–100 km (Martínez-Moreno et al., 2022), were less evident during this period. Although a SSH anomaly was detected around 48°W, it likely represents a smaller-scale or transient feature rather than a well-developed mesoscale eddy.
The observed SSH anomalies were associated with ΔpCO2 variability, consistent with the influence of mesoscale structures. These results point to the importance of mesoscale circulation in driving surface CO2 variability in the SWAO.
3.3 Ocean–atmosphere CO2 fluxes
The shelf region acted as a weak source and the open ocean region acted as a CO2 weak sink during the autumn campaign (2018). The median FCO2 was 0.1 mmol CO2 m−2h–1 for the shelf and −0.1 mmol CO2 m−2h–1 for the ocean (Wanninkoff 2014 parameterization) (Supplementary Table S2). Although the shelf region acted as a source, when considering the entire transect, there was a weak CO2 sink with a median FCO2 of −0.1 mmol CO2 m−2h–1 (Figure 4E). The wind speed was constant throughout the autumn campaign, with overall median values of ~10 m s–1 (Supplementary Figure S5a). On the other hand, during the entire winter 2019 campaign, the region behaved as a weak CO2 source (Figure 4F), with some areas showing CO2 equilibrium between the ocean and the atmosphere along the transect. A relatively strong CO2 sink area was observed ~48°W, where wind speeds with 10 m s–1 were also observed (Supplementary Figure S5b).
4 Discussion
4.1 Hydrographic conditions in the southwestern Atlantic Ocean
The analyzed period exhibited SST and SSS patterns consistent with the water masses typically found in the southwestern Atlantic Ocean (Bianchi et al., 1993; Piola et al., 2000; Möller et al., 2008). The pattern of wind directions in the study region changed from predominantly northerly winds in autumn to predominantly southerly and southwesterly winds in winter (Möller et al., 2008). Our observed thermohaline properties indicated that the relatively fresher, cooler and nutrient rich PPW was more common off the Argentine–Uruguay coastal area in autumn, with the STSW covering the northern portion of the shelf.
The surface haline front (100–200 m) divides the outer shelf and the open ocean regions (Brandini et al., 2018). Warmer and more saline waters predominated on the shelf and in the open ocean up to approximately 47°W in autumn 2018, suggesting a lesser influence of PPW, allowing greater penetration of TW and STSW in the region. On the other hand, in 2019 (winter), a significant reduction in SST and SSS was observed on the continental shelf, indicating an expansion of the PPW (Figure 3B). This pattern is consistent with studies (e.g., Möller et al., 2008) that showed that the Plata River discharge and the consequent expansion of the plume are intensified in winter. During this period, the prevailing winds from the south and southeast favored the dispersion of less saline water to the north.
Additionally, the SACW was observed during the winter of 2019, between the STSW and TW in the open ocean area (Figure 3). The presence of cooler and less saline waters in winter is also associated with the displacement of the BMC to more northern latitudes (Combes and Matano, 2014). The BMC marks the meeting point between the warm and salty BC and the cold and less saline MC. During winter, the MC intensifies its influence on the shelf, promoting the cooling of surface waters and contributing to the intrusion of subantarctic water masses.
Although no direct comparison was made between the model outputs and the in-situ measurements — as model validation was not the aim of this work — the CMEMS modeled fields were useful for supporting the interpretation of circulation patterns and thermohaline structures observed across the shelf and open ocean. The limitations of the CMEMS fields were considered during the interpretation of results, and care was taken to avoid overinterpreting features below the model’s resolution capability. No interpolation was applied to the model fields, and only daily mean values were used as provided by CMEMS.
4.2 Distribution of pCO2
The median pCO2 concentration in the winter of 2019 (434 μatm) was greater than that in the autumn of 2018 (380 μatm). In addition, the behavior of the regions (continental shelf vs. open ocean) was different during the study period. The pCO2 was greater than that of open ocean waters in autumn 2018, while both areas presented the same median (433 μatm) during the winter of 2019. One of the factors associated with these variations may be associated with the SST. SST highly modulates pCO2 variations (e.g., Takahashi et al., 2009; 2014). In this region, Ito et al. (2016) reported that the thermal effect is the main factor controlling the solubility of CO2. However, several processes can stimulate seasonal variations in ocean surface pCO2 (e.g., respiration, production, carbonate dissolution, and precipitation) (Sarmiento and Gruber, 2006).
In autumn 2018, when the influence of the PPW was lower, the shelf had higher pCO2 values. The observed warmer and saltier water conditions suggest a lower renewal of water masses and the predominance of oligotrophic TW, which tends to have higher pCO2 values (Ito et al., 2016).
Lencina-Avila et al. (2016) and Ito et al. (2016) noted that less saline water (<30), which is rich in organic matter and nutrients, can considerably reduce pCO2 by stimulating primary productivity. The PPW is rich in nutrients and may play a key role in promoting phytoplankton blooms (Lima et al., 2019), as does the SACW (Pezzi et al., 2009). After blooms, these organisms produce organic matter and decompose, potentially generating carbon in the water (Carvalho et al., 2022). Similarly, Bordin et al. (2019) demonstrated that CO2-rich waters at the surface increase pCO2, even at lower temperatures. During the 2019 winter cruise, the combination of enhanced vertical mixing and the presence of SACW likely increased surface carbon, raising pCO2 despite cooler temperature. In this context, variations in total alkalinity further modulate the signal: lower total alkalinity in river-influenced sectors reduces buffering and amplifies pCO2, whereas higher total alkalinity locally mitigates it. This interpretation is consistent with the temperature-normalized patterns and with regional total alkalinity–salinity relationships documented by Albuquerque et al. (2025). Together, these findings suggest that the observed homogenization of surface pCO2 in winter of 2019 resulted from an interplay of physical mixing, biological processes, and carbonate chemistry. However, full seasonal studies are still required to confirm these dynamics, and a complete carbonate-system decomposition (e.g., Kerr et al., 2024) will be addressed in future work.
4.3 Ocean–atmosphere FCO2
Several authors have discussed the importance of the South Atlantic Ocean region in the absorption of atmospheric CO2 (e.g., Ito et al., 2016; Lencina-Avila et al., 2016; Padin et al., 2010). During the study period, the SWAO area behaved as both a sink and a source of CO2 to the atmosphere. In the autumn of 2018, the shelf region acted as a weak source, and the open ocean region acted as a weak CO2 sink. However, during the winter of 2019, the region behaved as a CO2 source with some areas showing CO2 equilibrium. In general, open ocean region behaves as an ocean CO2 sink in the SWAO, whereas the shelf region is considered a CO2 source for the atmosphere during all seasons (Ito et al., 2005; Arruda et al., 2015). The same was found in our study in the autumn of 2018. In contrast, the transect region acted as a weak source of CO2 to the atmosphere during the winter of 2019, except in the SACW observed areas (Supplementary Tables S2, S3; Figure 4). Lencina-Avila et al. (2016) reported that the continental shelf region acted as a sink for atmospheric CO2 during the spring of 2011 in the southwestern Atlantic Ocean, with a mean flux of −0.5 ± 0.2 mmol CO2 m−2 d −1 in the shelf region and −3.1 ± 2.2 mmol CO2 m−2 d−1 in the open ocean region. The values found in this study were in accordance with those in the literature (Table 1) (e.g., Padin et al., 2010). These seasonal contrasts highlight only the large dynamics of the study region due to the intensity of physical processes (Lencina-Avila et al., 2016).
Table 1
| Area | Year | Season | FCO2 (mmol CO2 m−2 d −1) | Reference |
|---|---|---|---|---|
| Shelf region | 2018 | Austral autumn | 3.2 (1.6 – 9.9) (W14) |
This study – 34.5°S |
| 2019 | Austral winter | 2.4 (1.0 – 5.2) (W14) |
This study – 34.5°S | |
| 2011 | Austral spring | –0.001 ± 0.005 (W14) |
Carvalho et al., 2021 – 35°S | |
| 2011 | Austral spring | –0.5 ± 0.2 (W92) |
Lencina-Avila et al., 2016 – 35°S | |
| 2010 | Austral spring | 0.0 ± 1.1 (W92) |
Ito et al., 2016 – 34° to 34.9°S | |
| 2000 to 2008 | Austral autumn | −8.8 ± 7.4 (W92) |
Padin et al., 2010 – 31° to 40°S | |
| Open ocean | 2018 | Austral autumn | –2.5 (–3.8 – –1.1) (W14) |
This study – 34.5°S |
| 2019 | Austral winter | 1.2 (–0.1 – 3.7) (W14) |
This study – 34.5°S | |
| 2011 | Austral spring | –3.1 ± 2.2 (W92) |
Lencina-Avila et al., 2016 – 35°S | |
| 2000 to 2008 | Austral autumn | −6.0 ± 5.8 (W92) |
Padin et al., 2010 – 31° to 40°S |
Average or median air-sea fluxes of CO2 (FCO2; mmol CO2 m−2 d −1) with standard deviation or interquartile, season and year from several studies along 34.5°S and the surrounding area.
W14 and W92 correspond to the equations used by Wanninkhof 2014 and Wanninkhof 1992.
When compared to climatological estimates, our observations show broadly consistent magnitudes. For the open ocean region, Fay et al. (2024) reported climatological fluxes of ~ – 3 mmol m-² d-¹ in April (autumn) and ~ –5 mmol C m-² d-¹ in June (winter), with an annual mean flux at 35°S/54–44°W of –1.94 mol m-² yr-¹. However, our results diverge from these climatological means, particularly in winter of 2019 when a CO2 source was observed instead of the expected sink. This highlights that while climatologies are useful for large-scale generalizations, they may smooth out short-term or mesoscale variability, underscoring the importance of high-resolution regional observations to accurately represent local carbon dynamics, which are still sparse in this dynamic region (Affe et al., 2023).
The contrast in air–sea CO2 fluxes between the autumn of 2018 and winter of 2019 reflects the interplay among thermal structure, freshwater inputs, and wind forcing. The relatively warm surface temperatures (>21°C) and constant moderate wind speeds (~10 m s–1) likely maintained stratification and limited vertical mixing, while allowing for localized biological CO2 uptake offshore in autumn. In winter, however, colder waters and pronounced PPW intrusion (SST < 19°C; SSS < 30) spread over the continental shelf, altering surface water chemistry, as already observed by Albuquerque et al. (2025). Concurrently, stronger and more variable wind speeds (with values >15 m s–1) increased the gas transfer velocity and promoted deeper mixing, reducing the pCO2 gradient and leading to near-equilibrium conditions along the shelf region. The heterogeneity in the SST and SSS, also evident in CMEMS data, supports the influence of mesoscale dynamics and water mass mixing in shaping these seasonal differences. The heterogeneity in the SST and SSS, also evident in CMEMS data, supports the influence of mesoscale dynamics and water mass mixing in shaping these seasonal differences. During winter 2019, strong gradients of SST and SSS along ~36–38°S (Figure 2) were linked to frontal zones and cyclonic eddies, while at ~34–35°S (Figure 3) the influence of PPW further contributed to the observed variability.
Surface pCO2 distribution with a similar spatial structure farther south in the SWAO was also reported along the COSTAL-AR section (Berghoff et al., 2023), where three distinct systems were identified. Their study found significant differences in FCO2 between these domains and in different seasons. In both cases, high average FCO2 values were observed in the coastal zone, with minimum values occurring near the shelf-break front, followed by an increase in offshore waters. These observations support the hypothesis that horizontal gradients in pCO2 are shaped by shelf−ocean exchange and frontal dynamics and reinforce the idea that the shelf-break may act as a biogeochemical transition zone. Our findings align with this spatial pattern, particularly the tendency for lower pCO2 and fluxes near the open ocean in the autumn of 2018 and more homogenized values in winter of 2019.
The observed pCO2 dynamics reinforce the variable behavior of the southwestern Atlantic Ocean, which can act as both a sink and a source of CO2, tending towards CO2 equilibrium, depending on the season and the dominant processes. Lefèvre et al. (2010) highlighted this variability, indicating that the waters of the South Atlantic Ocean respond rapidly to changes in water masses and the influence of the BMC. Furthermore, this seasonal variation alternating between periods of CO2 uptake and release depends on the SST, riverine influence and upwelling (Landschützer et al., 2016).
In addition, lower temperatures can promote the uptake of CO2 through the solubility pump. This process may have contributed to the in gassing of CO2 in the open ocean region during both seasons, as demonstrated by Ito et al. (2005) and Lencina-Avila et al. (2016).
The coastal zone receives larger inputs of nutrients and organic matter because of the greater contribution from the continent (rivers, runoff, and groundwater discharge) (Möller et al., 2008). In addition to the influence of the plumes of the Plata River and Patos Lagoon on the supply of nutrients, Carvalho et al. (2021) reported that physical instability at the water surface and relatively cold water tend to increase phytoplankton permanence in the euphotic zone and favor the dominance of diatoms close to 35°S latitude. Therefore, high pCO2 values are generally observed in shelf water and waters and are influenced by both the physical dynamics of the BC and biological processes (Ito et al., 2016). While photosynthesis tends to lower pCO2, respiration and remineralization in productive shelf environments often enhance carbon concentrations and increase pCO2 values. In the SWAO shelf, this balance is further modulated by nutrient supply from upwelling and riverine input, which can stimulate biological production and subsequently reduce pCO2 at longer timescales. Our observations suggest that, during the study period, the net effect of physical dynamics and remineralization dominated, leading to higher pCO2 in shelf waters. Furthermore, carbon inputs from continents may be associated with groundwater from Patos Lagoon, since records in this region of groundwater discharge represent a potentially important source of dissolved nutrients to the coastal ocean (Souza et al., 2021). Once on the coast, this groundwater can mix with the PPW and influence the pCO2.
Upwelling and deep mixing processes can indeed contribute to the elevated pCO2 values observed in winter. These processes bring subsurface waters, enriched in carbon due to remineralization at depth, to the surface. The excess of carbon increases surface pCO2, often offsetting the cooling effect that would otherwise lower pCO2 in winter. Moreover, the stronger winds typical of this season enhance vertical mixing and air–sea gas exchange, favoring CO2 outgassing. The formation of the western SACW in this area enhances this effect (Liu and Tanhua, 2021). Similar mechanisms have been described for other upwelling systems and regions influenced by the SACW (e.g., Ito et al., 2016; Azar et al., 2021). Thus, the high pCO2 observed during our winter cruise may reflect the combined effect of deep-water ventilation and physical forcing.
Hydrodynamic processes, including mesoscale eddies, influence the regional variability in surface ocean pCO2 (Orselli et al., 2019). Along the transect, in both campaigns, the normalized pCO2 results indicate that this parameter is strongly dependent on the SST. The presence of cyclonic eddies in the region (Figure 2), detected from satellite-derived current velocities, suggests that these structures may be associated with variations in pCO2. Cyclonic eddies are characterized in the Southern Hemisphere by clockwise rotation and low-pressure centers, displacing the isopycnals upwards, thus presenting a typical signature of cooling of the sea surface (e.g., Azevedo and Mata, 2010; Talley et al., 2011). Therefore, they are associated with negative heat flux anomalies, which means that in the regions where they can be identified, the ocean takes up heat from the atmosphere and thus tends to cool the atmospheric boundary layer (Villas Bôas et al., 2015). Furthermore, the solubility of CO2 in seawater is greater when the water is cold and less salty. Consequently, cyclonic eddies increase the solubility of CO2 (Figure 2) (Smith et al., 2023), changing the pCO2 values, where cooler SST within the eddy core coincided with higher pCO2 compared to surrounding waters.
4.4 Mesoscale dynamics
The surface velocity field significantly differed between the two campaigns. In 2018, the BC region displayed more intense activity, extending its influence farther south to the BMC region. Upon reaching the BMC, the BC underwent retroflection, generating a coastward jet that changes course northwards near 48°W, reaching the SAMBAR transect. In 2019, the BC region was weaker than that in 2018, and the velocity field along with the sea surface height anomaly was characterized by multiple smaller vortical structures (Figure 5). Two cyclonic eddies, centered at 51°W 36°30’S and 48°W 35°30’S, present temperatures lower than 18 °C. This spatial variation suggests the influence of physical processes, such as upwelling and horizontal advection. Thus, the BC ocean boundary and its anticyclones are associated with positive sea surface height anomalies. Additionally, cyclonic vortices are characterized by negative sea surface height anomalies (Angel-Benavides et al., 2016; Carvalho et al., 2019) due to the upwelling of cold water (McGillicuddy and Robinson, 1997) and consequent thermal contraction in their interior. This spatial variation suggests the influence of physical processes, such as upwelling and horizontal advection.
Lencina-Avila et al. (2016) identified vortices in the region (open ocean) that promote the absorption of atmospheric CO2 through vertical and horizontal mixing processes and suggested the influence of frontal structures along the subtropical convergence region. This agrees with the results of this study for the open ocean in both periods. This finding reinforces our suggestion that mesoscale structures influence pCO2 dynamics in the study area along 34.5°S. Furthermore, Orselli et al. (2019) reported that eddies in the Agulhas region act as CO2 sinks in the South Atlantic Ocean. The authors explain that cyclonic structures can act in the upwelling of CO2-rich water masses, behaving as a source of CO2 to the atmosphere, despite the presence of anticyclonic vortices acting as CO2 sink zones. This means that the presence of a vortex near the transect region may affect the sink capacity of the southwestern Atlantic Ocean. However, a more detailed investigation should be performed to verify this conclusion.
5 Conclusion
In this study, the variations in surface ocean pCO2 and net CO2 fluxes at the ocean–atmosphere interface at 34.5°S in the SWAO during the autumn of 2018 and winter of 2019 were evaluated. Water mass distributions and physicochemical properties on the sea surface, which are strongly associated with seasonal variation, were considered in the spatial assessment of pCO2. The shelf region acted as a source, whereas the open sea tended towards a weak sink of CO2 in the autumn of 2018. In the winter of 2019, CO2 was predominantly weakly released into the atmosphere, both in the open ocean and on the continental shelf, while it was expected that it would act as a sink. In addition, a relatively strong CO2 sink area was observed ~48°W, where wind speeds with 10 m s–1 were also observed. This highlights that while climatologies are useful for largescale generalizations, they may smooth out short-term or mesoscale variability, underscoring the importance of high-resolution regional observations to accurately represent local carbon dynamics. This study contributes to the understanding of how different mechanisms lead to CO2 exchanges in the outer shelf and open ocean waters in the southwestern Atlantic Ocean. This knowledge provides support for establishing the influence of each factor involved in carbon exchange (e.g., thermal effects and hydrodynamic processes) while considering spatial and seasonal gradients, in addition to contributing to the quantification of the global carbon cycle. For this reason, we suggest further studies of biogeochemical parameters to better understand the variation in pCO2 and its influences.
Statements
Data availability statement
The original contributions presented in the study are included in the article/Supplementary Material. Further inquiries can be directed to the corresponding author.
Author contributions
CA: Software, Conceptualization, Methodology, Investigation, Writing – original draft. GM: Investigation, Methodology, Writing – original draft, Formal analysis, Software, Data curation. JL-A: Writing – review & editing, Conceptualization, Investigation. LP: Writing – review & editing, Supervision, Conceptualization, Investigation. HM: Formal analysis, Methodology, Conceptualization, Investigation, Writing – review & editing. AF: Writing – review & editing, Data curation, Methodology. EP: Writing – review & editing, Methodology, Software, Investigation, Conceptualization. LA-N: Writing – review & editing, Methodology, Software, Data curation, Validation. EC: Resources, Funding acquisition, Project administration, Writing – review & editing. LC: Visualization, Investigation, Project administration, Conceptualization, Resources, Funding acquisition, Writing – original draft, Supervision.
Funding
The author(s) declare financial support was received for the research and/or publication of this article. This study was financed in part by the Coordenação de Aperfeiçoamento de Pessoal de Nível Superior – Brasil (CAPES) – Finance Code 001, with a Master fellowship to GCM. The dataset analysed in this study is part of the SAMBAR project (Variabilidade interanual dos transportes meridionais através da rede transatlântica Samoc, process n° 17/09659-6, financed by Fundação de Amparo à Pesquisa do Estado de São Paulo – FAPESP). We acknowledge the contributions of Ms. Camilla Caetano and Ms. Julia Arouca for measuring underway surface ocean pCO2 during the 2 sampling campaigns, Fundação Carlos Chagas Filho de Amparo à Pesquisa do Estado do Rio de Janeiro (FAPERJ) for the fellowships awarded to Julia Arouca, the whole crew at RV Alpha Crucis for the onboard physicochemical data and SAMBAR campaigns, and Rede Nacional de Observação e Monitoramento Oceânico (RENOMO – financed by Conselho Nacional de Desenvolvimento Científico e Tecnológico – CNPq – process n° 409666/2022-0). LQP, AMF and LCC acknowledge the Prociência/UERJ+FAPERJ Scholarship Program. LCC acknowledges the CNPq-PQ2 309708/2021-4 and FAPERJ-CNE E-26/201.156/2022 grants.
Conflict of interest
The authors declare that the research was conducted in the absence of any commercial or financial relationships that could be construed as a potential conflict of interest.
Generative AI statement
The author(s) declare that no Generative AI was used in the creation of this manuscript.
Any alternative text (alt text) provided alongside figures in this article has been generated by Frontiers with the support of artificial intelligence and reasonable efforts have been made to ensure accuracy, including review by the authors wherever possible. If you identify any issues, please contact us.
Publisher’s note
All claims expressed in this article are solely those of the authors and do not necessarily represent those of their affiliated organizations, or those of the publisher, the editors and the reviewers. Any product that may be evaluated in this article, or claim that may be made by its manufacturer, is not guaranteed or endorsed by the publisher.
Supplementary material
The Supplementary Material for this article can be found online at: https://www.frontiersin.org/articles/10.3389/fmars.2025.1623344/full#supplementary-material
References
1
Affe H. M. J. Rocha D. S. B. Piedras F. R. Moser G. A. O. Araujo M. C. da Cunha L. C. (2023). ) Sea-air CO2 fluxes along the Brazilian continental margin. Ocean Coast. Res. 71. doi: 10.1590/2675-2824071.22051hmdja
2
Albuquerque C. Miguel G. Faria C. O. Pinho L. Marotta H. Orselli I. B. M. et al . (2025). Regional relationship between total alkalinity and salinity in the surface waters of the western South Atlantic margin. Regional Stud. Mar. Sci.81, 103992. doi: 10.1016/j.rsma.2024.103992
3
Angel-Benavides I. M. Pilo G. S. Dias F. B. Garcia C. A. (2016). Influência de vórtices na concentração de clorofila da confluência Brasil-Malvinas: Mecanismos inferidos por sensoriamento remoto. Braz. J. Aquat. Sci. Technology.20, 10–20. doi: 10.14210/bjast.v20n1.4782
4
Arruda R. Calil P. H. Bianchi A. A. Doney S. C. Gruber N. Lima I. et al . (2015). Air-sea CO2 fluxes and the controls on ocean surface pCO2 seasonal variability in the coastal and openocean southwestern Atlantic Ocean: a modeling study. Biogeosciences.12, 5793–5809. doi: 10.5194/bg-12-5793-2015
5
Azar E. Piñango A. Wallner-Kersanach M. Kerr R. (2021). Source waters contribution to the tropical Atlantic central layer: New insights on the Indo-Atlantic exchanges. Deep-Sea Res. Part II: Oceanographic Res. Papers168, 103450. doi: 10.1016/j.dsr.2020.103450
6
Azevedo J. L. L. Mata M. M. (2010). O mecanismo de autopropulsão de vórtices oceânicos: uma revisão. Rev. Bras. Geofísica.28, 331–347. doi: 10.1590/S0102-261X2010000300002
7
Bakker D. C. E. Alin S. R. Bates N. Becker M. Gkritzalis T. Jones S. et al . (2024). Surface Ocean CO2 Atlas Database Version 2024 (SOCATv2024) (NCEI Accession 0293257) ( NOAA National Centers for Environmental Information). doi: 10.25921/9wpn-th28
8
Bakker D. C. E. Pfeil B. Landa C. S. Metzl N. O’Brien K. N. Olsen A. et al . (2016). A multi-decade record of high quality fCO2 data in version 3 of the Surface Ocean CO2 Atlas (SOCAT). Earth System Sci. Data.8, 383–413. doi: 10.5194/essd-8-383-2016
9
Berghoff C. F. Pierrot D. Epherra L. Silva R. I. Segura V. Negri R. M. et al . (2023). Physical and biological effects on the carbonate system during summer in the Northern Argentine Continental Shelf (Southwestern Atlantic). J. Mar. Syst.237, 103828. doi: 10.1016/j.jmarsys.2022.103828
10
Bianchi A. A. Giulivi C. F. Piola A. R. (1993). Mixing in the Brazil-Malvinas confluence. Deep Sea Res. Part I: Oceanographic Res. Papers.40, 1345–1358. doi: 10.1016/0967-0637(93)90115-J
11
Bianchi A. A. Ruiz-Pino D. Perlender H. G. I. Osiroff A. P. Segura V. Lutz V. et al . (2009). Annual balance and seasonal variability of sea-air CO2 fluxes in the Patagonia Sea: their relationship with fronts and chlorophyll distribution. J. Geophysical Res.114, 1345-1358. doi: 10.1029/2008JC004854
12
Boot A. Heydt A. S. V. Dijkstra H. A. (2022). Effect of the Atlantic Meridional Overturning Circulation on atmospheric pCO2 variations. Earth System Dynamics.13, 1041–1058. doi: 10.5194/esd-13-1041-2022
13
Bordin L. H. MaChado E. C. Carvalho M. Freire A. S. Fonseca A. L. D. O. (2019). Nutrient and carbon dynamics under the water mass seasonality on the continental shelf at the South Brazil Bight. J. Mar. Systems.189, 22–35. doi: 10.1016/j.jmarsys.2018.09.006
14
Brandini F. P. Tura P. M. Santos P. P. G. M. (2018). Ecosystem response to biogeochemical fronts in the South Brazil Bight. Progress in Oceanography164, 52-62. doi: 10.1016/j.pocean.2018.04.012
15
Campos E. J. D. Gonçalves J. E. Ikeda Y. (1995). Water mass characteristics and geostrophic circulation in the South Brazil Bight: Summer of 1991. J. Geophysical Res.100, 18537. doi: 10.1029/95JC01724
16
Carvalho A. C. O. Kerr R. Mendes C. R. B. Azevedo J. L. L. Tavano V. M. (2021). Phytoplankton strengthen CO2 uptake in the South Atlantic Ocean. Prog. Oceanography190, 102476. doi: 10.1016/j.pocean.2020.102476
17
Carvalho A. C. O. Kerr R. Tavano V. M. Mendes C. R. B. (2022). The southwestern South Atlantic continental shelf biogeochemical divide. Biogeochemistry.159, 139–158. doi: 10.1007/s10533-02200918-8
18
Carvalho A. C. O. Mendes C. R. B. Kerr R. Azevedo J. L. L. Galdino F. Tavano V. M. (2019). ) The impact of mesoscale eddies on the phytoplankton community in the South Atlantic Ocean: HPLC-CHEMTAX approach. Mar. Environ. Res.144, 154-165. doi: 10.1016/j.marenvres.2018.12.003
19
Castro B. M. d Miranda L. B. d (1998). “ Physical oceanography of the western Atlantic continental shelf located between 4 N and 34 S,” in The sea, vol. 11. ( John Wiley & Sons, New York), 209–251.
20
Chelton D. B. Schlax M. G. Witter D. L. Richmann J. G. (1990). GEOSAT altimeter observations of the surface circulation of the Southern Ocean. J. Geophysical Res.95, 877–903. doi: 10.1029/jc095ic10p17877
21
Chidichimo M. P. Perez R. C. Speich S. Kersalé M. Sprintall J. Dong S. et al . (2023). Energetic overtuning flows, dynamic interocean exchanges, and ocean warming observed in the South Atlantic. Communication Earth Environ.4, 10. doi: 10.1038/s43247-022-00644-x
22
Chidichimo M. P. Piola A. R. Meinen C. S. Perez R. C. Campos E. J. D. Dong S. et al . (2021). Brazil current volume transport variability during 2009–2015 from a long-term moored array at 34.5 °S. J. Geophysical Research: Oceans126, e2020JC017146. doi: 10.1029/2020JC017146
23
Combes V. Matano R. P. (2014). Trends in the Brazil/Malvinas confluence region. Geophysical Res. Letters.41, 8971–8977. doi: 10.1002/2014GL062523
24
D'Agostino R. B. Pearson E. S. (1973). Tests for departure from normality. Biometrika.60, 613–622. doi: 10.1093/biomet/60.3.613
25
De Souza A. G. Q. Kerr R. Azevedo J. L. L. (2018). On the influence of subtropical mode water on the south atlantic ocean. J. Mar. System185, 13–24. doi: 10.1016/j.jmarsys.2018.04.006
26
FAPESP (Fundação de Amparo à Pesquisa do Estado de São Paulo) Grant 2018/09659-6; Cruise Report - Interannual Variability of the Meridional Transports across the SAMOC Basin-wide Array (SAMBAR). Available online at: https://inct.furg.br/images/Cruise_Report_SAM15_SAMBAR_A1_Low_Res.pdf (Accessed November 29, 2019).
27
FAPESP (Fundação de Amparo à Pesquisa do Estado de São Paulo) Grant 2019/09659-6; Cruise Report - Interannual Variability of the Meridional Transports across the SAMOC Basin-wide Array (SAMBAR). Available online at: https://www.bodc.ac.uk/resources/inventories/cruise_inventory/reports/alphacrucis_sambar_a2.pdf (Accessed November 29, 2019).
28
Fay A. R. Munro D. R. McKinley G. A. Pierrot D. Sutherland S. C. Sweeney C. et al . (2024). Updated climatological mean ΔfCO2 and net sea–air CO2 flux over the global open ocean regions. Earth System Sci. Data.16, 2123–2139. doi: 10.5194/essd-16-2123-2024
29
Fernandes T. F. Peixoto R. B. Queiroz Pinho L. da Cunha L. C. Veloso Franklin T. Pollery R. C. et al . (2025). Eutrophication triggers diel and seasonal shifts of carbon dioxide and oxygen in tropical urban coastal waters. Limnology Oceanography Letter.10, 329–339. doi: 10.1002/lol2.70006
30
Friedlingstein P. O'Sullivan M. Jones M. W. Andrew R. M. Hauck J. Landschüter P. et al . (2025). Global carbon budget 2024. Earth System Sci. Data.17, 965–1039. doi: 10.5194/essd-2024-519
31
Gallego M. A. Timmermann A. Friedrich T. Zeebe R. E. (2020). Anthropogenic intensification of surface ocean interannual pCO2 variability. Geophysical Res. Lett.47. doi: 10.1029/2020GL087104
32
Ito R. G. Garcia C. A. E. Tavano V. M. (2016). Net sea-air CO2 fluxes and modelled pCO2 in the southwestern subtropical Atlantic continental shelf during spring 2010 and summer 2011. Continental Shelf Res.119, 68–84. doi: 10.1016/j.csr.2016.03.013
33
Ito R. G. Schneider B. Thomas H. (2005). Distribution of surface fCO2 and air–sea fluxes in the Southwestern subtropical Atlantic and adjacent continental shelf. J. Mar. Systems.56, 227–242. doi: 10.1016/j.jmarsys.2005.02.005
34
Kerr R. Monteiro T. Orselli I. B. M. Tavano V. M. Mendes C. R. B. (2024). Sea-air CO2 exchanges, pCO2 drivers and phytoplankton communities in the southwestern South Atlantic Ocean during spring. Mar. Chem.267, 104472. doi: 10.1016/j.marchem.2024.104472
35
Kersalé M. Meinen C. S. Perez R. C. Le Hénaff M. Valla D. Lamont T. et al . (2020). Highly variable upper and abyssal overturning cells in the South Atlantic. Sci. Adv.6, eaba7573. doi: 10.1126/sciadv.aba7573
36
Landschützer P. Gruber N. Bakker D. C. E. (2016). Decadal variationsand trends of the global ocean carbon sink. Global Biogeochemical Cycles.0, 1396–1417. doi: 10.1002/2015GB005359
37
Lefèvre N. Diverrès D. Gallois F. (2010). Origin of CO2 undersaturation in the western tropical Atlantic. Tellus B: Chem. Phys. Meteorology.62, 595–607. doi: 10.1111/j.1600-0889.2010.00475.x
38
Lefèvre N. Veleda D. Hartman S. E. (2023). Outgassing of dominates in the coastal upwelling off the northwest African coast. Deep-Sea Res. Part I: Oceanographic Papers200, 104130. doi: 10.1016/j.dsr.2023.104130
39
Lencina-Avila J. M. Ito R. G. Garcia C. A. E. Tavano V. M. (2016). Sea-air carbon dioxide fluxes along 35 S in the South Atlantic Ocean. Deep Sea Res. Part I: Oceanographic Res. Papers.115, 175–187. doi: 10.1016/j.dsr.2016.06.004
40
Lima C. R. Mendes C. R. B. Tavano V. M. Detoni A. M. S. Secchi E. R. (2019). Chemotaxonomybased mapping of phytoplankton communities in the subtropical Southwestern Atlantic Ocean, with emphasis on the marine cyanobacterium Trichodesmium. Prog. Oceanography. 172, 77-88 doi: 10.1016/j.pocean.2019.01.008
41
Liu M. Tanhua T. (2021). Water masses in the Atlantic Ocean: characteristics and distributions. Ocean Science.17, 463–486. doi: 10.5194/os-17-463-2021
42
Liu J. Wang J. Wang X. Zhou Y. Hu R. Zhang H. (2025). Research on Atlantic surface pCO2 reconstruction based on machine learning. Ecol. Inf.87, 463–486. doi: 10.1016/j.ecoinf.2025.103094
43
Manta G. Speich S. Karstensen J. Hummels R. Kersalé M. Laxenaire R. et al . (2021). The South Atlantic meridional overturning circulation and mesoscale eddies in the first GO-SHIP section at 34.5°S. J. Geophysical Research: Oceans126, e2020JC016962. doi: 10.1029/2020JC016962
44
Martínez-Moreno J. Hogg A.M. England M. H. (2022). Climatology, seasonality, and trends of spatially coherent ocean eddies. J. Geophysical Research: Oceans127, e2021JC017453. doi: 10.1029/2021JC017453
45
Matthews H. D. Tokarska K. B. Nicholls Z. R. J. Rogelj J. Smith C. J. MacDougall A. H. (2020). Opportunities and challenges in using remaining carbon budgets to guide climate policy. Nat. Geoscience.13, 769–779. doi: 10.1038/s41561-020-00663-3
46
McGillicuddy D. J. Jr. Robinson A. R. (1997). Eddy-induced nutrient supply and new production in the Sargasso Sea. Deep Sea Res. Part I: Oceanographic Res. Papers44, 1427-1450. doi: 10.1016/S0967-0637(97)00024-1
47
Meinen C. S. Garzoli S. L. Perez R. C. Campos E. Piola A. R. Chidichimo M. P. et al . (2017). Characteristics and causes of Deep Western Boundary Current transport variability at 34.5° S during 2009–2014. Ocean Sci.13, 175–194. doi: 10.5194/os-13-175-2017
48
Meinen C. S. Speich S. Perez R. C. Dong S. Piola A. R. Garzoli S. L. et al . (2013). Temporal variability of the Meridional Overturning Cir culation at 34.5° S: Results from two pilot boundary arrays in the South Atlantic. J. Geophysical Research: Oceans118, 6461–6478. doi: 10.1002/2013JC009228
49
Meinen C. S. Speich S. Piola A. R. Ansorge I. Campos E. Kersalé M. et al . (2018). Meridional overturning circula tion transport variability at 34.5°S during 2009–2017: Baroclinic and barotropic f lows and the dueling influence of the boundaries. Geophysical Res. Letters.45, 4180–4188. doi: 10.1029/2018GL077408
50
Möller O. O. Jr Piola A. R. Freitas A. C. Campos E. J. D. (2008). The effects of river discharge and seasonal winds on the shelf off Southeastern South America. Continental Shelf Res.28, 1607–1624. doi: 10.1016/j.csr.2008.03.012
51
Moura-Falcão R. H. Silva-Cunha M. G. G. Borges G. C. P. Ferreira L. C. Farias G. B. AlbergariaBarbosa A. C. R. et al . (2024). Effects of environmental variability on phytoplankton structure, diversity and biomass at the Brazil-Malvinas Confluence (BMC). Anais da Academia Bras. Ciências. 96. doi: 10.1590/0001-3765202420230744
52
Nightingale P. D. Liss P. S. Schlosser P. (2000). Measurements of air-sea gas transfer during an open ocean algal bloom. Geophysical Res. Letters.27, 2117–2120. doi: 10.1029/2000GL011541
53
Orselli I. B. M. Goyet C. Kerr R. Azevedo J. L. L. Araujo M. Galdino F. et al . (2019). The effect of Agulhas Eddies on absorption and transport of anthropogenic carbon in the South Atlantic Ocean. Climate. doi: 10.3390/cli7060084
54
Padin X. A. Vázquez-Rodríguez M. Castaño M. Velo A. Alonso-Pérez F. Gago J. et al . (2010). Air-Sea CO2 fluxes in the Atlantic as measured during boreal spring and autumn. Biogeosciences.7, 1587–1606. doi: 10.5194/bg-7-1587-2010
55
Parc L. Bellenger H. Bopp L. Perrot X. Ho D. T. (2024). Global ocean carbon uptake enhanced by rainfall. Nat. Geosci.17, 851–857. doi: 10.1038/s41561-024-01517-y
56
Pérez F. F. Becker M. Goris N. Gehlen M. López-Mozos M. Tjiputra J. et al . (2024). An assessment of CO2 storage and sea-air fluxes for the Atlantic Ocean and Mediterranean Sea between 1985 and 2018. Global Biogeochemical Cycles38, e2023GB007862. doi: 10.1029/2023GB007862
57
Pezzi L. P. Souza R. B. Acevedo O. Wainer I. Mata M. M. Garcia C. A. et al . (2009). Multiyear measurements of the oceanic and atmospheric boundary layers at the Brazil-Malvinas confluence region. J. Geophysical Research: Atmospheres114, D19103. doi: 10.1029/2008JD011379
58
Pezzi L. P. Souza R. B. D. Dourado M. S. Garcia C. A. E. Mata M. M. Silva-Dias M. A. F. (2005). Ocean-atmosphere in situ observations at the Brazil-Malvinas Confluence region. Geophysical Res. Lett.32. doi: 10.1029/2005GL023866
59
Piola A. R. Campos E. J. D. Möller O. O. Charo M. Martinez C. M. (2000). Subtropical shelf front off eastern South America. J. Geophysical Res.105, 6566–6578. doi: 10.1029/1999JC000300
60
Resplandy L. Hogikyan A. Müller J. D. Najjar R. G. Bange H. W. Bianchi D. et al . (2024). A synthesis of global coastal ocean greenhouse gas fluxes. Global Biogeochemical Cycles38, e2023GB007803. doi: 10.1029/2023GB007803
61
Roobaert A. Laruelle G. G. Landschützer P. Gruber N. Chou L. Regnier P. (2019). The spatiotemporal dynamics of the sources and sinks of CO2 in the global coastal ocean. Global Biogeochemical Cycles.33, 1693–1714. doi: 10.1029/2019GB006239
62
Sabine C. L. Feely R. A. Gruber N. Key R. M. Lee K. Bullister J. L. et al . (2004). The oceanic sink for anthropogenic CO2. Science.305, 367–371. doi: 10.1126/science.1097403
63
Sarmiento J. L. Gruber N. (2006). Ocean biogeochemical dynamics (Princeton, NJ: Princeton University Press).
64
Schlitzer R. (2021). Ocean Data View. Available online at: https://odv.awi.de (Accessed March 12, 2018).
65
Siddiqui C. Rixen T. Lahajnar N. van der Plas A. K. Louw D. C. Lamont T. et al . (2023). Regional and global impact of CO2 uptake in the Benguela Upwelling System through preformed nutrients. Nat. Commun.14, 2582. doi: 10.1038/s41467-023-38208-y
66
Silveira I. C. A. d Schmidt A. C. K. Campos E. J. D. Godoi S. S. d Ikeda Y. (2000). A corrente do Brasil ao largo da costa leste brasileira. Rev. Bras. Oceanografia.48, 171–183. doi: 10.1590/S1413-77392000000200008
67
Smith T. G. Nicholson S.-A. Engelbrecht F. A. Chang N. Mongwe N. P. Monteiro P. M. S. (2023). The heat and carbon characteristicsof modeled mesoscale eddies in the South–East Atlantic Ocean. J. Geophysical Research: Oceans128, e2023JC020337. doi: 10.1029/2023JC020337
68
Souza G. K. Von Ahn C. M. E. Niencheski L. F. H. Andrade C. F. F. (2021). Effects of coastal lagoon water level groundwater fluxes of nutrients to the coastal zone of southern Brazil. J. Mar. Syst.213, 103459. doi: 10.1016/j.jmarsys.2020.103459
69
Takahashi T. Olafsson J. Goddard J. G. Chipman D. W. Sutherland S. C. (1993). Variação sazonal de CO2 e nutrientes nos oceanos superficiais de alta latitude: Um estudo comparativo. Global Biogeochemical Cycles.7, 843–878. doi: 10.1029/93GB02263
70
Takahashi T. Sutherland S. C. Chipman D. W. Goddard J. G. Ho C. Newberger T. et al . (2014). Climatological distributions of pH, pCO2, total CO2, alkalinity, and CaCO3 saturation in the global surface ocean, and temporal changes at selected locations. Mar. Chem.164, 95–125. doi: 10.1016/j.marchem.2014.06.004
71
Takahashi T. Sutherland S. C. Sweeney C. Poisson A. Metzl N. Tilbrook B. et al . (2002). Global sea–air CO2 flux based on climatological surface ocean pCO2, and seasonal biological and temperature effects. Deep Sea Res. Part II: Topical Stud. Oceanography.49, 1601–1622. doi: 10.1016/S09670645(02)00003-6
72
Takahashi T. Sutherland S. C. Wanninkhof R. Sweeney C. Feely R. A. Chipman D. W. et al . (2009). Climatological mean and decadal change in surface ocean pCO2, and net sea–air CO2 flux over the global oceans. Deep-Sea Res. Part II: Topical Stud. Oceanography.56, 554–577. doi: 10.1016/j.dsr2.2008.12.009
73
Talley L. Pickard G. Emery W. Swift J. (2011). Descriptive physical oceanography: an introduction (Boston: Elselvier).
74
Villas Bôas A. B. Sato O. T. Chaigneau A. Castelão G. P. (2015). The signature of mesoscale eddies on the air-sea turbulent heat fluxes in the South Atlantic Ocean. Geophysical Res. Letters.42, 1856–1862. doi: 10.1002/2015GL063105
75
Wang Z. Chen G. Ma C. Liu Y. (2023). Southwestern Atlantic oceans fronts detected from the fusion of the multi-source remote sensing data by a deep learning model. Front. Mar. Sci.10. doi: 10.3389/fmars.2023.1140645
76
Wanninkhof R. (1992). Relationship between wind speed and gas exchange over the ocean. J. Geophysical Research: Oceans97, 7373–7382. doi: 10.1029/92JC00188
77
Wanninkhof R. (2014). Relationship between wind speed and gas exchange over the ocean revisited. Limnology Oceanography: Methods12, 351–362. doi: 10.4319/lom.2014.12.351
78
Weiss R. F. (1974). Carbon dioxide in water and seawater: The solubility of a non-ideal gas. Mar. Chem.2, 203–215. doi: 10.1016/0304-4203(74)90015-2
79
Weiss R. F. Price B. A. (1980). Nitrous oxide solubility in water and seawater. Mar. Chem.8, 347–359. doi: 10.1016/0304-4203(80)90024-9
Summary
Keywords
air–sea CO2 fluxes, SAMOC, seasonality, partial pressure of CO2, subtropical South Atlantic Ocean, shelf region, open ocean
Citation
Albuquerque C, Miguel G, Lencina-Avila JM, Pinho L, Marotta H, Fernandes AM, Passos EN, Amora-Nogueira L, Campos E and Cotrim da Cunha L (2025) Linking surface pCO2 variability to physical processes along a continental shelf–ocean transect in the southwestern Atlantic Ocean during austral autumn and winter. Front. Mar. Sci. 12:1623344. doi: 10.3389/fmars.2025.1623344
Received
05 May 2025
Accepted
29 August 2025
Published
01 October 2025
Volume
12 - 2025
Edited by
Jose Martin Hernandez-Ayon, Autonomous University of Baja California, Mexico
Reviewed by
Solomon Dan, Beibu Gulf University, China; Nicolas Metzl, Centre National de la Recherche Scientifique (CNRS), France
Updates
Copyright
© 2025 Albuquerque, Miguel, Lencina-Avila, Pinho, Marotta, Fernandes, Passos, Amora-Nogueira, Campos and Cotrim da Cunha.
This is an open-access article distributed under the terms of the Creative Commons Attribution License (CC BY). The use, distribution or reproduction in other forums is permitted, provided the original author(s) and the copyright owner(s) are credited and that the original publication in this journal is cited, in accordance with accepted academic practice. No use, distribution or reproduction is permitted which does not comply with these terms.
*Correspondence: Cíntia Albuquerque, albuquerque.cintia@ce.uerj.br
Disclaimer
All claims expressed in this article are solely those of the authors and do not necessarily represent those of their affiliated organizations, or those of the publisher, the editors and the reviewers. Any product that may be evaluated in this article or claim that may be made by its manufacturer is not guaranteed or endorsed by the publisher.