 Yang Li1
 Hong Huang
 Zhuo-Yi Zhu
 Peng-Fei Cheng
 Xu Zhao
- 1College of Oceanography and Ecological Science, Shanghai Ocean University, Shanghai, China
- 2School of Oceanography, Shanghai Jiao Tong University, Shanghai, China
- 3The Observation and Research Station for Marine Risk and Hazard Management at Daya Bay, Ministry of Natural Resources, Huizhou, China
- 4College of Food Science and Engineering, Ningbo University, Ningbo, China
As integral components of global ecosystems, aquaculture ponds have received limited research attention regarding the fate and transformation of dissolved organic matter (DOM) in their wastewater. In this study, an incubation experiment was conducted to simulate the degradation of dissolved organic carbon (DOC) in Litopenaeus vannamei aquaculture wastewater under three conditions: photodegradation, biodegradation, and a combination of both photodegradation and biodegradation. We measured the concentration of DOC, the ultraviolet-visible absorbance, and the excitation-emission matrix (EEM) of aquaculture wastewater during the incubation. Based on the changes in DOC, we further estimated the upper limit of CO2 emissions from the aquaculture wastewater. The source of organic matter in the samples was identified by Parallel Factor Analysis (PARAFAC). Subsequently, Principal Component Analysis (PCA) was employed to reveal the differential effects of various degradation conditions on the composition of organic matter. The results demonstrated that under combined photodegradation and biodegradation, DOC in aquaculture wastewater exhibited a degradation rate of approximately 19% over 29 days. Based on this degradation efficiency, we estimated that the upper limit of CO2 emissions from the system amount to 0.7 kg CO2-eq per kg DOC, suggesting that aquaculture wastewater may act as a potential carbon source. Analysis of optical parameters revealed distinct roles of degradation mechanisms: light primarily altered the structural complexity of organic matter, whereas microorganisms directly reduced DOC concentrations and generated new metabolites. Fluorescence characterization via EEM combined with PARAFAC identified four components in the wastewater: C1 (microbial humic-like), C2 (terrestrial humic-like), C3 (autochthonous tyrosine-like) and C4 (terrestrial humic-like, distinct from C2 in spectral properties). PCA of 11 parameters in the incubation experiment showed that photodegradation weakened the stability and humification degree of organic matter, and produced products with simpler structures. Biodegradation has little effect on the stability and humification of organic matter, and is mainly characterized by the production of fresh low molecular weight (LMW) metabolites. The results of this study contribute to understanding the stability of DOC from aquaculture wastewater and reveal the differential effects of different degradation processes on organic matter composition, providing a basis for understanding the transformation pathways of organic matter in the environment.
1 Introduction
Global aquaculture expansion, driven by rising food demand, releases significant dissolved organic matter (DOM) into ecosystems. Aquaculture ponds, as important components of artificial ecosystems (Yang et al., 2020), release a large amount of easily bioavailable dissolved organic matter (DOM) into the environment through two pathways: leaching of surplus feed and excretion by farmed animals (Kamjunke et al., 2017). DOM serves as a key source of biologically available organic carbon, which not only sustains aquatic food webs but also attenuates light penetration in the water column. Furthermore, DOM mediates the transport and transformation of pollutants through complex biogeochemical interactions (Hansen et al., 2016). The changes in the quantity and composition of DOM over time and space mainly depend on its source and environmental treatment processes (Hansen et al., 2016). Firstly, from the perspective of sources, the DOM released during aquaculture mainly comes from feed and fish and shrimp excrement, which mainly contains fluorescent components of proteins (tryptophan and tyrosine) and humic components produced by microbial metabolism (Kamjunke et al., 2017; Li et al., 2024; Nimptsch et al., 2015; Ryan et al., 2022; Wang et al., 2021, 2017).
The main environmental treatment processes that affect the quantity and composition of DOM in water environments are photodegradation and biodegradation. DOM degradation usually leads to the conversion of DOM into inorganic compounds (i.e., CO2), loss of DOM from the water column, and changes in the chemical composition of DOM (Hansen et al., 2016). Biodegradation is primarily driven by heterotrophic microorganisms that metabolize labile low-molecular-weight (LMW) organic compounds, including proteins, carbohydrates, and organic acids (Mopper and Schultz, 1993; Moran and Zepp, 1997; Wetzel et al., 1995). This process also results in the production of high-molecular-weight (HMW) aromatic compounds, such as fulvic acid and humic acid (Repeta et al., 2002; Stepanauskas et al., 2005). Given the ubiquitous presence of microorganisms across Earth’s ecosystems, biodegradation is capable of proceeding in both photic and opaque zones. In contrast to biodegradation, photodegradation driven by solar radiation is predominantly confined to the photic zone of aquatic systems. This process photolytically cleaves HMW-DOM into LMW photo-labile compounds, which can then be removed from the water environment through the volatilization of carbon gas and the consumption of microorganisms (Mopper and Schultz, 1993; Moran and Zepp, 1997). Therefore, photodegradation enhances the biodegradation of DOM by cleaving HMW compounds into LMW substrates that are readily bioavailable to microorganisms. Since DOM released from aquaculture systems is predominantly protein-rich, it undergoes rapid bacterial degradation once discharged into rivers (Nimptsch et al., 2015). Such a shift from autotrophic to heterotrophic conditions in river ecosystems can trigger a surge in bacterial biomass and metabolic activity, leading to oxygen depletion and promoting harmful algal blooms (Hambly et al., 2015; Kamjunke et al., 2017). Furthermore, studies indicate that aquaculture wastewater releases DOC equivalent to 21% of feed carbon input and 76% of fish production biomass, potentially altering carbon cycling dynamics at the watershed scale (Nimptsch et al., 2015).
Quantifying DOM (commonly by measuring DOC concentration) and characterizing DOM are very important for studying the properties of DOM (Hansen et al., 2016). With the continuous development of analytical techniques, optical analysis is increasingly being applied to track DOM’s source and change process (Coble, 2007; Fellman et al., 2010; Gabor et al., 2014). Excitation-Emission Matrix (EEM), combined with Parallel Factors Analysis (PARAFAC), was widely used to identify and quantify the decomposed components. It has been employed to characterize fluorescent dissolved organic matter (FDOM) in recirculating aquaculture systems for fish or freshwater ponds, identifying protein-like and humic-like components (Hambly et al., 2015; Wang et al., 2021; Yamin et al., 2017).
Due to its rapid growth, strong stress resistance, and high aquaculture yield (Dai et al., 2023), Litopenaeus vannamei is one of the most prolifically farmed shrimp species in the global aquaculture industry (Chen et al., 2024; Liu et al., 2021). The corresponding Chinese production in 2022 reached 1.34 million tons, accounting for 80.7% of the total domestic shrimp production (Liu et al., 2023). In East China, ultra-high-density factory aquaculture for Litopenaeus vannamei are very common and typically use brackish waters. These ponds are accompanied by frequent (daily) wastewater drainage (Hambly et al., 2015; Wang et al., 2021; Yamin et al., 2017). As a relatively late emerging farming model, this type of farming activity currently receives limited attention. Studies have shown that the water and sediment in ponds containing Litopenaeus vannamei contain refractory dissolved organic carbon (RDOC), which has a certain carbon sequestration effect (Huang et al., 2024a, b). Thus, the aquaculture process effectively sequesters carbon input (primarily from feed) within the pond system. Furthermore, according to the research of Zheng et al. (2024), the drainage of aquaculture systems also functions as a nitrogen sink. This is primarily due to the presence of DOM, which impedes the removal of nitrogen and heavy metals from the drainage of aquaculture systems. This hinders water cycling and the achievement of net-zero discharge in aquaculture areas, especially when draining into surface waters. As reported by Hu et al. (2025), the “Three ponds, Two dams, One wetland” (3P-2D-1W) treatment system is widely used in China, which can effectively reduce DOC in aquaculture wastewater and thus reduce its impact on the environment. Although scientific treatment methods have effectively reduced the impact of aquaculture wastewater on the environment, a portion of the wastewater is inevitably discharged into the natural environment. Therefore, further research is needed on the dynamics and fate of DOM in aquaculture wastewater discharged into the environment. Against this background, the scientific questions are: (1) What is the stability of DOM derived from the ultra-high-density factory aquaculture pond under microbial degradation versus photodegradation? (2) How does the DOM composition change during incubation? To address these questions, we conducted incubation experiments using wastewater from Litopenaeus vannamei aquaculture systems to simulate the fate of DOM after drainage. We assessed DOM stability during degradation and employed optical techniques to track compositional changes throughout the incubation period.
2 Materials and methods
2.1 Study area
The study area is located in Xiangshan County, Ningbo City, Zhejiang Province, China (29°22’52”N, 121°48’56”E). The area has an average annual temperature of 18.2°C, annual precipitation of 1433 mm, and seawater salinity of 30.8‰. The region has a subtropical marine monsoon climate. The stocking density of high-density-intensive model (ranging from 600 to 1200 individuals/m²) is significantly higher than that of traditional methods (e.g., earth pond aquaculture). To maintain water quality, this model relies on frequent water exchange.
Each pond is approximately square, with length, width and depth of 5.85 m, 5.84 m and 1 m respectively. The bottom of the pond is covered with canvas. At the beginning of aquaculture, the pond water level is set to 70 cm, sourced from adjacent seawater. Dissolved oxygen (DO) concentration is maintained above 4.7 mg•L-1 through mechanical aeration devices. Prior to aquaculture initiation, seawater in the sedimentation tank was disinfected with 160 mg•L-1 bleaching powder. The treated seawater was pumped into the pond through filter bags. Before releasing shrimp seedlings, nutrients and Bacillus spp. were added to the pond, and water quality parameters (temperature, DO, pH, salinity.) were monitored to ensure suitability for shrimp growth. Approximately 19000 to 28000 shrimp postlarvae were stocked in each pond. Daily water exchange was conducted at 6:00, 10:00, 14:00, and 18:00 every day, with the volume and frequency adjusted according to pond water quality. The average daily water exchange rate reached 28% of the total water volume. Throughout the aquaculture period, water depth was maintained between 50 cm and 80 cm. After water exchange, shrimp are fed according to their growth stage, with an average daily feed of 2.49 kg (fresh weight basis) per pond.
2.2 The DOM incubation
During the pond drainage period, wastewater was filtered through precombusted GF/F membranes (450°C for 6 hours). The filtrate was collected in polyethylene bags (pre-treated with 10% hydrochloric acid for 24 hours and rinsed with ultrapure water). Currently, in situ seawater was collected as microbial inoculum. All samples were placed on ice and transported to the laboratory within 24 hours, and stored at 4°C until incubation. Samples of photodegradation and microbial degradation were collected during one sampling period, while samples of combined photodegradation and microbial degradation were collected during another sampling period.
Before the incubation experiment began, water samples were filtered through pre-sterilized polyethersulfone (PES) membranes (0.22 μm pore size) to remove microorganisms. The filtration device had been pre sterilized at 121°C for 20 minutes prior to use. The filtered water was thoroughly mixed and aliquoted into sterile transparent Polyethylene Terephthalate (PET) bottles (150 mL per bottle). The material has a transmittance of 88.8% ± 1.2% (n=3) for visible light and 80.7% ± 1.7% (n=3) for ultraviolet light. After aliquoting water samples for the photochemical degradation group (Group P), the bottles were immediately sealed with lids and placed in a well-lit outdoor area. For the biodegradation group (Group B), in situ seawater from the aquaculture site was added as a microbial inoculum at a volume ratio of 1:100 after sample aliquoting. The bottles were sealed with gas-permeable film to enable air exchange and incubated in a constant-temperature dark chamber at 25°C. For the combined photodegradation and biodegradation group (Group P+B), microbial inoculum was added at a volume ratio of 1:100 after aliquoting the water samples. Unlike the microbial degradation group, since the incubation occurred outdoors, the bottles were capped to prevent contamination and placed in an outdoor environment under natural light. Every three days, the bottles were opened, shaken thoroughly to replenish dissolved oxygen, and resealed.
Five replicate bottles were established for each group (Group P, Group B, and Group P+B). In the 29-day incubation experiment, sampling was conducted on days 0th, 2nd, 6th, 14th, and 29th of incubation. To avoid contaminating the incubation system, a sacrificial sampling strategy was adopted: only one bottle per group was sampled at each time, and each bottle was sampled only once during the incubation period. Three subsamples were collected from each sampled bottle.
2.3 Sampling and instrumental measurement
At each sampling time, the bottles were opened, and water was filtered through a disposable syringe with a 0.45 μm nylon filter. The filtrate was stored at −20°C until analysis. DOC concentrations were measured using a Total Organic Carbon Analyzer (TOC-L, Shimadzu, Japan), calibrated with the Deep Seawater Reference Material (Hansell Laboratory, University of Miami). Absorption spectra (200–800 nm, 0.5 nm intervals) were recorded on a UV-2600 spectrophotometer (Shimadzu, Japan) using a 10 cm quartz cell. Fluorescence excitation-emission matrices (EEMs) were obtained with an F-7000 spectrophotometer (Hitachi, Japan), scanning emission from 250 to 550 nm (1 nm intervals) and excitation from 240 to 450 nm (5 nm intervals). Milli-Q water served as the blank for all optical measurements.
2.4 Data processing
Nonlinear regression analyses were performed by Equation 1 proposed by Lønborg et al (Lønborg and Álvarez-Salgado, 2012), This equation describes DOM as two independent pools with unique reactivity:
where c is the final concentration of DOC; cRDOC (mg•L-1) is a residual pool at the end of incubation, and cLDOC (mg•L-1) is the difference between the initial concentrations of DOC and cRDOC, k (d-1) is the rate of DOC degradation, t (d) is the incubation time. RDOC is difficult to be biologically decomposed and used. It has the capacity of carbon sequestration on a millennium scale and is the most durable carbon pool on earth. Labile dissolved organic carbon (LDOC) is a substance that supports a large number of heterotrophic prokaryote populations and can be decomposed and utilized in a few hours to days (Jiao et al., 2010).
Optical parameters were calculated using absorbance and EEM results. a350 was calculated as described by Del Vecchio and Blough (Del Vecchio and Blough, 2004):
where Aλ is the absorbance of the sample at λ nm, and L is the path length in meters.
The specific ultraviolet absorbance at 254 nm (SUVA254) was calculated by dividing the ultraviolet absorbance coefficient at 254 nm by the DOC concentration (Weishaar et al., 2003).
The S275-295 was calculated by the Equation 3 (Stedmon et al., 2000):
where aλ and aλ0 are the absorption coefficients of the sample at wavelength λ and λ0, respectively, which are 275 nm and 295 nm.
The Fluorescence Index (FI) is defined as the ratio of fluorescence intensity at emission wavelengths (Em) 470 nm to 520 nm, measured at an excitation wavelength (Ex) of 370 nm (Cory et al., 2010). The Humification Index (HIX) is calculated as the peak area under the emission spectrum from Em 435–480 nm divided by the sum of the peak areas from Em 300–345 nm and Em 435–480 nm, all measured at Ex 254 nm (Ohno, 2002). The Biological Index (BIX) represents the ratio of fluorescence intensity at Em 380 nm to 430 nm, measured at Ex 310 nm (Huguet et al., 2009). The results of DOC and UV visible spectral parameters are the average values of three sets of repeated sub-samples (mean ± sd), while the fluorescence spectral parameters are the results of one set of samples.
Before conducting parallel factor analysis, the fluorescence excitation emission matrix data were preprocessed, including inner filter effect correction (using UV visible spectral data), removal of Raman and Rayleigh scattering, completing the missing parts by Delaunay triangulation interpolation, smoothing the figures by two-dimensional Gaussian kernel convolution, and normalizing the fluorescence intensity units (A.U.) to Raman units (R.U.) for fluorescence region integration calculation. A total of 25 samples participated in parallel factor analysis, and three abnormal samples were removed after outlier detection. The testing steps of PARAFAC include core consistency, explanation rate, sum of squares error, split half analysis, and factor match scores.
3 Results
3.1 Bulk DOC concentration changes
The initial concentration of DOC in Group P was 5.41 mg•L-1. It significantly increased to 6.01 mg•L-1 within 0-2 days, gradually decreased to 5.65 mg•L-1 during days 2 to 14, and then increased to 5.75 mg•L-1 during days 14 to 29 (Figure 1a). The concentration of DOC increased by 7.4% compared to the initial value. In contrast, DOC in Group B and Group P+B both showed a clear decreasing trend. The initial DOC in Group B was 5.61 mg•L-1. It gradually decreased to 4.43 mg•L-1 at 29 days (Figure 1a). The initial concentration of DOC in Group P+B was 12.60 mg•L-1. It continued to decline over incubation, being as low as 10.22 mg•L-1 at the end of incubation (Figure 1a). The most significant decrease occurred during days 0 to 2 (Figure 1a). Here, we define the decrement of DOC in Group B as BDOC (i.e., the biologically available fraction of DOC) and the decrement of DOC in Group P+B as LDOC (i.e., the labile fraction of DOC). Then the BDOC and LDOC accounted for 21.4% and 19.0% of the initial DOC, respectively (Figure 1a). Due to the synergistic effects of microbial degradation and photodegradation on aquaculture wastewater, this study focused on the DOC degradation process of Group P+B. Equation 1 fitting yielded the following results:
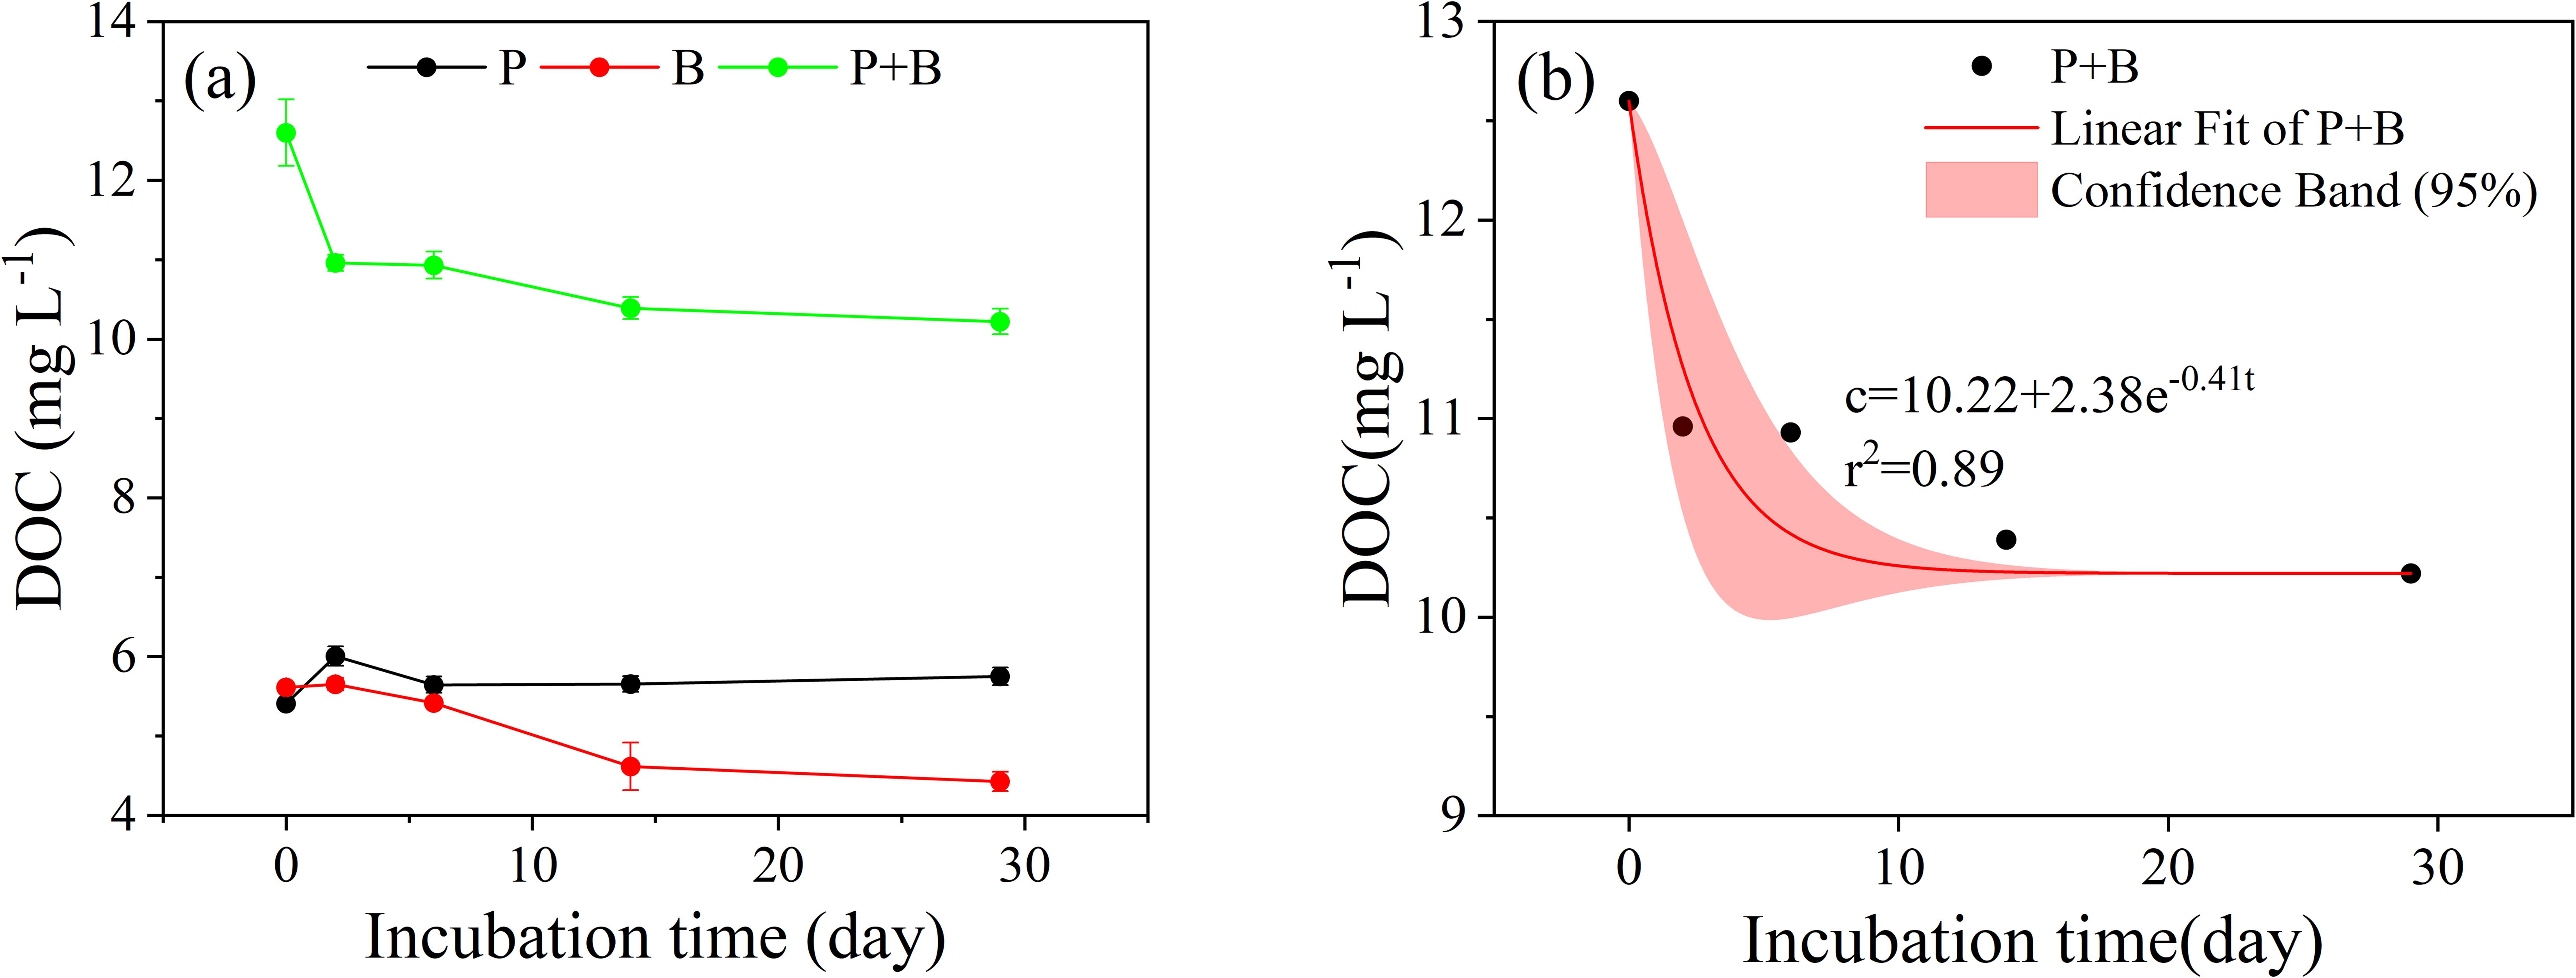
Figure 1. The raw pattern (a) and modeled change of bulk DOC (b) over the incubation (The samples of Group P and Group B were collected from the same sampling, while the samples of Group P+B were collected from another sampling).
3.2 Optical parameters
In Group P, the a350 of the samples was initially 5.26 m-1, and it decreased to 3.07 m-1 after incubation (Figure 2a). SUVA254 decreased from 1.47 L•mg-1•m-1 to 1.05 L•mg-1•m-1 during incubation, with the most significant decrease observed during days 0 to 2 (Figure 2b); S275-295 increased from 15.77 μm-1 to 24.22 μm-1 after incubation (Figure 2c); The initial value of FI was 2.26, and it decreased to 1.80 after incubation (Figure 2d), with the most significant decrease occurring days 0 to 2; HIX decreased from 0.61 to 0.31 during incubation (Figure 2e); The initial value of BIX is 0.86, which increased to 0.96 after incubation (Figure 2f).
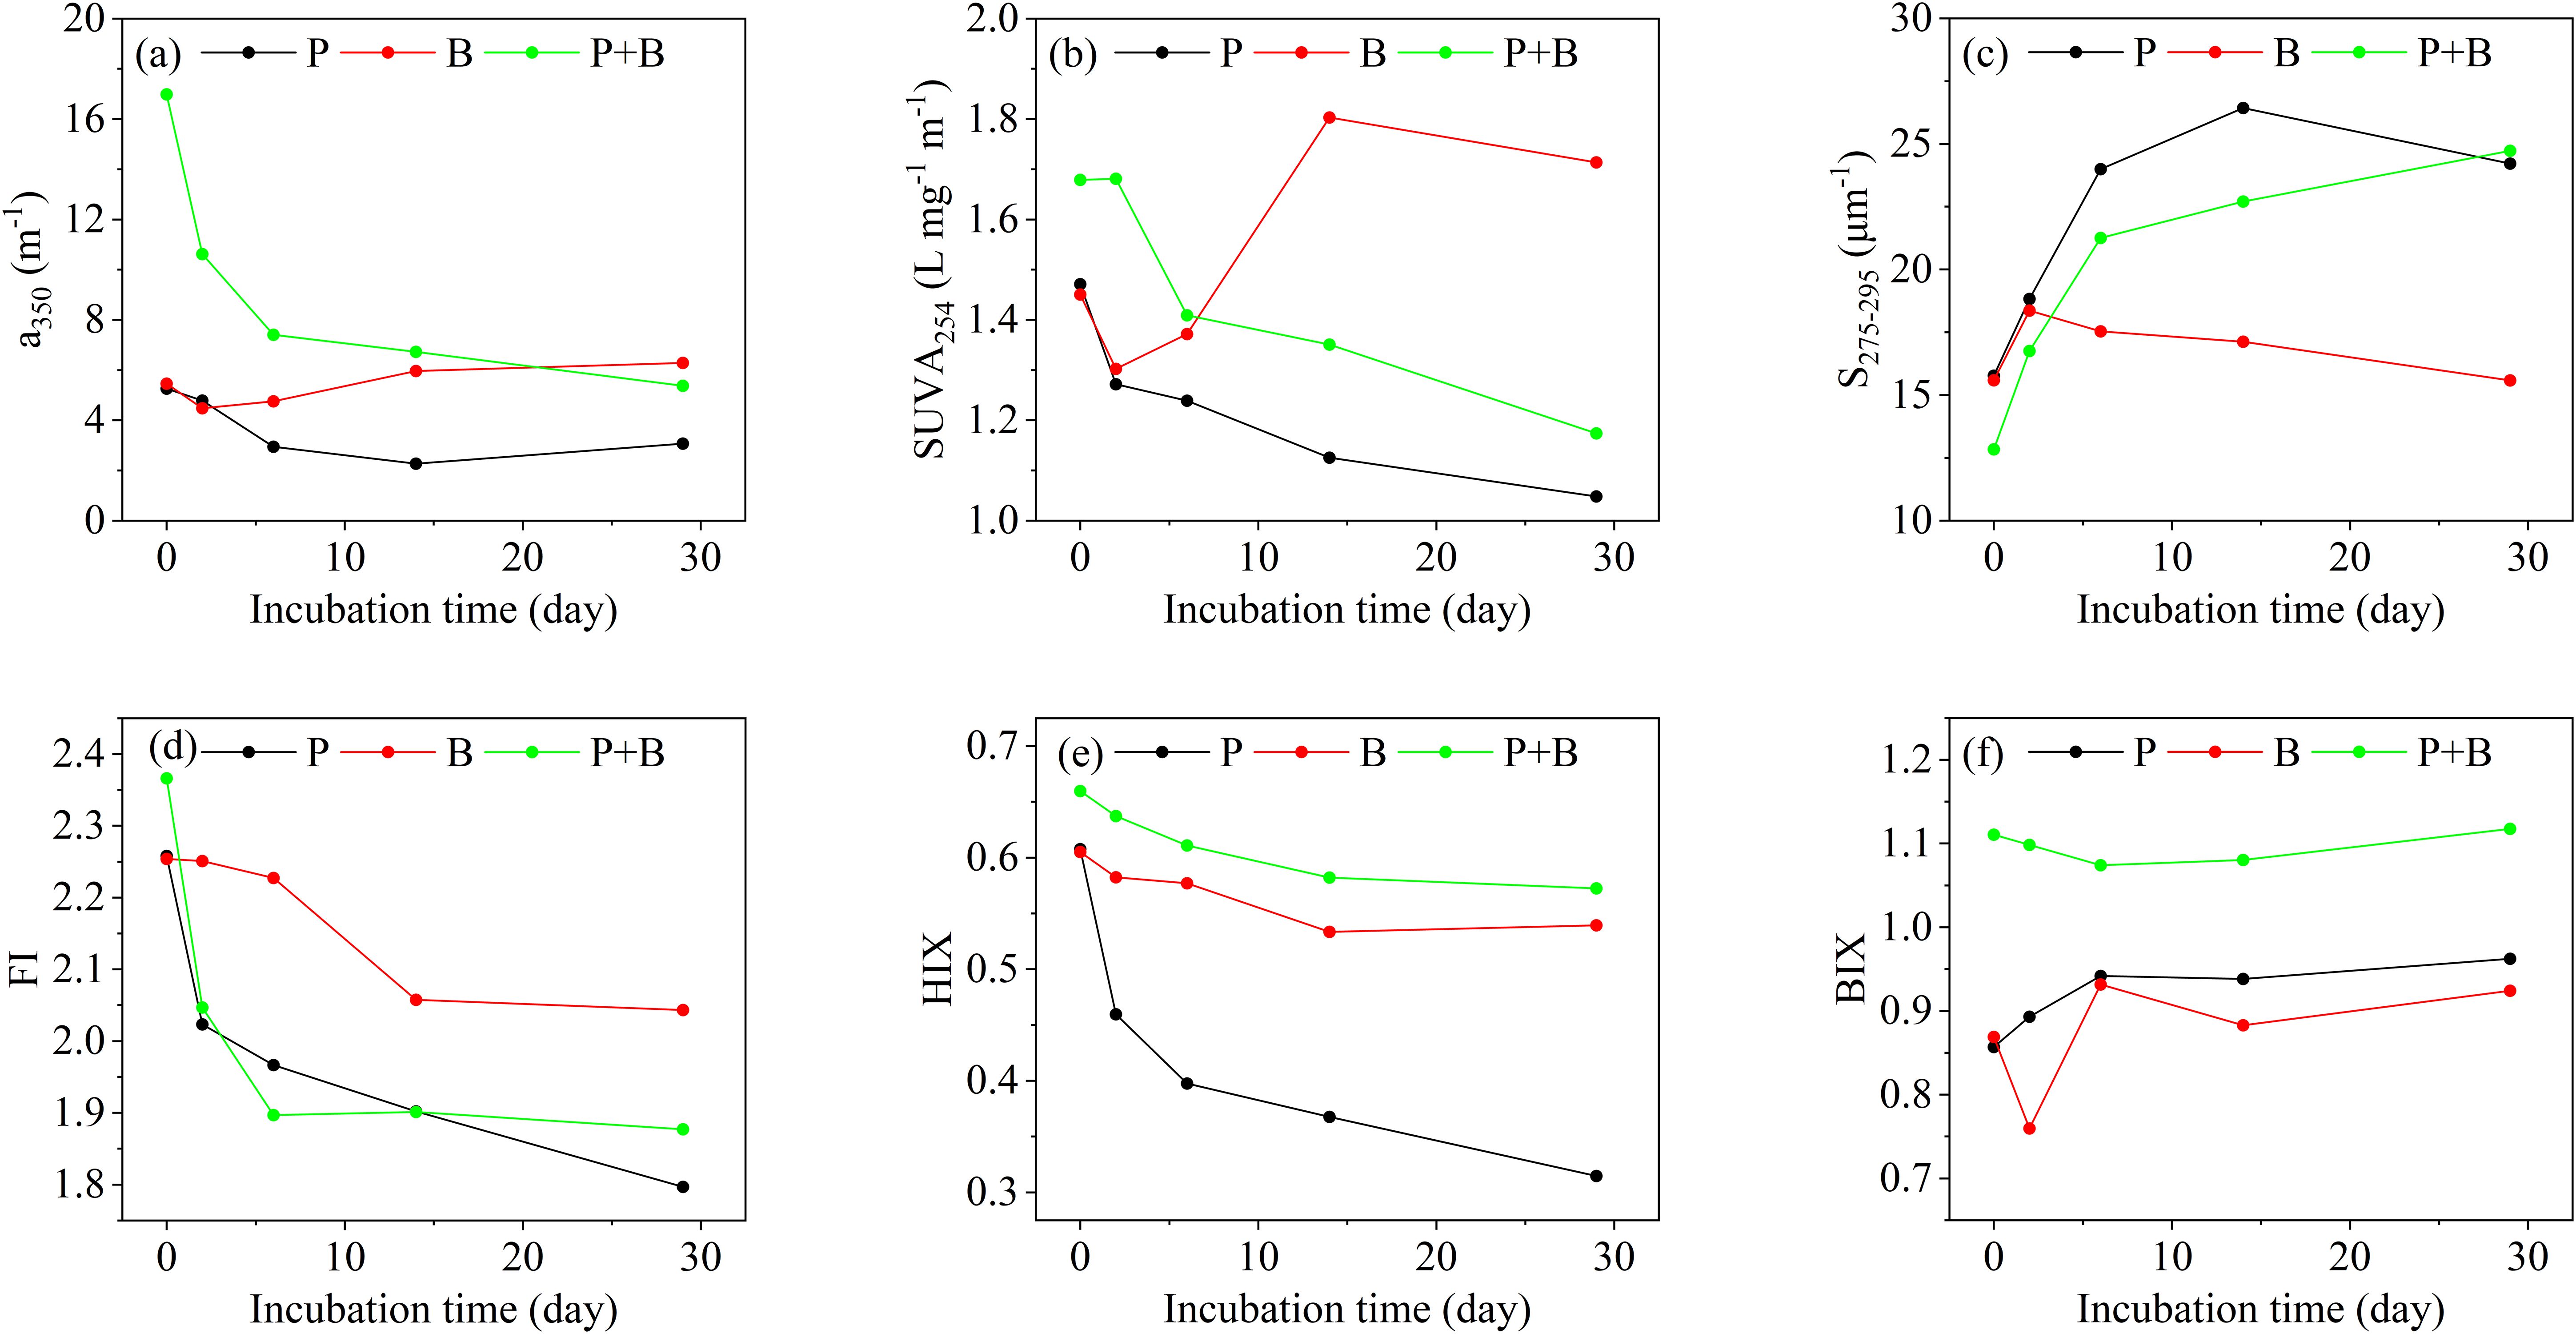
Figure 2. (a–f) Variation of optical parameters over the incubation (P: Group P; B: Group B; P+B: Group P+B).
In Group B, the a350 was initially 5.46 m-1, increasing to 6.29 m-1 after incubation (Figure 2a). The SUVA254 showed fluctuating changes, increasing from 1.45 L•mg-1•m-1 to 1.71 L•mg-1•m-1 (Figure 2b); S275-295 increased from 15.59 μm-1 to 18.36 μm-1 after 2 days, then decreased to 15.59 μm-1 after 29 days, which was the same as the initial value (Figure 2c); The initial value of FI was 2.25, which decreased to 2.04 after incubation (Figure 2d); HIX decreased from 0.61 to 0.54 after incubation (Figure 2e); BIX increased from 0.87 to 0.92 during incubation (Figure 2f).
In Group P+B, the a350 was initially 16.98 m-1, and it significantly decreased to 5.37 m-1 after incubation (Figure 2a); The SUVA254 decreased from 1.68 L•mg-1•m-1 to 1.17 L•mg-1•m-1 (Figure 2b); The initial value of S275-295 was 12.84 μm-1, which significantly increased to 24.73 μm-1 after incubation (Figure 2c); The initial FI was 2.37, and decreased to 1.88 after incubation (Figure 2d); HIX decreased from 0.66 to 0.57 during incubation (Figure 2e); BIX decreased from 1.11 to 1.07 during days 0-6, and then increased from 1.07 to 1.12 during days 6-29 (Figure 2f).
3.3 PARAFAC results
PARAFAC was conducted on the EEM of Litopenaeus vannamei aquaculture wastewater, and a 4-component model (C1-C4) was employed to characterize the DOM fluorescence properties across all samples (Figure 3). C1 showed an excitation maximum at Ex<240 nm, corresponding to the emission maxima at Em=389 nm. C2 exhibited three excitation maxima at Ex=250 nm, Ex=280 nm and Ex=330 nm and an emission maximum at Em=424 nm. C3 displayed an excitation maximum at Ex=275 nm and an emission maximum at Em=311 nm. C4 displayed an excitation maximum at Ex<240 nm and two emission maxima at Em=293 nm and Em=433 nm.
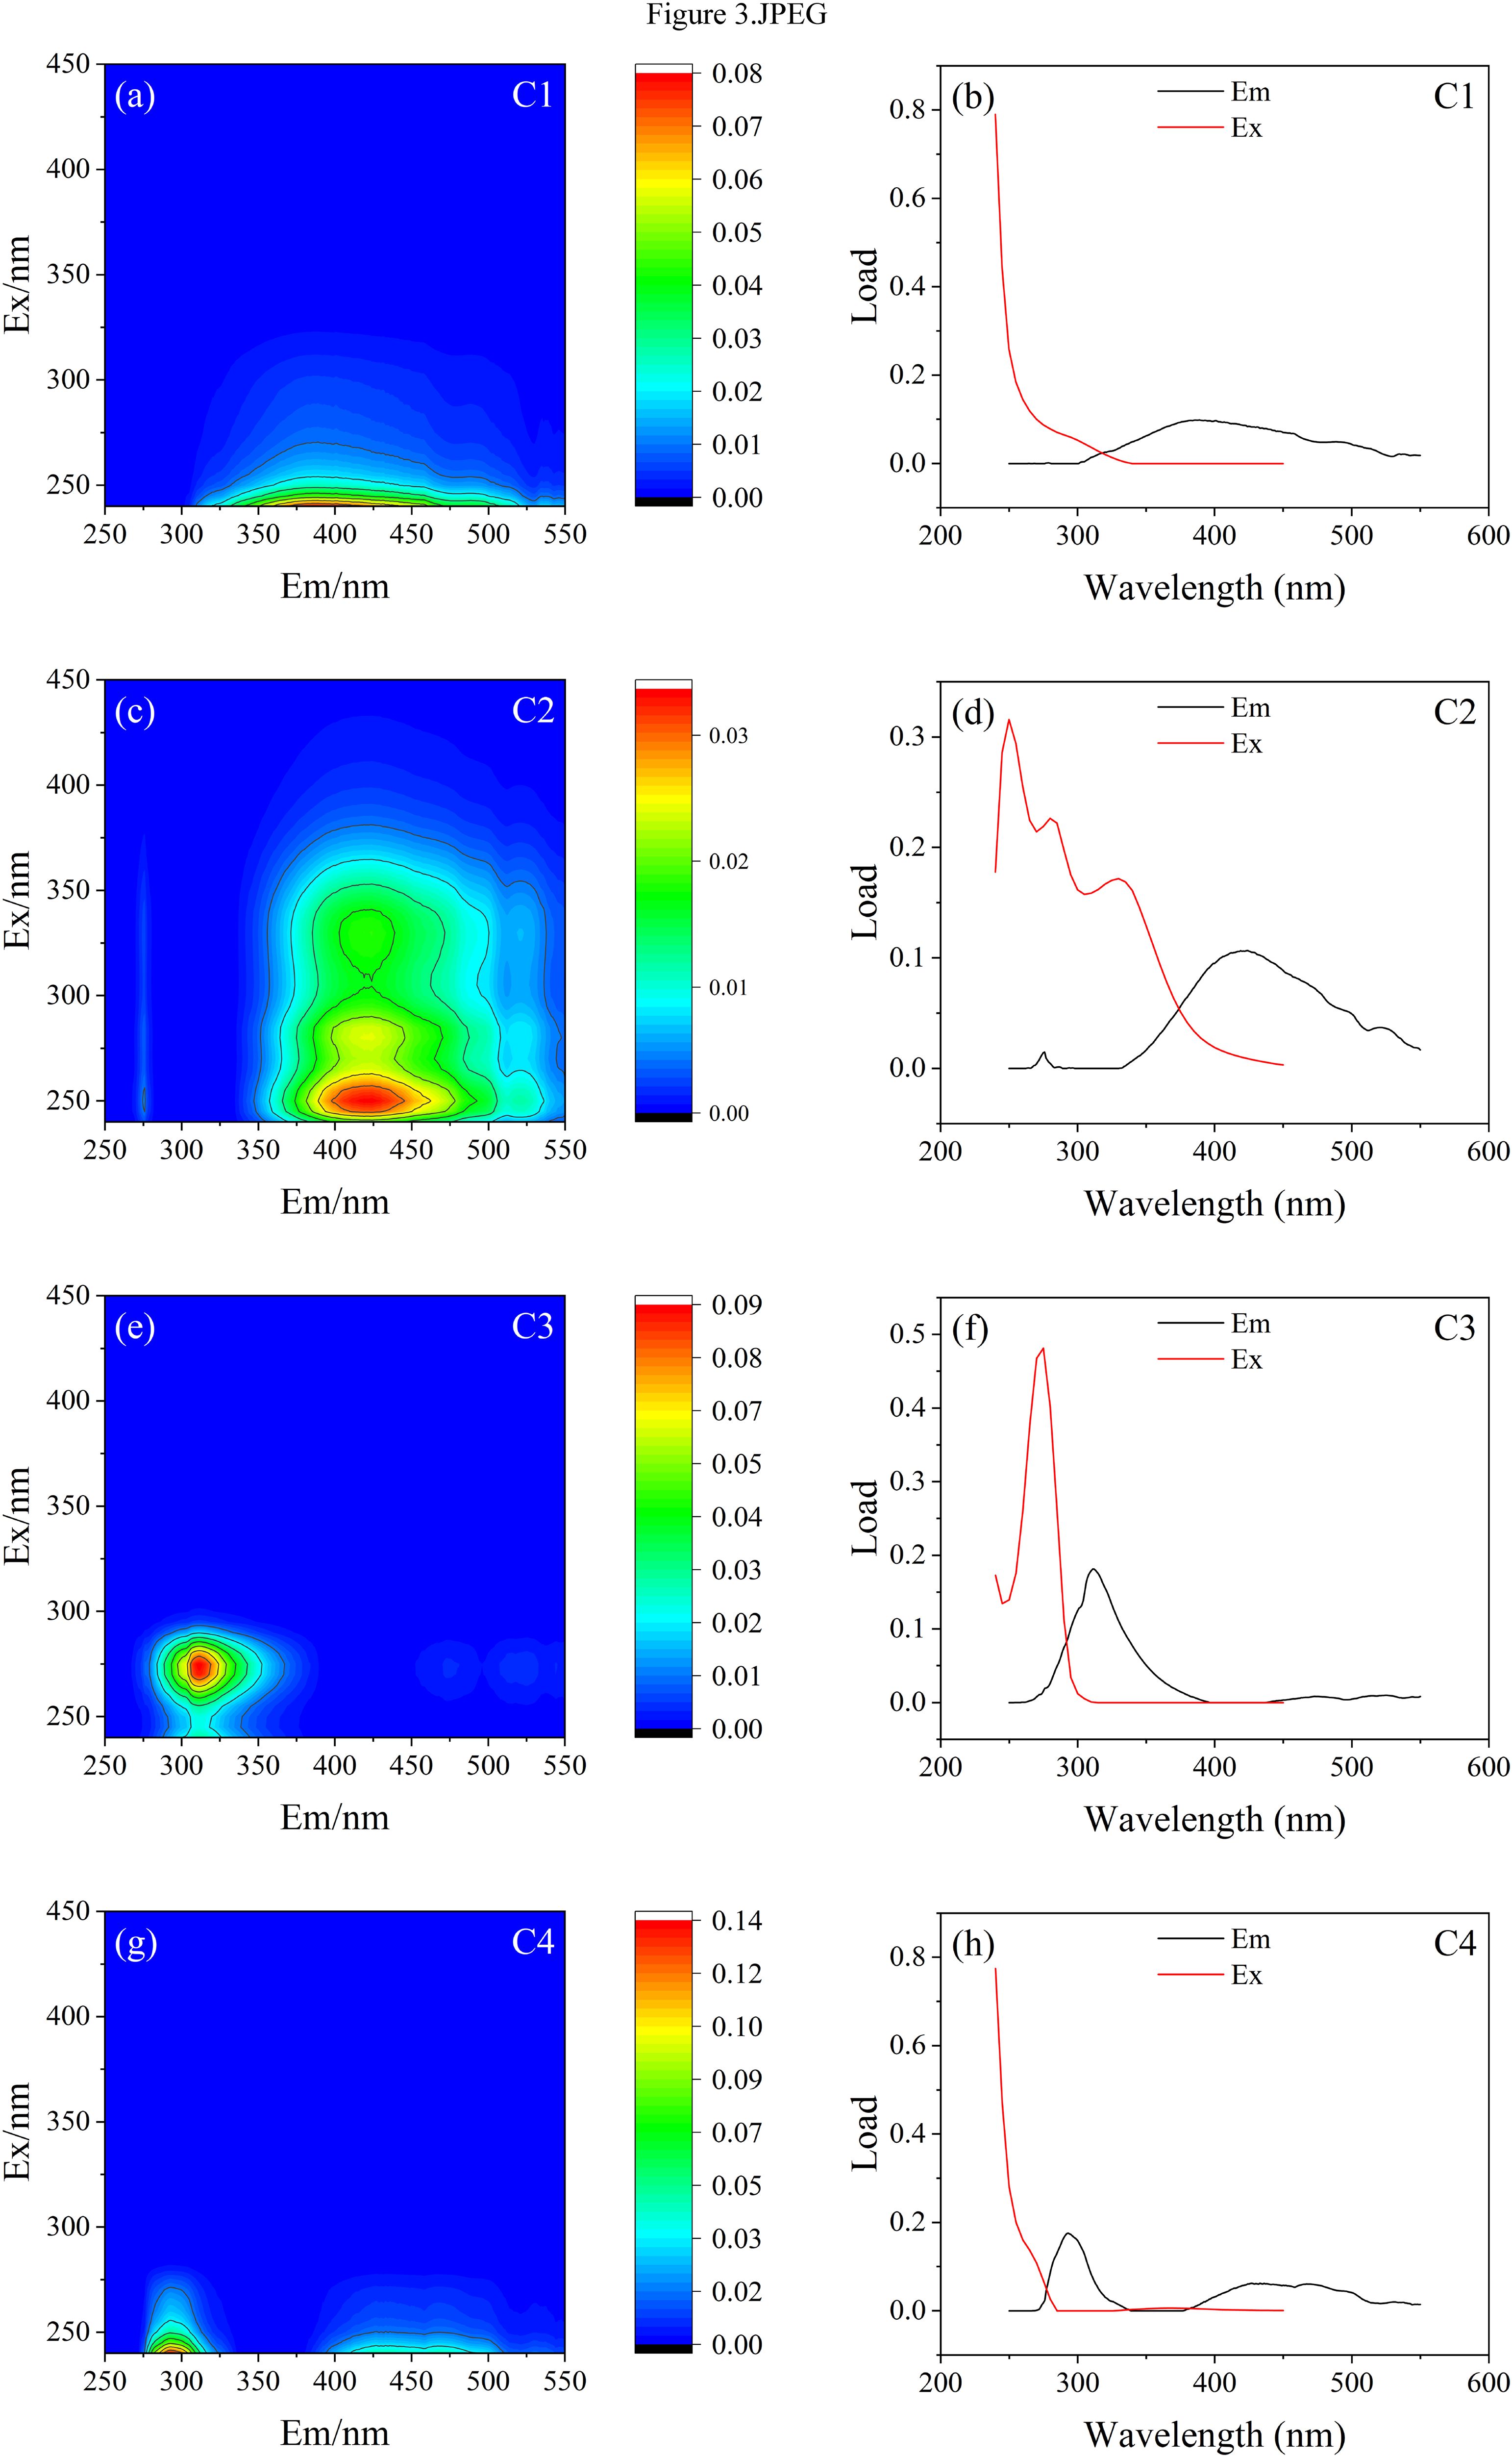
Figure 3. (a–h) Contour plots of components and variation of load of components from the 4-component model (C1: Component 1; C2: Component 2; C3: Component 3; C4: Component 4).
The fluorescence components showed variations during incubation, as shown in Figure 4. In Group P, the initial Fmax of C1 was 5.36 RU, and as the incubation progressed, the Fmax gradually decreased to 0.97 RU. The Fmax of C1 in Group B increased from 5.52 RU to 10.90 RU, showing a fluctuating trend of increase. The initial Fmax of C1 in Group P+B was the highest, significantly decreasing from 173.26 RU to 7.69 RU during the incubation. The Fmax of C2 decreased with increasing incubation time in both Group P and Group P+B. Group P decreased from 5.46 RU to 3.25 RU and Group P+B decreased from 34.54 RU to 3.03 RU. The Fmax of C2 in Group B increased with the increase of incubation time, from 5.83 RU to 10.33 RU. The Fmax of C3 in Group P first increased and then decreased, from 4.24 RU to 2.93 RU. The Fmax of C3 in Group B fluctuated and increased, from 4.43 RU to 4.96 RU. The Fmax of C3 in Group P+B decreased with increasing incubation time, from 34.51 RU to 3.03 RU. C4 showed a decrease in Fmax in three different degradation processes. In Group P, the Fmax of C4 decreased from 3.53 RU to 0.52 RU, in Group B, it decreased from 3.62 RU to 2.17 RU, and in Group P+B, it decreased from 32.21 RU to 2.11 RU.
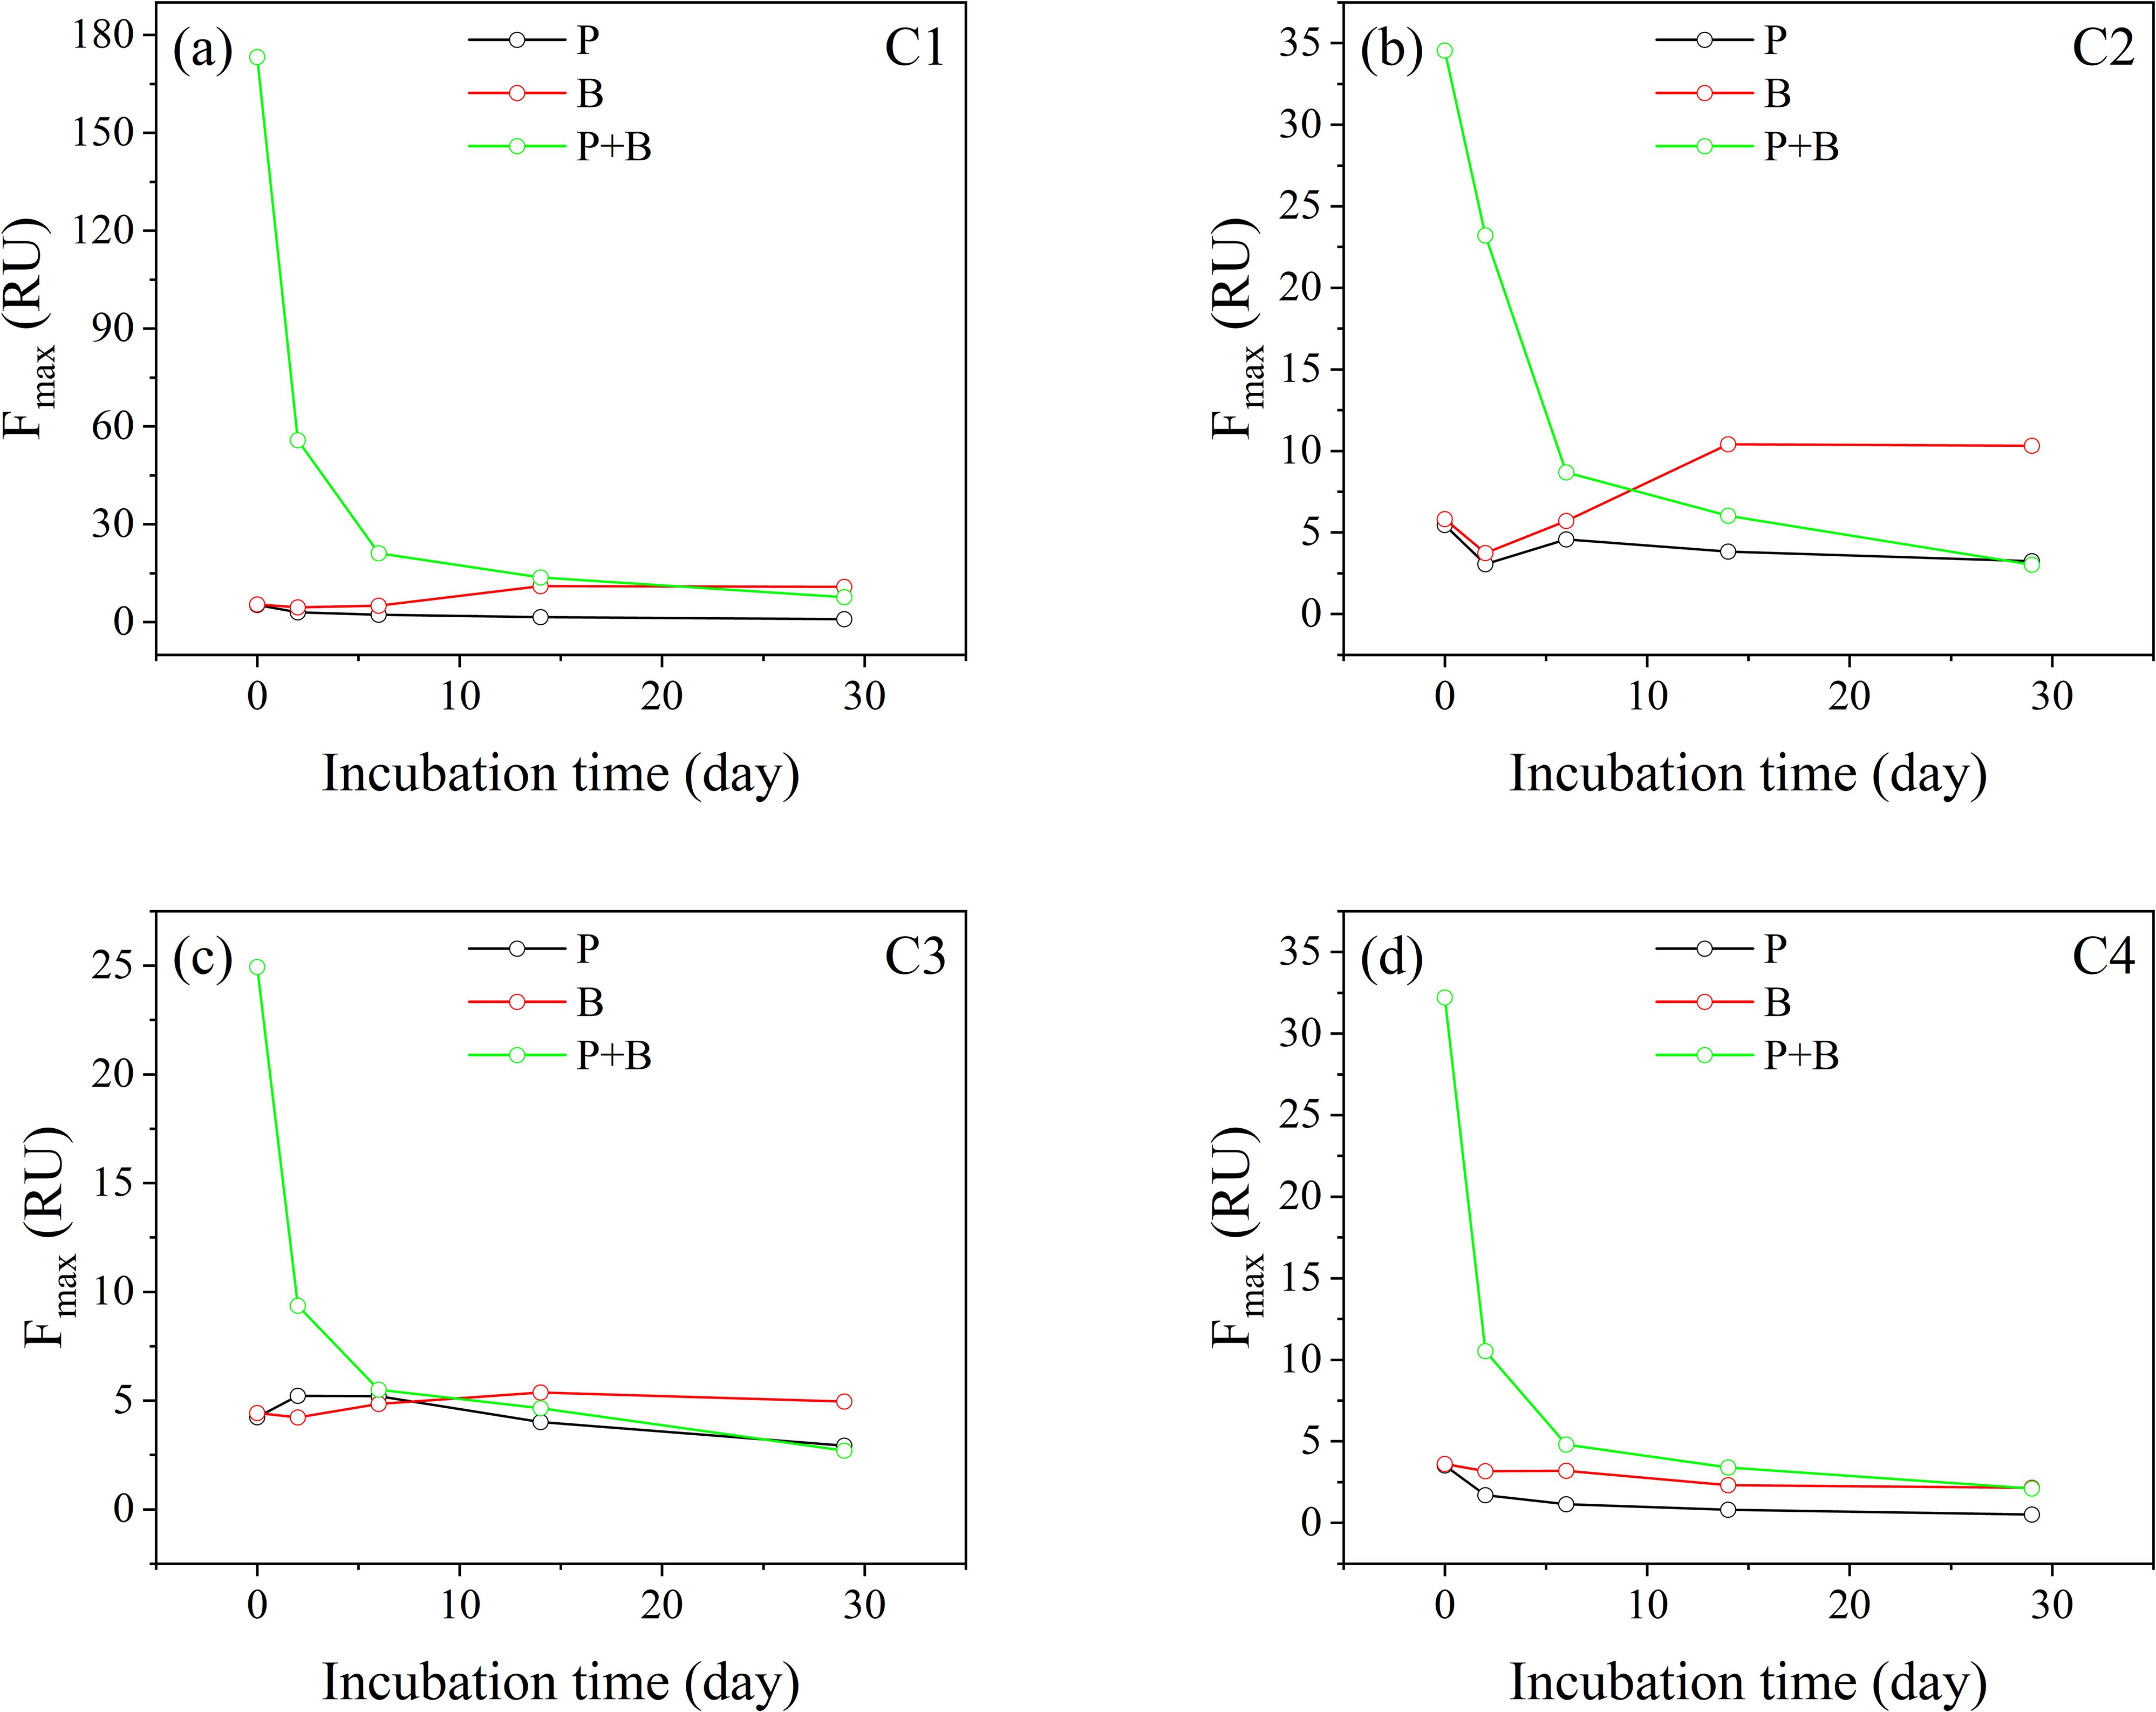
Figure 4. (a–d) Variation of Fmax of components from the 4-components PARAFAC model (P: Group P; B: Group B; P+B: Group P+B).
4 Discussion
4.1 Degradation characteristics of DOC
The results of the incubation experiment indicate that approximately one-fifth of the DOC in aquaculture wastewater demonstrates bioavailability, with microbial activity serving as the primary pathway for DOC degradation in such systems. Within this study, the bioavailability of DOC in aquaculture wastewater (21.4%) was comparable to previously reported values for East China Sea (ECS) seawater (17–26%) (Ji et al., 2019; Yang et al., 2021), yet lower compared to that of freshwater systems (~32%) (Benner and Kaiser, 2011). Freshly produced organic matter generally exhibits higher bioavailability (Amon and Benner, 1996), suggesting that the DOC pool in aquaculture wastewater demonstrates more refractory to degradation and aromaticity than its freshwater counterpart. Although the concentration of DOC is higher, under photochemical-biological coupled degradation conditions, the DOC reduction rate (19.0%) remained similar to that achieved through microbial degradation alone (21.4%) within identical timeframes. This further corroborates microbial activity as the primary driving mechanism governing DOC degradation processes in aquaculture wastewater. This also proves that the composition of DOC in the samples obtained from two samplings is similar.
Under combined photochemical-microbial degradation, the temporal variation of DOC concentration in aquaculture wastewater was fitted through nonlinear Equation 4. Previously, in their investigation of coastal upwelling water samples from Ria de Vigo, Spain, Lønborg et al. (2010) conducted biodegradation experiments and mathematically characterized DOC attenuation, revealing an average degradation rate of 0.22 d-1. Comparatively, the DOC degradation rate quantified in the present study for aquaculture wastewater attained 0.41 d-1. This substantially enhanced degradation rate indicates superior reactivity of organic matter in aquaculture wastewater relative to natural marine systems, reflecting rapid microbial community responses to elevated concentrations of labile organic substrates.
Because LDOC and semi-labile dissolved organic carbon (SLDOC) in the ocean mainly exists in the upper water column and is directly related to CO2 in the atmosphere (Gan et al., 2016), the impact of DOC degradation in aquaculture wastewater on carbon emissions must be given attention. Based on the following two facts (Gan et al., 2016): (1) LDOC helps to generate CO2, making aquaculture wastewater a carbon source; (2) The LDOC pool will promote microbial cycling and facilitate microbial carbon pumping in the ocean. Firstly, suppose only the degradation of LDOC in aquaculture wastewater is considered, according to the results of this study. In that case, the DOC output to the environment during the aquaculture process will degrade by about 19%. Although the degradation of DOC includes various products such as DIC, CO, CO2, etc., under limited conditions, this study evaluates the upper limit of DOC degradation and conversion to CO2. We assume that all the products of DOC degradation are CO2, and the conversion factor between DOC and CO2 is 3.67 (Xu et al., 2023). The CO2 emission equivalent (CO2-eq) per unit mass of DOC (kg) in aquaculture wastewater is 0.7 kg CO2-eq per kg DOC. However, as the remaining DOC after incubation also includes SLDOC and RDOC, according to Hansell et al.’s research (Hansell et al., 2012), when the average concentration of DOC is ~53-55 μmol•kg-1, SLDOC in the subsurface ocean will be depleted. When the average concentration of DOC is ~42-43 μmol•kg-1, most of SLDOC will be depleted. In this study, the DOC concentration after incubation is higher than this value. Therefore, if the incubation time is extended to several years, the remaining SLDOC will slowly degrade. Although the proportion of SLDOC in wastewater has not been quantified in this study, we speculate that the remaining DOC has relatively low biodegradability using fitting Equation 2, suggesting the presence of RDOC in the wastewater. Therefore, from the perspective of DOC degradation, small-scale aquaculture may not have a significant impact on regional carbon cycling in the short term.
4.2 Optical parameters
The variations in spectral parameters indicate that photodegradation preferentially targets specific chemical structures within organic matter, including CDOM, aromaticity, and molecular weight characteristics. Specifically, photodegradation effectively reduced the CDOM concentration, aromatic characteristics, and molecular weight of dissolved organic matter in aquaculture wastewater through distinct photochemical pathways. The alterations in fluorescence parameters predominantly reflect shifts in the relative compositional profile of DOM. During the photodegradation process, the organic components in aquaculture wastewater undergo a transformation, shifting from primarily autochthonous sources to a mixture of autochthonous and terrestrial sources (Blough, 2002). This shift indicates selective depletion of autochthonous DOM constituents through photodegradation, which may be attributed to two mechanistic pathways: (1) anaerobic or hypoxic decomposition of organic substrates, potentially diminishing protein-like fluorescent components while enhancing the relative abundance of humic-like substances; and (2) photobleaching effects induced by light exposure, leading to attenuation of characteristic fluorescence signatures in organic matrices. The attenuation of humic substances caused by photodegradation is most significant among the three degradation processes. This observation indicates that humified DOM fractions exhibit heightened susceptibility to photolytic degradation compared to other organic constituents. Meanwhile, photochemical processes can generate new DOM constituents, revealing a dual role of light-mediated reactions that encompasses both the decomposition of existing organic compounds and the photochemical synthesis of new organic fractions.
In contrast to Group P, microbial metabolism increased the CDOM content, aromaticity, and average molecular weight of DOM. According to established literature, microbial metabolic processes will facilitate the formation and accumulation of macromolecular organic compounds, such as fulvic acids and humic acids (Hansen et al., 2016; Hur et al., 2011). In addition, another reason for the increase in the average molecular weight of DOM may be that microorganisms preferentially consume small molecules of DOM during metabolic processes (Findlay and Sinsabaugh, 1999). Although there is some loss of autochthonous and DOM during microbial metabolism, by the end of incubation, the DOM in the sample remained primarily autochthonous. In the process of microbial degradation, the decrease in humility is smaller than that of Group P. Although this indicates that the consumption of humus DOM by microorganisms in the culture system cannot compete with photodegradation, this is because most terrestrial DOM is composed of humus, which is mainly composed of lignin and phenolic residues of other antimicrobial aromatic compounds (Hansen, 2014), In addition, similar to Group P, microbial metabolism utilizes the original DOM in the sample while also producing fresh DOM.
In Group P+B, the content of CDOM, aromatic DOM and macromolecular DOM decreased, and the combined effect of light and microorganisms was more significant in the degradation of CDOM, aromatic DOM, and high molecular weight DOM than the photodegradation effect alone. Comparing the changes in DOM caused by individual photodegradation and biodegradation, light is considered the main driving mechanism for these changes. In terms of changes in the relative composition of DOM, photodegradation causes the greatest changes, while microbial degradation causes the smallest changes. The changes caused by the combined degradation of light and microorganisms are between the two. This is because microorganisms produce new metabolites during the degradation of the original DOM, thereby weakening the impact of photodegradation.
The degradation experiments collectively demonstrate that photochemical processes preferentially target CDOM, aromatic DOM constituents, HMW-DOM, and humic-like DOM fractions, inducing their photolytic decomposition through wavelength-dependent reactions. Notably, light-mediated DOM degradation exhibits dual role: while facilitating the breakdown of existing organic complexes, it simultaneously generates of neo-formed DOM components via photochemical rearrangement pathways. In contrast, microbial activities predominantly facilitate the production of freshly produced DOM fractions characterized by enhanced chromophoric properties, aromaticity, HMW characteristics, and humification signatures. When photodegradation and microbial processing co-occur, spectroscopic analyses reveal that photochemical mechanisms maintain their predominance as the principal driver of DOM structural modifications. However, the presence of microbial communities exerts a mitigating effect on photoinduced DOM alterations, likely through competitive substrate utilization and metabolic transformation processes. By combining optical parameters with DOC degradation results, the roles of the two different degradation mechanisms were further elucidated: DOC removal from aquaculture wastewater is primarily driven by biodegradation, while photodegradation primarily regulates the chemical properties of DOC rather than its total concentration. This differential behavior is consistent with previous research reports (Yang et al., 2021).
4.3 DOM fluorescence features
Compare the results of parallel factor analysis with those in the OpenFluor online database (with a similarity level of 95%). C1 is highly similar to C3 reported by Nolan et al. (2023) in rivers affected by human activities in southwestern Ontario, Canada, and has been identified as a microbial humic-like, similar to peak A of Coble (Coble, 1996). C1 can be further decomposed into peak B and T, with moderate and significant correlations between C1 and peak B and T, respectively, and moderate correlations with C: N ratio (Nolan et al., 2023). Fellman et al. (2010) pointed out that C1 is ubiquitous in the environment, with the highest abundance in forest and wetland environments. Additionally, the presence of C1 has been observed in DOM affected by agricultural activities (Graeber et al., 2012; Hernes et al., 2009; Søndergaard et al., 2003), treated wastewater and algal DOM (Søndergaard et al., 2003), and lakes in New York State, USA (Du et al., 2016; Goranov et al., 2024; Wang et al., 2020). Some studies suggest that C1 is a product of heterotrophic microorganisms consuming terrestrial DOM (Lambert et al., 2017). According to the results of this study, the increase of C1 after biodegradation further supports the conclusion that C1 is of microbial origin. C2 has been found in salmon farming systems in Chile and is believed to be related to terrestrial humic-like (lignin) (Graeber et al., 2012; Ryan et al., 2022; Stedmon et al., 2011). Similar to Coble’s peak A (Coble, 1996), it can be further decomposed into a mixture of peak A and peak C (Yamashita et al., 2011). Peak A corresponds to terrestrial humic-like components, while peak C is related to agricultural activities (Coble, 1996). Therefore, it can be considered that C2 is associated with agricultural activities. In this study, the decrease in the maximum fluorescence intensity of C2 during the incubation process in the Group P and Group P+B demonstrated the degradation effect of light on C2. C3 is similar to Component C2 discovered by Nimptsch et al. (2015) in the Chilean salmon farming system and Component C3 discovered by Lei et al. (2021) in the shellfish farming area of Lianjiang County, Fujian Province, China. C3 has been reported as tyrosine-like (Yamashita et al., 2013, 2011), with its known source being aromatic amino acids (Yamashita et al., 2011). The fluorescence signal of C3 represents the concentration of hydrolyzable amino acids in DOM (Yamashita and Tanoue, 2003a), and these amino acids are considered to be semi-labile parts of DOM in aquatic environments (Davis and Benner, 2007; Yamashita and Tanoue, 2003b). Some studies have reported a linear relationship between C3 and semi-labile DOC in streams (Balcarczyk et al., 2009; Fellman et al., 2008), indicating that C3 may be an effective indicator for measuring the labile or semi-labile portion of freshly produced DOC (Yamashita et al., 2011). Additionally, research reports have found that C3 originates from algae (Coble, 1996; Murphy et al., 2006; Stedmon and Markager, 2005) representing an autochthonous source. Previous studies have also linked this component to microbial activity and suggested that its content is positively correlated with bioavailability (Graeber et al., 2012). There are relatively few reports on C4 in OpenFluor, with only Maurischat et al. (2022) reporting similar substances in Lake Namtso on the Qinghai-Tibet Plateau. In addition, the spectral characteristics of C4 are similar to those of terrestrial humic substances identified in coastal environments (Kowalczuk et al., 2009). C4 is described as a terrestrial fluorophore representing plant and soil sources (Stedmon et al., 2011), associated with solutes from plants and soil, as well as reprocessed terrestrial material. Similar to C2, C4 is also a mixture between peak A and peak C (Coble, 1996; Yamashita et al., 2011). Therefore, it can be inferred that the presence of C4 is closely related to agricultural activities.
4.4 Principal component analysis of parameters in DOC degradation
In order to further investigate the mechanism of changes in dissolved organic matter in aquaculture wastewater during degradation, we conducted principal component analysis on DOC, optical parameters, and fluorescence indices (Figure 5). Principal Component 1 (PC1) and Principal Component 2 (PC2) jointly explained 85.4% of the total variance in the dataset. In the direction of PC1 axis, parameters such as a350, SUVA254 and HIX have high positive loadings, indicating the presence of stable, aromatic, and humic DOM. The positive FI loading reflects aromatic and humic substances produced by microorganisms. The positive loads of C1, C2, and C4 further support the association between humic compounds and PC1. The negative loading of S275-295 confirms that PC1’s positive direction corresponds to HMW. Thus, PC1 represents HMW, highly humified, stable, and complex organic matter derived from the combined microbial and terrestrial sources. Initial undegraded samples showed high PC1 scores. Decreasing scores with degradation time indicate disruption of macromolecular structure and reduced humification.
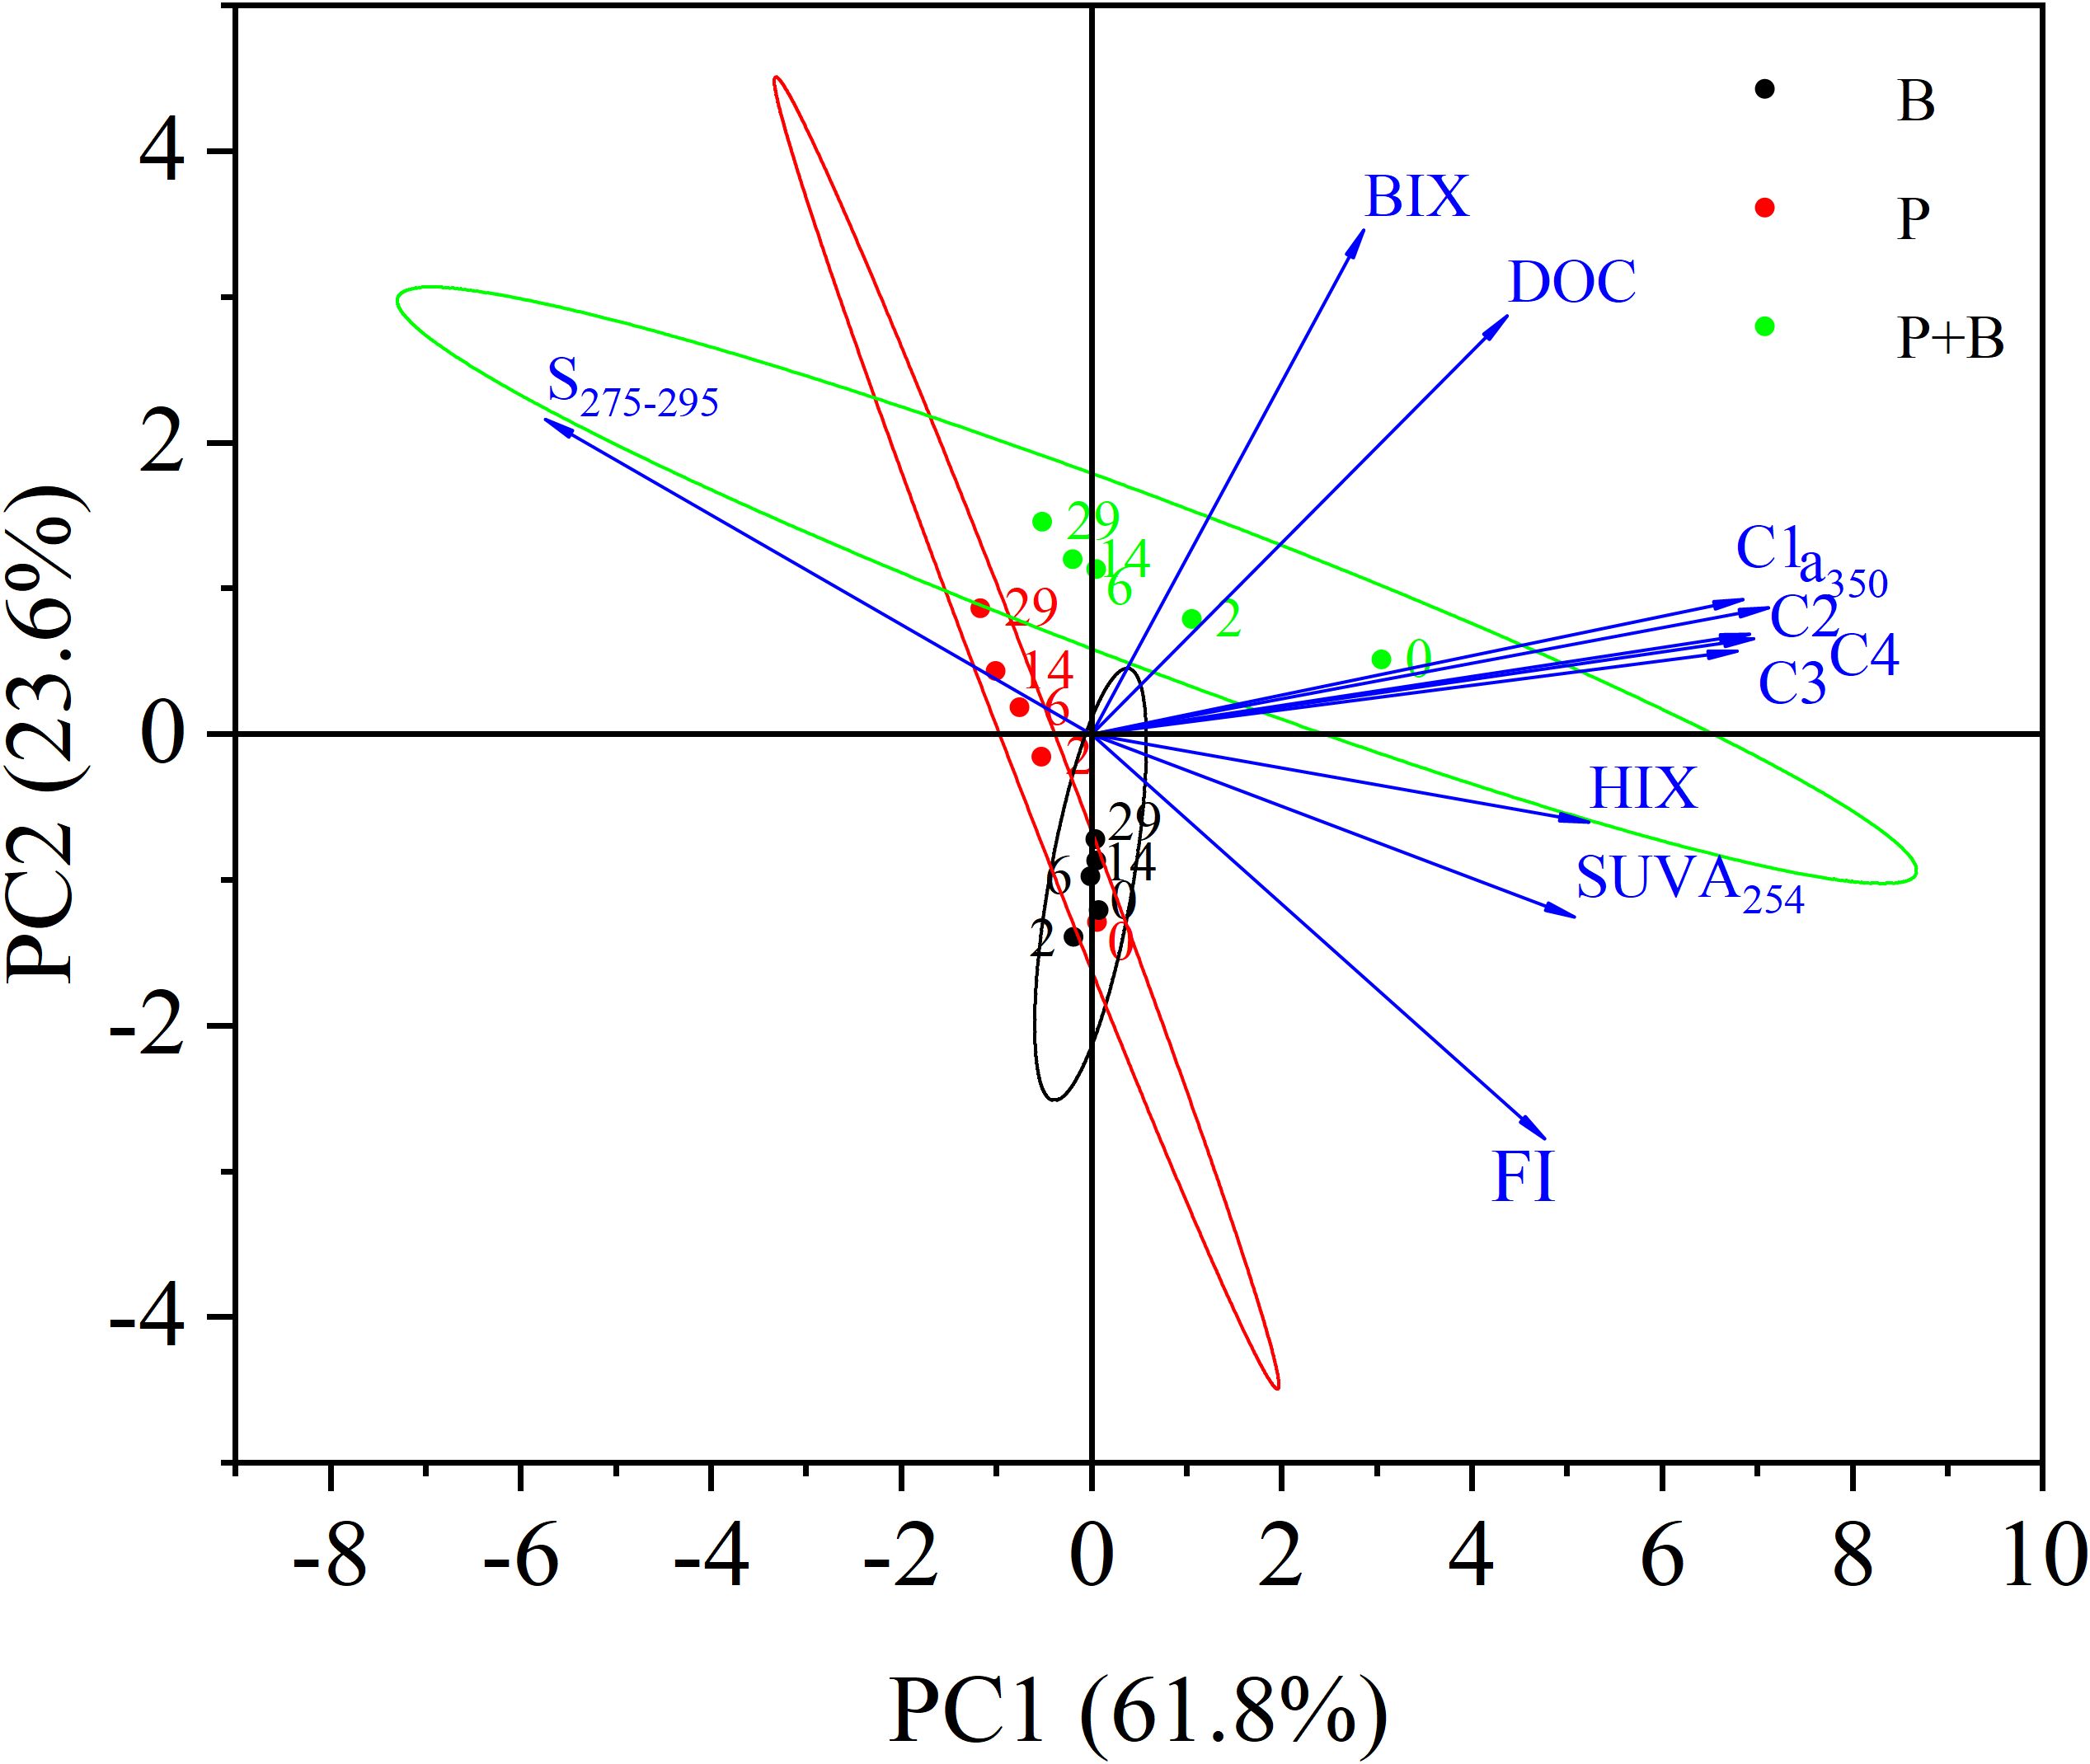
Figure 5. Principal component analysis load and score based on incubation experiment parameters (P: Group P; B: Group B; P+B: Group P+B).
The parameters with high positive loads on the PC2 axis are DOC, S275-295, and BIX, indicating that the positive direction of PC2 corresponds to newly produced LMW organic compounds. Negative loadings of FI and SUVA254 reflect terrestrial-derived material with low aromaticity and fluorescence. Therefore, PC2 represents microbially derived LMW organic compound. In the early stages of incubation, the initial undecomposed samples scored lower in the PC2 direction. As incubation progressed, the scores of the samples gradually increased in the PC2 direction, demonstrate the transformation pathway from terrestrial HMW matter to microbially derived LMW compounds.
5 Conclusion
The bioavailability of DOC in aquaculture wastewater is approximately one-fifth, which is similar to that in natural seawater. However, the degradation rate of DOC is higher in aquaculture water, suggesting its greater reactivity compared to natural seawater. Photodegradation primarily alters the chemical properties of DOC rather than the total amount of DOC, and microbial activity is the dominant driver of DOC degradation in aquaculture wastewater. In addition, an evaluation of the upper limit of CO2 generated from DOC degradation suggests aquaculture wastewater exhibits relatively weak carbon source attributes. Nevertheless, given the backdrop of the continuous expansion of the global aquaculture industry, this potential carbon source warrants serious consideration. The DOM in aquaculture wastewater is predominantly composed of microbial humic-like, terrestrial humic-like, and tyrosine-like (potentially algal-derived). PCA of 11 parameters monitored during the incubation experiment revealed the distinct effects of different degradation processes on the composition of organic matter. This provides insights for understanding the transformation environmental organic matter transformation pathways.
Data availability statement
The original contributions presented in the study are included in the article/supplementary material. Further inquiries can be directed to the corresponding authors.
Author contributions
YL: Data curation, Formal analysis, Investigation, Methodology, Validation, Visualization, Writing – original draft, Writing – review & editing. HH: Formal analysis, Funding acquisition, Project administration, Resources, Supervision, Writing – review & editing. Z-YZ: Funding acquisition, Methodology, Project administration, Resources, Supervision, Writing – review & editing. P-FC: Conceptualization, Funding acquisition, Project administration, Supervision, Writing – review & editing. XZ: Resources, Writing – review & editing. S-ND: Investigation, Writing – review & editing.
Funding
The author(s) declare financial support was received for the research and/or publication of this article. This work was funded by the National Key R&D Program of China (2022YFE0135800, 2024YFD2401701), the National Natural Science Foundation of China (42376207), and the Oceanic Interdisciplinary Program of Shanghai Jiao Tong University (SL2023MS019).
Acknowledgments
We are grateful to staffs of the shrimp farm for their help during the work. And thanks to the editor and reviewers for reviews and comments on the manuscript.
Conflict of interest
The authors declare that the research was conducted in the absence of any commercial or financial relationships that could be construed as a potential conflict of interest.
Generative AI statement
The author(s) declare that no Generative AI was used in the creation of this manuscript.
Any alternative text (alt text) provided alongside figures in this article has been generated by Frontiers with the support of artificial intelligence and reasonable efforts have been made to ensure accuracy, including review by the authors wherever possible. If you identify any issues, please contact us.
Publisher’s note
All claims expressed in this article are solely those of the authors and do not necessarily represent those of their affiliated organizations, or those of the publisher, the editors and the reviewers. Any product that may be evaluated in this article, or claim that may be made by its manufacturer, is not guaranteed or endorsed by the publisher.
References
Amon R. M. and Benner R. (1996). Bacterial utilization of different size classes of dissolved organic matter. Limnol. Oceanogr. 41, 41–51. doi: 10.4319/lo.1996.41.1.0041
Balcarczyk K. L., Jones J. B., Jaffé R., and Maie N. (2009). Stream dissolved organic matter bioavailability and composition in watersheds underlain with discontinuous permafrost. Biogeochemistry 94, 255–270. doi: 10.1007/s10533-009-9324-x
Benner R. and Kaiser K. (2011). Biological and photochemical transformations of amino acids and lignin phenols in riverine dissolved organic matter. Biogeochemistry 102, 209–222. doi: 10.1007/s10533-010-9435-4
Blough N. V. (2002). “Chromophoric DOM in the coastal environment,” in Biogeochemistry of marine dissolved organic matter. (San Diego, California: Academic Press).
Chen Y., Mitra A., Rahimnejad S., Chi S., Kumar V., Tan B., et al. (2024). Retrospect of fish meal substitution in Pacific white shrimp (Litopenaeus vannamei) feed: Alternatives, limitations and future prospects. Rev. Aquacult. 16, 382–409. doi: 10.1111/raq.12843
Coble P. G. (1996). Characterization of marine and terrestrial DOM in seawater using excitation-emission matrix spectroscopy. Mar. Chem. 51, 325–346. doi: 10.1016/0304-4203(95)00062-3
Coble P. G. (2007). Marine optical biogeochemistry: the chemistry of ocean color. Chem. Rev. 107, 402–418. doi: 10.1021/cr050350+
Cory R. M., McNeill K., Cotner J. P., Amado A., Purcell J. M., Marshall A. G., et al. (2010). Singlet oxygen in the coupled photochemical and biochemical oxidation of dissolved organic matter. Environ. Sci. Technol. 44, 3683–3689. doi: 10.1021/es902989y
Dai P., Li D., Sui J., Kong J., Meng X., Luan S., et al. (2023). Prediction of meat yield in the Pacific whiteleg shrimp Penaeus vannamei. Aquaculture 577, 739914. doi: 10.1016/j.aquaculture.2023.739914
Davis J. and Benner R. (2007). Quantitative estimates of labile and semi-labile dissolved organic carbon in the western Arctic Ocean: A molecular approach. Limnol. Oceanogr. 52, 2434–2444. doi: 10.4319/lo.2007.52.6.2434
Del Vecchio R. and Blough N. V. (2004). Spatial and seasonal distribution of chromophoric dissolved organic matter and dissolved organic carbon in the Middle Atlantic Bight. Mar. Chem. 89, 169–187. doi: 10.1016/j.marchem.2004.02.027
Du Y., Zhang Y., Chen F., Chang Y., and Liu Z. (2016). Photochemical reactivities of dissolved organic matter (DOM) in a sub-alpine lake revealed by EEM-PARAFAC: An insight into the fate of allochthonous DOM in alpine lakes affected by climate change. Sci. Total. Environ. 568, 216–225. doi: 10.1016/j.scitotenv.2016.06.036
Fellman J. B., D’Amore D. V., Hood E., and Boone R. D. (2008). Fluorescence characteristics and biodegradability of dissolved organic matter in forest and wetland soils from coastal temperate watersheds in southeast Alaska. Biogeochemistry 88, 169–184. doi: 10.1007/s10533-008-9203-x
Fellman J. B., Hood E., and Spencer R. G. (2010). Fluorescence spectroscopy opens new windows into dissolved organic matter dynamics in freshwater ecosystems: A review. Limnol. Oceanogr. 55, 2452–2462. doi: 10.4319/lo.2010.55.6.2452
Findlay S. and Sinsabaugh R. L. (1999). Unravelling the sources and bioavailability of dissolved organic matter in lotic aquatic ecosystems. Mar. Freshw. Res. 50, 781–790. doi: 10.1071/MF99069
Gabor R. S., Baker A., McKnight D. M., and Miller M. P. (2014). “Fluorescence indices and their interpretation,” in Aquatic organic matter fluorescence (Cambridge University Press), 303.
Gan S., Wu Y., and Zhang J. (2016). Bioavailability of dissolved organic carbon linked with the regional carbon cycle in the East China Sea. Deep. Sea. Res. Part II.: Topical. Stud. Oceanogr. 124, 19–28. doi: 10.1016/j.dsr2.2015.06.024
Goranov A. I., Swinton M. W., Winkler D. A., Farrell J. L., Nierzwicki-Bauer S. A., Wagner S., et al. (2024). Assessing the spatiotemporal variability of dissolved organic matter fluorescence composition in the Lake George, NY watershed. Biogeochemistry 167(6), 1–22. doi: 10.1007/s10533-024-01147-x
Graeber D., Gelbrecht J., Pusch M. T., Anlanger C., and von Schiller D. (2012). Agriculture has changed the amount and composition of dissolved organic matter in Central European headwater streams. Sci. Total. Environ. 438, 435–446. doi: 10.1016/j.scitotenv.2012.08.087
Hambly A. C., Arvin E., Pedersen L. F., Pedersen P. B., Seredyńska-Sobecka B., Stedmon C. A., et al. (2015). Characterising organic matter in recirculating aquaculture systems with fluorescence EEM spectroscopy. Water Res. 83, 112–120. doi: 10.1016/j.watres.2015.06.037
Hansell D. A., Carlson C. A., and Schlitzer R. (2012). Net removal of major marine dissolved organic carbon fractions in the subsurface ocean. Global Biogeochem. Cycles. 26. doi: 10.1029/2011GB004069
Hansen A. M. (2014). The effects of biodegradation and photodegradation on optical properties of dissolved organic matter in aquatic systems (Sacramento: California State University).
Hansen A. M., Kraus T. E. C., Pellerin B. A., Fleck J. A., Downing B. D., Bergamaschi B. A., et al. (2016). Optical properties of dissolved organic matter (DOM): Effects of biological and photolytic degradation. Limnol. Oceanogr. 61, 1015–1032. doi: 10.1002/lno.10270
Hernes P. J., Bergamaschi B. A., Eckard R. S., and Spencer R. G. (2009). Fluorescence-based proxies for lignin in freshwater dissolved organic matter. J. Geophys. Res.: Biogeosci. 114. doi: 10.1029/2009JG000938
Hu F., Ye J., Wang B., Zhang W., Chen P., Yuan Z., et al. (2025). Transformation of dissolved organic matter during aquaculture wastewater treatment: Insights into the biological toxicity, spectral indices and molecular signatures. Water Res. 283, 123834. doi: 10.1016/j.watres.2025.123834
Huang C., Jiang T., Zhu B., Liu D., Shan H., Wang F., et al. (2024b). Assessment of refractory dissolved organic carbon in sediments of marine culture ponds: An example of two culture systems for Penaeus vannamei. Aquaculture 593, 741368. doi: 10.1016/j.aquaculture.2024.741368
Huang C., Jiang T., Shan H., and Wang F. (2024a). Composition, dynamic changes, and carbon sequestration effects of organic carbon in the water of a Penaeus vannamei Culture Pond. Water 16, 721. doi: 10.3390/w16050721
Huguet A., Vacher L., Relexans S., Saubusse S., Froidefond J. M., Parlanti E., et al. (2009). Properties of fluorescent dissolved organic matter in the Gironde Estuary. Organic. Geochem. 40, 706–719. doi: 10.1016/j.orggeochem.2009.03.002
Hur J., Lee B.-M., and Shin H.-S. (2011). Microbial degradation of dissolved organic matter (DOM) and its influence on phenanthrene–DOM interactions. Chemosphere 85, 1360–1367. doi: 10.1016/j.chemosphere.2011.08.001
Ji C., Yang G., Chen Y., and Zhang P. (2019). Distribution, degradation and bioavailability of dissolved organic matter in the East China Sea. Biogeochemistry 142, 189–207. doi: 10.1007/s10533-018-0529-8
Jiao N., Herndl G. J., Hansell D. A., Benner R., Kattner G., Wilhelm S. W., et al. (2010). Microbial production of recalcitrant dissolved organic matter: long-term carbon storage in the global ocean. Nat. Rev. Microbiol. 8, 593. doi: 10.1038/nrmicro2386
Kamjunke N., Nimptsch J., Harir M., Herzsprung P., Schmitt-Kopplin P., Neu T. R., et al. (2017). Land-based salmon aquacultures change the quality and bacterial degradation of riverine dissolved organic matter. Sci. Rep. 7, 43739. doi: 10.1038/srep43739
Kowalczuk P., Durako M. J., Young H., Kahn A. E., Cooper W. J., Gonsior M., et al. (2009). Characterization of dissolved organic matter fluorescence in the South Atlantic Bight with use of PARAFAC model: Interannual variability. Mar. Chem. 113, 182–196. doi: 10.1016/j.marchem.2009.01.015
Lambert T., Bouillon S., Darchambeau F., Morana C., Roland F. A. E., Descy J. P., et al. (2017). Effects of human land use on the terrestrial and aquatic sources of fluvial organic matter in a temperate river basin (The Meuse River, Belgium). Biogeochemistry 136, 191–211. doi: 10.1007/s10533-017-0387-9
Lei J., Yang L., and Zhu Z. (2021). Testing the effects of coastal culture on particulate organic matter using absorption and fluorescence spectroscopy. J. Cleaner. Prod. 325, 129203. doi: 10.1016/j.jclepro.2021.129203
Li L., Jiao X., Peng S., Wei D., Jin Y., Wang C., et al. (2024). Exploring the variations in molecular characteristics of dissolved organic matter driven by aquaculture types. Water Res. 266, 122355. doi: 10.1016/j.watres.2024.122355
Liu X., Cui L., Jiang K., Yuan X., and Yu X. (2023). China fisheries Statistical Yearbook. (Beijing: China Agriculture Press).
Liu J., Zhou T., Wang C., Chan S., and Wang W. (2021). Deciphering the molecular regulatory mechanism orchestrating ovary development of the Pacific whiteleg shrimp Litopenaeus vannamei through integrated transcriptomic analysis of reproduction-related organs. Aquaculture 533, 736160. doi: 10.1016/j.aquaculture.2020.736160
Lønborg C. and Álvarez-Salgado X. A. (2012). Recycling versus export of bioavailable dissolved organic matter in the coastal ocean and efficiency of the continental shelf pump. Global biogeochemical cycles. Global biogeochemical cycles. 26. doi: 10.1029/2012GB004353
Lønborg C., Álvarez-Salgado X. A., Martínez-García S., Miller A. E., and Teira E. (2010). Stoichiometry of dissolved organic matter and the kinetics of its microbial degradation in a coastal upwelling system. Aquat. Microbial Ecol. 58, 117–126. doi: 10.3354/ame01364
Maurischat P., Lehnert L., Zerres V. H. D., Tran T. V., Kalbitz K., Rinnan Å., et al. (2022). The glacial–terrestrial–fluvial pathway: A multiparametrical analysis of spatiotemporal dissolved organic matter variation in three catchments of Lake Nam Co, Tibetan Plateau. Sci. Total. Environ. 838, 156542. doi: 10.1016/j.scitotenv.2022.156542
Mopper K. and Schultz C. A. (1993). Fluorescence as a possible tool for studying the nature and water column distribution of DOC components. Mar. Chem. 41, 229–238. doi: 10.1016/0304-4203(93)90124-7
Moran M. A. and Zepp R. G. (1997). Role of photoreactions in the formation of biologically labile compounds from dissolved organic matter. Limnol. Oceanogr. 42, 1307–1316. doi: 10.4319/lo.1997.42.6.1307
Murphy K. R., Ruiz G. M., Dunsmuir W. T., and Waite T. D. (2006). Optimized parameters for fluorescence-based verification of ballast water exchange by ships. Environ. Sci. Technol. 40, 2357–2362. doi: 10.1021/es0519381
Nimptsch J., Woelfl S., Osorio S., Valenzuela J., Ebersbach P., von Tuempling W., et al. (2015). Tracing dissolved organic matter (DOM) from land-based aquaculture systems in North Patagonian streams. Sci. Total. Environ. 537, 129–138. doi: 10.1016/j.scitotenv.2015.07.160
Nolan S., Frazao A. A., Hosen J., and Febria C. (2023). Anthropogenic land uses influence stream dissolved organic matter quality more than decomposition rates and macroinvertebrate diversity. Ecol. Indic. 155, 110991. doi: 10.1016/j.ecolind.2023.110991
Ohno T. (2002). Fluorescence inner-filtering correction for determining the humification index of dissolved organic matter. Environ. Sci. Technol. 36, 742–746. doi: 10.1021/es0155276
Repeta D. J., Quan T. M., Aluwihare L. I., and Accardi A. (2002). Chemical characterization of high molecular weight dissolved organic matter in fresh and marine waters. Geochim. Cosmochim. Acta 66, 955–962. doi: 10.1016/S0016-7037(01)00830-4
Ryan K. A., Chaverra Palacios L., Encina F., Graeber D., Osorio S., Stubbins A., et al. (2022). Assessing inputs of aquaculture-derived nutrients to streams using dissolved organic matter fluorescence. Sci. Total. Environ. 807, 150785. doi: 10.1016/j.scitotenv.2021.150785
Søndergaard M., Stedmon C. A., and Borch N. H. (2003). Fate of terrigenous dissolved organic matter (DOM) in estuaries: Aggregation and bioavailability. Ophelia 57, 161–176. doi: 10.1080/00785236.2003.10409512
Stedmon C. A., Seredyńska-Sobecka B., Boe-Hansen R., Le Tallec N., Waul C. K., Arvin E., et al. (2011). A potential approach for monitoring drinking water quality from groundwater systems using organic matter fluorescence as an early warning for contamination events. Water Res. 45, 6030–6038. doi: 10.1016/j.watres.2011.08.066
Stedmon C. A. and Markager S. (2005). Tracing the production and degradation of autochthonous fractions of dissolved organic matter by fluorescence analysis. Limnol. Oceanogr. 50, 1415–1426. doi: 10.4319/lo.2005.50.5.1415
Stedmon C. A., Markager S., and Kaas H. (2000). Optical properties and signatures of chromophoric dissolved organic matter (CDOM) in Danish coastal waters. Estuarine. Coast. Shelf. Sci. 51, 267–278. doi: 10.1006/ecss.2000.0645
Stepanauskas R., Moran M. A., Bergamaschi B. A., and Hollibaugh J. T. (2005). Sources, bioavailability, and photoreactivity of dissolved organic carbon in the Sacramento–San Joaquin River Delta. Biogeochemistry 74, 131–149. doi: 10.1007/s10533-004-3361-2
Wang X., Wu Y., Jiang Z., Ma Q., Zhang J., Liu S., et al. (2017). Quantifying aquaculture-derived dissolved organic matter in the mesocosms of Sanggou Bay using excitation-emission matrix spectra and parallel factor analysis. J. World Aquacult. Soc. 48, 909–926. doi: 10.1111/jwas.12409
Wang S., Matt M., Murphy B. L., Perkins M., Matthews D. A., Moran S. D., et al. (2020). Organic micropollutants in New York lakes: A statewide citizen science occurrence study. Environ. Sci. Technol. 54, 13759–13770. doi: 10.1021/acs.est.0c04775
Wang D., Song C., Zhang B., Chen J., Luo A., Wang X., et al. (2021). Deciphering dissolved organic matter from freshwater aquaculture ponds in Eastern China based on optical and molecular signatures. Process. Saf. Environ. Prot. 155, 122–130. doi: 10.1016/j.psep.2021.09.025
Weishaar J. L., Aiken G. R., Bergamaschi B. A., Fram M. S., Fujii R., Mopper K., et al. (2003). Evaluation of specific ultraviolet absorbance as an indicator of the chemical composition and reactivity of dissolved organic carbon. Environ. Sci. Technol. 37, 4702–4708. doi: 10.1021/es030360x
Wetzel R. G., Hatcher P. G., and Bianchi T. S. (1995). Natural photolysis by ultraviolet irradiance of recalcitrant dissolved organic matter to simple substrates for rapidbacterial metabolism. Limnol. Oceanogr. 40, 1369–1380. doi: 10.4319/lo.1995.40.8.1369
Xu Y., Liu H., Yang Y., Shen H., Zhang R., Wang C., et al. (2023). Assessment of carbon sink potential and methane reduction scenarios of marine macroalgae (Gracilaria) culvition (in Chinese). Sci. China Earth Sci. 66, 1047–1061. doi: 10.1007/s11430-022-1053-3
Yamashita Y., Boyer J. N., and Jaffé R. (2013). Evaluating the distribution of terrestrial dissolved organic matter in a complex coastal ecosystem using fluorescence spectroscopy. Continental. Shelf. Res. 66, 136–144. doi: 10.1016/j.csr.2013.06.010
Yamashita Y., Panton A., Mahaffey C., and Jaffé R. (2011). Assessing the spatial and temporal variability of dissolved organic matter in Liverpool Bay using excitation–emission matrix fluorescence and parallel factor analysis. Ocean. Dynamics. 61, 569–579. doi: 10.1007/s10236-010-0365-4
Yamashita Y. and Tanoue E. (2003a). Chemical characterization of protein-like fluorophores in DOM in relation to aromatic amino acids. Mar. Chem. 82, 255–271. doi: 10.1016/S0304-4203(03)00073-2
Yamashita Y. and Tanoue E. (2003b). Distribution and alteration of amino acids in bulk DOM along a transect from bay to oceanic waters. Mar. Chem. 82, 145–160. doi: 10.1016/S0304-4203(03)00049-5
Yamin G., Borisover M., Cohen E., and Van Rijn J. (2017). Accumulation of humic-like and proteinaceous dissolved organic matter in zero-discharge aquaculture systems as revealed by fluorescence EEM spectroscopy. Water Res. 108, 412–421. doi: 10.1016/j.watres.2016.11.028
Yang P., Zhang Y., Yang H., Guo Q., Lai D. Y. F., Zhao G., et al. (2020). Ebullition was a major pathway of methane emissions from the aquaculture ponds in southeast China. Water Res. 184, 116176. doi: 10.1016/j.watres.2020.116176
Yang L., Zhang J., and Yang G. (2021). Mixing behavior, biological and photolytic degradation of dissolved organic matter in the East China Sea and the Yellow Sea. Sci. Total. Environ. 762, 143164. doi: 10.1016/j.scitotenv.2020.143164
Keywords: mariculture, aquaculture wastewater, carbon emission, excitation-emission matrix, CDOM
Citation: Li Y, Huang H, Zhu Z-Y, Cheng P-F, Zhao X and Dang S-N (2025) Quantifying and characterizing degradation of dissolved organic carbon from aquaculture wastewater: a case study of Litopenaeus vannamei. Front. Mar. Sci. 12:1627724. doi: 10.3389/fmars.2025.1627724
Received: 13 May 2025; Accepted: 11 August 2025;
Published: 28 August 2025.
Edited by:
Kumbukani Mzengereza, Mzuzu University, MalawiReviewed by:
Da Huo, Chinese Academy of Sciences (CAS), ChinaAmit Ranjan, Tamil Nadu Fisheries University, India
Copyright © 2025 Li, Huang, Zhu, Cheng, Zhao and Dang. This is an open-access article distributed under the terms of the Creative Commons Attribution License (CC BY). The use, distribution or reproduction in other forums is permitted, provided the original author(s) and the copyright owner(s) are credited and that the original publication in this journal is cited, in accordance with accepted academic practice. No use, distribution or reproduction is permitted which does not comply with these terms.
*Correspondence: Hong Huang, aGh1YW5nQHNob3UuZWR1LmNu; Zhuo-Yi Zhu, emh1LnpodW95aUBzanR1LmVkdS5jbg==