 Calvin S. Beale1,2,3,4*
 Ferawati Runtuboy3,5
 Abraham B. Sianipar1,2,6Angela J. E. Beer2Kadarusman7
 Mark V. Erdmann8
 Edy Setyawan6,9
 Lydia Green10
 Clinton A. J. Duffy11
 Samantha Andrzejaczek12
 Barbara A. Block12
 Kerstin Forsberg13,14Mark Meekan15
 Adrian C. Gleiss1,4
- 1Harry Butler Institute, Murdoch University, Perth, WA, Australia
- 2Raja Ampat Manta Project, The Manta Trust Affiliate Project, Sorong, Papua Barat, Indonesia
- 3University of Papua, Manokwari, Papua Barat, Indonesia
- 4Environmental and Conservation Sciences, Murdoch University, Perth, WA, Australia
- 5Bogor Agricultural Institute, Bogor, West Java, Indonesia
- 6Elasmobranch Institute Indonesia, Denpasar, Indonesia
- 7Maritime and Fisheries Polytechnic, Sorong, Papua Barat, Indonesia
- 8Re:Wild, Austin, TX, United States
- 9Institute of Marine Science, The University of Auckland – Waipapa Taumata Rau, Auckland, New Zealand
- 10Manta Watch Charitable Trust, Auckland, New Zealand
- 11Marine Species Team, Department of Conservation, Auckland, New Zealand
- 12Hopkins Marine Station, Stanford University, Pacific Grove, CA, United States
- 13Planeta Océano, Lima, Peru
- 14Migramar, Forest Knolls, CA, United States
- 15University of Western Australia Oceans Institute, Perth, WA, Australia
Deep dives are performed by a range of marine megafauna, yet their function remains poorly understood. Proposed functions include foraging, predator avoidance, and navigation, but limited fine-scale data have hindered rigorous testing of these hypotheses. Here, depth time-series data from eight recovered and 16 non-recovered satellite tags deployed on oceanic manta rays (Mobula birostris) in Indonesia, Peru, and New Zealand were examined to characterise extreme dives and identify their potential function. From a total of 46,945 dives, 79 extreme dives (>500 m) were recorded, 11 of which were documented from recovered tags and associated high sampling frequency. Extreme dives were distinguished by rapid descents (up to 2.9 m s⁻¹), brief horizontal “steps” at depth, gradually slowing ascents, and extended periods spent near the surface both before and after diving. Unlike typical foraging dives, no substantial bottom phase was observed, and vertical oscillations—expected if feeding at depth—were absent. Extreme dives also occurred more frequently with increasing distance from the continental shelf edge as well as preceding periods of high 72h distance travelled, indicating they may inform subsequent movements. We propose that extreme dives enable oceanic manta rays to survey the properties of the water column, likely gathering environmental cues—such as temperature, dissolved oxygen, or geomagnetic gradients—to guide navigation and/or the decision to leave or remain in a general area. In open-ocean environments where external reference points are absent, such costly but infrequent dives may provide critical information for long-distance movements. Our results offer new insights into the role of extreme diving behaviour in oceanic manta rays and highlight the importance of fine-scale data for understanding deep-diving behaviours in marine megafauna.
1 Introduction
Deep dives to depths greater than 200 m appear ubiquitous across a wide variety of epipelagic fishes (Braun et al., 2022), with some, such as the shortfin mako shark (Isurus oxyrinchus), tope shark (Galeorhinus galeus), Atlantic bluefin tuna (Thunnus thynnus), and swordfish (Xiphias gladius), shown to routinely exploit mesopelagic and bathypelagic zones (Teo et al., 2007; Dewar et al., 2011; Santos et al., 2021; Schaber et al., 2022). In contrast, other species such as the basking shark (Cetorhinus maximus) and blue marlin (Makaira nigricans) perform deep dives infrequently, likely in response to specific environmental or behavioural triggers (Brill and Lutcavage, 2001; Gore et al., 2008; Lawson et al., 2010). The sporadic nature of deep dives in some species raises the question of whether these are simply a version of routine shallow dives or if they serve a fundamentally different purpose. A recent review identified multiple possible explanations for deep diving, including some that have been proposed for shallower vertical movements (e.g., foraging, thermoregulation, surveying the water column) as well as potentially unique functions, such as accessing magnetic gradients for navigation and/or parasite removal) (Braun et al., 2022). Although deep diving behaviour may have broad ecological significance, since it potentially facilitates energy transfer across trophic levels and connects surface and deep-sea ecosystems, field evidence of the function of deep dives is yet to emerge for many species.
One means to investigate the potential role of deep diving in epipelagic fishes is provided by tags that record depth time-series (DTS) data at high sampling frequencies (sampled at <30 s intervals). This is available from the archives of tags recovered after deployment and has enabled the detailed characterisation of dive profiles in some study species. Such DTS data allows the reconstruction of descent and ascent rates, accurate dive durations, and pre- and post-dive intervals—features not captured in summarised satellite-transmitted archival data (e.g., Bonfil et al., 2009). High sampling frequency DTS, often accompanied by temperature at depth records, can be used to break each dive into functional sections, which have been used in some studies to define the purpose of each dive. For example, by calculating vertical velocity throughout a dive, the descent, bottom, and ascent phases of the dive can be separated. Rapid vertical velocities during descent may indicate targeted dives to discrete features such as deep scattering layers (DSL) (Carey et al., 1990). Such descents have been shown in some species to lead to periods of residency within a depth band where foraging is believed to occur, for example, whale sharks (Rhincodon typus) descending to the DSL, or blue sharks (Prionace glauca) hunting for squid (Carey et al., 1990; Meekan et al., 2015). Dives with these characteristics are typically inferred to be foraging dives, although such inferences should be made cautiously and are more robust when supported by contextual environmental or behavioural data. Slow vertical velocities during descent can be indicative of gliding (i.e., using negative buoyancy to descend) (Meekan et al., 2015); in these dives the animal typically reaches a thermal limit before powered ascent begins (Watanabe et al., 2021). These dives are thought to be optimised for energy conservation, often while moving in a particular direction, potentially minimising the horizontal cost of transport (Weihs, 1973; Gleiss et al., 2011).
Mobulid rays provide exciting models to study deep-diving behaviour. Of the 11 species within the genus Mobula, deep diving has been recorded in five, with notable variations in the depth and frequency of dives among species. For example, Chilean devil rays (Mobula tarapacana) routinely dive to depths exceeding 500 m, with the deepest dives reaching a maximum of 1896 m (Thorrold et al., 2014). In contrast, reef manta rays (Mobula alfredi) only occasionally dive to mesopelagic depths, with a maximum recorded depth of 672 m (Lassauce et al., 2020). These differences likely reflect habitat preferences, with reef manta rays inhabiting shallow reef environments and Chilean devil rays occupying oceanic waters (Thorrold et al., 2014; Marshall et al., 2022).
The habitat of oceanic manta rays (Mobula birostris) straddles both offshore and inshore environments. This species is distributed circumglobally in tropical and subtropical oceans, occurring in epipelagic offshore habitats and also near productive coastal upwelling zones and seamounts (Stewart et al., 2016b; Marshall et al., 2020). Individuals may undertake long-distance movements exceeding 1000 km across ocean basins; for example, one individual moved from mainland Ecuador to the Galápagos Islands—a straight-line distance of over 1400 km—whereas another traversed from the coast of Peru to the Galápagos and then southward over a distance of >1800 km (Hearn et al., 2014; Andrzejaczek et al., 2021). Vertical movements of the species are thought to track prey undergoing diel vertical migration, such as zooplankton aggregating near the deep scattering layer (Stewart et al., 2016b; Beale et al., 2019). The deepest recorded dive for oceanic manta rays is 1246 m (Andrzejaczek et al., 2022); however, the absence of accompanying DTS data from recovered tags has limited the ability to infer the function of such deep dives.
In this study, we investigated the function of deep dives in oceanic manta rays by providing a comprehensive description of this behaviour using DTS data from satellite tags deployed in water off Indonesia, Peru, and New Zealand. By analysing both high-frequency archival data from recovered tags and transmitted data from non-recovered tags, we offer novel insights into the characteristics, for example, frequency, depth, and duration of deep dives by this species. We also identify environmental and spatio-temporal correlates of deep-diving behaviour. For this analysis, visual inspection of depth data supported defining deep dives as those between 200 and 500 m, as per (Braun et al., 2022), and extreme dives as those ≥500 m, as oceanic manta rays predominantly occupied epipelagic depths. In addition to high-resolution diving profiles from recovered archival tags, movement paths reconstructed from both recovered and non-recovered tags provided further context to assess how deep dives of the species related to broader patterns of space use and displacement. By addressing these objectives, we advance our understanding of the ecological drivers and potential functional roles of deep diving in oceanic manta rays and other large fishes of the epipelagic.
2 Methods
2.1 Study sites and satellite tag deployments
A total of 24 oceanic manta rays were tagged at three study sites between 2012 and 2022. Tags included 14 pop-up satellite archival tags (two MK10-PAT and 12 miniPAT), and 10 towed satellite tags (SPLASH10F - 321E) made by Wildlife Computers (Washington, USA). The first site was Raja Ampat in eastern Indonesia. Between September 2012 and May 2022, two MK10-PAT, nine MiniPAT, and one SPLASH10F - 321E tags were deployed using a modified pole spear while on SCUBA over a range of seasons; a subset of these tags are from Stewart et al. (2016a) and Beale et al. (2019). The second site was located near Tumbes off the coast of northern Peru. Between May and July 2018, three MiniPAT tags were deployed (detailed in Andrzejaczek et al., 2021). The third site was in the shallow coastal waters of the northeast shelf of Northland near Whangaroa in northern New Zealand. Between March 2019 and February 2022, nine SPLASH10F - 321E tags were deployed with a modified pole spear while freediving off Whangaroa Harbour, New Zealand.
Of the 24 tags, five MiniPAT tags were recovered from Indonesia, two MiniPAT tags were recovered from Peru, and one SPLASH tag was recovered from New Zealand. High sampling frequency (< 15-s) data were downloaded from the eight recovered tags, providing continuous time series of depth and temperature. The remaining 16 non-recovered tags transmitted summary data via satellite, which were aggregated into histograms and reported as mean values over intervals ranging from 6 to 24h.
2.2 Recovered tag time-series depth records, dive identification, and analysis
Time series of depth and temperature data were downloaded from recovered tags. The first 24h of data were discarded from analysis to remove anomalous data resulting from tagging; manta rays were not restrained as part of the tagging procedures and are expected to return to normal behaviour rapidly. Depth sensor drift was present in one tag. To correct for depth sensor drift whereby the tag reported depths deeper than the animal, the software Igor Pro (WaveMetrics, 2024) was used to calculate an average zero-offset in a moving 72h window so that depth was aligned to zero at the surface. Further analyses detailed below were then completed in the R Statistical Environment (R Core Team, 2024). Non-diving periods were defined as time spent within 50 m of the surface. Pre- and post-dive intervals were therefore the durations spent not diving immediately before and after a dive. To investigate differences in non-diving periods between extreme and shallow dives, Mann-Whitney U-tests were conducted to assess significant differences in pre- and post-dive intervals. Vertical velocity was calculated from the difference in consecutive depths divided by the sampling frequency of each tag (3, 5, or 15 s). Individual dives were extracted from the depth time series using the R package ‘diveMove’ (Luque, 2007). A dive was defined as time spent below the threshold of 50 m (Thorrold et al., 2014). Mean vertical velocity of descent of dives was calculated as (maximum depth – 50)/time taken to descend from 50 m to the maximum depth; similarly, the ascent vertical velocity was calculated as (maximum depth – 50)/time taken to ascend from maximum depth to 50 m. A Mann-Whitney U test was conducted to assess differences in vertical velocities of descents and ascents between extreme and shallow dives.
2.3 Daily locations and movement tracks
Maximum likelihood tracks were estimated using Wildlife Computers’ software package ‘Global Position Estimator 3’ (GPE3). GPE3 applies a hidden Markov model (HMM) to estimate the maximum likelihood daily location of a tag (Wildlife Computers, 2022). The model considers maximum depth, light level (twilight), and sea surface temperature (SST) data along with known deployment and release locations to calculate the most likely daily location (Skomal et al., 2017). A travel speed of between 1.25 and 2.0 m s−1 was input into the HMMs. This speed was calculated using a combination of several factors: mean speed between high-scoring fastloc GPS locations from SPLASH tag movements from multiple manta rays; drone video analysis of swimming oceanic manta rays in New Zealand; reported speeds of Caribbean manta ray Mobula cf. birostris (Fong et al., 2022); best fit with known locations of tag movements; and the resulting track score within GPE3 (Curnick et al., 2020). Tracks were assumed to consist of straight-line interpolated daily location estimates, providing a conservative estimate of rate of horizontal movement. Tracks did not account for land masses obstructing point-to-point locations. The straight-line distance between daily maximum likelihood locations is hereafter referred to as distance. To account for imprecise daily location estimates resulting from GPE3 error, we calculated mean distance over three days as a metric of movement, hereafter referred to as 72h distance. Three days was chosen based on the size of GPE3 error estimates, the number of twilights reported, the number and quality of locations for Splash tags, and the occurrence of gaps in transmitted data. Maximum likelihood tracks were plotted along with 50%, 75%, and 95% probability density surfaces (Andrzejaczek et al., 2021) and overlaid onto maps with the R package ‘ggOceanMaps’ (Vihtakari, 2023) using bathymetry data provided by NOAA (NOAA National Centers for Environmental Information, 2022).
To address known limitations of light-level-based location estimates (Lisovski et al., 2012), several quality assurance measures were applied to enhance track reliability. High-quality Fastloc GPS positions were used to validate GPE3 tracks where available, and GPE3 scores were optimised using known deployment and recapture locations (e.g., photo-ID matches). Travel speeds were adjusted following the approach of Curnick et al. (2020), and tracks with more than three consecutive days of missing twilight or maximum depth data were excluded from analysis. The use of 72h distance (mean three-day straight-line distance) further reduced sensitivity to daily positional uncertainty and provided a more robust measure of spatial movement.
2.4 Abiotic correlates of horizontal dive steps
A Spearman rank correlation test was used to explore the relationship between dissolved oxygen (DO) concentration and horizontal step depth during deep dives. Horizontal steps were defined as periods during deep or extreme dives when absolute vertical velocity was <0.1 m s−1 for ≥ 1 min. DO data were obtained from the daily ‘Global Ocean Biogeochemistry Analysis and Forecast’ modelled dataset provided by Copernicus Marine Environment Monitoring Service (CMEMS) (CMEMS, 2019). For each dive, the date and most likely GPS location were matched to the nearest 0.25 × 0.25-degree grid cell in the CMEMS data, from which the vertical dissolved oxygen profile was extracted. DO data were available in 38 depth bins ranging from 0.49 to 1452 m, with greater resolution in shallow water. The DO value corresponding to each step depth was extracted from the matching vertical profile, allowing correlation analysis between step depth and local DO concentration. Validation indicates a typical uncertainty of ±5–10 µmol kg−¹ in the upper ocean, with greater variability below the thermocline (CMEMS, 2019). Although subject to model error, the vertical gradients are sufficiently resolved to identify relative changes in DO with depth relevant to mesopelagic diving behaviour.
2.5 Biotic and abiotic correlates of extreme deep dives
Across all 24 recovered and unrecovered satellite tags, 2705 tag-days of data were recorded. Of these, 79 days included an extreme dive. To ensure the reliability of location estimates used for modelling, only daily GPE3 locations supported by high-quality twilight data (i.e., no gaps exceeding three consecutive days) and accompanying maximum depth records were included. Additionally, the datasets from Indonesia (5 of 1454 days featuring extreme deep diving) and Peru (3 of 170 days) were heavily zero-inflated and therefore excluded from modelling, as preliminary analyses indicated insufficient data to support inference. The final dataset comprised 572 days from tags deployed in New Zealand, where sufficient extreme dive occurrence and location data permitted robust modelling.
A generalised linear mixed model (GLMM) from the R package ‘lmerTest’ (Kuznetsova et al., 2020) was fitted to the occurrence of extreme dives as a function of oceanographic and location-based covariates, while accounting for the random effect due to individual variation (Howey et al., 2016). The daily GPE3 location estimates were used to calculate all position-dependent variables. A total of 13 biotic and abiotic covariates were considered. Covariates were rescaled to ensure comparability and screened for high collinearity (>0.50). The correlation structure among variables is shown in Supplementary Figure S1.
Daily distance was calculated initially; however, it was not included in the modelling. Instead 72h distance was used to allow for inaccuracy in daily location estimates. Net primary productivity and concentrations of phosphate, dissolved oxygen, and nitrate were also extracted from the CMEMS Biogeochemistry dataset but were removed due to high collinearity with other variables. Similarly, bathymetry and distance to nearest land were excluded due to high collinearity with distance to shelf edge, which is defined as the distance in km from each estimated position to the nearest location where bathymetry exceeded 200 m depths.
Mean 72h distance, distance to shelf edge, chlorophyll a concentration, moon phase, mean SST, and wind-generated waves were retained (Table 1), as they had the lowest collinearity. These were treated as fixed-effect explanatory variables. The binary response variable indicated whether an extreme dive occurred on a given day. Manta ID was included as a random effect. Stepwise model selection using the R package ‘MuMIn’ (Barton, 2022), guided by Akaike Information Criterion (AIC) and the principle of parsimony, identified the best-fitting model.
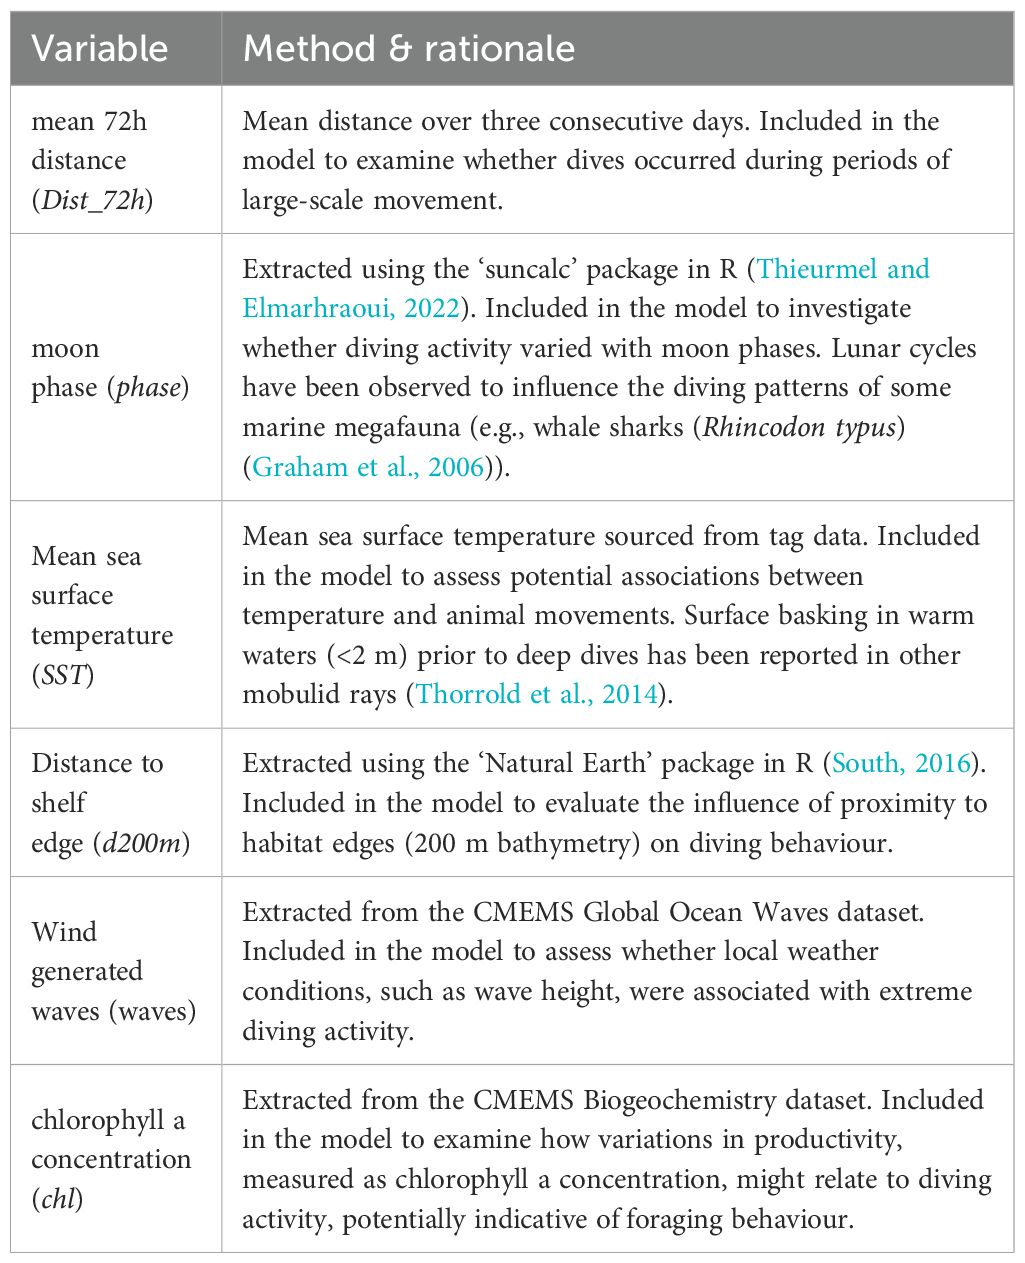
Table 1. Abiotic and biotic variables included in the generalised linear mixed models to analyse correlations with extreme dive occurrence: methods of calculation and selection rationale.
All means are reported with standard deviation (SD), and medians with interquartile range (IQR).
2.6 Ethics statement
Animal ethics approval was granted by Murdoch University animal ethics committee permit number RW3318/21 and protocol ID 836, and by the Indonesian ethics committee of the National Research and Innovation agency (BRIN) proposal number 07062022000004.
3 Results
In total, 2,705 d of tag data were collected from 24 animals. The eight recovered satellite tags yielded a time series of 957 d of depth data from tag archives (Table 2), with 791 d from five tags in Indonesia, 100 d from two tags in Peru, and 66 d from one tag recovered in New Zealand. A total of 11 extreme dives were recorded from four of these eight datasets (Table 2). The GPE3 maximum likelihood daily locations generated for these recovered tags were continuous, with no gaps in input data (Supplementary Figures S2–S9); representative examples from each study site are presented in Figure 1. An additional 1,748 d of summarised data were transmitted by satellite from 16 non-recovered tags (Table 2), comprising 1,172 d from Indonesia (seven tags), 70 d from Peru (one tag), and 506 d from New Zealand (eight tags). GPE3 generated maximum likelihood tracks for these 16 tags (Supplementary Figures S10–S25) had varying levels of accuracy.
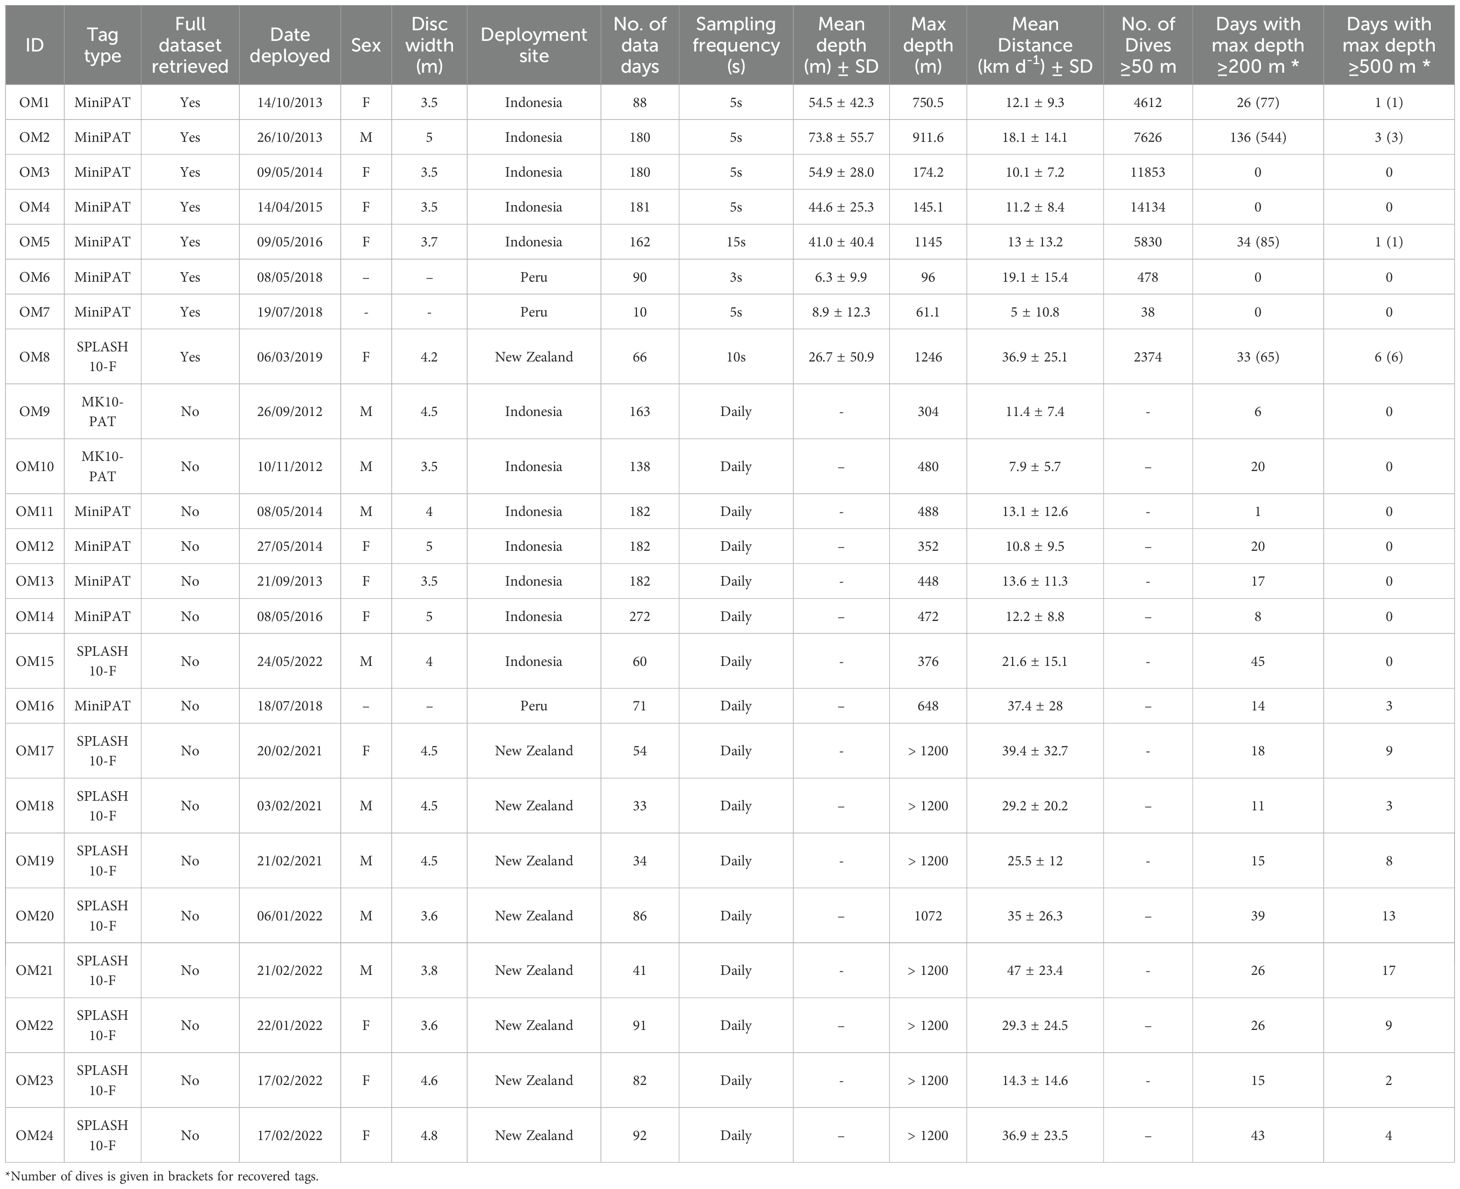
Table 2. Summary details from 24 satellite tag deployments on oceanic manta rays in Indonesia, Peru, and New Zealand.
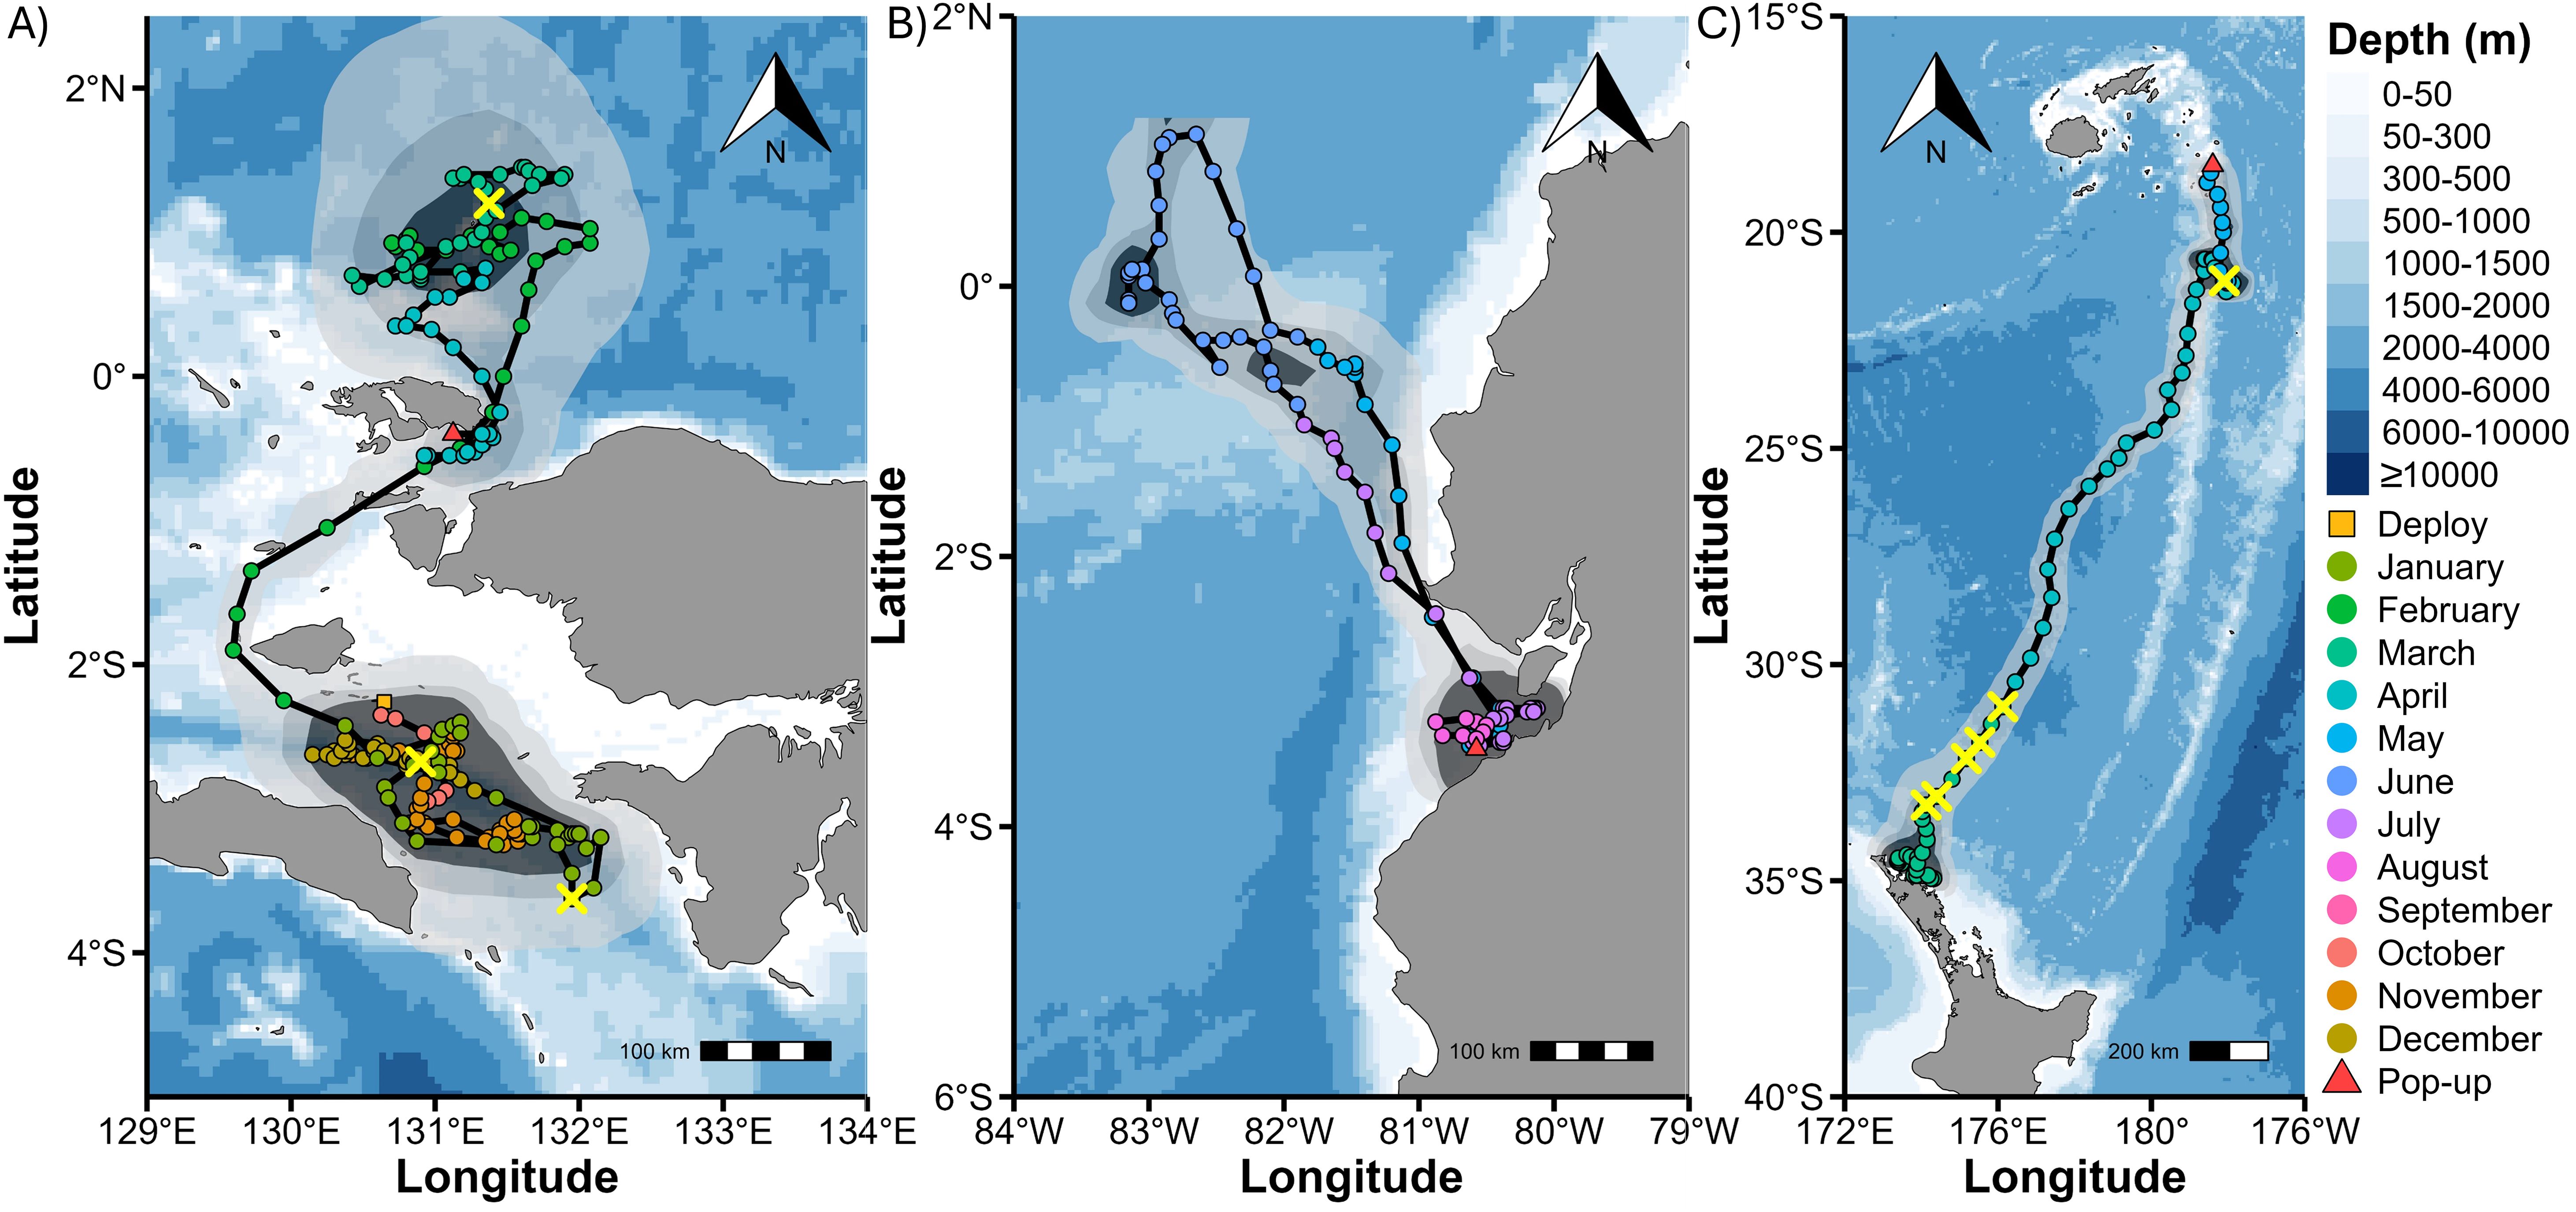
Figure 1. Example daily maximum likelihood location estimates with connecting straight-line movement tracks, output from Wildlife Computers Global Position Estimator 3 (GPE3) software. (A) Indonesia - OM2. (B) Peru - OM6. (C) New Zealand - OM8. Daily locations are the central point of location likelihood ellipses given by GPE3, coloured by month. Locations of extreme dives are marked with a yellow X, tagging sites by an orange square, and release locations by a red triangle. Polygons represent the probability density surfaces for each tag, with light to dark shades representing 95%, 75% and 50% probability contours. Different scales apply.
3.1 Daily locations and movement tracks
Recovered tags and splash tags provided the highest location accuracy. Three MiniPAT tags (OM9, OM10, and OM12) were excluded from GLMM analysis due to multiple data gaps exceeding five days. Details on GPE3 scores, track speed, twilights, SSTs, and location accuracy are available in Supplementary Table S1. Mean daily distance travelled pooled across data sets was 17.1 ± 17.7 km d−1 (median: 11.5 km d−1, IQR: 16.8) and was lower in Indonesia (12.1 ± 10.5 km d−1) than in Peru (24.0 ± 22.4 km d−1) and New Zealand (32.1 ± 25.1 km d−1). Oceanic manta rays tagged in Indonesia remained within the country’s exclusive economic zone (EEZ) (e.g., Figure 1A). However, those tagged in New Zealand and Peru travelled beyond national waters, entering both international waters and other nations’ EEZs (e.g., Figures 1B, C). Tags recovered from Indonesia after six-month deployments exhibited repeated latitudinal movements away from and back toward the tagging site, consistent with broad-scale north–south excursions. Although deployments in New Zealand and Peru were shorter, their movements also suggested cyclic patterns. In New Zealand, movements appeared seasonal, occurring as water temperatures began to drop, and oriented towards Fiji or Tonga. For example, OM8’s 67-d track covered >2500 km as it travelled north into tropical waters. OM8 exhibited three distinct phases during its 67-d track, representative of rays in this deployment site: an inshore phase along New Zealand’s coastal waters (mean daily straight-line distance 11.6 ± 11.1 km), a 29-d offshore phase covering 1700 km (60.3 ± 15.3 km d−1), and a third phase involving lower daily straight-line distances near the Lau Islands (24.5 ± 13.4 km d−1; Supplementary Table S2; Figure 1C).
3.2 Sea surface temperatures of recovered tags
Mean daily SSTs varied between tags (Tables 2, 3) and sites: Indonesia (28.0 ± 1.3°C), Peru (24.3 ± 1.0°C), and New Zealand (23.9 ± 2.6°C). OM8 experienced the greatest shift in SST, from 22.1 ± 0.23°C at the deployment site in New Zealand (−34.9°S) to 27.1 ± 0.11°C at the release location in the tropical Lau Islands (−18.5°S). This individual left the coastal waters of New Zealand heading north at the onset of the austral winter.
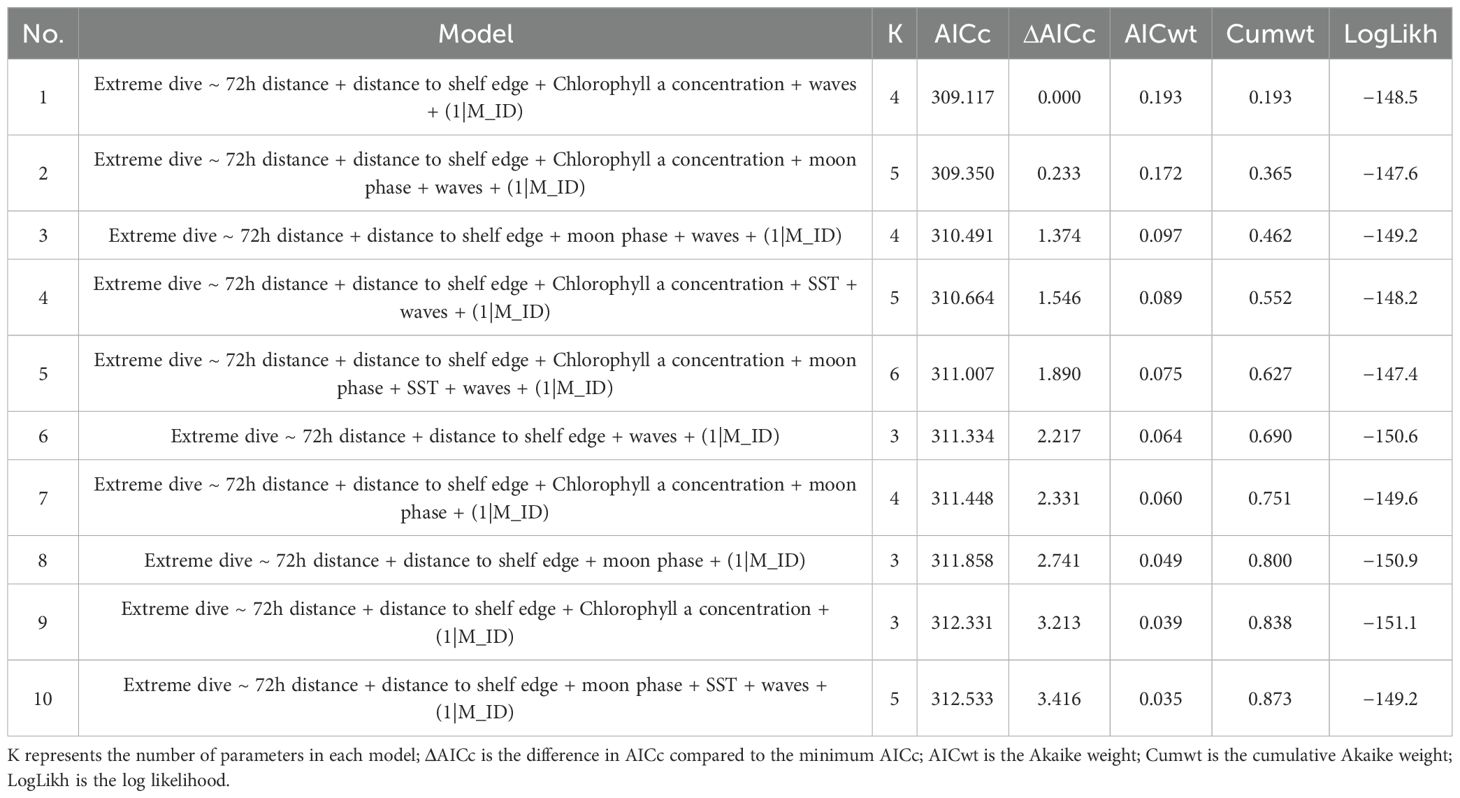
Table 3. Generalised linear mixed model selection based on AICc.
3.3 Analysis of recovered tag datasets
Analysis of the eight recovered tags across the three study sites (Table 2) revealed substantial individual variability in the diving behaviour of oceanic manta rays, with some individuals exclusively using shallow waters, whereas others dived beyond depths of 750 m. Depth and temperature were recorded at sampling frequencies of 3–15 s, providing a detailed profile of vertical movement patterns. The tagged oceanic manta rays exhibited a broad depth range, extending from the surface down to 1,246 m, in water temperatures from 29.8 to 4.6°C. Across these tags, 46,945 dives were identified from the DTS. Shallow dives (<200 m) comprised 98.36% of dives, whereas deep dives (200–500 m) and extreme dives (≥500 m) comprised 1.62% (n = 760) and 0.02% (n = 11), respectively. Four bathypelagic dives (>1000 m) were recorded, one in Indonesia and three from a ray tagged in New Zealand. The mean maximum depth across deep and extreme dives was 258.9 m (± 94.1). Individual variability in depth use was pronounced, with rays spending varying amounts of time across different depth ranges. For example, OM1 in Indonesian waters spent 51.0% of its time in shallow waters (≤50 m), 48.4% diving in the epipelagic zone between 50 and 200 m, and 0.6% in depths greater than 200 m. In contrast, OM3 in Indonesian waters spent 100% of its time in shallow waters, with a maximum depth of 174.2 m, with no recorded deep dives.
3.3.1 Depth time-series of recovered tags
The depth time series revealed distinct differences in diving behaviour across individuals and study sites (Figure 2; Supplementary Figures S26–S30). Mean depths varied consistently within each site but differed between sites; for example, mean depths in Peru were shallower than those at other sites, whereas tags deployed in Indonesia recorded the deepest mean depths, despite two tags not exceeding 175 m (Table 2). Maximum depths varied considerably, with four individuals remaining within the epipelagic zone (<200 m) and the remaining four exceeding 750 m (max: 1246 m, OM8; Table 2). Shallow dives (<200 m) occurred throughout the day, with a peak from 04:30 to 06:30 (Supplementary Figure S31). These dives had a mean vertical descent velocity of 0.16 ± 0.21 m s−1 and often included oscillations within a narrow depth range. The highest vertical velocities were recorded at depths shallower than 50 m, with descent speeds reaching 4.8 m s−1 and ascent speeds up to 6.0 m s−1. Dives between 200 and 300 m were rare but frequently occurred in succession (e.g., Figure 2A). Dives exceeding 300 m were uncommon, typically limited to one per day during daylight hours. The timing of deep and extreme dives followed a normal distribution centred around the late morning (Supplementary Figure S32), with 78% of deep dives occurring during daylight hours (6 am – 6 pm) and 64% of extreme dives starting between 9 am and 2 pm.
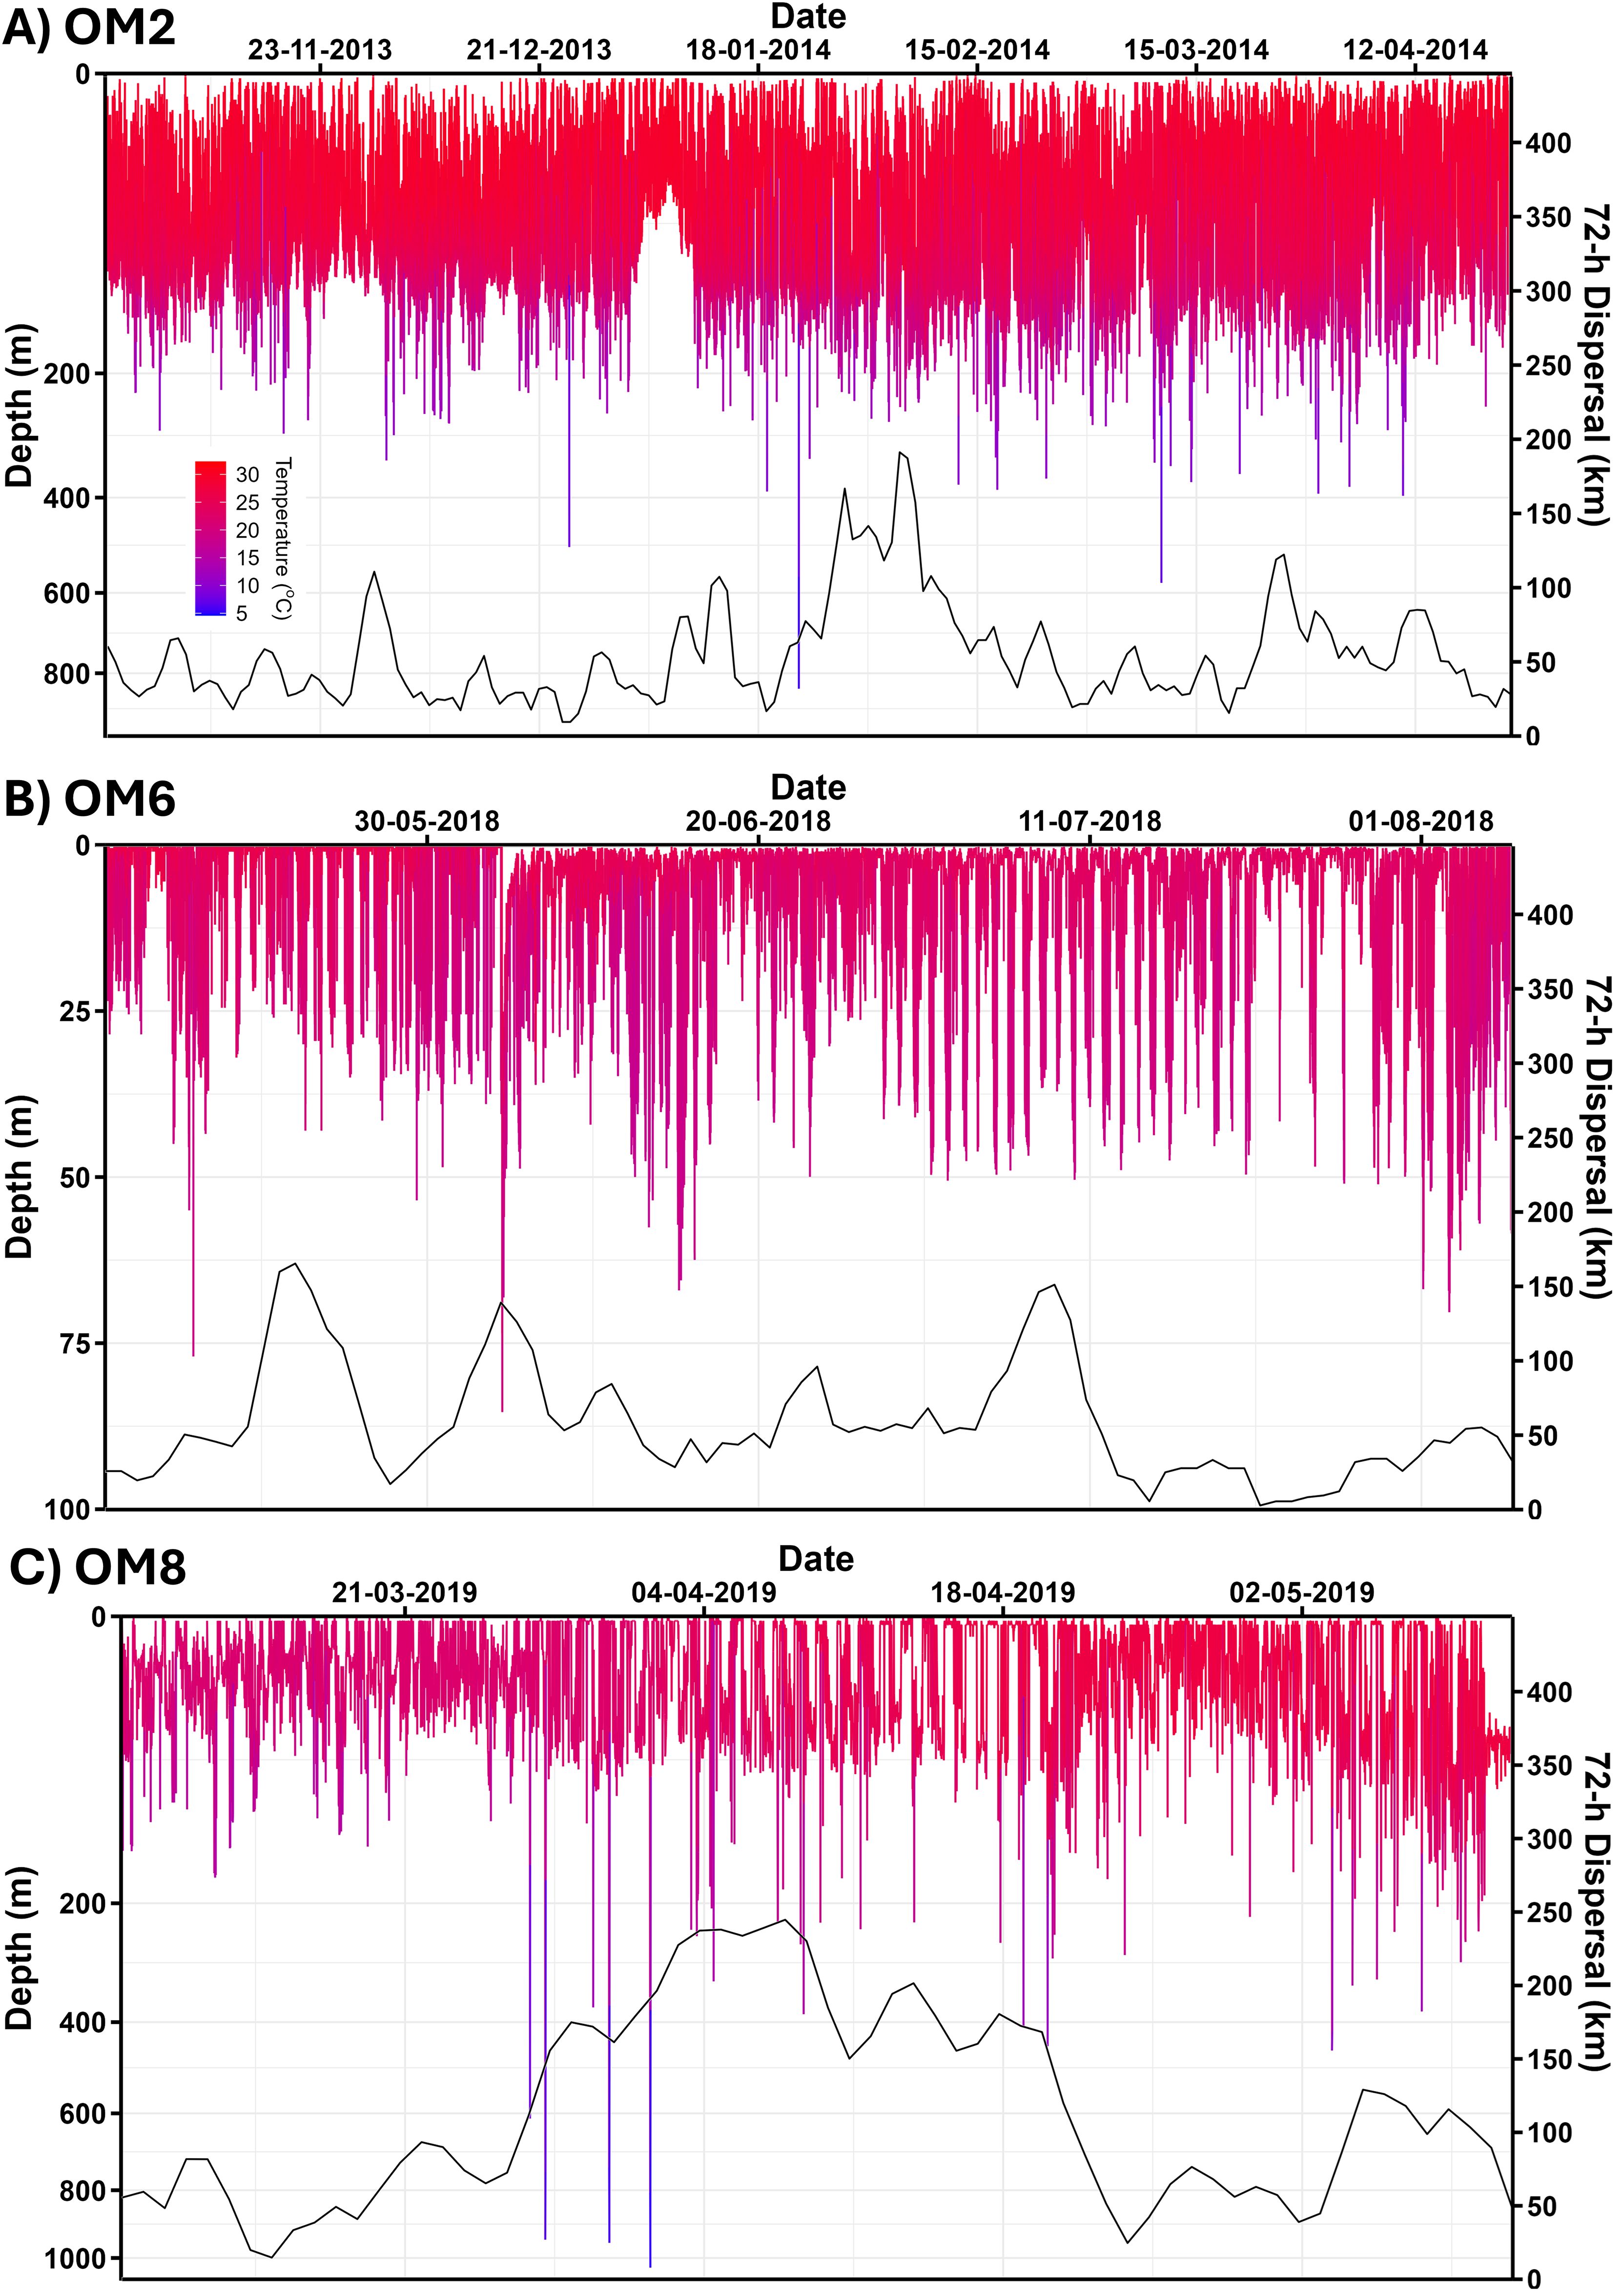
Figure 2. Depth time-series data from three recovered satellite tags deployed on oceanic manta rays. Coloured by temperature, legend in (A). (A) Indonesia – OM2. (B) Peru – OM6. (C) New Zealand – OM8. Note: OM2 and OM8 have semi-log depth axis. Second Y-axis shows 72h distance in kilometres. Note different length deployments.
Depth time-series data were overlaid with 72h distance, revealing peaks in distance travelled (ranging from 75 to >200 km) across all oceanic manta rays where >2 weeks of data were recorded (Figure 2; Supplementary Figures S26–S30). These peaks typically followed extreme dives. Manta rays tagged in Indonesia had an overall median daily distance travelled of 8.8 ± 11.1 km, similar to that of Peru (median: 15.7 ± 21.1 km) but lower than that of New Zealand (median: 34.8 ± 36.3 km). Manta OM2 in Indonesian waters displayed deep dives on 75% of days over its 181-d of tracking (Figure 2A), with three extreme dives recorded and a median 72h distance of 44.5 km (IQR 35.8). In contrast, OM6 in Peru remained at depths <100 m throughout its track (Figure 2B) and had a median distance of 49.7 km (IQR 40.1). OM8 in New Zealand performed six extreme dives and had the highest median distance among the recovered tags of 91.7 km (IQR 113.2) (Figure 2C). Depth time series of other recovered tags are presented in Supplementary Figures S26–S30.
3.3.2 Kinematics of extreme dives from recovered tags
The profiles of extreme dives were distinct from those of shallow dives. Extreme dives typically began with a rapid descent from a depth of 50 m occurring within the first 10 min from leaving the surface. Below 200 m they exhibited characteristic features: steep descents interspersed with horizontal steps lasting up to 15 min, V-shaped profiles with minimal bottom time, and ascents punctuated by additional horizontal steps. Ascents progressively slowed as depth decreased, creating right-skewed profiles. Depth oscillations during extreme dives were minimal (Figure 3). The median vertical velocity of descent was higher in extreme dives (median: 0.577 m s⁻¹, IQR: 0.289 m s⁻¹, max 2.9 m s⁻¹) compared to shallow dives (median: 0.095 m s⁻¹, IQR: 0.116 m s⁻¹, max 6.0 m s⁻¹, W df = 391,424, p < 0.001). The median vertical velocity of ascents was also different between extreme (median: 0.503 m s⁻¹, IQR: 0.140 m s⁻¹, max 2.85 m s⁻¹) and shallow dives (median: 0.140 m s⁻¹, IQR 0.177 m s⁻¹, max 4.8 m s⁻¹, W df = 389,355, p < 0.001), with extreme dives exhibiting a faster ascent vertical velocity.
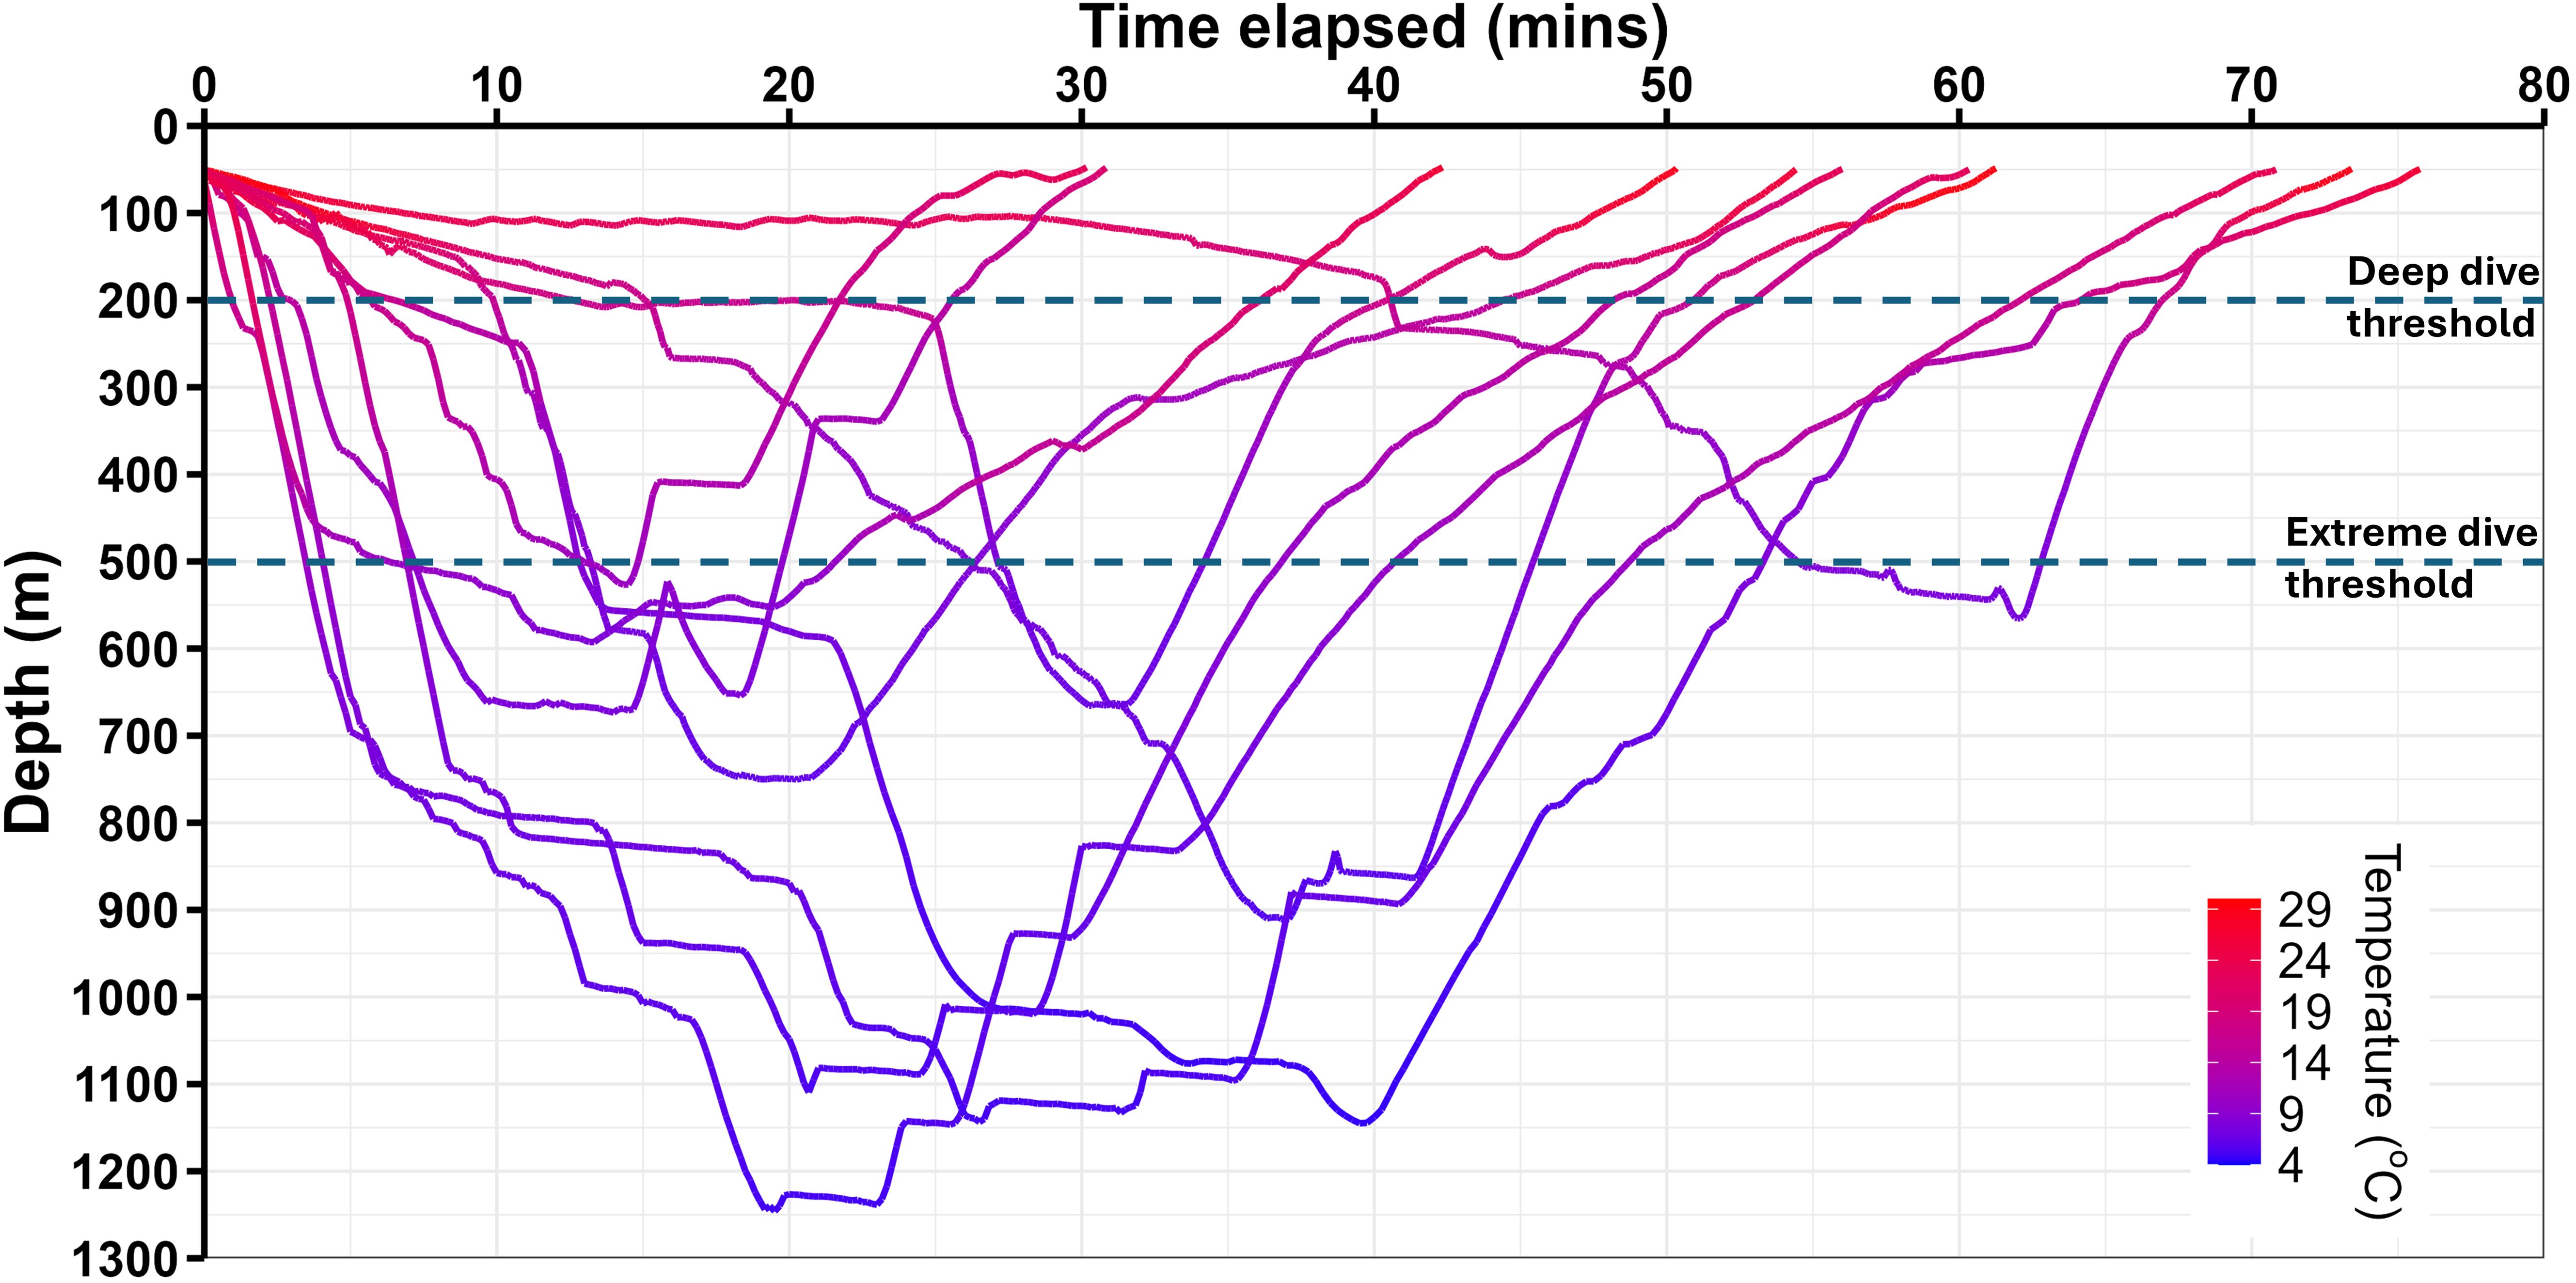
Figure 3. Depth time-series profiles of 11 extreme (≥500 m) dives from recovered satellite tags deployed on oceanic manta rays in Indonesia and New Zealand. Lines are coloured by temperature. Sampling frequency of depth and temperature varies between 5 and 15-s.
The mean depth of non-diving periods (<50 m) was 6.3 m (± 9.2) before extreme dives and 12.7 m (± 11.6) after extreme dives. These depths were shallower than the mean non-diving depth of 17.6 m (± 15.6). There were also differences in both pre-dive (time spent < 50 m before a dive) and post-dive (time spent < 50 m after a dive) durations between extreme and shallow dives. Pre-dive durations were longer for extreme dives (median: 34.8, IQR: 73.5 min) compared to shallow dives (median: 4.67, IQR: 12.9 min; Wdf = 466,347, p = 1.46 × 10⁻⁶). Similarly, post-dive durations were longer for extreme dives (median: 36.8, IQR: 43.2 min) than shallow dives (median: 4.67, IQR: 12.9 min; Wdf = 442,386, p = 1.92 × 10⁻⁵).
3.3.3 Stepped descents and ascents (recovered tag data)
To increase the number of observations used in further analyses, all dives ≥200 m depths were visually inspected for characteristics of extreme dives. Dives ≥400 m exhibited sustained vertical velocity descents, little to no bottom time, and gradually slowing ascents. Consequently, 34 dives ≥400 m were included in the analysis of horizontal steps. One dive was excluded due to unavailable modelled dissolved oxygen data from CMEMS. Horizontal steps were observed in all 34 dives (e.g., Figure 3) extracted from recovered satellite tags. Dives with a maximum depth of 400–500 m frequently featured a single horizontal step, serving as a brief bottom phase with a vertical velocity below 0.1 m s−1 sustained for at least 1 min (as per horizontal steps). Deeper dives typically had multiple steps.
The depth of the first step and the depth of peak dissolved oxygen content varied among dives. However, regardless of deployment site, the depth of the first deep step (≥200 m) typically occurred within the depth range of the peak in dissolved oxygen content (e.g., Figure 4, red shaded rectangle). Tag-recorded temperatures at the depth of peak dissolved oxygen (± 25 m) were available for 24 of 34 dives ≥400 m. These temperatures ranged from 7.05 °C to 15.4 °C, with a median of 10.9°C (IQR: 3.74°C). Steps were also recorded during ascent, with the final step often occurring at depths similar to the first step (Figure 4).
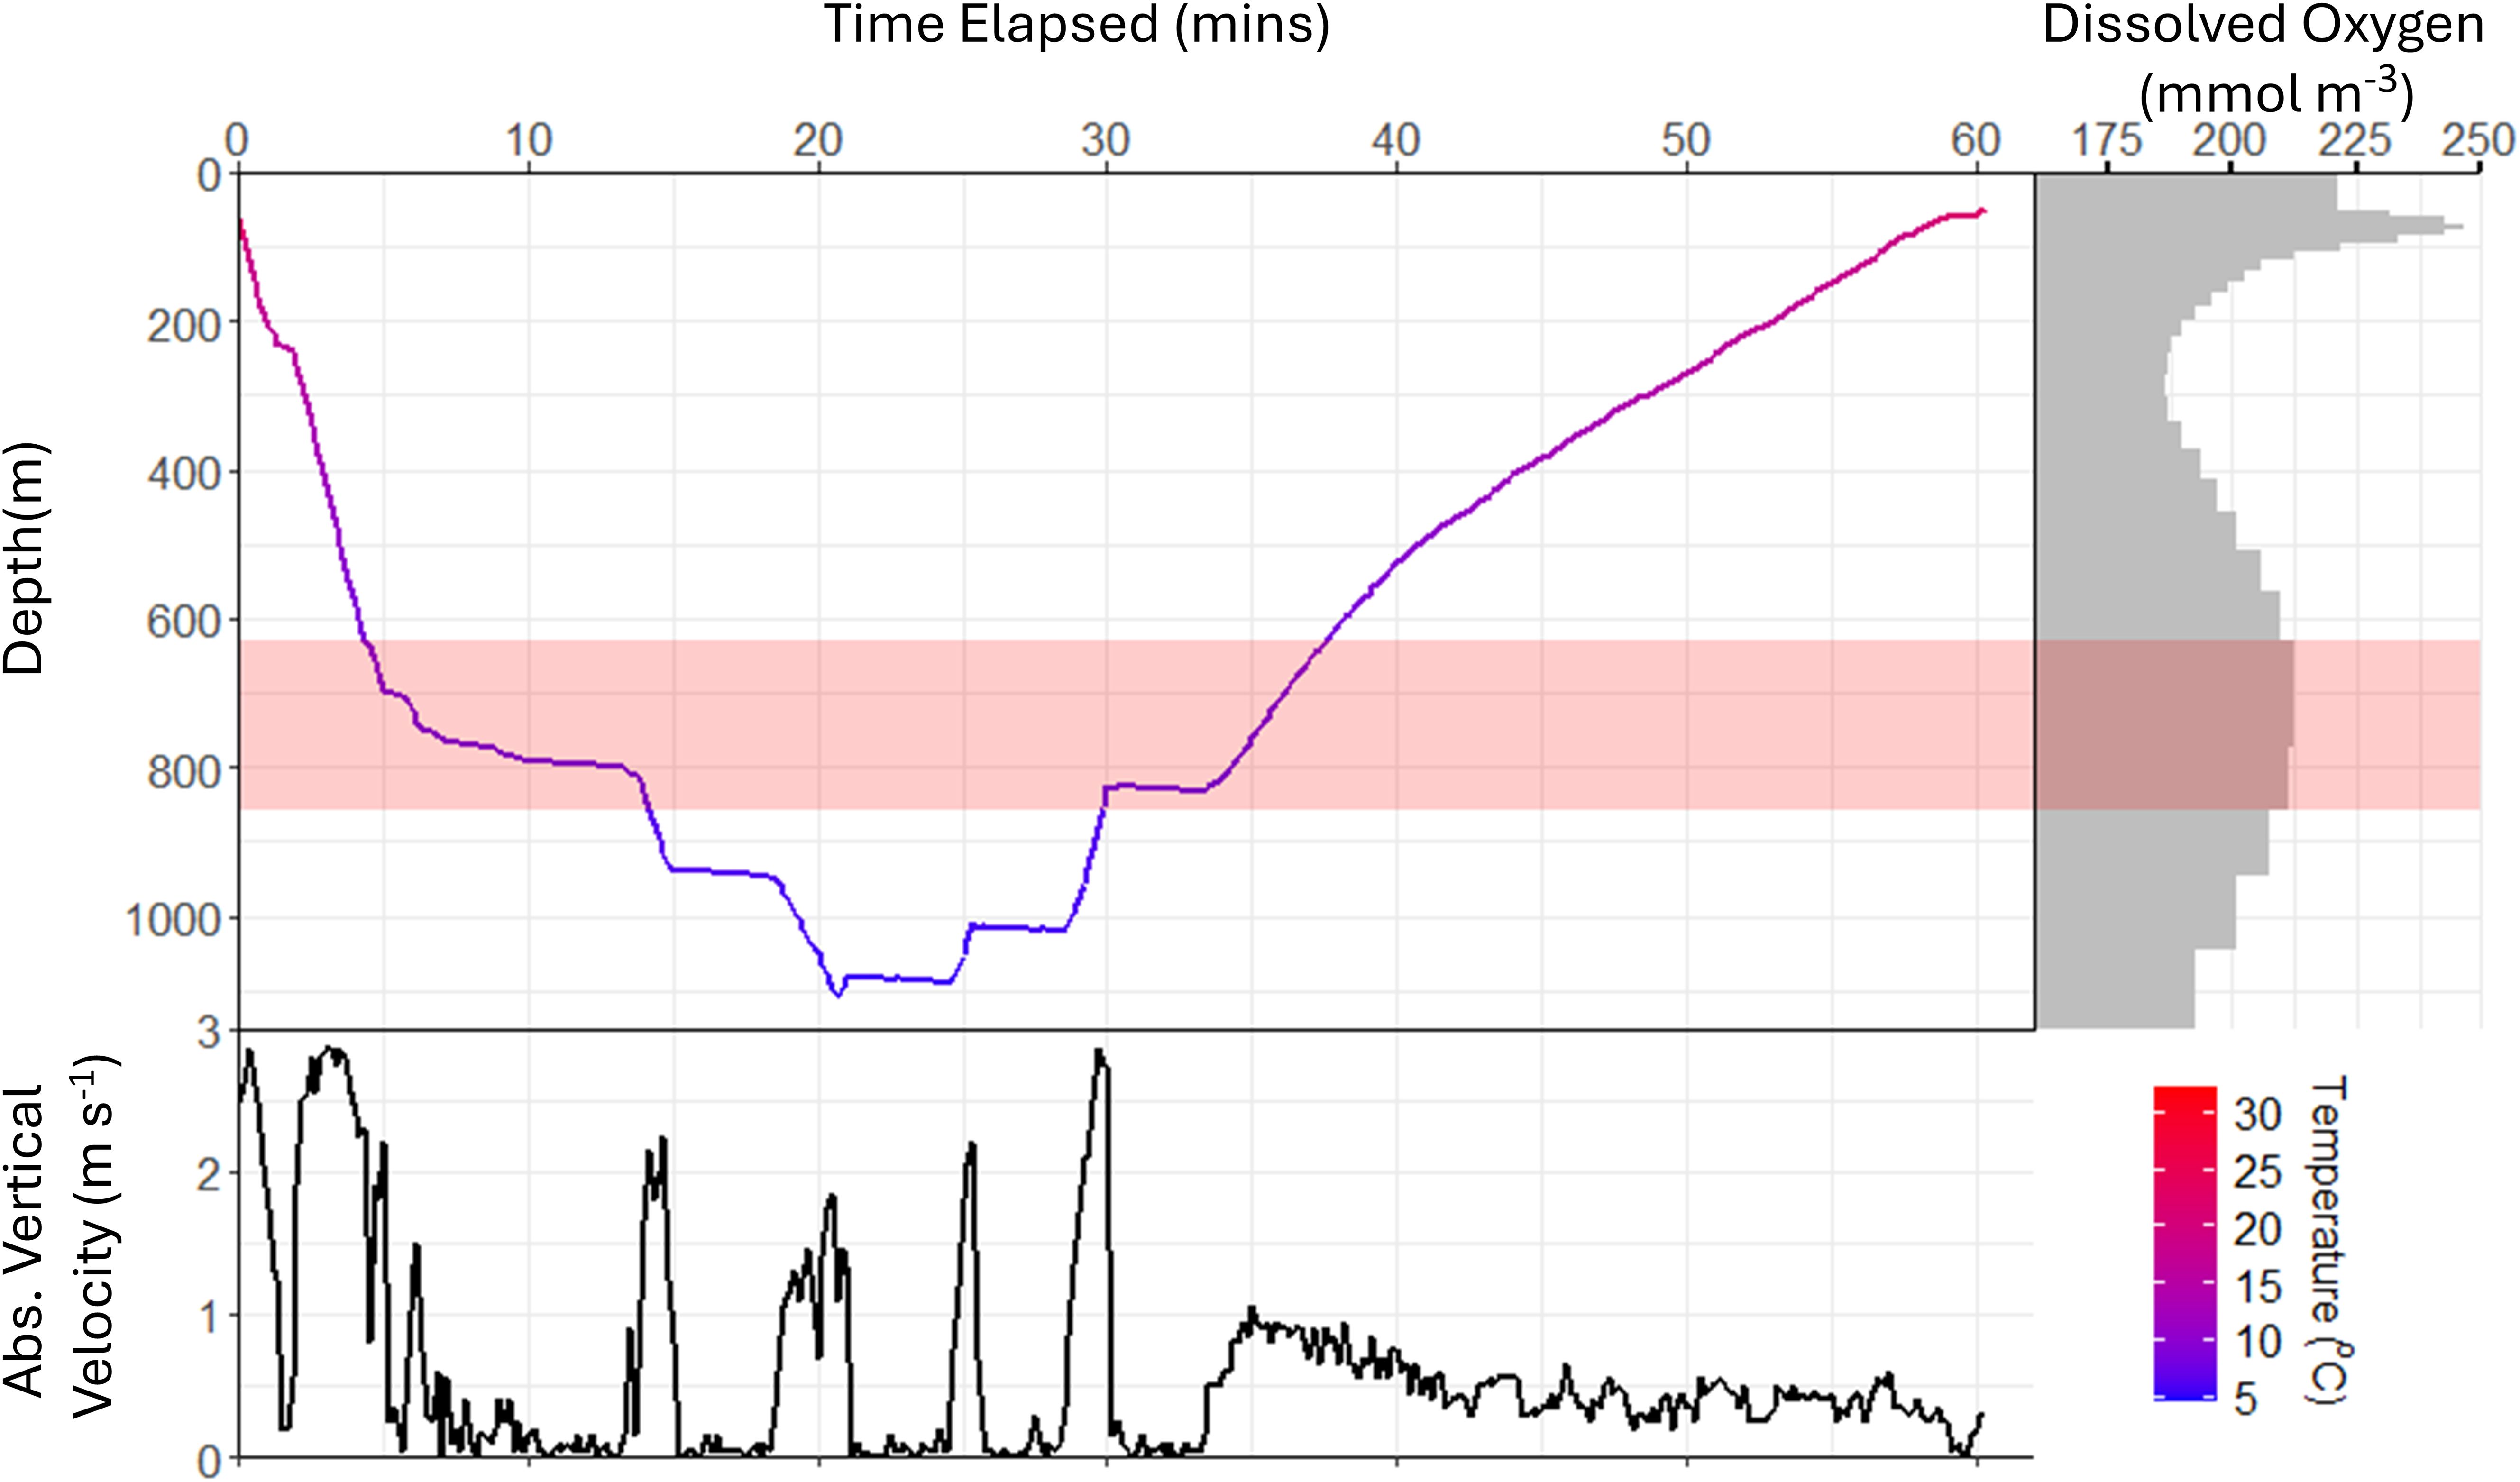
Figure 4. Representative extreme dive profile of oceanic manta ray OM8 tagged in New Zealand. (A) Depth time-series recorded at 10-s intervals, maximum depth 1110 m, note the right-skew with a slower ascent than descent. (B) Absolute vertical velocity (m s-1), highlighting periods of horizontal steps with vertical velocity <0.1 m s-1 between high vertical velocity descent periods (> 2 m s-1). (C) Modelled dissolved oxygen concentration at depth (mmol m-3), showing the secondary peak of dissolved oxygen content in deep water. Panels all coloured by ambient temperature. Red shading indicates peak dissolved oxygen depths which coincides with depth of first horizontal step.
3.3.4 Bathymetric constraints on dives recorded on recovered tags
Oceanic manta rays rarely descended to within 50 m of the ocean floor when the bathymetry exceeded 100 m (Figure 5). They were found to be in waters deeper than 200 m on 93.5% of days (901 of 957 d), yet deep dives were only recorded on 24.0% of days (230 of 957 d). During extreme dives, oceanic manta rays remained at least 600 m above the reported bathymetry on all but one occasion; however, there was no correlation between extreme dive maximum depth and bathymetry depth (r = 0.17, p = 0.624).
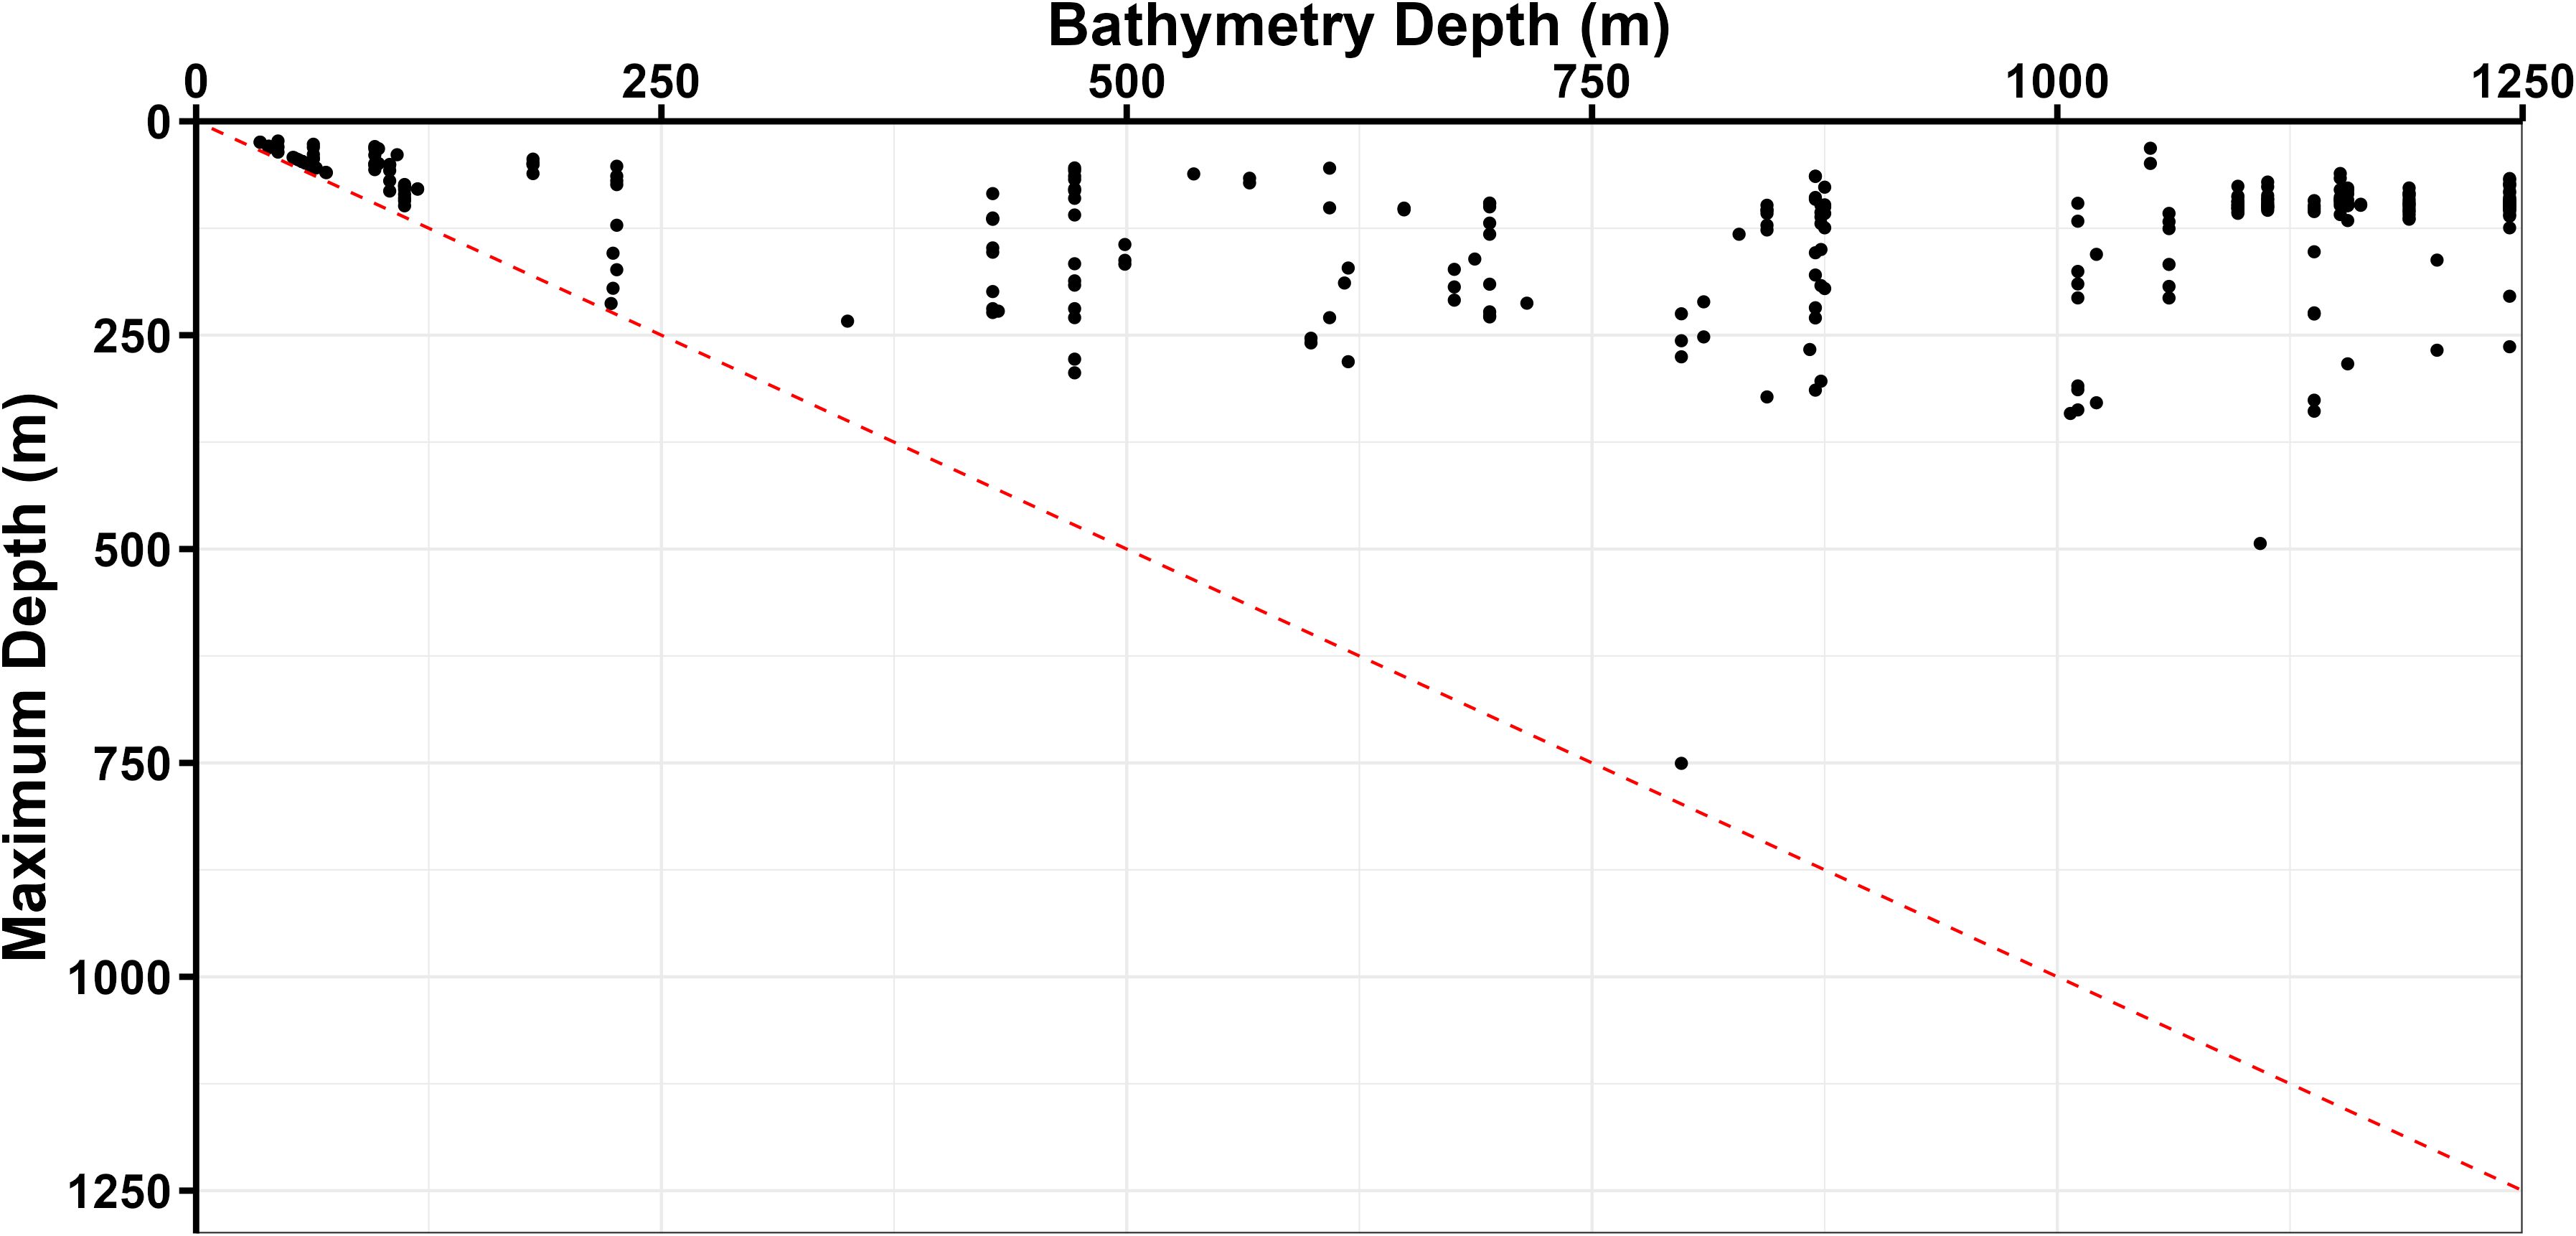
Figure 5. Daily maximum depth of recovered tags against the reported bathymetry depth for each day. Bathymetry from ETOPO - 1 dataset using GPE3 maximum likelihood daily location estimate. Bathymetry depths exceeding 1300 m were removed from the plot as they exceeded the maximum dive depth. Red dashed line is the line of unity.
3.4 Analysis of extreme dives recorded on all satellite tags
Extreme dives were recorded on 79 of 2,505 days (3.2%) across all 24 tags, with the most recorded from New Zealand rays (71 of 79). The median number of days between extreme dives from New Zealand rays was 2 (IQR 3). Visual inspection of movement tracks indicated an apparent association between the occurrence of extreme dives and subsequent increases in 72h distance (Figure 2; Supplementary Figures S26–S30). The median 72h distance for all tags was 35.3 km (IQR 38.2), with a maximum of 294 km recorded within 72h of an extreme dive.
3.4.1 Correlations between biotic and abiotic variables and extreme dives
The top 10 models resulting from the full GLMM (Table 3) highlight five models with ΔAIC < 2, indicating similar fit to the data. Among these, Model 1 had the lowest AIC and was the most parsimonious (K = 4); it was therefore selected as the best-fitting model. This model included the fixed effects of 72h distance, distance to the shelf edge, chlorophyll a concentration, and wind-generated waves; these effects were present in most of the five top models. The selected best-fit model explained 26.9% of the deviance in the occurrence of extreme dives relative to the null model (Supplementary Table S4). No autocorrelation was found (Supplementary Figure S33) in the residuals. Although five models featured ΔAICs < 2, they all included 72h distance and distance to the shelf edge, with four of the five also featuring chlorophyll a, supporting the importance of those three variables.
Model estimates for both the best-fit model (Table 4) and the full model (Supplementary Table S3) are reported, along with comparisons to the null model (Supplementary Table S4). The marginal R-squared (R2m) for the best-fit model was 40.4%, indicating that the fixed effects alone explained a substantial proportion of the variance. The conditional R-squared (R2c) (which includes both fixed and random effects) was 47.5%, indicating the random effect of the individual only accounts for a small proportion (7.1%) of variability in extreme diving behaviour.
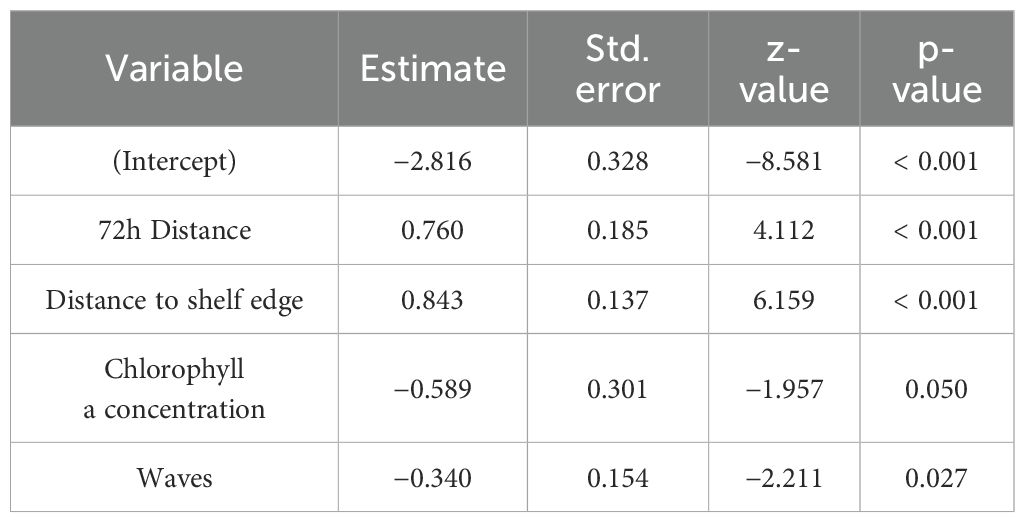
Table 4. Model estimates from the best-fit model [Extreme dive ~ 72h distance + chlorophyll a concentration + distance to shelf edge + waves + (1M_ID)].
The model intercept was negative, indicating that when all other variables were at their baseline values (or zero), the probability of extreme dives was very low. Both 72h distance and distance from shelf edge were positive, indicating that extreme dives were more likely to occur as distance from the shelf edge increased, and there was a high likelihood of larger mean 72h distance after extreme dives. Chlorophyll a concentration had a negative estimate, suggesting that as concentration increased, there was a decrease in the likelihood of an extreme dive occurring. Wind-generated waves had a negative estimate, indicating that as wave height increased there, was a decrease in the likelihood of extreme dives.
4 Discussion
4.1 Key features of extreme dives
Extreme dives in oceanic manta rays (Mobula birostris) followed a consistent sequence comprising five phases: extended pre-dive surface intervals, steep descents, horizontal steps at depth, gradually slowing ascents, and extended post-dive surface intervals. Pre-dive durations were significantly longer than for routine dives, often exceeding an hour, with dives typically initiated from depths <10 m. Descent vertical velocities reached up to 2.9 m s⁻¹, exceeding the threshold for passive gliding and suggesting actively powered descents. These descent speeds were markedly higher than those recorded during routine swimming or straight-feeding in reef manta rays (M. alfredi) (~0.75 m s⁻¹) (Fong et al., 2022) and far exceed gliding velocities (<0.2 m s⁻¹) documented in negatively buoyant elasmobranchs (Gleiss et al., 2011; Braun et al., 2014; Fontes et al., 2022). Below 200 m, descents were punctuated with horizontal steps—brief pauses in vertical movement with velocities <0.1 m s⁻¹—that often occurred near midwater dissolved oxygen peaks. Maximum depths reached 1250 m, with no prolonged bottom phase. Ascents slowed progressively, typically including additional shorter-duration steps. Post-dive surface intervals were again significantly extended, suggesting physiological recovery following extreme dives. Notably, extreme dives were followed by significantly increased horizontal displacement, with peaks in 72h distance frequently exceeding 200 km. This structure of long pre- and post-dive intervals, steep V-shaped dive profiles, interspersed steps, and absence of sustained bottom phases aligns closely with extreme dive profiles reported in shortfin mako sharks (Isurus oxyrinchus) (Sepulveda et al., 2004), elephant seals (Mirounga angustirostris) (Robinson et al., 2012), blue sharks (Prionace glauca) (Howey et al., 2016), tunas (Thunnus spp.) (Musyl et al., 2011), and scalloped hammerhead sharks (Sphyrna lewini) (Klimley, 1993), where they have often been associated with navigation, environmental sampling, or rapid transit through less favourable habitats.
The dive profiles of extreme dives differed from typical foraging dives. Oscillatory movements commonly associated with manta rays tracking prey within discrete layers such as deep scattering layers (Stewart et al., 2016b; Andrzejaczek et al., 2020) were absent, and dive depths consistently exceeded deep scattering layers depths in New Zealand (~457 m) (Batzler, 1975) and Indonesia (300 – 400 m) (Schalk, 1987), which are typically associated with mesopelagic prey. Additionally, horizontal steps, although potentially indicative of foraging in other oceanic species such as the Chilean devil ray (Mobula tarapacana) and whale shark (Rhincodon typus) (Wilson et al., 2006; Thorrold et al., 2014; Tyminski et al., 2015), did not correspond with vertical foraging behaviours of manta rays such as barrel rolling (Stevens, 2016), and individuals often continued descending after completing horizontal steps, which is difficult to reconcile with prey encounter and exploitation. Although opportunistic feeding during steps cannot be entirely ruled out, there is little direct evidence of foraging to support this assumption (Thorrold et al., 2014; Tyminski et al., 2015; Braun et al., 2022), and the observed dive profiles and vertical velocities argue against foraging as the primary function of extreme dives. The combination of high descent speeds, absence of prey-associated oscillations, and consistent increases in post-dive displacement supports the hypothesis that extreme dives serve an information-gathering or orientation function. This interpretation is further supported by similar potential behavioural links between deep dives and subsequent travel observed in scalloped hammerhead sharks (Klimley, 1993), blue sharks (Carey et al., 1990), and oceanic whitetip sharks (Carcharhinus longimanus) (Howey et al., 2016).
4.2 Physiological implications of extreme dives
Certain epipelagic species appear better adapted than others to perform temporary deep-water excursions, but few spend substantial periods of time below 200 m (Braun et al., 2022). At depths exceeding 1000 m, animals experience low temperatures, high pressure, and sometimes hypoxic conditions. Ambient temperatures at these depths are well below the thermal optimum for most tropical shallow-water species (Rummer et al., 2014). As a result of thermal inertia, large-bodied marine animals experience a lag in body temperature relative to ambient conditions. By swimming at high speeds, animals minimise the time in descent and therefore presumably arrive at the maximum depth of their dive with a higher residual body temperature and/or can dive deeper before they reach a critical thermal threshold. The high vertical velocities observed during descent suggest that oceanic manta rays reduce their exposure to cold environments by minimising descent time, despite the higher energetic cost of active swimming, similar to blue sharks (e.g., Carey et al., 1990). It is also conceivable that oceanic manta rays use a form of “breath holding” similar to that observed in scalloped hammerhead sharks. Breath holding involves the suspension of convective heat transfer, which is likely achieved by reducing water flow across the gills via mouth closure or restricted gill ventilation (Royer et al., 2023). This behaviour allows scalloped hammerheads to descend to greater depths and/or stay in cold waters for longer periods, ensuring substantive cooling only occurs during the latter stages of the ascent phase once, presumably, gill ventilation is resumed (Royer et al., 2023). If oceanic manta rays use this behaviour, it would help limit heat loss, allowing them to reach greater depths while delaying the reduction of body temperature. The lower vertical velocities observed during ascent compared to descent may facilitate physiological recovery, allowing for progressive reoxygenation following anaerobic exertion, similar to behaviours observed in deep-diving tunas and sharks (Carlson and Parsons, 2001; Fitzgibbon et al., 2010).
The presence of horizontal steps during descent and ascent presents a challenge to this hypothesis. If horizontal steps represent recovery from anaerobic exercise, individuals will presumably need to allow water to pass over the gills, thereby increasing heat exchange with the surrounding water and likely accelerating body cooling. The rate at which oceanic manta rays lose body heat remains unknown, but further investigation using temperature sensors embedded in the musculature could clarify body temperature changes during descent and could reject hypotheses about the function of horizontal steps proposed earlier (sensu Carey et al., 1990). The physiological limitations of oceanic manta rays likely play a key role in shaping their deep-diving behaviours. Even among closely related species, physiological adaptations can drive marked differences in vertical movement behaviour. For example, although both oceanic manta rays and Chilean devil rays possess cranial rete, their ability to retain heat during extreme dives differs. Oceanic manta rays lack red muscle endothermy and visceral counter-current heat exchangers, which Chilean devil rays use to retain body heat during deep dives (Arostegui, 2024). This physiological limitation likely results in faster declines in body temperature in oceanic manta rays compared to Chilean devil rays, forcing them to spend less time at depth. Similar relationships between endothermic capacity and dive duration have been documented in other marine species. For instance, regional endothermy in bigeye tuna (Thunnus obesus) and swordfish (Xiphias gladius) enables prolonged deep-water foraging, whereas strictly ectothermic species like yellowfin tuna (Thunnus albacares) exhibit shorter, thermally constrained dives (Graham and Dickson, 2004). Given these differences, the shorter extreme dives observed in oceanic manta rays may necessitate alternative behavioural adaptations – such as breath-holding and prolonged pre- and post-dive warming periods—to mitigate rapid cooling and enable deep-water excursions. The significantly longer non-diving periods before and after extreme dives may represent behavioural thermoregulation, allowing manta rays to warm their bodies before and after encountering temperatures below 5 °C at depth. Such a function of these surface intervals could be validated using muscle-implanted temperature sensors, similar to studies of blue sharks (Carey et al., 1990). In addition to limiting dive duration, these physiological constraints may also contribute to the relative infrequency of extreme dives in oceanic manta rays compared to the congeneric Chilean devil ray, which routinely performs deep dives (Thorrold et al., 2014). This discrepancy may be attributed to the higher energetic and thermal costs faced by oceanic manta rays, which lack red muscle endothermy and visceral heat exchange mechanisms (Arostegui, 2024). It is possible that a single extreme dive is sufficient to fulfil specific ecological functions, such as environmental sampling or navigation, thereby reducing the necessity for repeated extreme dives over short time scales.
In addition to thermal challenges, extreme dives expose oceanic manta rays to substantial variations in dissolved oxygen (DO), including regions below the oxygen minimum zone (Dagorn et al., 2000; Roche et al., 2013; Rummer et al., 2014). Notably, the depths of the first horizontal steps during extreme dives consistently occurred within the midwater oxygen maxima located above the oxygen minimum layer and below the thermocline. The depth of the midwater O2 maxima differs by ~300 m between Indonesian and New Zealand sampling sites data sets, which is consistent with differences in the depth of the commencement of the first dive step by manta rays in these two sites. It seems possible that the first step in the descent phase may serve as a reoxygenation break, allowing oceanic manta rays to maximise oxygen uptake before continuing their descent. In such conditions, oceanic manta rays may swim horizontally at a speed that optimises ventilation efficiency while minimising metabolic costs, similar to behaviours observed in deep-diving species like southern bluefin tuna (Thunnus maccoyii) and various ram-ventilating sharks (Carlson and Parsons, 2001; Fitzgibbon et al., 2010; Domenici et al., 2013). Alternatively (or in addition), given the velocities at which animals are swimming, it is conceivable that oceanic manta rays are using anaerobic metabolic pathways during descent and may require rest to process some of the lactate produced by this exercise. Both strategies, however, would likely expose manta rays to rapid cooling and are inconsistent with a ‘breath holding’ thermoregulatory behaviour. Further investigations into the internal temperature dynamics of oceanic manta rays and concentrations of dissolved oxygen at depth could provide useful insights into the functional significance of these steps in patterns of descent.
4.3 Spatial distribution
Oceanic manta rays exhibited distinct regional differences in movement patterns and the occurrence of extreme dives. Given the known limitations of light-based geolocation (Lisovski et al., 2012), we applied rigorous quality control to improve track reliability. Individuals tagged in New Zealand undertook long offshore movements, with all oceanic manta rays leaving the continental shelf and travelling into the tropical South Pacific, including movements towards Fiji and Tonga. These movements in New Zealand coincided with seasonal shifts in sea surface temperature, particularly during the onset of the austral winter. In Peru, only one individual moved far offshore, westward to the Galápagos Islands. Oceanic manta rays in Indonesia remained predominantly within the country’s exclusive economic zone (EEZ), moving among islands within the archipelago. The frequency of extreme dives mirrored these spatial differences. Extreme dives were most frequently recorded in New Zealand, accounting for 71 of 79 total events, with rays often initiating extreme dives within a day of leaving the continental shelf. In Peru and Indonesia, extreme dives were infrequent, corresponding with most rays remaining in shallower coastal habitats. However, consistent with the pattern in New Zealand, one individual in Peru performed an extreme dive immediately upon leaving the continental shelf. In Indonesia, limited access to offshore environments likely constrained opportunities for extreme dives. These patterns highlight both individual and regional variability in the frequency of extreme dives among oceanic manta rays, similar to that seen in the shortfin mako shark, which adjusts its vertical habitat use depending on local ocean conditions (Vaudo et al., 2016).
Our mixed-effects model identified distance from the shelf edge as a significant predictor of extreme dive occurrence, supporting the observed patterns. Extreme dives were more likely as manta rays moved offshore into deeper waters. The median interval between extreme dives was two days (IQR 3), suggesting these energetically costly events are possibly tied to broader movement decisions rather than immediate environmental conditions. High individual variation in daily maximum dive depth was also observed across and within study sites, consistent with patterns documented in Chilean devil rays, shortfin mako sharks, and yellowfin tuna (Schaefer et al., 2011; Thorrold et al., 2014; Vaudo et al., 2016). However, this variability in maximum dive depth did not correlate with bathymetry, suggesting that extreme dives are not bathymetrically constrained.
4.4 Potential functions of extreme dives
Although the precise function of extreme dives remains unclear, their rarity, timing, and characteristics collectively suggest that they are unlikely to be undertaken purely for short-term energetic benefits such as foraging, thermoregulation, predator avoidance, or energy conservation. The most compelling evidence comes from the consistent association between extreme dives and subsequent increases in horizontal movement, with rays frequently travelling over 200 km in the 72h following extreme dives. This post-dive movement supports the hypothesis that extreme dives serve an informational role, enabling manta rays to gather environmental cues that guide broader-scale movements in offshore habitats. During extreme dives, oceanic manta rays did not prolong bottom time or display foraging-associated behaviours, with these extreme dives comprising ≤3% of recorded days, suggesting minimal direct energetic gain from prey resources. Although some deep-diving taxa, including shortfin mako sharks, Chilean devil rays, bigeye tuna, leatherback turtles (Dermochelys coriacea), and billfish (Xiphiidae), are believed to exploit mesopelagic resources or exhibit sensory adaptations for deep foraging (Fritsches et al., 2000, 2005; Schaefer and Fuller, 2002; Crognale et al., 2008; Thorrold et al., 2014; Vaudo et al., 2016), the dive profiles observed here lacked the oscillatory patterns commonly associated with feeding. Additionally, the maximum depths observed exceeded known distributions of pelagic prey layers in the study regions (Batzler, 1975; Schalk, 1987). The normal distribution of deep and extreme dives around noon may suggest a connection with light levels, as seen in other taxa. For example, bigeye tuna and Chilean devil rays display increased deep-diving activity during midday, coinciding with peak light penetration (Schaefer and Fuller, 2002; Thorrold et al., 2014). Similarly, billfish exhibit visual adaptations, including colour vision and ocular endothermy, that enhance prey detection in deep, low-light environments (Fritsches et al., 2000, 2005). However, in oceanic manta rays, this midday pattern may alternatively reflect diel preferences for other behaviours, such as surface foraging at night on diel-vertically migrating prey (Hays, 2003) or energy conservation when prey availability is lower.
The substantial energetic cost associated with steep, rapid descents, combined with prolonged warming intervals near the surface before and after dives, further argues against functions related primarily to thermoregulation or energy conservation. Likewise, predator avoidance seems improbable, as extreme dives showed no indication of the fast-escape trajectories expected during a predation event (Domenici and Blake, 1997), included horizontal steps, and maximum depths remained accessible to potential predators, for example, tiger sharks (Galeocerdo cuvier) and killer whales (Orcinus orca) (Afonso and Hazin, 2015; Towers et al., 2019). In other marine megafauna, such as leatherback turtles, deep dives during inter-nesting periods are interpreted as antipredator behaviour in coastal environments (Asada et al., 2022), but the offshore and directed nature of manta ray movements following extreme dives suggests a different function.
Instead, the distinct profile of extreme dives—characterised by stepped descents, shortened bottom phases, and a markedly greater horizontal movement—suggests extreme dives may serve an informational function that aids long-distance navigation or habitat selection. Gathering information on environmental gradients, including temperature, dissolved oxygen, and potentially geomagnetic cues, could help oceanic manta rays orient and decide whether to remain in an area or disperse to new foraging grounds. Similar hypotheses have been proposed for scalloped hammerhead sharks, which use seamount-associated geomagnetic anomalies for navigation (Klimley, 1993). In sea turtles, controlled experiments have demonstrated that hatchlings can detect magnetic intensity differences and use them for regional positioning (Lohmann and Lohmann, 1996), whereas adults likely rely on bicoordinate magnetic maps—incorporating both inclination angle and field intensity—to navigate across ocean basins (Lohmann et al., 2008). Experimental evidence from bonnethead sharks (Sphyrna tiburo) further supports the ability of elasmobranchs to use geomagnetic fields as positional cues, showing that individuals can orient towards their home region when exposed to a magnetic field mimicking a distant location (Keller et al., 2021). Whether oceanic manta rays similarly sample magnetic field gradients remains unknown. Geomagnetic anomalies in the study regions have not been mapped. Additionally, as magnetic orientation in sea turtles occurs without deep diving (Lohmann et al., 2008), it is uncertain whether diving enhances magnetic sensing in oceanic manta rays. Other rays, such as yellow stingrays (Urobatis jamaicensis), are hypothesised to possess compass-like orientation abilities based on magnetic cues (Newton and Kajiura, 2020). Consequently, although geomagnetic sampling remains a plausible hypothesis, further investigation is required to determine whether extreme dives in manta rays contribute to magnetic navigation or primarily serve to sample other environmental cues.
The clear association between these dives and subsequent increases in distance travelled supports the notion that extreme dives enable the rays to sample the vertical structure of the water column, informing their navigation in relatively featureless open-ocean environments. In this context, extreme dives may represent a key, albeit infrequent, component of an adaptive movement behaviour, serving as a potentially costly but important means to survey environmental conditions to guide patterns of broad-scale movement and habitat use.
Data availability statement
The raw data supporting the conclusions of this article will be made available by the authors, without undue reservation.
Ethics statement
Research was conducted in Indonesia with permission under Surat Izin Penelitian Nomor 69A/SIP/IV/FR/8/2022. In New Zealand, satellite tagging was done under NZ Department of Conservation tagging permit DOCDM-5626452 (and Animal Ethics Approval AEC 337) to Clinton Duffy and Department of Conservation permit 96119-FAU to Manta Watch New Zealand (and University of Auckland Animal Ethics Approval AEC23490 to Rochelle Constantine). Animal ethics approval was granted by Murdoch University animal ethics committee permit number RW3318/21 and protocol ID 836, and by the Indonesian ethics committee of the National Research and Innovation agency (BRIN) proposal number 07062022000004. The study was conducted in accordance with the local legislation and institutional requirements.
Author contributions
CB: Resources, Software, Writing – original draft, Investigation, Visualization, Funding acquisition, Formal analysis, Methodology, Writing – review & editing, Conceptualization, Project administration, Data curation. FR: Writing – review & editing, Data curation. AS: Writing – review & editing, Data curation. AB: Writing – review & editing. K: Writing – review & editing. ME: Data curation, Supervision, Writing – review & editing. ES: Writing – review & editing. LG: Data curation, Writing – review & editing. CD: Data curation, Writing – review & editing. SA: Writing – review & editing, Data curation. BB: Writing – review & editing. KF: Writing – review & editing. MM: Writing – review & editing, Supervision. AG: Project administration, Methodology, Visualization, Data curation, Supervision, Formal analysis, Conceptualization, Writing – review & editing, Funding acquisition, Software, Investigation, Resources.
Funding
The author(s) declare financial support was received for the research and/or publication of this article. In Peru, the research was supported by a collaborative grant to BAB and KF from the Rolex Awards for Enterprise. KF was additionally funded by the Whitley Fund for Nature and the Nausicaá Charitable Foundation. Additional funding was provided in support of SA by the Bertarelli Foundation. We thank MAC3 Impact Philanthropies, the Henry Foundation, the Save the Blue Foundation, Daniel Roozen, and Katrine Bosley for their generous financial support of our satellite tagging programs. Finally, we extend special thanks to the Harbig Family Foundation for their generous financial support.
Acknowledgments
We extend special thanks to Professor Ricardo F. Tapilatu, who sadly passed away in 2022, leaving a legacy of conservation and research at the University of Papua. Special thanks are also extended to Jenna Hounslow for her assistance and support with sections of R-mark coding of the analysis. Research was conducted in Indonesia with permission under Surat Izin Penelitian Nomor 69A/SIP/IV/FR/8/2022. We acknowledge and appreciate the assistance RISTEK-BRIN to obtain this research permit, along with BALITBANGDA Papua Barat and Pemerintah Daerah Raja Ampat. We would like to thank both the University of Papua (UNIPA) and the Maritime and Fisheries Polytechnic of Sorong for their help in arranging research permits, collaboration, and research opportunities. We also thank the Raja Ampat Marine Protected Area Management Authority (UPTD BLUD KKPD Raja Ampat) for supporting this research. In New Zealand, satellite tagging was done under NZ Department of Conservation tagging permit DOCDM - 5626452 (and Animal Ethics Approval AEC 337) to Clinton Duffy and Dept of Conservation permit 96119-FAU to Manta Watch New Zealand (and University of Auckland Animal Ethics Approval AEC23490 to Rochelle Constantine). We thank Ngati Manuhiri, Ngati Rehua Ngatiwai ki Aotea, the NZ Department of Conservation, and the University of Auckland for their support of the oceanic manta ray tagging program in New Zealand. We also thank Semisi Meo and the Conservation International Fiji field team for their efforts in recovering the OM8 tag. This study has been conducted using E.U. Copernicus Marine Service Information; O2 dataset – Global Ocean Biogeochemistry Analysis and Forecast daily model available: https://doi.org/10.48670/moi-00019 and SST – Global Ocean Physics Reanalysis daily model available: – https://doi.org/10.48670/moi-00021.
Conflict of interest
The authors declare that the research was conducted in the absence of any commercial or financial relationships that could be construed as a potential conflict of interest.
The author(s) declared that they were an editorial board member of Frontiers, at the time of submission. This had no impact on the peer review process and the final decision.
Generative AI statement
The author(s) declare that no Generative AI was used in the creation of this manuscript.
Any alternative text (alt text) provided alongside figures in this article has been generated by Frontiers with the support of artificial intelligence and reasonable efforts have been made to ensure accuracy, including review by the authors wherever possible. If you identify any issues, please contact us.
Publisher’s note
All claims expressed in this article are solely those of the authors and do not necessarily represent those of their affiliated organizations, or those of the publisher, the editors and the reviewers. Any product that may be evaluated in this article, or claim that may be made by its manufacturer, is not guaranteed or endorsed by the publisher.
Supplementary material
The Supplementary Material for this article can be found online at: https://www.frontiersin.org/articles/10.3389/fmars.2025.1630451/full#supplementary-material
References
Afonso A. S. and Hazin F. H. V. (2015). Vertical movement patterns and ontogenetic niche expansion in the tiger shark, Galeocerdo cuvier. PLoS One 10, 1-26. doi: 10.1371/journal.pone.0116720
Andrzejaczek S., Chapple T. K., Curnick D. J., Carlisle A. B., Castleton M., Jacoby D. M. P., et al. (2020). Individual variation in residency and regional movements of reef manta rays Mobula alfredi in a large marine protected area. Mar. Ecol. Prog. Ser. 639, 137–153. doi: 10.3354/meps13270
Andrzejaczek S., Lucas T. C. D., Goodman M. C., Hussey N. E., Armstrong A. J., Carlisle A., et al. (2022). Diving into the vertical dimension of elasmobranch movement ecology. Sci. Adv. 8, 1–20. doi: 10.1126/sciadv.abo1754
Andrzejaczek S., Schallert R. J., Forsberg K., Arnoldi N. S., Cabanillas-Torpoco M., Purizaca W., et al. (2021). Reverse diel vertical movements of oceanic manta rays off the northern coast of Peru and implications for conservation. Ecol. Solut. Evid. 2, e12051. doi: 10.1002/2688-8319.12051
Arostegui M. C. (2024). Cranial endothermy in mobulid rays: Evolutionary and ecological implications of a thermogenic brain. J. Anim. Ecol., 1–9. doi: 10.1111/1365-2656.14200
Asada A., Eckert S. A., Gelwick F. P., Hagey W. H., and Davis R. W. (2022). Diving behavior and energetic strategy of leatherback sea turtles during internesting intervals on St. Croix, U.S. Virgin Islands. J. Exp. Mar. Bio. Ecol. 550. doi: 10.1016/j.jembe.2022.151722
Barton K. (2022). MuMIn: Multi-Model Inference. Available online at: https://cran.r-project.org/package=MuMIn (Accessed September 01, 2022).
Batzler W. E. (1975). Deep-scattering-layer observations off New Zealand and comparison with other volume scattering measurements. J. Acoust. Soc Am. 58, 51–71. doi: 10.1121/1.380663
Beale C. S., Stewart J. D., Setyawan E., Sianipar A. B., and Erdmann M. V. (2019). Population dynamics of oceanic manta rays (Mobula birostris) in the Raja Ampat Archipelago, West Papua, Indonesia, and the impacts of the El Niño–Southern Oscillation on their movement ecology. Divers. Distrib. 25, 1472–1487. doi: 10.1111/ddi.12962
Bonfil R., Francis M. P., Duffy C., Manning M. J., and O’Brien S. (2009). Large-scale tropical movements and diving behavior of white sharks Carcharodon carcharias tagged off New Zealand. Aquat. Biol. 8, 115–123. doi: 10.3354/ab00217
Braun C. D., Arostegui M. C., Thorrold S. R., Papastamatiou Y. P., Gaube P., Fontes J., et al. (2022). The functional and ecological significance of deep diving by large marine predators. Ann. Rev. Mar. Sci. 14, 129–159. doi: 10.1146/annurev-marine-032521-103517
Braun C. D., Skomal G. B., Thorrold S. R., and Berumen M. L. (2014). Diving behavior of the reef manta ray links coral reefs with adjacent deep pelagic habitats. PLoS One 9, e88170. doi: 10.1371/journal.pone.0088170
Brill R. W. and Lutcavage M. E. (2001). Understanding environmental influences on movements and depth distributions of tunas and billfishes can significantly improve population assessments. Am. Fish. Soc Symp., 25, 179–198.
Carey F. G., Scharold J. V., and Kalmijn A. J. (1990). Movements of blue sharks (Prionace glauca) in depth and course. Mar. Biol. 106, 329–342. doi: 10.1007/BF01344309
Carlson J. K. and Parsons G. R. (2001). The effects of hypoxia on three sympatric shark species: Physiological and behavioral responses. Environ. Biol. Fishes 61, 427–433. doi: 10.1023/A:1011641302048
CMEMS (2019). Global ocean biogeochemistry analysis and forecast. Glob. Ocean Biogeochem. Anal. Forecast. Available online at: https://data.marine.copernicus.eu/product/GLOBAL_ANALYSIS_FORECAST_BIO_001_028/description (Accessed December 08, 2022).
Crognale M. A., Eckert S. A., Levenson D. H., and Harms C. A. (2008). Leatherback sea turtle Dermochelys coriacea visual capacities and potential reduction of bycatch by pelagic longline fisheries. Endanger. Species Res. 5, 249–256. doi: 10.3354/esr00112
Curnick D. J., Andrzejaczek S., Jacoby D. M. P., Coffey D. M., Carlisle A. B., Chapple T. K., et al. (2020). Behavior and ecology of silky sharks around the chagos archipelago and evidence of Indian ocean wide movement. Front. Mar. Sci. 7. doi: 10.3389/fmars.2020.596619
Dagorn L., Bach P., and Josse E. (2000). Movement patterns of large bigeye tuna (Thunnus obesus) in the open ocean, determined using ultrasonic telemetry. Mar. Biol. 136, 361–371. doi: 10.1007/s002270050694
Dewar H., Prince E. D., Musyl M. K., Brill R. W., Sepulveda C., Luo J., et al. (2011). Movements and behaviors of swordfish in the Atlantic and Pacific Oceans examined using pop-up satellite archival tags. Fish. Oceanogr. 20, 219–241. doi: 10.1111/j.1365-2419.2011.00581.x
Domenici P. and Blake R. W. (1997). The kinematics and performance of fish fast-start swimming. J. Exp. Biol. 200, 1165–1178. doi: 10.1242/jeb.200.8.1165
Domenici P., Herbert N. A., Lefrançois C., Steffensen J. F., and McKenzie D. J. (2013). “The effect of hypoxia on fish swimming performance and behaviour,” in Swimming Physiology of Fish: Towards Using Exercise to Farm a Fit Fish in Sustainable Aquaculture (Springer Berlin, Heidelberg), 129–159. doi: 10.1007/978-3-642-31049-2_6
Fitzgibbon Q. P., Seymour R. S., Buchanan J., Musgrove R., and Carragher J. (2010). Effects of hypoxia on oxygen consumption, swimming velocity and gut evacuation in southern bluefin tuna (Thunnus maccoyii). Environ. Biol. Fishes 89, 59–69. doi: 10.1007/s10641-010-9690-1
Fong V., Hoffmann S. L., and Pate J. H. (2022). Using drones to assess volitional swimming kinematics of manta ray behaviors in the wild. Drones 6, 12. doi: 10.3390/drones6050111
Fontes J., Macena B., Solleliet-Ferreira S., Buyle F., Magalhães R., Bartolomeu T., et al. (2022). The advantages and challenges of non-invasive towed PILOT tags for free-ranging deep-diving megafauna. Anim. Biotelemetry 10, 1–13. doi: 10.1186/s40317-022-00310-1
Fritsches K. A., Brill R. W., and Warrant E. J. (2005). Warm eyes provide superior vision in swordfishes. Curr. Biol. 15, 55–58. doi: 10.1016/j.cub.2004.12.064
Fritsches K. A., Partridge J. C., Pettigrew J. D., and Marshall N. J. (2000). Colour vision in billfish. Philos. Trans. R. Soc B Biol. Sci. 355, 1253–1256. doi: 10.1098/rstb.2000.0678
Gleiss A. C., Norman B., and Wilson R. P. (2011). Moved by that sinking feeling: Variable diving geometry underlies movement strategies in whale sharks. Funct. Ecol. 25, 595–607. doi: 10.1111/j.1365-2435.2010.01801.x
Gore M. A., Rowat D., Hall J., Gell F. R., and Ormond R. F. (2008). Transatlantic migration and deep mid-ocean diving by basking shark. Biol. Lett. 4, 395–398. doi: 10.1098/rsbl.2008.0147
Graham J. B. and Dickson K. A. (2004). Tuna comparative physiology. J. Exp. Biol. 207, 4015–4024. doi: 10.1242/jeb.01267
Graham R. T., Roberts C. M., and Smart J. C. R. (2006). Diving behaviour of whale sharks in relation to a predictable food pulse. J. R. Soc Interface 3, 109–116. doi: 10.1098/rsif.2005.0082
Hays G. C. (2003). “A review of the adaptive significance and ecosystem consequences of zooplankton diel vertical migrations,” in Migrations and Dispersal of Marine Organisms (Springer, Dordrecht), 163–170. doi: 10.1007/978-94-017-2276-6_18
Hearn A. R., Acuña D., Ketchum J. T., Peñaherrera C., Green J., Marshall A., et al. (2014). Elasmobranchs of the Galapagos Marine Reserve. New York LLC, New York, USA: Springer. doi: 10.1007/978-3-319-02769-2_2
Howey L. A., Tolentino E. R., Papastamatiou Y. P., Brooks E. J., Abercrombie D. L., Watanabe Y. Y., et al. (2016). Into the deep: the functionality of mesopelagic excursions by an oceanic apex predator. Ecol. Evol. 6, 5290–5304. doi: 10.1002/ece3.2260
Keller B. A., Putman N. F., Grubbs R. D., Portnoy D. S., and Murphy T. P. (2021). Map-like use of Earth’s magnetic field in sharks. Curr. Biol. 31, 2881–2886.e3. doi: 10.1016/j.cub.2021.03.103
Klimley A. P. (1993). Highly directional swimming by scalloped hammerhead sharks, Sphyrna lewini, and subsurface irradiance, temperature, bathymetry, and geomagnetic field. Mar. Biol. 117, 1–22. doi: 10.1007/BF00346421
Kuznetsova A., Brockhoff P. B., Christensen R. H. B., and Jensen S. P. (2020). lmerTest: Tests in Linear Mixed Effects Models. Available online at: https://cran.r-project.org/package=lmerTest (Accessed August 19, 2023).
Lassauce H., Chateau O., Erdmann M. V., and Wantiez L. (2020). Diving behavior of the reef manta ray (Mobula alfredi) in New Caledonia: More frequent and deeper night-time diving to 672 meters. PLoS One 15, 7–9. doi: 10.1371/journal.pone.0228815
Lawson G. L., Castleton M. R., and Block B. A. (2010). Movements and diving behavior of Atlantic bluefin tuna Thunnus thynnus in relation to water column structure in the northwestern Atlantic. Mar. Ecol. Prog. Ser. 400, 245–265. doi: 10.3354/meps08394
Lisovski S., Hewson C. M., Klaassen R. H. G., Korner-Nievergelt F., Kristensen M. W., and Hahn S. (2012). Geolocation by light: Accuracy and precision affected by environmental factors. Methods Ecol. Evol. 3, 603–612. doi: 10.1111/j.2041-210X.2012.00185.x
Lohmann K. J. and Lohmann C. M. F. (1996). Detection of magnetic field intensity by sea turtles. Nature 380, 59–61. doi: 10.1038/380059a0
Lohmann K. J., Lohmann C. M. F., and Endres C. S. (2008). The sensory ecology of ocean navigation. J. Exp. Biol. 211, 1719–1728. doi: 10.1242/jeb.015792
Luque S. P. (2007). Diving behaviour analysis in R. R News 7, 8–14. Available online at: https://cran.r-project.org/doc/Rnews/ (Accessed July 22, 2022).
Marshall A., Barreto R., Carlson J., Fernando D., Fordham S., Francis M. P., et al. (2020). Mobula birostris. (International Union for Conservation of Nature: IUCN Red List Threat. Species e.T198921A), 20. doi: 10.2305/IUCN.UK.2020-3.RLTS.T198921A68632946.en
Marshall A., Barreto R., Carlson J., Fernando D., Fordham S., Francis M. P., et al. (2022). Mobula alfredi. (International Union for Conservation of Nature: IUCN Red List Threat. Species e.T195459A), 21. doi: 10.2305/IUCN.UK.2022-1.RLTS.T195459A214395983.en
Meekan M. G., Fuiman L. A., Davis R., Berger Y., and Thums M. (2015). Swimming strategy and body plan of the world’s largest fish: Implications for foraging efficiency and thermoregulation. Front. Mar. Sci. 2. doi: 10.3389/fmars.2015.00064
Musyl M. K., Domeier M. L., Nasby-Lucas N., Brill R. W., McNaughton L. M., Swimmer J. Y., et al. (2011). Performance of pop-up satellite archival tags. Mar. Ecol. Prog. Ser. 433, 1–28. doi: 10.3354/meps09202
Newton K. C. and Kajiura S. M. (2020). The yellow stingray (Urobatis jamaicensis) can discriminate the geomagnetic cues necessary for a bicoordinate magnetic map. Mar. Biol. 167, 1–13. doi: 10.1007/s00227-020-03763-1
NOAA National Centers for Environmental Information (2022). NOAA National Centers for Environmental Information (2022: ETOPO 2022 – 15 Arc-Second Global Relief Model). Available online at: https://www.ncei.noaa.gov/access/metadata/landing-page/bin/iso?id=gov.noaa.ngdc.mgg.dem:316 (Accessed February 09, 2023).
R Core Team (2024). R: A Language and Environment for Statistical Computing. Available online at: https://www.r-project.org/ (Accessed March 15, 2024).
Robinson P. W., Costa D. P., Crocker D. E., Gallo-Reynoso J. P., Champagne C. D., Fowler M. A., et al. (2012). Foraging behavior and success of a mesopelagic predator in the northeast Pacific Ocean: insights from a data-rich species, the northern elephant seal. PLoS One 7, e36728. doi: 10.1371/journal.pone.0036728
Roche D. G., Binning S. A., Bosiger Y., Johansen J. L., and Rummer J. L. (2013). Finding the best estimates of metabolic rates in a coral reef fish. J. Exp. Biol. 216, 2103–2110. doi: 10.1242/jeb.082925
Royer M., Meyer C., Royer J., Maloney K., Cardona E., Blandino C., et al. (2023). Breath holding” as a thermoregulation strategy in the deep-diving scalloped hammerhead shark. Sci. (80-.). 380, 651–655. doi: 10.1126/SCIENCE.ADD4445
Rummer J. L., Couturier C. S., Stecyk J. A. W., Gardiner N. M., Kinch J. P., Nilsson G. E., et al. (2014). Life on the edge: Thermal optima for aerobic scope of equatorial reef fishes are close to current day temperatures. Glob. Change Biol. 20, 1055–1066. doi: 10.1111/gcb.12455
Santos C. C., Domingo A., Carlson J., Natanson L. J., Travassos P., Macías D., et al. (2021). Movements, habitat use, and diving behavior of shortfin mako in the atlantic ocean. Front. Mar. Sci. 8. doi: 10.3389/fmars.2021.686343
Schaber M., Gastauer S., Cisewski B., Hielscher N., Janke M., Peña M., et al. (2022). Extensive oceanic mesopelagic habitat use of a migratory continental shark species. Sci. Rep. 12, 1–14. doi: 10.1038/s41598-022-05989-z
Schaefer K. M. and Fuller D. W. (2002). Movements, behavior, and habitat selection of bigeye tuna (Thunnus obesus) in the eastern equatorial Pacific, ascertained through archival tags. Fish. Bull. 100, 765–788.
Schaefer K. M., Fuller D. W., and Block B. A. (2011). Movements, behavior, and habitat utilization of yellowfin tuna (Thunnus albacares) in the Pacific Ocean off Baja California, Mexico, determined from archival tag data analyses, including unscented Kalman filtering. Fish. Res. 112, 22–37. doi: 10.1016/j.fishres.2011.08.006
Schalk P. H. (1987). Monsoon-related changes in zooplankton biomass in the eastern Banda Sea and Aru Basin. Biol. Oceanogr. 5, 1–12. doi: 10.1080/01965581.1987.10749502
Sepulveda C. A., Kohin S., Chan C., Vetter R., and Graham J. B. (2004). Movement patterns, depth preferences, and stomach temperatures of free-swimming juvenile mako sharks, Isurus oxyrinchus, in the Southern California Bight. Mar. Biol. 145, 191–199. doi: 10.1007/s00227-004-1356-0
Skomal G. B., Braun C. D., Chisholm J. H., and Thorrold S. R. (2017). Movements of the white shark Carcharodon carcharias in the North Atlantic Ocean. Mar. Ecol. Prog. Ser. 580, 1–16. doi: 10.3354/meps12306
South A. (2016). rnaturalearth. Available online at: https://github.com/ropensci/rnaturalearth (Accessed December 06, 2024).
Stevens G. M. W. (2016). Conservation and Population Ecology of Manta Rays in the Maldives (York, UK: University of York). http://etheses.whiterose.ac.uk/16981/
Stewart J. D., Beale C. S., Fernando D., Sianipar A. B., Burton R. S., Semmens B. X., et al. (2016a). Spatial ecology and conservation of Manta birostris in the Indo-Pacific. Biol. Conserv. 200, 178–183. doi: 10.1016/j.biocon.2016.05.016
Stewart J. D., Hoyos-Padilla E. M., Kumli K. R., and Rubin R. D. (2016b). Deep-water feeding and behavioral plasticity in Manta birostris revealed by archival tags and submersible observations. Zoology 119, 406–413. doi: 10.1016/j.zool.2016.05.010
Teo S. L. H., Boustany A., Dewar H., Stokesbury M. J. W., Weng K. C., Beemer S., et al. (2007). Annual migrations, diving behavior, and thermal biology of Atlantic bluefin tuna, Thunnus thynnus, on their Gulf of Mexico breeding grounds. Mar. Biol. 151, 1–18. doi: 10.1007/s00227-006-0447-5
Thieurmel B. and Elmarhraoui A. (2022). Package “suncalc”: Compute Sun Position, Sunlight Phases, Moon Position and Lunar Phase. Available online at: https://cran.r-project.org/package=suncalc (Accessed July 22, 2022).
Thorrold S. R., Afonso P., Fontes J., Braun C. D., Santos R. S., Skomal G. B., et al. (2014). Extreme diving behaviour in devil rays links surface waters and the deep ocean. Nat. Commun. 5, 1–7. doi: 10.1038/ncomms5274
Towers J. R., Tixier P., Ross K. A., Bennett J., Arnould J. P. Y., Pitman R. L., et al. (2019). Movements and dive behaviour of a toothfish-depredating killer and sperm whale. ICES J. Mar. Sci. 76, 298–311. doi: 10.1093/icesjms/fsy118
Tyminski J. P., de la Parra-Venegas R., Cano J. G., and Hueter R. E. (2015). Vertical movements and patterns in diving behavior of whale sharks as revealed by pop-up satellite tags in the Eastern Gulf of Mexico. PLoS One 10, e0142156. doi: 10.1371/journal.pone.0142156
Vaudo J. J., Wetherbee B. M., Wood A. D., Weng K., Howey-Jordan L. A., Harvey G. M., et al. (2016). Vertical movements of shortfin mako sharks Isurus oxyrinchus in the western North Atlantic Ocean are strongly influenced by temperature. Mar. Ecol. Prog. Ser. 547, 163–175. doi: 10.3354/meps11646
Vihtakari M. (2023). ggOceanMaps: Plot Data on Oceanographic Maps. Available online at: https://mikkovihtakari.github.io/ggOceanMaps/ (Accessed September 05, 2023).
Watanabe Y. Y., Nakamura I., and Chiang W. C. (2021). Behavioural thermoregulation linked to foraging in blue sharks. Mar. Biol. 168, 1–10. doi: 10.1007/s00227-021-03971-3
Weihs D. (1973). Mechanically efficient swimming techniques for fish with negative buoyancy. J. Mar. Res. 31, 194–209.
Keywords: Mobula birostris, movement ecology, extreme diving, open ocean navigation, satellite telemetry, animal behaviour
Citation: Beale CS, Runtuboy F, Sianipar AB, Beer AJE, Kadarusman, Erdmann MV, Setyawan E, Green L, Duffy CAJ, Andrzejaczek S, Block BA, Forsberg K, Meekan M and Gleiss AC (2025) Deep diving behaviour in oceanic manta rays and its potential function. Front. Mar. Sci. 12:1630451. doi: 10.3389/fmars.2025.1630451
Received: 17 May 2025; Accepted: 15 August 2025;
Published: 15 October 2025.
Edited by:
Randall William Davis, Texas A&M University at Galveston, United StatesReviewed by:
Catherine Lohmannn, University of North Carolina at Chapel Hill, United StatesScott A. Eckert, Principia College, United States
Copyright © 2025 Beale, Runtuboy, Sianipar, Beer, Kadarusman, Erdmann, Setyawan, Green, Duffy, Andrzejaczek, Block, Forsberg, Meekan and Gleiss. This is an open-access article distributed under the terms of the Creative Commons Attribution License (CC BY). The use, distribution or reproduction in other forums is permitted, provided the original author(s) and the copyright owner(s) are credited and that the original publication in this journal is cited, in accordance with accepted academic practice. No use, distribution or reproduction is permitted which does not comply with these terms.
*Correspondence: Calvin S. Beale, Y2FsdmluLmJlYWxlLjhAZ21haWwuY29t