Abstract
Marine coral sand-clay mixtures (MCCM) are widely used as fill materials in offshore engineering, where their strength characteristics are critical to structural stability and safety. This study conducted a series of triaxial shear tests under varying conditions of clay content, reinforcement layers, confining pressure, water content, and strain to establish a comprehensive strength database for MCCM. Based on this dataset, multiple predictive models were developed, including Backpropagation Neural Network (BPNN), Genetic Algorithm optimized BPNN (GA-BPNN), Particle Swarm Optimization enhanced BPNN (PSO-BPNN), and a Logical Development Algorithm preprocessed BPNN model (LDA-BPNN). Among them, the LDA-BPNN model demonstrated superior accuracy and generalization capabilities compared to traditional optimization algorithms. Sensitivity analysis identified water content, clay content, and confining pressure as the primary factors influencing MCCM strength. Furthermore, an explicit empirical formula derived from the LDA-BPNN model was proposed, offering a practical and efficient tool for engineers without specialized machine learning expertise. These findings provide valuable technical support for the optimized design and safety assessment of MCCM materials in marine geotechnical engineering applications.
1 Introduction
Large-scale marine resource development has been carried out in subtropical and tropical offshore regions such as the South China Sea and the central Pacific (Lin et al., 2024; Shi et al.; Wang et al., 2025; Zhao et al., 2022). Numerous marine engineering structures have been constructed in these areas, often using marine coral sand–clay mixtures (MCCM) as the primary fill material (Guo et al.; Prakasha and Chandrasekaran, 2005; Zhou et al., 2022). However, marine coral sand has inherently low strength and is highly susceptible to breakage (Chao et al., 2025; Li et al., 2024; Wu et al., 2021). When combined with clay, the mechanical strength and stability of MCCM-based structures are significantly compromised (Lv et al., 2021; Peng et al., 2022; Xiao et al.; Zhang et al., 2023a). Therefore, there is an urgent need for a rational and effective method to reinforce marine engineering structures built with MCCM.
Geogrids are widely recognized for their positive effects on the strength and deformation characteristics of marine coral sand (Ding and Ou, 2022a; Ding and Ou, 2022a). However, their application in reinforcing MCCM has yet to be explored (Gao et al., 2024; Poorahong et al., 2024; Song et al., 2024). The triaxial test is a commonly used method for investigating the mechanical behavior and reinforcement mechanisms of soils (Chen et al., 2024; Cui et al., 2024). While many studies have examined the mechanical properties of marine coral sand through triaxial testing, they often overlook the fact that the actual fill material used in marine engineering projects is MCCM (Dong et al., 2017; Fan et al., 2025; Gong et al., 2025; Xu et al., 2020; Zhao et al., 2023b). As a result, there is a noticeable gap in research on the mechanical behavior and reinforcement mechanisms of MCCM. Although triaxial tests can provide reliable experimental data and valuable insights into the mechanical characteristics of MCCM, they have inherent limitations (Ding et al., 2024; Zheng et al., 2024b). First, the tests are time-consuming and costly, making them difficult to implement extensively in engineering practice (Chao and Fowmes, 2021; Li et al., 2025). Additionally, the specific type of geogrid used in a project is often not finalized until the later stages of design, which limits the practical applicability of experimental results (Chao et al., 2023; Fan et al., 2023; Wang et al., 2024; Zheng et al., 2024a). Second, it is challenging to precisely control environmental conditions such as moisture during testing, which can introduce uncertainty into the results and compromise the reliability of subsequent design decisions (Chao et al., 2024c; Xiao et al., 2024; Zhao et al., 2023a). Marine coral sand has irregular shapes, and some researchers have proposed using 3D printing technology to fabricate customized geogrids to meet this demand (Fowmes et al., 2017). Therefore, there is an urgent need to develop a more efficient predictive approach that can account for multiple influencing factors, reduce reliance on costly and time-intensive physical testing, and maintain high predictive accuracy.
Machine learning techniques have garnered increasing attention in recent years due to their ability to capture complex nonlinear relationships among multiple factors, and they have been progressively applied in the field of marine engineering (Chao et al., 2021, Chao et al., 2022; Shao et al., 2024). Studies have shown that machine learning methods offer high accuracy and strong applicability in predicting the strength of materials such as marine coral sand (Chao et al., 2023; Huang et al., 2024; Zhang et al., 2023b). For instance, some researchers have employed genetic algorithm (GA)-optimized backpropagation neural networks (BPNN) to predict the shear strength of soils, while intelligent optimization algorithms such as particle swarm optimization (PSO) have been used to enhance model stability and predictive performance (Nhu et al., 2020; Pham et al., 2018; Qin et al., 2025). However, research focusing on the mechanical behavior modeling of MCCM remains limited. Most existing studies rely on relatively simple model architectures and basic algorithms, without fully leveraging the potential of more advanced ensemble learning techniques (Chao et al., 2024b; Ren et al., 2024). Moreover, the performance of machine learning models is highly sensitive to the selection of hyperparameters. Appropriate hyperparameter tuning plays a crucial role in improving training efficiency and model generalization (Chao et al., 2024a; Wang et al., 2023). Therefore, incorporating optimization algorithms for hyperparameter tuning before model development is essential for achieving higher prediction accuracy and robustness (Chao et al., 2022; Xu et al., 2024, Xu et al., 2025). In summary, integrating advanced machine learning models with efficient optimization algorithms not only enhances the predictive accuracy of MCCM mechanical properties but also offers a novel pathway for the rapid evaluation of complex marine engineering materials.
Traditional optimization algorithms such as particle swarm optimization (PSO) and genetic algorithms (GA) face limitations in practical applications, including relatively slow computation speeds and a tendency to get trapped in local optima (Wang and Shen, 2018). To address these issues, researchers have developed a novel heuristic optimization method called the Logical Development Algorithm (LDA) (Jie et al., 2004). By performing similarity and dissimilarity operations in parallel, LDA significantly accelerates the optimization process while effectively preserving original information, thereby enhancing its global search capability (Chao et al., 2024a). Studies have demonstrated that LDA outperforms traditional optimization techniques in improving estimation accuracy and enhancing the performance of machine learning models. For instance, when applied to parameter tuning of wavelet neural networks (WNN) for rock mass parameter evaluation, LDA showed superior optimization results compared to GA (Zhang et al., 2022). Similarly, LDA-optimized artificial neural networks (ANN) have been found to predict wave heights more accurately than GA-optimized counterparts (Wang et al., 2018). Therefore, integrating LDA with machine learning models not only improves prediction accuracy and stability but also offers a practical and efficient approach for forecasting the strength of MCCM.
The primary objective of this study is to investigate the strength behavior of MCCM under varying conditions. Triaxial tests were conducted on MCCM samples with different clay contents, numbers of reinforcement layers, confining pressures, and water contents to obtain stress-strain data. A comprehensive database was established based on the experimental results, which was then used to train and evaluate several machine learning models. By comparing the accuracy and generalization capabilities of these models, the LDA-optimized backpropagation neural network (LDA-BPNN) was identified as the most effective. Building on the LDA-BPNN model, sensitivity analysis was performed, and empirical formulas were developed to provide practical guidance for marine engineering applications.
2 Physical test methodology
2.1 Materials
The experimental materials comprised marine coral sand and kaolin clay. The coral sand was sourced from a reef island in the South China Sea. To ensure consistency and reliability of the test results, the collected sand was subjected to a series of preparatory procedures including oven drying and mechanical sieving. The particle size fraction retained between 0.074 mm and 2 mm was selected for use in the experiments. The kaolin clay employed in this study consisted of particles with a uniform diameter of 10 μm, ensuring its suitability for mixing and compaction with the sand matrix. Photographs of the marine coral sand and kaolin clay are provided in Figure 1, while their corresponding physical properties are summarized in Table 1. According to the particle size distribution analysis, the marine coral sand demonstrated a coefficient of uniformity (Cu) of 3.1 and a coefficient of curvature (Cc) of 1.2. These values indicate that the sand has a well-graded distribution.
Figure 1
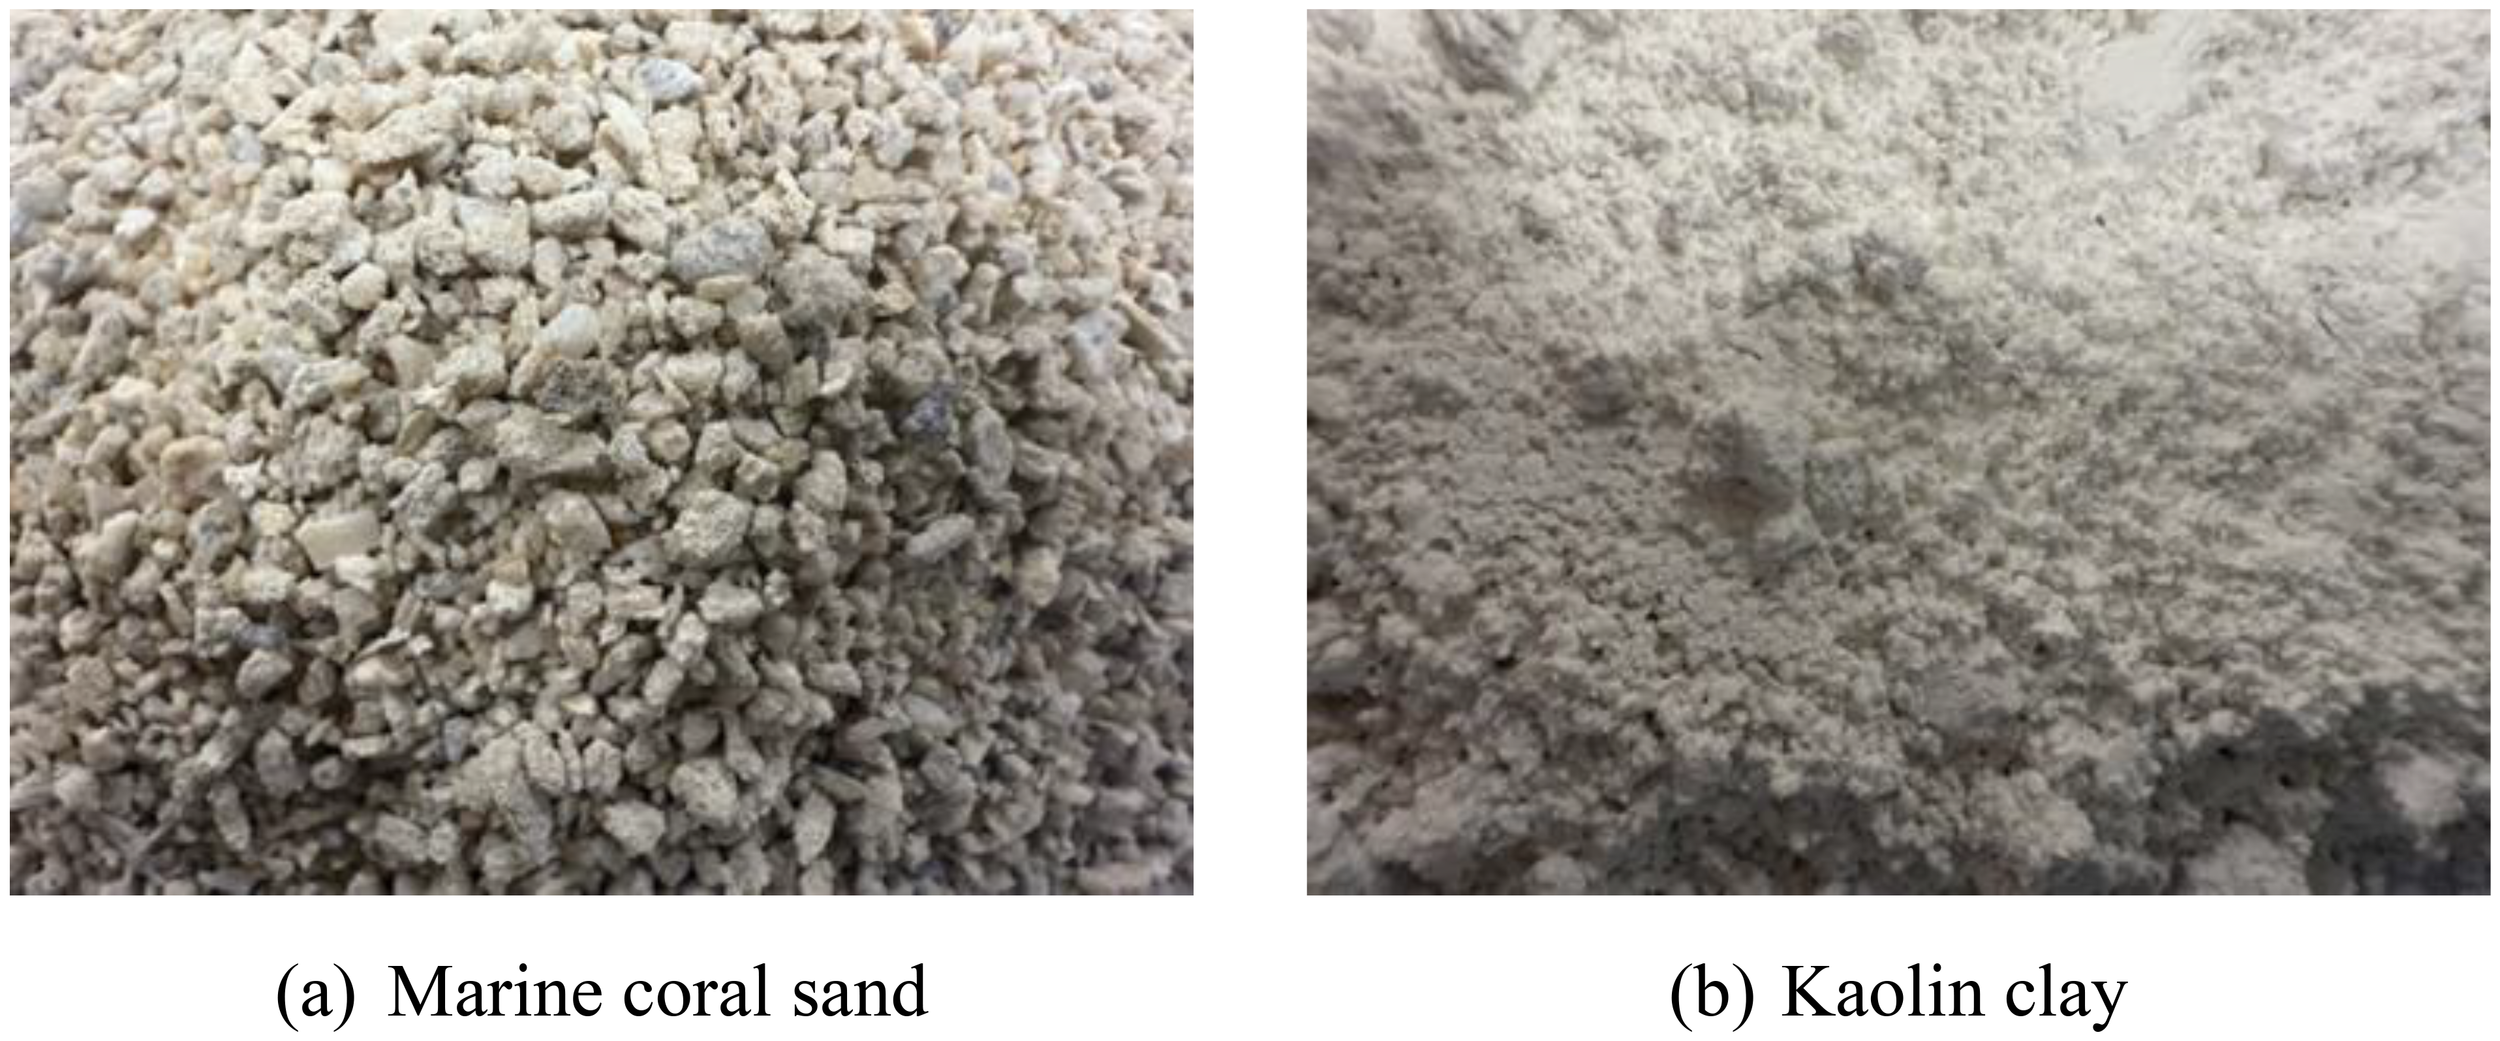
Marine coral sand and kaolin clay. (a) Marine coral sand. (b) Kaoling clay.
Table 1
| GS | D50/mm | Cu | Cc | emin | emax |
|---|---|---|---|---|---|
| 2.83 | 1 | 3.1 | 1.2 | 0.99 | 1.49 |
Basic physical parameters of marine coral sand.
A triaxial geogrid was manufactured using stereolithography (SLA)-based 3D printing, as illustrated in Figure 2. The geogrid features ribs with a width of 1.5 mm and a thickness of 2 mm. The apertures are designed as equilateral triangles, each with a side length of 2 mm. To minimize boundary effects during specimen preparation, the overall diameter of the triaxial geogrid was set at 39.1 mm. A comprehensive summary of the geometric and structural properties of the printed geogrid is presented in Table 2.
Figure 2
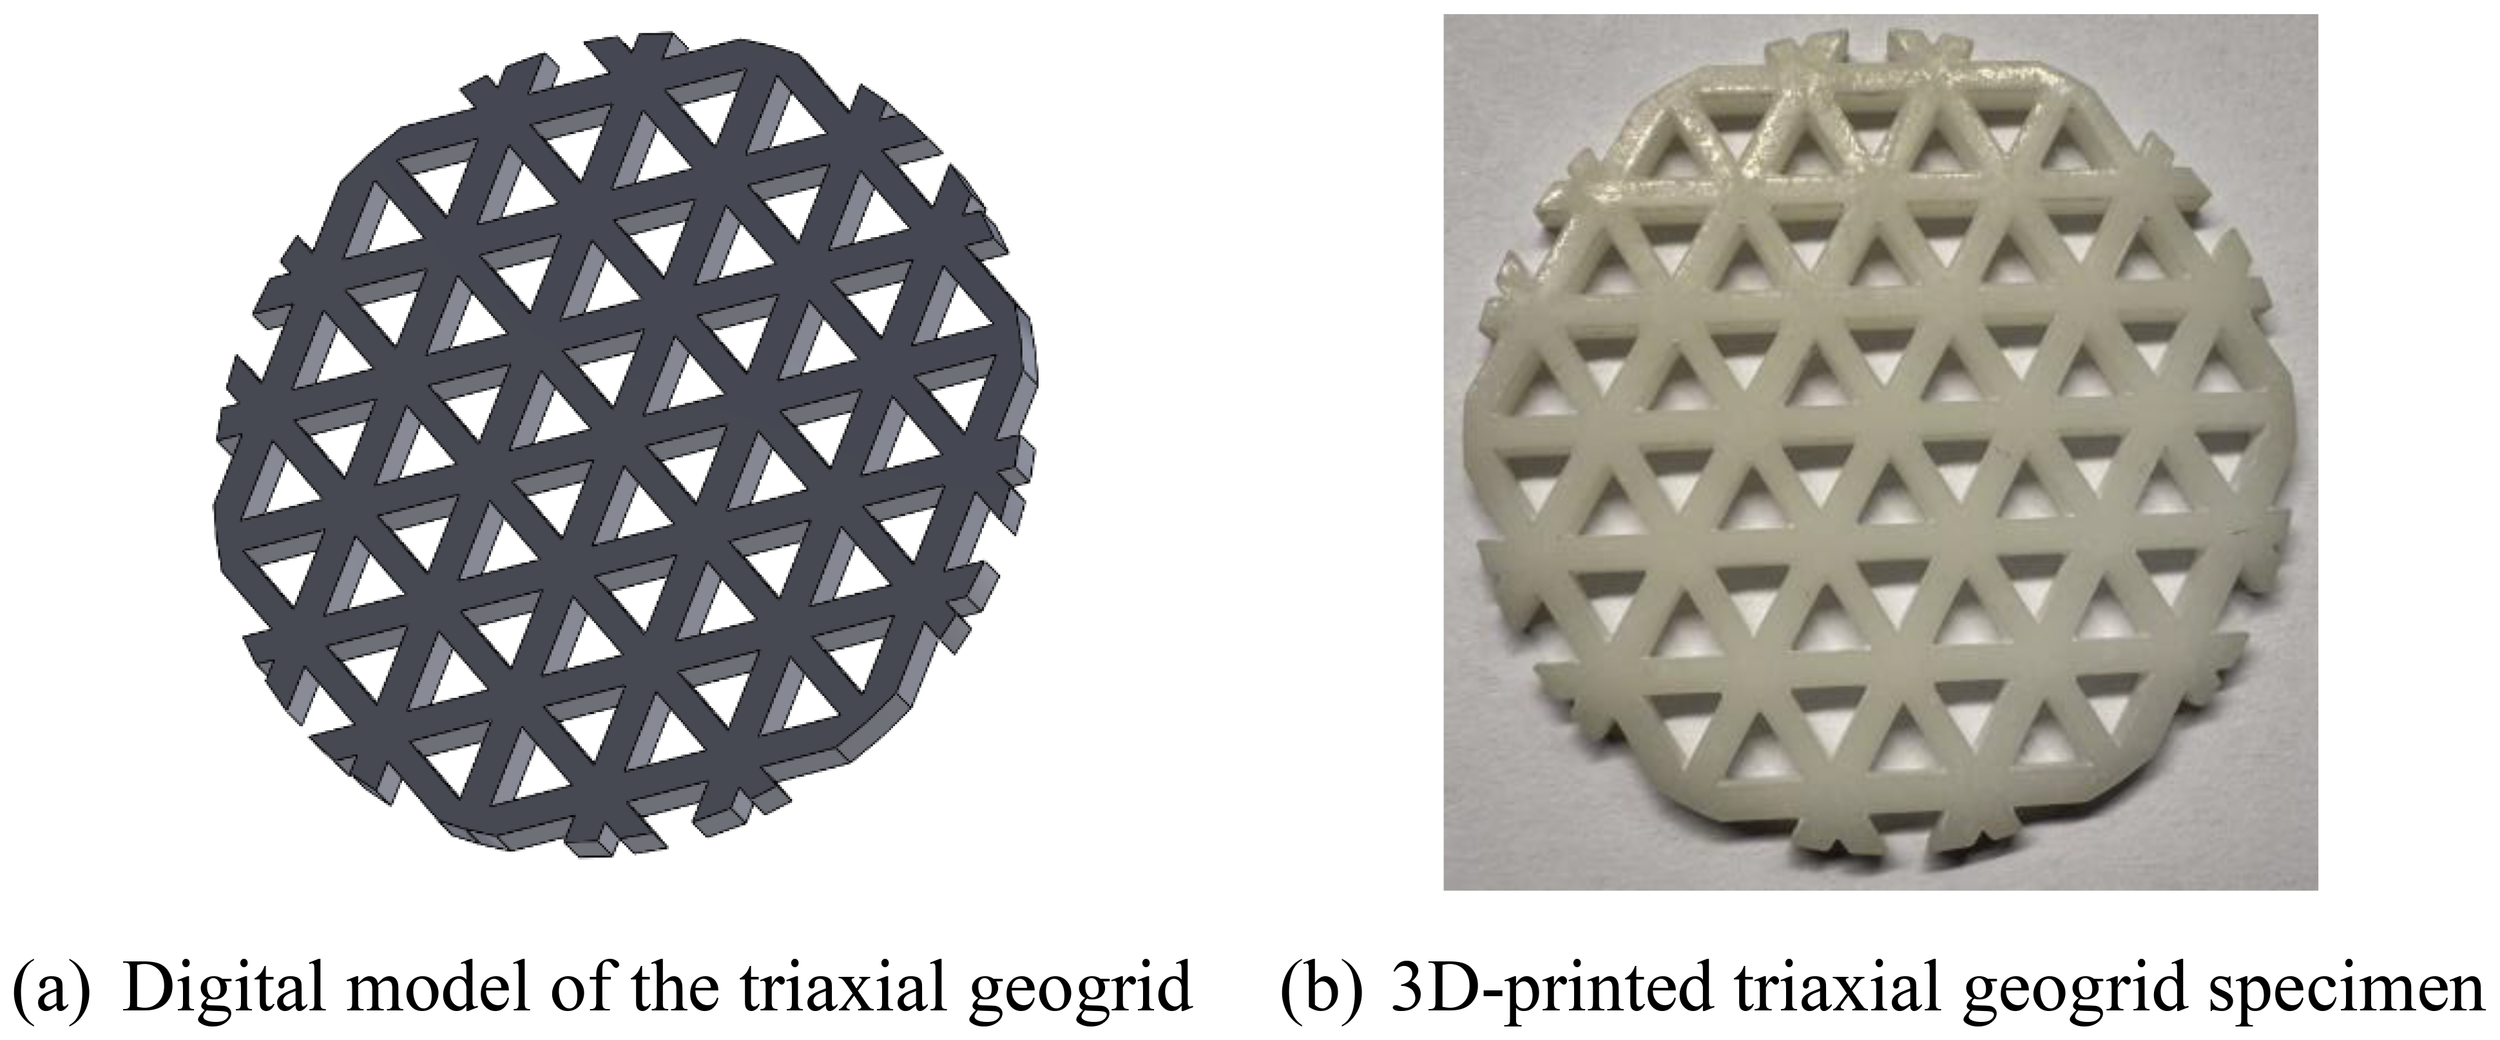
3D printing of geogrid model and entity. (a) Digital model of the triaxial geogrid. (b) 3D-printed triaxial geogrid specimen.
Table 2
| Standard | Tensile modulus | Tensile strength | Elongation at break | Flexural modulus | Impact strength | Distortion temperature |
|---|---|---|---|---|---|---|
| ASTM | 2,598Mpa | 58Mpa | 11% | 2,755Mpa | 30J/m | 65°C |
Physical and mechanical properties of the triaxial geogrid.
2.2 Experimental procedure
In the natural conditions of islands and reefs in the South China Sea (Gao and Ye, 2024), surface and near-surface marine coral sand typically remains in an unsaturated state for extended periods, leading to significantly low shear strength (Chao et al., 2025; Ye and Gao, 2024). These regions are considered potential target zones for geogrid-based reinforcement (Gao and Ye, 2024). A thorough understanding of their mechanical behavior and the establishment of an effective reinforcement mechanism are essential to ensure the structural safety and stability of island infrastructure. To explore the fundamental mechanical response, deformation behavior, and particle crushing characteristics of marine coral sand–clay mixtures (MCCM) reinforced with triaxial geogrids, a series of unconsolidated undrained (UU) triaxial tests were performed. These tests, summarized in Table 3, examined the influence of several key factors, including clay content, number of geogrid layers, water content, and confining pressure.
Table 3
| Number | Clay content | Confining pressure(kPa) | Geogrid layers | Water content |
|---|---|---|---|---|
| T1 | 30 | 50、100、150、200 | 0、1、2 | 0 |
| T2 | 50 | 50、100、150、200 | 0、1、2 | 0 |
| T3 | 70 | 50、100、150、200 | 0、1、2 | 0 |
| T4 | 70 | 50、100、150、200 | 1 | 9 |
| T5 | 70 | 50、100、150、200 | 1 | 15 |
| T6 | 70 | 50、100、150、200 | 1 | 18 |
| T7 | 70 | 50、100、150、200 | 1 | 21 |
| T8 | 70 | 50、100、150、200 | 1 | 27 |
| T9 | 70 | 50、100、150、200 | 1 | 36 |
Experimental scheme.
All tests were carried out using a static-dynamic triaxial testing apparatus (VJ Tech, UK), as illustrated in Figure 3. For each specimen, the mass of individual layers was pre-calculated based on the target water content, followed by accurate weighing and water adjustment. The MCCM material was thoroughly mixed, placed into the mold in layers, and compacted to the specified height. During specimen preparation, the geogrid volume was accounted for and subtracted to ensure consistent sample density. After specimen preparation, triaxial compression tests were performed, with loading continued until an axial strain of 15% was reached. Upon completion, the specimens were disassembled, washed, oven-dried, and subjected to sieve analysis to determine the post-shear particle size distribution of the marine coral sand.
Figure 3
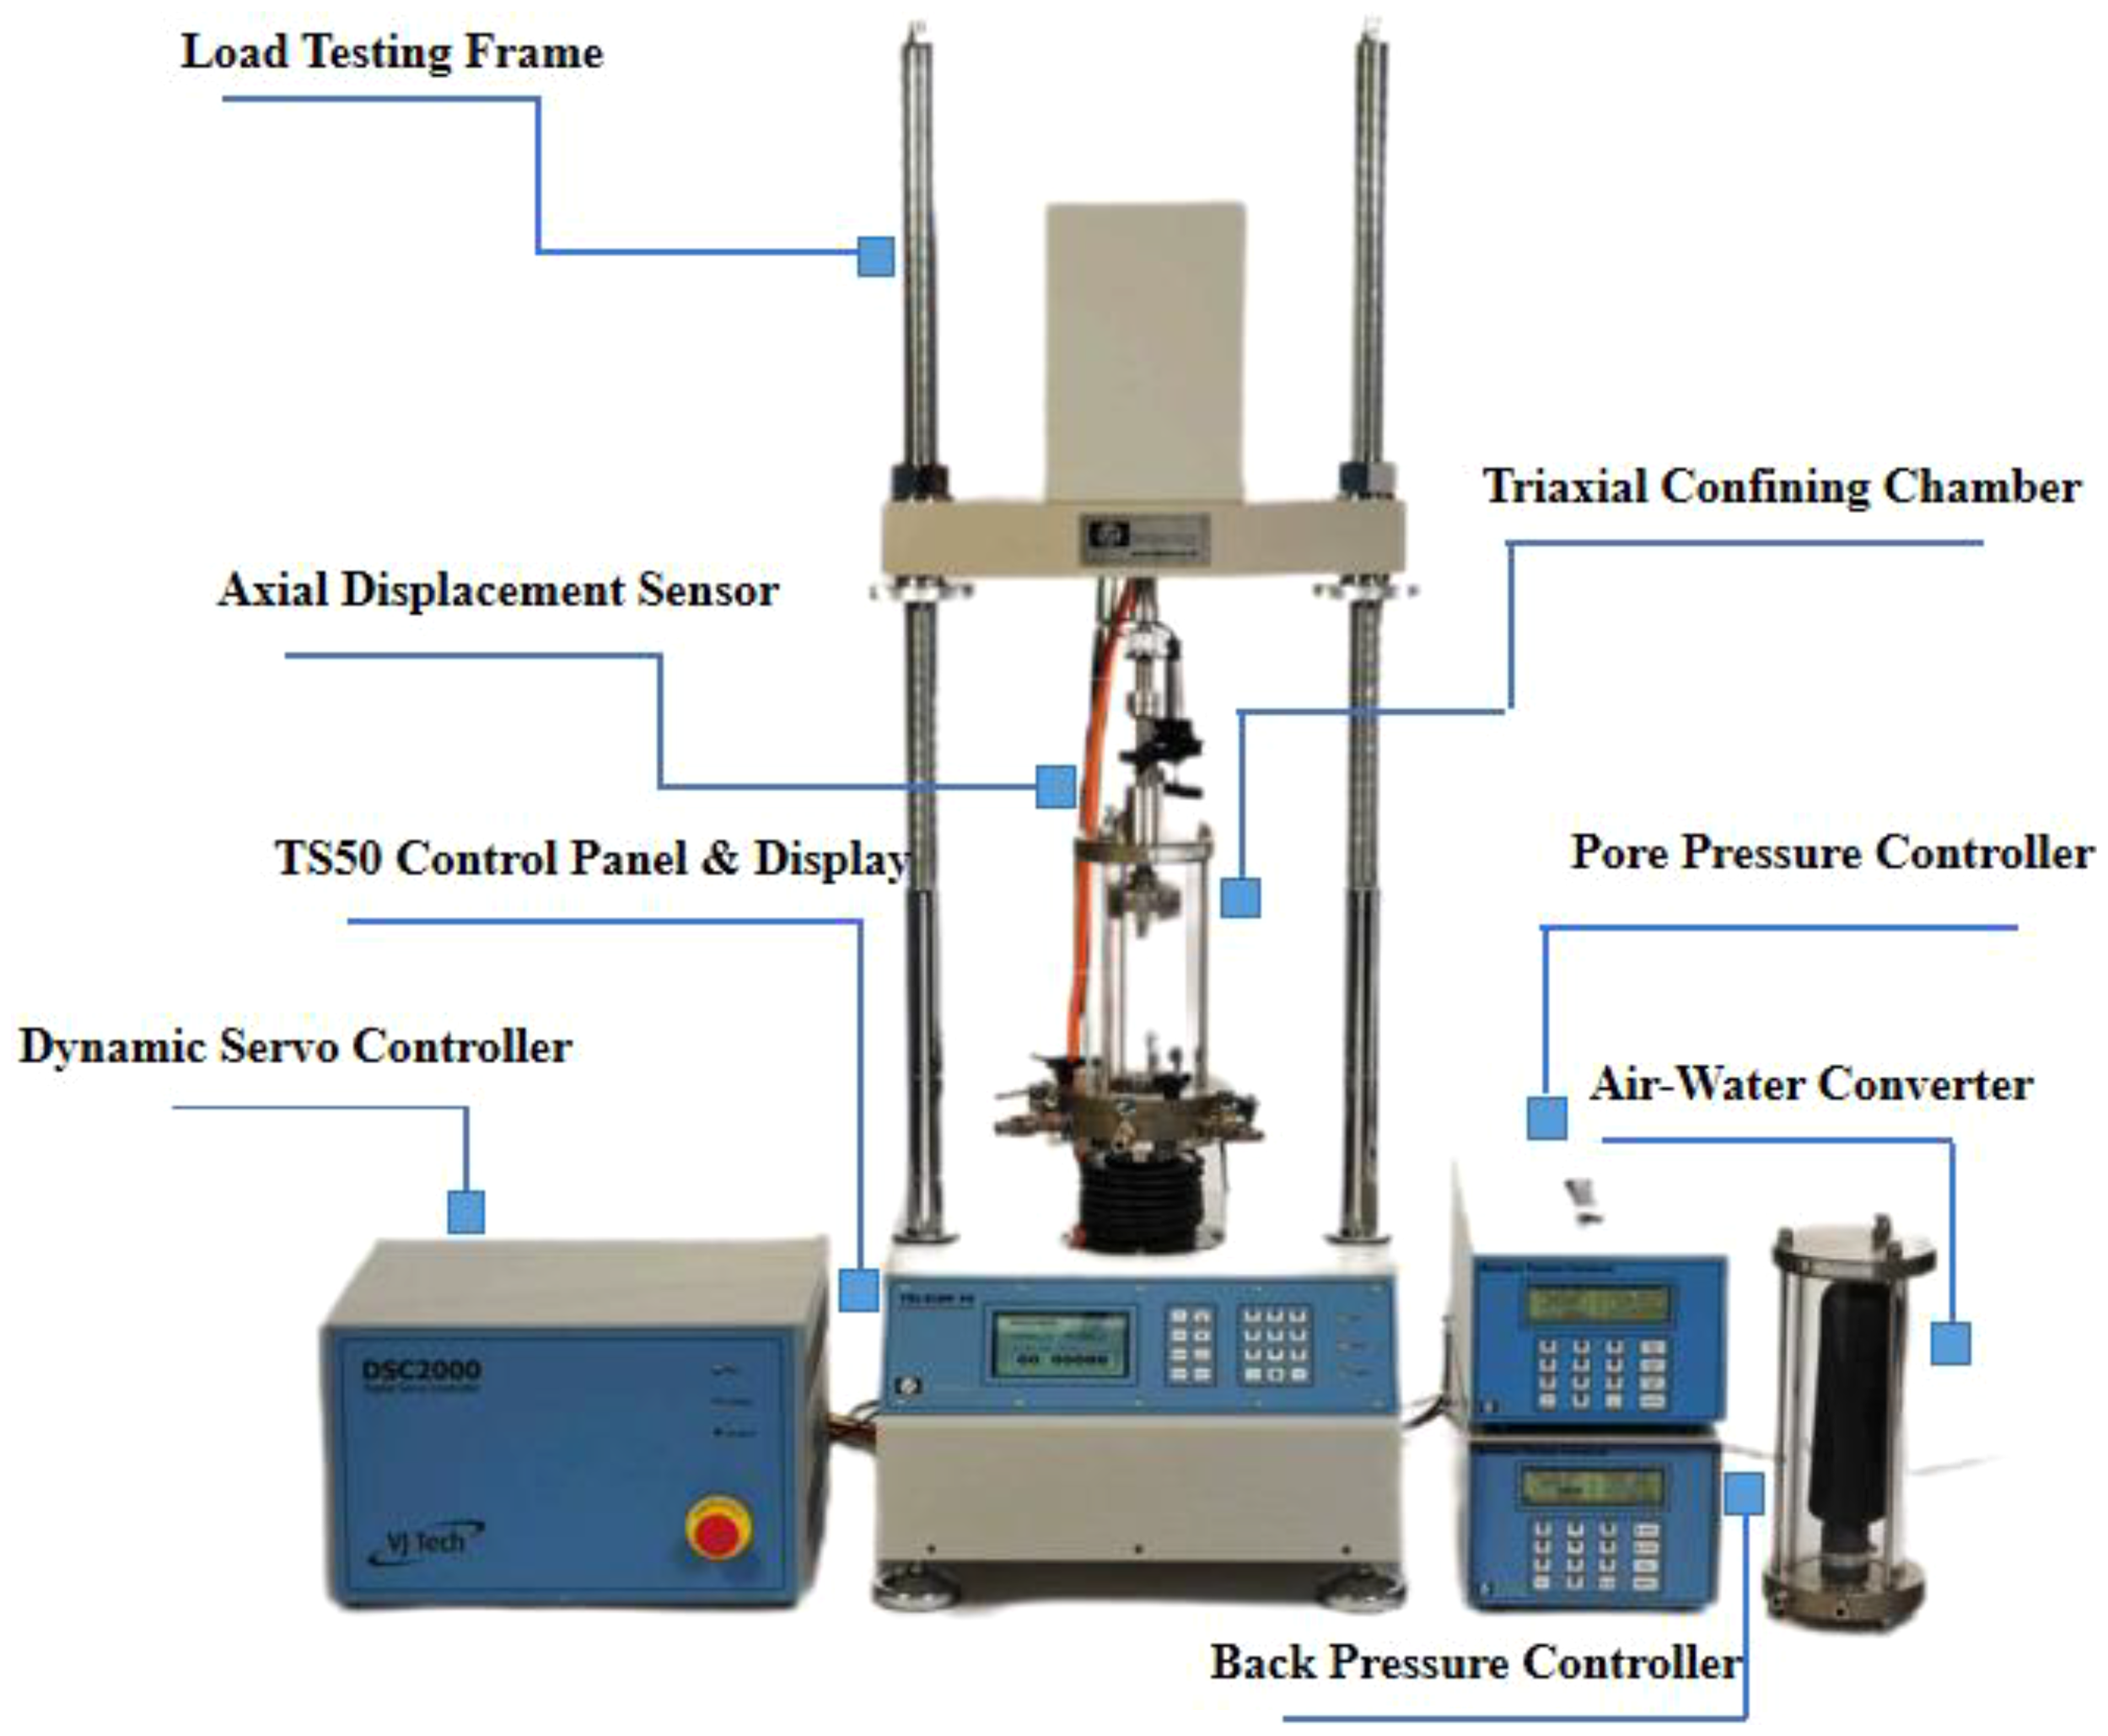
A static-dynamic triaxial testing apparatus (VJ Tech, UK).
2.3 Impact of clay content variation on the strength characteristics of MCCM
Based on the experimental results, deviator stress–strain curves corresponding to the test groups listed in Table 3 were obtained. Figures 4a–d illustrate the stress–strain responses of dried MCCM specimens with varying confining pressure. The results indicate that increasing the confining pressure and the number of geogrid layers, as well as reducing the clay content, leads to a noticeable rise in peak deviator stress and a more evident hardening behavior. Notably, the specimen containing 30% clay, tested under a confining pressure of 200 kPa with two reinforcement layers, exhibited a maximum deviator stress of 5300.15 kPa at 15% axial strain.
Figure 4
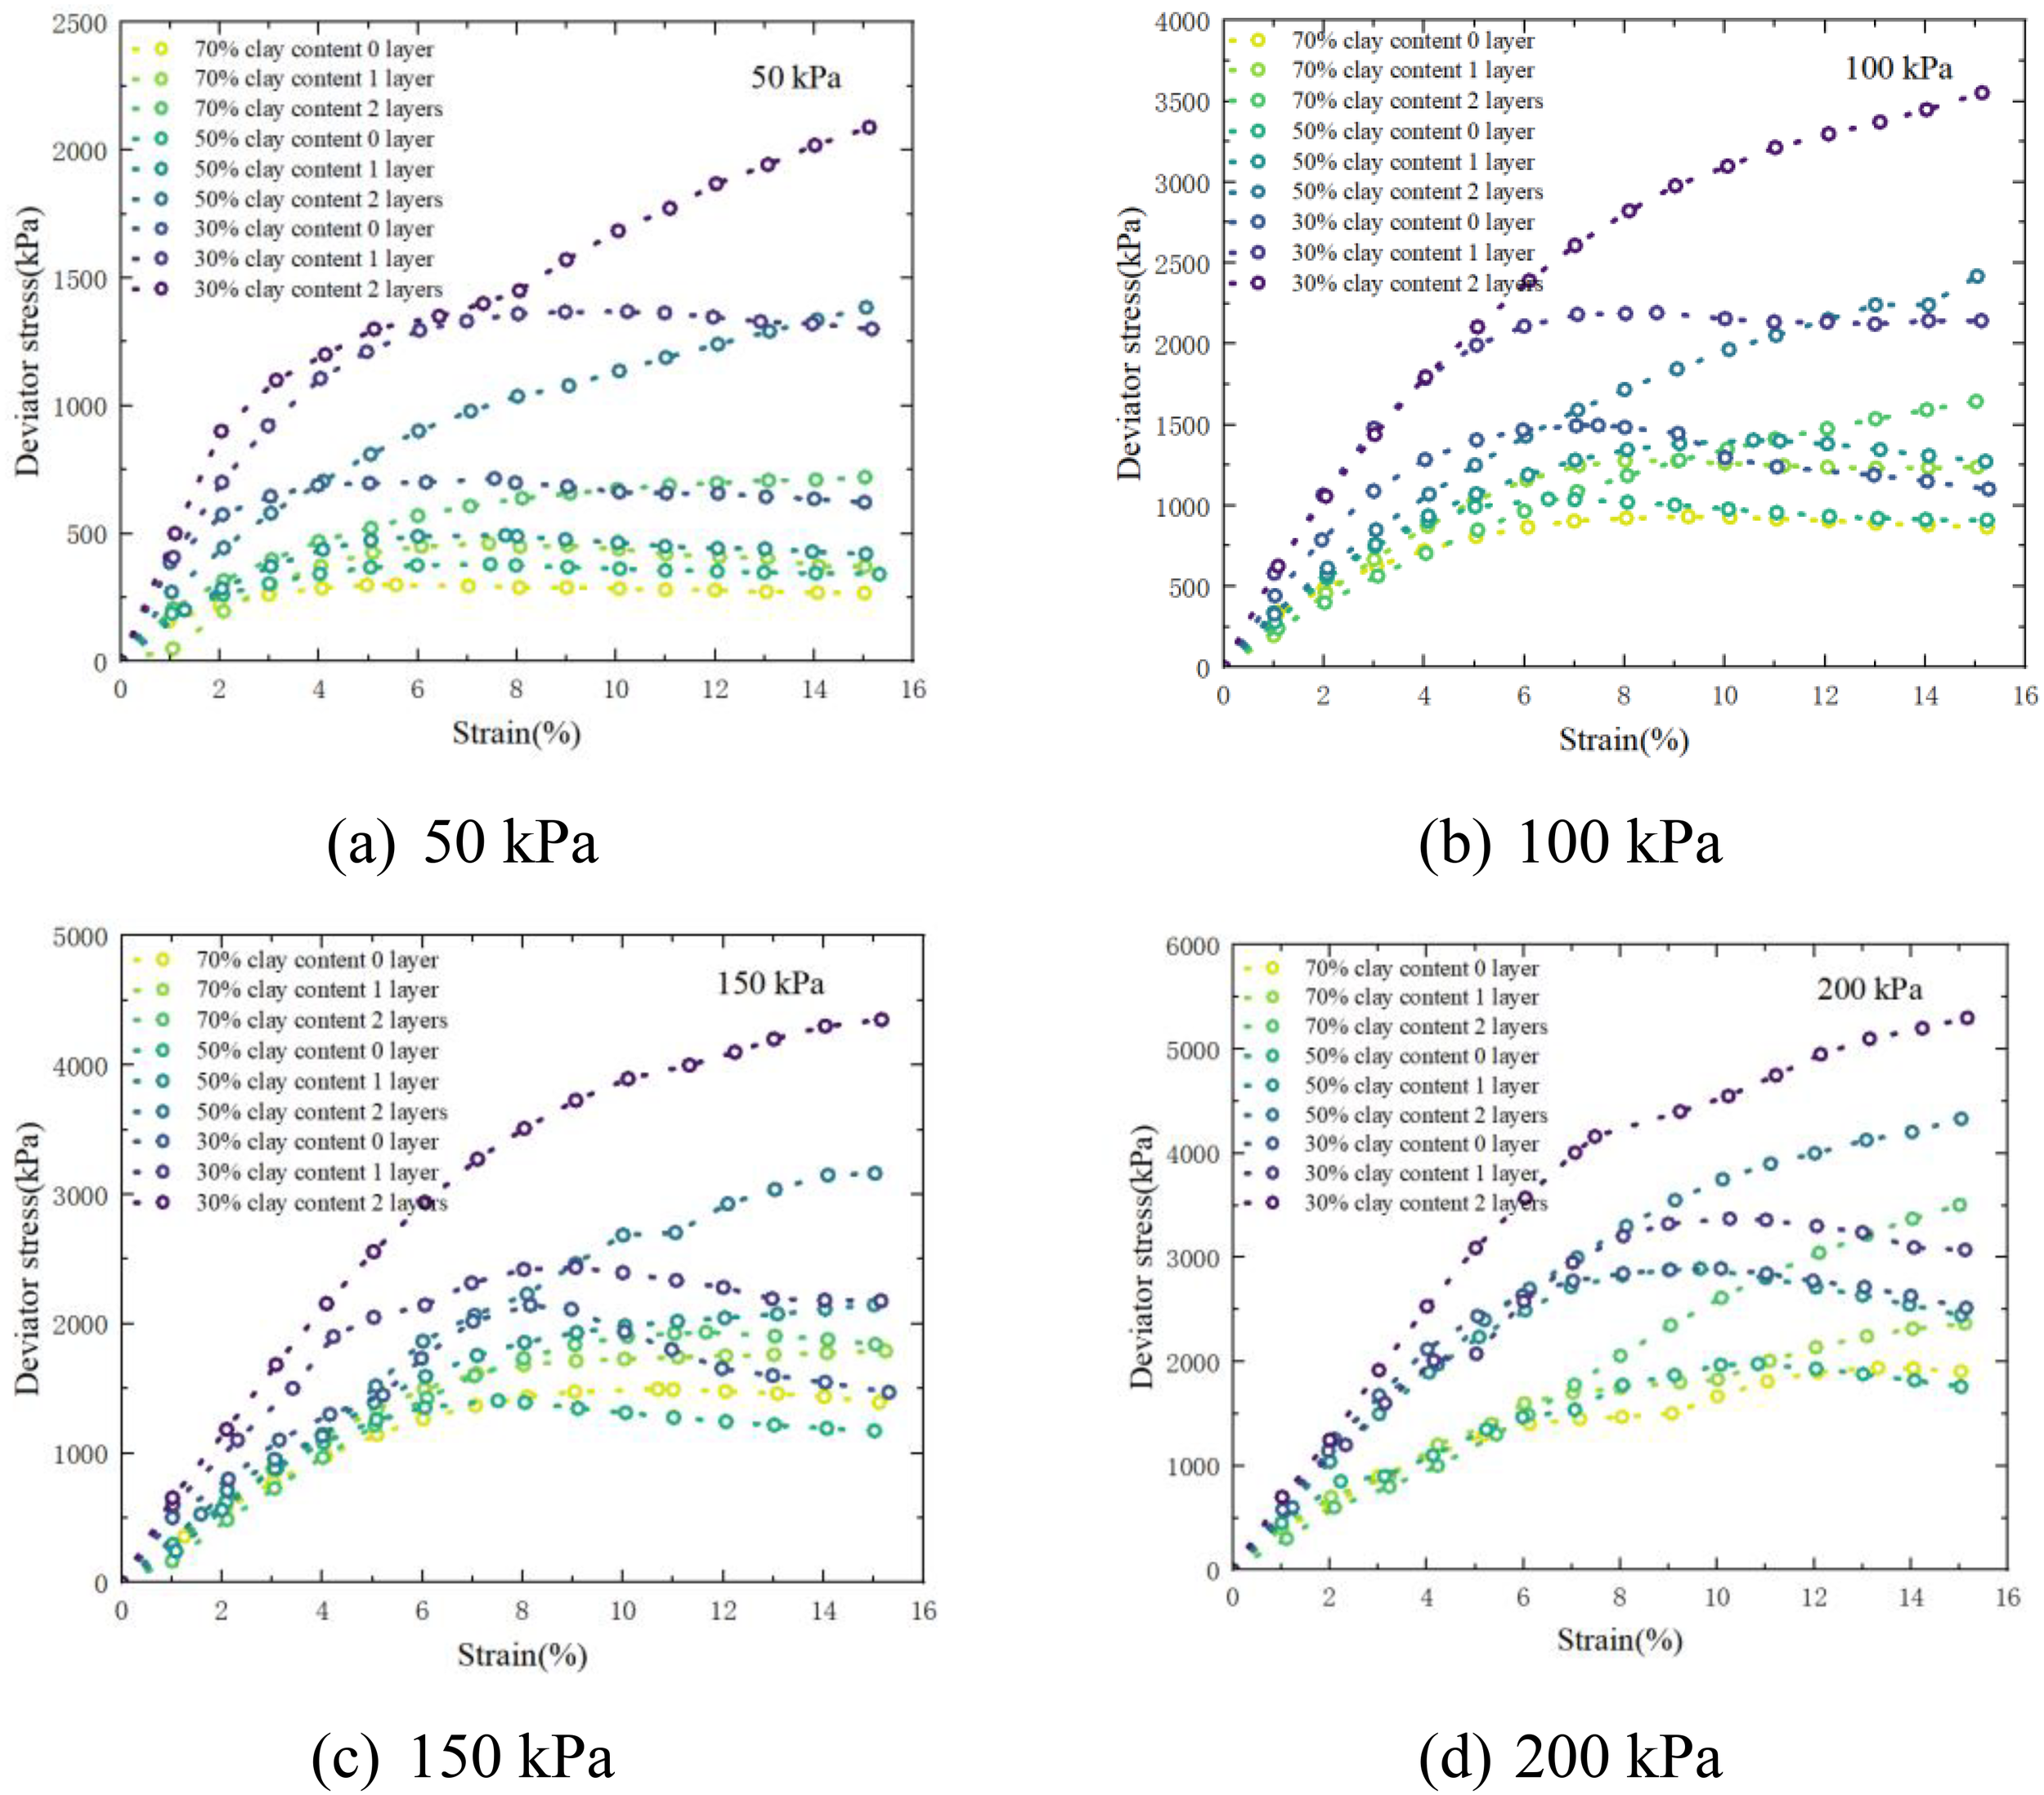
Stress–strain curves of MCCM under different confining pressure. (a) 50 kPa. (b) 100 kPa. (c) 150 kPa. (d) 200 kPa.
2.4 Impact of water content variation on the strength characteristics of MCCM
Figure 5 presents the deviator stress–strain curves of MCCM specimens containing 70% clay and reinforced with a single geogrid layer under varying moisture conditions. The results show that specimens with higher water content exhibit lower strength compared to their dried counterparts. However, it can also be observed that the strength of MCCM does not decrease monotonically with increasing water content; instead, it first declines, then rises, and eventually drops again. This trend indicates a nonlinear and highly complex relationship between water content and the strength behavior of MCCM.
Figure 5
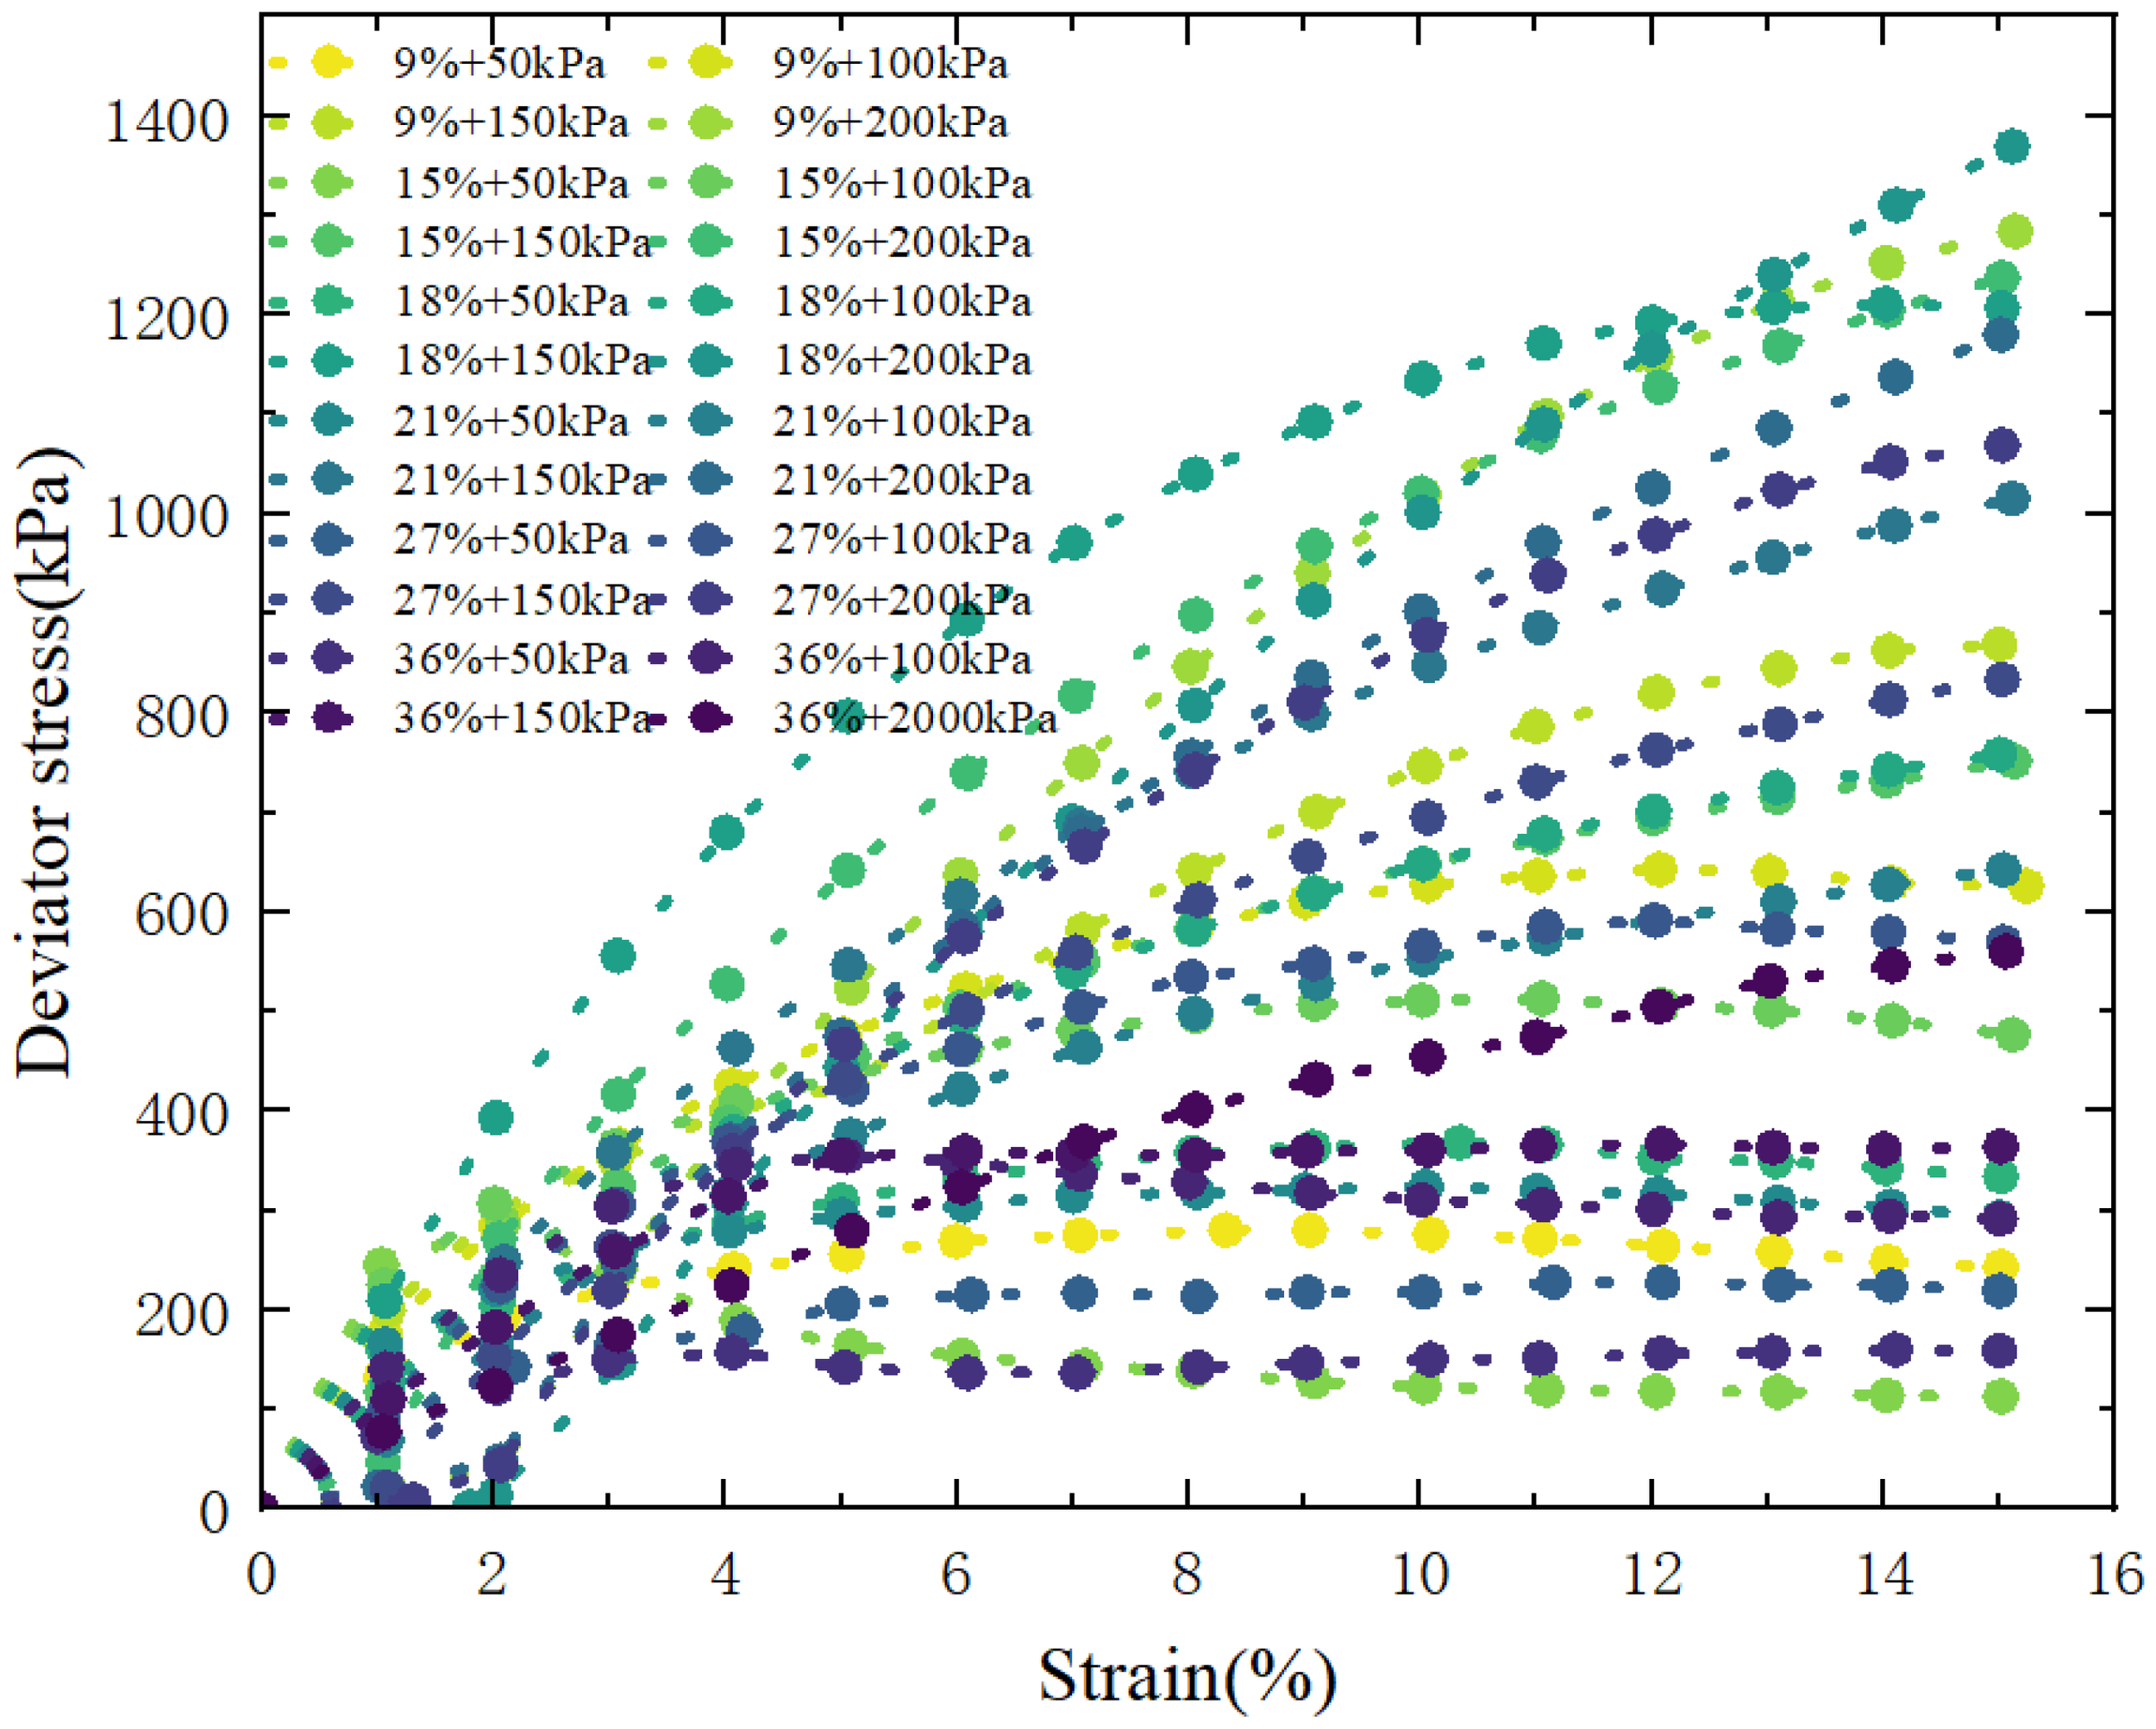
Stress–strain curves of MCCM under different water contents.
The observed variation in strength can be attributed to several factors. Initially, the increase in water content leads to the softening of the clay particles, causing a decrease in the material’s overall strength. As the water content continues to increase, the water may act as a lubricating agent, temporarily improving the internal structure of the material and enhancing its shear strength. However, beyond a certain point, excessive water content can result in the weakening of the cemented bonds between the particles, leading to a reduction in strength. This non-monotonic behavior suggests that there may be an optimal water content for MCCM, where the balance between lubrication and cementation is most favorable for strength development.
3 Methodology
3.1 Machine learning algorithms
In this study, a machine learning approach based on the Back Propagation Neural Network (BPNN) is adopted. To enhance the model’s performance, optimization techniques including Genetic Algorithm (GA), Particle Swarm Optimization (PSO), and Logical Development Algorithm (LDA) are incorporated. These methods offer several advantages, among which three primary benefits are particularly noteworthy:
-
Each algorithm was constructed through a uniform and methodical development framework (Kardani et al., 2020).
-
They have been extensively utilized in tackling various issues within the field of marine engineering (Samui, 2012; Zhou et al., 2017).
-
They are highly effective in capturing the intricate nonlinear relationships among a wide range of contributing variables (Liu et al., 2015).
3.1.1 BPNN
The Back Propagation Neural Network (BPNN) is a type of artificial neural network that processes data through multiple layers by iteratively adjusting weights and biases (Hecht-Nielsen, 1992). It receives input variables through the input layer, propagates them to the hidden layer, where weighted computations and nonlinear transformations are performed using activation functions, and finally produces the predicted output. In this study, the BPNN model is configured with five input parameters—clay content, number of reinforcement layers, confining pressure, water content, and strain—and one output parameter: stress. The model employs the Log-Log Sigmoid function as the activation function and is constructed using the newff function, with initial weights and biases optimized to enhance prediction performance as shown in Figure 6.
Figure 6
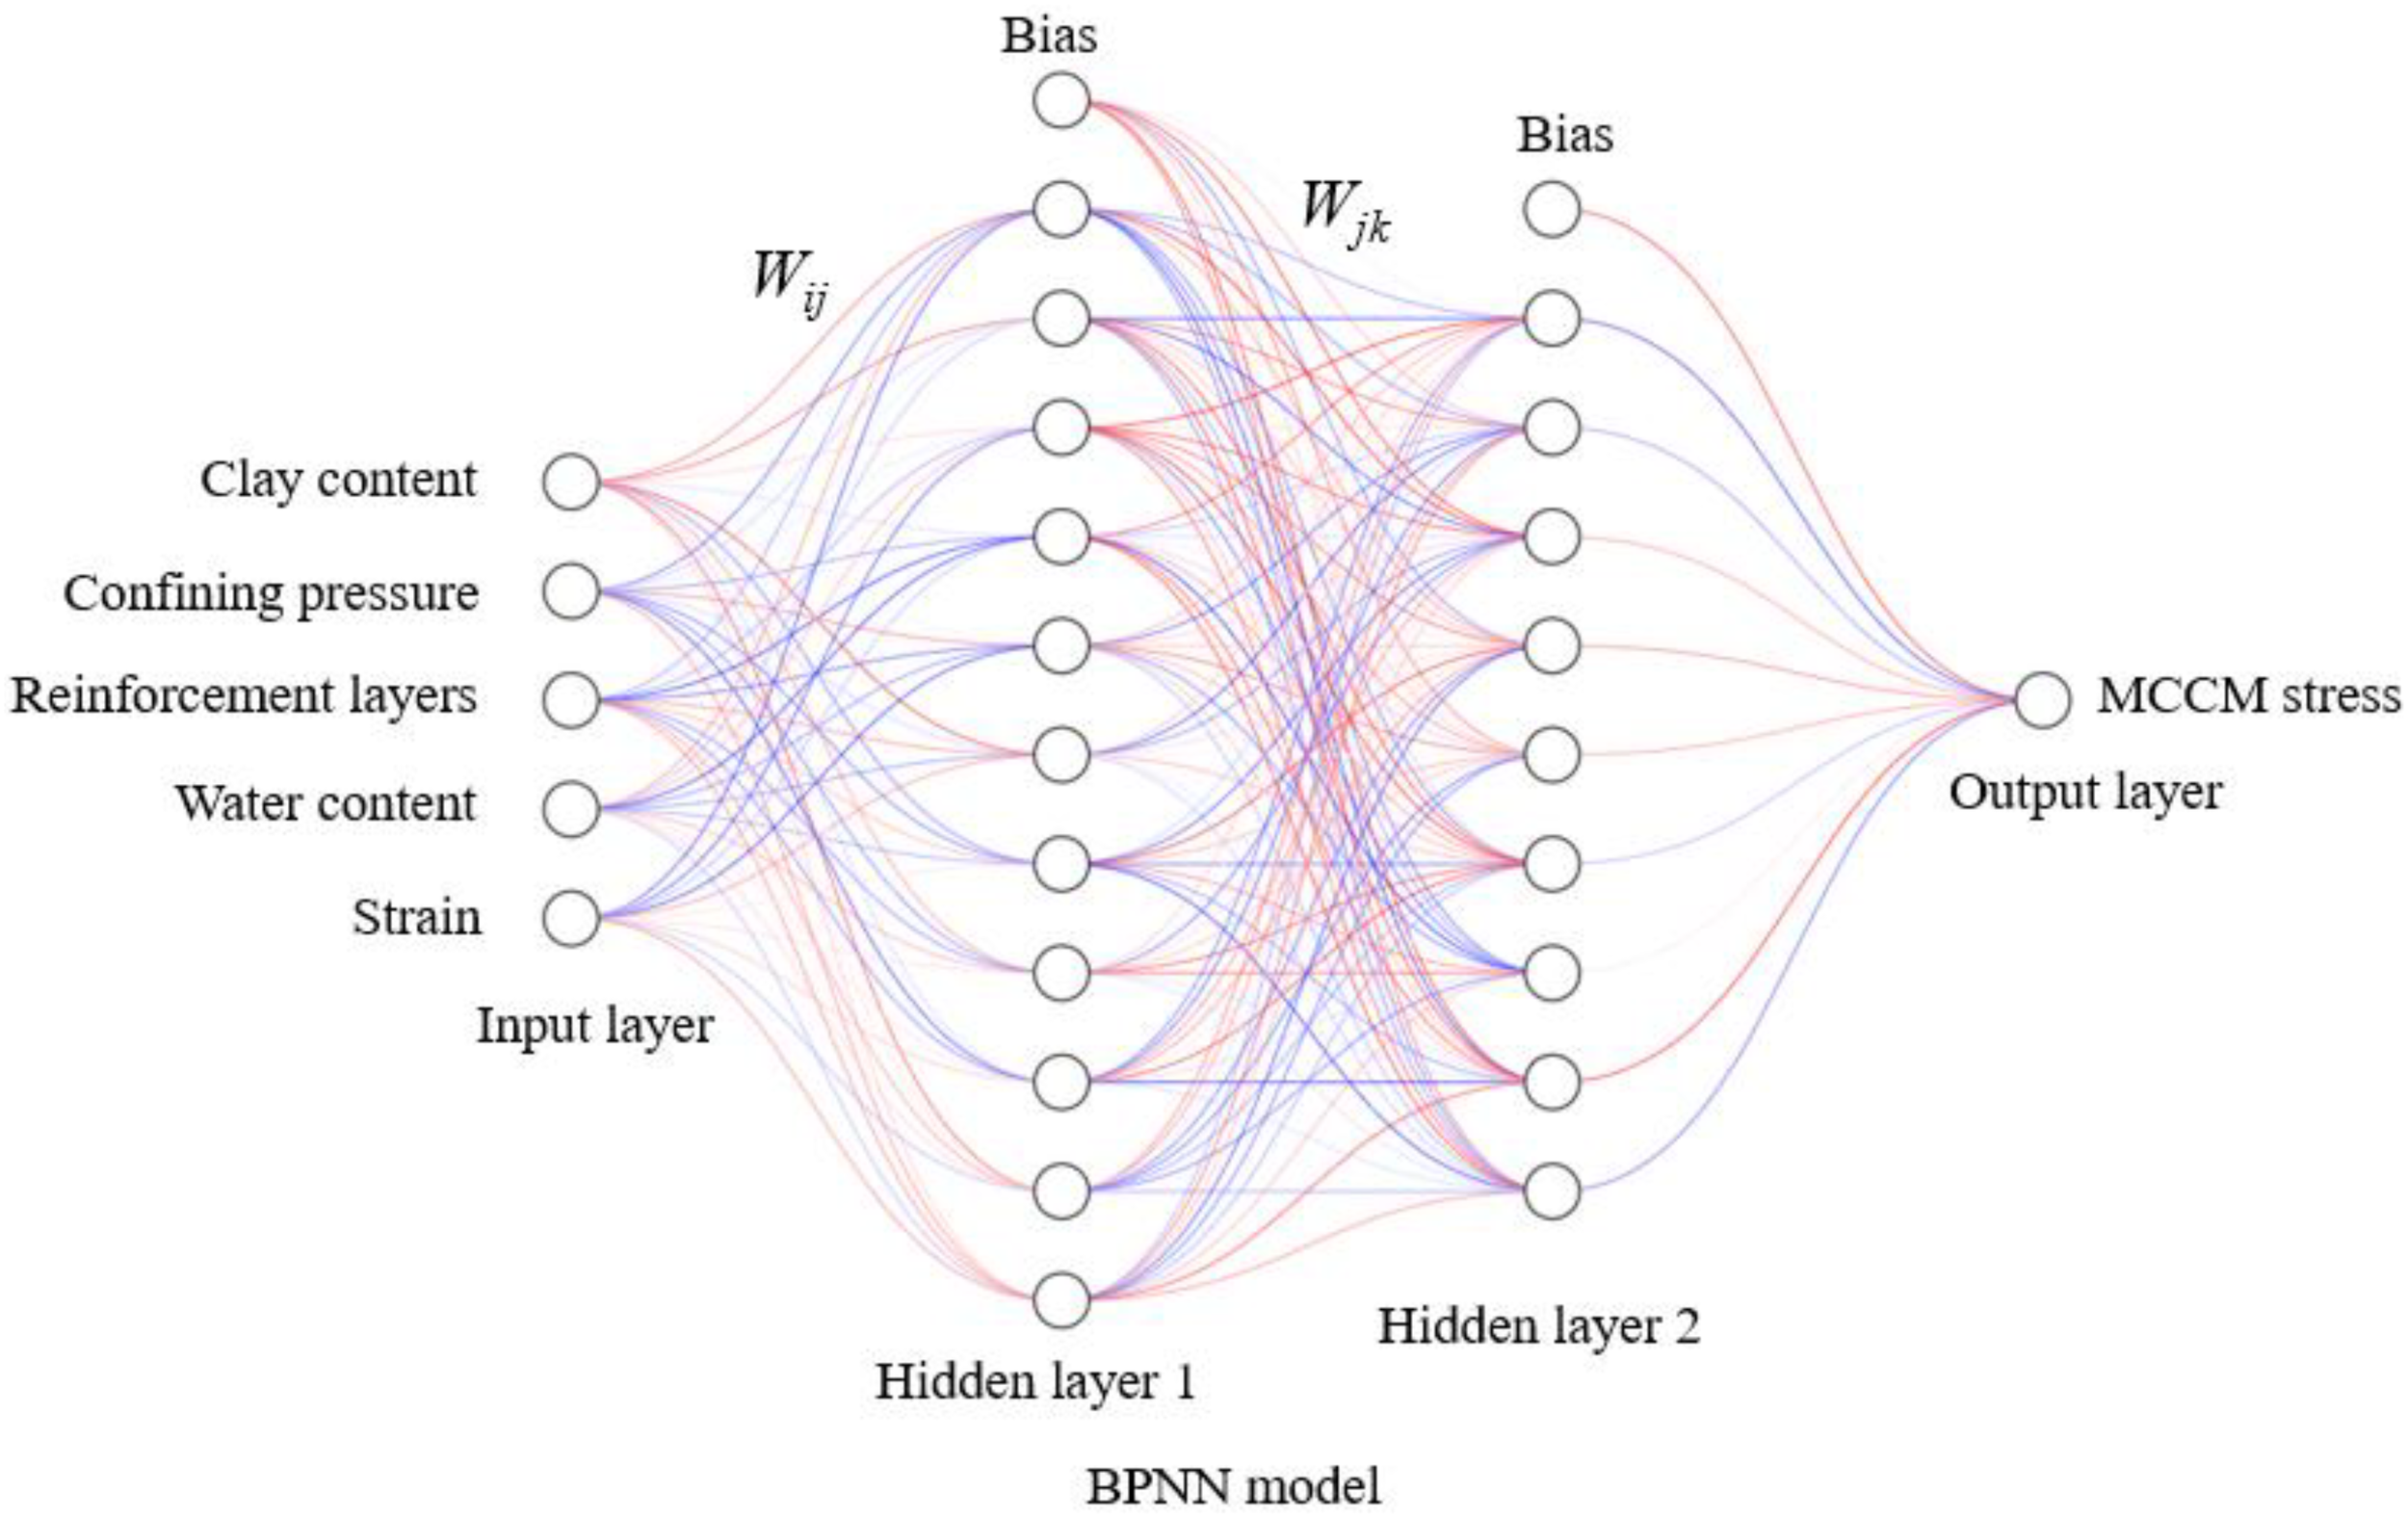
The typical structure of BPNN.
3.1.2 GA and PSO
The Genetic Algorithm (GA) is a population-based optimization technique inspired by the principles of natural selection (Lambora et al., 2019). It identifies optimal or near-optimal solutions by simulating evolutionary processes such as selection, crossover, and mutation. The process begins with a randomly initialized population, where each individual is evaluated using a fitness function. High-performing individuals are selected to reproduce, and genetic diversity is introduced through crossover and mutation. This iterative process continues until a predefined stopping criterion—such as a maximum number of iterations or an acceptable fitness level—is satisfied. GA is particularly effective in solving complex optimization problems due to its robust global search capability and adaptability in nonlinear, high-dimensional spaces.
Particle Swarm Optimization (PSO) is another population-based heuristic algorithm, inspired by the coordinated behavior of swarming organisms like birds and fish (Wang et al., 2018). In PSO, each potential solution is represented as a particle that navigates the search space, adjusting its velocity and position based on both its personal best performance and the best experience found by the entire swarm. This mechanism enables the swarm to collectively converge toward optimal solutions. PSO offers several advantages, including a simple structure, ease of implementation, no reliance on gradient information, and strong global optimization ability. It has been successfully applied in function optimization, neural network training, and other complex optimization tasks.
3.1.3 LDA
Logical Development Algorithm (LDA) is a supervised dimensionality reduction technique that transforms input features into a lower-dimensional space by maximizing the ratio of between-class variance to within-class variance (Chao et al., 2024a). In regression-oriented applications, LDA can be used as a preprocessing step to extract the most relevant and uncorrelated features, thereby improving model stability, reducing overfitting, and enhancing prediction accuracy. Its integration with neural networks helps simplify the input space while retaining essential discriminative information, contributing to more efficient and robust learning.
The integration of LDA with neural networks enhances its effectiveness by simplifying the input space while retaining essential discriminative information. This step enables more efficient learning, as the neural network can focus on the most relevant features without being overwhelmed by redundant data. As a result, the model becomes more robust and capable of handling complex, high-dimensional datasets with greater ease. Moreover, this combination of LDA and neural networks contributes to faster training times, as the reduced dimensionality allows the network to converge more quickly while still capturing the key patterns in the data. This synergy ultimately leads to improved overall performance, especially when dealing with large-scale, noisy, or imbalanced datasets as shown in Figure 7.
Figure 7
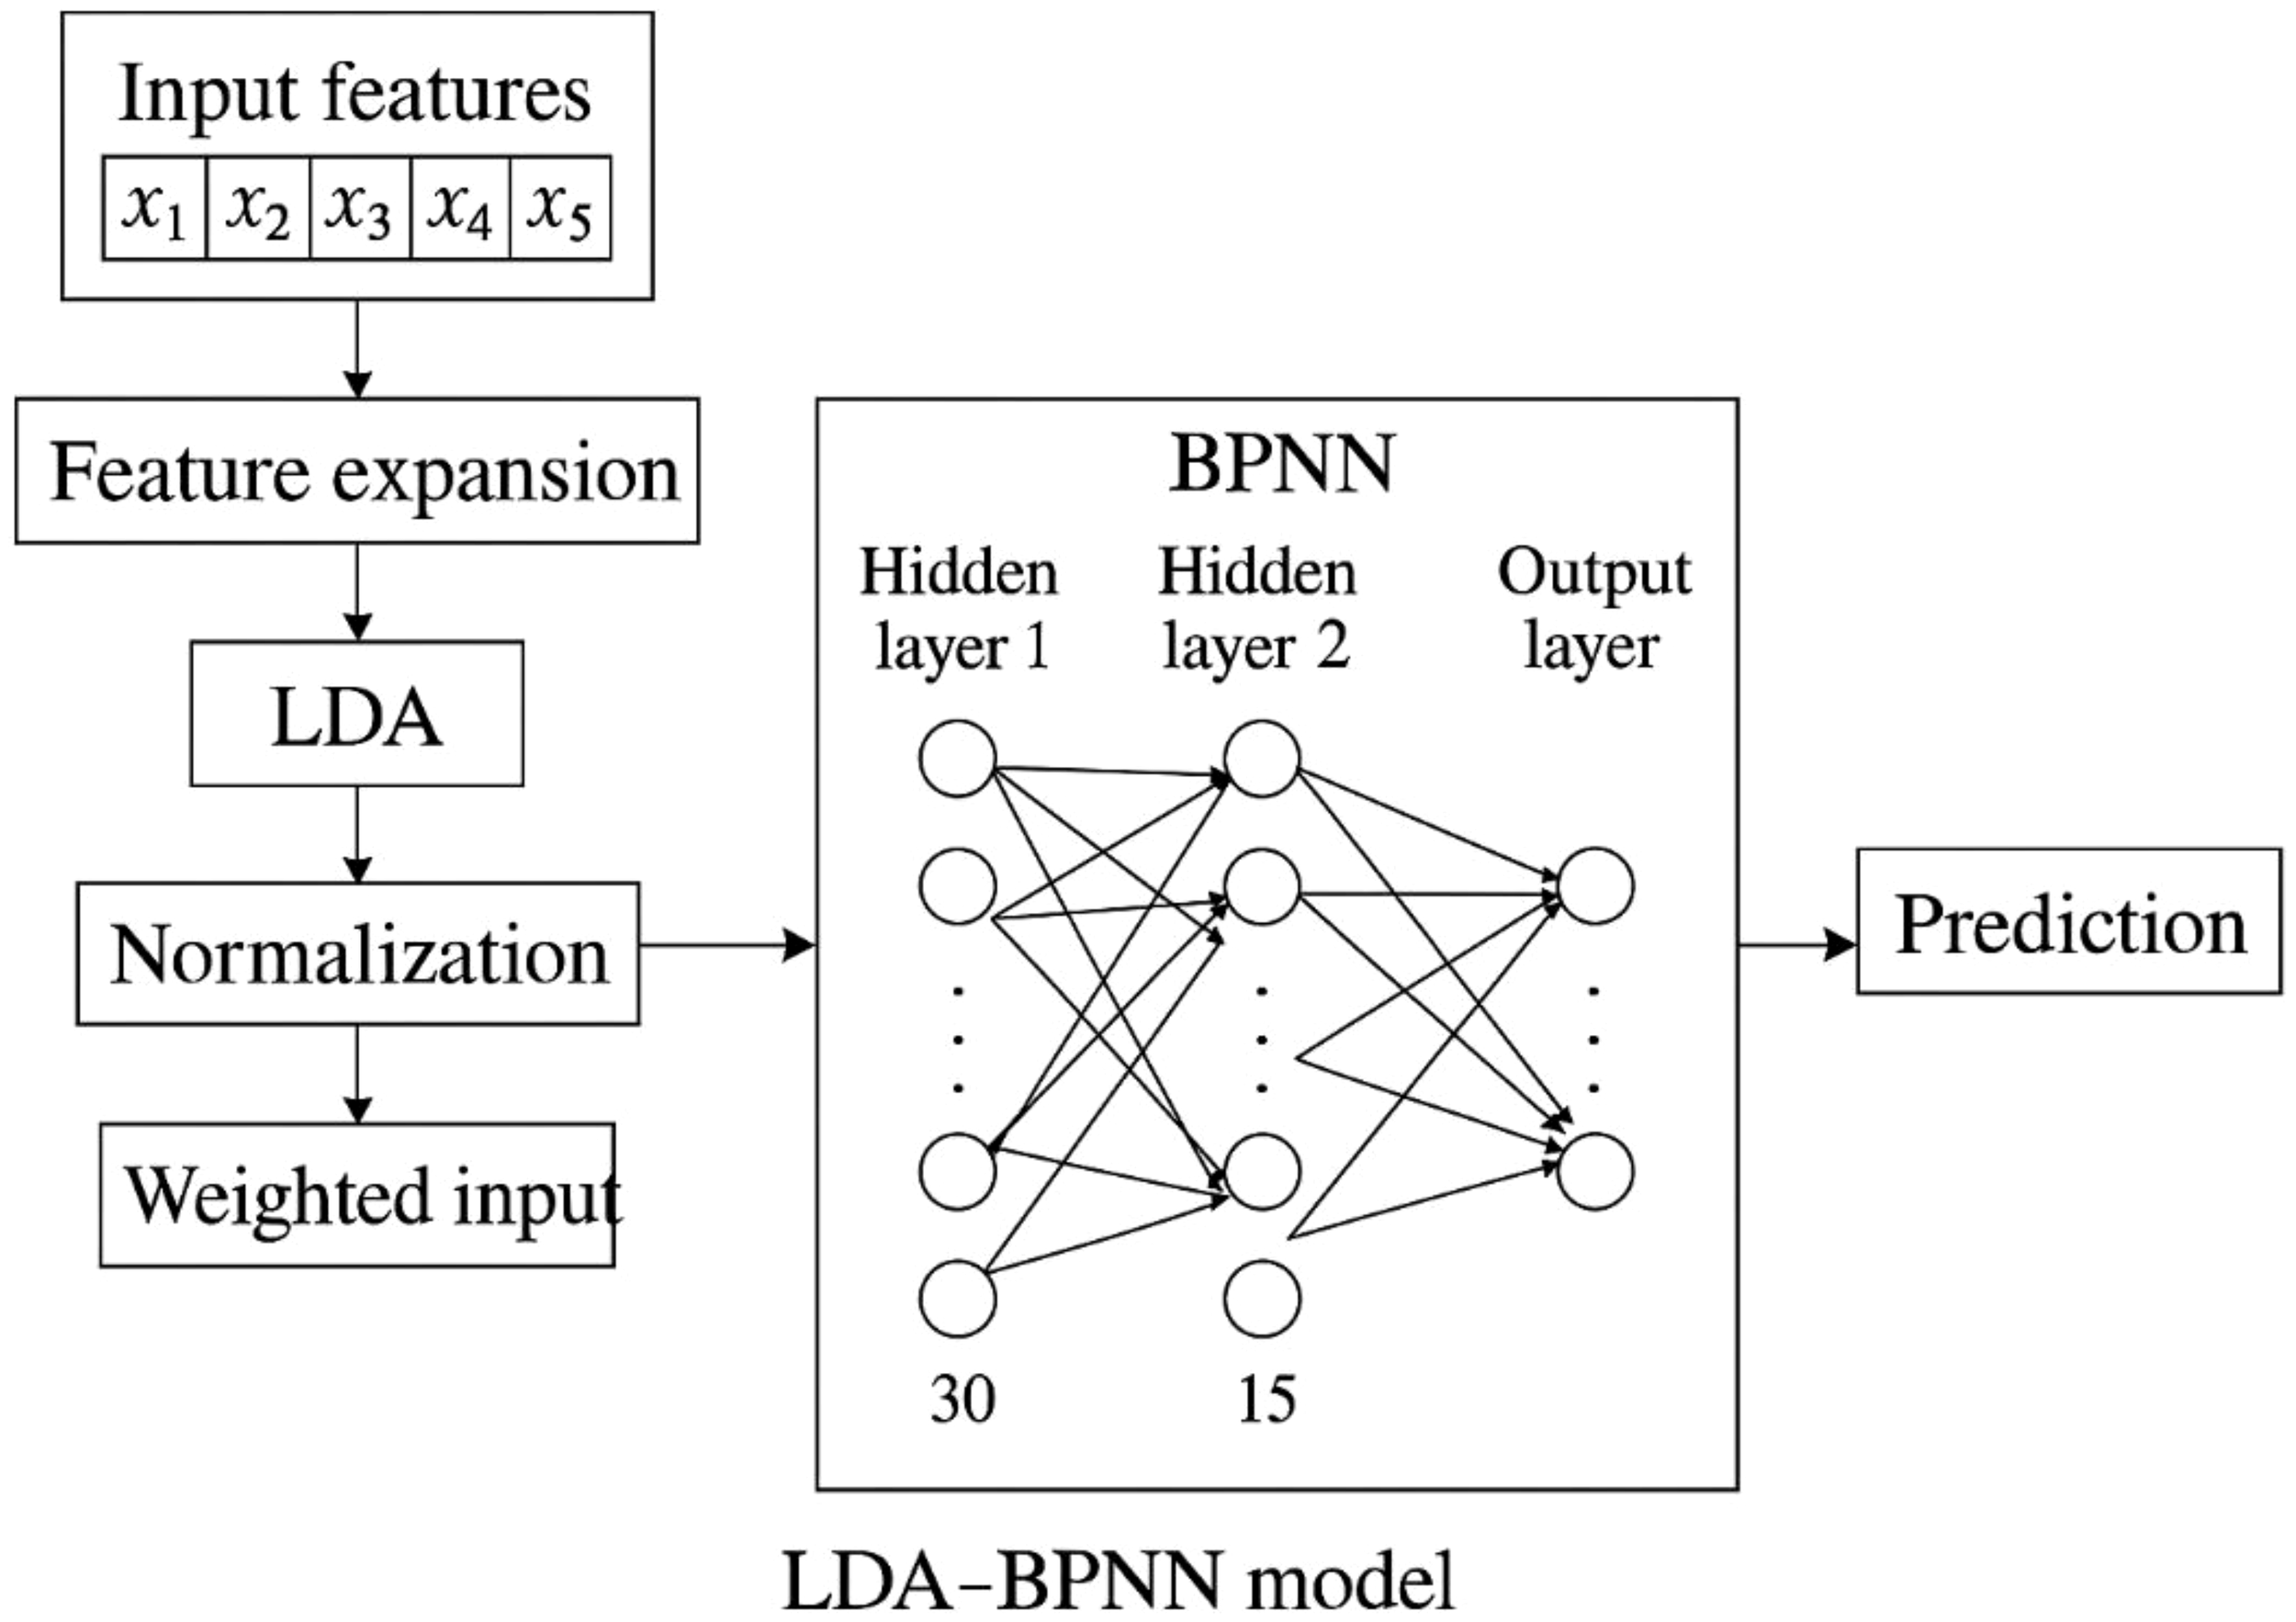
LDA-BPNN Model Workflow.
3.2 Model parameter setting
Hyperparameter optimization plays a crucial role in enhancing the performance of machine learning models, as different configurations can significantly affect training efficiency and predictive accuracy. In this study, GA, PSO, and LDA were used to optimize the hyperparameters of a BPNN to improve overall model performance.
To ensure efficient convergence and improved accuracy, key parameters in each optimization algorithm were carefully selected, as summarized in Table 4. In GA, the population size(pop_num) was set to 5 to reduce computational overhead while maintaining sufficient search diversity. The number of generations (gen) was fixed at 100 to ensure comprehensive exploration. The selection function parameter (normGeomSelect) was set to 0.05 to increase the probability of selecting high-fitness individuals. The crossover function (arithXover) was assigned a value of 3 to enhance diversity, while the mutation function (nonUnifMutation) was configured as [0.5, 50, 3] to strengthen global search capabilities and prevent premature convergence. The optimal solution tolerance (maxGenTerm) was set to 1e-6, allowing continued search near the optimum and improving solution stability. In PSO, the learning factors (c1, c2) were set to 1.5 to balance individual and collective influence on particle velocity. The position limits were set between -1.0 and 1.0 to constrain the search space. A population size (sizepop) of 30 was used to maintain a trade-off between computational cost and global search ability. The number of population update times (maxgen) was set to 100, and the training epochs (epochs) for the BPNN were set to 150 to ensure adequate learning. For LDA, the population size (pop_num) was set to 30 and the maximum number of iterations (max_iter) to 50. The mutation factor (F) was set to 0.5 to improve global exploration, and the crossover probability (CR) was set to 0.9 to enhance diversity within the solution space. These settings enabled the model to more effectively capture class separability, thereby improving classification accuracy after dimensionality reduction. Overall, the well-tuned hyperparameters allowed GA, PSO, and LDA to significantly enhance BPNN performance. These optimizations accelerated convergence, reduced overfitting, and ultimately improved prediction accuracy, demonstrating strong potential in applications such as reinforced MCCM strength prediction.
Table 4
| Hyperparameter | Parameter name | Range of values |
|---|---|---|
| GA | Population size(pop_num) | 5 |
| Genetic generations(gen) | 100 | |
| Selection function parameter(normGeomSelect) | 0.05 | |
| Crossover function parameter (arithXover) | 3 | |
| Mutation function parameter(nonUnifMutation) | [0.5,50,3] | |
| Optimal solution tolerance(maxGenTerm) | 1e-6 | |
| PSO | Learning factors (c1, c2) | 1.5 |
| Maximum position (popmax) | 1.0 | |
| Minimum position (popmin) | -1.0 | |
| Population size (sizepop) | 30 | |
| Population update times (maxgen) | 100 | |
| Training iterations (epochs) | 150 | |
| LDA | Population size(pop_num) | 30 |
| Maximum number of iterations (max_iter) | 50 | |
| Mutation factor (F) | 0.5 | |
| Crossover probability (CR) | 0.9 |
Parameter settings for GA, PSO and LDA optimized BPNN.
Figure 8 illustrates the RMSE-based performance comparison of GA, PSO, and LDA during the optimization process. The horizontal axis represents the number of iterations (0–50), while the vertical axis denotes the RMSE values, reflecting model prediction error. As shown, the RMSE values for all three algorithms decrease progressively with the increase in iterations, indicating their effectiveness in reducing prediction error. Notably, PSO demonstrates the fastest convergence rate, reaching lower RMSE values within fewer iterations. This suggests higher search efficiency in exploring the solution space. Although PSO achieves a rapid initial drop in RMSE, the rate of decline slows in later iterations, eventually stabilizing around 5.6. In contrast, GA also shows a sharp early decrease in RMSE but with a more gradual decline, stabilizing near 4 after approximately 20 iterations. LDA, on the other hand, exhibits a slower initial reduction, followed by an accelerated decrease, ultimately converging to an RMSE close to 1. Overall, the comparison indicates that while PSO offers faster early convergence, LDA achieves superior final accuracy and convergence stability, outperforming both GA and PSO in the optimization process.
Figure 8
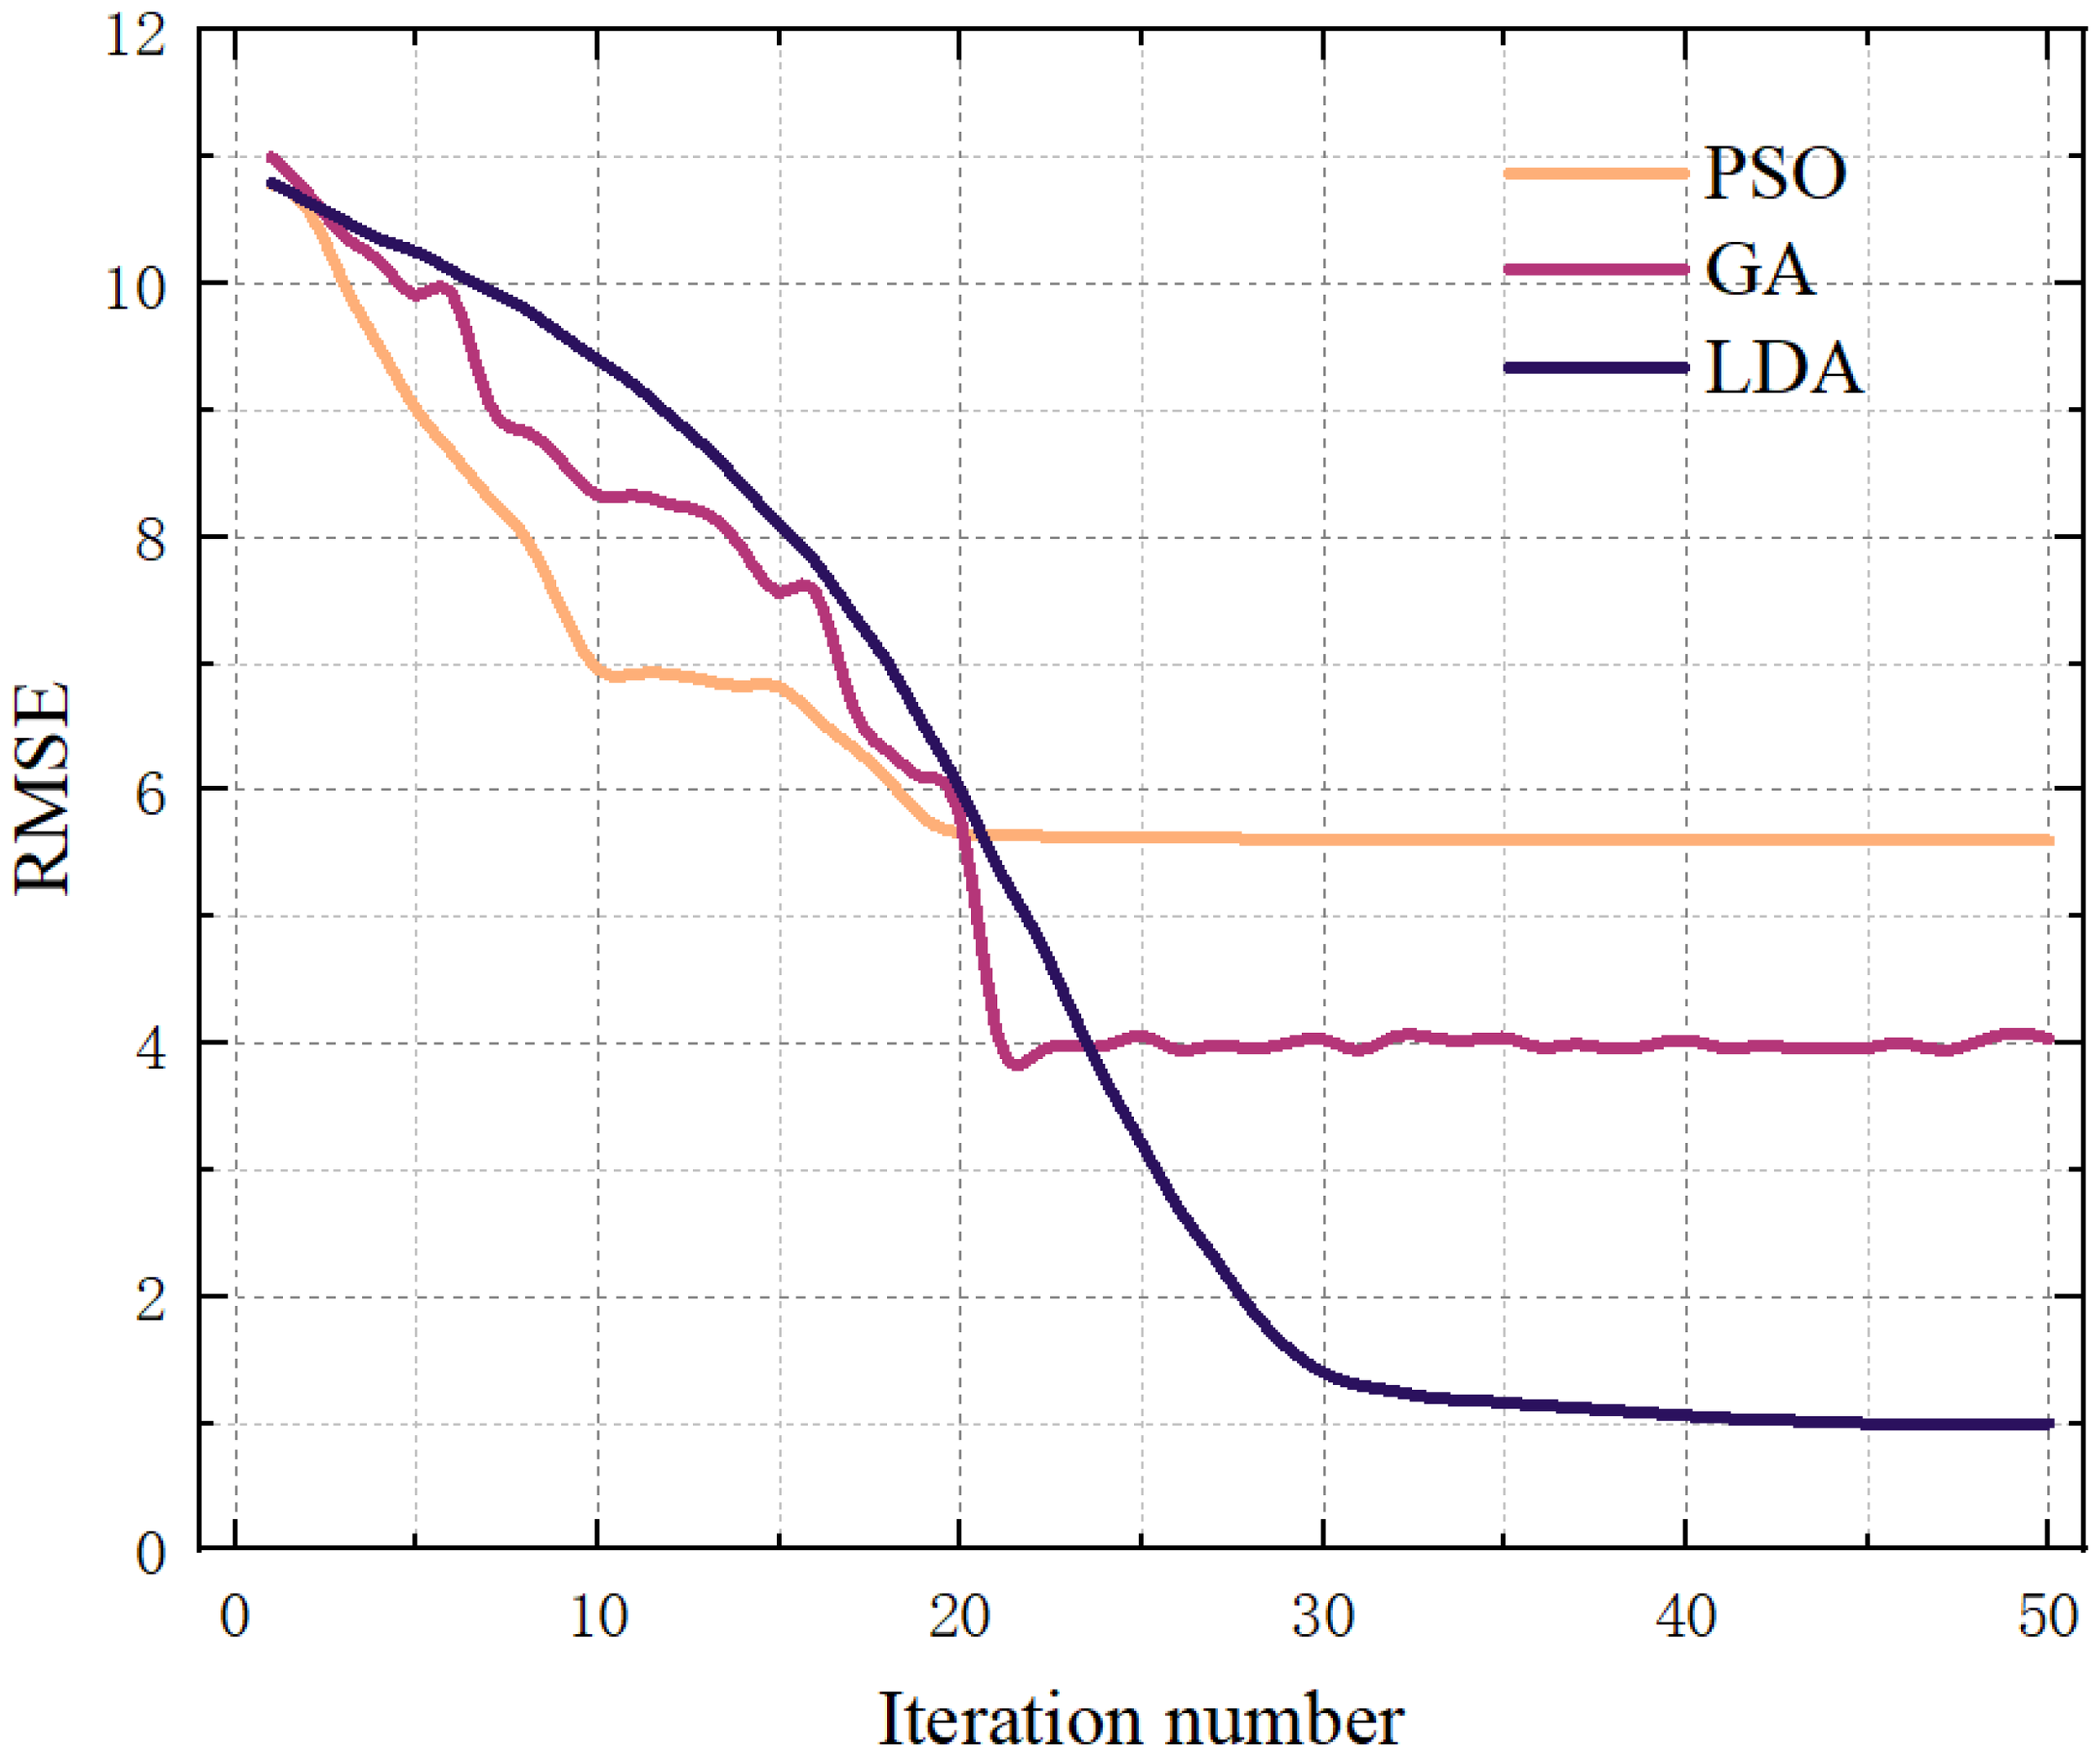
Number of RMSE iterations for GA, PSO and LDA.
3.3 Establishment of database and data processing
To investigate the strength of MCCM under various conditions, a dataset consisting of 900 samples was established. This dataset includes five variables: clay content, number of reinforcement layers, confining pressure, water content, and strain. All input and output variables were normalized to ensure effective modeling:
As shown in Equation 1, where is the original data value, is the normalized data value, min is the smallest value in the data, and max is the largest value in the data set.
The summary statistics of the variables in the dataset are presented in Table 5. The clay content ranges from 30% to 70%, the number of reinforcement layers includes three levels: 0, 1, and 2, the confining pressure varies from 50 kPa to 200 kPa, and the water content includes six levels ranging from 9% to 36%. Strain values range from 0% to 15%. Data preprocessing steps, including cleaning, normalization, and dataset splitting, were conducted to ensure data quality and suitability for machine learning modeling.
Table 5
| Argument | Type | Minimum value | Maximum value | Mean value | Standard deviation |
|---|---|---|---|---|---|
| Clay content(%) | Numerical type | 30 | 70 | 50 | 20 |
| Number of reinforcement layers | 0 | 2 | 1 | 1 | |
| Confining pressure(Kpa) | 50 | 200 | 125 | 64.55 | |
| Water content(mm) | 0 | 36 | 21 | 11.75 | |
| Strain(mm) | 1 | 15 | 8 | 4.472 |
Statistical table of factors affecting the stress of the MCCM.
3.4 Predictive performance assessment index
In the process of model construction and optimization, it is essential to select appropriate assessment metrics to evaluate the predictive performance of the model. In this study, two key assessment indicators are utilized:
1、Root Mean Square Error (RMSE): RMSE represents the standard deviation of the difference between predicted values and actual values. A smaller RMSE indicates a lower prediction error, reflecting a more accurate and reliable model as shown in Equation 2.
Where n is the number of samples, yi is the observed value, and fi is the predicted value.
2、Mean Absolute Percentage Error (MAPE): MAPE calculates the average of the absolute errors between predicted and actual values, expressed as a percentage of the actual values. A smaller MAPE indicates a lower prediction error, demonstrating better model accuracy and performance as shown in Equation 3.
Where n is the number of samples, yi is the observed value, and is the predicted value.
4 Results and analysis
4.1 Establishment of data sets
In this study, the dataset creation serves as the foundation for training the machine learning algorithms. A dataset with 5 input parameters and 1 output parameter was developed to train and validate the performance of BPNN, GA-BPNN, PSO-BPNN, and LDA-BPNN, as illustrated in Figure 9.
Figure 9
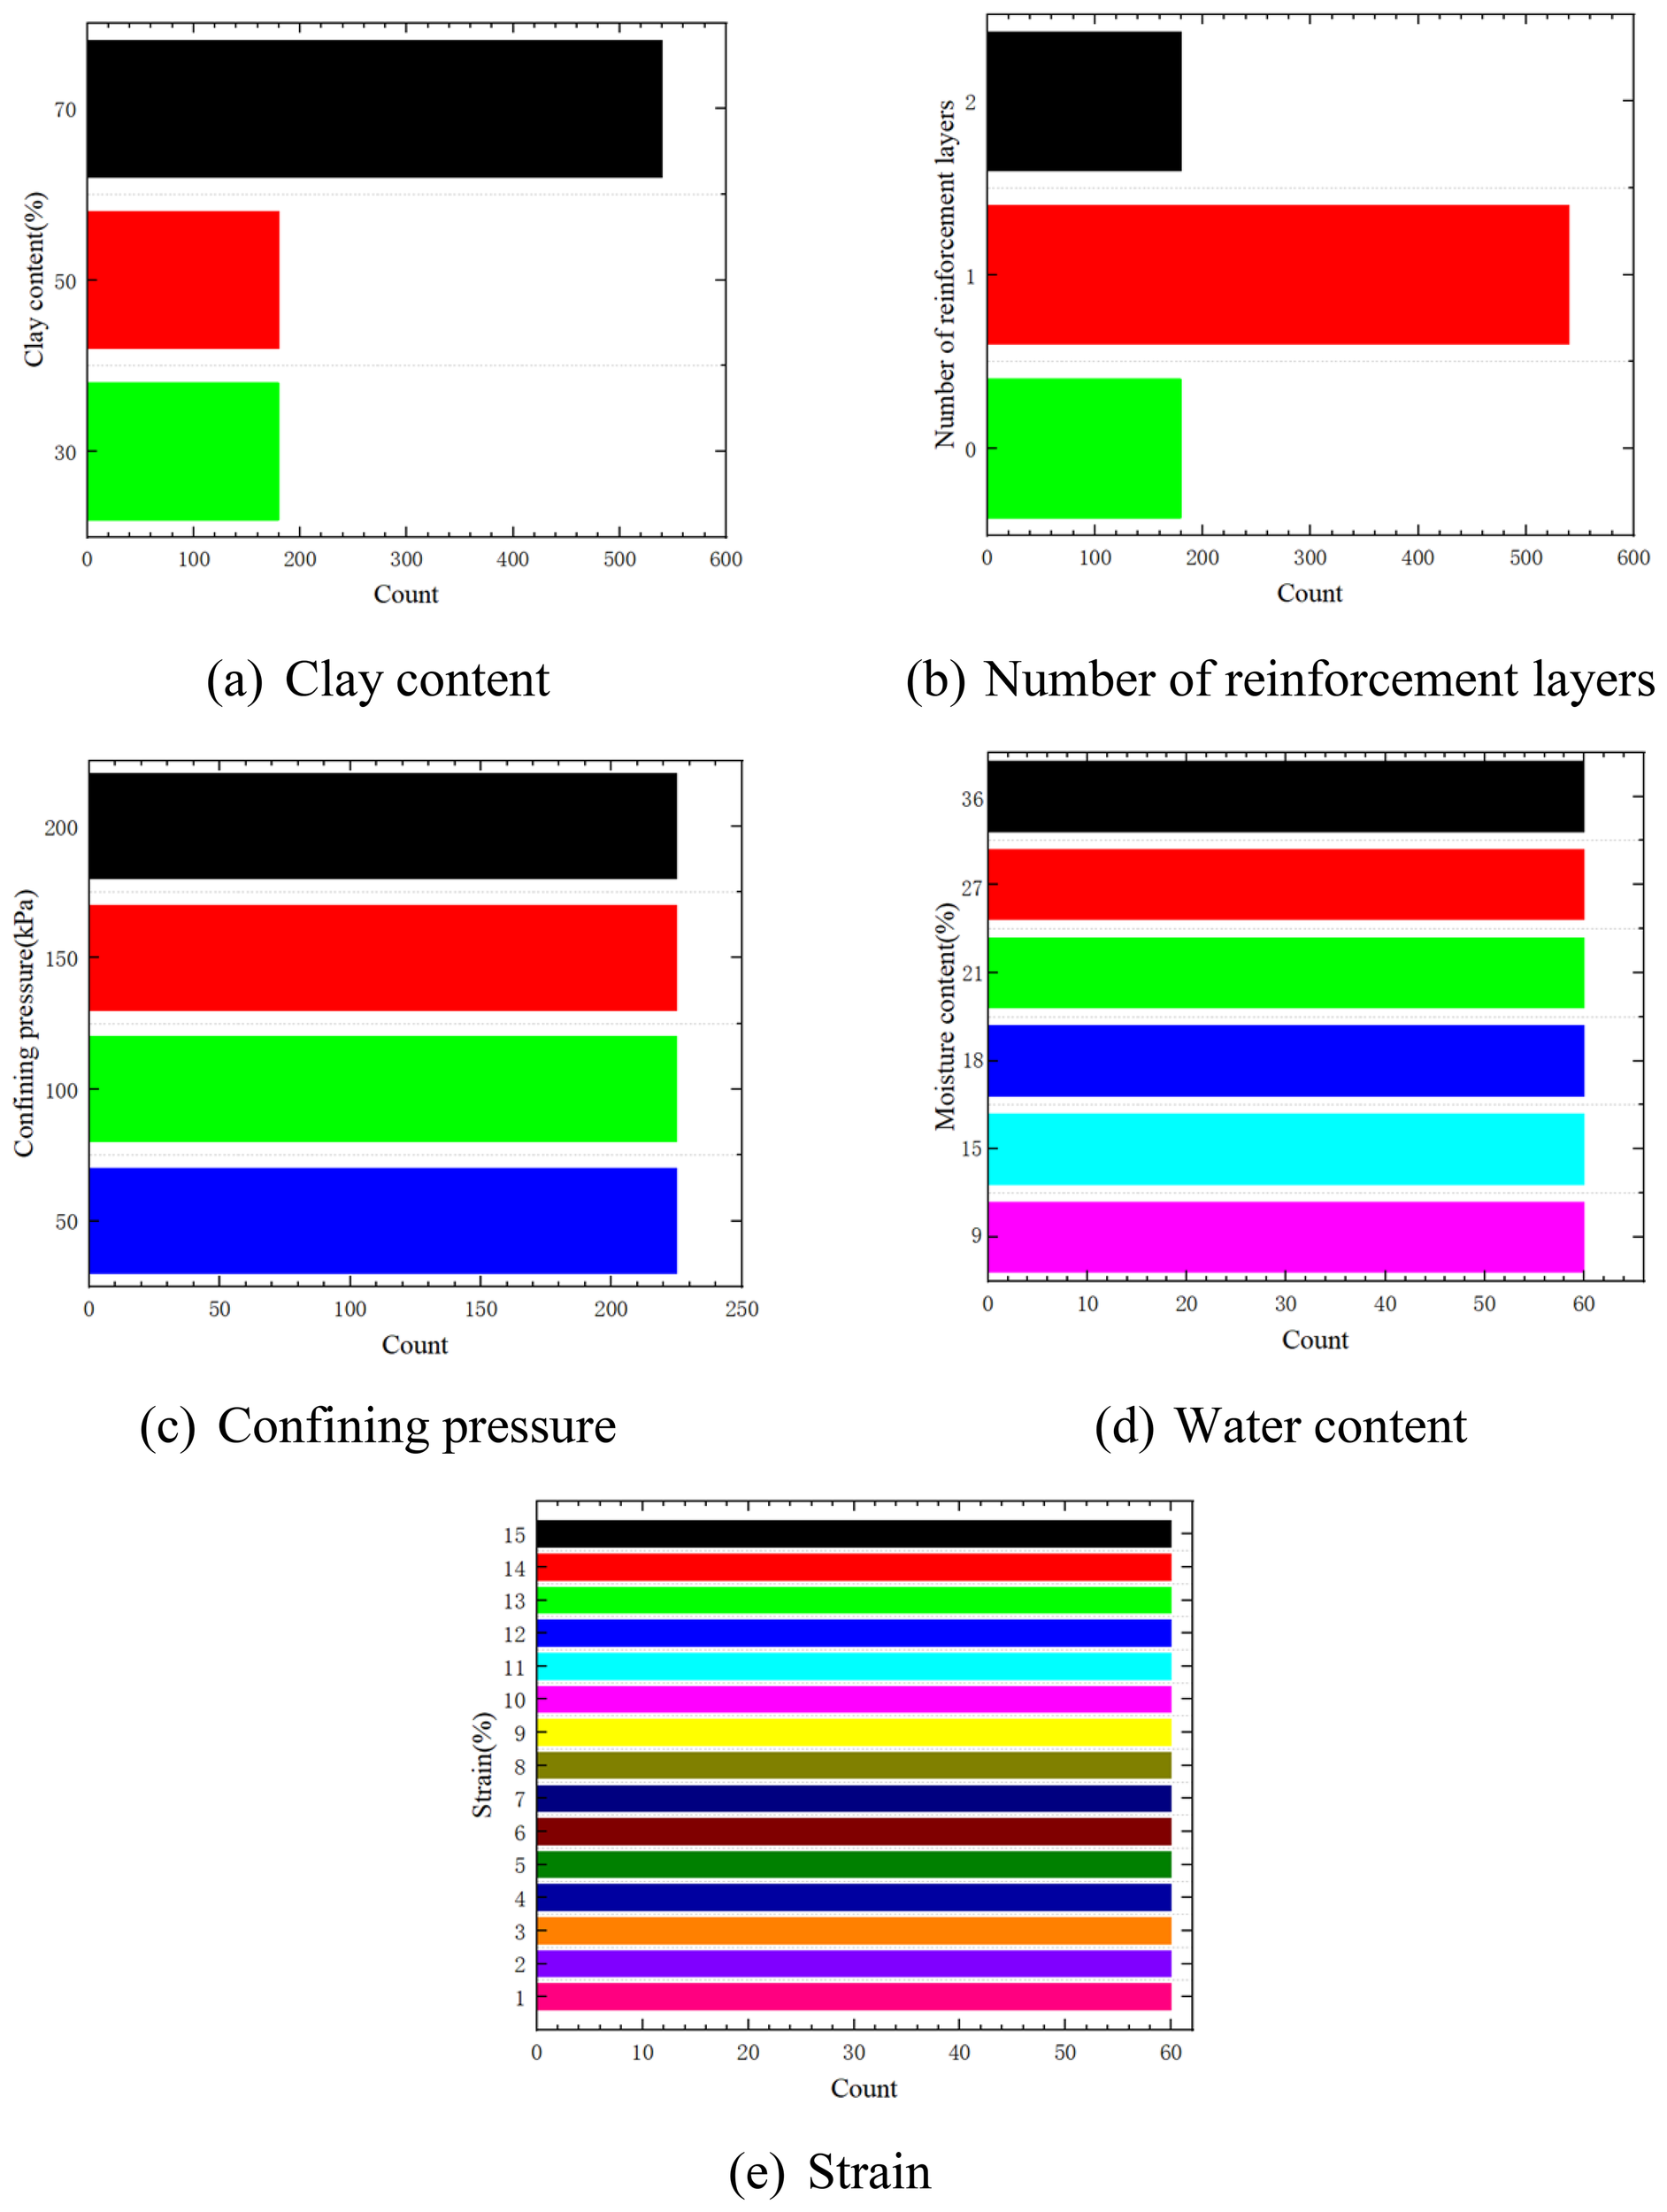
Distribution for data in the constructed database. (a) Clay content. (b) Number of reinforcement layers. (c) Confining pressure. (d) Water content. (e) Strain.
A database with 900 datasets was created, containing four key input parameters: clay content, number of reinforcement layers, confining pressure, water content, and strain. To assess the model’s generalization capability, the dataset was split into two subsets: the training set and the test set. The training set was used to train the model, while the test set provided the basis for final performance evaluation. The dataset was divided into 80% for training and 20% for testing, ensuring a more accurate assessment of the model’s generalization ability and practical performance. The correlation analysis of different inputs is shown in Figure 10.
Figure 10
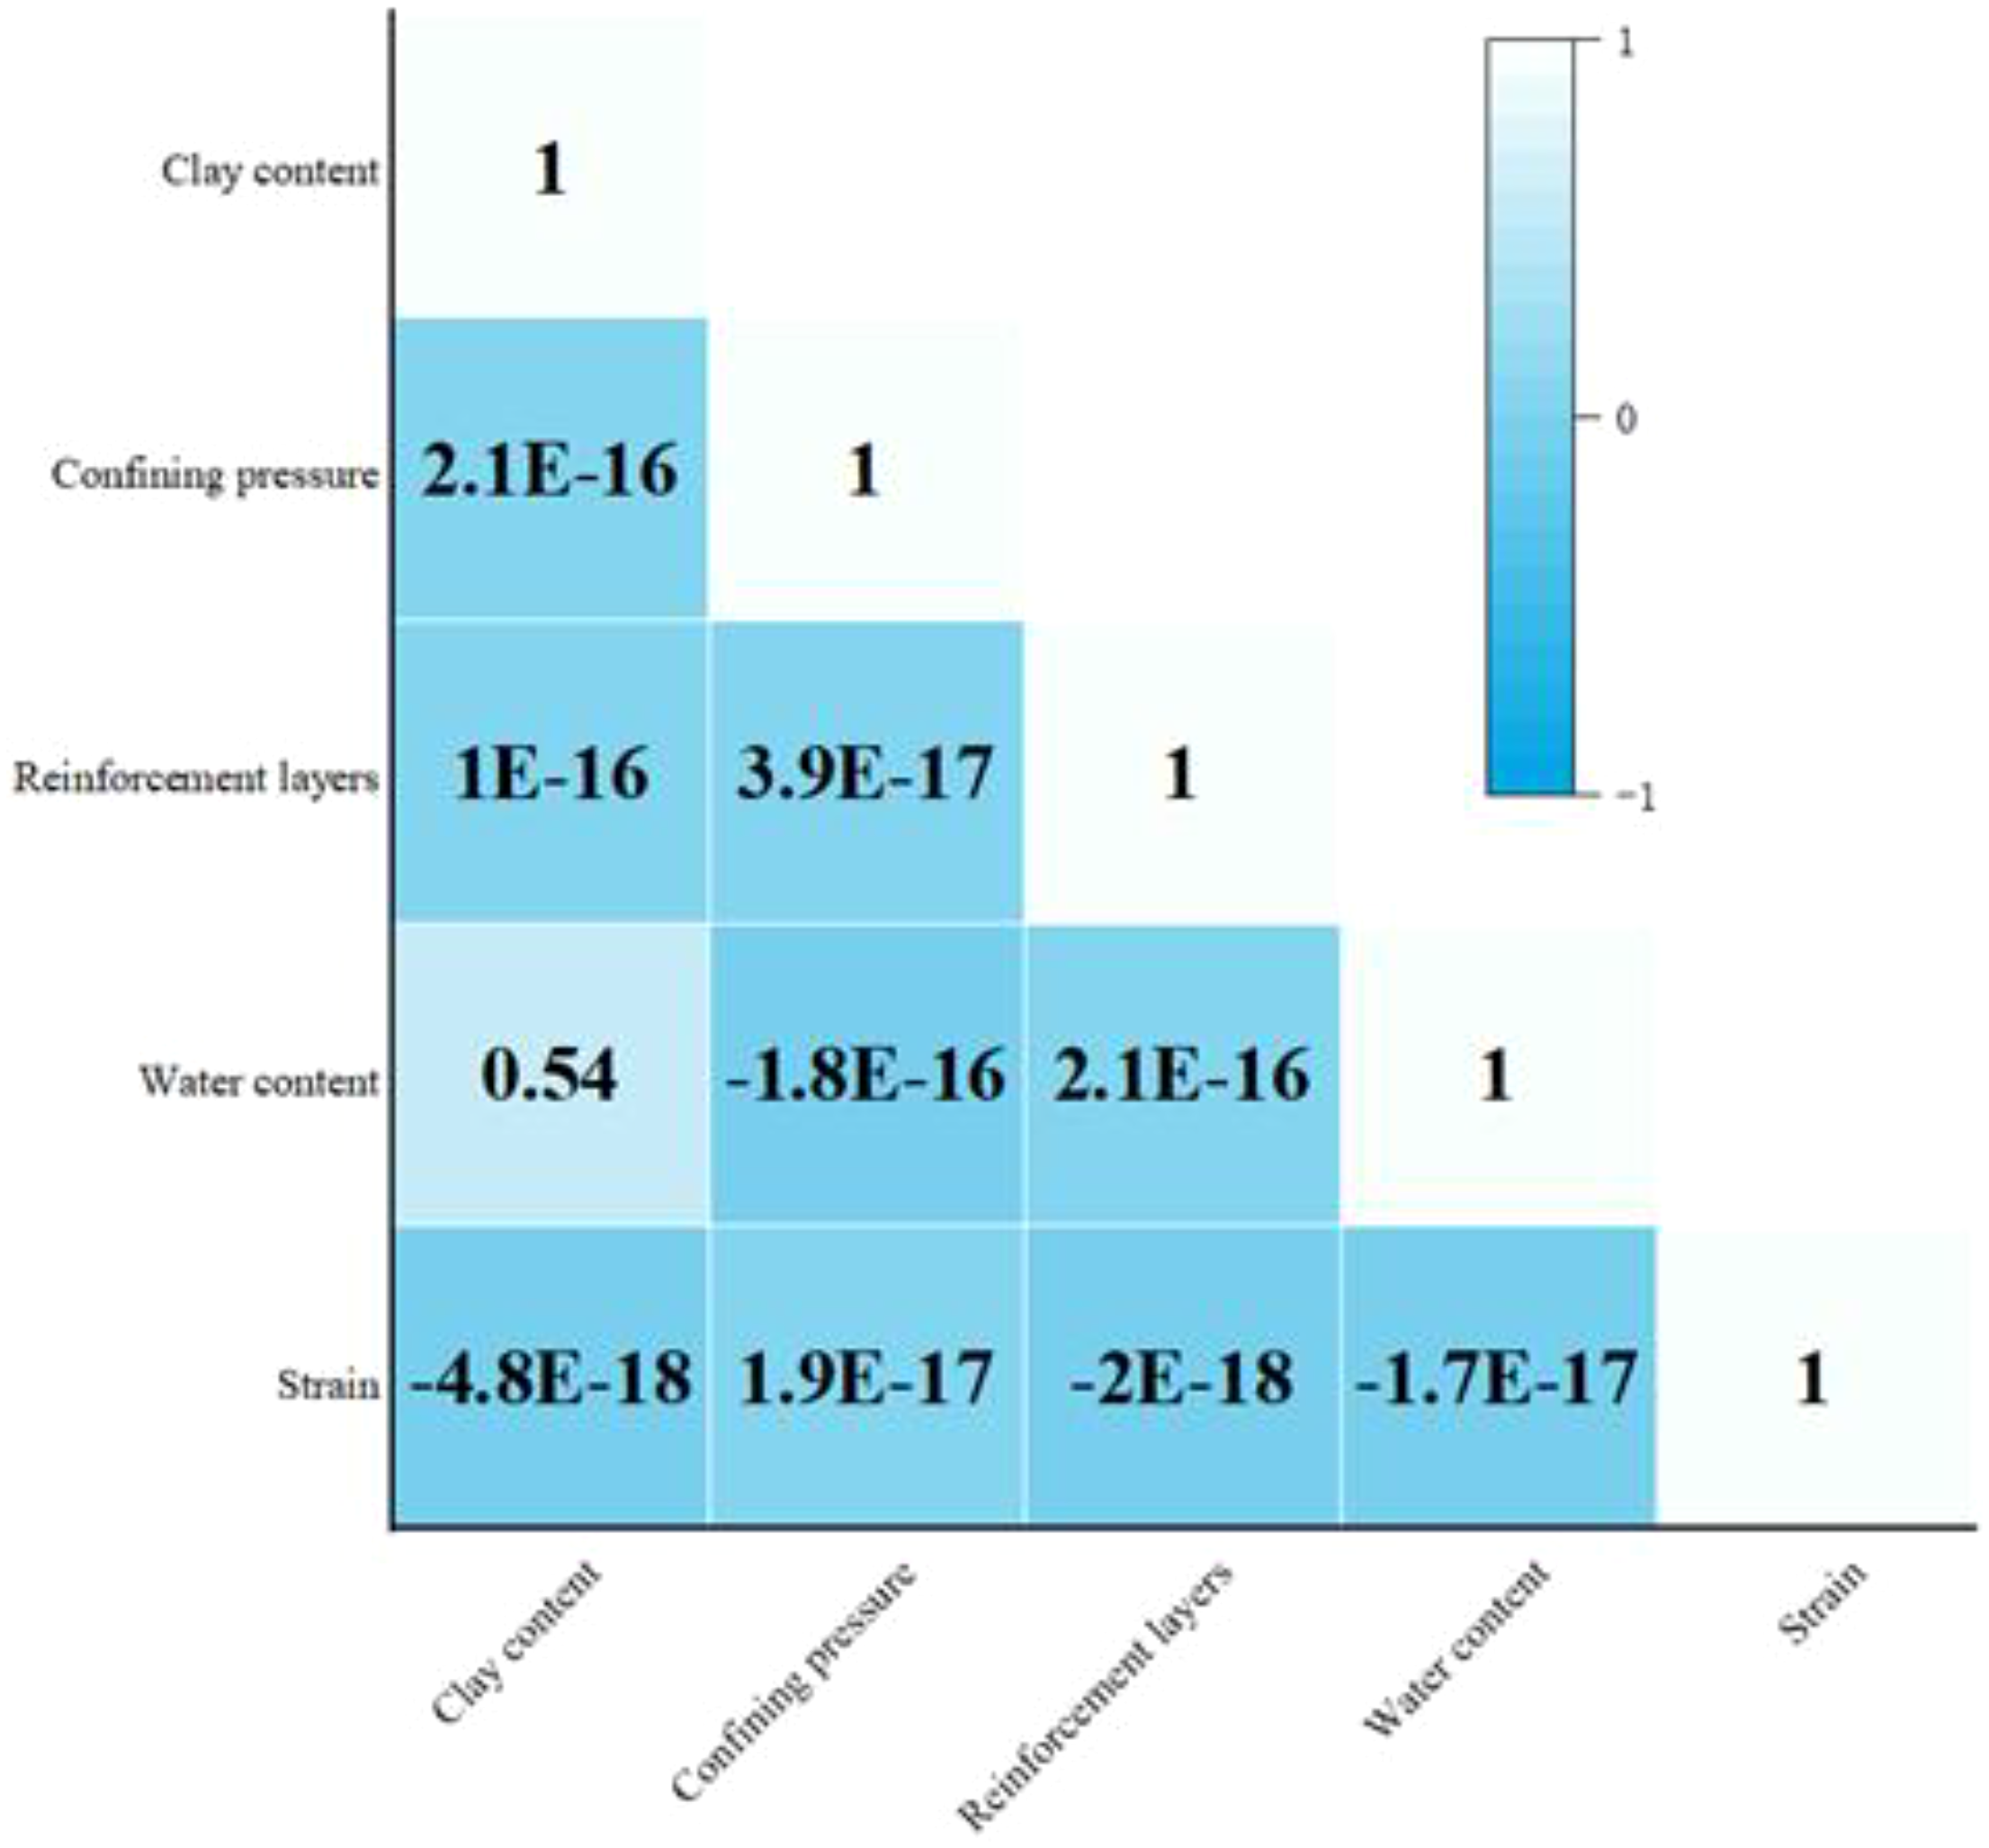
Parametric analysis diagram.
4.2 Machine learning predicting performance
The prediction results obtained from the machine learning model, based on 900 training and testing samples, are shown in Figures 11 , 12.
Figure 11
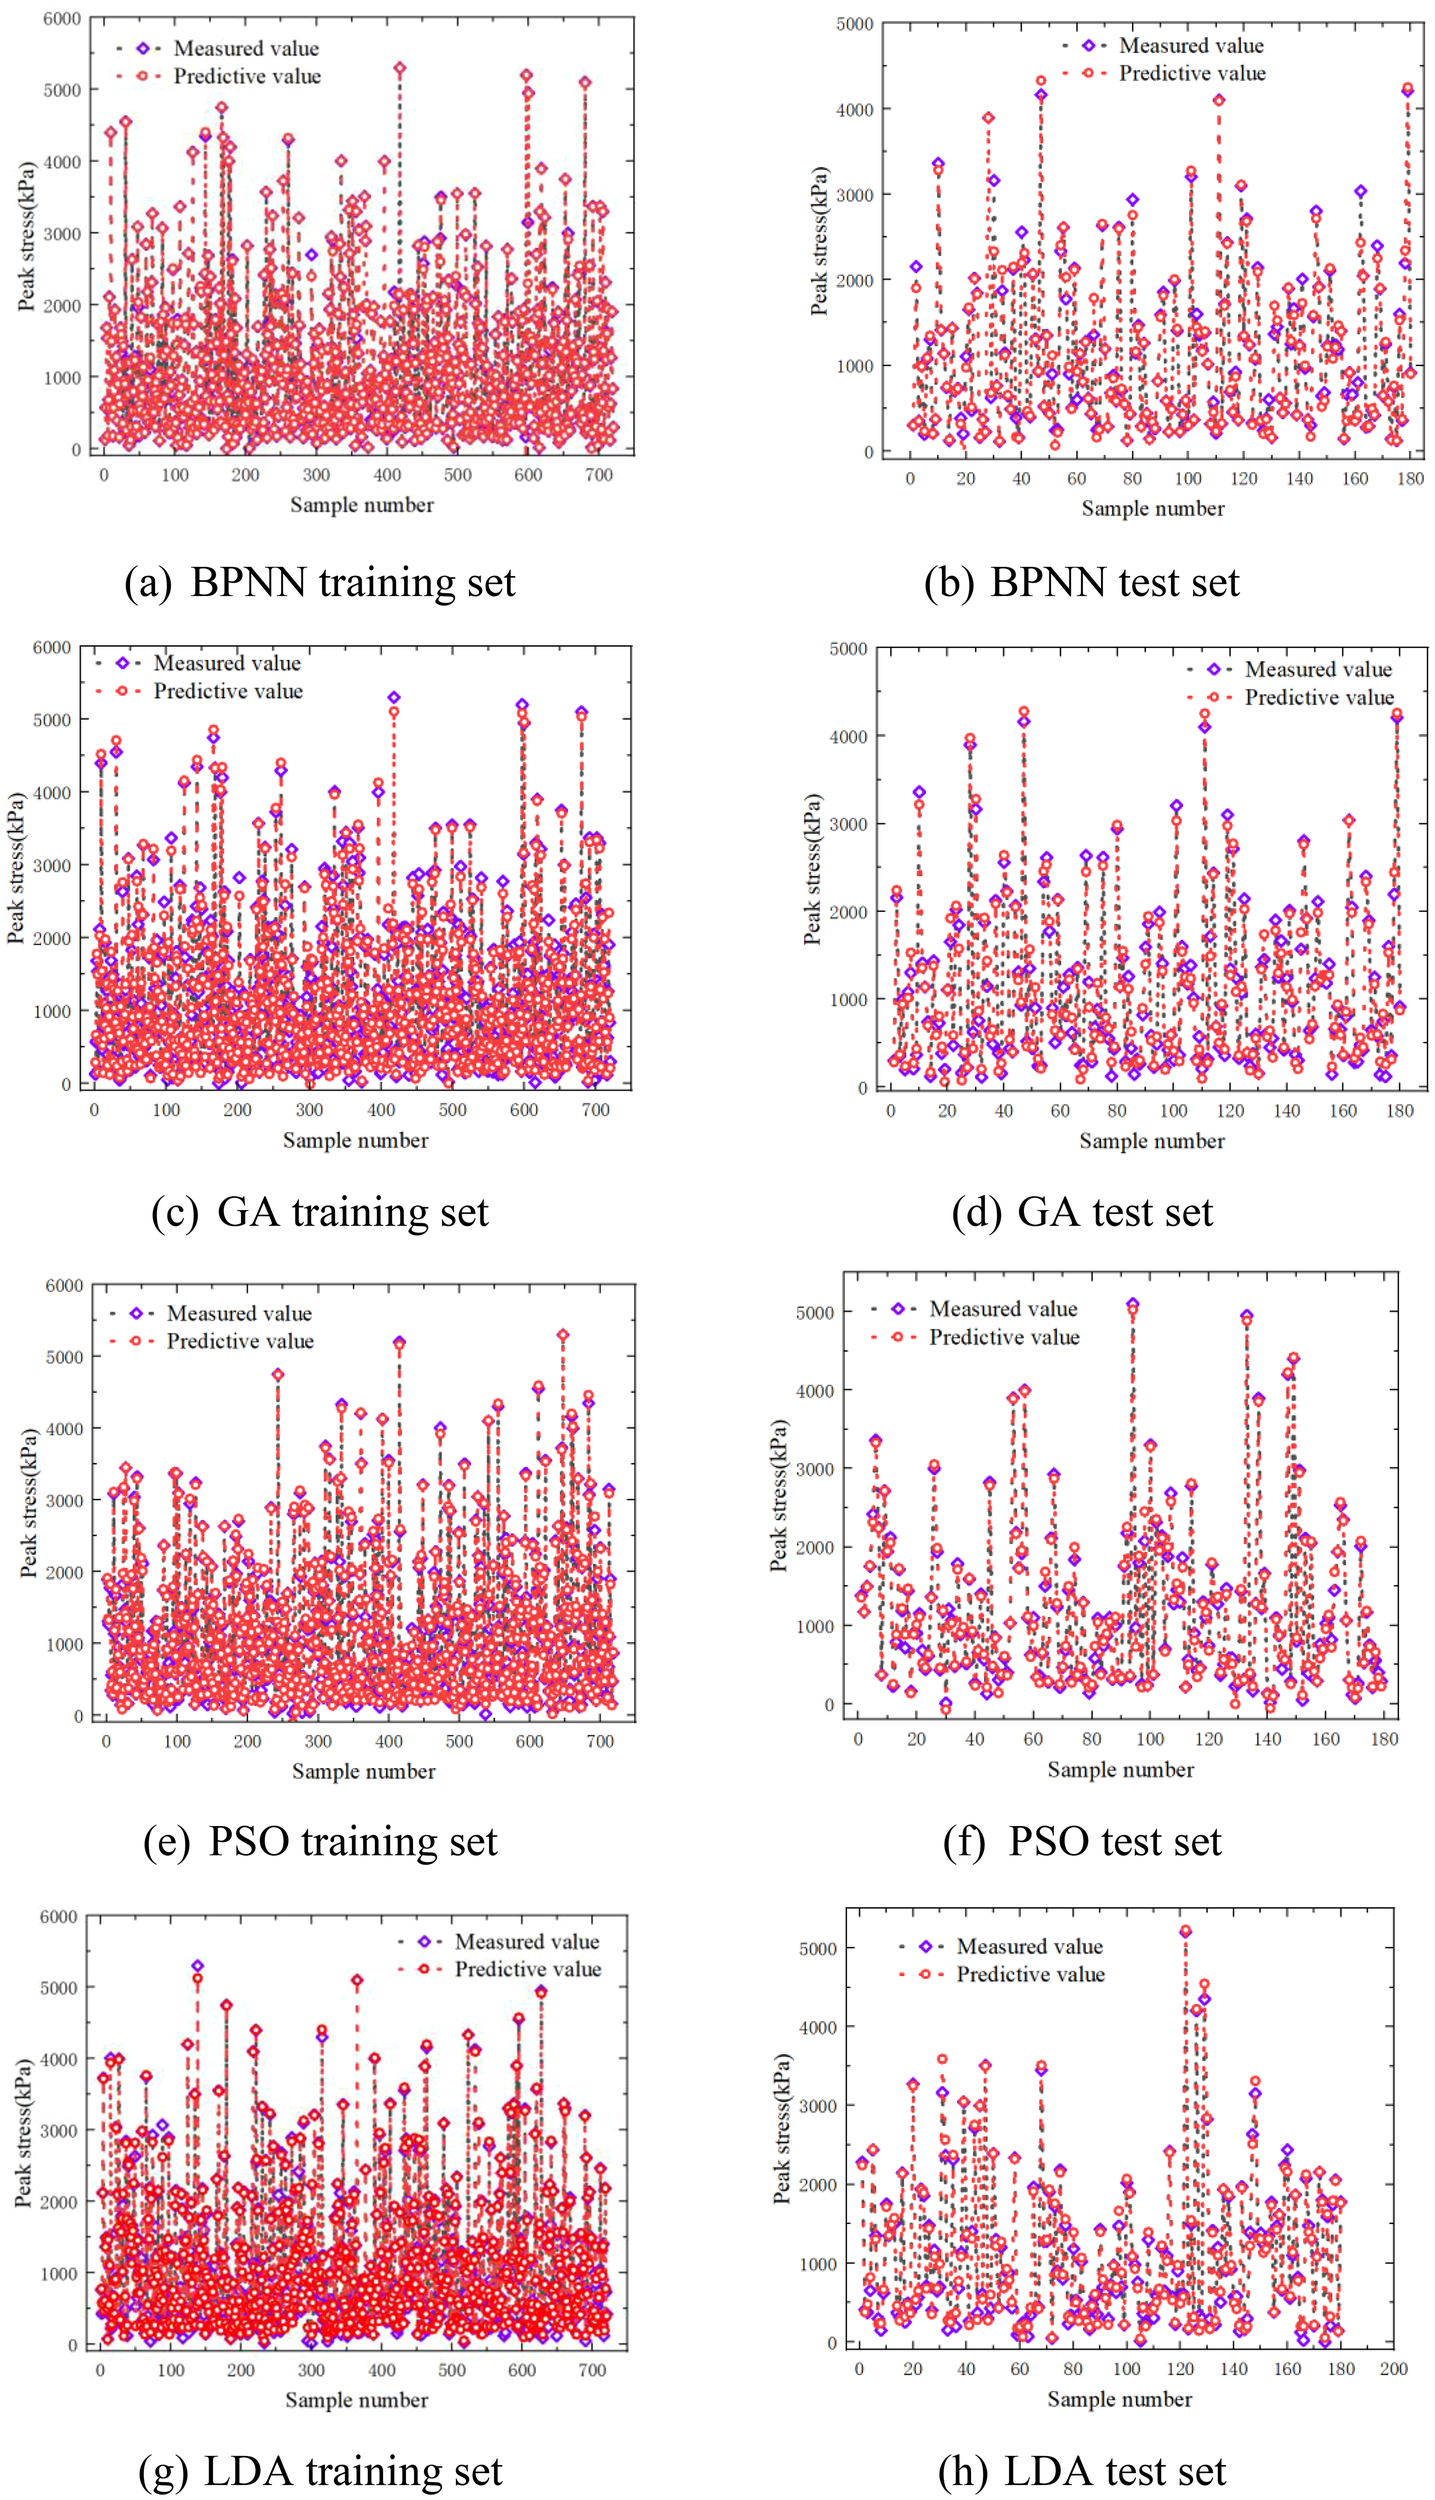
Prediction results of training set and test set on test data. (a) BPNN training set. (b) BPNN test set. (c) GA training set. (d) GA test set. (e) PSO training set. (f) PSO test set. (g) LDA training set. (h) LDA test set.
Figure 12
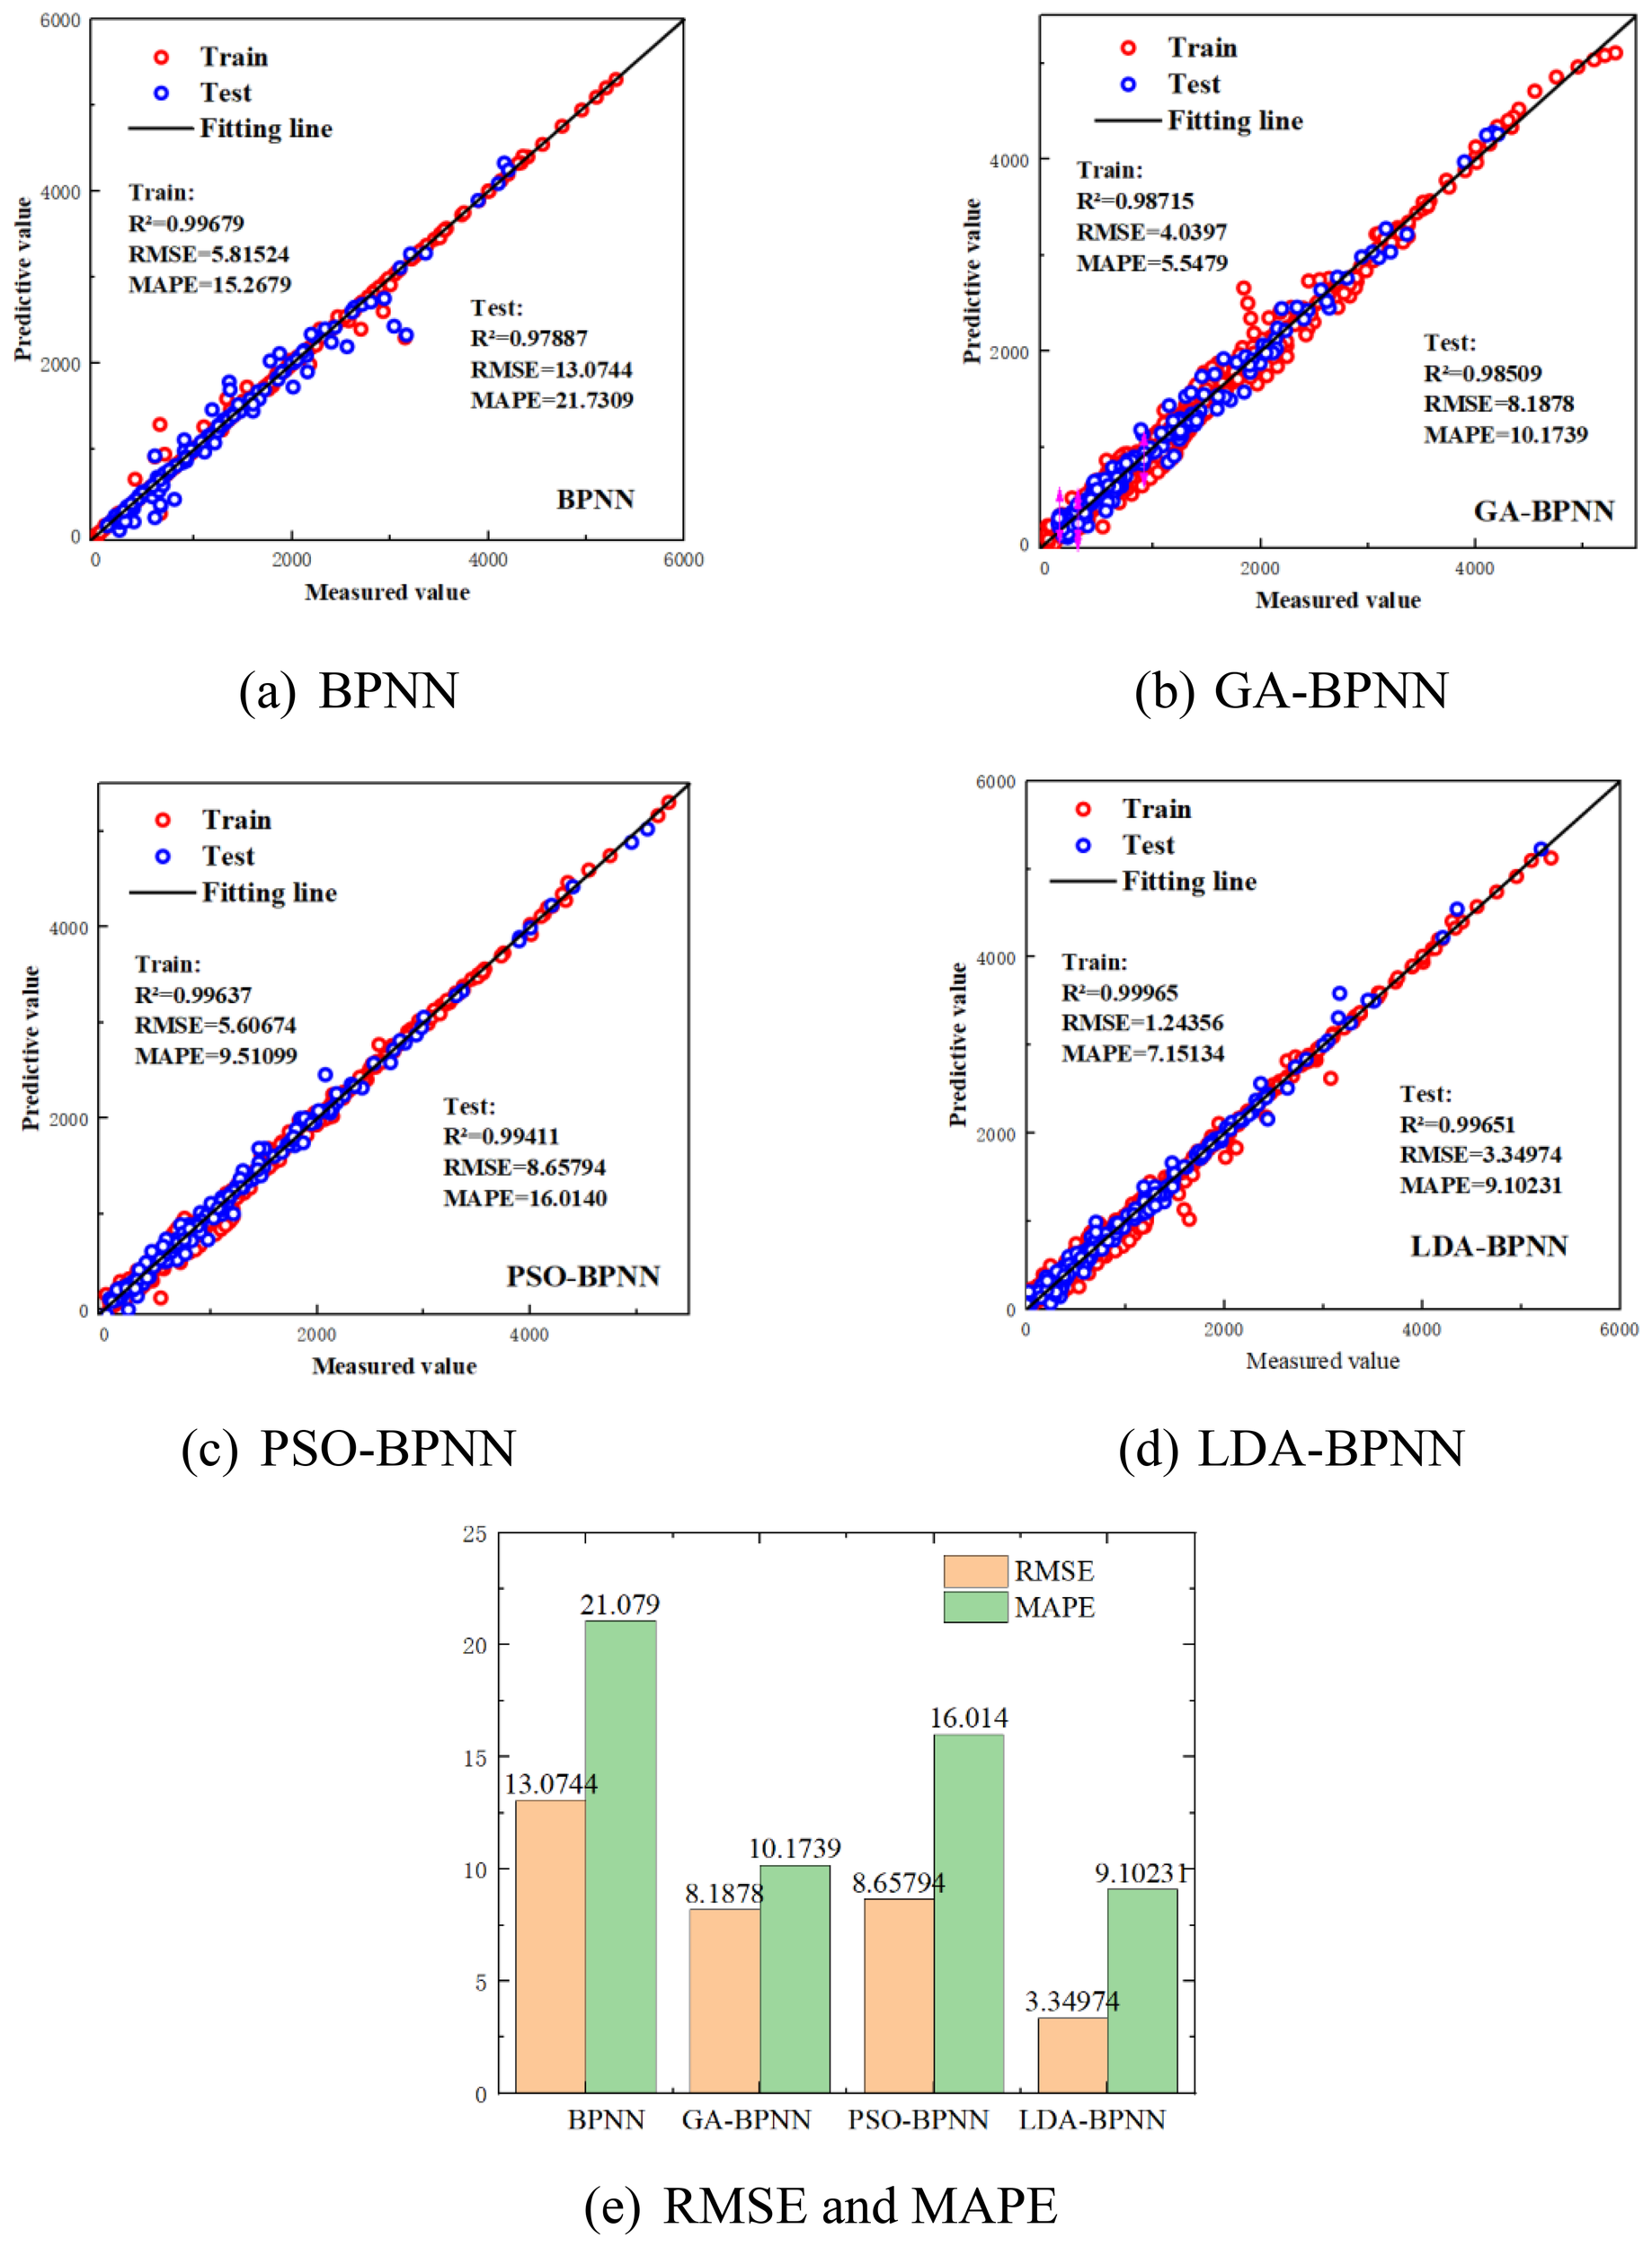
Comparison of R, RMSE, and MAPE across different models. (a) BPNN. (b) GA-BPNN. (c) PSO-BPNN. (d) LDA-BPNN. (e) RMSE and MAPE.
Overall, the predicted values (red hollow circles) produced by each model generally align with the actual values (purple hollow diamonds), indicating that all models are capable of effectively fitting the training data and capturing the nonlinear relationships between the input features and the target output. However, noticeable differences are observed in prediction accuracy across the models. The LDA model (Figure 11h) exhibits the smallest deviation from the actual values, reflecting its superior fitting performance. In contrast, the BPNN model (Figure 11b) shows relatively large prediction errors, particularly for high-peak samples, suggesting that its shallow architecture is insufficient to model the complex patterns inherent in the data. Both GA-BPNN (Figure 11d) and PSO-BPNN (Figure 11f) enhance the baseline BPNN through the integration of optimization algorithms, resulting in predictions that better match the actual values, though slight overfitting is still evident in certain samples. Overall, the LDA model outperforms the other models on both the training and testing sets, demonstrating more robust learning capability and better generalization performance.
As shown in Figure 12, when evaluated using the testing dataset, the LDA model consistently outperforms the other three machine learning models. Specifically, the LDA model achieves the highest prediction accuracy, with the lowest RMSE values of 1.24356 and 3.34974 for the testing and training sets, respectively. It also records the lowest MAPE values—7.15134% for the testing set and 9.10231% for the training set. In terms of correlation, the LDA model attains an R value of 0.99651 on the testing set, indicating an extremely strong linear relationship between the predicted and measured values.
By contrast, although the GA-BPNN model benefits from genetic algorithm optimization and shows improved performance, it still falls short of the LDA model. GA-BPNN yields RMSE values of 4.0397 and 8.1878, and MAPE values of 5.5479% and 10.1739% for the testing and training sets, respectively. The R value of 0.98509 suggests limited ability to capture the underlying data patterns.
The PSO-BPNN model performs relatively poorly, with larger prediction errors and more scattered residuals, indicating that particle swarm optimization fails to significantly enhance the predictive capability of BPNN. For PSO-BPNN, the RMSE values are 5.60674 and 8.65794, and MAPE values are 9.51099% and 16.014% for the testing and training sets, respectively, with an R value of 0.99411.
The original BPNN model exhibits the lowest prediction accuracy among all models. It produces RMSE values of 5.81524 and 13.0744, and MAPE values of 15.2679% and 21.7309% for the testing and training sets, respectively. The R value of 0.97887, along with a significant deviation of data points from the fitted line, suggests that the simple architecture of BPNN lacks the capacity to represent complex data features effectively.
In summary, the LDA-BPNN model demonstrates superior performance over GA-BPNN, PSO-BPNN, and BPNN in both the training and testing phases. It offers higher predictive accuracy and robustness, particularly on unseen test data. Notably, even under identical optimization strategies, the predictive capability of the LDA model is markedly better than that of the other models.
4.3 Sensitivity analysis
Understanding machine learning models is crucial for ensuring transparency and encouraging broader adoption (Yang et al., 2025). Feature importance analysis plays a key role in uncovering the internal logic of these models, offering insights into their decision-making processes. Among various interpretability approaches, the SHAP (Shapley Additive Explanations) method has gained significant traction (Lundberg and Lee, 2017). Based on game theory, SHAP evaluates all possible feature combinations to assess their interactions and calculates a SHAP value for each prediction. This value reflects the individual contribution of each feature to the model’s output, with positive values indicating an increase and negative values a decrease in the predicted result.
Figure 13 presents the five most influential features affecting the output of the LDA model, along with a brief analysis of their respective impacts. The pie chart illustrates the mean SHAP values for each feature, where a larger SHAP value denotes a stronger contribution to the model’s prediction. On the left, the beeswarm plot offers a more detailed visualization of feature effects. In this plot, the horizontal axis corresponds to the SHAP value, while the vertical axis represents the feature value. A high SHAP value combined with a high feature value suggests a positive correlation—larger feature values lead to higher predicted outputs. Conversely, negative SHAP values indicate a negative influence on the model output. As shown, water content exerts the most significant impact on strain prediction, with a relative importance of 35.9%, followed by clay content at 29.5%. In contrast, strain itself contributes the least, accounting for only 7.8%. The SHAP-based analysis identifies water content as the dominant factor influencing the model’s predictive performance. This can be attributed to its critical role in governing interparticle contact behavior and pore water pressure distribution, both of which are key determinants of soil strength and deformation. Clay content, ranking second in importance, significantly affects soil fabric and moisture retention. A higher clay fraction generally implies stronger cohesion and more pronounced plasticity, which are essential to stress accumulation and dissipation during the shearing process of MCCM.
Figure 13
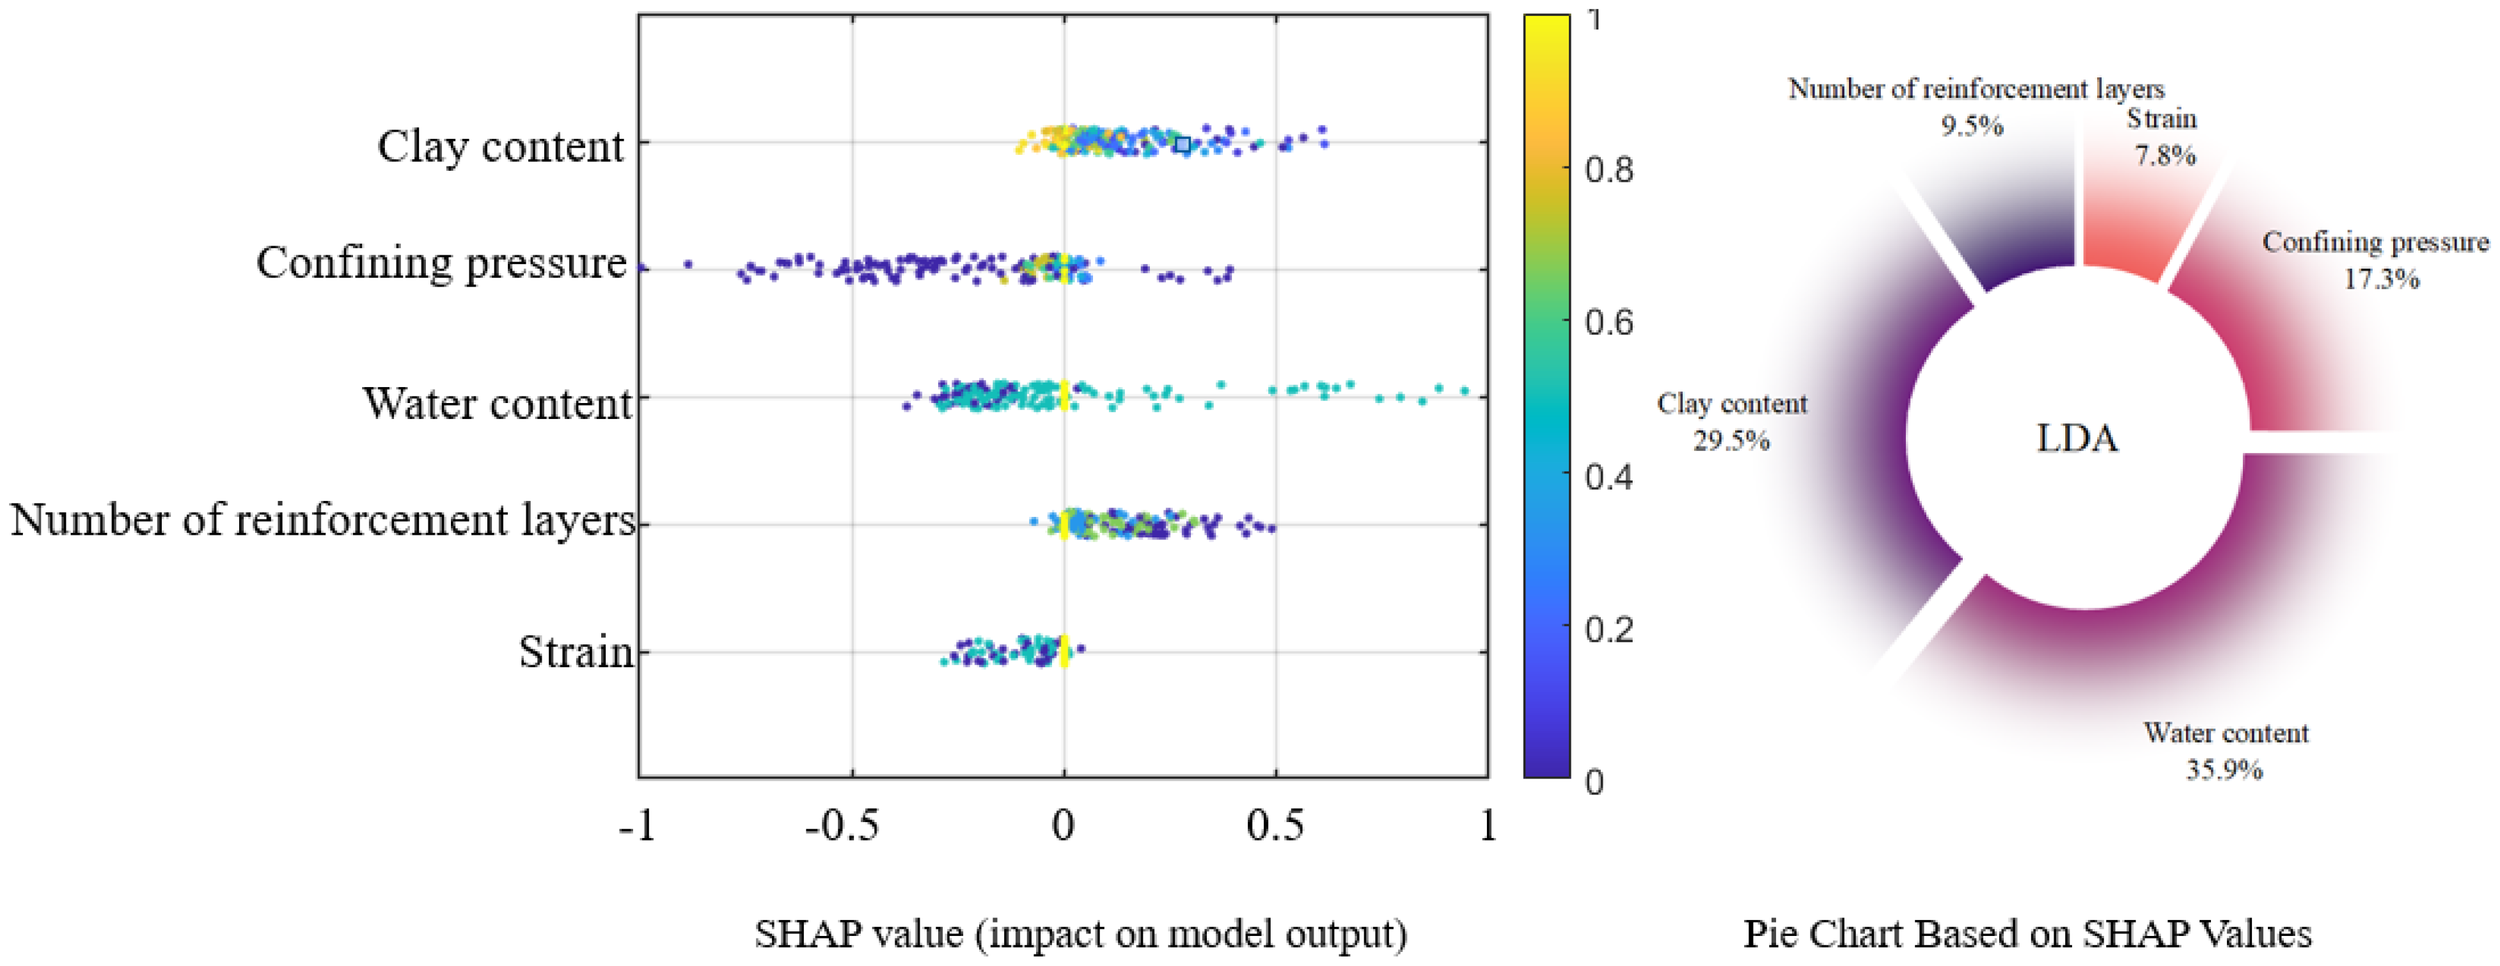
Feature importance analysis plot.
These findings highlight the necessity of implementing targeted optimization strategies that consider the varying influence of different parameters to ensure the stability and reliability of marine infrastructure constructed with MCCM as the principal material.
5 Empirical formulas
The previous modeling results indicate that the established LDA-BPNN model can accurately predict the strength of MCCM. However, due to the complexity of machine learning models, practitioners without a background in artificial intelligence may face challenges in practical applications. To address this issue, this section proposes an analytical empirical formula designed to simulate the predictive behavior of the LDA-BPNN model, thereby enabling a convenient and efficient estimation of MCCM strength. The BPNN model is a typical feedforward neural network structure with one hidden layer. Its output can be expressed by the following formula based on the connection weights and node biases obtained during training (Goh et al., 2005):
The normalized predicted output Yn, ranging from -1 to 1, is calculated based on the normalized input variables Xi, which includes clay content (%), number of reinforcement layers, confining pressure (kPa), water content (%), and strain (%), through the connection weights Wik between the ith input node and the kth hidden node, hidden layer biases bk, weights Wk connecting the hidden nodes to the output node, output layer bias b0, and the hyperbolic tangent sigmoid transfer function , where h and m denote the numbers of hidden nodes and input variables, respectively.
The normalized output Yn can be converted into the actual predicted strength τ using the following denormalization formula:
Here, τmax and τmin represent the maximum and minimum MCCM strength values in the dataset, respectively.
To facilitate engineering applications, the neural network structure described above can be further expressed in the following simplified form:
All connection weights in the model (Wik, Wk) and bias parameters (bk, b0) are automatically optimized during training using the Differential Evolution algorithm. The complete set of parameters, which can be directly applied in engineering calculations, is provided in Table 6.
Table 6
| Hidden layer node number | Weight | Bias | ||||||
|---|---|---|---|---|---|---|---|---|
| Input parameter | Output parameter | Hidden layer | Output layer | |||||
| C | L | P | W | S | H | |||
| 1 | 0.42 | -0.51 | 1.2 | 0.33 | -0.27 | 0.21 | 0.85 | 0.14 |
| 2 | -0.78 | 0.96 | -1.34 | 2.15 | 0.1 | -0.38 | -0.66 | |
| 3 | 1.53 | -1.12 | 2.72 | -0.85 | 0.57 | 0.45 | 1.1 | |
| 4 | 0.63 | 1.34 | -0.69 | 1.88 | -0.93 | 0.09 | -0.74 | |
| 5 | -1.21 | 0.45 | 0.92 | -1.67 | 1.23 | -0.11 | 0.39 | |
Connected weights and biases for the constructed LDA-BPNN algorithm.
The variables C, L, P, W, and S represent the input parameters: Clay content, Layer number, Confining pressure, Water content, and Strain, respectively, while H denotes the output parameter, which is the strength of the MCCM, as listed in Table 6.
As shown in Equations 4-7, this analytical empirical model offers strong interpretability and enables rapid prediction of MCCM strength without relying on machine learning platforms, making it well-suited for practical engineering scenarios where model transparency and computational efficiency are critical.
6 Experimental verifications
To assess the applicability of both the machine learning model and the analytical formula, the proposed empirical model was used to predict the strength of MCCM under various conditions. A total of 30 representative test cases were selected, as listed in Table 7. Based on the specific experimental setups, Equation 4 was used to estimate the strength of MCCM under different conditions. The predicted values were then compared with experimental results from previous studies, as illustrated in Figure 14.
Table 7
| Clay content (%) | Number of reinforcement layers | Confining pressure (Kpa) | Water content (%) | Strain (%) |
|---|---|---|---|---|
| 30 | 0 | 50 | 0 | 5 |
| 1 | 100 | 0 | 10 | |
| 2 | 150 | 0 | 15 | |
| 30 | 0 | 100 | 0 | 5 |
| 1 | 150 | 0 | 10 | |
| 2 | 200 | 0 | 15 | |
| 50 | 0 | 50 | 0 | 5 |
| 1 | 100 | 0 | 10 | |
| 2 | 150 | 0 | 15 | |
| 50 | 0 | 100 | 0 | 5 |
| 1 | 150 | 0 | 10 | |
| 2 | 200 | 0 | 15 | |
| 70 | 0 | 50 | 0 | 5 |
| 1 | 100 | 0 | 10 | |
| 2 | 150 | 0 | 15 | |
| 70 | 0 | 100 | 0 | 5 |
| 1 | 150 | 0 | 10 | |
| 2 | 200 | 0 | 15 | |
| 70 | 1 | 50 | 9 | 5 |
| 1 | 100 | 15 | 10 | |
| 1 | 150 | 18 | 15 | |
| 70 | 1 | 100 | 21 | 5 |
| 1 | 150 | 27 | 10 | |
| 1 | 200 | 36 | 15 | |
| 70 | 1 | 50 | 9 | 3 |
| 1 | 100 | 15 | 7 | |
| 1 | 150 | 18 | 11 | |
| 70 | 1 | 100 | 21 | 3 |
| 1 | 150 | 27 | 7 | |
| 1 | 200 | 36 | 11 |
30 sets of data selected for the experiment.
Figure 14
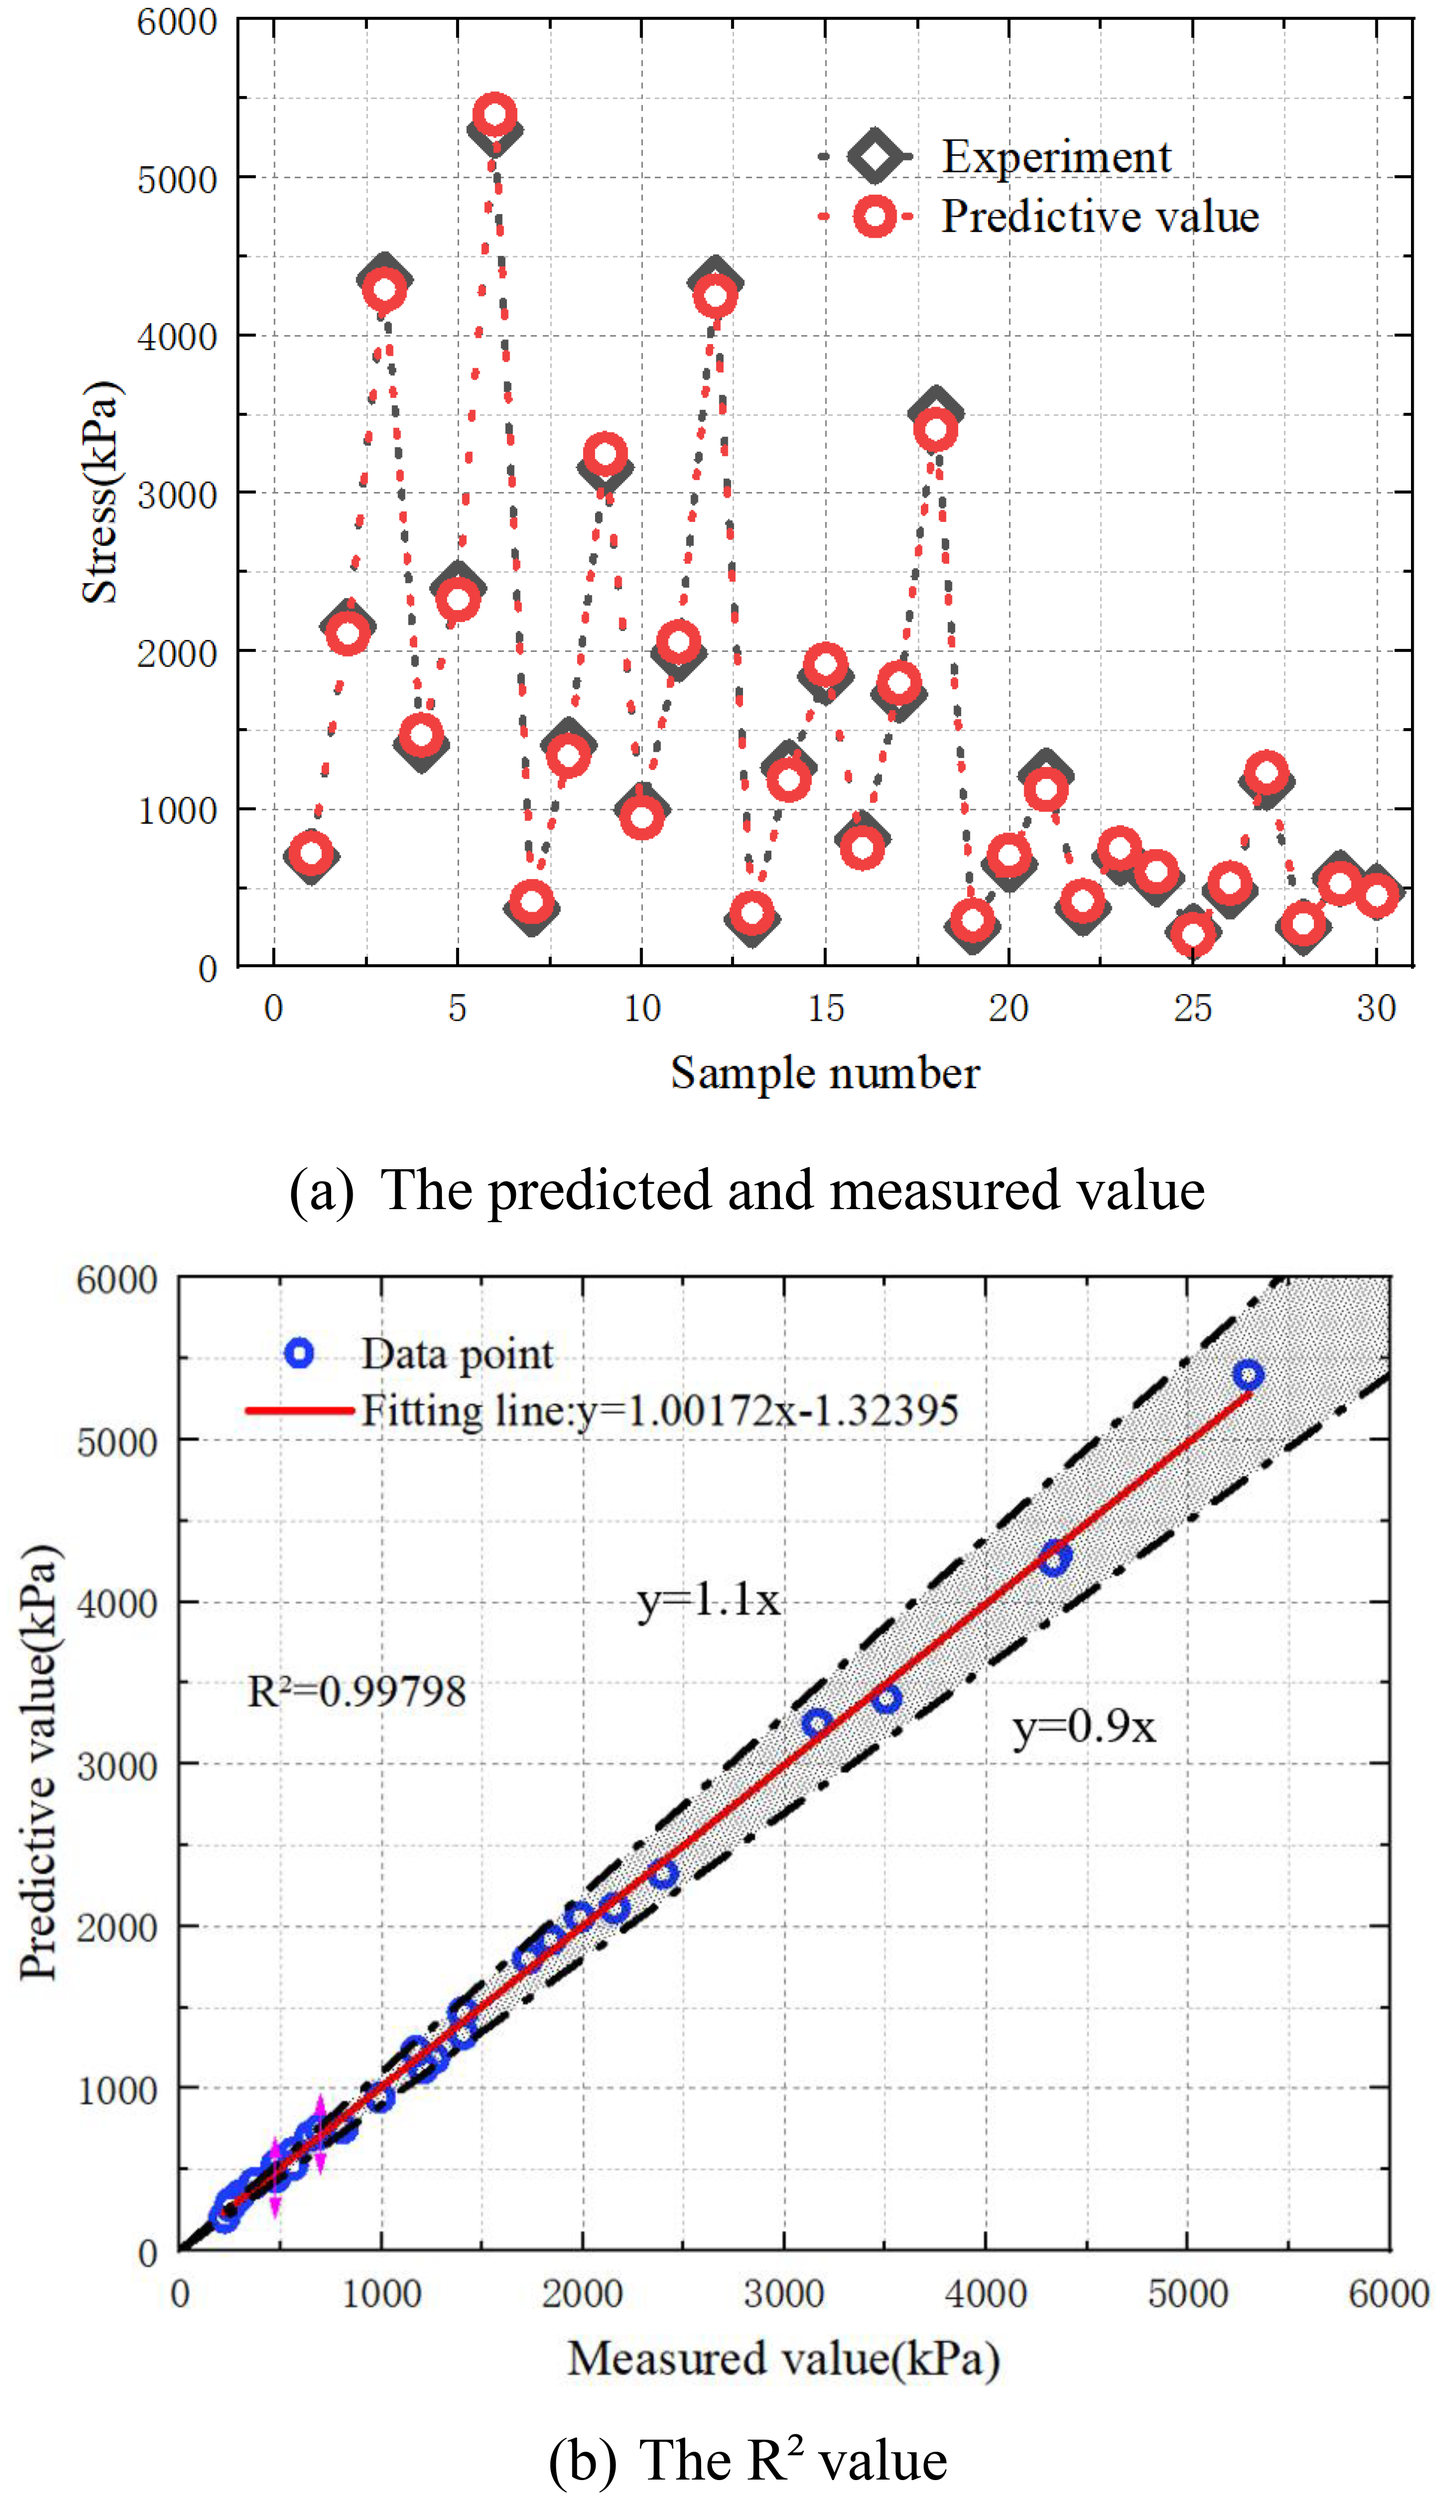
Performance evaluation of MCCM strength prediction based on empirical equations. (a) The predicted and measured value. (b) The R2 value.
As shown in Figure 14, the empirical formula demonstrates strong predictive performance for estimating the strength of MCCM under various conditions. Overall, the model achieved an RMSE of 0.56, a MAPE of 2.65%, and a coefficient of determination (R²) of 0.99798. These results indicate that the developed empirical formula offers high accuracy and reliability in predicting MCCM strength, effectively capturing its response under different scenarios. This approach provides a simple and efficient alternative for users without a machine learning background, enabling rapid strength estimation without relying on complex algorithms. It serves as a practical tool for engineering design and decision-making.
7 Conclusions
This study conducted experimental tests on the strength of marine coral sand clay mixtures (MCCM) under various conditions and established a comprehensive database based on the results. Using this dataset, a machine learning model called LDA-BPNN was developed to predict the strength of MCCM. The model considers key input variables that influence strength, including clay content, number of reinforcement layers, confining pressure, water content, and strain. To evaluate the performance of the LDA-BPNN model, three conventional machine learning models (BPNN, GA-BPNN, and PSO-BPNN) were developed and their predictive capabilities were compared. In addition, sensitivity analysis was carried out to quantify the influence of each input parameter on the strength of MCCM. Based on the analysis, an empirical formula was proposed to support practical application by engineers who may not have a background in machine learning. The main findings of this study are summarized as follows:
-
Experimental results show that clay content, reinforcement layers, confining pressure, water content, and strain significantly affect MCCM strength. Reinforcement layers and confining pressure have the strongest positive impact. These findings help optimize material composition and design parameters for engineering applications.
-
The LDA-BPNN model outperformed traditional models (BPNN, GA-BPNN, PSO-BPNN) in predicting MCCM strength, showing higher accuracy and better generalization with a notably lower RMSE, demonstrating the value of combining dimensionality reduction and ensemble learning.
-
Sensitivity analysis showed water content most affects MCCM strength, followed by clay content and confining pressure, aiding targeted and efficient parameter control in engineering design.
-
The empirical formula derived from the machine learning model is interpretable and practical, enabling reliable strength prediction without specialized AI tools. It offers a simple, cost-effective solution for engineers, especially when data or computing resources are limited, supporting rapid engineering decisions.
Overall, accurately predicting the strength of MCCM remains a challenging task due to the complex, nonlinear interactions among multiple influencing factors. However, the LDA-BPNN model developed in this study effectively addresses these challenges by integrating dimensionality reduction with neural network learning. In addition, the empirical formula derived from the model results offers a practical and accessible alternative for strength estimation, especially in engineering contexts where computational resources or machine learning expertise are limited. That said, it is important to note that the empirical formula is based on a single dataset, which introduces certain limitations in its generalizability. For future research, it is recommended to incorporate additional material characteristics of MCCM, such as particle morphology, fabric, and mineral composition, to further enhance model generalization. Expanding the experimental database with more diverse loading and environmental conditions would also help validate and refine the model under a broader range of scenarios. These efforts will contribute to developing a more robust and reliable predictive framework, capable of supporting informed engineering decisions and improving the safety and efficiency of marine infrastructure projects. Currently, the study is limited to a single soil type, and the experimental conditions are relatively constrained. Further research will involve incorporating more experimental data and expanding the scope to include a wider variety of soil types and loading conditions. Additionally, the model comparison in this study is also limited; future work will aim to include comparisons with other predictive models to better evaluate its performance and applicability across different contexts.
Statements
Data availability statement
The raw data supporting the conclusions of this article will be made available by the authors, without undue reservation.
Author contributions
BY: Investigation, Conceptualization, Visualization, Data curation, Resources, Project administration, Funding acquisition, Validation, Methodology, Writing – review & editing, Software, Formal Analysis, Supervision. KX: Project administration, Methodology, Formal Analysis, Data curation, Investigation, Writing – review & editing, Software, Resources, Writing – original draft. YL: Validation, Methodology, Formal Analysis, Software, Writing – review & editing. PC: Supervision, Validation, Writing – review & editing, Data curation, Funding acquisition, Resources, Project administration, Visualization.
Funding
The author(s) declare financial support was received for the research and/or publication of this article. The authors would like to acknowledge the consistent support of National Natural Science Foundation of China: No 52471290, No 52301327; Project funded by China Postdoctoral Science Foundation: No 2024T170217, No 2023M730929; Failure Mechanics and Engineering Disaster Prevention, Key Lab of Sichuan Province: No FMEDP202209; Shanghai Sailing Program: No 22YF1415800, No 23YF1416100; Shanghai Natural Science Foundation: No 23ZR1426200, No 24ZR1427900; The Shanghai Soft Science Key Project: No 23692119700; Funded by Key Laboratory of Ministry of Education for Coastal Disaster and Protection, Hohai University, No 202302; Funded by Key Laboratory of Estuarine & Coastal Engineering, Ministry of Transport, No KLECE220302. Shanghai Frontiers Science Center of “Full Penetration Far-Reaching Offshore Ocean Energy and Power.
Conflict of interest
Author BY was employed by Shanxi Ningguli New Materials Joint Stock Company Limited.
The remaining authors declare that the research was conducted in the absence of any commercial or financial relationships that could be construed as a potential conflict of interest.
Generative AI statement
The author(s) declare that no Generative AI was used in the creation of this manuscript.
Any alternative text (alt text) provided alongside figures in this article has been generated by Frontiers with the support of artificial intelligence and reasonable efforts have been made to ensure accuracy, including review by the authors wherever possible. If you identify any issues, please contact us.
Correction note
A correction has been made to this article. Details can be found at: 10.3389/fmars.2026.1789998.
Publisher’s note
All claims expressed in this article are solely those of the authors and do not necessarily represent those of their affiliated organizations, or those of the publisher, the editors and the reviewers. Any product that may be evaluated in this article, or claim that may be made by its manufacturer, is not guaranteed or endorsed by the publisher.
References
1
Chao Z. Fowmes G. (2021). Modified stress and temperature-controlled direct shear apparatus on soil-geosynthetics interfaces. Geotextiles Geomembranes49, 825–841. doi: 10.1016/j.geotexmem.2020.12.011
2
Chao Z. Li Z. Dong Y. Shi D. Zheng J. (2024a). Estimating compressive strength of coral sand aggregate concrete in marine environment by combining physical experiments and machine learning-based techniques. Ocean Eng.308, 118320. doi: 10.1016/j.oceaneng.2024.118320
3
Chao Z. Liu H. Wang H. Dong Y. Shi D. Zheng J. (2024b). The interface mechanical properties between polymer layer and marine sand with different particle sizes under the effect of temperature: Laboratory tests and artificial intelligence modelling. Ocean Eng.312, 119255. doi: 10.1016/j.oceaneng.2024.119255
4
Chao Z. Ma G. He K. Wang M. (2021). Investigating low-permeability sandstone based on physical experiments and predictive modeling. Underground Space6, 364–378. doi: 10.1016/j.undsp.2020.05.002
5
Chao Z. Shi D. Fowmes G. Xu X. Yue W. Cui P. et al . (2023). Artificial intelligence algorithms for predicting peak shear strength of clayey soil-geomembrane interfaces and experimental validation. Geotextiles Geomembranes51, 179–198. doi: 10.1016/j.geotexmem.2022.10.007
6
Chao Z. Wang H. Zheng J. Shi D. Li C. Ding G. et al . (2024c). Temperature-dependent post-cyclic mechanical characteristics of interfaces between geogrid and marine reef sand: experimental research and machine learning modeling. J. Mar. Sci. Eng.12, 1262. doi: 10.3390/jmse12081262
7
Chao Z. Wang M. Sun Y. Xu X. Yue W. Yang C. et al . (2022). Predicting stress-dependent gas permeability of cement mortar with different relative moisture contents based on hybrid ensemble artificial intelligence algorithms. Construction Building Materials348, 128660. doi: 10.1016/j.conbuildmat.2022.128660
8
Chao Z. Zhou J. Shi D. Zheng J. (2025). Particle size effect on the mechanical behavior of coral sand–geogrid interfaces. Geosynthetics Int., 1–17. doi: 10.1680/jgein.24.00143
9
Chen J. Bao N. Ma C. Sun R. (2024). Triaxial behavior of unreinforced and geogrid-reinforced calcareous gravelly sand: Experiment and discrete element modelling. Construction Building Materials430, 136405. doi: 10.1016/j.conbuildmat.2024.136405
10
Cui J. Jin Y. Jing Y. Lu Y. (2024). Elastoplastic solution of cylindrical cavity expansion in unsaturated offshore island soil considering anisotropy. J. Mar. Sci. Eng.12, 308. doi: 10.3390/jmse12020308
11
Ding S. Li S. Kong S. Li Q. Yang T. Nie Z. et al . (2024). Changing of mechanical property and bearing capacity of strongly chlorine saline soil under freeze-thaw cycles. Sci. Rep.14, 6203.
12
Ding X.-m. Ou Q. (2022a). Mechanical property and deformation behavior of geogrid reinforced calcareous sand. Geotextiles Geomembranes50, 618–631. doi: 10.1016/j.geotexmem.2022.03.002
13
Dong Y. Wang D. Randolph M. F. (2017). Investigation of impact forces on pipeline by submarine landslide using material point method. Ocean Eng.146, 21–28. doi: 10.1016/j.oceaneng.2017.09.008
14
Fan L. Cui L. Zhu Z. Sheng Q. Zheng J. Dong Y. (2025). Elaborate numerical analysis and new fibre Bragg grating monitoring methods for the ground pressure in shallow large-diameter shield tunnels: a case study of the yellow crane tower tunnel project. Bull. Eng. Geology Environ.84, 1–19. doi: 10.1007/s10064-025-04088-3
15
Fan N. Jiang J. Nian T. Dong Y. Guo L. Fu C. et al . (2023). Impact action of submarine slides on pipelines: A review of the state-of-the-art since 2008. Ocean Eng.286, 115532. doi: 10.1016/j.oceaneng.2023.115532
16
Fowmes G. J. Dixon N. Fu L. Zaharescu C. A. (2017). Rapid prototyping of geosynthetic interfaces: investigation of peak strength using direct shear tests. Geotextiles Geomembranes45, 674–687. doi: 10.1016/j.geotexmem.2017.08.009
17
Gao R. Ye J. (2024). A novel relationship between elastic modulus and void ratio associated with principal stress for coral calcareous sand. J. Rock Mechanics Geotechnical Eng.16, 1033–1048. doi: 10.1016/j.jrmge.2023.07.011
18
Gao J. Zhu G. Wang J. Yang Y. Li Y. (2024). Study on the dynamic characteristics of geogrids combined with rubber particles reinforced with calcareous sand. Acta Geotechnica, 1–17. doi: 10.1007/s11440-024-02368-y
19
Goh A. T. Kulhawy F. H. Chua C. (2005). Bayesian neural network analysis of undrained side resistance of drilled shafts. J. geotechnical geoenvironmental Eng.131, 84–93. doi: 10.1061/(ASCE)1090-0241(2005)131:1(84)
20
Gong J. Xu J. Xu L. Hong Z. (2025). Enhancing motion forecasting of ship sailing in irregular waves based on optimized LSTM model and principal component of wave-height. Front. Mar. Sci.12, 1497956. doi: 10.3389/fmars.2025.1497956
21
Hecht-Nielsen R. (1992). Theory of the backpropagation neural network, Neural networks for perception. Elsevierpp, 65–93.
22
Huang S. Wang P. Lai Z. Yin Z.-Y. Huang L. Xu C. (2024). Machine-learning-enabled discrete element method: The extension to three dimensions and computational issues. Comput. Methods Appl. Mechanics Eng.432, 117445. doi: 10.1016/j.cma.2024.117445
23
Jie J. Zeng J. Ren Y. (2004). Improved mind evolutionary computation for optimizations, Fifth World Congress on Intelligent Control and Automation (IEEE Cat. No. 04EX788). IEEE, 2200–2204.
24
Kardani N. Zhou A. Nazem M. Shen S.-L. (2020). Estimation of bearing capacity of piles in cohesionless soil using optimised machine learning approaches. Geotechnical Geological Eng.38, 2271–2291. doi: 10.1007/s10706-019-01085-8
25
Lambora A. Gupta K. Chopra K. (2019). Genetic algorithm-A literature review international conference on machine learning, big data, cloud and parallel computing (COMITCon). IEEE, 380–384.
26
Li D. Jiang Z. Tian K. Ji R. (2025). Prediction of hydraulic conductivity of sodium bentonite GCLs by machine learning approaches. Environ. Geotechnics12, 154–173. doi: 10.1680/jenge.22.00181
27
Li T. Zhu Z. Wu T. Ren G. Zhao G. (2024). A potential way for improving the dispersivity and mechanical properties of dispersive soil using calcined coal gangue. J. Materials Res. Technol.29, 3049–3062. doi: 10.1016/j.jmrt.2024.01.281
28
Lin H. Gong X. Zeng Y. Zhou C. (2024). Experimental study on the effect of temperature on HDPE geomembrane/geotextile interface shear characteristics. Geotextiles Geomembranes52, 396–407. doi: 10.1016/j.geotexmem.2023.12.005
29
Liu Z. Shao J. Xu W. Wu Q. (2015). Indirect estimation of unconfined compressive strength of carbonate rocks using extreme learning machine. Acta Geotechnica10, 651–663. doi: 10.1007/s11440-014-0316-1
30
Lundberg S. M. Lee S.-I. (2017). A unified approach to interpreting model predictions. Adv. Neural Inf. Process. Syst. 30.
31
Lv Y. Li X. Fan C. Su Y. (2021). Effects of internal pores on the mechanical properties of marine calcareous sand particles. Acta Geotechnica16, 3209–3228. doi: 10.1007/s11440-021-01223-8
32
Nhu V.-H. Shirzadi A. Shahabi H. Singh S. K. Al-Ansari N. Clague J. J. et al . (2020). Shallow landslide susceptibility mapping: A comparison between logistic model tree, logistic regression, naïve bayes tree, artificial neural network, and support vector machine algorithms. Int. J. Environ. Res. Public Health17, 2749. doi: 10.3390/ijerph17082749
33
Peng Y. Ding X. Yin Z.-Y. Wang P. (2022). Micromechanical analysis of the particle corner breakage effect on pile penetration resistance and formation of breakage zones in coral sand. Ocean Eng.259, 111859. doi: 10.1016/j.oceaneng.2022.111859
34
Pham H. Guan M. Zoph B. Le Q. Dean J. (2018). “ Efficient neural architecture search via parameters sharing,” in Proceedings of the International Conference on Machine Learning. ( PMLR), 4095–4104.
35
Poorahong H. Jamsawang P. Thanasisathit N. Jongpradist P. Jing G. (2024). Performance of a triaxial geogrid-reinforced crushed rock base underlain by a soft clay subgrade. Case Stud. Construction Materials20, e03198. doi: 10.1016/j.cscm.2024.e03198
36
Prakasha K. Chandrasekaran V. (2005). Behavior of marine sand-clay mixtures under static and cyclic triaxial shear. J. geotechnical geoenvironmental Eng.131, 213–222. doi: 10.1061/(ASCE)1090-0241(2005)131:2(213)
37
Qin W. Ye C. Gao J. Dai G. Wang D. Dong Y. (2025). Pore water pressure of clay soil around large-diameter open-ended thin-walled pile (LOTP) during impact penetration. Comput. Geotechnics180, 107065. doi: 10.1016/j.compgeo.2025.107065
38
Ren P. Chen Z.-L. Li L. Gong W. Li J. (2024). Dynamic shakedown behaviors of flexible pavement overlying saturated ground under moving traffic load considering effect of pavement roughness. Comput. Geotechnics168, 106134. doi: 10.1016/j.compgeo.2024.106134
39
Samui P. (2012). Application of statistical learning algorithms to ultimate bearing capacity of shallow foundation on cohesionless soil. Int. J. Numerical Analytical Methods Geomechanics36, 100–110. doi: 10.1002/nag.997
40
Shao W. Qin F. Shi D. Soomro M. A. (2024). Horizontal bearing characteristic and seismic fragility analysis of CFRP composite pipe piles subject to chloride corrosion. Comput. Geotechnics166, 105977. doi: 10.1016/j.compgeo.2023.105977
41
Song S. Wang P. Yin Z. Cheng Y. P. (2024). Micromechanical modeling of hollow cylinder torsional shear test on sand using discrete element method. J. Rock Mechanics Geotechnical Eng.16, 5193–5208. doi: 10.1016/j.jrmge.2024.02.010
42
Wang H. Shen J. (2018). An improved model combining evolutionary algorithm and neural networks for PV maximum power point tracking. IEEE Access7, 2823–2827. doi: 10.1109/ACCESS.2018.2881888
43
Wang W. Tang R. Li C. Liu P. Luo L. (2018). A BP neural network model optimized by mind evolutionary algorithm for predicting the ocean wave heights. Ocean Eng.162, 98–107. doi: 10.1016/j.oceaneng.2018.04.039
44
Wang T. Xiao G. Li Q. Biancardo S. A. (2025). The impact of the 21st-Century Maritime Silk Road on sulfur dioxide emissions in Chinese ports: based on the difference-in-difference model. Front. Mar. Sci.12, 1608803. doi: 10.3389/fmars.2025.1608803
45
Wang F. Zhai W. Man J. Huang H. (2024). A hybrid cohesive phase-field numerical method for the stability analysis of rock slopes with discontinuities. Can. Geotechnical J. (ja).
46
Wang F. Zhang D. Huang H. Huang Q. (2023). A phase-field-based multi-physics coupling numerical method and its application in soil–water inrush accident of shield tunnel. Tunnelling Underground Space Technol.140, 105233. doi: 10.1016/j.tust.2023.105233
47
Wu Y. Li N. Wang X. Cui J. Chen Y. Wu Y. et al . (2021). Experimental investigation on mechanical behavior and particle crushing of calcareous sand retrieved from South China Sea. Eng. geology280, 105932. doi: 10.1016/j.enggeo.2020.105932
48
Xiao G. Wang Y. Wu R. Li J. Cai Z. (2024). Sustainable maritime transport: A review of intelligent shipping technology and green port construction applications. J. Mar. Sci. Eng.12, 1728. doi: 10.3390/jmse12101728
49
Xu J. Gong J. Li Y. Fu Z. Wang L. (2024). Surf-riding and broaching prediction of ship sailing in regular waves by LSTM based on the data of ship motion and encounter wave. Ocean Eng.297, 117010. doi: 10.1016/j.oceaneng.2024.117010
50
Xu D.-s. Huang M. Zhou Y. (2020). One-dimensional compression behavior of calcareous sand and marine clay mixtures. Int. J. Geomechanics20, 04020137. doi: 10.1061/(ASCE)GM.1943-5622.0001763
51
Xu Z. Zhang X. Zhou X. Zhang J. (2025). AvatarShield: visual reinforcement learning for human-centric video forgery detection. arXiv preprint arXiv2505, 15173.
52
Yang H. Li H. Zhao Z. (2025). Modeling prediction of bond strength between rebar and recycled aggregate concrete by deep learning approach based on attention mechanism. Construction Building Materials471, 140753. doi: 10.1016/j.conbuildmat.2025.140753
53
Ye J. Gao R. (2024). Isotropic compression and triaxial shear characteristics of coral sand under high confining pressure and related particle breakage. Géotechnique, 1–17.
54
Zhang W. Li H. Shi D. Shen Z. Zhao S. Guo C. (2023a). Determination of safety monitoring indices for roller-compacted concrete dams considering seepage–stress coupling effects. Mathematics11, 3224. doi: 10.3390/math11143224
55
Zhang J. Li P. Yin X. Wang S. Zhu Y. (2022). Back analysis of surrounding rock parameters in pingdingshan mine based on BP neural network integrated mind evolutionary algorithm. Mathematics10, 1746. doi: 10.3390/math10101746
56
Zhang Y. Zhang Z. Zheng J. Zheng Y. Zhang J. Liu Z. et al . (2023b). Research of the array spacing effect on wake interaction of tidal stream turbines. Ocean Eng.276, 114227. doi: 10.1016/j.oceaneng.2023.114227
57
Zhao Y.-P. Chen Q.-P. Bi C.-W. (2022). Numerical investigation of nonlinear wave loads on a trestle-netting enclosure aquaculture facility. Ocean Eng.257, 111610. doi: 10.1016/j.oceaneng.2022.111610
58
Zhao S. Zhang J. Feng S.-J. (2023b). The era of low-permeability sites remediation and corresponding technologies: A review. Chemosphere313, 137264. doi: 10.1016/j.chemosphere.2022.137264
59
Zhao G. Zhu Z. Ren G. Wu T. Ju P. Ding S. et al . (2023a). Utilization of recycled concrete powder in modification of the dispersive soil: A potential way to improve the engineering properties. Construction Building Materials389, 131626. doi: 10.1016/j.conbuildmat.2023.131626
60
Zheng Z. Deng B. Li S. Zheng H. (2024a). Disturbance mechanical behaviors and anisotropic fracturing mechanisms of rock under novel three-stage true triaxial static-dynamic coupling loading. Rock Mechanics Rock Eng.57, 2445–2468. doi: 10.1007/s00603-023-03696-3
61
Zheng Z. Li R. Pan P. Qi J. Su G. Zheng H. (2024b). Shear failure behaviors and degradation mechanical model of rockmass under true triaxial multi-level loading and unloading shear tests. Int. J. Min. Sci. Technol.34, 1385–1408. doi: 10.1016/j.ijmst.2024.10.002
62
Zhou B. Ku Q. Li C. Wang H. Dong Y. Cheng Z. (2022). Single-particle crushing behaviour of carbonate sands studied by X-ray microtomography and a combined finite–discrete element method. Acta Geotechnica17, 3195–3209. doi: 10.1007/s11440-022-01469-w
63
Zhou J. Shi X. Du K. Qiu X. Li X. Mitri H. S. (2017). Feasibility of random-forest approach for prediction of ground settlements induced by the construction of a shield-driven tunnel. Int. J. Geomechanics17, 04016129. doi: 10.1061/(ASCE)GM.1943-5622.0000817
Summary
Keywords
marine coral sand-clay mixture, strength prediction, LDA-BPNN model, machine learning, empirical formula
Citation
Yang B, Xu K, Liu Y and Cui P (2025) Predictive modeling on the mechanical properties of marine coral sand-clay mixtures based on machine learning algorithms and triaxial shear tests. Front. Mar. Sci. 12:1630481. doi: 10.3389/fmars.2025.1630481
Received
17 May 2025
Accepted
08 August 2025
Published
26 August 2025
Corrected
04 February 2026
Volume
12 - 2025
Edited by
Maohan Liang, National University of Singapore, Singapore
Reviewed by
Zhihua Chen, Hong Kong Polytechnic University, China
Miao Gao, Tianjin University, China
Hangyu Mao, Hohai University, China
Abolfazl Baghbani, La Trobe University, Australia
Updates
Copyright
© 2025 Yang, Xu, Liu and Cui.
This is an open-access article distributed under the terms of the Creative Commons Attribution License (CC BY). The use, distribution or reproduction in other forums is permitted, provided the original author(s) and the copyright owner(s) are credited and that the original publication in this journal is cited, in accordance with accepted academic practice. No use, distribution or reproduction is permitted which does not comply with these terms.
*Correspondence: Peng Cui, cui.peng@umu.se
†These authors have contributed equally to this work
Disclaimer
All claims expressed in this article are solely those of the authors and do not necessarily represent those of their affiliated organizations, or those of the publisher, the editors and the reviewers. Any product that may be evaluated in this article or claim that may be made by its manufacturer is not guaranteed or endorsed by the publisher.