Abstract
Microplastics (MPs) are a significant environmental concern due to their abundance, widespread occurrence, slow degradation rate, and toxicity. Although MPs have been found in various environments and organisms (including humans), few studies have investigated their historical accumulation in marine settings. Here we present the first chronological accumulation of MPs in Baltic Sea sediments over time. The high sediment accumulation rates (ca. 1 cm yr-1) and anoxic bottom conditions in the study area allowed for an exceptionally well-preserved record of MPs in sediment over the last 50 years. Despite potential biases and limitations associated with the methodologies (e.g., visual identification), our results suggest that MP accumulation began in the 1970s-1980s and has continued to increase until present-day, with up to 4450 particles per kg of dry sediment. The temporal distribution of MPs in sediment is consistent with local population growth in catchment areas and global plastic production rates, highlighting the impact of human activities on MP pollution in the region.
1 Introduction
The production and use of synthetic materials, including plastics, have accompanied the development of modern society. Unfortunately, this has resulted in pollution of the environment, and concerns have arisen about the potential contamination of natural habitats, wildlife, and humans with microplastics (MPs) (Thompson et al., 2009). MPs commonly refer to plastic particles that are 1- 5000 µm in size (Thompson, 2015). The severity of MP pollution in the environment, particularly in the oceans, is exacerbated by the vast amounts of manufactured plastic materials, poor management of plastic waste, and limited technologies available for collection and cleanup (Geyer et al., 2017; Hahladakis, 2020; Watt et al., 2021). Estimates suggest that the total volume of plastic waste generated worldwide until 2015 is a staggering 6.3 billion metric tons (Mt) (Geyer et al., 2017). The annual waste generation increased by more than two-fold from 2000 to 2019 (i.e., 156 Mt to 353 Mt) (Organisation de coopération et de développement économiques, 2022). During the same time period, the amount of floating plastic debris in the oceans - primarily MPs - increased even more dramatically, from 0.37 - 0.49 million Mt in 2000 to 1.1 - 4.9 million Mt in 2019 (Eriksen et al., 2023).
Given its semi-enclosed nature, limited water exchange, and long-term environmental monitoring, the Baltic Sea provides a unique setting for studying the historical accumulation of MPs. The Baltic Sea is one of the largest brackish water bodies in the world, with a surface area of 374,000 km2, a volume of 21,580 km3, and average and maximum depths of 60 and 459 meters, respectively (Voipio, 1981). The Baltic Sea and the North Sea have very limited water exchange, occurring through the Danish strait between Sweden and Denmark (Andersen et al., 2010), and resulting in a water exchange time for the entire Baltic Sea of about 25–30 years (Lundberg et al., 2009). Due to this limited water exchange, the Baltic Sea is a semi-enclosed, shallow-water, micro-tidal environment with high anthropogenic pressure from densely populated catchment areas (Borg and Jonsson, 1996; Helcom, 2018; Reusch et al., 2018). These characteristics may facilitate the deposition and accumulation of MPs (Haseler et al., 2020). Moreover, the Baltic Sea has experienced an early history of multistressor disturbance and ecosystem deterioration, along with long-term scientific monitoring and cross-border environmental management (Reusch et al., 2018). Because of these unique characteristics, the Baltic Sea has been considered a “time-machine” and, therefore, an analog for the future coastal ocean (Reusch et al., 2018).
MPs can exert detrimental impacts on marine biota (Anbumani and Kakkar, 2018), with examples including fibrosis of stomach tissues in seabirds (Charlton-Howard et al., 2023), oxidative stress responses in sea cucumbers (Lombardo et al., 2022) and decreased reproduction performances in crabs (Horn et al., 2020). The toxicological effects can be further exacerbated by additive chemicals used in plastic production, including plasticizers, flame retardants, and photostabilizers (Campanale et al., 2020; Do et al., 2022). Studies of potential environmental and health effects related to exposure to MPs are, however, complicated by variations in particle size, shape, color, and chemical composition, all of which affect their uptake in biota and associated toxicity (Hidalgo-Ruz et al., 2012; Kershaw, 2015; Frias et al., 2018; Bhagat et al., 2020). Beyond ecological concerns, recent research has highlighted the presence of MPs in human tissues, including the placenta (Ragusa et al., 2021), lungs (Amato-Lourenço et al., 2021), and blood (Leslie et al., 2022), raising questions about potential health risks. These findings suggest that MPs can enter the human body through ingestion, inhalation, and possibly dermal exposure, although the full extent of their toxicological effects remains unclear and warrants further investigation (Vethaak and Legler, 2021). The physicochemical properties of MPs also play a crucial role in their initial distribution in the marine environment (Li et al., 2023). This distribution is further influenced by factors such as the distance from the source, weather conditions (e.g., rainfall, snowmelt, wind), ocean currents and gyres, river discharge and drift, biofouling and various physical and biological processes, as well as human activities (Cole et al., 2011; Eriksen et al., 2014; Frere et al., 2017; Booth and Sørensen, 2020; Ory et al., 2020).
Since marine sediments are believed to be the major sink for plastic and MPs in aquatic environments (Woodall et al., 2014; Martin et al., 2022), they are a key medium for studying how these particles accumulate in the environment. Additionally, sediment cores are considered more reliable for MP inventories than water samples, as the former may record MP accumulation over time, while the latter provide only a momentary view (Tekman et al., 2020; Uddin et al., 2021). While most studies on MPs in sediments focus only on recently deposited surface layers, recent studies (Martin et al., 2020; Belivermiş et al., 2021) have highlighted the chronological accumulation of MPs in marine sediments, and there are studies (Torres and De-la-Torre, 2021; Uddin et al., 2021) that have attempted to establish chronological trends in MP abundance by using sediment cores as historical archives. Plastic is considered a good stratigraphic indicator of the Anthropocene due to its generally good preservation potential within sedimentary strata, comparable to that of recalcitrant organic fossils (Zalasiewicz et al., 2016). In particular, marine sediments in areas with high sedimentation rates (e.g., ca. 1 cm yr-1) provide a valuable opportunity to study the accumulation of MP over past decades (Sabdono et al., 2022). However, since the temporal distribution of MPs in sedimentary records may not always be preserved (Dimante-Deimantovica et al., 2024), anoxic bottom water conditions that suppress bioturbation and vertical mixing of MP in the upper sediment layers are also beneficial (Brandon et al., 2019; Torres and De-la-Torre, 2021).
The Baltic Sea has been extensively investigated in terms of climate, physics, chemistry, biology, and responses to climate change (Feistel et al., 2008). However, only a few studies (Lenz et al., 2016; Gewert et al., 2017; Rothäusler et al., 2019; Zobkov et al., 2019) have investigated MP abundance, and some articles (Graca et al., 2017; Zobkov and Esiukova, 2017; Esiukova et al., 2020; Schernewski et al., 2020; Kaiser et al., 2023) have reported on the distribution of MPs in Baltic Sea seafloor sediment. Thus, despite recent progress (Uddin et al., 2021) in understanding MP pollution in sediment profiles, limited studies have been carried out in the Baltic Sea. To the best of our knowledge, this study is the first to provide clear evidence of chronological MP accumulation in the sediment of this region. It indicates the starting years of contamination and lays the groundwork for future research.
2 Methods
2.1 Study area and fieldwork
This study is based on analyses of two sediment cores collected during an offshore sampling campaign operated by the Swedish Geological Survey in 2020 (campaign MOS20). The two cores were collected at two stations included in the Swedish National Environmental Monitoring Program, in the central Baltic Sea: station SE-05 (N 58° 58′ 38.16′′, E 20° 18′ 25.42′′, northern Baltic Proper, water depth: ca. 175 m, Figure 1) and station SE-08 (N 58° 40′ 41.25′′, E 18° 21′ 24.45′′, western Gotland Basin, water depth: ca. 404 m; Figure 1). Station SE-08 is situated closer to the coastline and the Swedish capital of Stockholm, 34 km from the coastline and 72 km from the Stockholm city center. Station SE-05 is located in the middle of the open sea, approximately 110 km, 167 km, and 100 km from the Swedish, Finnish, and Estonian coasts, respectively. Both stations are situated in areas with high sediment accumulation rates (1.03 cm yr-1) and anoxic bottom water conditions (Josefsson, 2022; Ketzer et al., 2024).
Figure 1
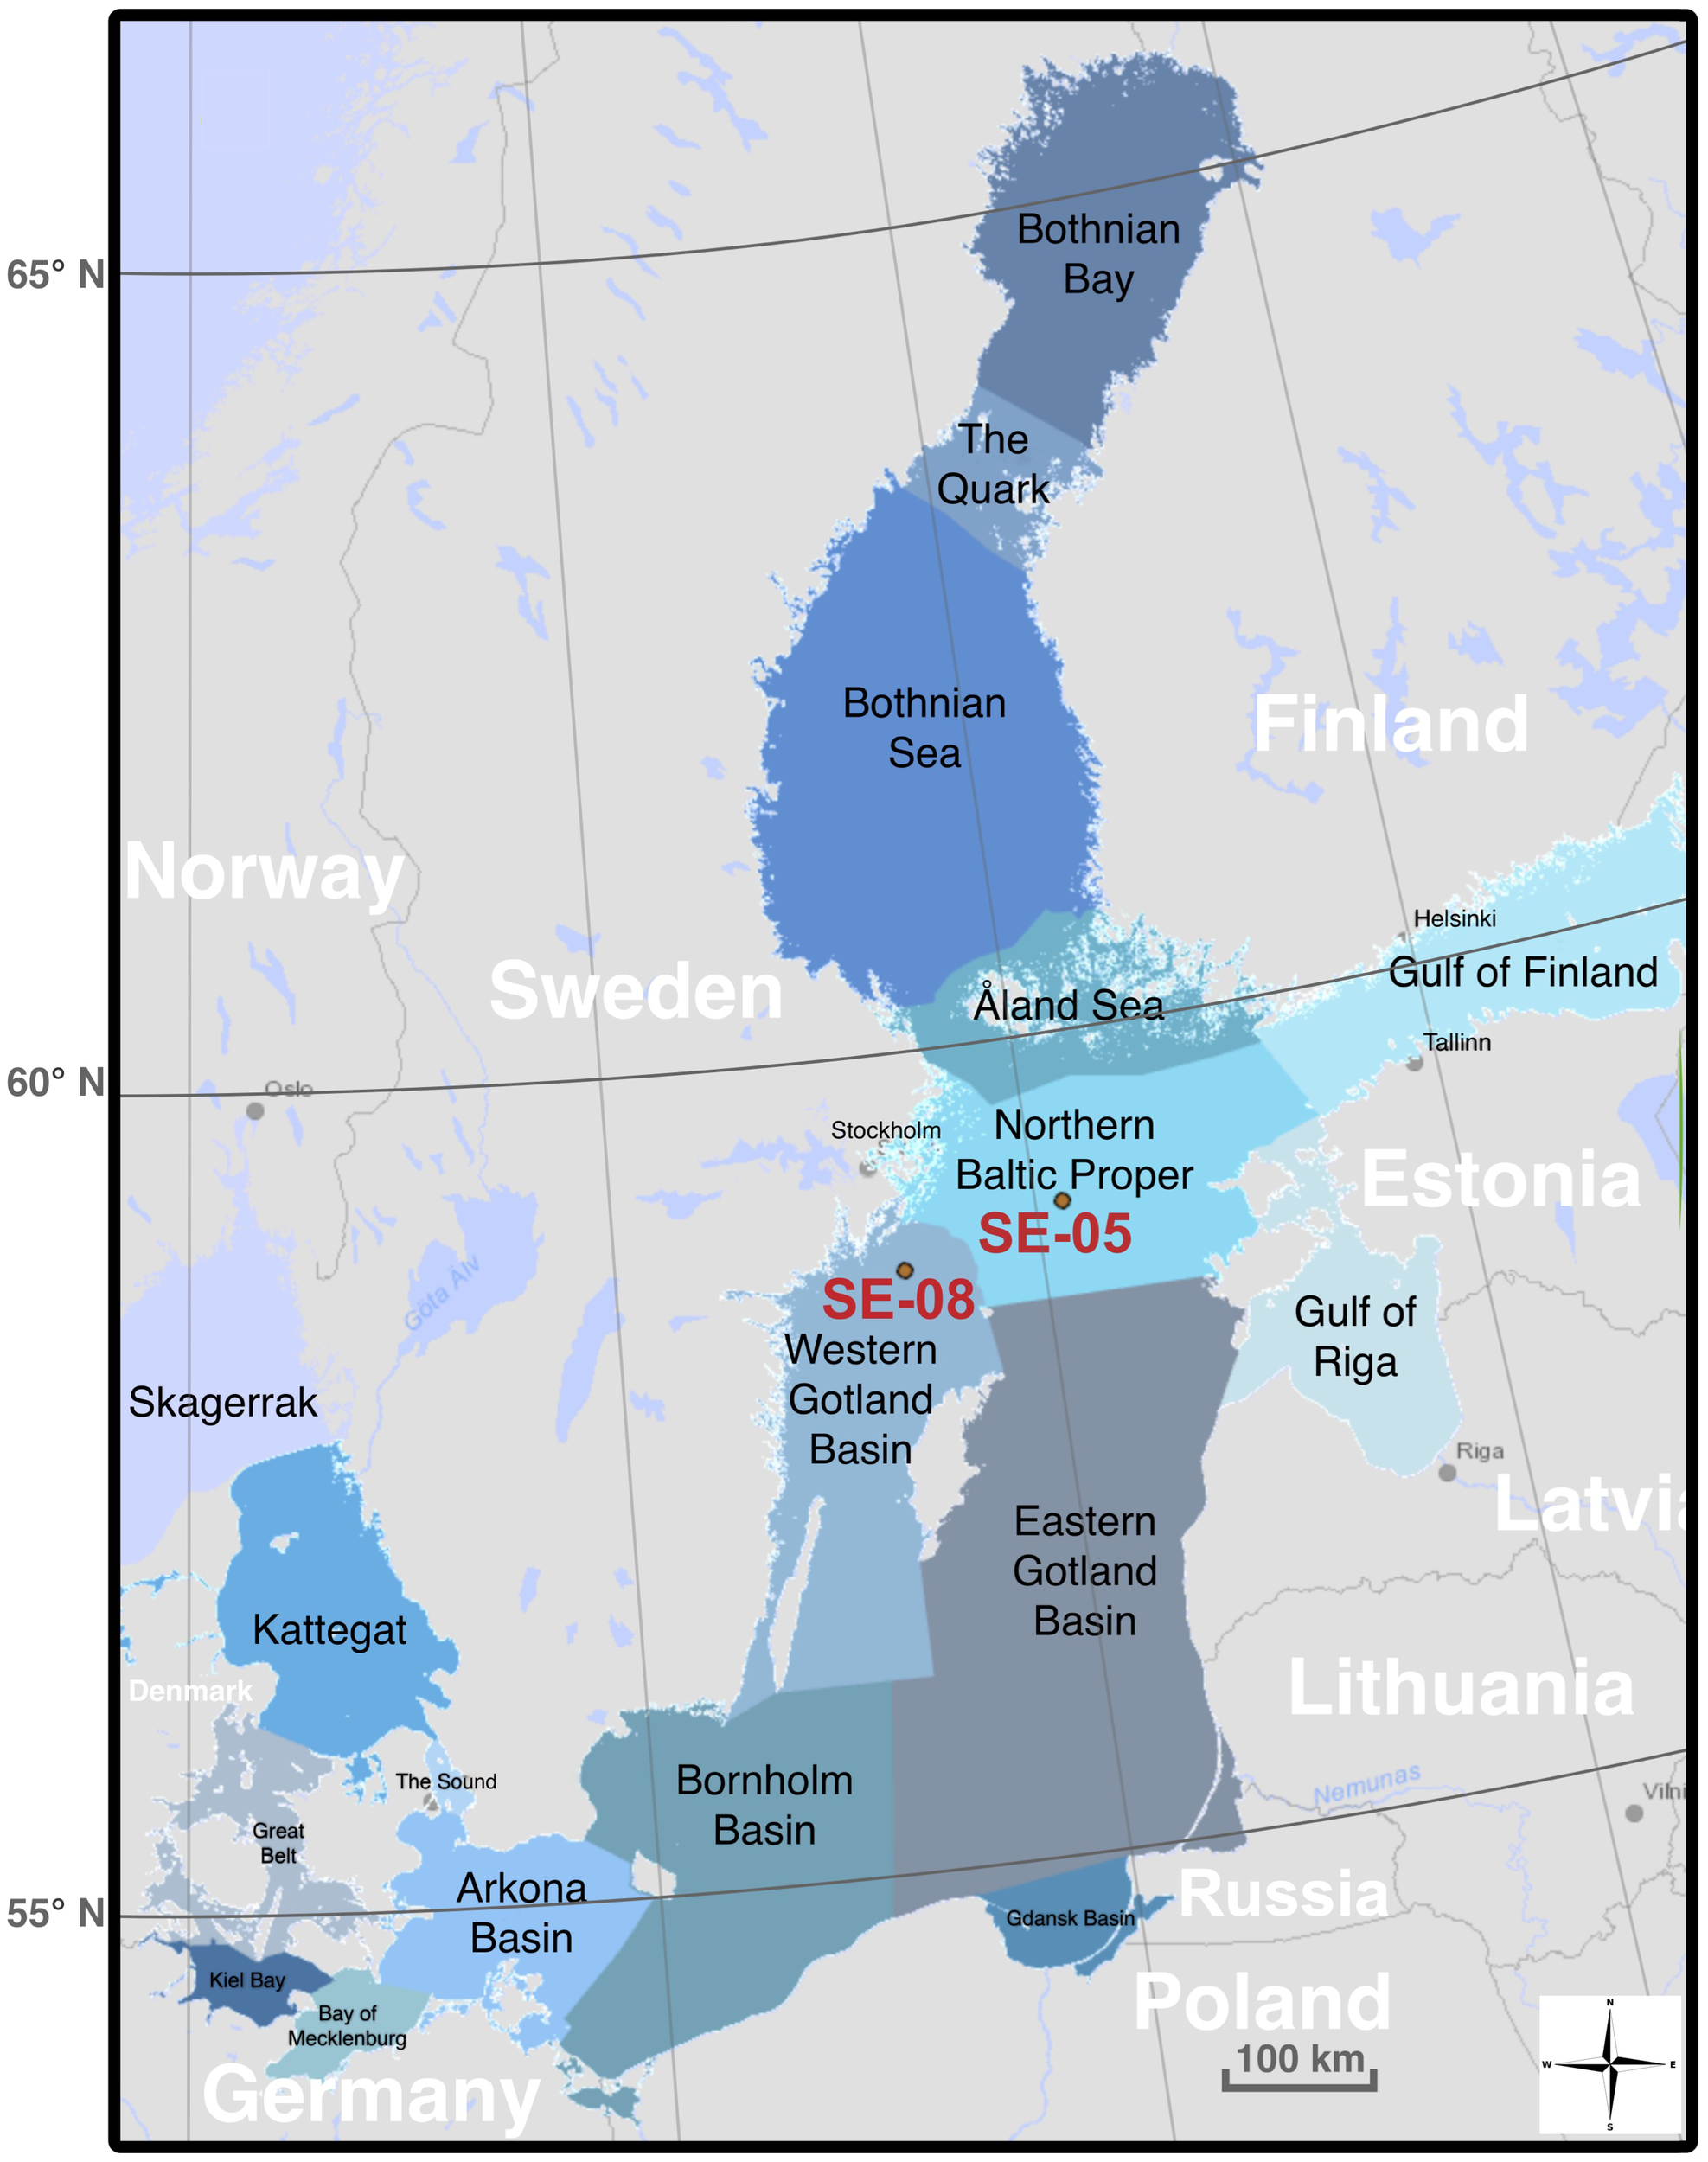
Map showing the locations of the study cores: Swedish National Environmental Monitoring Program station SE-05 and SE-08. (Image derived from data provided by the HELCOM map and data service).
A GEMAX-type twin gravity corer equipped with two transparent acrylic liners (70 cm in length, 9 cm in inner diameter) was used for sediment core collection. Parallel cores were collected from each site to enable both sedimentological characterization and geochemical analyses. Previously published work on the cores reported that there were no signs of bioturbation, with the sediment comprising black to dark brown, massive to laminated mud, and no visible marine fauna (Ketzer et al., 2024). The cores used for MP analyses from stations SE-05 and SE-08 measured 62 cm and 60 cm in length, respectively. They were sliced by a clean metal blade at two-centimeter intervals, resulting in a total of 31 and 30 samples. All samples were immediately frozen at -20 °C after slicing.
2.2 Microplastic extraction and examination
The methods used to investigate MP abundance in this study were modified from the NOAA guideline (Masura et al., 2015), with reference to the standardized protocol (Frias et al., 2018) from JPI-Oceans (Joint Programming Initiative Healthy and Productive Seas and Oceans). Upon receiving the 2 cm thick (15 ± 11 g-DW) pre-sliced frozen sediment samples, a series of laboratory steps were performed, including sample drying, H2O2 treatment, sieving, density separation, centrifugation, filtration and microscopic examinations. The samples were dried in a 90 °C oven for 24–48 hours until a constant weight was achieved. To remove organic matter, each sample was slowly mixed with 100 mL of 10% H2O2 and left for 24 hours. The mixture was then passed through a stainless steel sieve (mesh size: 20 µm), and both the beaker and sieve were thoroughly rinsed with distilled water to ensure complete transfer of residual solids. This sieving step also served as a preliminary filtration to remove particles smaller than 20 µm, thereby reducing the total solid mass and minimizing interference in subsequent separation and analysis steps.
Density separation was carried out by adding saturated NaCl solution (density: 1.2 g/cm³) at a volume at least three times that of the residual solids, allowing MPs to float in the supernatant. Centrifugation of the supernatant at 4300 rpm for 5–10 minutes (Tang et al., 2020; Grause et al., 2021; Xu et al., 2021) was used to enhance separation and obtain a cleaner fraction for subsequent filtration and analysis. The supernatant was filtered using Munktell glass fiber filters (pore size: 8 - 12 µm), and the retained MPs were examined under a stereomicroscope (Olympus SZX10) and a compound microscope (Olympus BX50). MPs were identified and described based on color, size, and shape. Following the JPI-Oceans protocol (Frias et al., 2018), MPs were classified into two categories: (1) fibers – long, thread-like particles (also referred to as filaments), and (2) fragments – irregularly shaped, broken-off pieces. Film particles (thin, flat, and sheet-like) were included in the fragment category.
2.2.1 Quality assurance and quality control
To avoid contamination, most of the laboratory procedures were conducted in a fume hood, and the samples were protected by aluminum foil, petri dishes or metal lids. To prevent airborne MP contamination during microscopic analysis, the glass fiber filters containing MPs were sealed with clean, transparent tape that had been pre-checked under the microscope. Glass or metal tools were preferred, although white rubber gloves and transparent plastic centrifuge tubes were utilized during operation. The lab coats were white and made of cotton. The density separation solution was filtered through a glass fiber filter prior to use. Two procedural blanks were included throughout the laboratory procedure; each contained 5 suspected plastic particles, all of which were fibrous in shape.
2.3 Analytical methodology limitations
Many recent studies (Pervez and Wang, 2022; Khan et al., 2023; Izlal et al., 2024; Souza et al., 2024) have employed the same or similar analytical methods as those used in the present study to determine the MP abundance in the environment, due to considerations such as cost-effectiveness and limited access to advanced equipment. However, this methodology carries certain limitations that may affect the interpretation of the results and should thus be taken into account.
First, visual identification of MPs under a stereomicroscope can introduce both overestimation and underestimation. For instance, natural fibers, such as cotton and wool, may be misidentified as MPs, inflating the counts (Xu et al., 2021). On the other hand, smaller MPs, which are difficult to detect visually, may lead to underreported abundances. Advanced techniques, such as Fourier-transform infrared spectroscopy (FTIR), Laser Direct Infrared (LDIR) and Pyrolysis Gas Chromatography–Mass Spectrometry (py-GCMS), provide greater precision in quantifying MP abundance and determining their chemical composition (Dehaut et al., 2020; Cheng et al., 2022; Uaciquete et al., 2024). In some studies (Uaciquete et al., 2024; Villanova-Solano et al., 2024; Watson and Turner, 2024), this issue is addressed by referring to particles identified under the microscope solely as ‘anthropogenic particles’ unless they are validated as plastics. Furthermore, as mentioned earlier, transparent and white materials were used in the experiment. The white glass fiber filter, used as a surface for depositing the plastic particles before microscope examination, makes it difficult to identify anthropogenic particles of similar color. The proportion of white or transparent anthropogenic particles varies significantly across sampling locations (Sui et al., 2020; Sayed et al., 2021). Consequently, this study may exhibit significant bias related to the detection of such particles, and the variability in color distribution across sites further complicates efforts to assess their significance.
Another limitation is the reliance on density separation using a saturated NaCl solution. While a cost-effective method commonly adopted in previous studies (Van Cauwenberghe et al., 2015; Harris, 2020), this approach can only extract MPs with a density below 1.2 g/cm3, potentially overlooking denser polymers. Nevertheless, it effectively extracts the most common polymers found in the environment, such as polypropylene (PP), polystyrene (PS), and polyethylene (PE) (Frias et al., 2018; Phuong et al., 2021; Li et al., 2023). A previous study (Esiukova et al., 2020) conducted in Baltic Proper (same as our two study sites) sediments found that 70.3% of identified MPs had densities below 1.2 g/cm3.
2.4 Data analysis
2.4.1 Microplastic concentration
The number of MPs in each sample was calculated by subtracting the number of MPs detected in the procedural blanks (5 pcs/sample), from the number of particles identified in the microscope analysis, with negative values considered to be zero (Uurasjarvi et al., 2021; Viet Dung et al., 2021).
2.4.2 Chronological accumulation and prediction of microplastics contamination
The sediment cores analyzed in this study consist of laminated, fine-grained mud with no visible signs of bioturbation, indicating well-preserved stratigraphy and chronological integrity. Anoxic bottom water conditions at both sampling sites further suppress vertical mixing and biological disturbance, minimizing post-depositional alteration. In addition, the relatively high sedimentation rate (~1 cm yr-1) reduces the influence of short-term hydrodynamic variability, supporting the preservation of temporal signals in the sediment profile.
Based on these favorable depositional conditions, we adopted a constant sedimentation rate model to reconstruct the chronological accumulation of MPs. This approach is consistent with a previous study (Shahabi-Ghahfarokhi et al., 2021a) conducted at the same locations, including investigations of metal contamination, which similarly assumed a constant sedimentation rate for temporal interpretation.
The sedimentation rates for both sampling locations have been determined with radiometric dating techniques (Olszewski et al., 2018) by the Swedish Radiation Safety Authority, and reported as 1.03 cm yr-1 for both SE-05 and SE-08 (Josefsson, 2022) based on 210Pb measurements. Further support for the approach comes from the study (Olszewski et al., 2018) with six sediment cores across the Baltic Sea using multiple radionuclides (210Pb, 137Cs, 239 + 240Pu, and 238Pu/239 + 240Pu). The study found consistent sedimentation rates across these radionuclides at each station, with overlapping standard deviations. For example, at Station 6 (Northern Baltic Proper), sedimentation rates ranged from 0.66 to 0.88 cm yr-1 depending on the radionuclide used, with 210Pb estimates reported as 0.88 ± 0.09 cm yr-1.
An estimated age for each 2-cm sediment sample was reached by calculating backward from the year of sampling (2020). The relationship between MP concentration (pcs kg-DW-1) and depositing year was visualized by fitting the data into exponential curves, according to principles outlined in more detail by other studies (Brandon et al., 2019; Martin et al., 2020). The year 1950 was set as the starting point of the x-axis because there was little plastic production before this year (Geyer et al., 2017). The generic exponential equation, here used to describe the relationship between the MP concentration (y) and the year of deposition since 1950 (t), says that:
where b is the relative growth rate (Hoffmann and Poorter, 2002) of the exponential curve, and A+C indicates the intersection between the Y-axis and the exponential curve. The best fitted exponential curve equations based on ordinary least squares were also used to estimate the potential MP concentration in 2030.
2.4.3 Exploration of influencing factors
The distribution of MPs in sediment can be driven by different factors, and previous studies have compared trends in aquatic sediment MP concentrations to global plastic production (Brandon et al., 2019; Martin et al., 2020) or population density (Nel et al., 2017; Jorquera et al., 2022). In this study too, the trends (exponential curves) were compared with the historical data on 1) global plastic production, 2) accumulative global plastic production, 3) Swedish population and 4) Stockholm County population (closest county to the sampling locations). The data of global plastic production is from the research study by Geyer, R., et al (Geyer et al., 2017), while the data on the Swedish and Stockholm county populations is retrieved from Statistics Sweden (www.scb.se). The best fitting curves are constructed with the same method as those described above for the MP concentration.
A Generalized Additive Model (GAM) was used to further explore which of these four factors could better explain the MP concentration distribution in the samples. GAM analysis has been used in several studies (Kanhai et al., 2017; Liu et al., 2021; Meyerjürgens et al., 2022) to determine the influencing factors for MP distribution. The connection between explanatory factors and response variables is described by smooth functions in GAMs, a non-parametric variation of generalized linear models (GLM) (Meyerjürgens et al., 2022). The response variables were MP concentrations at SE-05 and SE-08, respectively. GAM was performed with single explanatory variables each time because the plastic production and population growth can be correlated. The mgcv package was adopted for the GAM in R (version 4.2.1). The datasheet used here can be found in the Supplementary Data 1 together with the data description (Shapiro-Wilk test for normality as well as Spearman rank correlation). The values used for exponential curve fitting and GAM analysis can be found in the Supplementary Data 1, together with the R-script and corresponding effective degrees of freedom (edf), k-index, Generalized Cross-Validation (GCV) scores, and Akaike Information Criterion (AIC) values for each model.
3 Results and discussion
3.1 Characterization of microplastics in the study cores
Out of the plastic particles retrieved from the studied cores, 99% were of MP size (<5 mm). Most of the plastic particles (ca. 70% for SE-05 and 67% for SE-08) are smaller than 1mm (Figure 2), concurring with results found in other studies dealing with MPs in sediments (Fok et al., 2017; Wang et al., 2020; Li et al., 2021). The high abundance of smaller MPs is commonly attributed to secondary MPs caused by the fragmentation of MPs into smaller pieces in the environment (Auta et al., 2017). Additionally, the smaller-sized MPs may selectively sink to the seafloor via biofouling due to high surface to volume ratio (Kaiser et al., 2017).
Figure 2
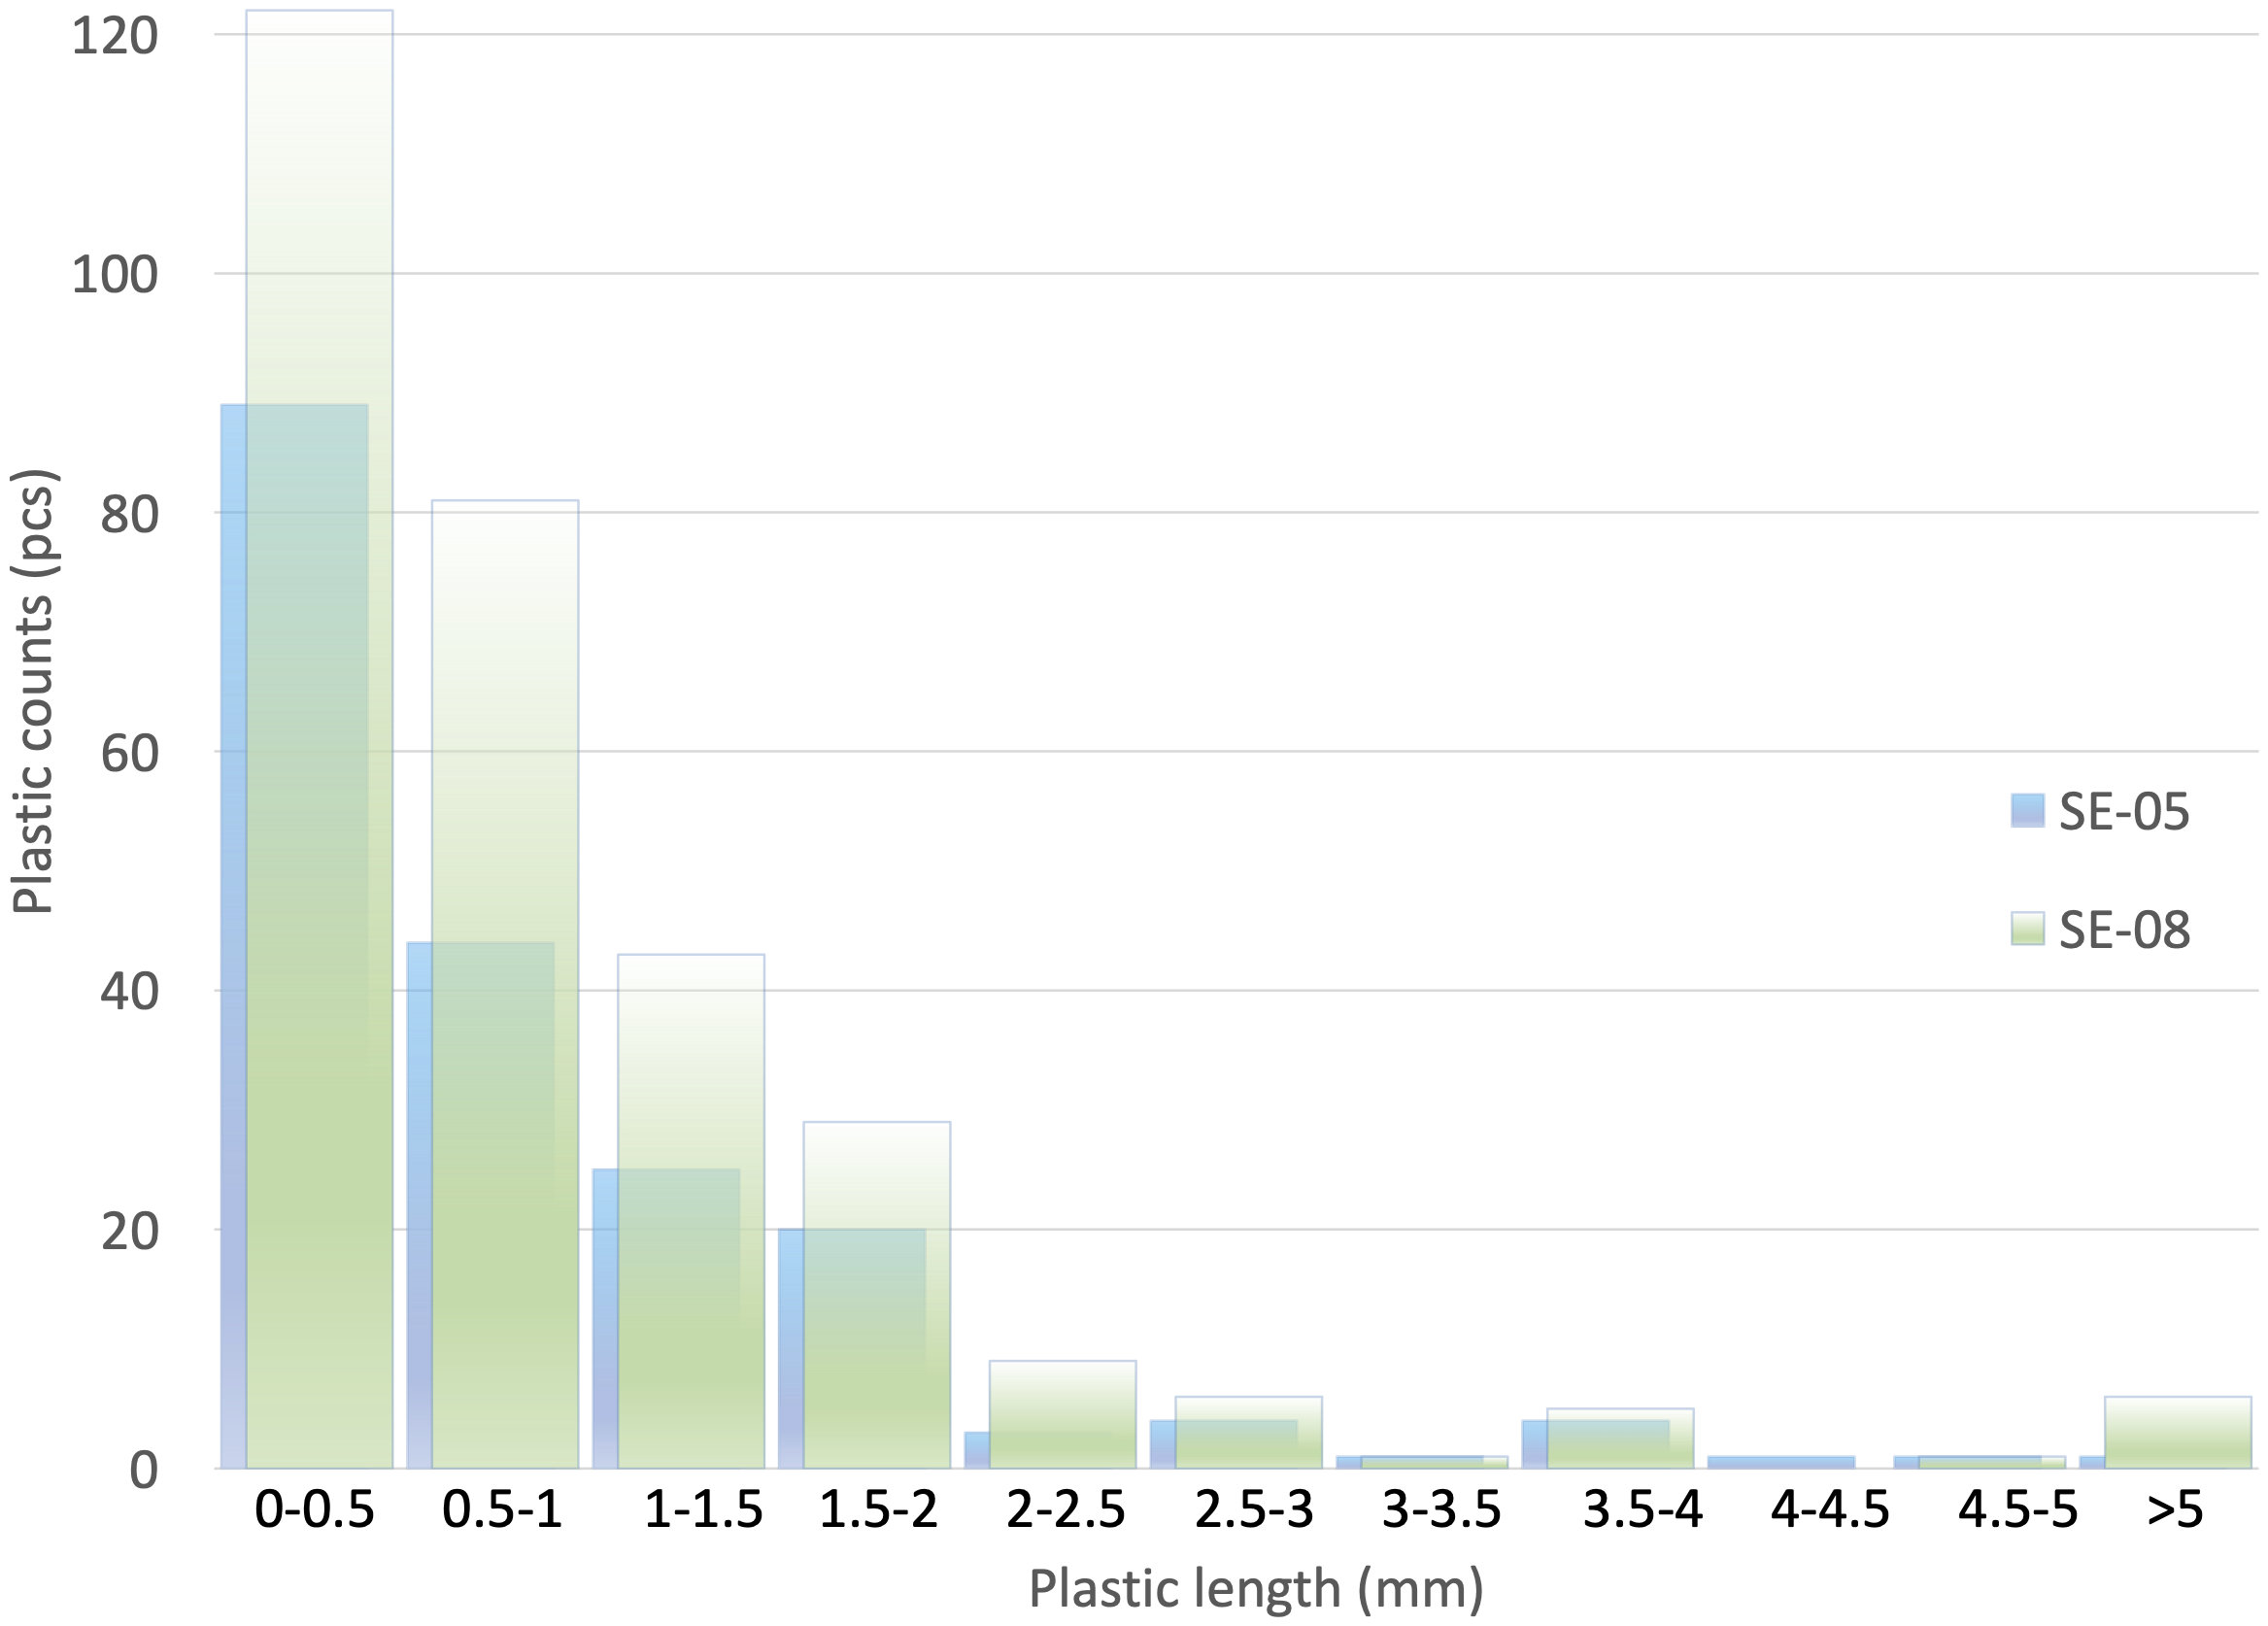
Size distribution of plastic pieces at SE-05 and SE-08. Smaller pieces are more abundant in the samples from both sampling sites.
The color of the analyzed MP varies significantly, encompassing blue, black, white, red, brown, green, yellow, translucent, purple, and orange (Figure 3). The most frequent colors are blue (67% of all samples, 76% of SE-05 samples, and 62% of SE-08 samples), and black (12% of all MPs, 9% of SE-05 samples, and 13% of SE-08 samples). Blue MPs are the most prevalent in both sediment cores of this study, which is in accordance with some (Stolte et al., 2015; Zheng et al., 2019; Zhou et al., 2021) but not with all previous studies (Jiang et al., 2018; Yaranal et al., 2021; Chubarenko et al., 2022). Plastic products used in household life or industry come in a variety of colors. Colors of plastic may play an important role in the plastic photoaging, and bluish plastics have been found to break down more easily than plastics in other colors (brown, red, orange, yellow, green, and purple) due to higher light energy transmitted to the blue plastic (Zhao et al., 2022). This observation explains the phenomenon that small-sized plastics in environment are commonly blue (Zhao et al., 2022).
Figure 3
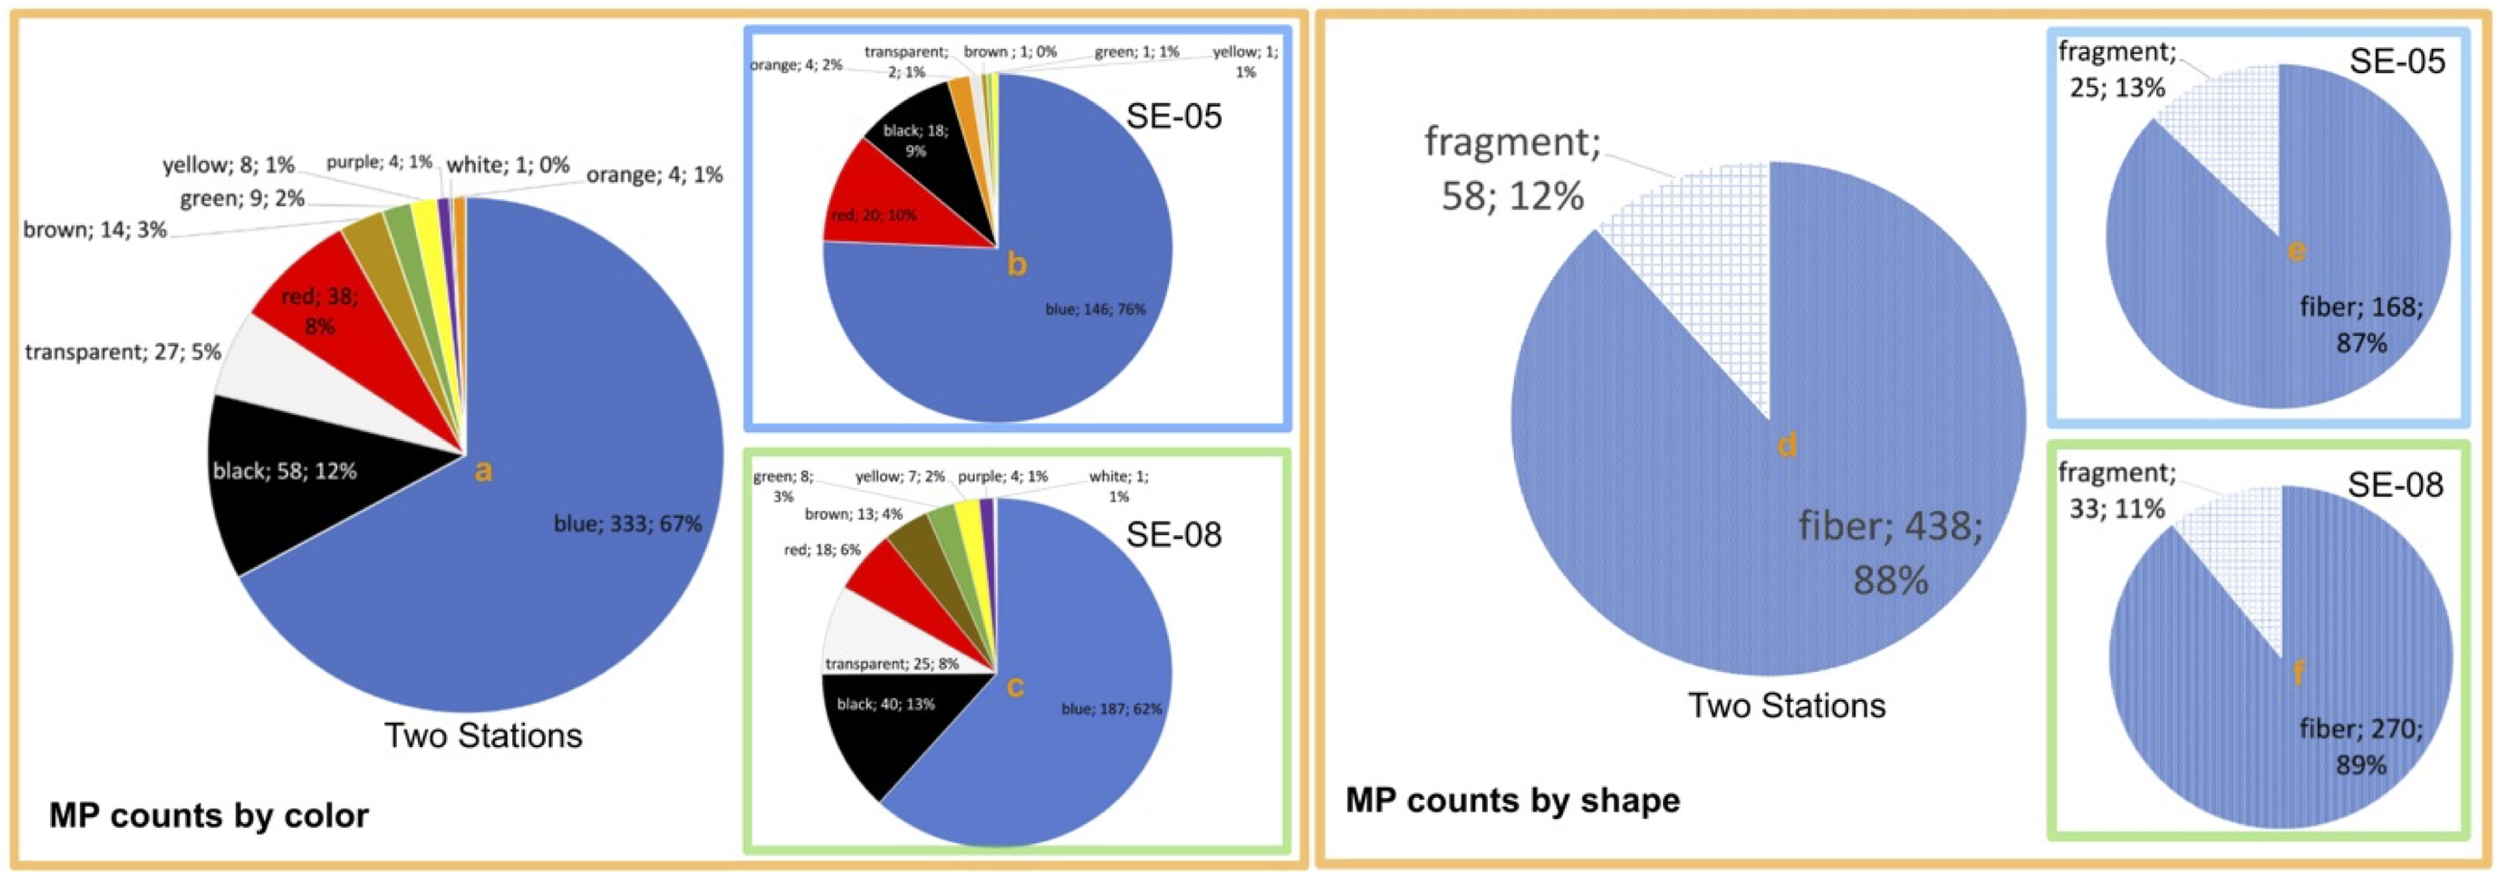
The microplastic (MP) distribution by color and shape. MP counts by color from all samples (a), SE-05 samples (b) and SE-08 samples (c). MP counts by shape from all samples (d), SE-05 samples (e) and SE-08 samples (f). The labels show color or shape, count and percentage.
Regarding the shape of the MP particles, it was found that fiber is the dominant form in both study sites (87% of SE-05’s samples and 89% of SE-08’s samples, shown in Figure 3). This finding is consistent with previous research in Baltic Sea sediments (Chubarenko et al., 2022; Zhou et al., 2021), and from other locations (Willis et al., 2017; Kooi and Koelmans, 2019) too. Microfibers have been reported as a major source of the MPs found in oceans, with domestic laundering being recognized as a major contributor (Singh et al., 2020). In just one wash, for instance, a single garment can produce more than 1900 microfibers (Browne et al., 2011), and it is estimated that 100–600 quadrillion pieces of microfibers are released from the washing of clothing in Europe every year (Hann et al., 2018). Once fibers are released into the environment, they tend to experience biofouling and increase settling velocity, resulting in sinking and deposition on the seafloor (Elizalde-Velázquez and Gómez-Oliván, 2021). The deep sea is statistically proven to be the ultimate terminus for synthetic fibers, implied by a set of data that spans from the coastal zone to central bottom depressions in the Baltic Sea (Chubarenko et al., 2022).
In Sweden, textile laundering has been identified as a major contributor to MP fiber emissions (Swedish Environmental Protection Agency, 2021). A study (Magnusson et al., 2016) of three Swedish wastewater treatment plants found that influent water can contain over 20,000 MP fibers per cubic meter. Although most fibers are retained during treatment, effluent still contains between 150 and 3,300 fibers per cubic meter. Wastewater treatment plants, while generally effective, may still serve as pathways for microfibers into the marine environment (Magnusson et al., 2016). Given the dense network of wastewater treatment facilities along the Baltic Sea coast (Schernewski et al., 2021), especially in the Stockholm region, it is plausible that urban effluents contribute significantly to the fiber-rich MP profiles observed in our sediment cores, particularly at SE-08.
The raw MP counts can be found in the Supplementary Data 1. No clear correlation was found between the depth and size, color or shape of plastic particles. They are very diverse, and a selection of MPs is shown in Figure 4 to illustrate the variety of colors and morphologies.
Figure 4
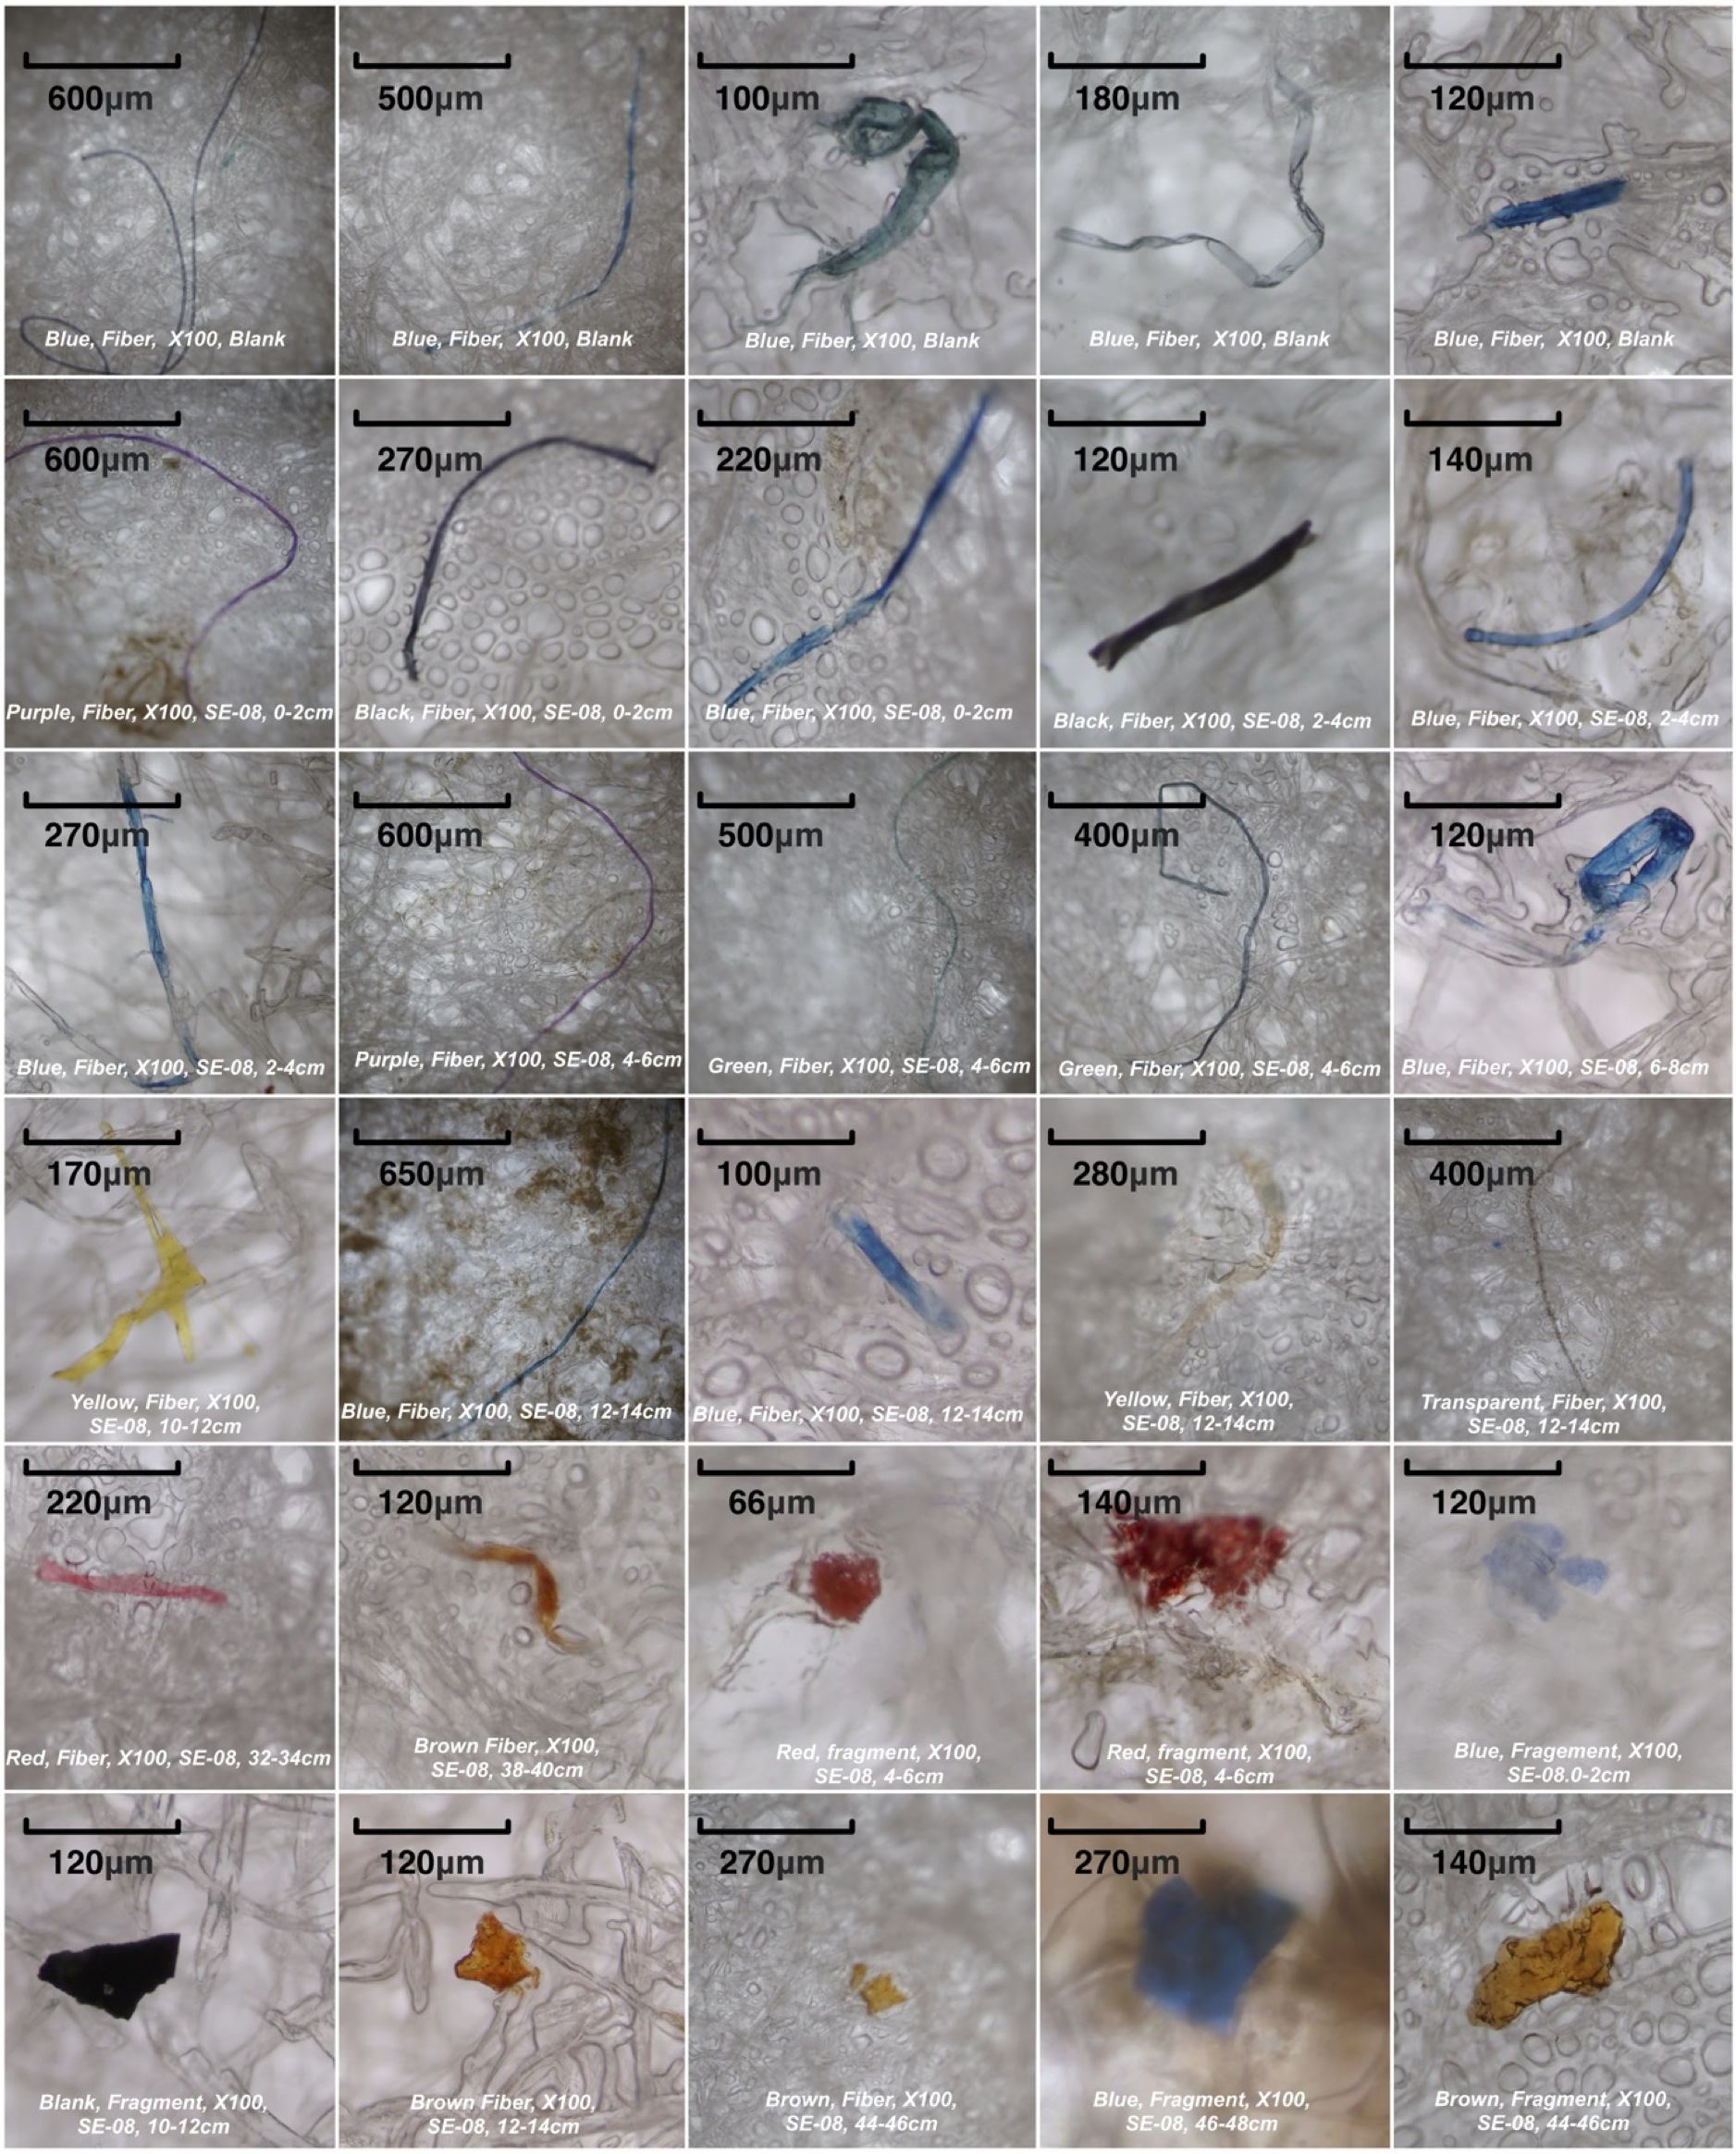
Images of selected microplastic (MP) specimens observed under the microscope. The various morphologies and colors of MPs in the analyzed sediment are depicted. Each image includes annotations indicating the color, shape, magnification, blank/sample, and depth of observation.
While visual identification under a microscope provided valuable insights into the size, color, and shape of MP particles, it is inherently limited in confirming polymer composition. To strengthen the reliability of MP identification, future studies could incorporate polymer characterization techniques, such as FTIR spectroscopy, on a subset of visually identified particles. This would reduce uncertainty in visual identification and offer a deeper understanding of polymer types and their environmental behavior.
3.2 Historical accumulation of microplastics in Baltic Sea sediments
In this study, SE-08 exhibited higher levels of MP contamination than SE-05. Considering both of the study sites are with similar sedimentation rates and characterized by fine-grained sediments and high organic matter content (Josefsson, 2022), one plausible explanation is the location of the sampling sites: SE-08 is closer to the shoreline and to Stockholm, whereas SE-05 is situated in the middle of the open sea (Figure 1). In addition, a major surface current passes over SE-08, transporting water from the Stockholm coastal area and potentially carrying plastic particles from urban sources (Karimova and Gade, 2016). Additional factors, such as the influence of bottom currents or shipping activities, may also contribute to the observed variations. However, due to practical constraints, these factors could not be thoroughly investigated in this study. Furthermore, analyzing additional sediment cores would be necessary to draw more robust conclusions about large-scale deposition patterns. Despite these limitations, the findings of this study provide valuable preliminary insights into the historical deposition of MPs in the central Baltic Sea.
In the study area, MPs were found at maximum burial depths of 33 cm in core SE-05 and 47 cm in core SE-08. The MPs found in the samples below those depths are considered to come from the operation (see Methods). The concentration of MP particles increases towards the seafloor (Figure 5; Supplementary Data 1), from zero to more than 2000 and 4000 pcs kg-DW-1 of sediment at the top 2 cm in cores SE-05 and SE-08, respectively, revealing their progressive accumulation over time. With a sediment accumulation rate of 1.03 cm yr-1, we assess that the base of the cores was deposited in the early 1960s, and that the MP accumulation started ca. 1974 in the western Gotland Basin (SE-08), ca. 1988 in the northern Baltic Proper (SE-05), and peaked at present-day in both sites (Figure 5). However, due to natural variability in sedimentation rates and potential sediment dynamics, the estimated onset of MP accumulation should be interpreted with caution. This trend is different from the observed for metal pollutants in the Baltic Sea in the same study locations, where Cd, Pb, and Zn concentrations peak in the 1980s and decrease till present-day owing to efforts to control emissions of those pollutants in the region (Shahabi-Ghahfarokhi et al., 2021b). This result supports the potential of MPs as stratigraphic markers in sediment profiles (Bancone et al., 2020).
Figure 5
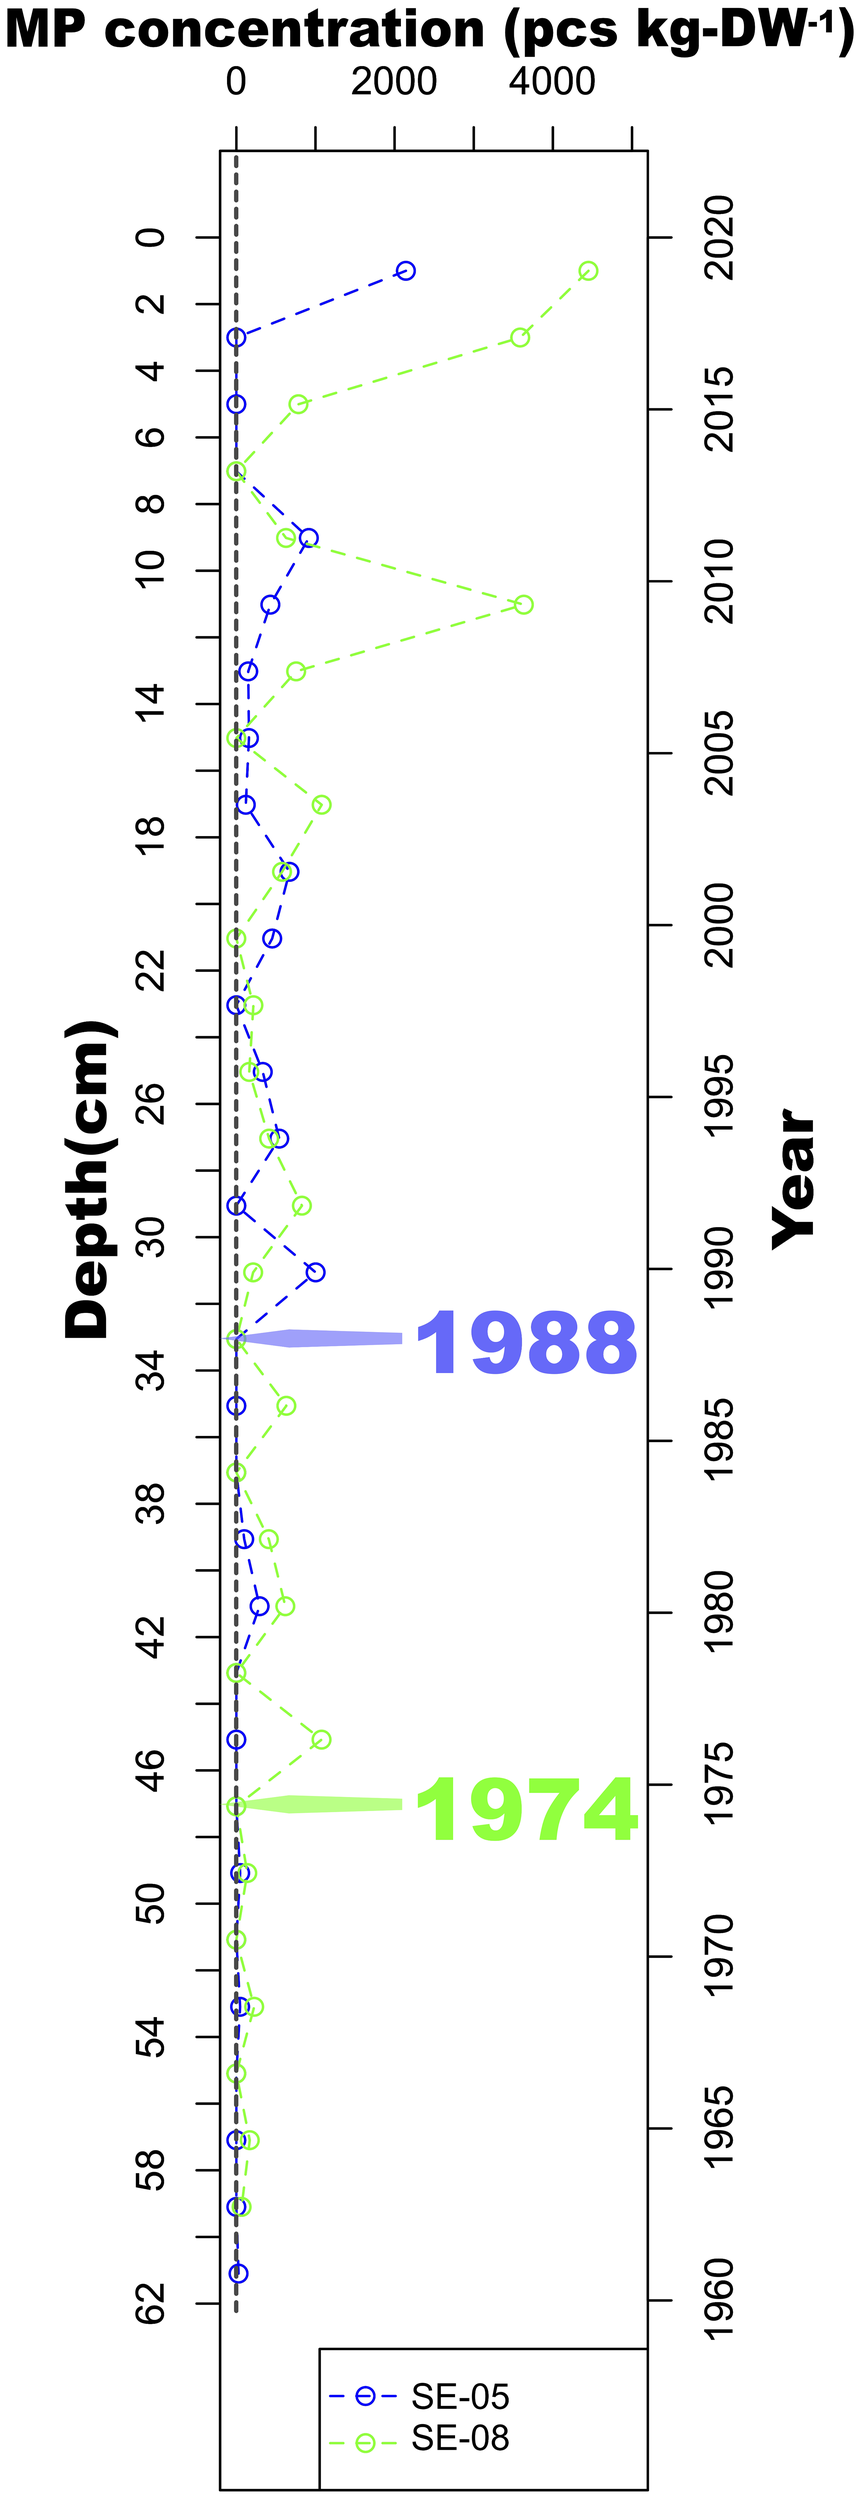
Number of microplastic (MP) particles per kilogram of sediment dry weight in the study cores SE-05 (northern Baltic Proper) and SE-08 (western Gotland Basin). The depth was converted to depositional year using a sediment accumulation rate of 1.03cm yr-1, which was obtained via radiometric dating of sediments in both locations (Josefsson, 2022) (SE-05 and SE-08). The green and blue arrows mark the approximate years in which MP started to accumulate in the two study cores.
The best fitting curves of MP concentrations (pcs kg-DW-1) with depth for both SE-05 and SE-08 are shown in Figure 6a. To account for the potential influence of human activities on MP pollution in our study area, the Swedish population was incorporated as a factor in our analysis instead of the total population of the Baltic Sea region. This is attributable to the fact that the total population of the entire Baltic Sea region grew at a relatively low rate of just 1.2% between 1990 and 2018 (ESPON, 2019), whereas the populations of Sweden and Stockholm increased by 19.1% and 42.8%, respectively, during the same period. This suggests that any increases in MP abundance, if linked to population size changes, are more likely to be associated with demographic shifts in Sweden rather than in the broader Baltic Sea region.
Figure 6
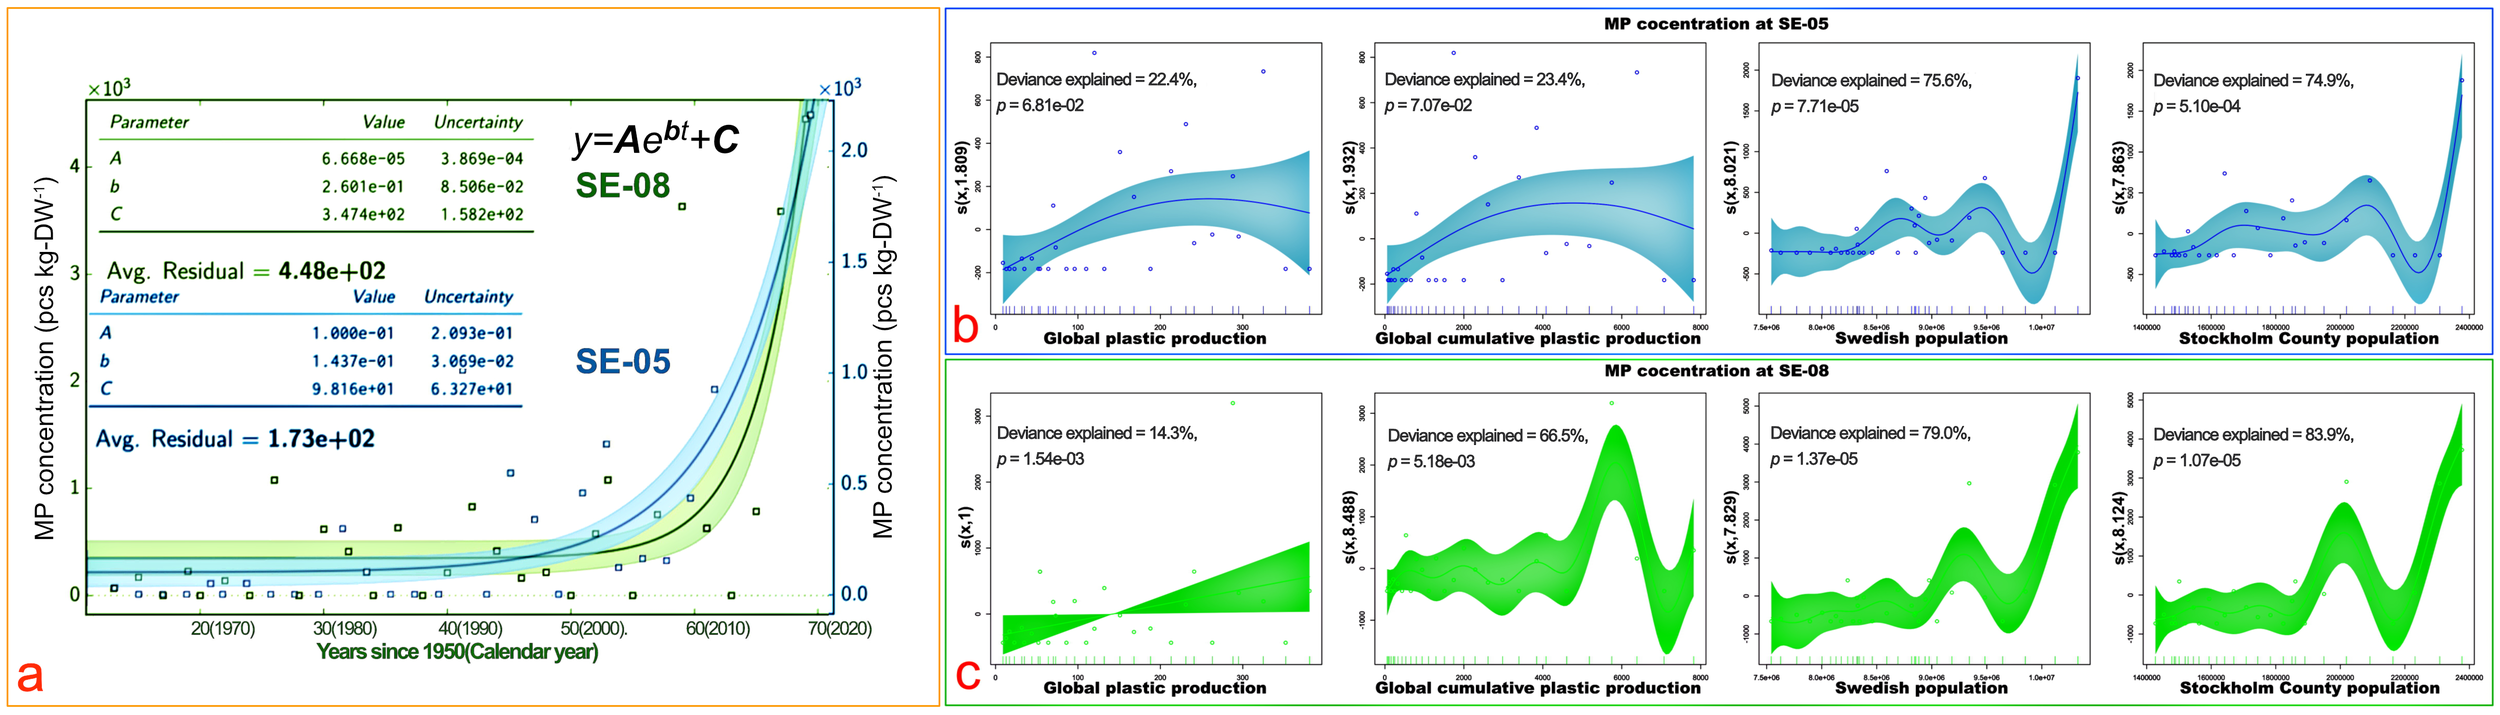
Microplastic (MP) chronological accumulation trends at study sites SE-05 and SE-08 (a) and plot of GAM analysis: splines of MP concentration to individual explanatory variable at both SE-05 (b) and SE-08 (c). The shaded areas (a–c) represent 95% confidence intervals. The scatter points are observatory data (a) or partial residuals (b, c). The lines on the X-axis show the distribution of data points (b, c). The estimated degrees of freedom for smoothed fits are indicated in parentheses on the y-axis (b, c). Deviance explained by the GAM models is displayed in each plot: up to 83.9% for Stockholm Country population, 79.0% for Swedish population, and lower values for global plastic production and cumulative plastic production.
All models used in the GAM analysis have k-index values greater than 1, indicating that the number of basis functions chosen is appropriate and there is no significant risk of overfitting. The GCV scores and edf values are also within reasonable ranges, further supporting the stability and reliability of the models (Supplementary Data 1). GAM plots (Figures 6b, c) further explain the variance of MP concentration distribution in the samples through splines of MP concentrations to each explanatory variable at both SE-05 (Figure 6b) and SE-08 (Figure 6c) according to the Generalized Additive Model (Kanhai et al., 2017; Liu et al., 2021; Meyerjürgens et al., 2022) (GAM, smooth functions; see Methods). The populations of both Sweden and Stockholm have stronger capacities to explain the variance of MP concentration than global plastic production and cumulative plastic production, contributing more to the variance in MP concentration at both sampling sites. Specifically, the deviance explained by the population of Sweden is 75.6% (p < 0.001) at SE-05 and 79% at SE-08 (p < 0.001). For the Stockholm population, the deviance explained is 74.9% at SE-05 (p < 0.001) and 83.9% at SE-08 (p < 0.001). In contrast, the deviance explained by global plastic production is much lower or unsignificant, at 22.4% at SE-05 (p > 0.05) and 14.3% at SE-08 (p < 0.005). Similarly, cumulative plastic production explains 23.4% of the deviance at SE-05 (p > 0.05) and 66.5% at SE-08 (p > 0.05).
Some studies have reported similar exponential patterns of increasing MP concentrations towards the surface layers of sediment profiles, for example, in the Kuwait Bay (Uddin et al., 2021), the Sakurada-bori Moat in Japan (Matsuguma et al., 2017), the Gulf of Thailand (Matsuguma et al., 2017), the Santa Barbara Basin in California (Brandon et al., 2019), and the Jiaozhou Bay in China (Zheng et al., 2020). Previously, the higher MP concentration in near-seafloor, present-day sediments has been correlated with the historical increase in plastic production (Brandon et al., 2019; Martin et al., 2020). Data from both Kuwait Bay (Uddin et al., 2021), Santa Barbara Basin in California (Brandon et al., 2019) as well as South China Sea (Chen et al., 2020) indicate that MPs started accumulating at these sites during the 1970s-1980s, which is roughly the same time as this study in the central Baltic Sea. Although plastic production began around 1950, it was not until the 1980s that global production started to accelerate (Geyer et al., 2017). Furthermore, synthetic fibers have been identified as a significant source of MPs in the ocean (Boucher and Friot, 2017), and the demand for synthetic fibers began to rise rapidly from 1970 onwards, eventually surpassing that of natural fibers by 2000 (Mills, 2011). Our findings on the historical MP accumulation in Baltic Sea sediments are strongly consistent with the development of the synthetic fiber market, with MPs first appearing in the Baltic Sea sediment in the mid-1970s (SE-08) and late 1980s (SE-05), and concentrations beginning to increase significantly during the 2000s-2010s.
There are also several publications (Nel et al., 2017; Brandon et al., 2019; Jorquera et al., 2022) which demonstrate how MP accumulation trends in sea sediments correlate with increased population densities. For example, the study in the Santa Barbara Basin (Brandon et al., 2019) points to a close relationship between the increase in coastal population and plastic accumulation in sea sediments. Similarly, in our study, the Stockholm County population contributes to the variance of MP concentration to a large extent (75% at SE-05, 84% at SE-08; Figures 6b, 6c). Numerical modelling work corroborates our findings by indicating that local onshore sources are important for the MP accumulation in the deep Baltic Sea. A recent study found, for instance, that different types of MPs, notably from tire wear and some specific household MPs derived from effluents of wastewater treatment plants, can efficiently be transported from coastal to offshore areas and reach the bottom of deep Baltic Sea basins (Murawski et al., 2022).
Based on the fitting equations of both study sites (Figure 6a), we estimated the future MP concentration in the surface sediments (Methods). It assumes that i) there will be no effective prevention or treatment measures induced in plastic management and production, ii) that the population growth will continue along the present-day trend, and iii) that the sedimentation rate will be the same. By 2030, for instance, the MP accumulation in the top 2 cm are projected to reach up to 9930 pcs kg-DW-1 at SE-05 (northern Baltic Proper) and an alarming 72,924 pcs kg-DW-1 at SE-08 (western Gotland Basin). Station SE-05, even located in the middle of the open sea, will eventually reach present-day contamination levels of one heavily polluted beach site in the South China Sea (Qiu et al., 2015). The prediction serves as a warning to society and provides a compelling rationale for increasing policy efforts to control MP discharge and to support more scientific research in this area.
3.3 Present-day seafloor occurrence of microplastics in Baltic Sea sediments
To assess the present-day level of MP abundance, we compared the concentration observed in the top 2 cm of our two cores with findings from other publications from the Baltic Sea area and other marine environments, as shown in Figure 7 (more details are included in Supplementary Data 1). While we primarily focused on studies involving sediments less than 3 cm in depth, we also included some publications reporting MPs in deeper sediments, owing to the lack of relevant data from certain regions, such as the Baltic Sea region (Chubarenko et al., 2022) (covering depths of 2–7 cm) and Arctic Ocean (top 5 cm) (Bergmann et al., 2017; Tekman et al., 2020; Fang et al., 2022). It is important to note that various factors may contribute to differences in MP concentrations reported across studies. Differences in sampling strategies, analytical methods, and sediment depths can significantly influence the results. Additionally, the sampling times of the comparative studies differ, spanning from 2012 to 2020, which may also limit the interpretation of the comparison.
Figure 7
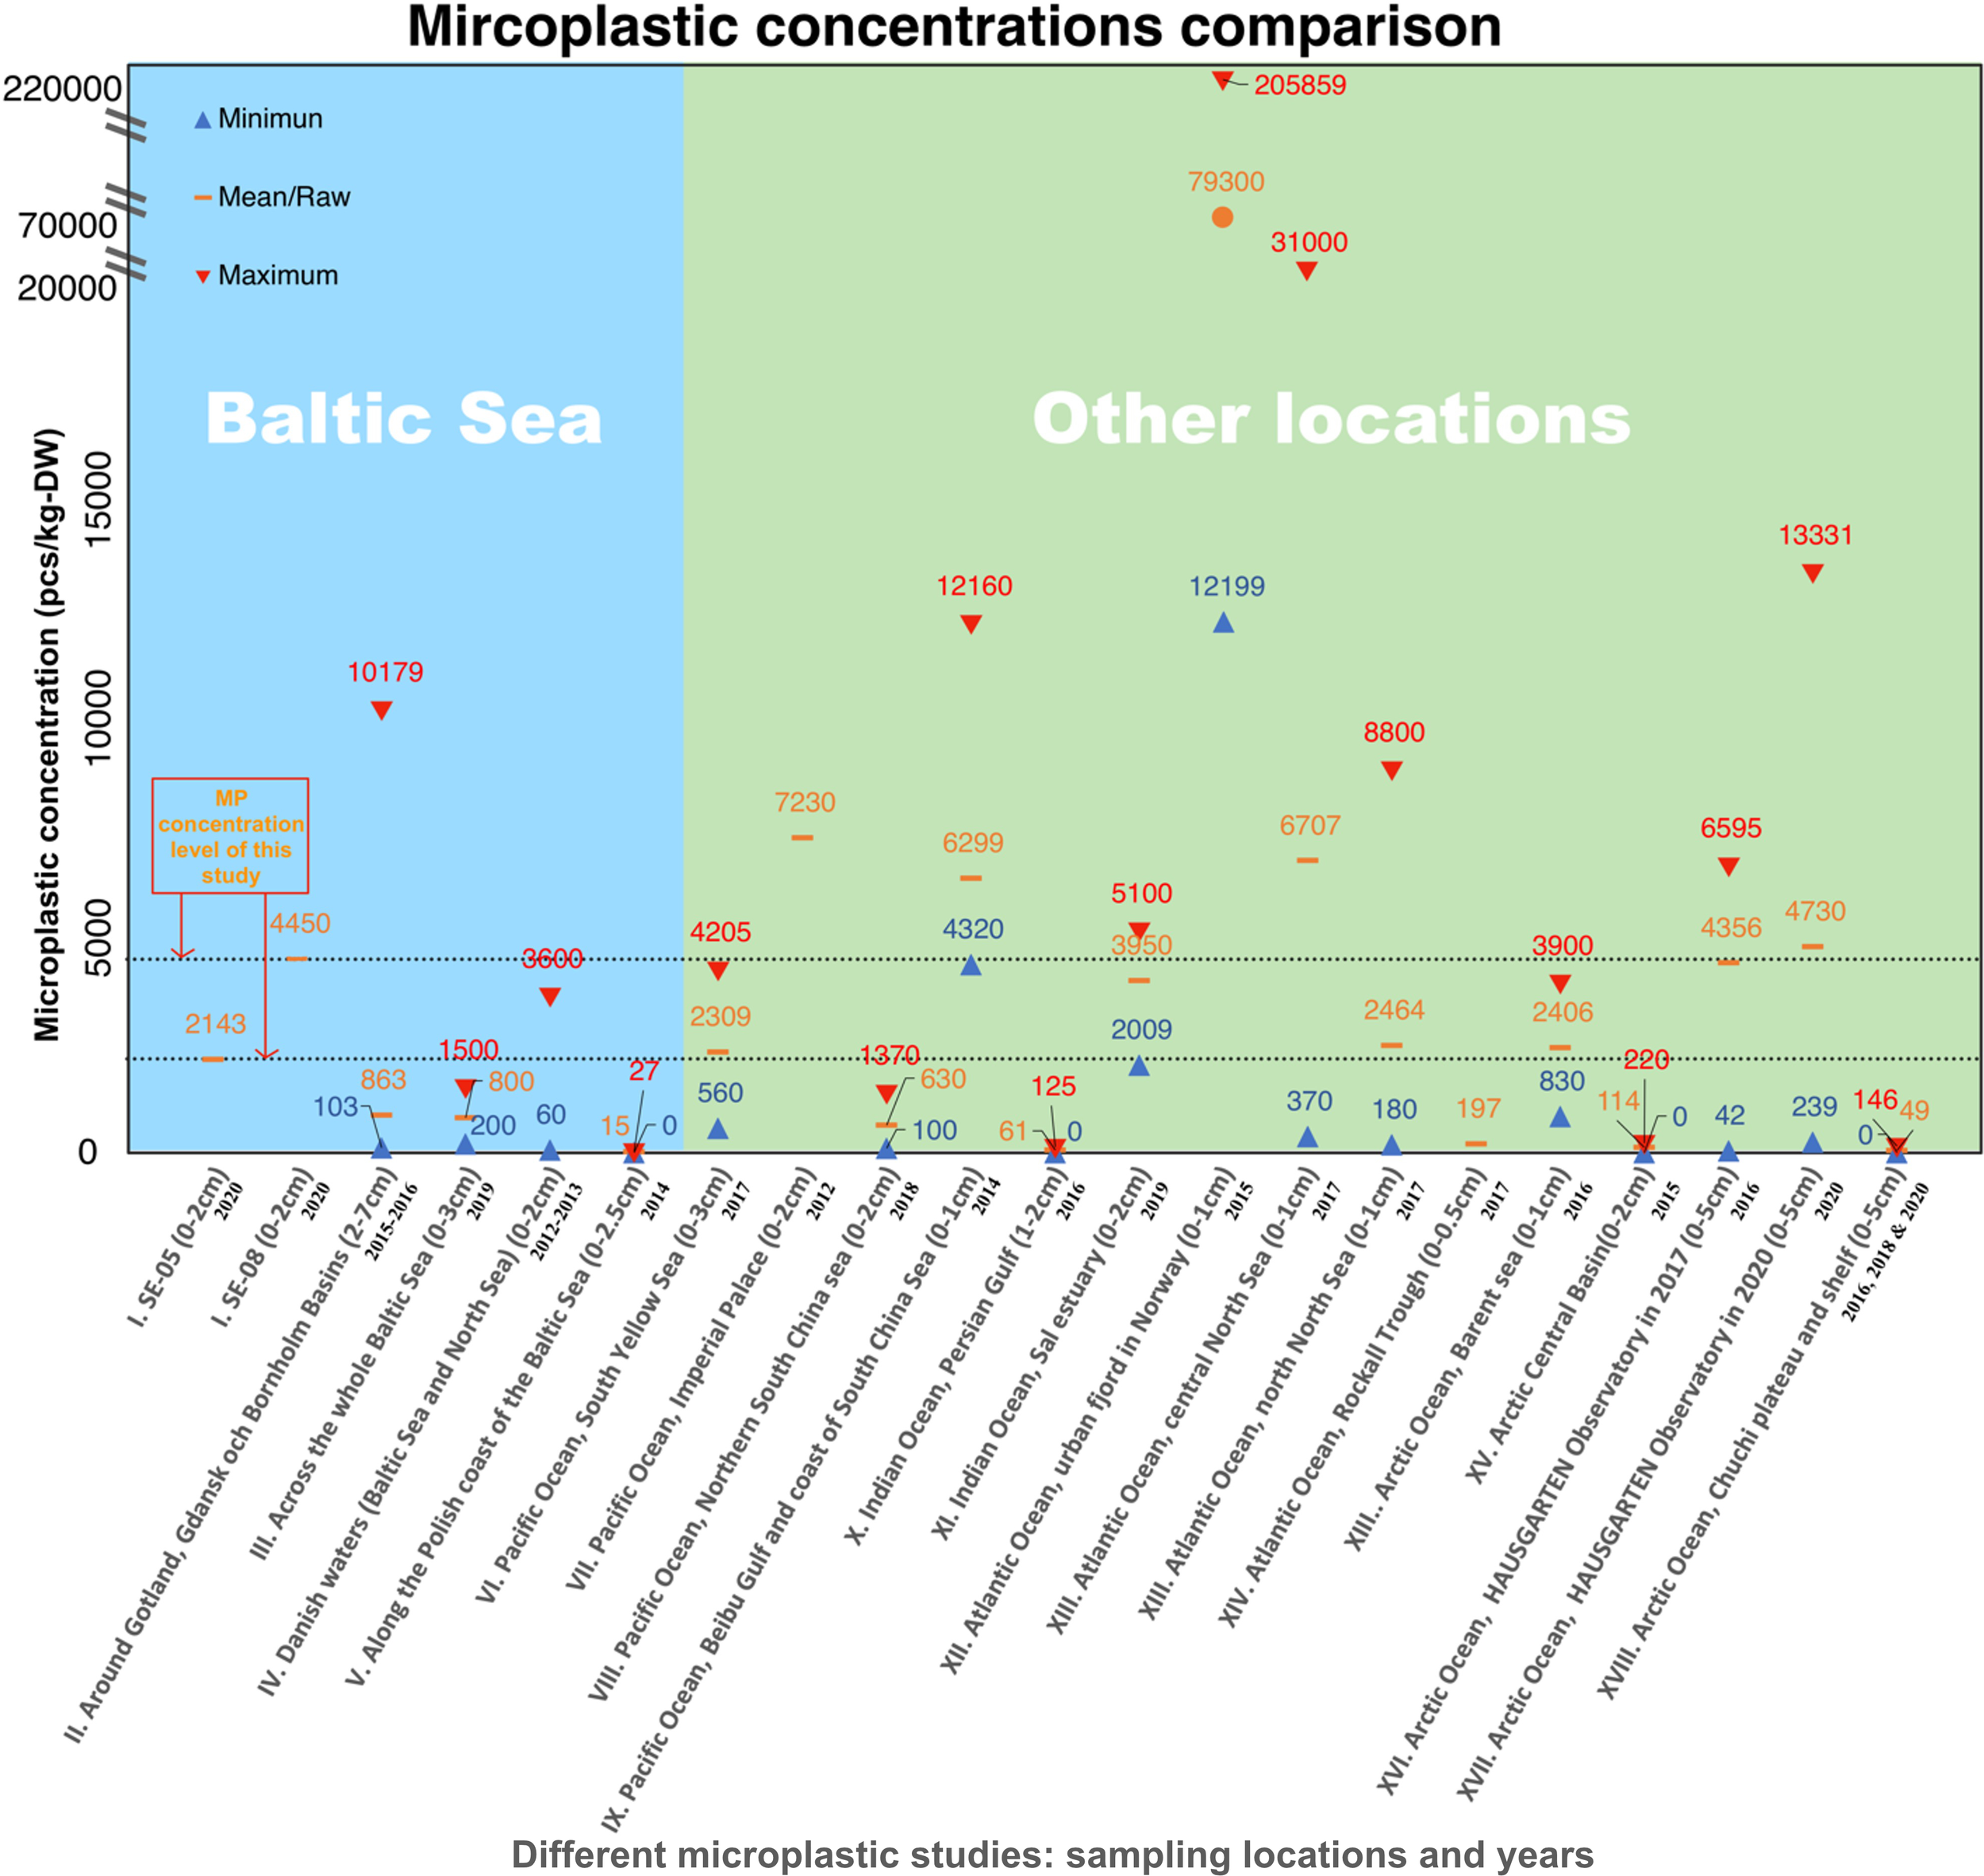
Comparison of microplastic (MP) concentrations in the near-seafloor sediment in Baltic Sea and other sea areas from the present study and previous studies. The figure shows the mean or raw values of MP concentrations and/or the range. The Roman numbers beside the X-axis show the reference of different studies as well as the sampling depth and sampling year. Source of the data: I from the present study, II from Chubarenko, I. et al (Chubarenko et al., 2022), III from Zhou, Q., et al (Zhou et al., 2021), IV from Strand, J., et al (Strand et al., 2013), V from Graca, B., et al (Graca et al., 2017), VI from Wang J., et al (Wang et al., 2019), VII from Matsuguma, Y., et al (Matsuguma et al., 2017), VIII from Chen M., et al (Chen et al., 2020), IX from Qiu, Q., et al (Qiu et al., 2015), X from Naji A., et al (Naji et al., 2017), XI from Saha M., et al (Saha et al., 2021), XII from Haave, M., et al (Haave et al., 2019), XIII from Møskeland, T., et al (Møskeland et al., 2018), XIV from Courtene-Jones, W., et al (Courtene-Jones et al., 2020), XV from La Daana, K.K., et al (La Daana et al., 2019), XVI from Bergmann, M., et al (Bergmann et al., 2017), XVII from Tekman M.B., et al (Tekman et al., 2020), XVIII from Fang C., et al (Fang et al., 2022).The results of this study are marked in box with red frame and the dotted lines indicate the present study’s MP concentrations level at SE-05 and SE-08.
The MP abundance level in our near-seafloor sediment cores (2143 pcs kg-DW-1 at SE-05 and 4450 pcs kg-DW-1 at SE-08) is comparable in magnitude to the MP concentrations identified in most other studies from the Baltic Sea, as illustrated in the left-hand side of Figure 7. The variability between individual studies and samples is large, though. For instance, one study (Chubarenko et al., 2022) that examined 53 samples of the upper 2–7 cm sediment from the Gotland, Gdansk, and Bornholm Basins in 2015 - 2016, showed an average MP concentration of 863 ± 1371 pcs kg-DW-1, but with a min-max span that covers 2 orders of magnitude; 103 – 10,179 pcs kg-DW-1. The MP concentration in 37 out of the 53 samples was between 100 and 1000 pcs kg-DW-1, and 50 of the samples contained below 2000 pcs kg-DW-1. Another study (Zhou et al., 2021) that sampled the top 3 cm of sediment at 11 sampling stations in 2019 across the whole Baltic Sea found an average MP concentration of 800 pcs kg-DW-1, ranging from 200 to 1500 pcs kg-DW-1. In a study (Strand et al., 2013) that examined the top 2 cm sediments from 21 stations in the Danish waters of the Baltic and North Seas during 2012 - 2013, highly variable MP concentrations were reported, ranging from 60 to 3600 pcs kg-DW-1, with no mean value indicated. Most of the MP concentrations found (in 16 of the 21 stations) were below 500 pcs kg-DW-1. While some examples in the literature suggest low MP accumulation in recent sediment deposits in certain areas of the Baltic Sea, the lowest concentration reported (15 ± 10 pcs kg-DW-1) comes from a study (Graca et al., 2017) that analyzed sediments (top 2.5 cm) from four shallow and two deep-water stations along the Polish coast of the Baltic Sea in 2014. The study revealed minimum and maximum values of 0 and 27 pcs kg-DW-1, respectively.
The right-hand part of Figure 7 shows data from other oceans and seas worldwide, and it also points to a ubiquitous MP abundance of today’s marine environment, but to various degrees according to different studies. While the average number of MP pieces found per kilogram of dry sediment is generally below ten thousand, concentrations exceeding one hundred thousand have been reported. The very high MP concentration, 20,5859 pcs kg-DW-1, was found in the top 1 cm sediment from the urban fjord in Norway in 2017 (Haave et al., 2019), with 24,953 pcs kg-DW-1 larger than 50 μm. The study (Haave et al., 2019) on the Norwegian Continental Shelf shows how the top 1 cm sediment of 35 cores contains MPs in the order of 4900 ± 6200 pcs kg-DW-1, ranging from 180 - 31,000 pcs kg-DW-1. Even in the studies (Bergmann et al., 2017; Tekman et al., 2020; Fang et al., 2022) in Arctic Ocean during 2016 - 2020, MPs have accumulated in the upper 5 cm sediments with concentrations ranging from 0 to 13,331 pcs kg-DW-1. Moreover, the MP concentrations comparison also shows that the MP concentrations in the upper 2 cm of our samples are comparable in magnitude in a wider geographical context.
4 Conclusion
Our study has unveiled, for the first time, that there is a progressive increase in microplastic (MP) accumulation in sediments of the central Baltic Sea. This accumulation became particularly noticeable in the western Gotland Basin (SE-08) in the mid-1970s and in the northern Baltic Proper (SE-05) in the late 1980s. The study further indicates that this accumulation has grown exponentially up to present-day, with local population growth in Stockholm County accounting for over 70% of the temporal variance in MP concentration at the study sites. Importantly, our study validates the method for monitoring the temporal accumulation of MPs through sediment analysis. This method provides a valuable tool for assessing the effectiveness of future measures aimed at controlling MP emissions in the marine environment. In addition, chronological studies of this kind, which track the accumulation of MPs from zero to present-day levels, are crucial for conducting an accurate inventory of total MP pollution in the marine environment.
To reduce MP emissions, tighter waste management and improved wastewater treatment are recommended, with particular attention to controlling microfiber release from laundry. In addition, these sediment-based data can contribute to marine policy frameworks such as the HELCOM monitoring guidelines and the Marine Strategy Framework Directive (MSFD) by informing local baseline assessments, identifying pollution hotspots, and guiding monitoring strategies.
Statements
Data availability statement
The original contributions presented in the study are included in the article/Supplementary Material. Further inquiries can be directed to the corresponding author.
Author contributions
CC: Data curation, Investigation, Methodology, Writing – review & editing, Conceptualization, Writing – original draft, Project administration, Visualization, Validation, Formal Analysis. AA: Formal Analysis, Funding acquisition, Data curation, Validation, Supervision, Writing – review & editing. SS: Writing – review & editing, Investigation, Conceptualization. MR: Conceptualization, Investigation, Writing – review & editing. SJ: Writing – review & editing, Investigation. LA: Methodology, Formal Analysis, Writing – review & editing. MK: Formal Analysis, Investigation, Validation, Supervision, Funding acquisition, Conceptualization, Writing – review & editing.
Funding
The author(s) declare financial support was received for the research and/or publication of this article. The research was initiated through a grant from the Geological Survey of Sweden (SGU) [grant 36-2033/2018] and was further supported by Linnaeus University’s initiative Knowledge Environment Water (Kunskapsmiljö Vatten). The cores were collected during an environmental monitoring campaign financed by the Swedish Environmental Protection Agency and the Swedish Agency for Marine and Water Management.
Conflict of interest
The authors declare that the research was conducted in the absence of any commercial or financial relationships that could be construed as a potential conflict of interest.
Generative AI statement
The author(s) declare that no Generative AI was used in the creation of this manuscript.
Any alternative text (alt text) provided alongside figures in this article has been generated by Frontiers with the support of artificial intelligence and reasonable efforts have been made to ensure accuracy, including review by the authors wherever possible. If you identify any issues, please contact us.
Publisher’s note
All claims expressed in this article are solely those of the authors and do not necessarily represent those of their affiliated organizations, or those of the publisher, the editors and the reviewers. Any product that may be evaluated in this article, or claim that may be made by its manufacturer, is not guaranteed or endorsed by the publisher.
Supplementary material
The Supplementary Material for this article can be found online at: https://www.frontiersin.org/articles/10.3389/fmars.2025.1630780/full#supplementary-material
References
1
Amato-Lourenço L. F. Carvalho-Oliveira R. Ribeiro Júnior G. dos Santos Galvão L. Ando R. A. Mauad T. (2021). Presence of airborne microplastics in human lung tissue. J. Hazardous Materials416, 126124. doi: 10.1016/j.jhazmat.2021.126124
2
Anbumani S. Kakkar P. (2018). Ecotoxicological effects of microplastics on biota: a review. Environ. Sci. pollut. Res.25, 14373–14396. doi: 10.1007/s11356-018-1999-x
3
Andersen J. H. Korpinen S. Laamanen M. Wolpers U. Claussen U. Durkin M. et al . (2010). Ecosystem Health of the Baltic Sea. HELCOM Initial Holistic Assessment 2003-2007 Vol. 122Baltic Sea Environmental Proceedings No. 122. (Helsinki, Finland: Helsinki Commission (HELCOM)).
4
Auta H. S. Emenike C. U. Fauziah S. H. (2017). Distribution and importance of microplastics in the marine environment: a review of the sources, fate, effects, and potential solutions. Environ. Int.102, 165–176. doi: 10.1016/j.envint.2017.02.013
5
Bancone C. E. P. Turner S. D. Ivar do Sul J. A. Rose N. L. (2020). The paleoecology of microplastic contamination. Front. Environ. Sci.8. doi: 10.3389/fenvs.2020.574008
6
Belivermiş M. Kılıç Ö. Sezer N. Sıkdokur E. Güngör N. D. Altuğ G. (2021). Microplastic inventory in sediment profile: A case study of Golden Horn Estuary, Sea of Marmara. Mar. pollut. Bull.173, 113117. doi: 10.1016/j.marpolbul.2021.113117
7
Bergmann M. Wirzberger V. Krumpen T. Lorenz C. Primpke S. Tekman M.B. et al . (2017). High quantities of microplastic in Arctic deep-sea sediments from the HAUSGARTEN observatory. Environ. Sci. Technol.51, 11000–11010. doi: 10.1021/acs.est.7b03331
8
Bhagat J. Zang L. Nishimura N. Shimada Y. (2020). Zebrafish: An emerging model to study microplastic and nanoplastic toxicity. Sci. Total Environ.728, 138707. doi: 10.1016/j.scitotenv.2020.138707
9
Booth A. M. Sørensen L. (2020). Microplastic fate and impacts in the environment. Handb. Microplastics Environment 1-24. doi: 0.1007/978-3-030-10618-8_29-1
10
Borg H. Jonsson P. (1996). Large-scale metal distribution in Baltic Sea sediments. Mar. pollut. Bull.32, 8–21. doi: 10.1016/0025-326X(95)00103-T
11
Boucher J. Friot D. (2017). Primary microplastics in the oceans: a global evaluation of sources (Switzerland: Iucn Gland).
12
Brandon J. A. Jones W. Ohman M. D. (2019). Multidecadal increase in plastic particles in coastal ocean sediments. Sci. Adv.5, eaax0587. doi: 10.1126/sciadv.aax0587
13
Browne M. A. Crump P. Niven S. J. Teuten E. Tonkin A. Galloway T. et al . (2011). Accumulation of microplastic on shorelines woldwide: sources and sinks. Environ. Sci. Technol.45, 9175–9179. doi: 10.1021/es201811s
14
Campanale C. Massarelli C. Savino I. Locaputo V. Uricchio V. F. (2020). A detailed review study on potential effects of microplastics and additives of concern on human health. Int. J. Environ. Res. Public Health17, 1212. doi: 10.3390/ijerph17041212
15
Charlton-Howard H. S. Bond A. L. Rivers-Auty J. Lavers J. L. (2023). ‘Plasticosis’: Characterising macro-and microplastic-associated fibrosis in seabird tissues. J. Hazardous Materials450, 131090. doi: 10.1016/j.jhazmat.2023.131090
16
Chen M. Du M. Jin A. Chen S. Dasgupta S. Li J. et al . (2020). Forty-year pollution history of microplastics in the largest marginal sea of the western Pacific. Geochemical Perspect. Lett.13, 42–47. doi: 10.7185/geochemlet.2012
17
Cheng Y.-L. Zhang R. Tisinger L. Cali S. Yu Z. Chen H. Y. et al . (2022). Characterization of microplastics in sediment using stereomicroscopy and laser direct infrared (LDIR) spectroscopy. Gondwana Res.108, 22–30. doi: 10.1016/j.gr.2021.10.002
18
Chubarenko I. Esiukova E. Zobkov M. Isachenko I. (2022). Microplastics distribution in bottom sediments of the Baltic Sea Proper. Mar. pollut. Bull.179, 113743. doi: 10.1016/j.marpolbul.2022.113743
19
Cole M. Lindeque P. Halsband C. Galloway T. S. (2011). Microplastics as contaminants in the marine environment: a review. Mar. pollut. Bull.62, 2588–2597. doi: 10.1016/j.marpolbul.2011.09.025
20
Courtene-Jones W. Quinn B. Ewins C. Gary S. F. Narayanaswamy B. E. (2020). Microplastic accumulation in deep-sea sediments from the Rockall Trough. Mar. pollut. Bull.154, 111092. doi: 10.1016/j.marpolbul.2020.111092
21
Dehaut A. Hermabessiere L. Duflos G. (2020). Microplastics detection using pyrolysis-GC/MS-based methods. Handb. Microplastics Environ., 1–35. doi: 10.1007/978-3-030-39041-9_27
22
Dimante-Deimantovica I. Saarni S. Barone M. Buhhalko N. Stivrins N. Suhareva N. et al . (2024). Downward migrating microplastics in lake sediments are a tricky indicator for the onset of the Anthropocene. Sci. Adv.10, eadi8136. doi: 10.1126/sciadv.adi8136
23
Do A. T. N. Ha Y. Kwon J.-H. (2022). Leaching of microplastic-associated additives in aquatic environments: a critical review. Environ. pollut.305, 119258. doi: 10.1016/j.envpol.2022.119258
24
Elizalde-Velázquez G. A. Gómez-Oliván L. M. (2021). Microplastics in aquatic environments: A review on occurrence, distribution, toxic effects, and implications for human health. Sci. Total Environ.780, 146551. doi: 10.1016/j.scitotenv.2021.146551
25
Eriksen M. Cowger W. Erdle L. M. Coffin S. Villarrubia-Gómez P. Moore C. J. et al . (2014). Plastic Pollution in the World’s Oceans: More than 5 Trillion Plastic Pieces Weighing over 250,000 Tons Afloat at Sea. PlLoS One9, e111913. doi: 10.1371/journal.pone.0111913
26
Eriksen M. Cowger W. Erdle L.M. Coffin S. Villarrubia-Gómez P. Moore C. J. et al . (2023). A growing plastic smog, now estimated to be over 170 trillion plastic particles afloat in the world’s oceans—Urgent solutions required. PloS One18, e0281596. doi: 10.1371/journal.pone.0281596
27
Esiukova E. Zobkov M. Chubarenko I. (2020). Data on microplastic contamination of the Baltic Sea bottom sediment samples in 2015-2016. Data Brief28, 104887. doi: 10.1016/j.dib.2019.104887
28
ESPON (2019). BT2050 - Territorial Scenarios for the Baltic Sea Region 2050, Main report. (Luxembourg: ESPON).
29
Fang C. Zhang Y. Zheng R. Hong F. Zhang M. Zhang R. et al . (2022). Spatio-temporal variation of microplastic pollution in the sediment from the Chukchi Sea over five years. Sci. Total Environ.806, 150530. doi: 10.1016/j.scitotenv.2021.150530
30
Feistel R. Nausch G. Wasmund N. (2008). State and evolution of the Baltic Sea, 1952-2005: a detailed 50-year survey of meteorology and climate, physics, chemistry, biology, and marine environment (Hoboken, NJ, USA: John Wiley & Sons).
31
Fok L. Cheung P. K. Tang G. Li W. C. (2017). Size distribution of stranded small plastic debris on the coast of Guangdong, South China. Environ. pollut.220, 407–412. doi: 10.1016/j.envpol.2016.09.079
32
Frere L. Paul-Pont I. Rinnert E. Petton S. Jaffré J. Bihannic I. et al . (2017). Influence of environmental and anthropogenic factors on the composition, concentration and spatial distribution of microplastics: a case study of the Bay of Brest (Brittany, France). Environ. pollut.225, 211–222. doi: 10.1016/j.envpol.2017.03.023
33
Frias J. Pagter E. Nash R. O'Connor I. Carretero O. Filgueiras A. et al . (2018). Standardised protocol for monitoring microplastics in sediments. Deliverable4.2.
34
Gewert B. Ogonowski M. Barth A. MacLeod M. (2017). Abundance and composition of near surface microplastics and plastic debris in the Stockholm Archipelago, Baltic Sea. Mar. pollut. Bull.120, 292–302. doi: 10.1016/j.marpolbul.2017.04.062
35
Geyer R. Jambeck J. R. Law K. L. (2017). Production, use, and fate of all plastics ever made. Sci. Adv.3, e1700782. doi: 10.1126/sciadv.1700782
36
Graca B. Szewc K. Zakrzewska D. Dołęga A. Szczerbowska-Boruchowska M. (2017). Sources and fate of microplastics in marine and beach sediments of the Southern Baltic Sea—a preliminary study. Environ. Sci. pollut. Res.24, 7650–7661. doi: 10.1007/s11356-017-8419-5
37
Grause G. Kuniyasu Y. Chien M.-F. Inoue C. (2021). Separation of microplastic from soil by centrifugation and its application to agricultural soil. Chemosphere288, 132654. doi: 10.1016/j.chemosphere.2021.132654
38
Haave M. Lorenz C. Primpke S. Gerdts G. (2019). Different stories told by small and large microplastics in sediment-first report of microplastic concentrations in an urban recipient in Norway. Mar. pollut. Bull.141, 501–513. doi: 10.1016/j.marpolbul.2019.02.015
39
Hahladakis J. N. (2020). Delineating the global plastic marine litter challenge: clarifying the misconceptions. Environ. Monit. Assess.192, 1–11. doi: 10.1007/s10661-020-8202-9
40
Hann S. Sherrington C. Jamieson O. Hickman M. Kershaw P. Bapasola A. et al . (2018). Investigating options for reducing releases in the aquatic environment of microplastics emitted by (but not intentionally added in) products. Rep. DG Environ. Eur. Commission335.
41
Harris P. T. (2020). The fate of microplastic in marine sedimentary environments: A review and synthesis. Mar. pollut. Bull.158, 111398. doi: 10.1016/j.marpolbul.2020.111398
42
Haseler M. Balciunas A. Hauk R. Sabaliauskaite V. Chubarenko I. Ershova A. et al . (2020). Marine litter pollution in Baltic Sea beaches–application of the sand rake method. Front. Environ. Sci.8. doi: 10.3389/fenvs.2020.599978
43
Helcom (2018). State of the Baltic Sea–Second HELCOM holistic assessment 2011–2016.
44
Hidalgo-Ruz V. Gutow L. Thompson R. C. Thiel M. (2012). Microplastics in the marine environment: a review of the methods used for identification and quantification. Environ. Sci. Technol.46, 3060–3075. doi: 10.1021/es2031505
45
Hoffmann W. A. Poorter H. (2002). Avoiding bias in calculations of relative growth rate. Ann. Bot.90, 37–42. doi: 10.1093/aob/mcf140
46
Horn D. A. Granek E. F. Steele C. L. (2020). Effects of environmentally relevant concentrations of microplastic fibers on Pacific mole crab (Emerita analoga) mortality and reproduction. Limnology Oceanography Lett.5, 74–83. doi: 10.1002/lol2.10137
47
Izlal S. Ruhad F. M. Islam T. Rahman M. H. Tania H. A. (2024). Characterization and spatial distribution of microplastics in Surma river, Bangladesh: Assessing water and sediment dynamics. Water Environ. Res.96, e11130. doi: 10.1002/wer.11130
48
Jiang C. Yin L. Wen X. Du C. Wu L. Long Y. et al . (2018). Microplastics in sediment and surface water of West Dongting Lake and South Dongting Lake: abundance, source and composition. Int. J. Environ. Res. Public Health15, 2164. doi: 10.3390/ijerph15102164
49
Jorquera A. Castillo C. Murillo V. Araya J. Pinochet J. Narváez D. et al . (2022). Physical and anthropogenic drivers shaping the spatial distribution of microplastics in the marine sediments of Chilean fjords. Sci. Total Environ.814, 152506. doi: 10.1016/j.scitotenv.2021.152506
50
Josefsson S. (2022). “ Contaminants in Swedish offshore sediments 2003–2021,” in Results from the national environmental monitoring programme (Uppsala, Sweden: Geological Survey of Sweden (SGU).
51
Kaiser J. Abel S. Arz H. W. Cundy A. B. Dellwig O. Pawel G. et al . (2023). The East Gotland Basin (Baltic Sea) as a candidate global boundary Stratotype section and point for the Anthropocene series. Anthropocene Rev.10, 25–48. doi: 10.1177/20530196221132
52
Kaiser D. Kowalski N. Waniek J. J. (2017). Effects of biofouling on the sinking behavior of microplastics. Environ. Res. Lett.12, 124003. doi: 10.1088/1748-9326/aa8e8b
53
Kanhai L. K. Officer R. Lyashevska O. Thompson R. C. O’Connor I. (2017). Microplastic abundance, distribution and composition along a latitudinal gradient in the Atlantic Ocean. Mar. pollut. Bull.115, 307–314. doi: 10.1016/j.marpolbul.2016.12.025
54
Karimova S. Gade M. (2016). Improved statistics of sub-mesoscale eddies in the Baltic Sea retrieved from SAR imagery. Int. J. Remote Sens.37, 2394–2414. doi: 10.1080/01431161.2016.1145367
55
Kershaw P. J. (2015). Sources, fate and effects of microplastics in the marine environment: a global assessment.
56
Ketzer M. Stranne C. Rahmati-Abkenar M. Shahabi-Ghahfarokhi S. Jaeger L. Pivel M. A. G. et al . (2024). Near seafloor methane flux in the world’s largest human-induced dead zone is regulated by sediment accumulation rate. Mar. Geology468, 107220. doi: 10.1016/j.margeo.2024.107220
57
Khan M. B. Urmy S. Y. Setu S. Kanta A. H. Gautam S. Eti S. A. et al . (2023). Abundance, distribution and composition of microplastics in sediment and fish species from an Urban River of Bangladesh. Sci. Total Environ.885, 163876. doi: 10.1016/j.scitotenv.2023.163876
58
Kooi M. Koelmans A. A. (2019). Simplifying microplastic via continuous probability distributions for size, shape, and density. Environ. Sci. Technol. Lett.6, 551–557. doi: 10.1021/acs.estlett.9b00379
59
La Daana K. K. Johansson C. Frias J. Gardfeldt K. Thompson R. C. O’Connor I. (2019). Deep sea sediments of the Arctic Central Basin: a potential sink for microplastics. Deep Sea Res. Part I: Oceanographic Res. Papers145, 137–142. doi: 10.1016/j.dsr.2019.03.003
60
Lenz R. Enders K. Beer S. Sørensen T. K. Stedmon C. A. Reeh L. (2016). Analysis of microplastic in the stomachs of herring and cod from the North Sea and Baltic Sea. DTU Aqua Natl. Institute Aquat. Resour.10, 30. doi: 10.13140/RG.2.1.1625.1769
61
Leslie H. A. Van Velzen M. J. Brandsma S. H. Vethaak A. D. Garcia-Vallejo J. J. Lamoree M. H. (2022). Discovery and quantification of plastic particle pollution in human blood. Environ. Int.163, 107199. doi: 10.1016/j.envint.2022.107199
62
Li Y. Zhang Y. Chen G. Xu K. Gong H. Huang K. et al . (2021). Microplastics in surface waters and sediments from Guangdong Coastal Areas, South China. Sustainability13, 2691. doi: 10.3390/su13052691
63
Li Y. Wu M. Li H. Xue H. Tao J. Li M. et al . (2023). Current advances in microplastic contamination in aquatic sediment: Analytical methods, global occurrence, and effects on elemental cycling. TrAC Trends Analytical Chem.168, 117331. doi: 10.1016/j.trac.2023.117331
64
Li J. Shan E. Zhao J. Teng J. Wang Q. (2023). The factors influencing the vertical transport of microplastics in marine environment: A review. Sci. Total Environ.870, 161893. doi: 10.1016/j.scitotenv.2023.161893
65
Liu Y. Zhang J. Tang Y. He Y. Li Y. You J. et al . (2021). Effects of anthropogenic discharge and hydraulic deposition on the distribution and accumulation of microplastics in surface sediments of a typical seagoing river: The Haihe River. J. Hazardous Materials404, 124180. doi: 10.1016/j.jhazmat.2020.124180
66
Lombardo J. Solomando A. Cohen-Sánchez A. Pinya S. Tejada S. Ferriol P. et al . (2022). Effects of human activity on markers of oxidative stress in the intestine of Holothuria tubulosa, with special reference to the presence of microplastics. Int. J. Mol. Sci.23, 9018. doi: 10.3390/ijms23169018
67
Lundberg C. Jakobsson B.-M. Bonsdorff E. (2009). The spreading of eutrophication in the eastern coast of the Gulf of Bothnia, northern Baltic Sea–An analysis in time and space. Estuarine Coast. Shelf Sci.82, 152–160. doi: 10.1016/j.ecss.2009.01.005
68
Magnusson K. Eliasson K. Fråne A. Haikonen K. Hultén J. Olshammar M. et al . (2016). Swedish sources and pathways for microplastics to the marine environment. A review of existing data. IVL C183, 1–87.
69
Martin C. Baalkhuyur F. Valluzzi L. Saderne V. Cusack M. Almahasheer H. et al . (2020). Exponential increase of plastic burial in mangrove sediments as a major plastic sink. Sci. Adv.6, eaaz5593. doi: 10.1126/sciadv.aaz5593
70
Martin C. Young C. A. Valluzzi L. Duarte C. M. (2022). Ocean sediments as the global sink for marine micro-and mesoplastics. Limnology Oceanography Lett.7, 235–243. doi: 10.1002/lol2.10257
71
Masura J. Baker J. Foster G. Arthur C. (2015). Laboratory Methods for the Analysis of Microplastics in the Marine Environment: Recommendations for quantifying synthetic particles in waters and sediments.
72
Matsuguma Y. Takada H. Kumata H. Kanke H. Sakurai S. Suzuki T. et al . (2017). Microplastics in sediment cores from Asia and Africa as indicators of temporal trends in plastic pollution. Arch. Environ. contamination Toxicol.73, 230–239. doi: 10.1007/s00244-017-0414-9
73
Meyerjürgens J. Schöneich-Argent R. I. Badewien T. H. (2022). An exploratory analysis of seabed litter dynamics in the SE German Bight. Mar. pollut. Bull.177, 113515. doi: 10.1016/j.marpolbul.2022.113515
74
Mills J. (2011). Polyester & cotton: unequal competitors Vol. 6 (Deauville, France: Tecnon OrbiChem presentation at Association Française Cotonnière (AFCOT).
75
Møskeland T. Knutsen H. Arp H. P. Lilleeng Ø. Pettersen A. (2018). Microplastics in sediments on the Norwegian continental shelf. Norwegian Environ. Agency M-976, 84p.
76
Murawski J. She J. Frishfelds V. (2022). Modeling drift and fate of microplastics in the Baltic Sea. Front. Mar. Sci.9. doi: 10.3389/fmars.2022.886295
77
Naji A. Esmaili Z. Mason S. A. Dick Vethaak A. (2017). The occurrence of microplastic contamination in littoral sediments of the Persian Gulf, Iran. Environ. Sci. pollut. Res.24, 20459–20468. doi: 10.1007/s11356-017-9587-z
78
Nel H. A. Hean J. W. Noundou X. S. Froneman P. W. (2017). Do microplastic loads reflect the population demographics along the southern African coastline? Mar. pollut. Bull.115, 115–119. doi: 10.1016/j.marpolbul.2016.11.056
79
Olszewski G. Andersson P. Lindahl P. Eriksson M. (2018). On the distribution and inventories of radionuclides in dated sediments around the Swedish coast. J. Environ. Radioactivity186, 142–151. doi: 10.1016/j.jenvrad.2017.09.025
80
Organisation de coopération et de développement économiques . (2022). Global Plastics Outlook: Economic drivers, environmental impacts and policy options (Paris, France: OECD publishing).
81
Ory N. C. Lehmann A. Javidpour J. Stohr R. Walls G. L. Clemmesen C. (2020). Factors in fluencing the spatial and temporal distribution of microplastics at the sea surface? A year -long monitoring case study from the urban Kiel Fjord, southwest Baltic Sea. Sci. Total Environ.736, 11. doi: 10.1016/j.scitotenv.2020.139493
82
Pervez R. Wang Y. (2022). Microplastic distribution within core sediments of beach and its responses to anthropogenic activities. Mar. pollut. Bull.174, 113256. doi: 10.1016/j.marpolbul.2021.113256
83
Phuong N. N. Fauvelle V. Grenz C. Ourgaud M. Schmidt N. Strady E. et al . (2021). Highlights from a review of microplastics in marine sediments. Sci. Total Environ.777, 146225. doi: 10.1016/j.scitotenv.2021.146225
84
Qiu Q. Peng J. Yu X. Chen F. Wang J. Dong F. (2015). Occurrence of microplastics in the coastal marine environment: First observation on sediment of China. Mar. pollut. Bull.98, 274–280. doi: 10.1016/j.marpolbul.2015.07.028
85
Ragusa A. Svelato A. Santacroce C. Catalano P. Notarstefano V. Carnevali O. et al . (2021). Plasticenta: First evidence of microplastics in human placenta. Environ. Int.146, 106274. doi: 10.1016/j.envint.2020.106274
86
Reusch T. B. H. Dierking J. Andersson H. C. Bonsdorff E. Carstensen J. Casini M. et al . (2018). The Baltic Sea as a time machine for the future coastal ocean. Sci. Adv.4, eaar8195. doi: 10.1126/sciadv.aar8195
87
Rothäusler E. Jormalainen V. Gutow L. Thiel M. (2019). Low abundance of floating marine debris in the northern Baltic Sea. Mar. pollut. Bull.149, 110522. doi: 10.1016/j.marpolbul.2019.110522
88
Sabdono A. Ayuningrum D. Sabdaningsih A. (2022). First evidence of microplastics presence in corals of Jepara coastal waters, Java Sea: A comparison among habitats receiving different degrees of sedimentations. Polish J. Environ. Stud.31, 825–832. doi: 10.15244/pjoes/139376
89
Saha M. Naik A. Desai A. Nanajkar M. Rathore C. Kumar M. et al . (2021). Microplastics in seafood as an emerging threat to marine environment: a case study in Goa, west coast of India. Chemosphere270, 129359. doi: 10.1016/j.chemosphere.2020.129359
90
Sayed A. E.-D. H. Hamed M. Badrey A. E.A. Ismail R. F. Osman Y. A.A. Osman A. G.M. et al . (2021). Microplastic distribution, abundance, and composition in the sediments, water, and fishes of the Red and Mediterranean seas, Egypt. Mar. pollut. Bull.173, 112966. doi: 10.1016/j.marpolbul.2021.112966
91
Schernewski G. Radtke H. Hauk R. Baresel C. Olshammar M. Osinski R. et al . (2020). Transport and behavior of microplastics emissions from urban sources in the Baltic Sea. Front. Environ. Sci.8. doi: 10.3389/fenvs.2020.579361
92
Schernewski G. Radtke H. Hauk R. Baresel C. Olshammar M. Oberbeckmann S. (2021). Urban microplastics emissions: effectiveness of retention measures and consequences for the Baltic Sea. Front. Mar. Sci.8. doi: 10.3389/fmars.2021.594415
93
Shahabi-Ghahfarokhi S. Åström M. Josefsson S. Apler A. Ketzer M. (2021a). Background concentrations and extent of Cu, As, Co, and U contamination in Baltic Sea sediments. J. Sea Res.176, 102100. doi: 10.1016/j.seares.2021.102100
94
Shahabi-Ghahfarokhi S. Josefsson S. Apler A. Kalbitz K. Åström M. Ketzer M. (2021b). Baltic Sea sediments record anthropogenic loads of Cd, Pb, and Zn. Environ. Sci. pollut. Res.28, 6162–6175. doi: 10.1007/s11356-020-10735-x
95
Singh R. P. Mishra S. Das A. P. (2020). Synthetic microfibers: Pollution toxicity and remediation. Chemosphere257, 127199. doi: 10.1016/j.chemosphere.2020.127199
96
Souza A. M. C. Ferreira G. V. B. de los Santos C. B. Frédou F. L. Magalhães K. M. (2024). Anthropogenic microparticles accumulation in small-bodied seagrass meadows: The case of tropical estuarine species in Brazil. Mar. pollut. Bull.207, 116799. doi: 10.1016/j.marpolbul.2024.116799
97
Stolte A. Forster S. Gerdts G. Schubert H. (2015). Microplastic concentrations in beach sediments along the German Baltic coast. Mar. pollut. Bull.99, 216–229. doi: 10.1016/j.marpolbul.2015.07.022
98
Strand J. Lassen P. Shashoua Y. Andersen J. (2013). “ Microplastic particles in sediments from Danish waters,” in ICES Annual Science Conference (ASC), 23–27 September 2013, Harpa Conference Centre, Reykjavik, Iceland.
99
Sui Q. Zhang L. Xia B. Chen B. Sun X. Zhu L. et al . (2020). Spatiotemporal distribution, source identification and inventory of microplastics in surface sediments from Sanggou Bay, China. Sci. Total Environ.723, 138064. doi: 10.1016/j.scitotenv.2020.138064
100
Swedish Environmental Protection Agency (2021). Microplastics in the Environment 2019: Report on a government commission, Vol. 113, ISBN: Report No. 978-91-620-6957-5. (Stockholm, Sweden: Swedish Environmental Protection Agency).
101
Tang N. Liu X. Xing W. (2020). Microplastics in wastewater treatment plants of Wuhan, Central China: Abundance, removal, and potential source in household wastewater. Sci. Total Environ.745, 141026. doi: 10.1016/j.scitotenv.2020.141026
102
Tekman M. B. Wekerle C. Lorenz C. Primpke S. Hasemann C. Gerdts G. et al . (2020). Tying up loose ends of microplastic pollution in the Arctic: distribution from the sea surface through the water column to deep-sea sediments at the HAUSGARTEN observatory. Environ. Sci. Technol.54, 4079–4090. doi: 10.1021/acs.est.9b06981
103
Thompson R. C. (2015). Microplastics in the marine environment: sources, consequences and solutions. Mar. anthropogenic litter, 185–200. doi: 10.1007/978-3-319-16510-3_7
104
Thompson R. C. Swan S. H. Moore C. J. Vom Saal F. S. (2009). Our plastic age. Philos. Trans. R. Soc. B: Biol. Sci.364, 1973–1976. doi: 10.1098/rstb.2009.0054
105
Torres F. G. De-la-Torre G. E. (2021). Historical microplastic records in marine sediments: Current progress and methodological evaluation. Regional Stud. Mar. Sci.46, 101868. doi: 10.1016/j.rsma.2021.101868
106
Uaciquete D. Mitsunaga K. Aoyama K. Kitajima K. Chiba T. Jamal D. L. et al . (2024). Microplastic abundance in the semi-enclosed Osaka Bay, Japan. Environ. Sci. pollut. Res.31, 1–13. doi: 10.1007/s11356-024-34444-x
107
Uddin S. Fowler S. W. Uddin M. F. Behbehani M. (2021). & Naji, A. A review of microplastic distribution in sediment profiles. Mar. pollut. Bull.163, 111973. doi: 10.1016/j.marpolbul.2021.111973
108
Uurasjarvi E. Paakkonen M. Setala O. Koistinen A. Lehtiniemi M. (2021). Microplastics accumulate to thin layers in the stratified Baltic Sea. Environ. pollut.268, 115700. doi: 10.1016/j.envpol.2020.115700
109
Van Cauwenberghe L. Devriese L. Galgani F. Robbens J. Janssen C. R. (2015). Microplastics in sediments: a review of techniques, occurrence and effects. Mar. Environ. Res.111, 5–17. doi: 10.1016/j.marenvres.2015.06.007
110
Vethaak A. D. Legler J. (2021). Microplastics and human health. Science371, 672–674. doi: 10.1126/science.abe5041
111
Viet Dung L. Huu Duc T. Thi Khanh Linh L. Thi Dieu Ly T. Anh Duong H. Thi My Hao N. (2021). Depth profiles of microplastics in sediment cores from two mangrove forests in northern Vietnam. J. Mar. Sci. Eng.9, 1381. doi: 10.3390/jmse9121381
112
Villanova-Solano C. Navalón-Alajarín G. González-Sálamo J. Hernández-Borges J. Hernández-Sánchez C. (2024). Assessment of anthropogenic particles in Holothuria sanctori from Tenerife (Canary Islands, Spain). Mar. pollut. Bull.208, 117013. doi: 10.1016/j.marpolbul.2024.117013
113
Voipio A. (1981). The Baltic Sea (Amsterdam, Netherlands: Elsevier).
114
Wang Y. Zou X. Peng C. Qiao S. Wang T. Yu W. et al . (2020). Occurrence and distribution of microplastics in surface sediments from the Gulf of Thailand. Mar. pollut. Bull.152, 110916. doi: 10.1016/j.marpolbul.2020.110916
115
Wang J. Wang M. Ru S. Liu X. (2019). High levels of microplastic pollution in the sediments and benthic organisms of the South Yellow Sea, China. Sci. Total Environ.651, 1661–1669. doi: 10.1016/j.scitotenv.2018.10.007
116
Watson H. Turner A. (2024). Contamination of consumer composts by metals, microplastics and other microscopic debris. Environ. Sci. pollut. Res.31, 1–10. doi: 10.1007/s11356-024-34952-w
117
Watt E. Picard M. Maldonado B. Abdelwahab M. A. Mielewski D. F. Drzal L. T. et al . (2021). Ocean plastics: environmental implications and potential routes for mitigation–a perspective. RSC Adv.11, 21447–21462. doi: 10.1039/D1RA00353D
118
Willis K. A. Eriksen R. Wilcox C. Hardesty B. D. (2017). Microplastic distribution at different sediment depths in an urban estuary. Front. Mar. Sci.4. doi: 10.3389/fmars.2017.00419
119
Woodall L. C. Sanchez-Vidal A. Canals M. Paterson G. L.J. Coppock R. Sleight V. et al . (2014). The deep sea is a major sink for microplastic debris. R. Soc. Open Sci.1, 140317. doi: 10.1098/rsos.140317
120
Xu Y. Chan F. K.S. Johnson M. Stanton T. He J. Jia T. et al . (2021). Microplastic pollution in Chinese urban rivers: The influence of urban factors. Resources Conserv. Recycling173, 105686. doi: 10.1016/j.resconrec.2021.105686
121
Yaranal N. A. Subbiah S. Mohanty K. (2021). Distribution and characterization of microplastics in beach sediments from Karnataka (India) coastal environments. Mar. pollut. Bull.169, 112550. doi: 10.1016/j.marpolbul.2021.112550
122
Zalasiewicz J. Waters C. N. Ivar do Sul J. A. Corcoran P. L. Barnosky A. D. Cearreta A. et al . (2016). The geological cycle of plastics and their use as a stratigraphic indicator of the Anthropocene. Anthropocene13, 4–17. doi: 10.1016/j.ancene.2016.01.002
123
Zhao X. Wang J. Yee Leung K. M. Wu F. (2022). Color: an important but overlooked factor for plastic photoaging and microplastic formation. Environ. Sci. Technol.56, 9161–9163. doi: 10.1021/acs.est.2c02402
124
Zheng Y. Li J. Cao W. Liu X. Jiang F. Ding J. et al . (2019). Distribution characteristics of microplastics in the seawater and sediment: a case study in Jiaozhou Bay, China. Sci. Total Environ.674, 27–35. doi: 10.1016/j.scitotenv.2019.04.008
125
Zheng Y. Li J. Cao W. Jiang F. Zhao C. Ding H. et al . (2020). Vertical distribution of microplastics in bay sediment reflecting effects of sedimentation dynamics and anthropogenic activities. Mar. pollut. Bull.152, 110885. doi: 10.1016/j.marpolbul.2020.110885
126
Zhou Q. Tu C. Yang J. Fu C. Li Y. Waniek J. J. (2021). Trapping of microplastics in halocline and turbidity layers of the semi-enclosed Baltic Sea. Front. Mar. Sci.8. doi: 10.3389/fmars.2021.761566
127
Zobkov M. Esiukova E. (2017). Microplastics in Baltic bottom sediments: quantification procedures and first results. Mar. pollut. Bull.114, 724–732. doi: 10.1016/j.marpolbul.2016.10.060
128
Zobkov M. B. Esiukova E. E. Zyubin A. Y. Samusev I. G. (2019). Microplastic content variation in water column: The observations employing a novel sampling tool in stratified Baltic Sea. Mar. pollut. Bull.138, 193–205. doi: 10.1016/j.marpolbul.2018.11.047
Summary
Keywords
sediment, Baltic Sea, ocean, microplastic, chronological accumulation
Citation
Chang C, Augustsson A, Shahabi-Ghahfarokhi S, Rahmati-Abkenar M, Josefsson S, An L and Ketzer M (2025) Chronological evidence of microplastic accumulation and contamination onset in Central Baltic Sea sediments. Front. Mar. Sci. 12:1630780. doi: 10.3389/fmars.2025.1630780
Received
18 May 2025
Accepted
13 October 2025
Published
30 October 2025
Volume
12 - 2025
Edited by
Rakesh Kumar, Auburn University, United States
Reviewed by
Mohamed Hamed, Louisiana State University, United States; Baranidharan Sundaram, National Institute of Technology, India; Priyansha Gupta, Escuela de Ingenieria y Ciencias, Mexico
Updates
Copyright
© 2025 Chang, Augustsson, Shahabi-Ghahfarokhi, Rahmati-Abkenar, Josefsson, An and Ketzer.
This is an open-access article distributed under the terms of the Creative Commons Attribution License (CC BY). The use, distribution or reproduction in other forums is permitted, provided the original author(s) and the copyright owner(s) are credited and that the original publication in this journal is cited, in accordance with accepted academic practice. No use, distribution or reproduction is permitted which does not comply with these terms.
*Correspondence: Cheng Chang, cheng.chang@lnu.se
† Present addresses: Sina Shahabi-Ghahfarokhi, Earth & Environment, Förorenade områden Syd, WSP, Kalmar, Sweden; Mahboubeh Rahmati-Abkenar, Research and Development, TRATON AB, Södertälje, Sweden
Disclaimer
All claims expressed in this article are solely those of the authors and do not necessarily represent those of their affiliated organizations, or those of the publisher, the editors and the reviewers. Any product that may be evaluated in this article or claim that may be made by its manufacturer is not guaranteed or endorsed by the publisher.