 Pedro Otiñar
 Manuel Cobos
 Marcus Santana
 Asunción Baquerizo
- Environmental Fluid Dynamics Group, Andalusian Institute for Earth System Research (IISTA), Granada, Spain
Despite significant scientific progress in developing long-term projections of coastal impacts and the growing concern of public authorities, the transfer of knowledge from academia to policy remains less effective than desired. As a result, the legal and administrative frameworks guiding coastal management are often misaligned with the latest scientific evidence. To help address this gap, we present a procedure for the stochastic characterization of erosion and flooding, aimed at supporting informed management decision-making using projections under a climate change scenario. The approach focuses on a comprehensive collection of random sets defined in accordance with the Spanish regulatory framework and the needs of the regional administrative authority responsible for granting permits and concessions for the use and/or occupation of land within the public maritime-terrestrial domain in Andalusia (Spain). The study analyses the spatial and temporal variability of these random sets in probabilistic terms across different time horizons. These time frames are introduced to harmonize the definitions and criteria established in legal texts with the mandate to account for climate change impacts. Statistical analyses are also conducted for both peak and off-peak tourist seasons, as well as on annual time scales, to support managerial decision-making based on the specific characteristics of the coastal management issues at hand, including their potential seasonal nature. The results, obtained for the provinces of Granada and Almería along the Mediterranean Andalusian coast for the high-emissions Representative Concentration Pathway scenario (RCP 8.5), underscore the importance of considering specific time horizons—and, when relevant, seasonal variability—when authorizing uses and concessions in coastal zones. In this regard, it was found that by 2100, 40% of beaches in the studied provinces are projected to lose over 80% of their dry beach area during the off-peak tourist season, with only 33% of them failing to recover by the tourist season. This highlights the importance of considering natural recovery capacities in coastal management to potentially avoid drastic interventions. Furthermore, the analysis reveals the high sensitivity of the parameters currently used in Spanish legislation to define the public maritime-terrestrial domain and to identify areas of severe coastal regression, along with their implications along the coastline.
1 Introduction
The growing threat of climate change (CC), as highlighted by the IPCC (2023), combined with the intensification of human settlements along global coastlines, is exacerbating the already complex task of managing vulnerable coastal areas (Wainwright et al., 2015). Projections of flooding and coastal erosion are increasingly influencing strategic decisions in coastal management, particularly in high-risk regions (Environmental Agency, 2023). Anticipated rises in sea level and compound flooding events are compelling coastal authorities to prioritize risk-based planning, infrastructure adaptation, and emergency preparedness measures (Gómez Rave et al., 2025). At the same time, both long- and short-term coastal erosion forecasts are playing a pivotal role in land-use regulation, infrastructure relocation planning, and the development of legal frameworks that provide administrative certainty (Hunt et al., 2023).
In this context, it is more critical than ever to harness advances in climate forecasting and process-based modelling to design integrated coastal evolution plans. Such plans are essential for supporting evidence-based decision-making by coastal managers (Staneva et al., 2024).
Significant progress has been made in developing methodologies for the stochastic characterization of coastal erosion and flooding by incorporating uncertainty into long-term impact projections. Zacharioudaki and Reeve (2011) conducted a statistical analysis of shoreline changes on an idealized beach using 30-year wave climate projections, focusing on monthly and seasonal fluctuations. Wainwright et al. (2015) assessed long-term coastal retreat and short-term variations at Narrabeen Beach, Australia, using probability distributions of shoreline positions. Toimil et al. (2017) examined erosion from waves, storm surges, and sea-level rise at northern Spanish beaches, providing statistical descriptors of shoreline retreat. Álvarez-Cuesta et al. (2021) projected shoreline retreat and beach area loss over a 40 km coastline, analyzing the long-term trends in retreat and beach area loss, as well as time-varying annual extreme retreat. Vitousek et al. (2021) presented time-varying statistical descriptors of shoreline positions at Tairua Beach, New Zealand. Toimil et al. (2023) projected coastal flooding and erosion along a Mediterranean coastline for 2050 and 2100, statistically characterizing water levels, flooded areas, and shoreline positions. The methods employed in these studies are summarized in a companion paper by Otiñar et al. (2025), which also includes details of their main characteristics in the Supplementary Material (Supplementary Table SM1).
Although these studies use probabilistic techniques to estimate the likelihood of future coastal impacts, taking intrinsic and sometimes epistemic sources of uncertainty into account, they do not directly address the specific needs of coastal management planners and decision-makers responsible for authorizing land use and occupation in coastal areas. This highlights a significant gap: despite scientific progress and growing concern from public authorities, knowledge transfer between academia and policy remains less effective than desired (Magaña et al., 2020). Consequently, the legal and administrative frameworks that guide coastal management frequently remain misaligned with the latest scientific insights (Cullinan, 2006).
In Spain, the legal framework governing the use and protection of coastal zones has undergone several changes in recent years. The current regulations are primarily established by Law 22/1988 on Coasts (Government of Spain, 1988), as amended by Law 2/2013 (Government of Spain, 2013; hereinafter LC), and further developed in the Regulation enacted through Royal Decree 876/2014 (Government of Spain, 2014; hereinafter RGV). Although this regulation has remained in force since its publication, it was temporarily modified by Royal Decree 668/2022 (Government of Spain, 2022; RGF), which introduced amendments to several critical articles. However, these modifications were annulled by the Supreme Court ruling of January 31, 2024.
Article 3 of the LC states which assets are public maritime-terrestrial state property, in accordance with the provisions of the Spanish Constitution. This includes the seashore and estuaries, as well as beaches and areas where loose materials such as sand, gravel and pebbles are deposited. This also covers escarpments, berms and dunes, provided they are necessary for ensuring the stability of the beach and the defense of the coast.
The above-mentioned legal texts define the inland boundary of the public maritime-terrestrial domain (MTD) as the point reached by waves during the largest known storms or, if this is exceeded, the line of the maximum equinoctial spring tide. This corresponds to what the regulation refers to as the shoreline, as established in Article 3 of the LC and its subsequent amendments.
The RGV establishes a technical criterion for determining the MTD as the line “reached at least five times within a five-year period, except in exceptional cases where the best available scientific evidence demonstrates the need to apply a different criterion” (MTD5-5). It also specifies that, to estimate this boundary, the highest recorded waves must be used. However, this criterion (MTD5-5) was repealed under the RGF, which instead refers to the limit reached by waves during the largest known storms (MTDW). In both cases, technical calculations must be based on recorded data. This approach contrasts with the broader objective stated in the law: to determine the limits of the public maritime-terrestrial domain to ensure its integrity and proper conservation—adopting protection, restoration, and, where appropriate, adaptation measures, while considering the effects of CC. The obligation to consider CC is also mentioned in other articles, particularly those related to projects and interventions within MTD.
Tables 1 and 2 summarize the relevant aspects of these legal texts for the purposes of this research. More precisely, Table 1 includes excerpts extracted from the Law 22/1988 on Coasts, amended by Law 2/2013 (LC) that is in force, while Table 2 refers to the two recent Royal Decrees that set out the regulatory framework of the Law. More precisely, it compares the excerpts of the more recent one and the previous document that is currently in force (and probably on a temporary basis) after the annulment by the Supreme Court of some modifications in response to an appeal.
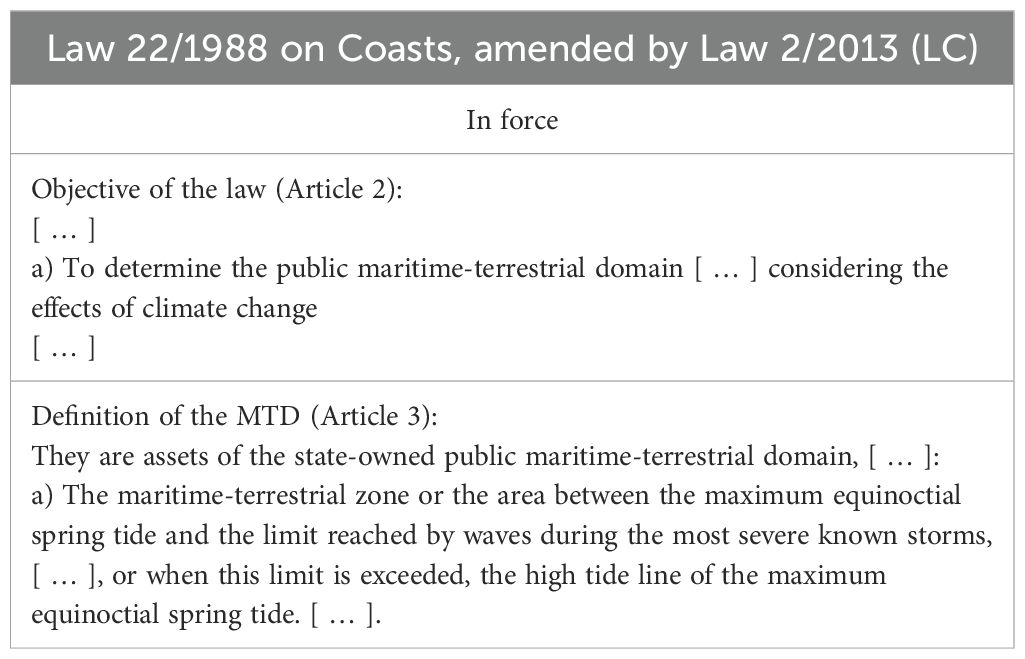
Table 1. Selection of excerpts from the Law 22/1988 on Coasts, amended by Law 2/2013 (LC).
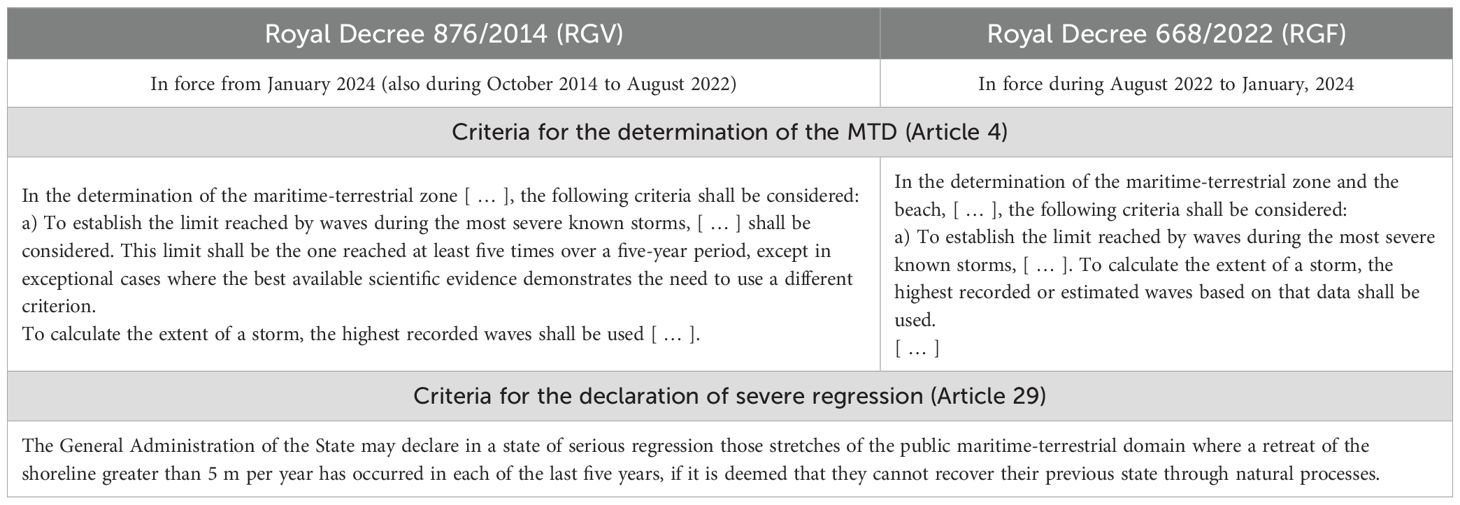
Table 2. Selection of excerpts from the Royal Decrees that set out the regulatory framework of the LC.
From the above, it becomes evident that the current regulations, beyond not adequately considering long-term climate variability within a global change scenario, also fail to account for the stochastic nature of climatic phenomena and the dynamic changes in coastal morphology. This is particularly concerning given the numerous references throughout the legal texts to flood risks. Under these circumstances, coastal managers lack clear criteria to make decisions with legal certainty.
The intensification of coastal erosion and flooding due to climate change has been documented along multiple sectors of the Spanish Mediterranean coast. In Andalusia, for example, Prieto Campos and Ojeda Zújar (2024) analyzed shoreline changes between 2001 and 2019, identifying significant retreat in unprotected beach segments, particularly in natural areas, which they attribute to increasing climate-driven pressures. An earlier land cover analysis by Ojeda Zújar and Villar Lama (2006) confirmed the accelerated expansion of urbanized areas along the Andalusian coast between 1998 and 2002, which increased its exposure and vulnerability. Contreras de Villar et al. (2024) assessed the combined effect of rising sea-levels and intensifying storms on coastal regression in Cádiz and Málaga, emphasizing the need for proactive planning based on risk scenarios. In Catalonia, Sánchez-Artús et al. (2023) projected substantial increase in beach loss and flooding risk for 55 beaches under RCP 4.5 and RCP 8.5 climate scenarios by 2100. Similarly, in south-eastern Spain, Oliva et al. (2024) identified the interplay between climate change, river regulation, and coastal dune degradation as key drivers of shoreline retreat in Guardamar del Segura (Alicante). Together, these studies provide robust historical and regional evidence that both erosion and flooding have become more frequent and severe in various parts of Spain due to climate change.
Faced with this situation, the Andalusian regional government department responsible for managing authorizations for the use and occupation of the coastal zone has promoted the development of a methodology to study the spatial and temporal variability of the coast under a CC scenario. This initiative aims to support their responsibilities with legal backing and its implementation along approximately 1,000 km of the Andalusian coastline. The initiative, launched in 2019 under the title ICCOAST, was carried out through two projects awarded to the University of Granada (UGR) and the Temporary Joint Venture (TJV) Estudio 7 – SandS. The UGR was tasked with designing the general methodology, coordinating the work, and implementing it in the provinces of Granada and Almería. Meanwhile, the TJV oversaw its implementation in the provinces of Huelva, Cádiz, and Málaga.
In this article, we present the component of the methodology developed within the framework of the ICCOAST project that focuses on the stochastic characterization of erosion and flooding. The aim is to support informed decision-making in coastal management by using projections under a CC scenario, based on the methodology proposed by Otiñar et al. (2025). The approach centers on the definition and stochastic characterization of a comprehensive collection of random sets defined in accordance with the Spanish regulatory framework, seeking to harmonize legal definitions with the requirement to account for CC. It is a novel proposal specifically designed to meet the needs of the regional administrative department responsible for granting permits and concessions for the use and/or occupation of land within MTD. We illustrate this methodology through its application to the Andalusian coastal provinces of Granada and Almería, located along the Mediterranean coast and encompassing more than 290 kilometers of coastline.
Although this work is based on Spain’s legal framework—which is among the most restrictive in terms of coastal regulation—the underlying concepts can be adapted to other national coastal protection laws.
2 Data and methods
In a companion paper, Otiñar et al. (2025) presented a methodology to obtain probabilistic joint projections of coastal erosion and flooding impacts due to CC, covering temporal scales of several decades and spatial scales of hundreds of kilometers. The approach considers: (1) the stochastic nature of climate and its inherent variability; (2) the combined effects of maritime and hydrological events on the coastline; (3) the availability of sediment, including its three-dimensional spatial distribution, granulometry, and degree of consolidation; (4) sediment contributions from rivers and ephemeral streams; and (5) the presence of infrastructure that alters hydrodynamic and sedimentary processes, such as dams, ports, breakwaters, buildings, and promenades. The methodology was applied along more than 290 km of the Mediterranean coast of Andalusia (Figure 1), encompassing over 190 beaches in the provinces of Granada and Almería. A series of random realizations of hydro-morphological evolution properties were generated for the 21st century. Figure 1a, b were produced using QGIS with the vector layer ll_autonomicas_inspire_peninbal_etrs89 distributed by the Spanish National Centre for Geographic Information (CNIG, in Spanish Centro Nacional de Información Geográfica) over Google satellite map base and Digital Terrain Model (DTM) with a 25 m-cell size, in Spanish called MDT25 (CNIG) and bathymetry maps from General Bathymetric Chart of the Oceans (GEBCO) of 2022, respectively. Figure 1c was deployed using Python software and the package matplotlib with layers MDT02 (CNIG); eco-bathymetries were downloaded in ESRI shape format from the Andalusian environmental network website called REDIAM (in Spanish, Red De Información AMbiental de Andalucía); and Cadastral data, which was obtained using the Spanish Inspire Cadastral Downloader plugin. Coastal structures manually digitalized based on google satellite imagery. Panel b) is on geospatial reference system WGS84 geodetic system (EPSG:4326).
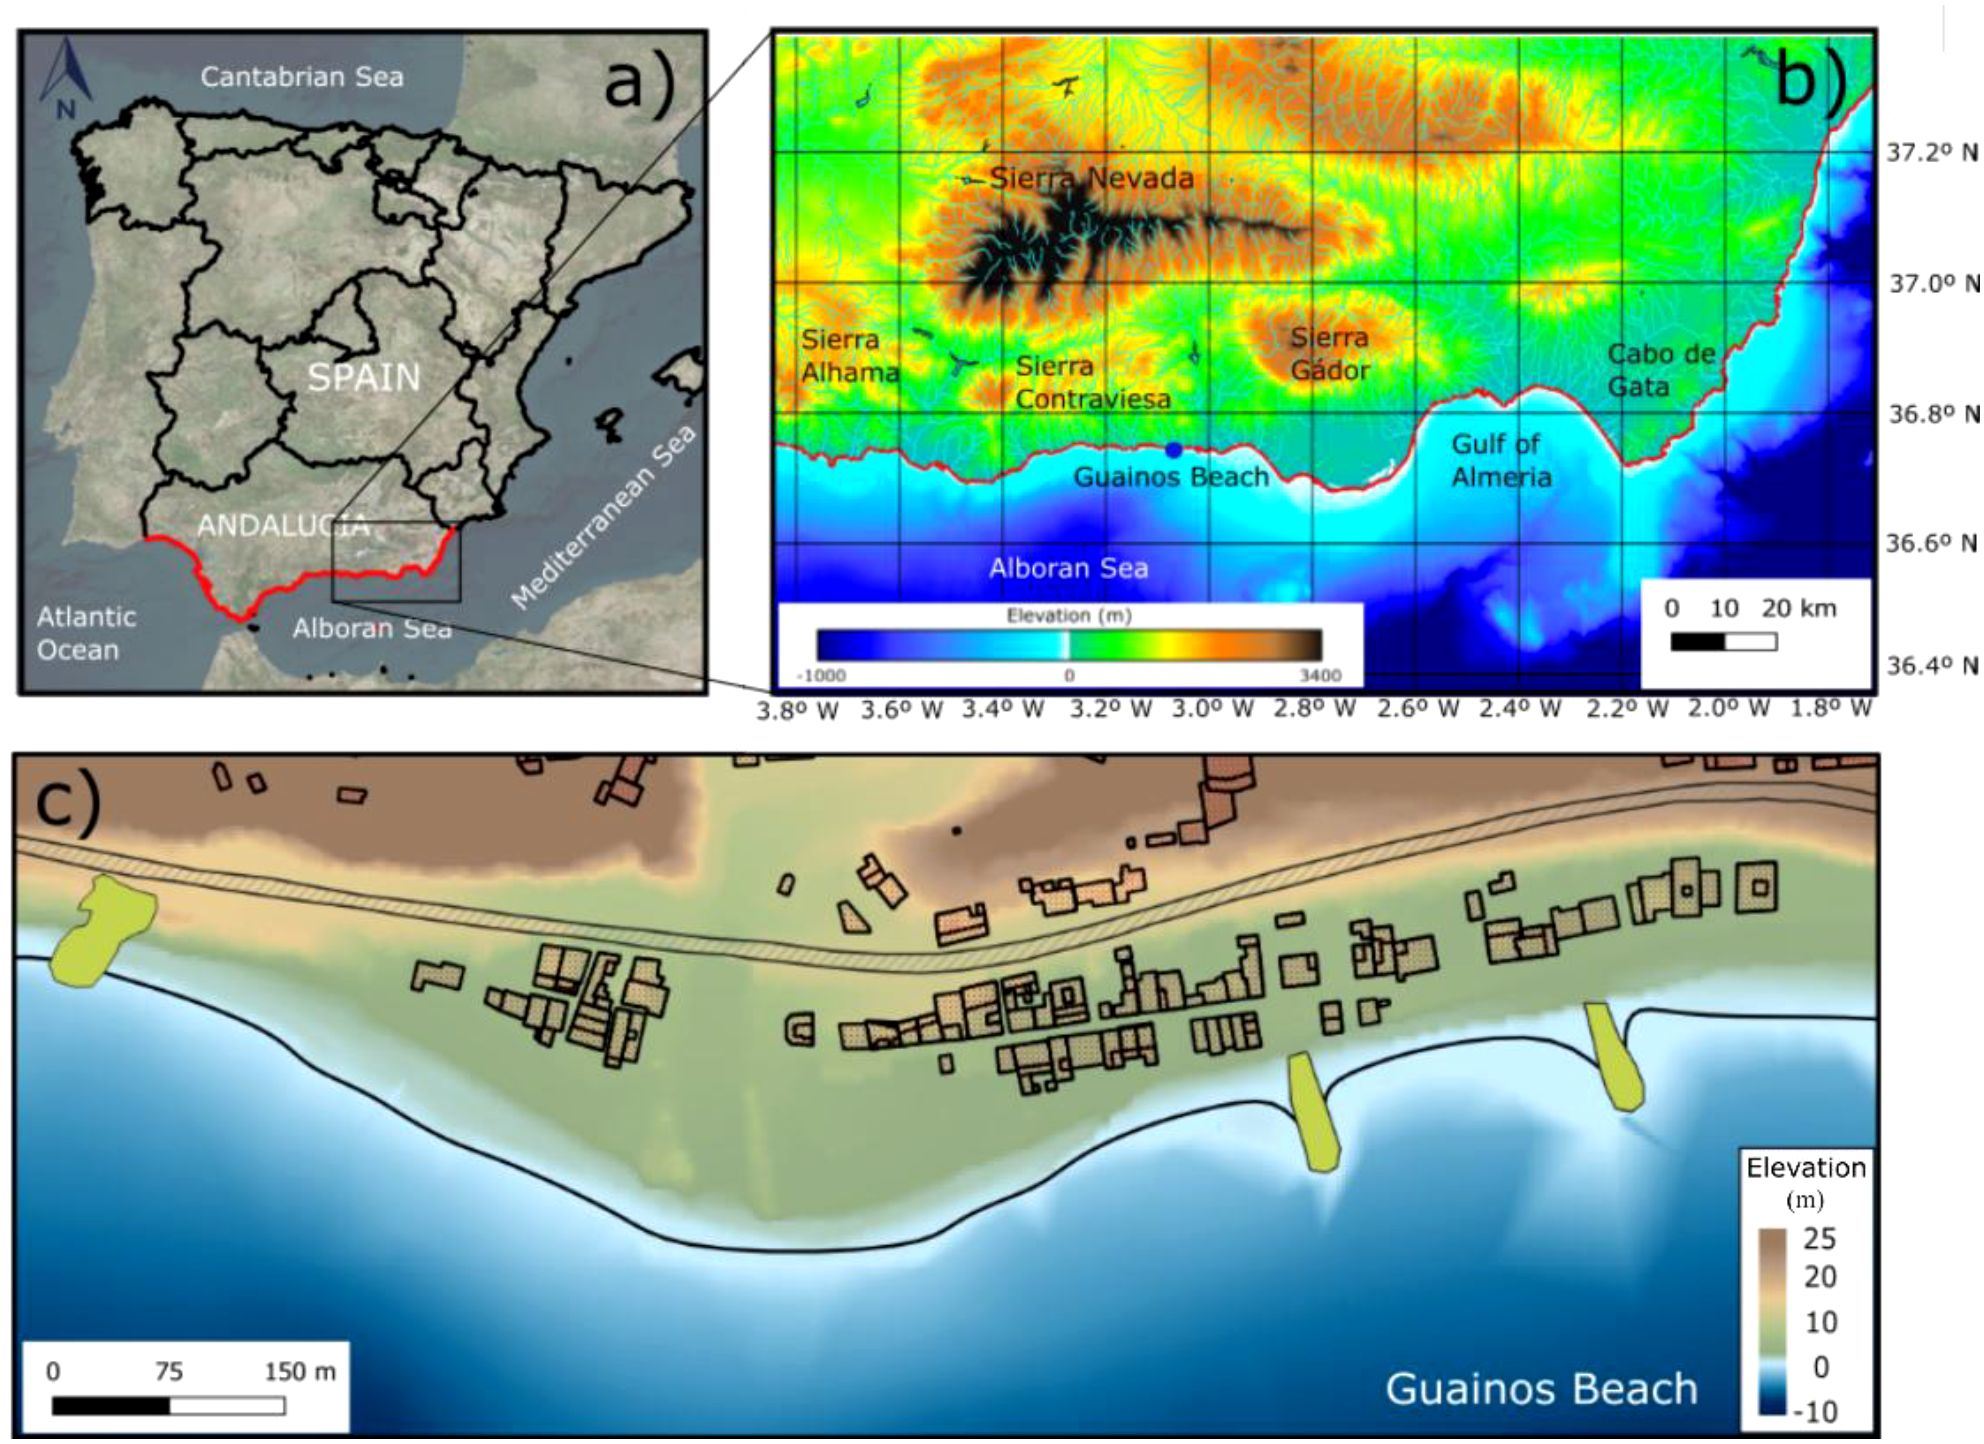
Figure 1. Study area. (a) Map of Andalusia placed over Spain. The red line indicates the Andalusian coastline. (b) Zoomed-in view of the Granada and Almería coasts. (c) Detailed map of Guainos Beach (Almería).
In this section, we summarize the methodology, and the data used for its implementation. We then present the random sets employed for the stochastic characterization of erosion and flooding, based on the Spanish legal framework, along with the procedure used to evaluate them.
2.1 Summary of the methodology and the data
The methodology applied in the present study follows Otiñar et al. (2025). It began with a characterization of the physical environment, which allows for the definition of different subunits within the coastal tracts as outlined by Cowell et al. (2003). Climate projections were then analyzed using non-stationary multimodel and multivariate techniques that capture climate variability across different time scales. This data was used to generate several equally probable realizations of future climate conditions, represented as multivariate time series of variables that define climate forcings. For each realization, the climate conditions were transformed to coastal proximities using hybrid methods that combine process-based models with interpolation techniques, resulting in time series for waves, sea level, and, where applicable, river discharge and sediment supply. These transformation models had been calibrated using parameterizations derived from local studies carried out on this particular coastline. The resulting data was used to simulate the temporal variation of the coastline with a coastal evolution model that had been calibrated using shoreline positions automatically extracted from satellite imagery. This model sequentially reproduces hydrodynamic processes and associated morphodynamics, with each state’s coastal configuration based on the previous state. The outcome of this process is a set of equally probable realizations of dynamic random variables that describe the evolution of erosion and flooding in the subunits under a CC scenario during the analyzed period. Further details on available data, models used, and their resolution and the calibration procedure are provided in Otiñar et al. (2025).
The methodology was applied to the coastal areas of the provinces of Granada and Almería using climate projections based on the representative concentration pathway (RCP) for greenhouse gases, corresponding to a total radiative forcing of 8.5 W/m² by the year 2100. The study spanned 75 years, from the beginning of 2025 to the beginning of 2100. The non-stationary analysis used the year as the base period. A total of 20 realizations were generated, during which hydrodynamic condition data was recorded at regular intervals of three hours. Topobathymetric properties were stored at the beginning of each month and every six hours during storms and high river discharge events, as well as at the start and end of these events.
2.2 Statistical characterization of erosion and flooding for coastal management
Based on the stored information and the legal framework outlined in the Introduction section, several random variables are defined to facilitate the decision-making process of the Andalusian administration responsible for authorizations and concessions for the use and/or occupation of land in the public maritime-terrestrial domain and the coastal protection easement area (Table 3). The characterization of these variables using statistical techniques allows for the association of probabilities of occurrence to different events related to erosion and flooding in the future, at various time horizons (tH) particularly at those corresponding to the years 2030, 2035, 2050, 2100. These dates represent the timeframes that managers must consider making decisions in accordance with the law. This approach avoids the use of historical recorded data, aiming to harmonize the definitions of the curves given in the legal texts with the mandate to consider CC effects, while introducing a time frame (tH) that can be chosen depending on the characteristics of the coastal management problem under consideration. Additionally, to facilitate decisions regarding the authorizations for the occupation of the MTD for seasonal services, two seasonal periods corresponding to peak (PS) and off-peak (OS) tourist seasons were considered, in addition to the yearly scale. These periods range from April 1st to September 30th for PS and from October 1st to March 31st for OS. Table 2 summarizes the random sets that are analyzed, including the type of statistical information computed and their spatial and temporal resolution. Figure 2 sketches the definition of some of these quantities.
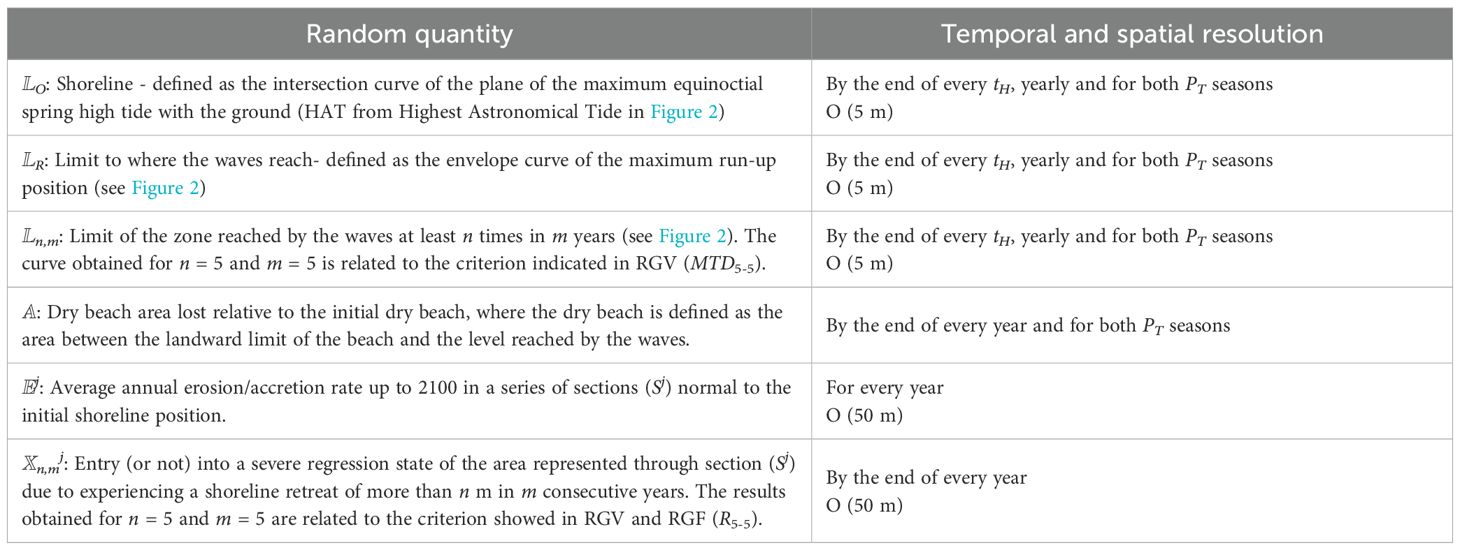
Table 3. Definition of the random sets used to analyze erosion and flooding.
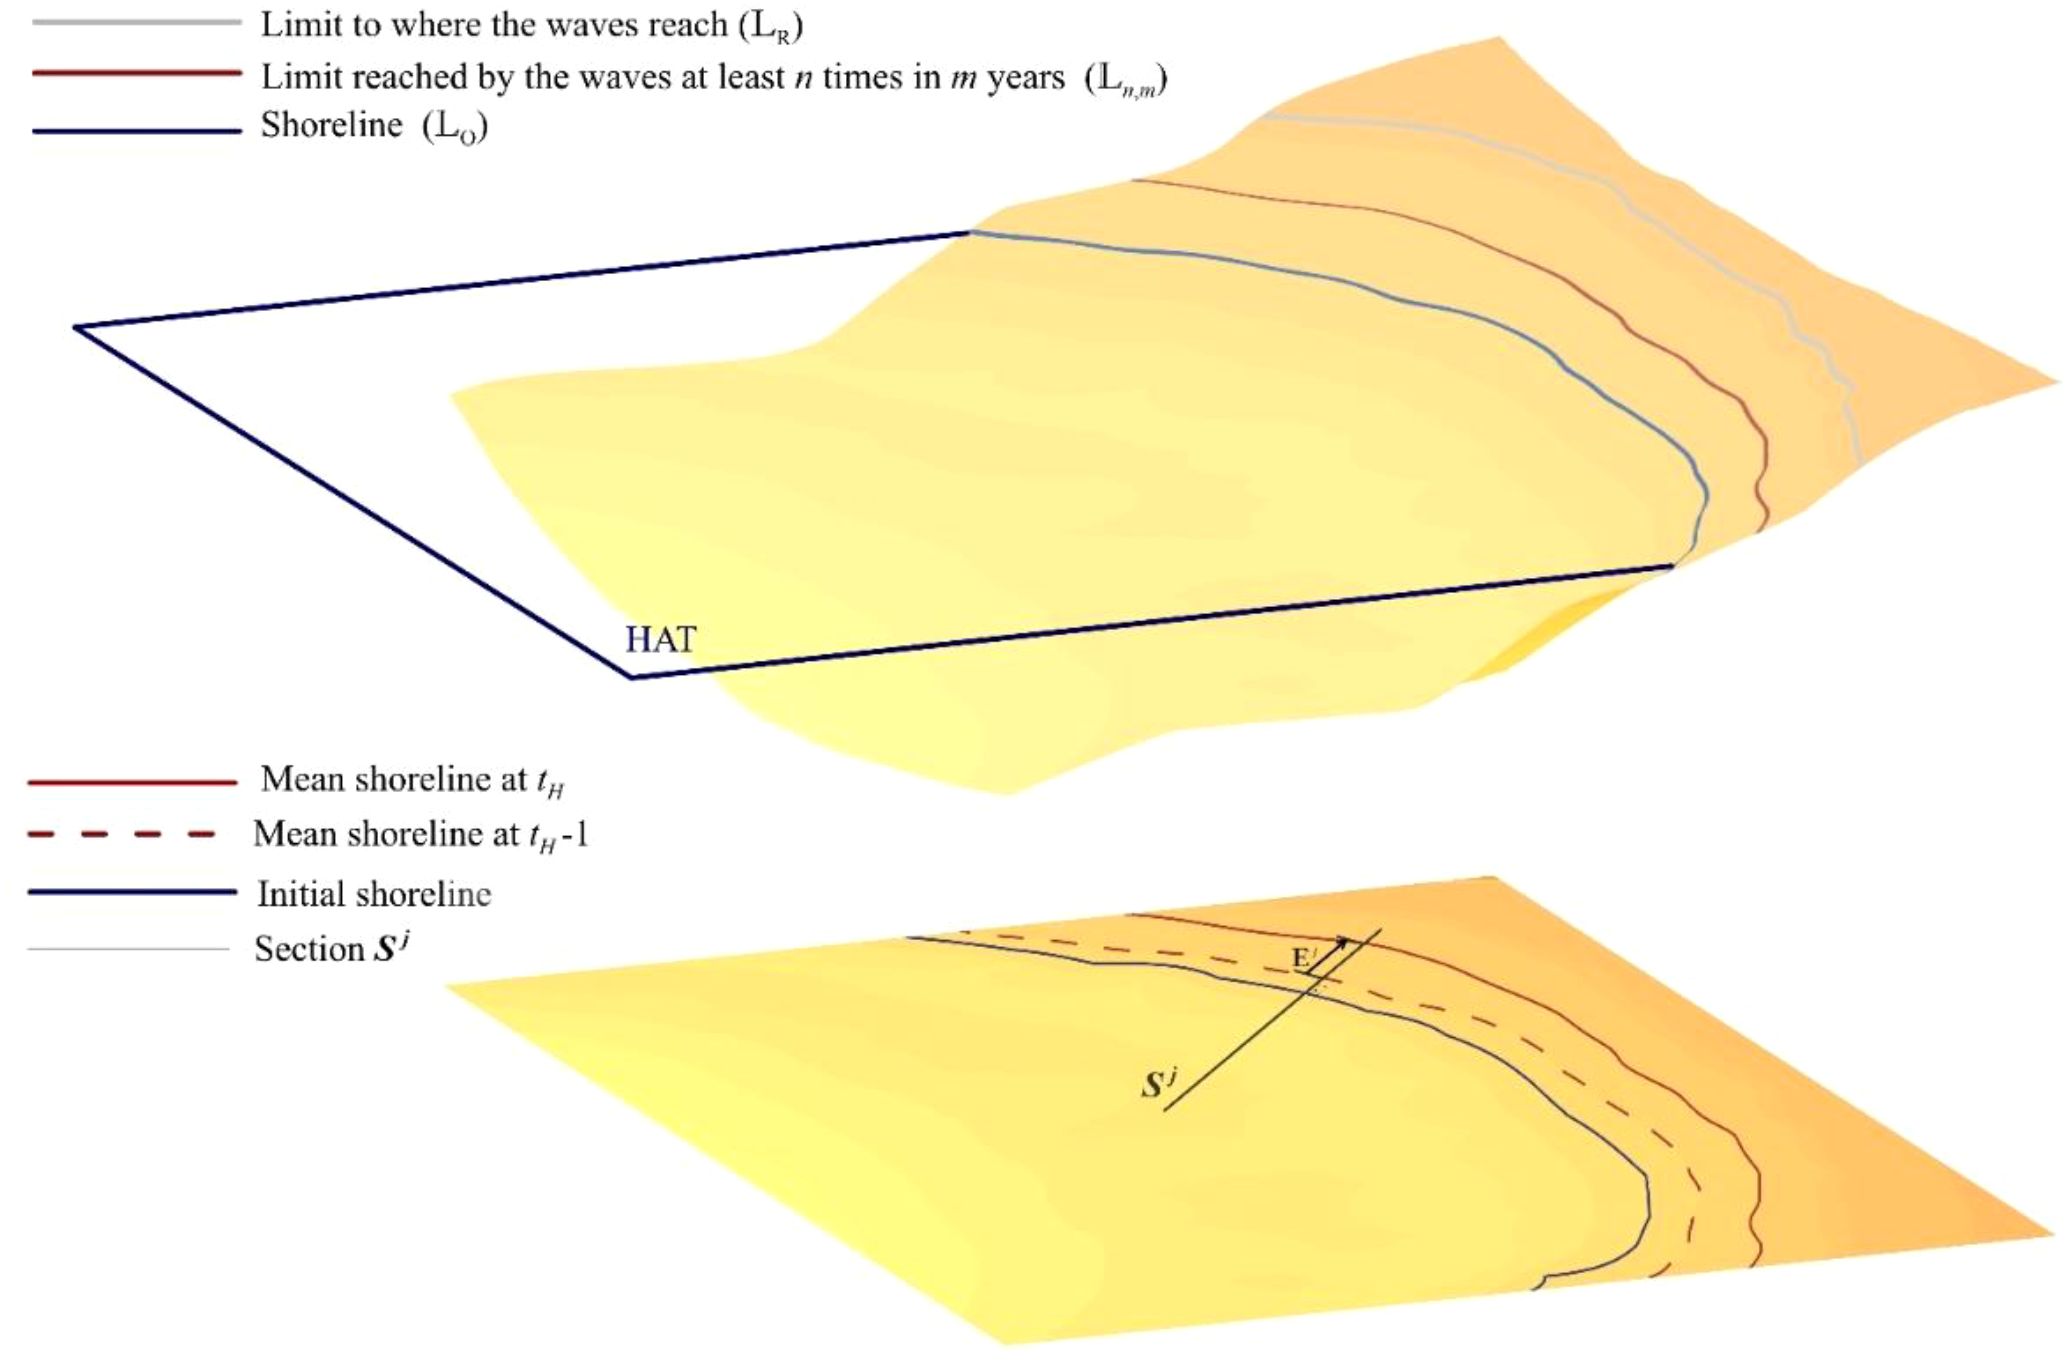
Figure 2. Sketch of some of the statistical quantities defined in Table 2, shown over a 3D image (upper panel) of a beach and a plan view (lower panel).
The random sets defined on Table 2 —standing for a continuous line along the coast— are described statistically using georeferenced isolines of the 5%, 50%, and 95% probabilities. They are derived from probability raster maps where each cell contains a value representing the probability that the cell is flooded or reached by waves, according to the curve’s definition.
The lower panel of Figure 2 illustrates the estimation of 𝔼j for a given year t in one of the simulations. The yearly mean shoreline positions are first computed from the monthly stored curves (see the red lines in the lower panel of Figure 2, corresponding to a generic year t and the previous year, t–1). Then, the distance between each curve and the curve from the previous year (or the initial shoreline position for the first year) is measured along section Sj (black straight line). The sign of the estimate is negative if the shoreline retreats and positive otherwise. In the characterization of the dry beach area loss (𝔸) and the section-based data variables, namely the mean erosion rate 𝔼 j and the entry into a severe regression situation defined by the Bernoulli random variable 𝕏n,mj, the yearly mean value and the 5th and 95th percentiles, are also provided. Finally, for this last indicator, a beach is considered to have entered a severe regression situation if it does so at any of the considered cross-sections. To identify whether such regression occurs, we first compute shoreline changes rates along each beach using a set of cross-shore transects spaced every 50 m along the coastline.
3 Results
Guainos Beach (Figure 1) was selected as a case study to present the results. It is a deltaic beach formed at the mouth of Guainos Creek, an intermittent watercourse in the province of Almería. Summary results for all the beaches covered in the study are also provided. First, the results related to the delineation of the MTD within the Spanish legal framework are presented, followed by those related to concessions and land occupation within the MTD.
3.1 Delineation of the MTD
According to the legal framework outlined in Section 1, the extent to which waves reach, the shoreline and the position associated with the criteria MTD5–5 are critical lines in defining MTD. Figure 3 summarizes the information related to these three curves for tH = 2030, 2050 and 2100 at Guainos beach. Solid lines represent the isolines of the 50% probability positions of each curve, while dash-dotted and dashed lines correspond to the 5% and 95% probabilities, respectively. For reference, the initial shoreline position is also shown. Differences between the 2030 and 2050 projections are minimal due to the steep upper-beach profile and the presence of a pronounced scarp near the shore. All the curves show differences between the curves that delimit the strip within which the line would be with a probability of 90%, showing that those lines are, indeed, strips that need to be stochastically characterized. Due to the steepness of the beach profile, the uncertainty strip for the shoreline is relatively narrow (up to 5 m for 2030–2050 and 10 m for 2100). In contrast, the uncertainty is substantially larger for the other two quantities. MTD5–5 curves are up to 25 and 60 m far from each other and for MTDW differences up to 50 and 80 m for 2030–2050 and 2100 can be, respectively, found. This occurs because the wave runup levels — both the maximum values and those reached at least five times within a five‐year period — are substantially higher than the highest astronomical tide and exceed the elevation of the steepest beach scarp, reaching a more gently sloping upper beach platform. Regarding the differences between the MTD5–5 and MTDW curves, although their 50% probability isolines are quite similar, the isoline of 5% probability of the MTDW line is consistently further inland than the corresponding MTD5–5 line because it accounts for all wave events, with differences up to several tens of between them. Accordingly, as expected, MTDW represents a more restrictive criterion.
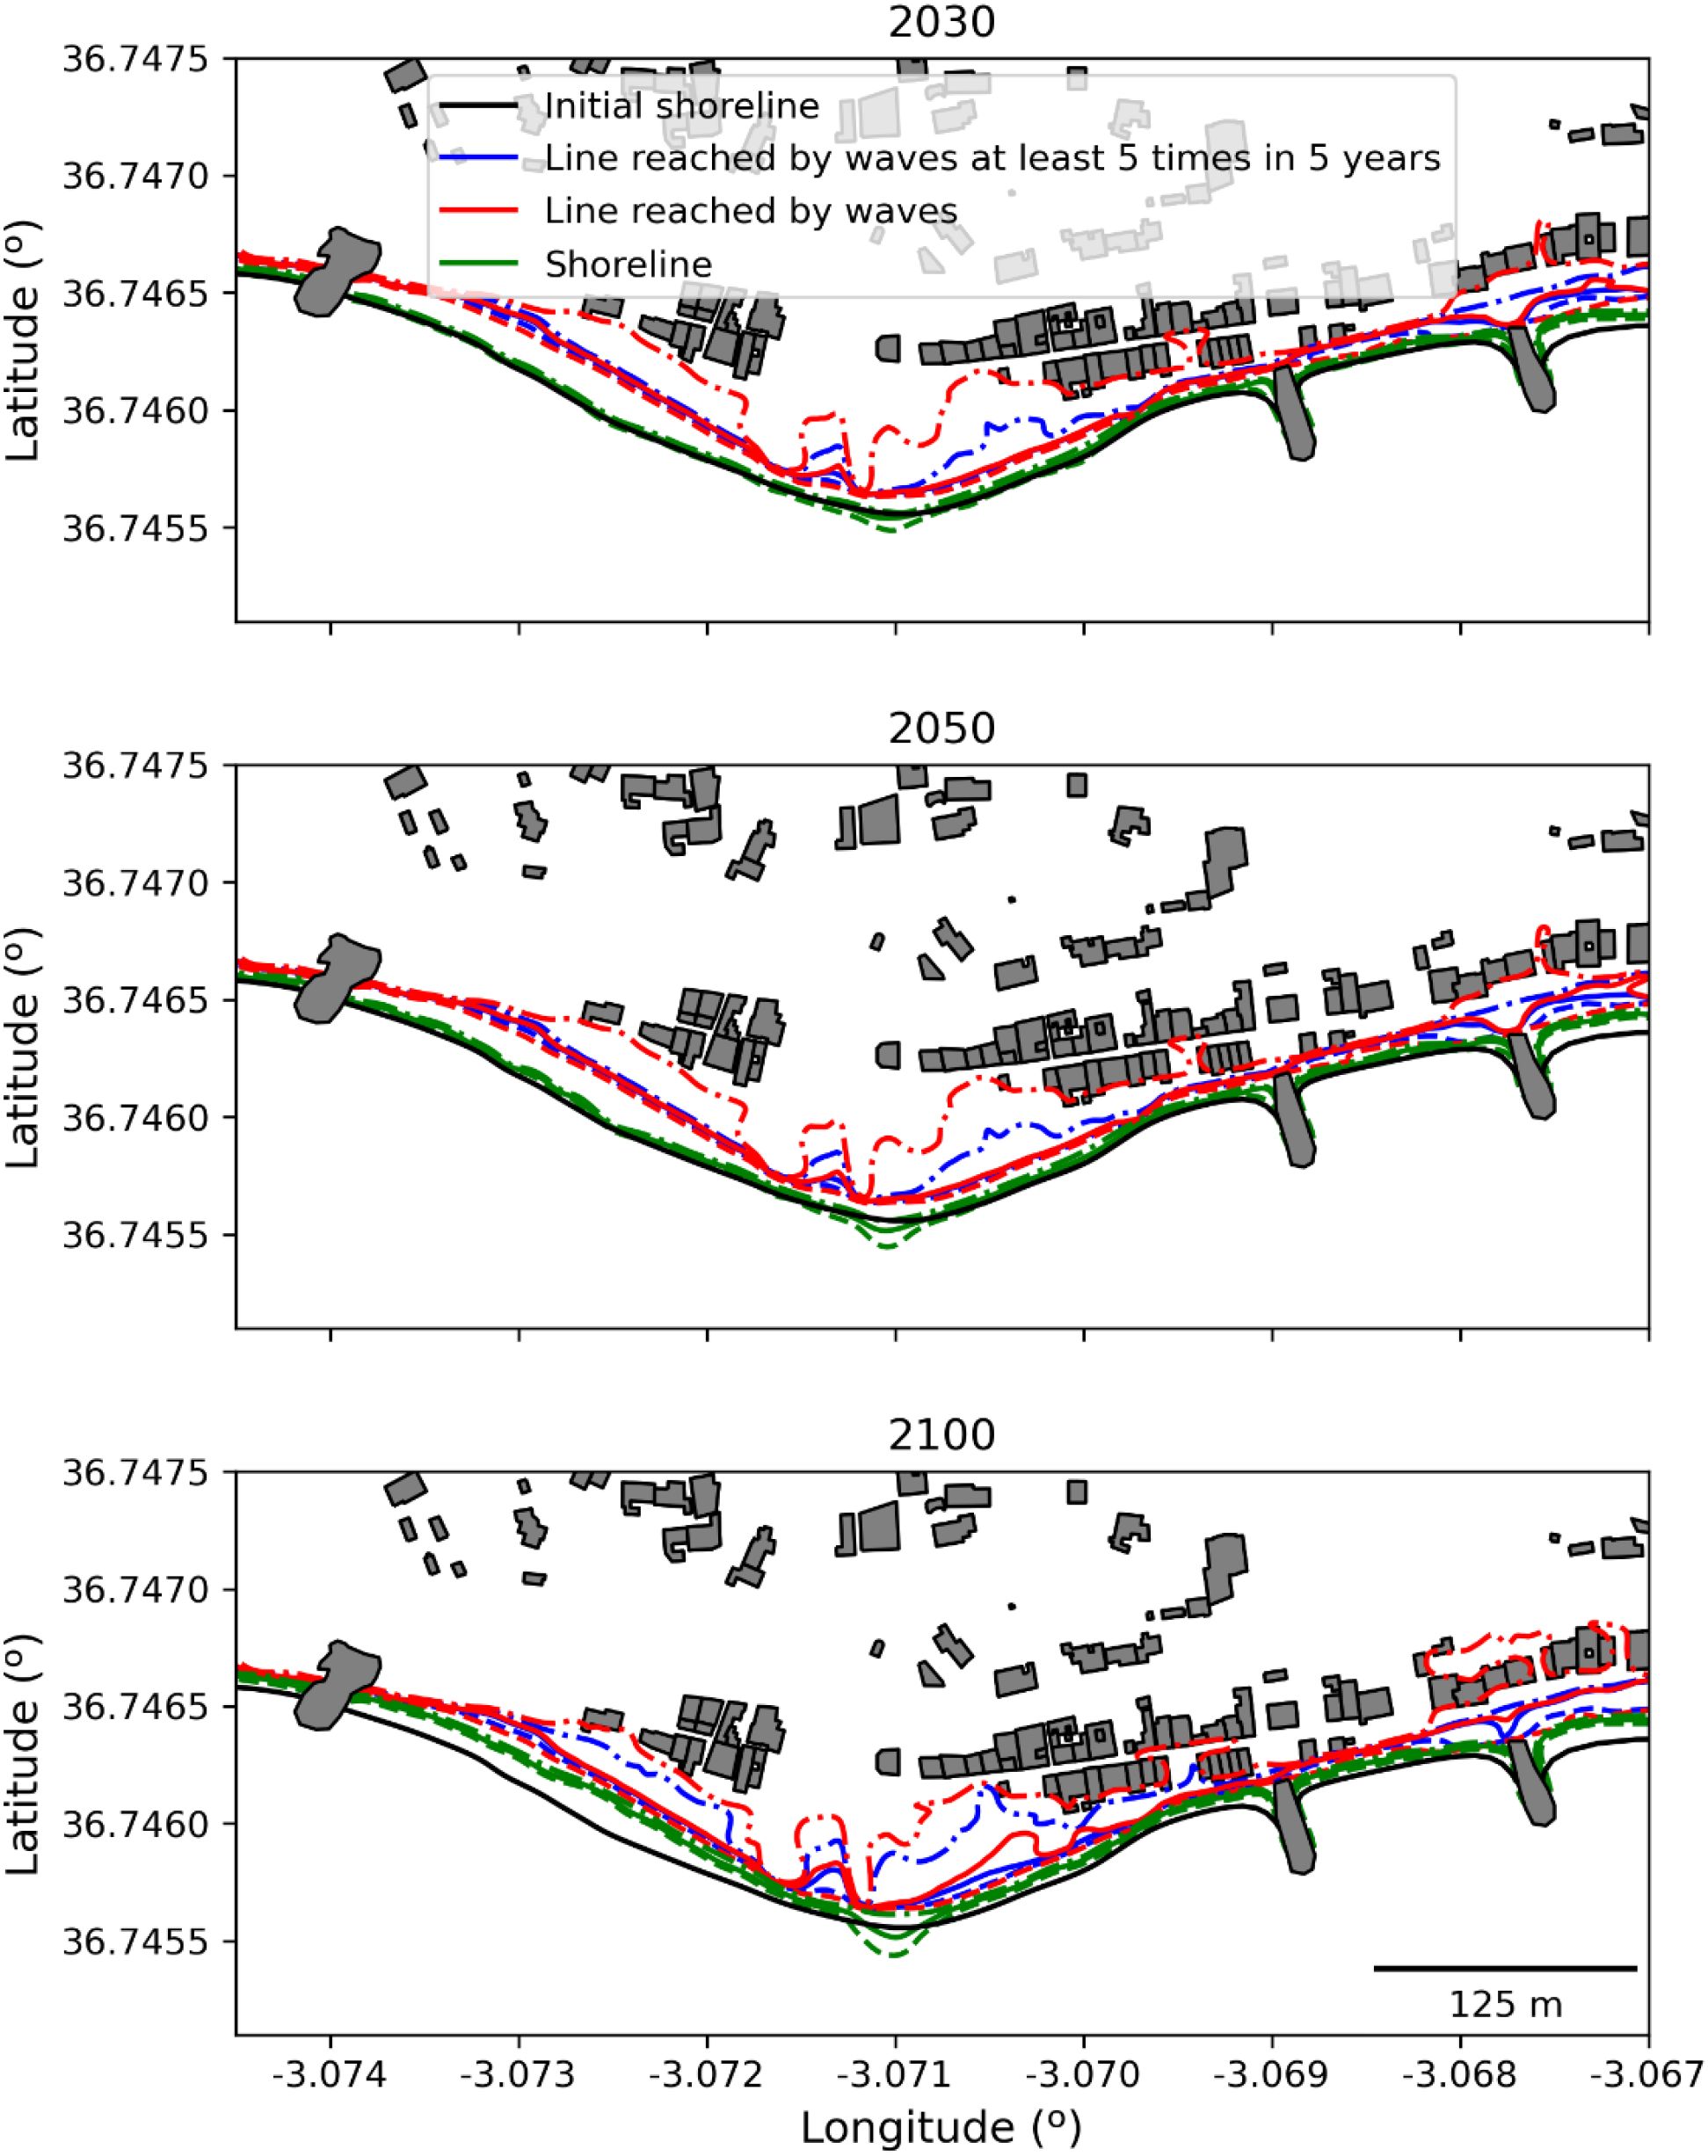
Figure 3. Statistical characterization of the shoreline (𝕃O) and the curves associated to MTDW and MTD5–5 at Guainos beach: the 50%, 5%, and 95% probability levels are indicated by solid, dash-dotted, and dashed lines, respectively.
Given the previously discussed differences and the lack of technical justification for the MTD5–5 criterion, we conducted an additional sensitivity analysis by varying both the number of occurrences and the number of years at Guainos beach, considering values ranging from 3 to 7 for each parameter. Defining MTDn-m as the curve reached at least n times within an m-year period, we calculated the area between MTDn-m and MTD5-5, as well as the lateral boundaries of the beach. A line positioned seawards or landwards relative to MTD5–5 indicates a gain or loss (positive or negative value) in unprotected dry beach area compared to that criterion, reflecting a less or more restrictive approach. Figure 4, depicts for tH= 2030, 2050, and 2100, the mean, 5th, and 95th percentile values of the differences in beach area, expressed as a percentage of the initial beach area (14,590 m²) at Guainos Beach. These estimates are derived from the 50% probability isolines obtained across the 20 realizations. As expected, decreasing/increasing the number of occurrences while simultaneously increasing/decreasing the number of years results in more/less restrictive criteria. Red cells represent a decrease in area compared to the reference case (5-5), while blue cells indicate an increase. In terms of magnitude, the mean percentage variation ranges from -26.40% to 14.58% for 2030, -33.19% to 22.72% for 2050 and -18.91% to 33.43% for 2100. Notably, as the number of occurrences (n) increases, the relative area percentage increases significantly, regardless of the number of years (m). This is particularly evident for n = 3, where area is consistently lost compared to the reference case across all time horizons, and for n = 7, where area is consistently gained. Regarding the number of years (m), as this value increases, the relative area percentage decreases, indicating area loss with respect to the reference case. Moreover, variability due to the number of occurrences is significantly greater than that due to the number of years, the effect is still notable. For example, at m = 3 and tH = 2030, the relative area percentage varies from -13.99% (n = 3) to 14.58% (n = 7). Conversely, for n = 3 and the same tH, the percentage drops from -13.99% (m = 3) to -26.40% (m = 7). These results demonstrate the impact of selecting n-m on the percentage of area gained or lost, highlighting the beach’s greater sensitivity to changes in n than in m under the selected criteria. Notably, the maximum beach loss reaches -33.19%, observed at the 2050 temporal horizon, with n = 3 and m = 7, while the maximum gain reaches 33.43%, occurring at tH = 2050 with n = 7, and m = 3. Regarding the 5th and 95th percentiles, it is important to note that while the value of these percentiles typically follow the trend of the mean—i.e., when the mean is positive, the percentiles also tend to be positive— there are exceptions, particularly along the main diagonal. In some cases, the 5th and 95th percentiles values are up to twice the mean. Additionally, in certain instances, particularly for the 95th percentile, the maximum inundation value defined by the reference case is reached. This finding underscores the considerable sensitivity introduced by the arbitrary nature of this legal criterion in the delimitation of the MTD.
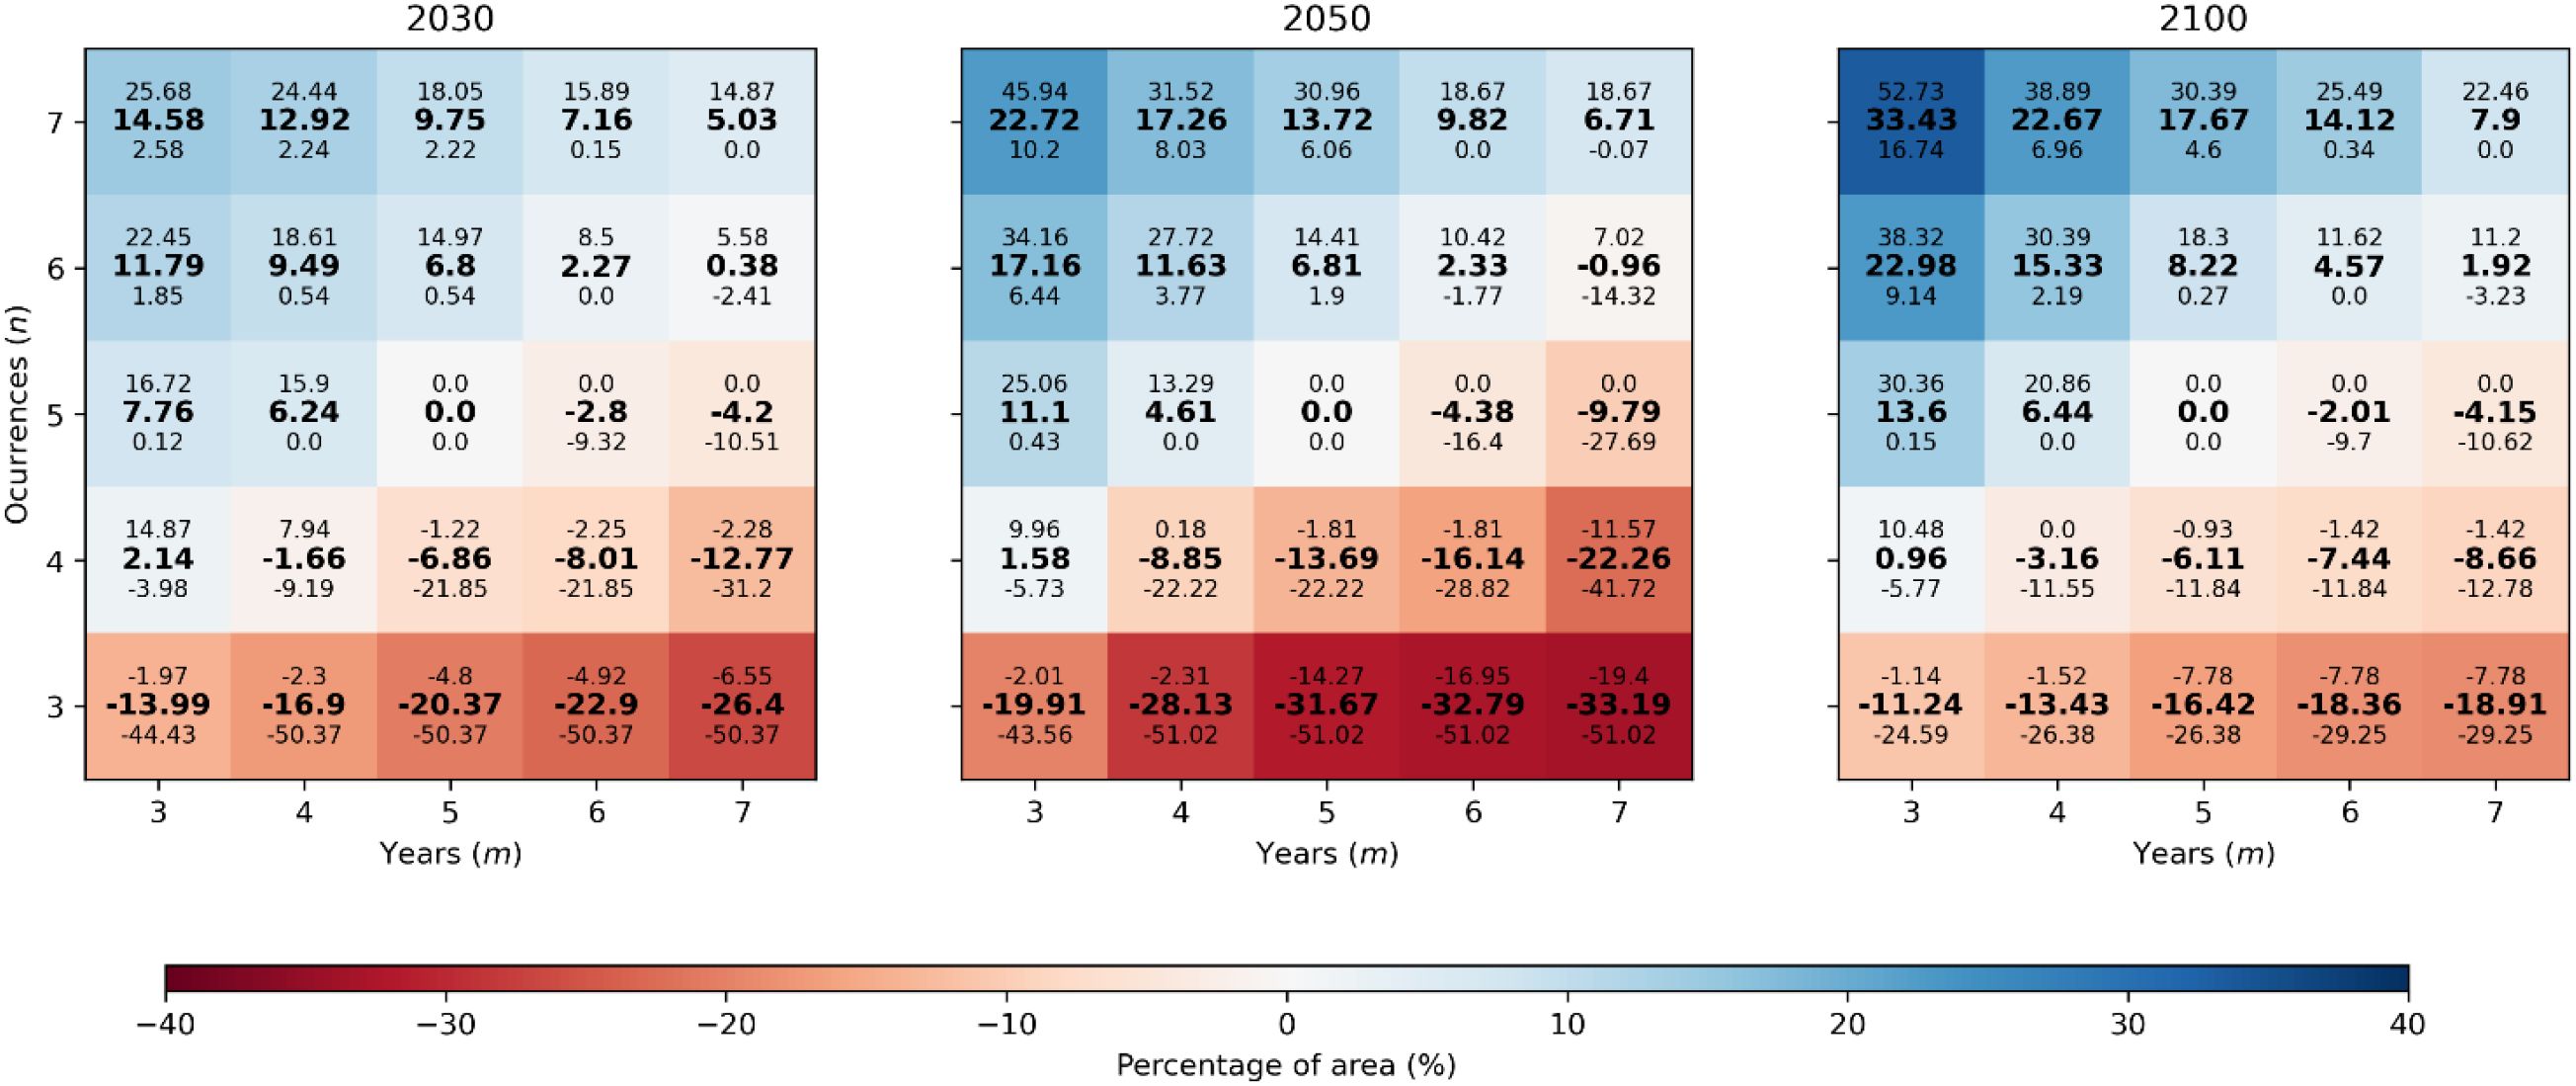
Figure 4. Percentage of differences in areas defined by MTDn-m and MTD5–5 criteria, illustrating the restrictiveness of the MTDn-m criterion relative to the MTD5–5 criterion for three temporal horizons tH = 2030 (left panel), 2050 (mid panel), and 2100 (right panel) for Guainos beach. In each cell, the central value (bold) represents the mean, while the values above and below correspond to the 5th and 95th percentiles, respectively.
The results of the same analysis conducted for all the beaches within the study domain for tH = 2100 are presented in Figure 5. The n-m cases are shown from the least restrictive criteria (6-4) at the top to the most restrictive one (4-6) at the bottom. Only 12 beaches exhibit variations greater than 25% compared to the reference case. These beaches are grouped in clusters and correspond to areas where the beach profile is flat in the swash zone regardless of its orientation. In some cases, even when a berm is present, wave runup exceeds the berm crest, reaching inland areas with gentler slopes. This results in significant differences in the wave-inundated area depending on the frequency (n) and duration (m) values applied in the criteria. Once again, this highlights the sensitivity introduced by the arbitrary nature of this legal criterion.
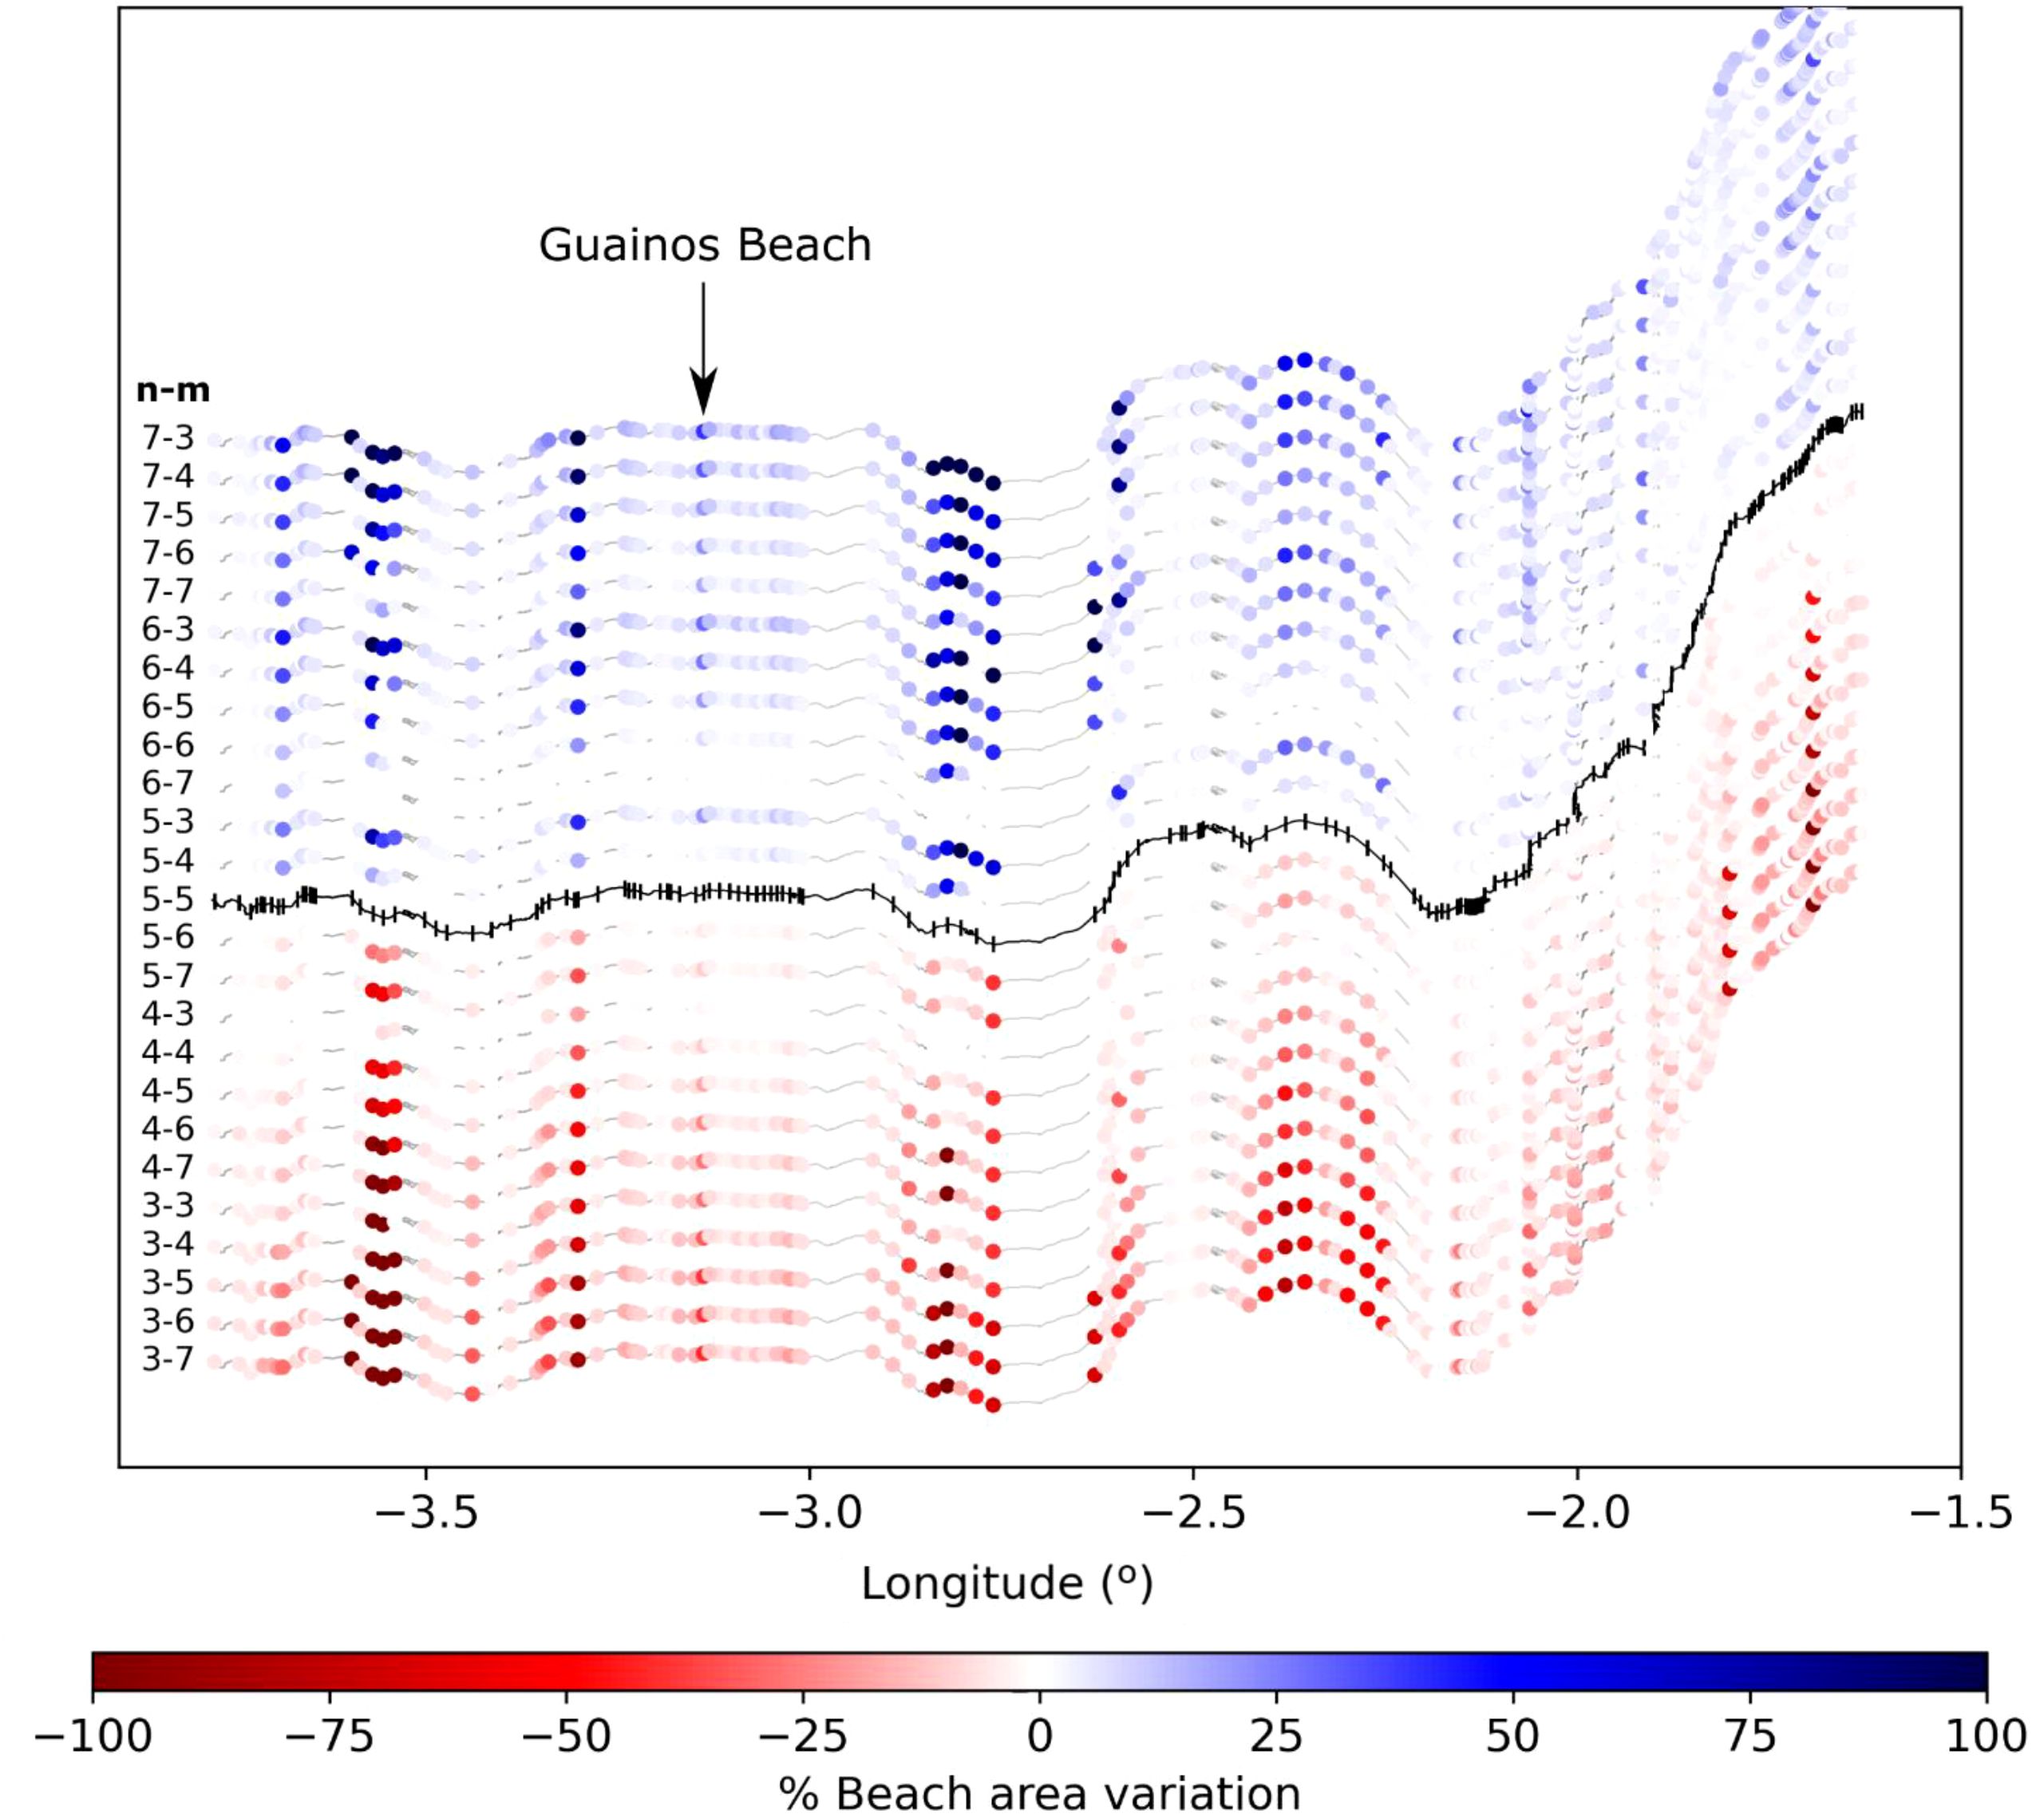
Figure 5. Percentage of differences in areas defined by MTDn-m and MTD5–5 criteria along the coast, across nine criteria that result from varying the number of occurrences (n) and the number of years (m) from 3 to 7. Vertical black lines in the reference case (5-5) represent the position of the beaches.
Table 4 shows for each combination n-m, the number of beaches that fulfil different conditions of beach area variation with respect to the reference case along the coast under study. All the beaches for cases above the reference case increase its area while below of the reference case, all beaches reduce its area. The 90.53% of beaches in case 4–4 remains unaltered (beach area variation lower than the 5%), while 60.53% remains unaltered in case 6-4. The variability between cases is also notable. As example, it is compared cases 4–4 and 6–6 it is obtained that 169/172 beaches remain constant, respectively, and 21/18, 12/7, 6/1, 2/1, 0/0, 0/0 beaches change its area more than 5, 10, 25, 50, 76 and 90%. Others legal criteria will result in beach area variations that will differ much more than explained in the text.
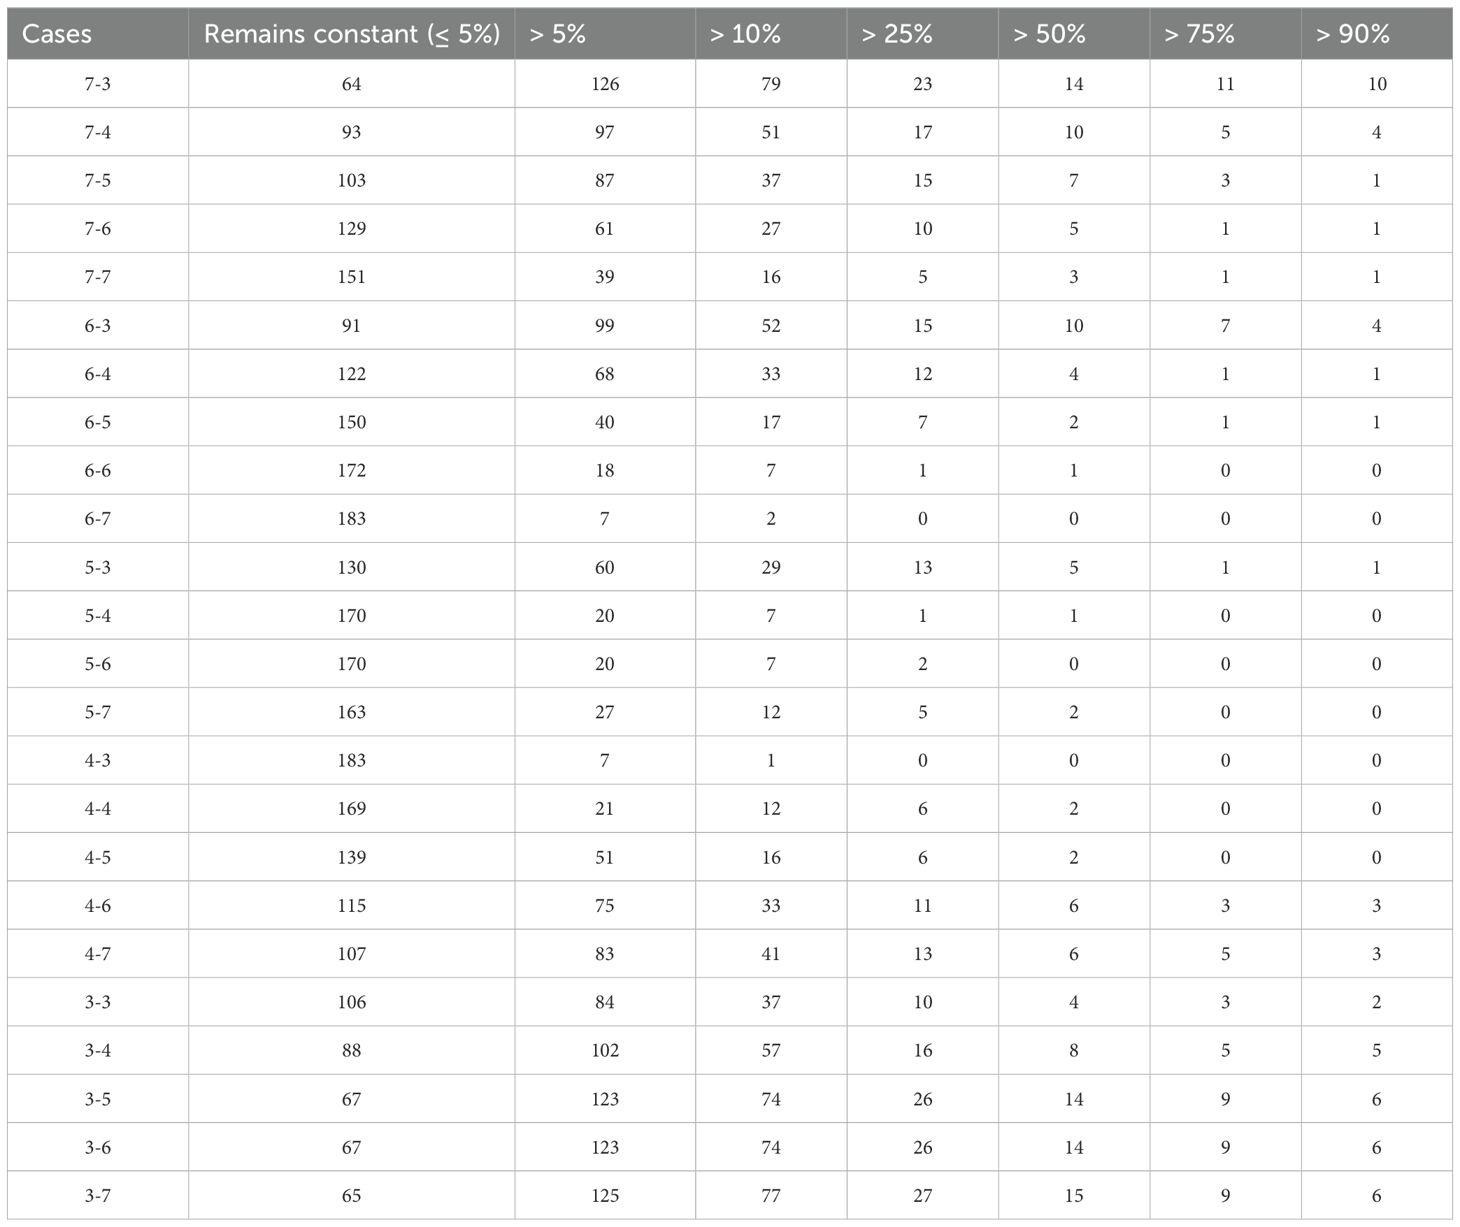
Table 4. The number of beaches in which the beach area variation with respect to the reference case remains constant (the change is lower than 5%) or changes more than 5, 10, 25, 50, 75 or 90%.
To illustrate the seasonal variations in the delineation of zones relevant for decision-making regarding authorizations for the occupation of the MTD by seasonal services, Figure 6 shows the probability isolines of wave reach (i.e., based on the MTDW criterion) for time horizons (tH): 2030, 2050, and 2100, obtained for both PS and OS seasons at Guainos beach. The inundation probability during the peak season (PS) shows significant differences between the western and eastern sides of the river mouth (36.7456°N – 3.0711°W). Differences between isolines for temporal horizons of 2030 and 2050 are almost negligible. For tH = 2100, the isolines shift slightly landward, with the change being more noticeable near the river mouth. On the eastern side of the river mouth, at tH = 2030 and 2050, the 95% probability isoline for the PS season shows a slight landward retreat near the mouth, reaching up to the first row of buildings, while the other isolines remain stationary. By tH = 2100, the 95% probability isoline advances over 30 m inland, nearly reaching the first row of buildings. The 50% and 5% probability isolines also show a landward shift near the eastern vertical breakwater. The off-peak season (OS) exhibits similar results for the 2030 and 2050 horizons, with more noticeable landward shifts of the 95% isoline —approximately 40 m on the western side and 60 m on the eastern side of the river mouth. The 50% probability of inundation isoline for tH = 2100 outlines a markedly different beach configuration. In all cases, the most significant differences in the delimited areas between PS and OS are observed along the 95% probability isoline, with discrepancies reaching up to 100 m.
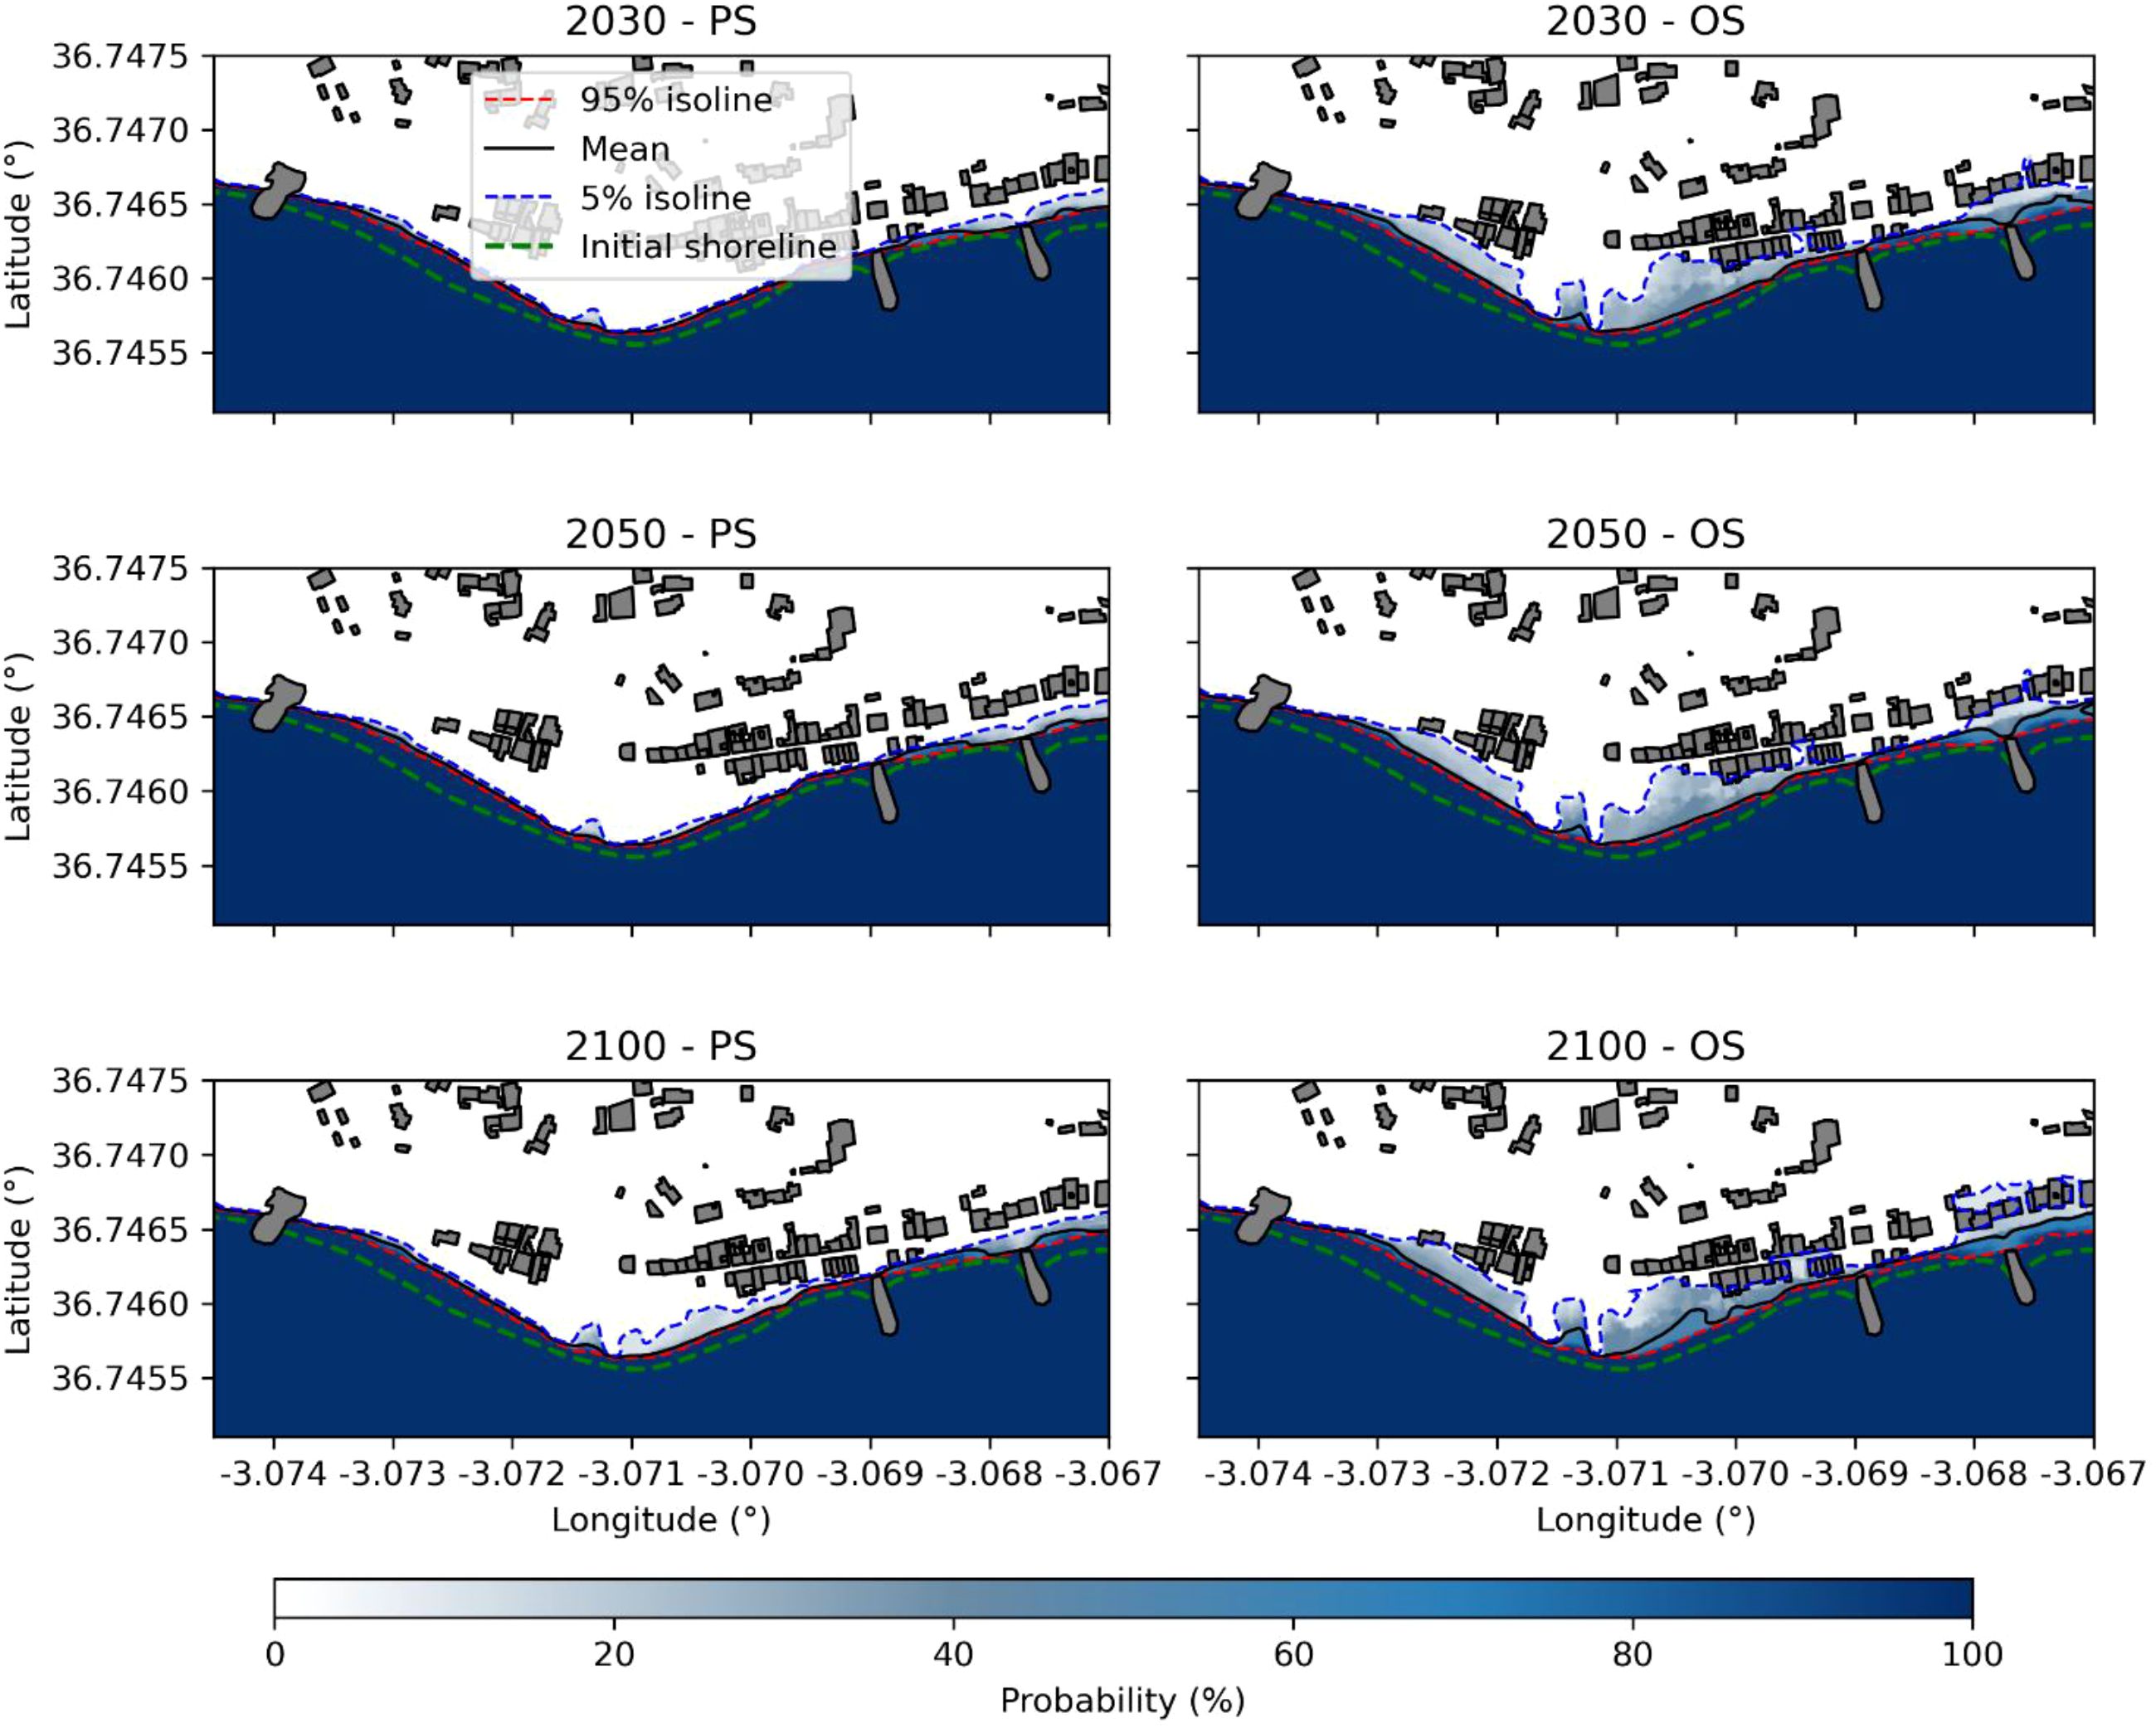
Figure 6. Probability contour map characterizing the criteria MTDW for PS and OS seasons and tH equals to 2030, 2050 and 2100 at Guainos beach.
The aforementioned differences are attributed to the pronounced seasonal variability in both total sea level and the associated run-up, as illustrated in Figure 7. The figure shows the mean, 5th, and 95th percentile values of the maximum levels recorded during the PS (red) and OS (blue) seasons over the entire analysis period. Both series exhibit the characteristic upward trend of mean sea level, with an approximate increase of 0.008 m per year. In addition, the observed difference between the mean PS and OS values is approximately 50 cm and remains nearly through the year 2100. It is also important to note that the difference in variability between the PS and OS periods is 1.5 and 0.75 m, respectively, and likewise remains nearly constant over time. The distribution of water levels relative to the mean value is asymmetric, with the 5th percentile generally closer to the mean than the 95th percentile for both stations. During PS, the 5th percentile is about 30 cm below the mean, while the 95th percentile is nearly 50 cm above it. For OS, these values increase to 50 cm and 1 meter, respectively. Some moderate storms caused levels to reach as high as 3.87 m (see the year 2072 in OS season).
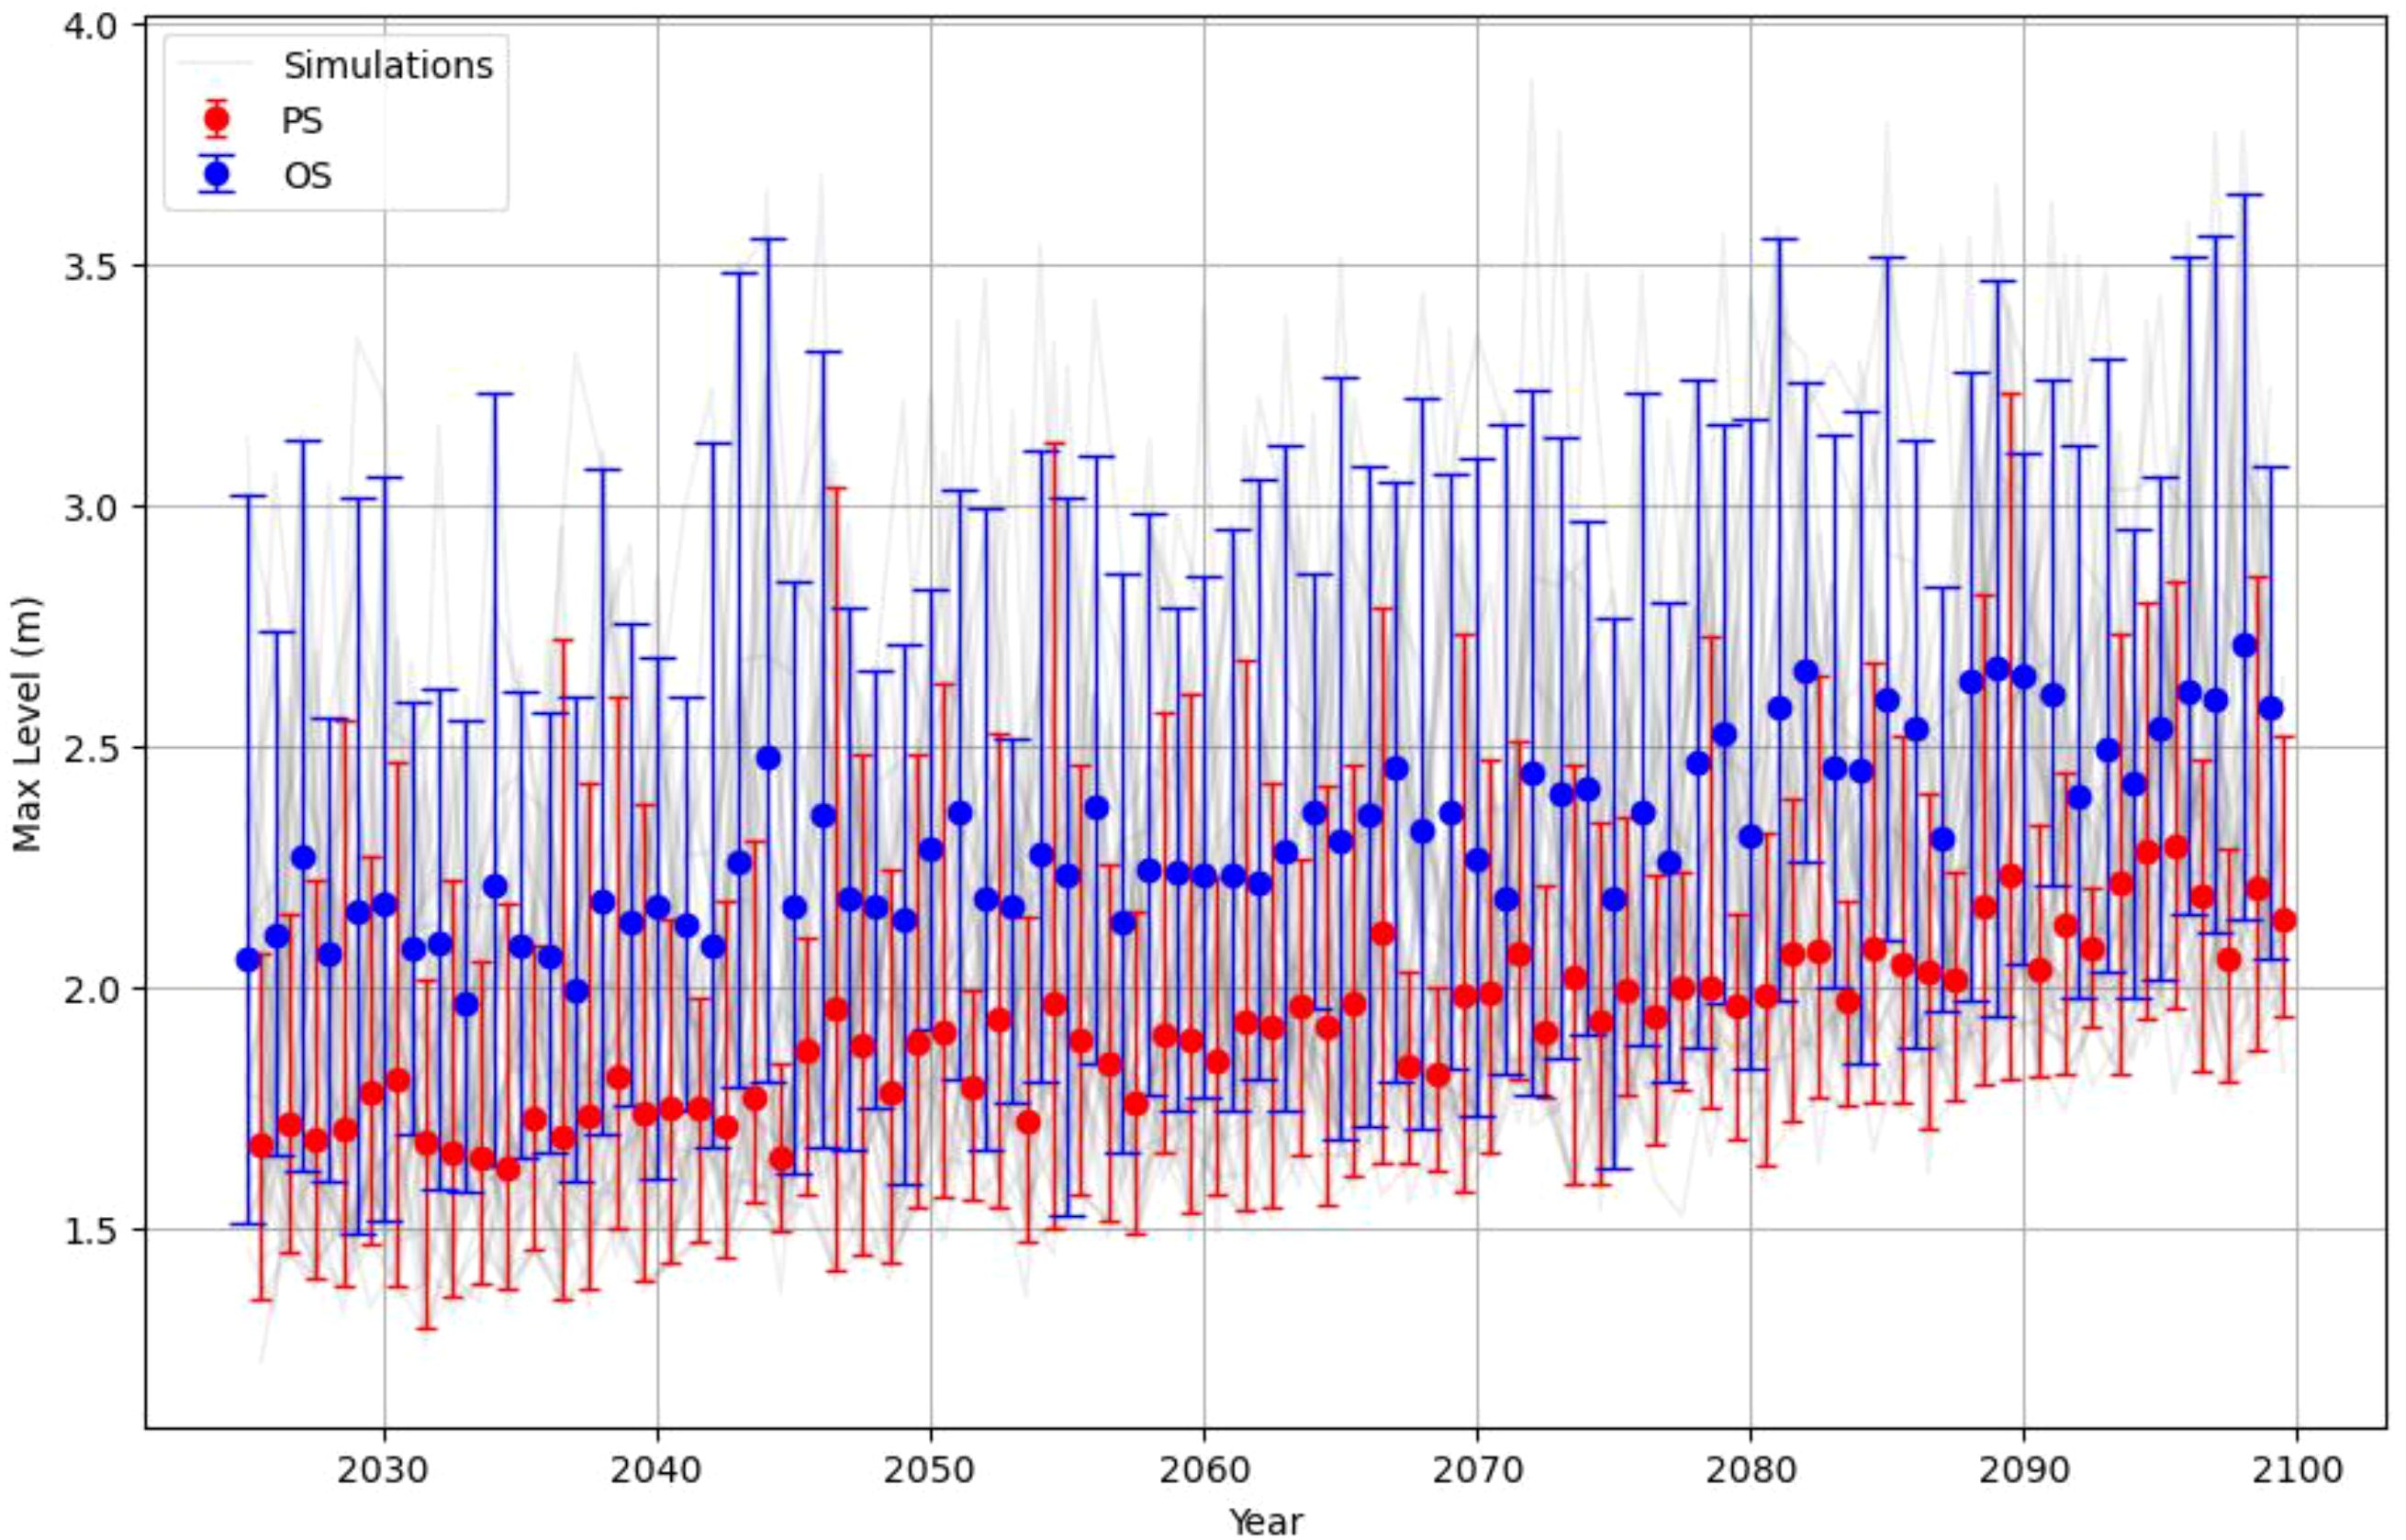
Figure 7. Interval plot (mean values and 5th, 95th percentiles) of maximum sea levels (including the run-up level) during PS and OS along the period of analysis.
3.2 Concessions and land occupation within the MTD
3.2.1 Dry beach area lost
Figure 8 shows the percentage of dry beach areas lost relative to the initial dry beach area, estimated from the mean MTDW line, and its spatial variation along the coast by the year 2100 for both tourist seasons. On average, a difference of approximately 15% in dry beach area can be observed between the PS and OS. During the PS season, most beaches exhibit dry beach losses ranging uniformly between 20 and 60%. The clusters with a strong area variation highlighted in Figure 5, persists and new groups of beaches with substantial losses emerge, particularly during the OS season. The eastern sector of Almería (from 2.1°W eastward), which previously showed almost no significant dry beach area loss, now includes more than 15 beaches with losses exceeding 80%. Furthermore, during the OS season, a substantial proportion of beaches (around 40%) are projected to experience dry beach losses of approximately 80% by tH = 2100. However, only 33% of those severely eroded beaches remain in this condition during the PS season. That implies that 26% of the beaches along the coasts of Granada and Almería will experience a permanent and significant reduction in dry beach areas by 2100.
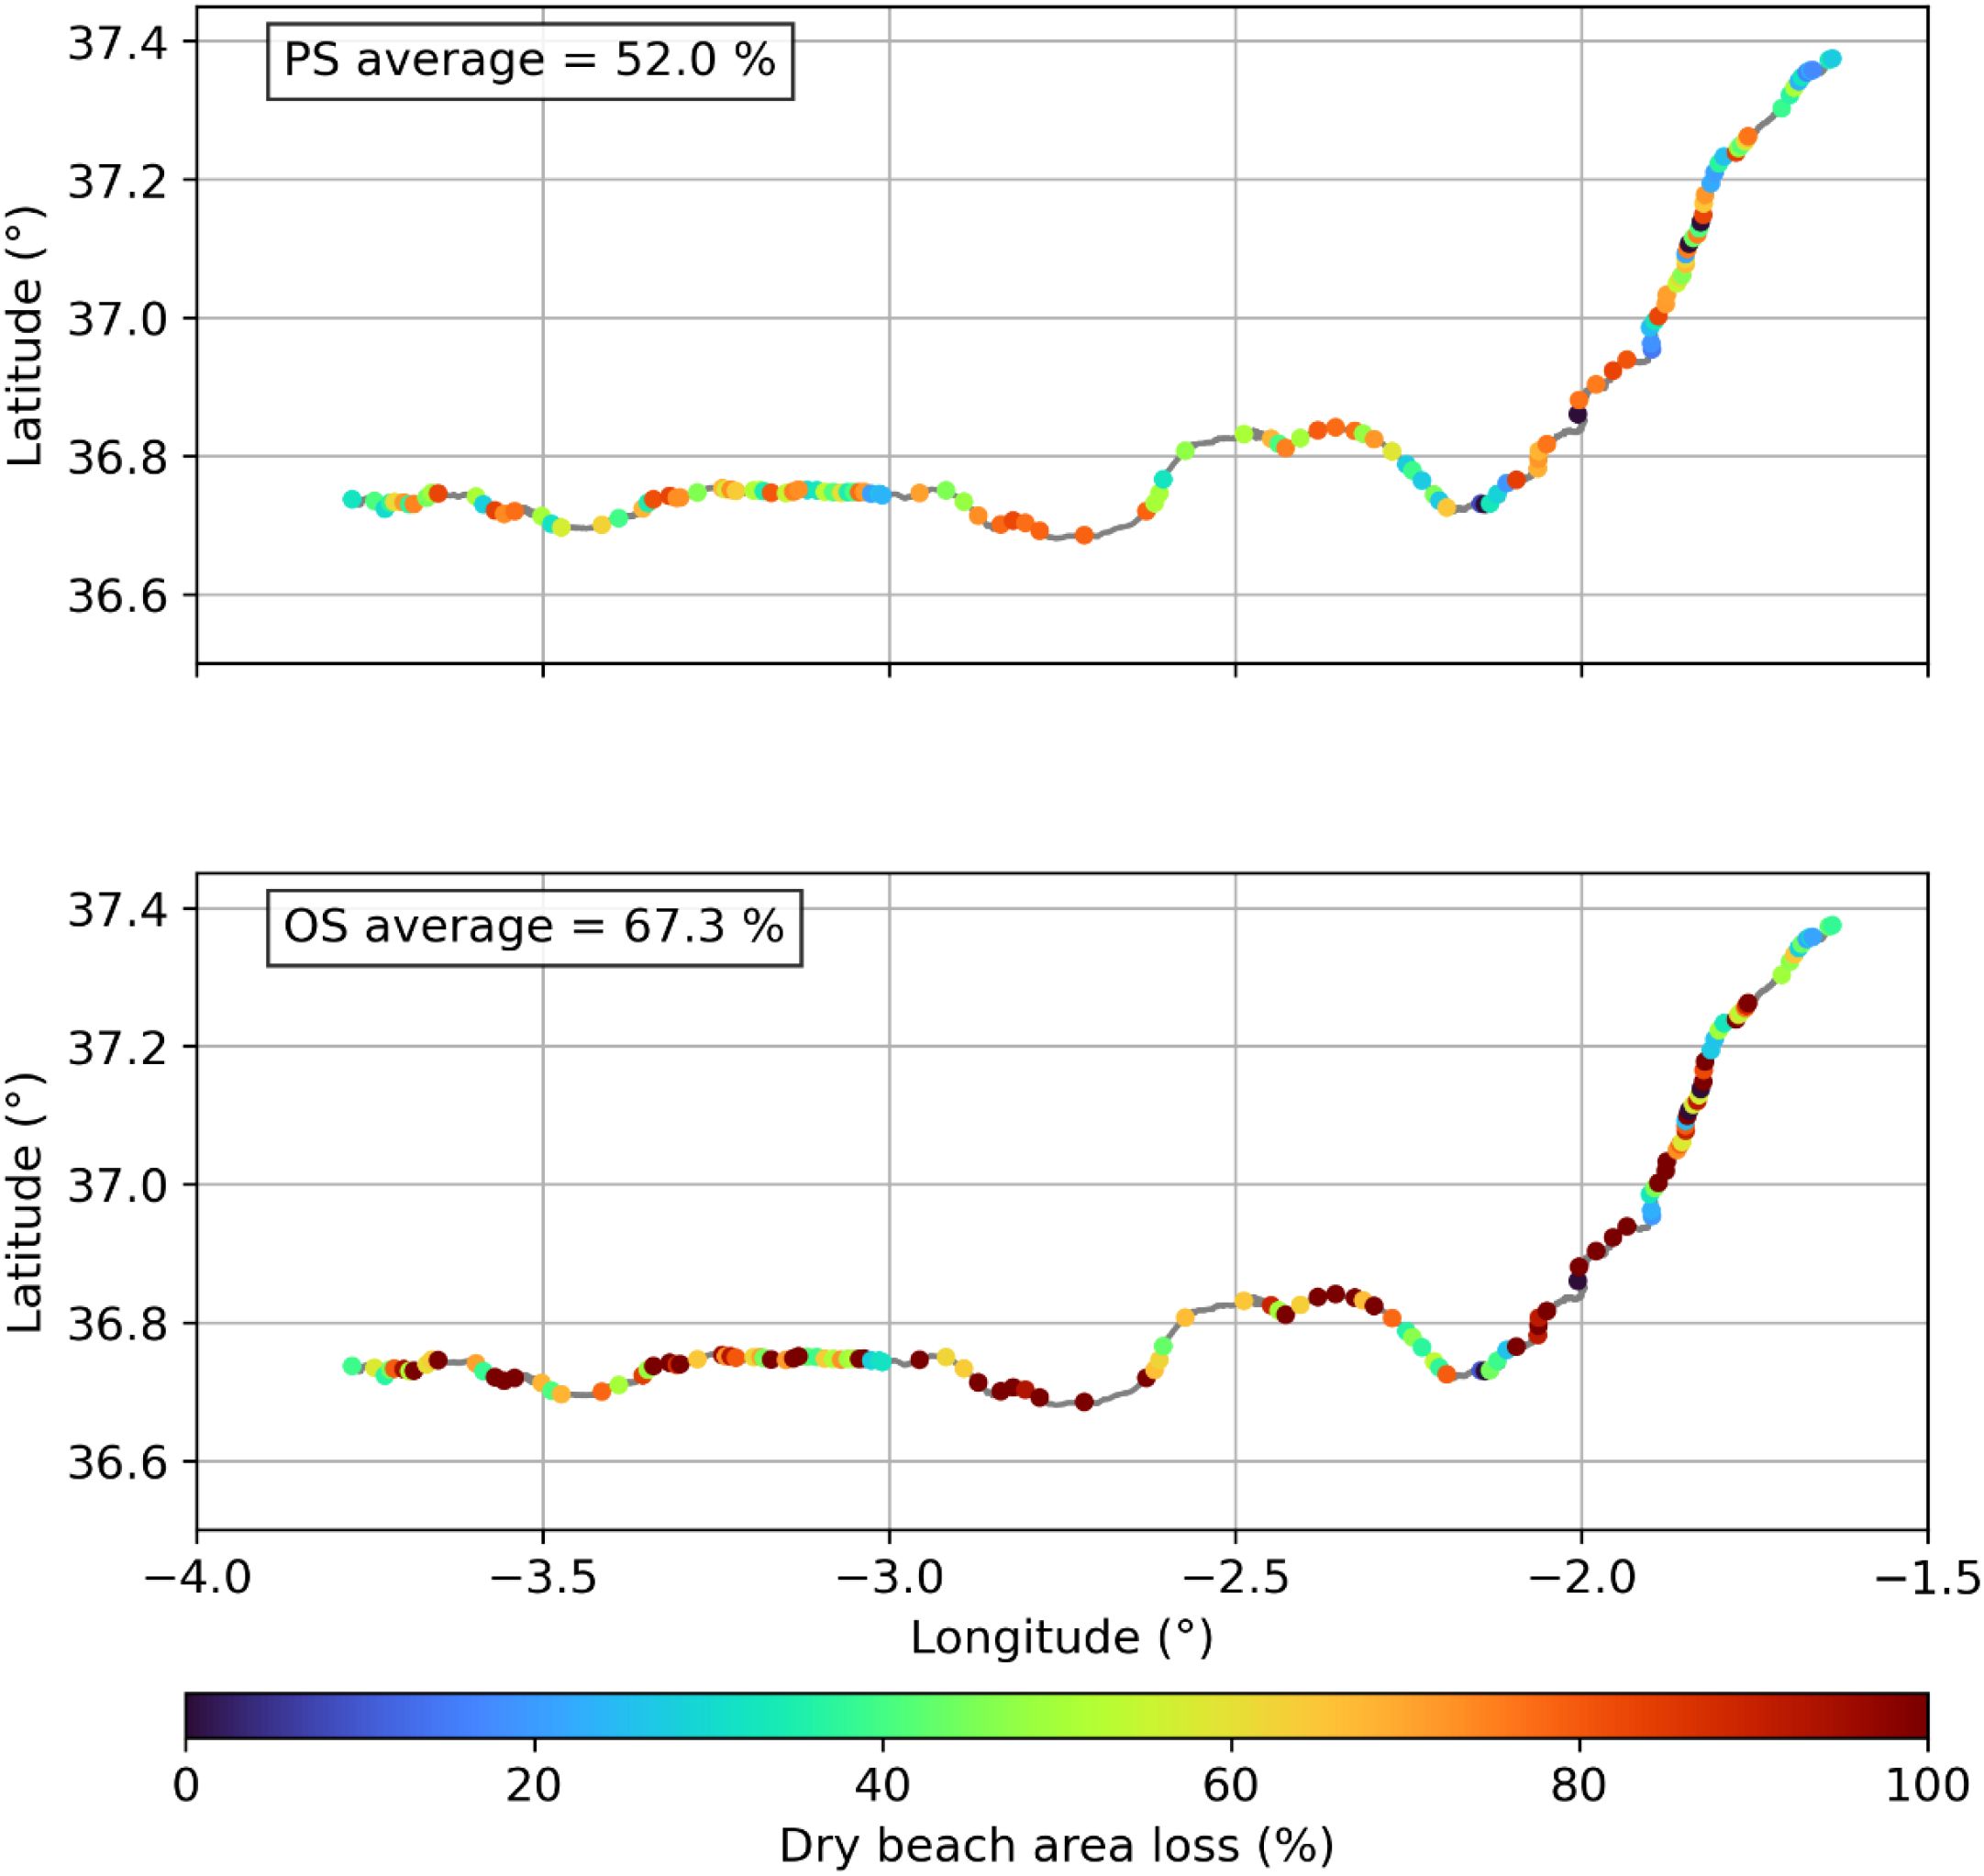
Figure 8. Variation along the coast of the percentage of dry beach area with respect to the initial dry beach area, estimated from the line corresponding to the mean value of MTDW by 2100.
3.2.2 Average annual erosion/accretion rate up to 2100
Annual erosion and accretion rates are calculated based on the temporal evolution of shoreline position for each transect, as explained in Table 3. As an illustrative example, Figure 9 presents three time series of mean erosion/accretion rates, along with their corresponding uncertainty bands defined by the 5th and 95th percentiles, at three distinct cross-shore transects in Guainos Beach. Section 2 is located west of the river mouth, while Sections 7 and 9 are on the eastern side, with Section 9 situated between groins.
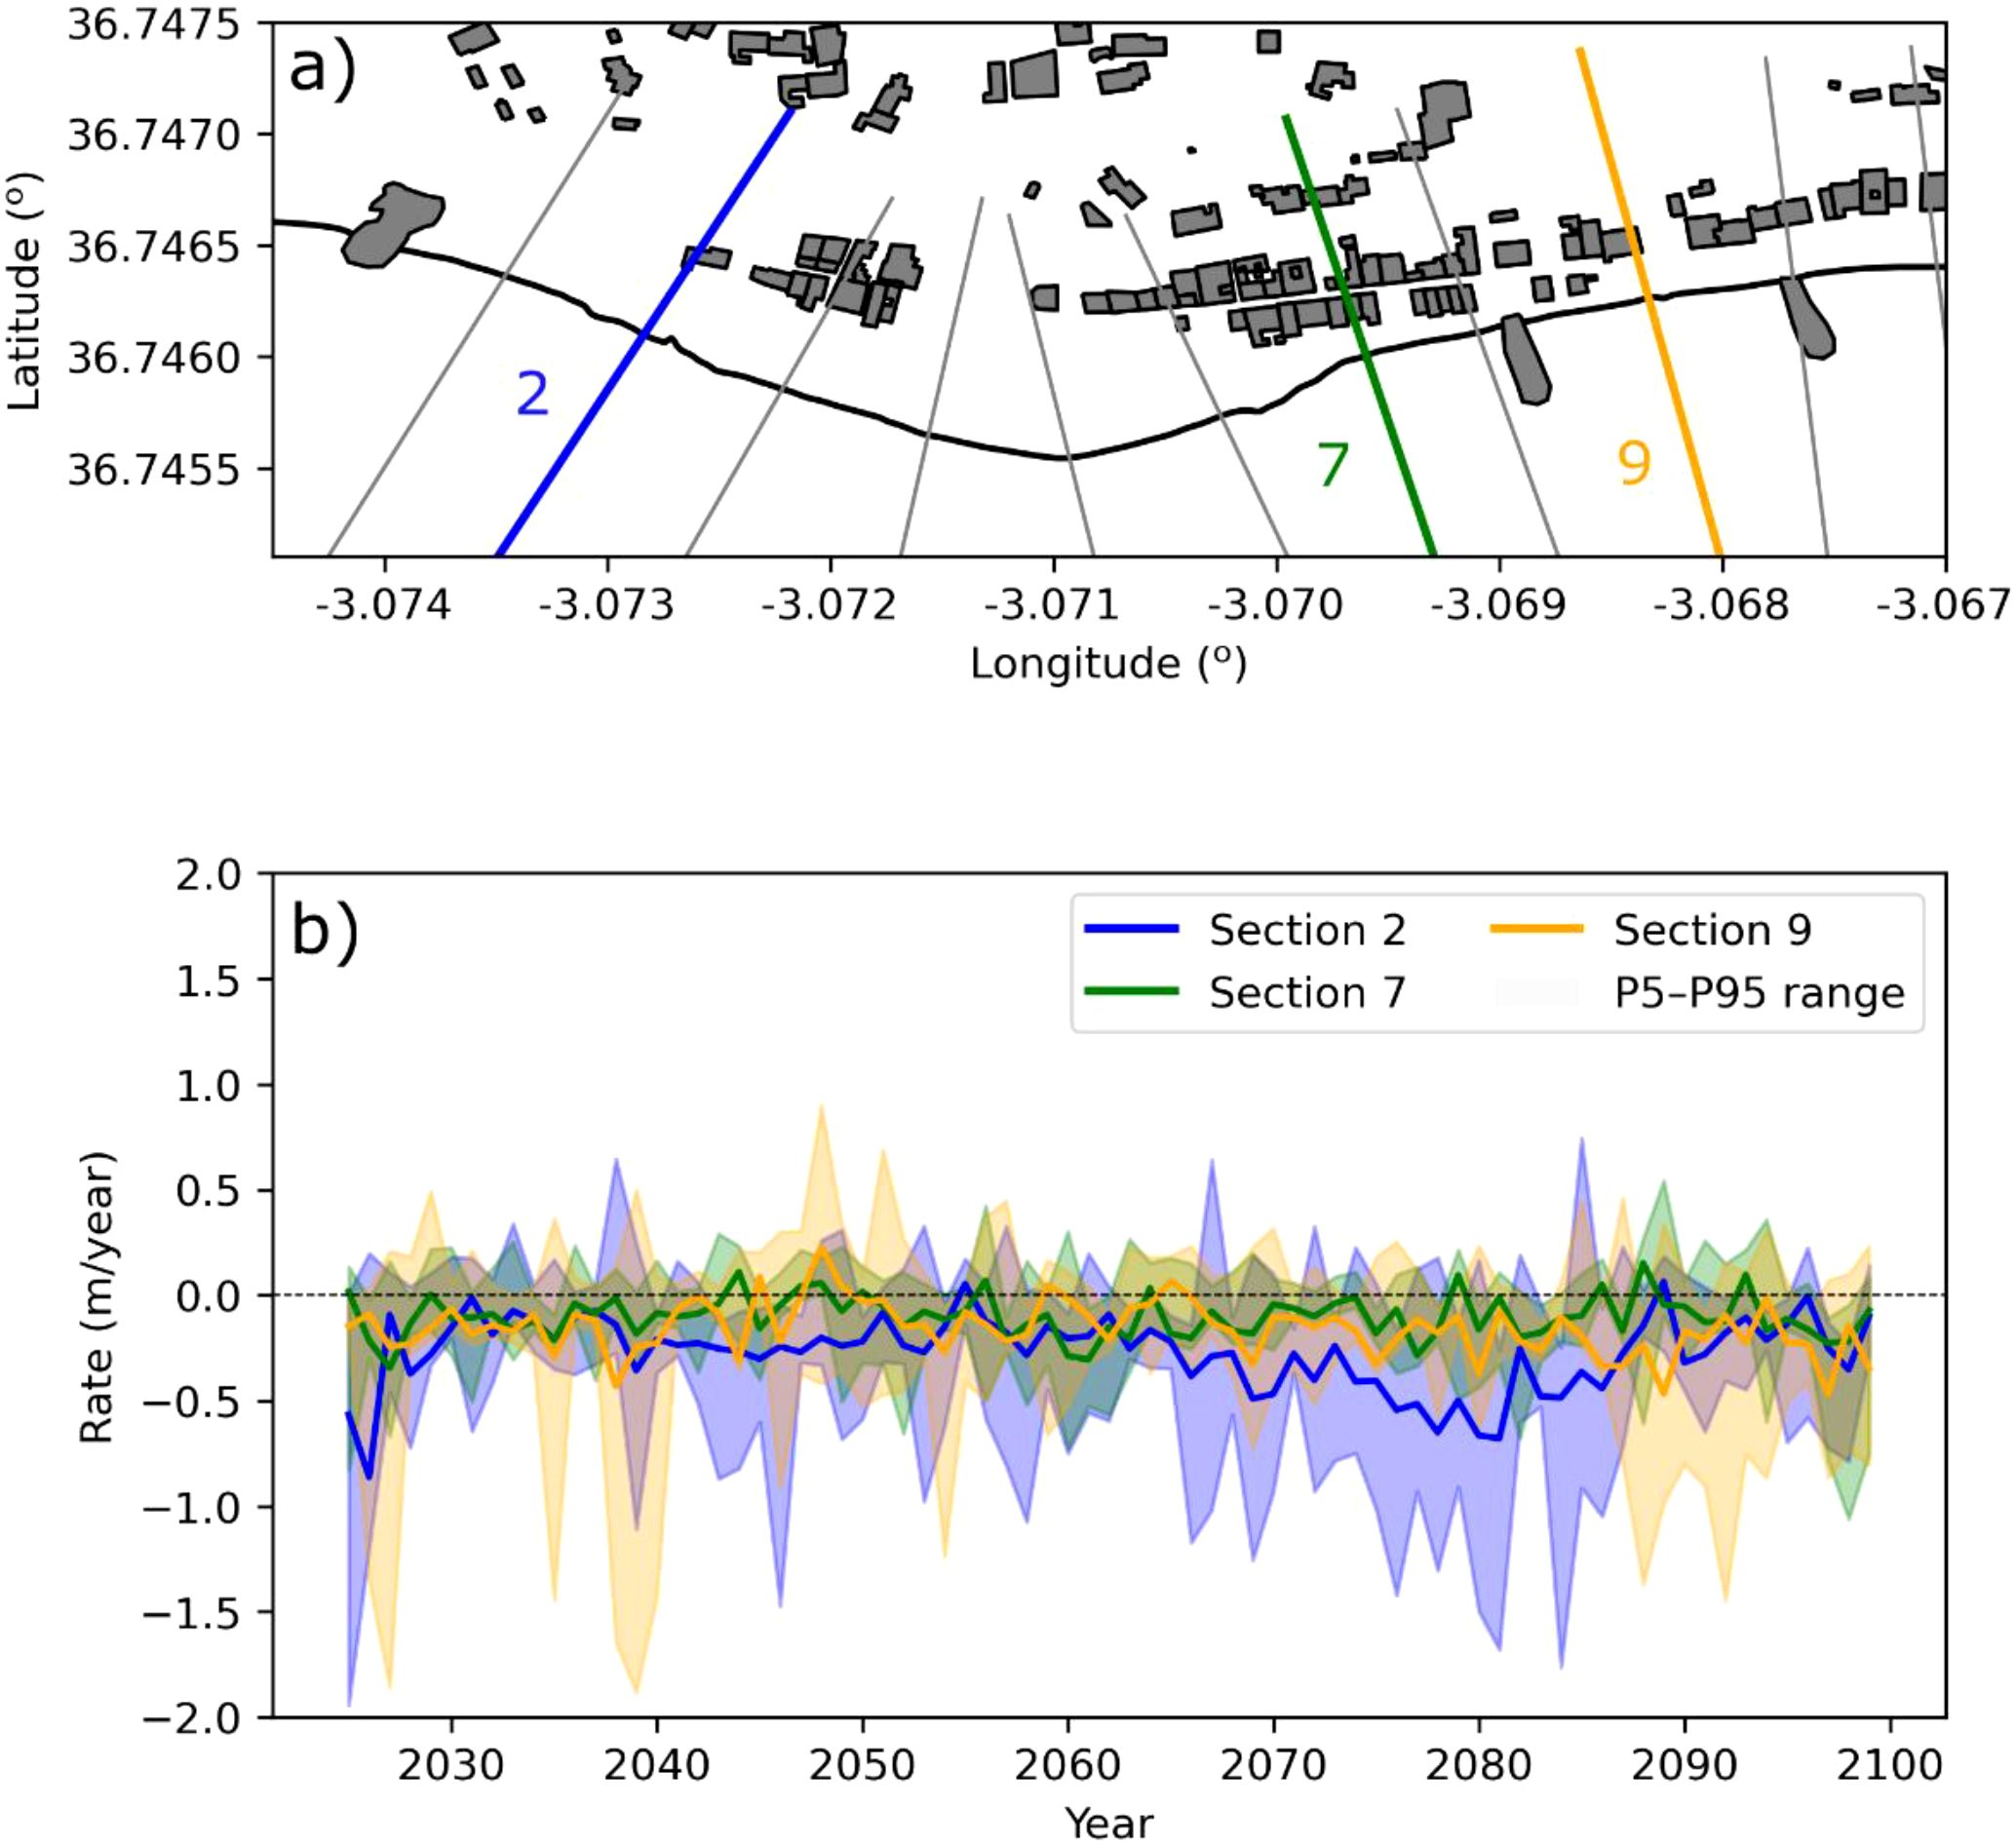
Figure 9. Average annual erosion/accretion rate at Guainos beach. (a) Cross-sections along the beach, and (b) temporal series of erosion/accretion rates along three transects.
Section 2 shows a persistent trend toward erosion, with a transitional phase until 2032, during which a rate of 0.15 m/year is observed. This rate increases to 0.75 m/year by 2082, followed by greater variability toward the end of the century. In contrast, Section 7, where buildings are closest to the sea, remains relatively stable with fluctuating rates bounded by ±0.2 m/year. Section 9 exhibits rates ranging between -0.5 and 0.2 m/year until 2065, after which they become consistently negative in the latter part of the century.
It is important to highlight that the variability among realizations in Sections 2 and 9 is significant. For example, in Section 2, the 5th percentile is approximately twice the mean erosion rate for much of the study period. In Section 9, the difference between the 5th percentile and the mean reaches almost 2 m/year in 2038 and exceeds 1 m/year in 2090. In any case, these erosion rates, with maximum values of up 2 m/year, remain well below the 5m/year indicated by the legal framework as the threshold for a beach to be considered in severe regression.
There is no technical justification in RGV and RGF for the R5–5 criterion to declare that a beach has entered a severe regression state. We illustrate the sensitivity of this criterion in a manner similar to MTD5-5. We define Rn-m as the criterion that corresponds to experiencing a shoreline retreat of more than n m over m consecutive years.
3.2.3 Severe regression state of a beach
Figure 10, depicts along the entire coast of Granada and Almería, the beaches that enter a state of severe regression in at least one of the realizations. The dots indicate the beach locations, while their sizes are proportional to the estimated probability of being under severe erosion. This probability is calculated as the proportion of realizations in which the beach experiences this situation. The color of the points corresponds to the mean value calculated from the years in each realization in which the beach first enters a state of regression. Beaches for which the average year of entry is the same across all realizations are marked with an arrow. To prevent information overload, a histogram illustrating the years and frequency of occurrence is provided for only a subset of the remaining beaches, highlighted with a red square.
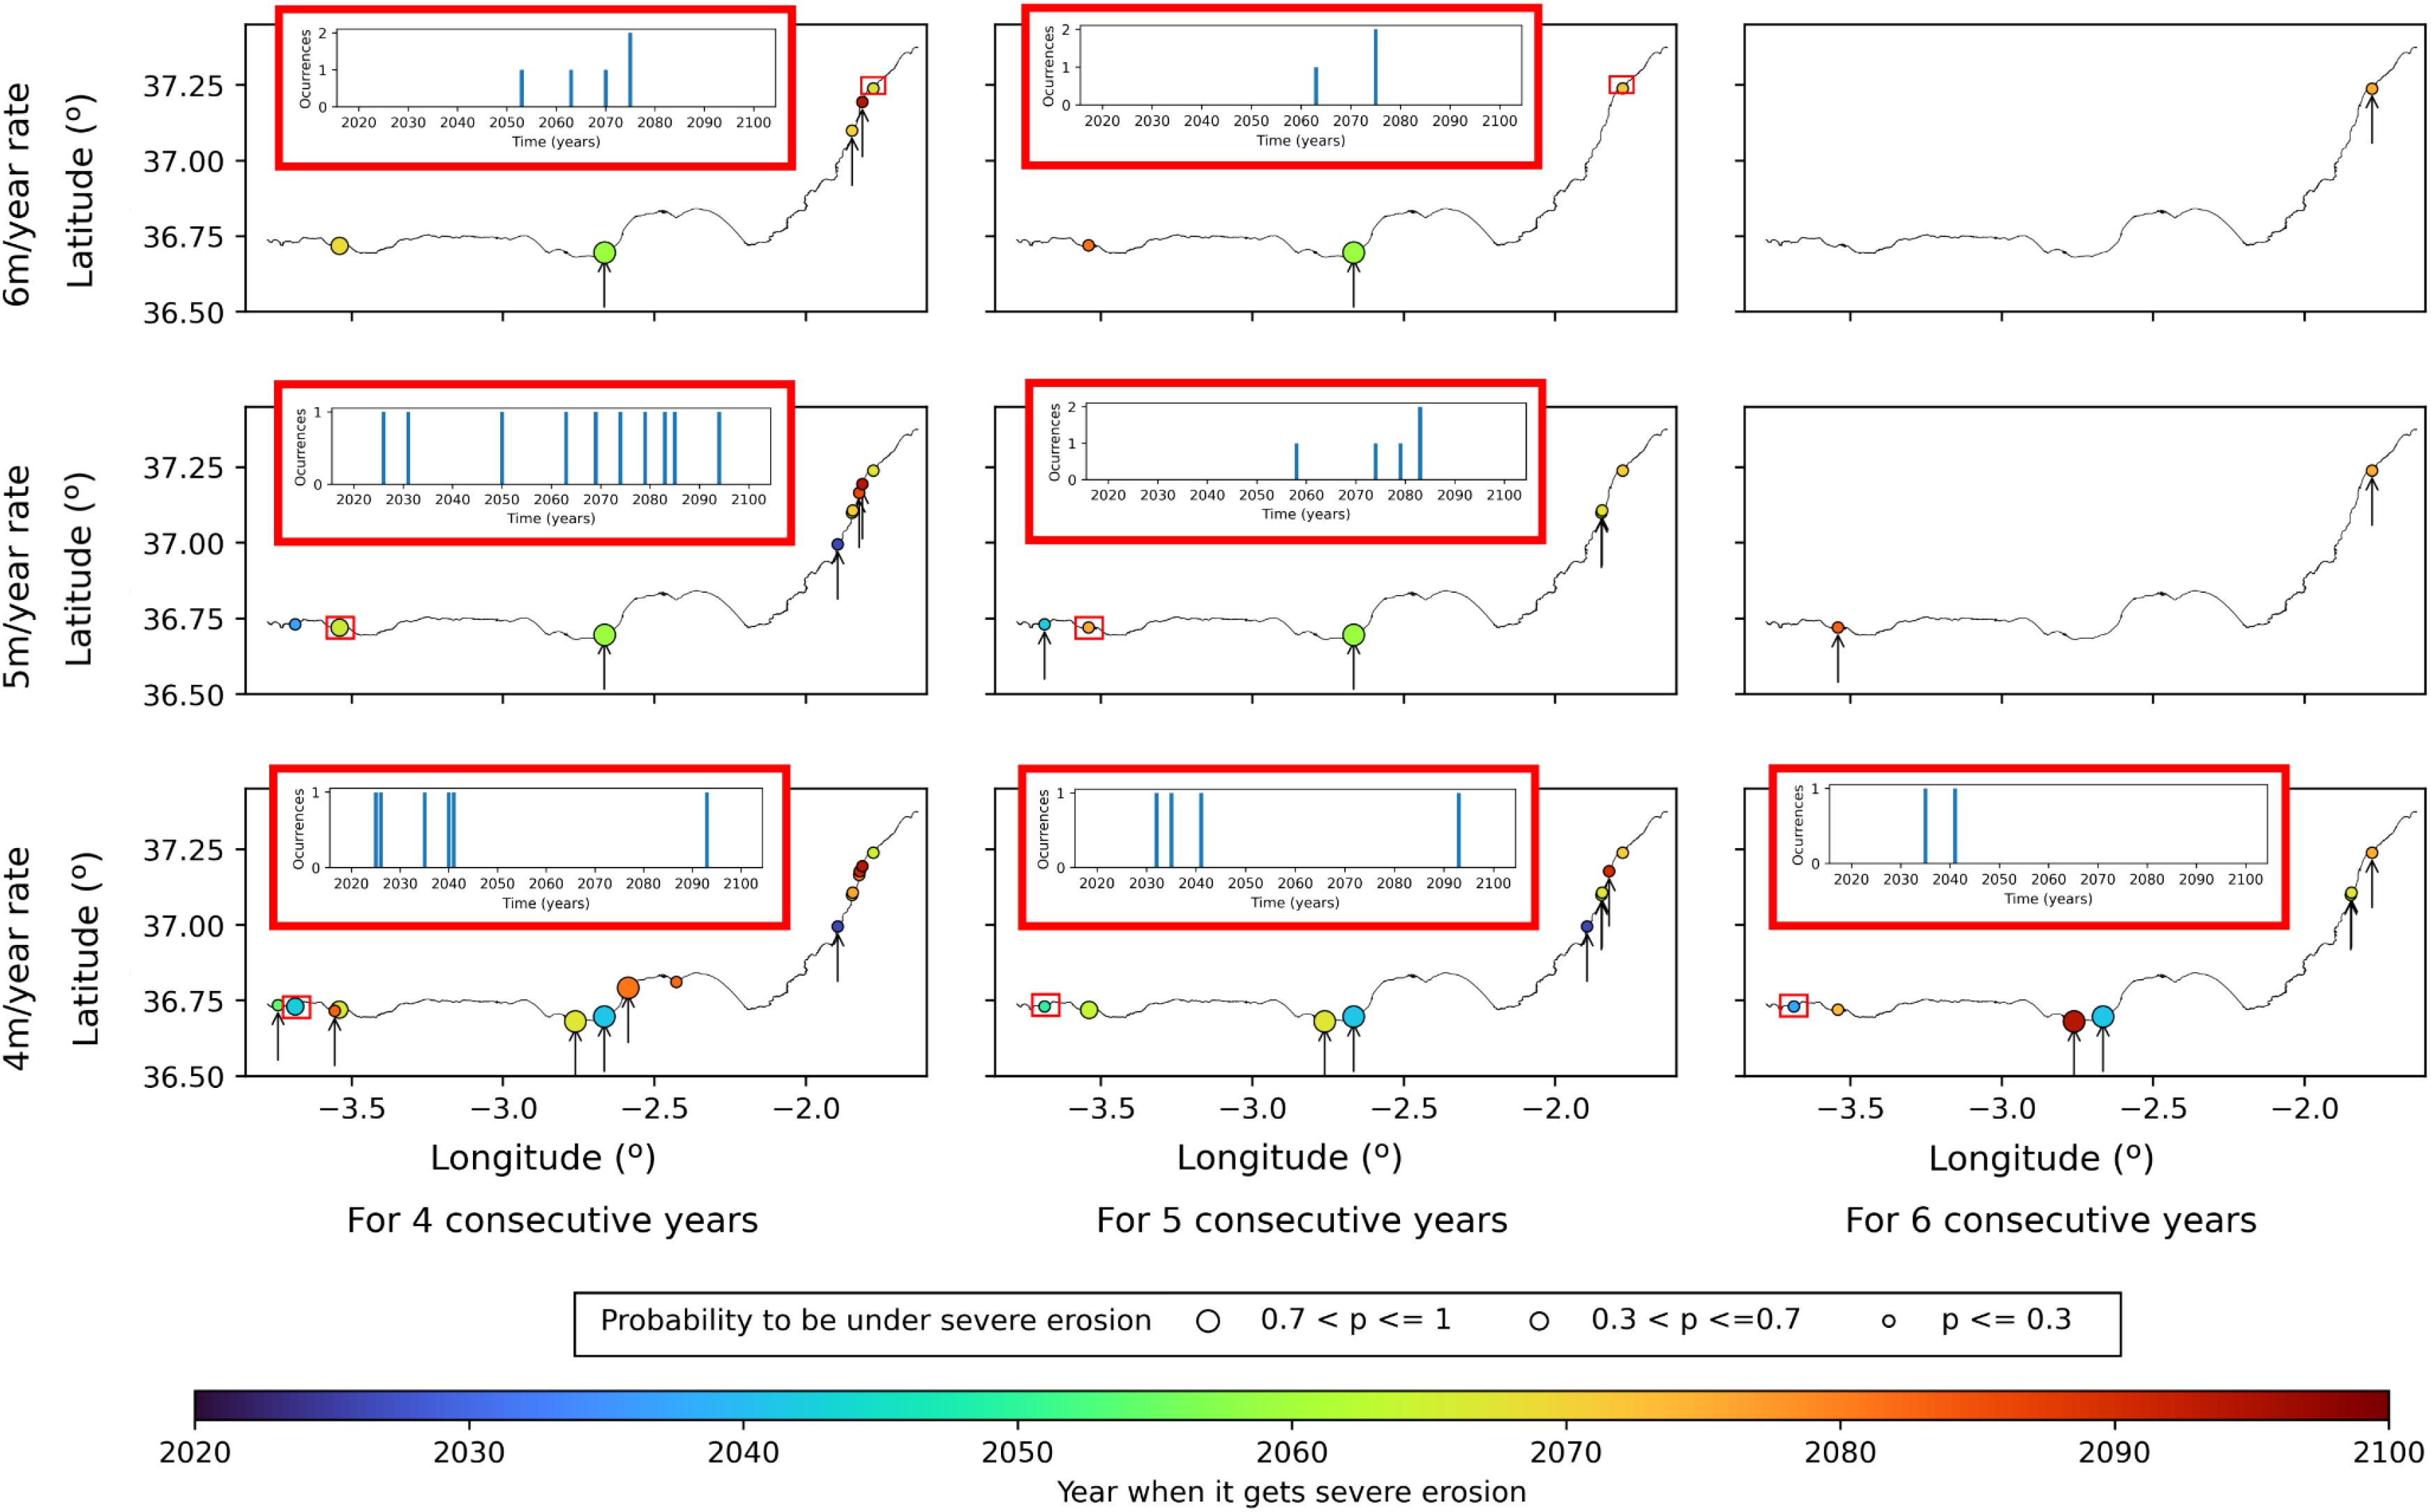
Figure 10. Sensitivity analysis matrix of the beaches that enter severe erosion for nine scenarios (Rn-m) resulting from varying the rates (n) and the number of years (m) from four to six. Frequency histograms of the number of occurrences along the time for some beaches are highlighted in red.
Regarding the annual rate of erosion (m) and the consecutive years during which that erosion rate is maintained (n), as these values increase, the number of beaches that enter severe erosion decreases. For example, 15 beaches enter sever erosion in the R4–4 case (lower-left panel), while only one does in the R6–6 case (upper-right panel). In the reference case (mid panel), six out of the 190 beaches along the Granada and Almería coast enter severe erosion. The probability of being under severe erosion increases, and the average year of entry into this situation decreases when either m or n decreases. The sensitivity to the number of consecutive years is almost equivalent to that of the erosion rate, meaning that selecting 4, 5 or 6 consecutive years and/or erosion rates will change the number of beaches that enter severe erosion. It is important to highlight that the time horizon selected for this analysis is 2100. Other time horizons can be selected, which would lead to significant changes. For instance, the histogram selected for the beach in cases 6-4, 6-5, 5-5, and all beaches that enter regression in cases 6–6 and 5–6 would not necessarily enter severe regression if the time horizon were changed to 2050.
4 Discussion
We presented a procedure for the probabilistic characterization of erosion and flooding, aimed at supporting informed-based management decisions within the Spanish regulatory framework. This procedure uses CC projections derived from the methodology proposed by Otiñar et al. (2025), which accounts for the non-stationarity of climate and its stochastic nature.
Considering the inconsistencies between the purpose of the Spanish regulation, its definitions, and the criteria it establishes—as well as the lack of technical justification for some of these criteria—a series of random sets have been defined in accordance with the legal framework, incorporating a time horizon into the calculations. These definitions aim to ensure consistency in the application of technical criteria, especially considering that the regulation itself states that CC must be considered. Where feasible, two tourist seasons are also considered.
The proposed procedure is specifically designed to assist the staff of regional administrative departments responsible for issuing permits and concessions for the use and/or occupation of land within the public maritime-terrestrial domain, particularly in cases involving the seasonal nature of certain uses as recognized by law.
Despite being grounded in Spain’s stringent coastal regulations, the principles of this work are adaptable to other countries’ coastal protection laws.
The methodology is illustrated using results from its application to Guainos Beach, as well as with broader results obtained from implementation along the Andalusian Mediterranean coast in the provinces of Granada and Almería.
Overall, given the stochastic nature of coastal processes, the inconsistencies in the legal framework, and the results obtained, this works highlight that a revision of the current legal framework would be beneficial for coastal planners and decision-makers responsible for authorizing land use and occupations so that their responsibilities are legally supported. More specifically, the criteria used for the delimitation of MTD and the declaration of zones in severe regression should align with the objectives of the legal framework and be supported by technical evidence, incorporating probabilistic approaches and a defined time horizon for the analysis. Given the importance of beach use during the tourist season in Spain, the consideration of both peak and off-peak tourist seasons is also highly relevant.
The seasonal analysis is found to be particularly relevant for long term coastal management in the study zone, as it is found that almost two thirds of the beaches suffering severe erosion are capable to recover for the off-peak season. This finding supports management recommendations for specific coastal areas by considering the natural recovery capacity of beaches following severe erosion events, potentially avoiding the need for drastic interventions.
The results obtained in this study for future projections are consistent with previously documented studies along the Andalusian coast, particularly in terms of the spatial distribution of the most critical sectors and the intensity of expected impacts. Specifically, the location of the most erosion- and flooding-prone areas, as well as the order of magnitude of the projected shoreline retreat, align with the historical patterns identified by Prieto Campos and Ojeda Zújar (2024) for the provinces of Granada and Almería, based on shoreline changes observed between 2001 and 2019. This consistency between historical trends and future projections—despite covering different time periods—reinforces the robustness of the methodology and increases confidence in the projections presented for the 21st century (2025–2100).
Given the large spatial scope of the ICCOAST methodology (over 1,000 km of the Andalusian coast), several simplifications have been made. First, only one RCP scenario has been considered. Also, a single time series corresponding to the ensemble mean of 20 GCMs is used to represent SLR. Other authors like Álvarez-Cuesta et al. (2021) and Toimil et al. (2021, 2023) employ multiple SLR time series from different percentiles, treating the resulting outcomes as equally probable to reduce uncertainty. In the present approach, an alternative approximation—not pursued here due to computational constraints—would be to apply the methodology for different curves of SLR and to present results in the style of a scenario-based analysis.
In regard to the sources of uncertainty, as mentioned in Otiñar et al. (2025), future climate is addressed through a multi-model non-stationary ensemble characterization (Lira-Loarca et al., 2021; Cobos et al., 2022), which applies a Bayesian approach that allows to account not only for the intrinsic climate uncertainty but also for the uncertainty regarding the true state of nature. Other works such as Vitousek et al. (2021) and Toimil et al. (2023) also deal with epistemological uncertainty that in this work has not been considered.
5 Concluding remarks
This study introduces a methodology for the stochastic characterization of erosion and flooding within climate change scenarios. This approach is novel in that it considers random sets, which are defined in accordance with the Spanish regulatory framework concerning the public maritime-terrestrial domain of coastal use and protection. The approach is also intended to assist regional administrative department staff who are responsible for issuing permits and concessions for land use and/or occupation. More precisely, it interprets the legal criteria for the delimitation of the public maritime-terrestrial domain, incorporating future climate projections within a given timeframe. Using coastal evolution and flooding projections derived from the proposed methodology, which considers the non-stationary nature of the climate, enables the future evolution to be analyzed on a seasonal basis.
The application of the methodology to the Mediterranean coast of Andalusia, in the provinces of Granada and Almería, allows us to draw some conclusions that may be useful for other coastal areas.
Regarding the definition of the lines related to the delimitation of the MTD—namely, the shoreline, the limit of wave reach, and the limit of the area reached by waves at least five times in five years—it is shown that these can be described using random sets. Their characterization is achieved through isolines of probability (e.g., 5%, 50%, and 95%). It is found that the MTD5–5 criterion defined in the RGV is less restrictive than the MTDW criterion, which corresponds to the legal definition of the MTD (as used in the RGF). These differences increase over longer time horizons. Significant seasonal differences are found in the evolution of these lines, which are highly relevant for management decisions regarding seasonal services. A sensitivity analysis allows to question the objectivity of the MTD5–5 criterion as it is found that minor changes in parameters can lead to significantly different results along the studied coastline.
Turning to erosion processes, the methodology demonstrates its capacity to detect spatial and temporal variability in shoreline behavior. The results obtained for Guainos Beach, and more broadly across the coastal provinces of Granada and Almería, show that certain beach segments exhibit persistent erosive trends while others remain relatively stable. Importantly, the inclusion of seasonal timeframes allows for the identification of beaches with natural recovery potential during peak tourist periods—information of high value for coastal land-use planning. These insights also call into question the adequacy of applying rigid, non-probabilistic criteria such as R5–5 to determine whether a beach is in a state of severe regression. As shown through sensitivity analyses, this criterion may yield inconsistent results depending on small input variations, underscoring the advantage of adopting probabilistic indicators tailored to dynamic coastal conditions.
Erosion results are illustrated through several cross-sections of Guainos Beach, where some segments exhibit a persistent erosive trend that intensifies toward the end of the century, while others remain relatively stable. Results for the provinces of Granada and Almería are summarized in terms of the percentage of dry beach area lost relative to the initial extent, using the 50% probability isoline of the MTDW as the reference. By 2100, the average difference in dry beach loss between PS and OS seasons is approximately 15%. Furthermore, around 40% of the beaches in these provinces are expected to lose more than 80% of their dry beach area by tH = 2100. However, only 33% of those severely eroded beaches do not recover from this situation during the PS season. The objectivity of the R5–5 criterion in determining whether a beach has entered a state of severe regression is also examined through a sensitivity analysis similar to that applied to the MTD5–5 criterion.
Data availability statement
The raw data supporting the conclusions of this article will be made available by authors upon request, pending approval from the Andalusian Regional Government.
Author contributions
PO: Data curation, Investigation, Methodology, Writing – review & editing, Software, Visualization, Formal analysis, Writing – original draft. MC: Formal analysis, Investigation, Software, Validation, Writing – review & editing, Methodology. MS: Investigation, Data curation, Validation, Writing – original draft, Software. AB: Supervision, Conceptualization, Writing – review & editing, Writing – original draft, Investigation, Project administration, Funding acquisition.
Funding
The author(s) declare financial support was received for the research and/or publication of this article. This work was conducted within the framework of contracts (Exped. Contr. 2018 66984 and 2020 687686) that were competitively bid by the Junta de Andalucía (with funds of the Fondo Europeo de Desarrollo Regional) and awarded to the University of Granada (Lot I). Authors are also indebted to EPICOS (Plan Andaluz de Investigación, Desarrollo e Innovación, PAIDI 2020. Ref. ProyExcel\00375). MC is indebted to Consejería de Transformación Económica, Industria, Conocimiento y Universidades de la Junta de Andalucía (POSTDOC_ 21_00724) which partially funded his work.
Conflict of interest
The authors declare that the research was conducted in the absence of any commercial or financial relationships that could be construed as a potential conflict of interest.
Generative AI statement
The author(s) declare that no Generative AI was used in the creation of this manuscript.
Any alternative text (alt text) provided alongside figures in this article has been generated by Frontiers with the support of artificial intelligence and reasonable efforts have been made to ensure accuracy, including review by the authors wherever possible. If you identify any issues, please contact us.
Publisher’s note
All claims expressed in this article are solely those of the authors and do not necessarily represent those of their affiliated organizations, or those of the publisher, the editors and the reviewers. Any product that may be evaluated in this article, or claim that may be made by its manufacturer, is not guaranteed or endorsed by the publisher.
References
Álvarez-Cuesta M., Toimil A., and Losada I. J. (2021). Modelling long-term shoreline evolution in highly anthropized coastal areas. Part 1: Model description and validation. Coast. Eng. 169. doi: 10.1016/j.coastaleng.2021.103960
Cobos M., Otiñar P., Magaña P., and Baquerizo A. (2022). A method to characterize climate, Earth or environmental vector random processes. Stochastic Environ. Res. Risk Assess. 36, 4073–4085. doi: 10.1007/s00477-022-02260-9
Contreras de Villar A., Muñoz Pérez J. J., Vidal Pérez J. M., Contreras de Villar F., López García P., Diaz-Carrasco P., et al. (2024). Estudio para la resiliencia de zonas costeras en las provincias de Cádiz y Málaga, ante el desafío del cambio climático.
Cowell P. J., Stive M. J., Niedoroda A. W., de Vriend H. J., Swift D. J., Kaminsky G. M., et al. (2003). The coastal-tract (part 1): a conceptual approach to aggregated modeling of low-order coastal change. J. Coast. Res. 19, 812–827.
Cullinan C. (2006). Integrated coastal management law: establishing and strengthening national legal frameworks for integrated coastal management (No. 93) (Food & Agriculture Org).
Environment Agency (2023). FCERM Strategy Roadmap to 2026: Creating climate resilient places (London, UK: United Kingdom Government). Available online at: https://assets.publishing.service.gov.uk/media/629de862e90e07039c27b440/FCERM-Strategy-Roadmap-to-2026-FINAL.pdf (Accessed May 1, 2025).
Gomez Rave D. V., Scolobig A., and del Jesus M. (2025). Review article: rethinking preparedness for coastal compound flooding: insights from a systematic review (Göttingen, Germany: Copernicus Publications). doi: 10.5194/egusphere-2025-262
Government of Spain (1988). Spanish coastal law 22/1988, of july 28 (Madrid, Spain: Official State Gazette). Available online at: https://www.boe.es/buscar/act.php?id=BOE-A-1988-18762 (Accessed May 1, 2025).
Government of Spain (2013). Spanish coastal protection and sustainable use law 2/2013, of may 29 (Madrid, Spain: Official State Gazette). Available online at: https://www.boe.es/diario_boe/txt.php?id=BOE-A-2013-5670 (Accessed May 1, 2025).
Government of Spain (2014). Royal Decree 876/2014, of October 10, approving the General Coastal Regulation (Madrid, Spain: Official State Gazette). Available online at: https://www.boe.es/buscar/act.php?id=BOE-A-2014-10345 (Accessed May 1, 2025).
Government of Spain (2022). Royal Decree 668/2022, of August 1, amending the General Coastal Regulation approved by Royal Decree 876/2014, of October 10 (Madrid, Spain: Official State Gazette). Available online at: https://www.boe.es/buscar/doc.php?id=BOE-A-2022-12932 (Accessed May 1, 2025).
Hunt E., Davidson M., Steele E. C., Amies J. D., Scott T., and Russell P. (2023). Shoreline modelling on timescales of days to decades. Cambridge Prisms: Coast. Futures 1, e16. doi: 10.1017/cft.2023.5
Intergovernmental Panel on Climate Change (2023). Climate change 2023: synthesis report (Geneva, Switzerland: IPCC). Available online at: https://www.ipcc.ch/report/ar6/syr/ (Accessed May 1, 2025).
Lira-Loarca A., Cobos M., Besio G., and Baquerizo A. (2021). Projected wave climate temporal variability due to climate change. Stochastic Environ. Res. Risk Assess. 35, 1741–1757. doi: 10.1007/s00477-020-01946-2
Magaña P., Del-Rosal-Salido J., Cobos M., Lira-Loarca A., and Ortega-Sánchez M. (2020). Approaching software engineering for marine sciences: a single development process for multiple end-user applications. J. Mar. Sci. Eng. 8, 350. doi: 10.3390/jmse8050350
Ojeda Zújar J. and Villar Lama A. (2006). Evolución del suelo urbano/alterado en el litoral de Andalucía, (1998-2002).
Oliva A., Olcina J., and Ollero A. (2024). Coastal Retreat on the Spanish Mediterranean Coast in a Climate Change Context: Effects of the Regulation of the Segura River at its mouth and the coastal sand dune in Guardamar del Segura (Alicante, Spain). Coasts 4, 63–88. doi: 10.3390/coasts4010005
Otiñar P., Cobos M., Santana M., Millares A., and Baquerizo A. (2025). A probabilistic methodology for the projection of flooding and erosion processes in the coastal zones of Andalusia (Spain) throughout the 21st century. Front. Mar. Sci. 12, 1631041. doi: 10.3389/fmars.2025.1631041
Prieto Campos A. and Ojeda Zújar J. (2024). Methodology of data generation and calculation of erosion rates applied to littoral areas: Evolution of the Andalusian shoreline on exposed beaches during the 21st century, (2001-2019). Investigaciones Geográficas 81), 9–31. doi: 10.14198/INGEO.25242
Sánchez-Artus X., Gracia V., Espino M., Sierra J. P., Pinyol J., and Sánchez-Arcilla A. (2023). Present and future flooding and erosion along the NW Spanish Mediterranean Coast. Front. Mar. Sci. 10, 1125138. doi: 10.3389/fmars.2023.1125138
Staneva J., Melet A., Veitch J., and Matte P. (2024). Solving coastal dynamics: introduction to high resolution ocean forecasting services. State of the planet discussions. 2024, 1–17. doi: 10.5194/sp-2024-44
Toimil A., Álvarez-Cuesta M., and Losada I. J. (2023). Neglecting the effect of long- and short-term erosion can lead to spurious coastal flood risk projections and maladaptation. Coast. Eng. 179. doi: 10.1016/j.coastaleng.2022.104248
Toimil A., Camus P., Losada I. J., and Á́lvarez-Cuesta M. (2021). Visualising the uncertainty cascade in multi-ensemble probabilistic coastal erosion projections. Front. Mar. Sci. 8. doi: 10.3389/fmars.2021.683535
Toimil A., Losada I. J., Camus P., and Díaz-Simal P. (2017). Managing coastal erosion under climate change at the regional scale. Coast. Eng. 128, 106–122. doi: 10.1016/j.coastaleng.2017.08.004
Vitousek S., Cagigal L., Montaño J., Rueda A., Mendez F., Coco G., et al. (2021). The application of ensemble wave forcing to quantify uncertainty of shoreline change predictions. J. Geophysical Research: Earth Surface 126. doi: 10.1029/2019JF005506
Wainwright D. J., Ranasinghe R., Callaghan D. P., Woodroffe C. D., Jongejan R., Dougherty A. J., et al. (2015). Moving from deterministic towards probabilistic coastal hazard and risk assessment: Development of a modelling framework and application to Narrabeen Beach, New South Wales, Australia. Coast. Eng. 96, 92–99. doi: 10.1016/j.coastaleng.2014.11.009
Keywords: coastal erosion, coastal flooding, climate change impact, uncertainty assessment, informed decision making
Citation: Otiñar P, Cobos M, Santana M and Baquerizo A (2025) Statistical characterization of projected flooding and erosion processes for coastal management. Front. Mar. Sci. 12:1631047. doi: 10.3389/fmars.2025.1631047
Received: 19 May 2025; Accepted: 12 August 2025;
Published: 02 September 2025.
Edited by:
Rodolfo Silva, National Autonomous University of Mexico, MexicoReviewed by:
Valeria Chávez, National Autonomous University of Mexico, MexicoMd. Shamsuzzoha, Patuakhali Science and Technology University, Bangladesh
Copyright © 2025 Otiñar, Cobos, Santana and Baquerizo. This is an open-access article distributed under the terms of the Creative Commons Attribution License (CC BY). The use, distribution or reproduction in other forums is permitted, provided the original author(s) and the copyright owner(s) are credited and that the original publication in this journal is cited, in accordance with accepted academic practice. No use, distribution or reproduction is permitted which does not comply with these terms.
*Correspondence: Manuel Cobos, bWNvYm9zYkB1Z3IuZXM=