 Zhongqiao Li1
 Ruoshi Zhao1,2
 Xiao Ma3,4
 Xiaona Wang5
 Liang Su1,2
 Hongliang Li1,4,6
 Haiyan Jin1
 Jiangning Zeng1
 Jianfang Chen1,3*
- 1Key Laboratory of Marine Ecosystem Dynamics, Second Institute of Oceanography, Ministry of Natural Resources, Hangzhou, China
- 2Ocean College, Zhejiang University, Zhoushan, China
- 3State Key Laboratory of Satellite Ocean Environment Dynamics, Second Institute of Oceanography, Ministry of Natural Resources, Hangzhou, China
- 4Observation and Research Station of Yangtze River Delta Marine Ecosystems, Ministry of Natural Resources, Zhoushan, China
- 5Shanghai Academy of Environmental Sciences, Shanghai, China
- 6Southern Marine Science and Engineering Guangdong Laboratory (Zhuhai), Zhuhai, China
To address the knowledge gap concerning the behavioral dynamics of dissolved organic matter (DOM) in the Changjiang Estuary during the late flooding season, we conducted an extensive sampling campaign during which 188 water samples were systematically collected across the estuary from August 15th to September 4th, 2021. Through analysis of dissolved organic carbon (DOC) concentrations and optical properties, this study aimed to elucidate the spatial distribution patterns and biogeochemical transformations of DOM during estuarine mixing processes in the late flooding season of the Changjiang. DOC in our study ranged from 0.72 to 2.24 mg/L, with a mean (± standard deviation) of 1.15 ± 0.32 mg/L. The correlation with salinity clearly indicated the dual control of hydrodynamic mixing processes and localized organic matter inputs on DOM abundance. Spectroscopic characterization combined with PARAFAC modeling revealed the predominantly terrestrial signature of chromophoric DOM (CDOM) and its progressive transformation along the estuarine gradient. Notably, rapid consumption of protein-like fluorescent DOM (FDOM) was observed within the Changjiang Estuary’s low-salinity transition zone. The consistent decrease in DOM aromaticity (SUVA254 decline of 0.13 L·mg C-1·m-1 per salinity unit, r2 = 0.77) coupled with increasing spectral slope S275-295 (an increase of 0.0006 nm-1 per salinity unit) clearly demonstrates selective removal of terrestrial constituents, and molecular weight reduction through estuarine processing. These results demonstrate that photochemical degradation might dominate CDOM removal in the Changjiang Estuary.
1 Introduction
The mean annual flux of dissolved organic matter (DOM) transported by global riverine systems to marine environments has been conservatively estimated at 205 teragrams of carbon per year (TgC/yr), with approximately 35% of this flux characterized as labile organic matter that undergoes oxidative mineralization within estuarine environments (Ludwig et al., 1996; Ittekkot, 1988). Fluvial discharge during inundation periods conveys the majority of DOM load (e.g., Bao et al., 2015). The inventories of DOM are largely controlled by the discharge from rivers and achieved a balance of the supply from continental run off, marine primary productivity, microbial production and photochemical removal in surface waters of coastal environments (Jørgensen et al., 2011; Guo et al., 2021; Gao et al., 2019; Zhu et al., 2018; Ye et al., 2019). Flooding season is known to significantly increase the inputs of suspended particulate matter (SPM), terrestrial nutrients, DOM, and dissolved inorganic carbon (DIC) into estuaries (Luterbacher et al., 2016; Wiltshire and Manly, 2004). These enhanced inputs can have direct effects on the lateral fluxes of DOC, facilitating their export from coastal ecosystems to continental shelves, as well as influencing the vertical fluxes of CO2 (fCO2) within these coastal environments. Furthermore, the enrichment of nutrients and DOC due to flooding can stimulate the remineralization of organic matter through microbial processes, thereby potentially shifting the balance of carbon cycling within coastal regions (Bianchi et al., 2013; Gong et al., 2011; Song et al., 2023). The Changjiang, one of the largest rivers globally, accounted for 70% of the total annual runoff in 2021 during the flooding season (May to October, Changjiang Sediment Bulletin, 2021), playing a significant role in dissolved organic carbon (DOC) and water transport. Consequently, it is imperative to undertake a comprehensive investigation into the biogeochemical dynamics of DOM in the Changjiang Estuary.
The integration of DOC content and chromophoric dissolved organic matter (CDOM) represents a robust approach to investigating the biogeochemical dynamics of DOC in estuarine environments (Jørgensen et al., 2011; Bianchi et al., 2013; Guo et al., 2021; Gao et al., 2019; Zhu et al., 2018; Ye et al., 2019). CDOM is the principal absorber of sunlight in DOC fractions and contributes to the optical properties of natural waters (Twardowski et al., 2004), playing an important role in global carbon budgets and oceanic cycling of carbon, nitrogen and trace elements (Chen et al., 2021). In the estuaries, CDOM is influenced by complex interactions of physical, photochemical and microbial processes, and transported to the marginal seas with high bioavailability. The absorption and fluorescence spectra provide not only quantitative information on CDOM but also characteristics regarding its composition and origin (Zhao et al., 2021; Zhang et al., 2019; Zhou et al., 2018), and have proven to be useful tracers of riverine inputs (Jung et al., 2021; Guo et al., 2018). The absorption coefficient and spectral slope reflect the concentration, molecular weight, and sources of CDOM, allowing a better understanding of behaviors and transformations of DOM in aquatic ecosystems (Fichot and Benner, 2012; Helms et al., 2008). Fluorescence excitation-emission matrix (EEM) is an effective technology and has been widely used to characterize CDOM from different sources. The parallel factor analysis (PARAFAC) method, introduced by Stedmon et al. in 2003, allows for rapid analysis of complex datasets at high resolution. This trilinear decomposition-based multivariate processing technique provides multidimensional information on fluorescent components (Guo et al., 2011; Walker et al., 2009; Stedmon and Markager, 2005a). With the development of spectrum technology, the transformation and degradation mechanisms are revealed (Catalán et al., 2021, Shuang et al., 2016), prompting the attention on the dynamics of CDOM in estuarine ecosystems.
The East China Sea (ECS) is a typical marginal sea, connecting the largest continent (Eurasia) and the northwest Pacific Ocean. It receives large amounts of terrigenous matter from the Changjiang, which is one of the biggest rivers in the world. Due to the short residence time for the continental shelf water in the ECS (estimated to be ~3–5 years, Men and Liu, 2015), material and energy exchange with the Pacific is frequent and active via the intrusion of the Kuroshio Current and lateral transport from the nearshore to offshore (Gong et al., 1996; Hung et al., 2000). Under the influence of heavy urbanization and industrialization, the Changjiang Estuary is experiencing huge anthropogenic disturbances (Zhou et al., 2018). Due to the excessive nutrients and organic matter input, the Changjiang Estuary became a complicated and dynamic ecosystem with the highest primary production in the ECS (Li et al., 2007; Zhang et al., 2019). In the last decade, more attention has been given to the behaviors of DOM in estuarine systems (Dias et al., 2020; Guo et al., 2021; Osburn et al., 2016). Although some observations suggested that CDOM in the Changjiang Estuary behaved conservatively in terms of its quantity (Guo et al., 2007), long-term monitoring programs showed that DOM was rapidly removed in low salinity areas (Zhang et al., 2019; Guo et al., 2018). Ji et al. (2021) reported that accumulated DOC in surface waters was removed and then transported to the bottom layers. By combining field observations and experiments of microbial incubation, Guo et al. (2021) identified photodegradation, biodegradation, and photo-enhanced biodegradation as key DOC removal pathways in aquatic systems. The intrinsic nature of the DOM from different sources exerted stronger control on the reactivity in degradation (Catalán et al., 2021). DOM was influenced by various factors, such as monsoon, dilution from seawater and biochemical processes, resulting in obvious variability of molecular sizes, composition, and origins (Zhao et al., 2021; Zheng et al., 2018). Therefore, it’s important to integrate the sources and behaviors of CDOM when studying of estuarine environments. Several studies have shown the ability of absorption and fluorescence spectroscopy in tracking organic matter sources (Zhao et al., 2023; Jung et al., 2021; Makarewicz et al., 2018; Yang et al., 2007), and together with PARAFAC the fluorescence spectroscopy of CDOM can be analyzed accurately and rapidly.
In summary, the objectives of this study are as follows: to investigate the distribution of DOM in the Changjiang Estuary and its adjacent areas, and to explore the sources and sinks of DOM in the coastal region; to examine the relationships between DOM and salinity, and to elucidate the nonconservative behavior of DOM during the estuarine mixing process; to characterize the fluorescent properties of DOM using Excitation-Emission Matrix-Parallel Factor Analysis (EEM-PARAFAC) and to enhance our understanding of the biogeochemical processes occurring in the Changjiang Estuary during the late flooding season.
2 Materials and methods
2.1 Study area and sampling
The ECS is a marginal sea located to the east of mainland China and connected to the Pacific Ocean via the Okinawa Trough. To the north, the ECS is adjacent to the Yellow Sea, while in the south it is connected to the South China Sea through the Taiwan Strait. The ECS Shelf is a typical epicontinental sea covering an area of approximately 0.77×10⁶ km2, of which 65% has a water depth of less than 200 m. Driven by the East Asia monsoon system, the south and southeast winds prevail in summer while north and northwest winds predominate in winter (Deng et al., 2006). The Kuroshio Current generally moves away from the shelf and bifurcates into two branches, with a mainstream to the east and a tributary to the northwest, and significantly influences the current pattern northeast of Taiwan (Tang et al., 2000). In summer, Kuroshio subsurface water strongly upwells, while in winter massive amount of their surface waters invade the shelf (Lin et al., 1992). In the west of the ECS, Taiwan Warm Current (TWC) moves northward throughout the year within a water depth of 50–100 m. Affected by TWC and southwest winds, a strong coastal upwelling occurs in steep area south of the Changjiang Estuary in summer (Su, 2001). The Changjiang plume flows southward along the coast of China in a narrow band in winter. However, the plume moves toward northeast and spreads outwards across the shelf during the summer season (Liu et al., 2003). This later diffusion of Changjiang plume is intensified by the northward East China Sea Coastal Current (ECSCC, Su, 2001).
A total of 188 water samples were collected from the Changjiang Estuary and the adjacent ECS area (28.5-33°N, 121-124.5°E, Figure 1A) on the R/V Runjiang I from August 15 to September 4, 2021. Samples were retrieved from 48 stations at depths from surface (2 m) to the bottom (2 m above the seafloor) by a 10-L Rossette hydrophore fitted with a Sea-Bird 19 plus conductivity-temperature-depth (CTD) recorder, which also provided the live data of temperature and salinity. Water samples were filtered within 3 hours of collection through 0.45 μm pore-size polyethersulfone (PES) syringe filters (Millipore). To minimize potential filter artifacts, the initial 5 mL of filtrate was discarded to rinse the filter membrane, followed by rinsing pre-cleaned 40 mL brown glass bottles (CNW) with 15 mL of filtrate. Bottle preparation involved: (1) 24 h HCl immersion (10%, v/v); (2) thorough rinsing with Milli-Q water (≥18.2 MΩ·cm); and (3) pre-combustion at 450°C for 5 h to eliminate organic residues. Processed samples were subsequently divided for different analyses: filtrates for CDOM measurement were stored in the dark at 4°C, while aliquots for dissolved organic carbon (DOC) determination were preserved at -18°C until analysis. The samples were tested as soon as we got back to the lab.
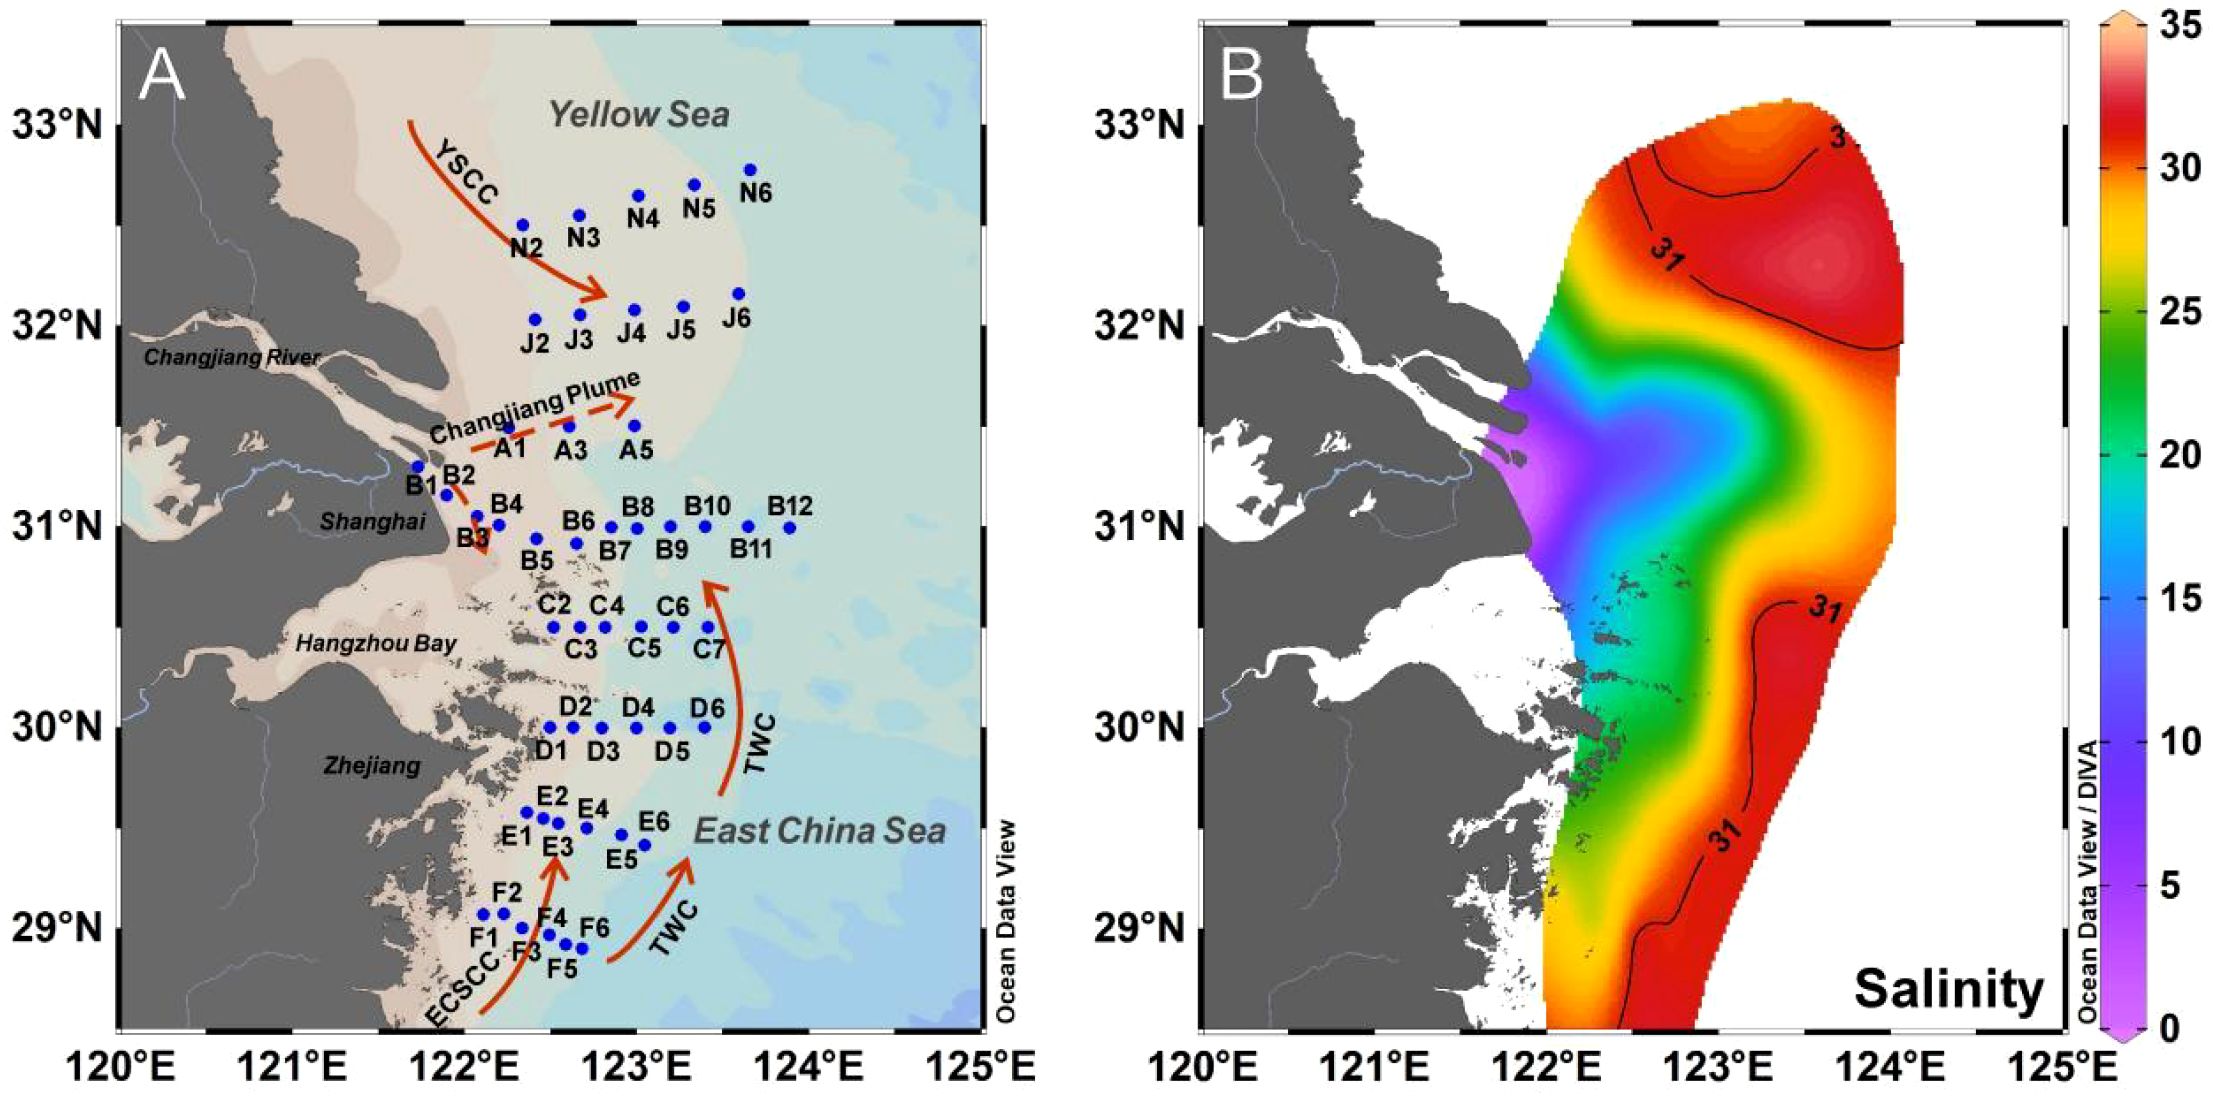
Figure 1. (A) Map showing the study area and coastal ocean currents; Sampling stations are marked with solid blue dots while solid red arrows represent the ocean circulation in the ECS in summer. ECSCC, East China Sea Coastal Current; TWC, Taiwan warm current; YSCC, Yellow Sea Coastal Current. (B) Horizontal distribution of salinity with a 31-salinity contour line in the surface water.
2.2 DOC measurements
DOC concentrations were measured using a Shimadzu TOC-L analyzer based on high-temperature combustion method (Guo et al., 1995; Yang et al., 2012), where inorganic carbon was first removed with HCl and oxygen purging. Analytical variation coefficient based on repeated measurements (at least triplicate per sample) were within 5% for DOC (Chen et al., 2018). Milli-Q water (blank) and 0.5 mg/L standard solution (diluted from 1000 mg/L DOC standard, National Institute of Metrology, China) were measured frequently to ensure the accuracy of the measurements.
2.3 Optical measurements and calculation of optical proxies
2.3.1 Absorption measurements
The absorption spectra of CDOM samples were obtained using a UV-visible spectrophotometer (Thermo Scientific Evolution 300) with a 5 cm quartz cuvette at room temperature. The wavelength range of measurement was 200 to 800 nm with 1 nm increment. Milli-Q water was used as a blank and the average absorbance between 700 and 800 nm was subtracted from each spectrum to correct the effect of light scattering and baseline drift (Helms et al., 2008; Yang et al., 2019). The absorption coefficients (a, m-1) (Hu et al., 2002) were calculated from the following formula:
where Aλ is the absorbance at the wavelength of λ, and L represents the path length of cuvette in meters (0.05 m). The absorption coefficient at 254 nm (a254) was used as an index for CDOM abundance in samples. The specific ultraviolet absorbance at 254 nm (SUVA254) was shown to be useful to estimate the dissolved aromatic carbon content (Weishaar et al., 2003) and molecular weight (Chowdhury and Shakhawat, 2013) in aquatic systems. SUVA254 was calculated as absorption coefficient (a254) per unit mass of DOC:
where the units of DOC and SUVA254 were mg C/L and L·mg C-1·m-1. The spectral slopes (S, nm-1) were obtained from a non-linear exponential function to the absorption spectrum over the wavelength range between 275 nm and 295 nm:
where and are absorption coefficients at defined and reference wavelengths, respectively. Typically, higher S values indicate low molecular weight material and decreasing aromaticity (Helms et al., 2008; Blough and Del Vecchio, 2002). The spectral slope coefficient between 275 nm and 295 nm (S275–295) can be used as a tracer of terrigenous DOM in river-influenced ocean margins (Fichot and Benner, 2012).
2.3.2 Fluorescence EEM measurements and PARAFAC modeling
Three-dimensional fluorescence excitation-emission matrices (EEMs) were scanned using a fluorescence spectrophotometer (HITACHI, F-7100) at excitation/emission (Ex/Em) wavelengths of 240–450 nm/280–600 nm with a 1 cm cuvette. The scanning steps for the Ex and Em wavelengths were set at 5 nm and 1 nm, respectively. The fluorescence intensity of Milli-Q water was measured daily and used as a blank for quality control. The EEMs of each sample were calibrated by subtracting the EEM of the Milli-Q water and were normalized to Raman Units (R. U.) by integrating the Raman scatter peak, to avoid the influence of instrument specificities:
where Arp is integral of Raman peak, with the excitation of 350 nm, emission of 371 to 428 nm (Lawaetz and Stedmon, 2009); is the measured intensity of the Raman peak at emission wavelength λ; F is fluorescence intensity in Raman Units after calibration. The humification index (HIX, the ratio of the peak area at the emission between 434 and 480 nm and between 300 and 346 nm, at a fixed excitation of 255 nm) (Zsolnay et al., 1999; Ohno, 2002), and biological index (BIX, the ratio of emission intensity at 380 nm divided by 430 nm at an excitation of 310 nm) (Huguet et al., 2009) were used as indicators of humic substance content and autotrophic productivity respectively.
The corrected EEM spectra were analyzed by PARAFAC in MATLAB R2020b with the DOMFluor toolbox 1.7 (Stedmon and Bro, 2008). In the PARAFAC modelling process, the region of Rayleigh and Raman peaks were cut to avoid the interference of scatter peaks. Sample 48 (B9-2m) was removed as it represented a clear outlier in the test. Split half validation and random initialization were used to mathematically compare the excitation and emission loadings of the models, to determine the number of components fitting best (Stedmon et al., 2003; Stedmon and Markager, 2005a). Finally, a three-component model was chosen. The result of PARAFAC model was uploaded to OpenFluor, an online spectral library of auto-fluorescence by organic compounds in the environment, to quantitatively match with previous studies (Murphy et al., 2014).
3 Results
3.1 Hydrography
During the sampling period (August 15 to September 4, 2021), the surface water salinity varied from 0.16 to 32.64, with an average of 24.50 ± 8.24, reflecting the dominant influence of freshwater discharge from the Changjiang River. The surface salinity increases northeastward from the inner Changjiang Estuary to the central ECS. The isohaline of 31 psu is considered here as the edge of Changjiang plume, because the nitrate dropped to an undetectable level in seawater with salinity above it (Gong et al., 1996). As can be seen from Figure 1B, the eastward expansion of the Changjiang Diluted Water (CDW) reached its maximum extent at approximately 124.2°E, where it encountered frontal resistance from the Taiwan Warm Current (TWC) prevailing in the southeast sector. However, the southward along-shore expansion of CDW was obvious, which was probably resulted from continued strong cyclonic wind forcing in summer. The strengthened southwesterly wind over the southern region off the river mouth may change the pathway of CDW and reinforces the southeastward extension (Chang et al., 2014). The temperature of surface water (2 m) ranged from 26.40°C to 30.07°C, with an average of 27.96 ± 0.83°C. On the whole, the surface water of the ECS was warmer than the YS due to the CDW high heat content and the solar irradiance controlled by latitude (Men and Liu, 2015; Zhang et al., 2019b). Compared to previous studies in the ECS, the temperature and salinity in our investigation spread more evenly and diffusely (Wang et al., 2023; Ji et al., 2021). The Severe Typhoon In-Fa, with a maximum wind speed of 42 m/s, which struck the ECS in July, is probably the primary trigger for this feature through wind-induced strong vertical mixing of the water column (Miao et al., 2023). The spatial distribution of temperature in the water column is shown in Figure 2A. South of the study area, a banded region of low temperature of surface water was observed. Upwelling caused by the branch of TWC in upper layer has been reported in previous studies, which could lead to the uplift of thermocline in coastal slope (Tang et al., 2000). In the area near the mouth of the Changjiang, the raised isolines of temperature and salinity along the coast indicated the upwelling of the bottom water (Figures 2B, C), which was observed in the transect of A, B and C. The depth of upwelled water extended in relation with the wind-force on the sea. In the strong typhoon period, the depth was about 20–30 m, while it could reach the euphotic zone (~5 m) when the sea is calm (Wang et al., 2023; Ji et al., 2021).
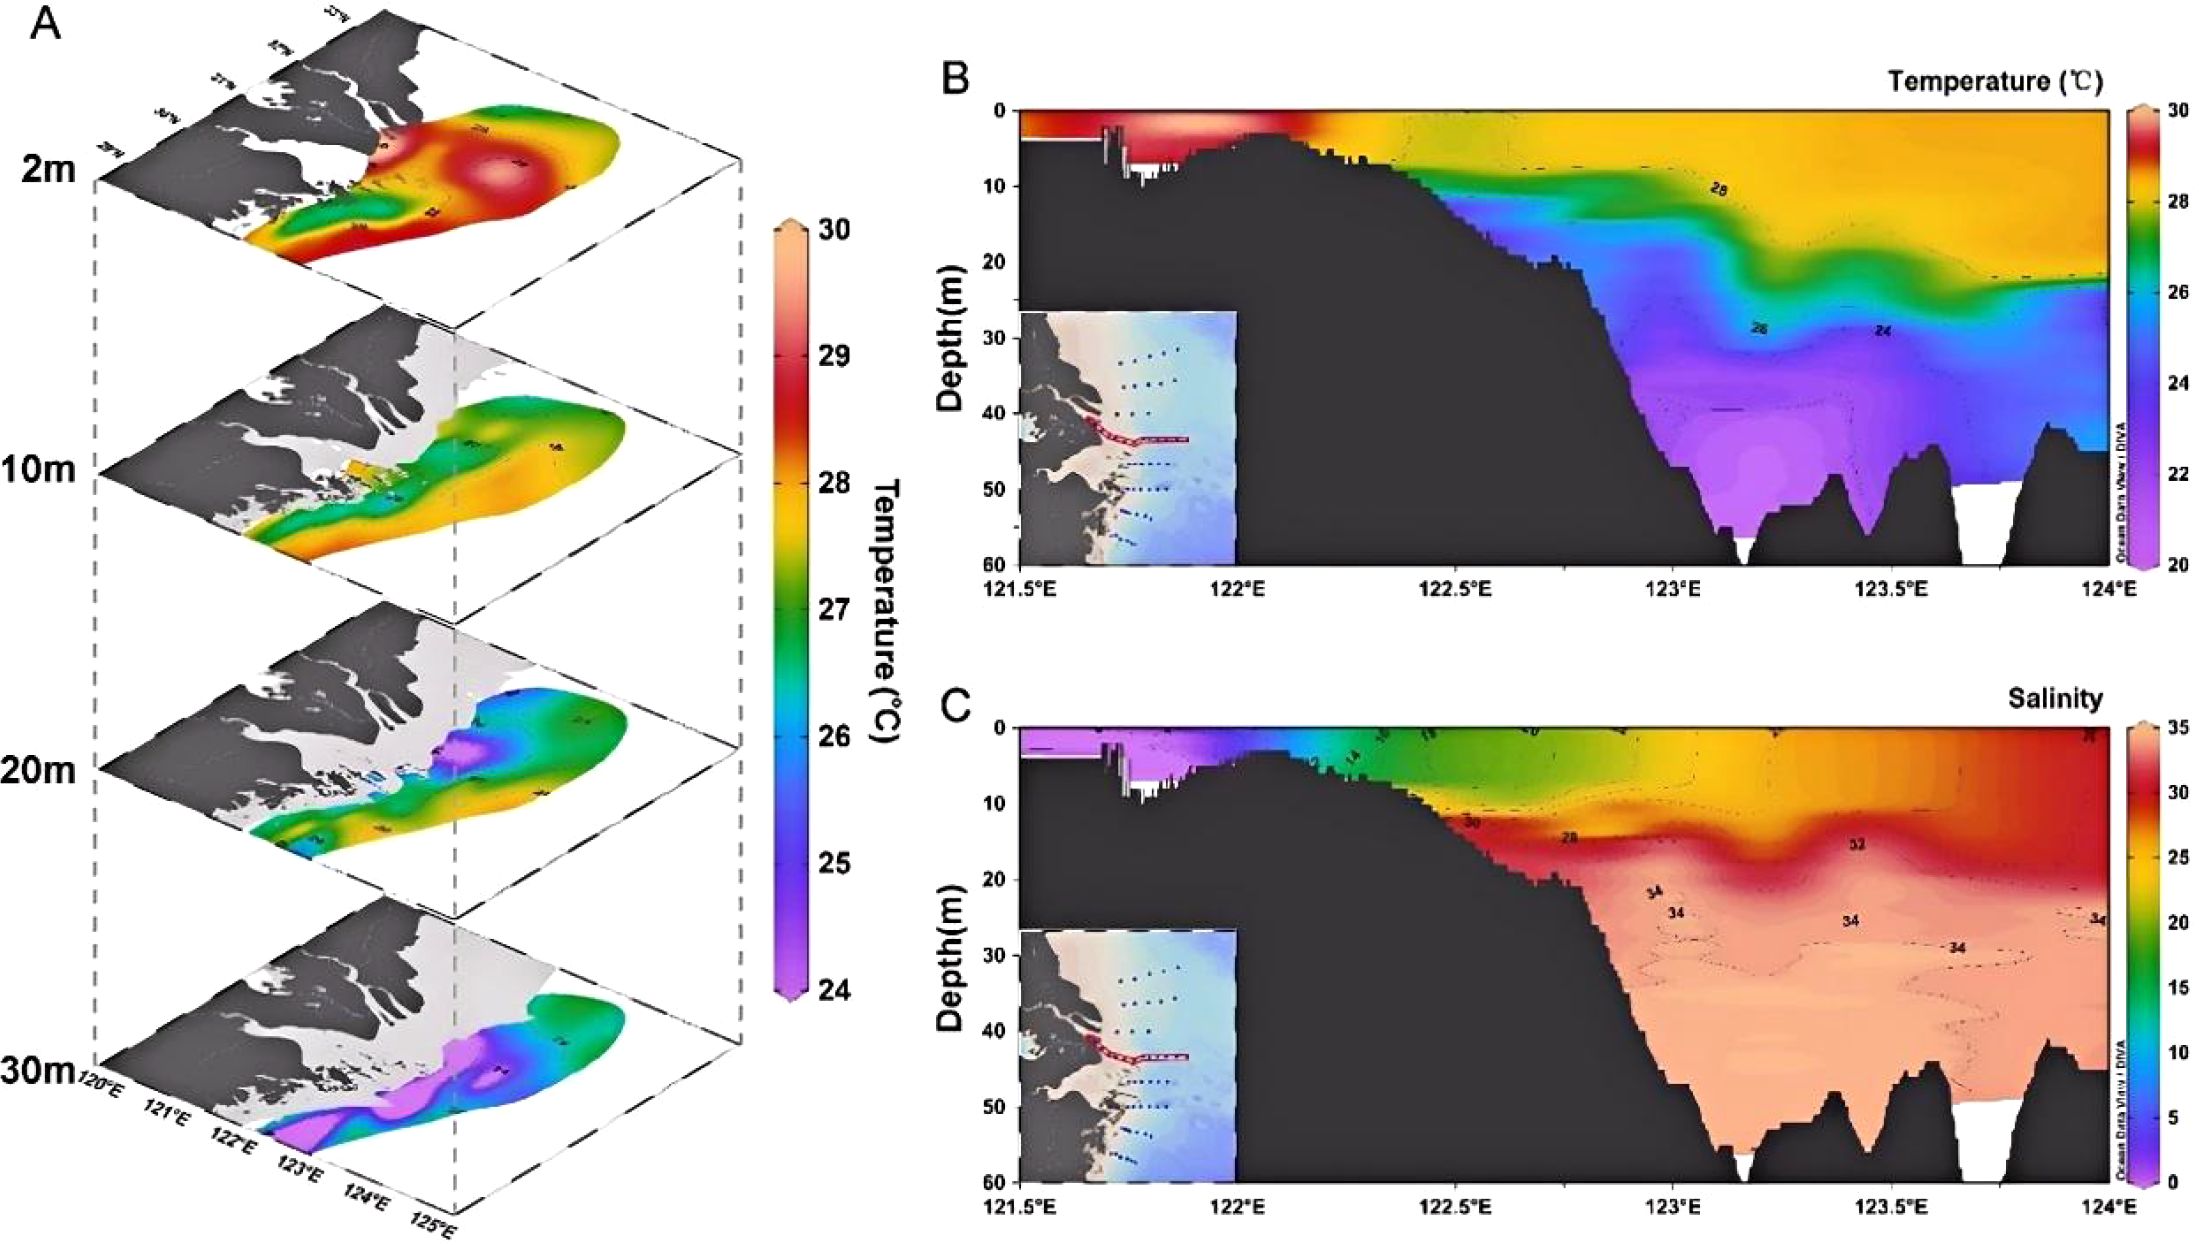
Figure 2. (A) Spatial distribution of temperature (°C) in the water column (depth of 2 m, 10 m, 20 m, and 30 m); and the transect distribution (section B) of (B) temperature (°C) and (C) salinity.
3.2 Variations in DOC and CDOM distribution
DOC concentrations of surface water ranged from 0.72 to 2.24 mg/L, with an average of 1.15 ± 0.32 mg/L. Input from Changjiang River was the main controlling factor of DOC distribution during flooding seasons. Along the direction of extension of CDW, DOC concentrations decreased from the river mouth towards the open sea (Figure 3A). The water samples from station B1 and B2 were identified as Changjiang freshwater during the sampling period with salinity at ~0.16. The average DOC concentration of station B1 and B2 was 2.20 mg/L, close to the value measured before (DOC: 2.196 mg/L, salinity: 0.15 in surface water collected at the Xuliujing station; Zhao et al., 2021).
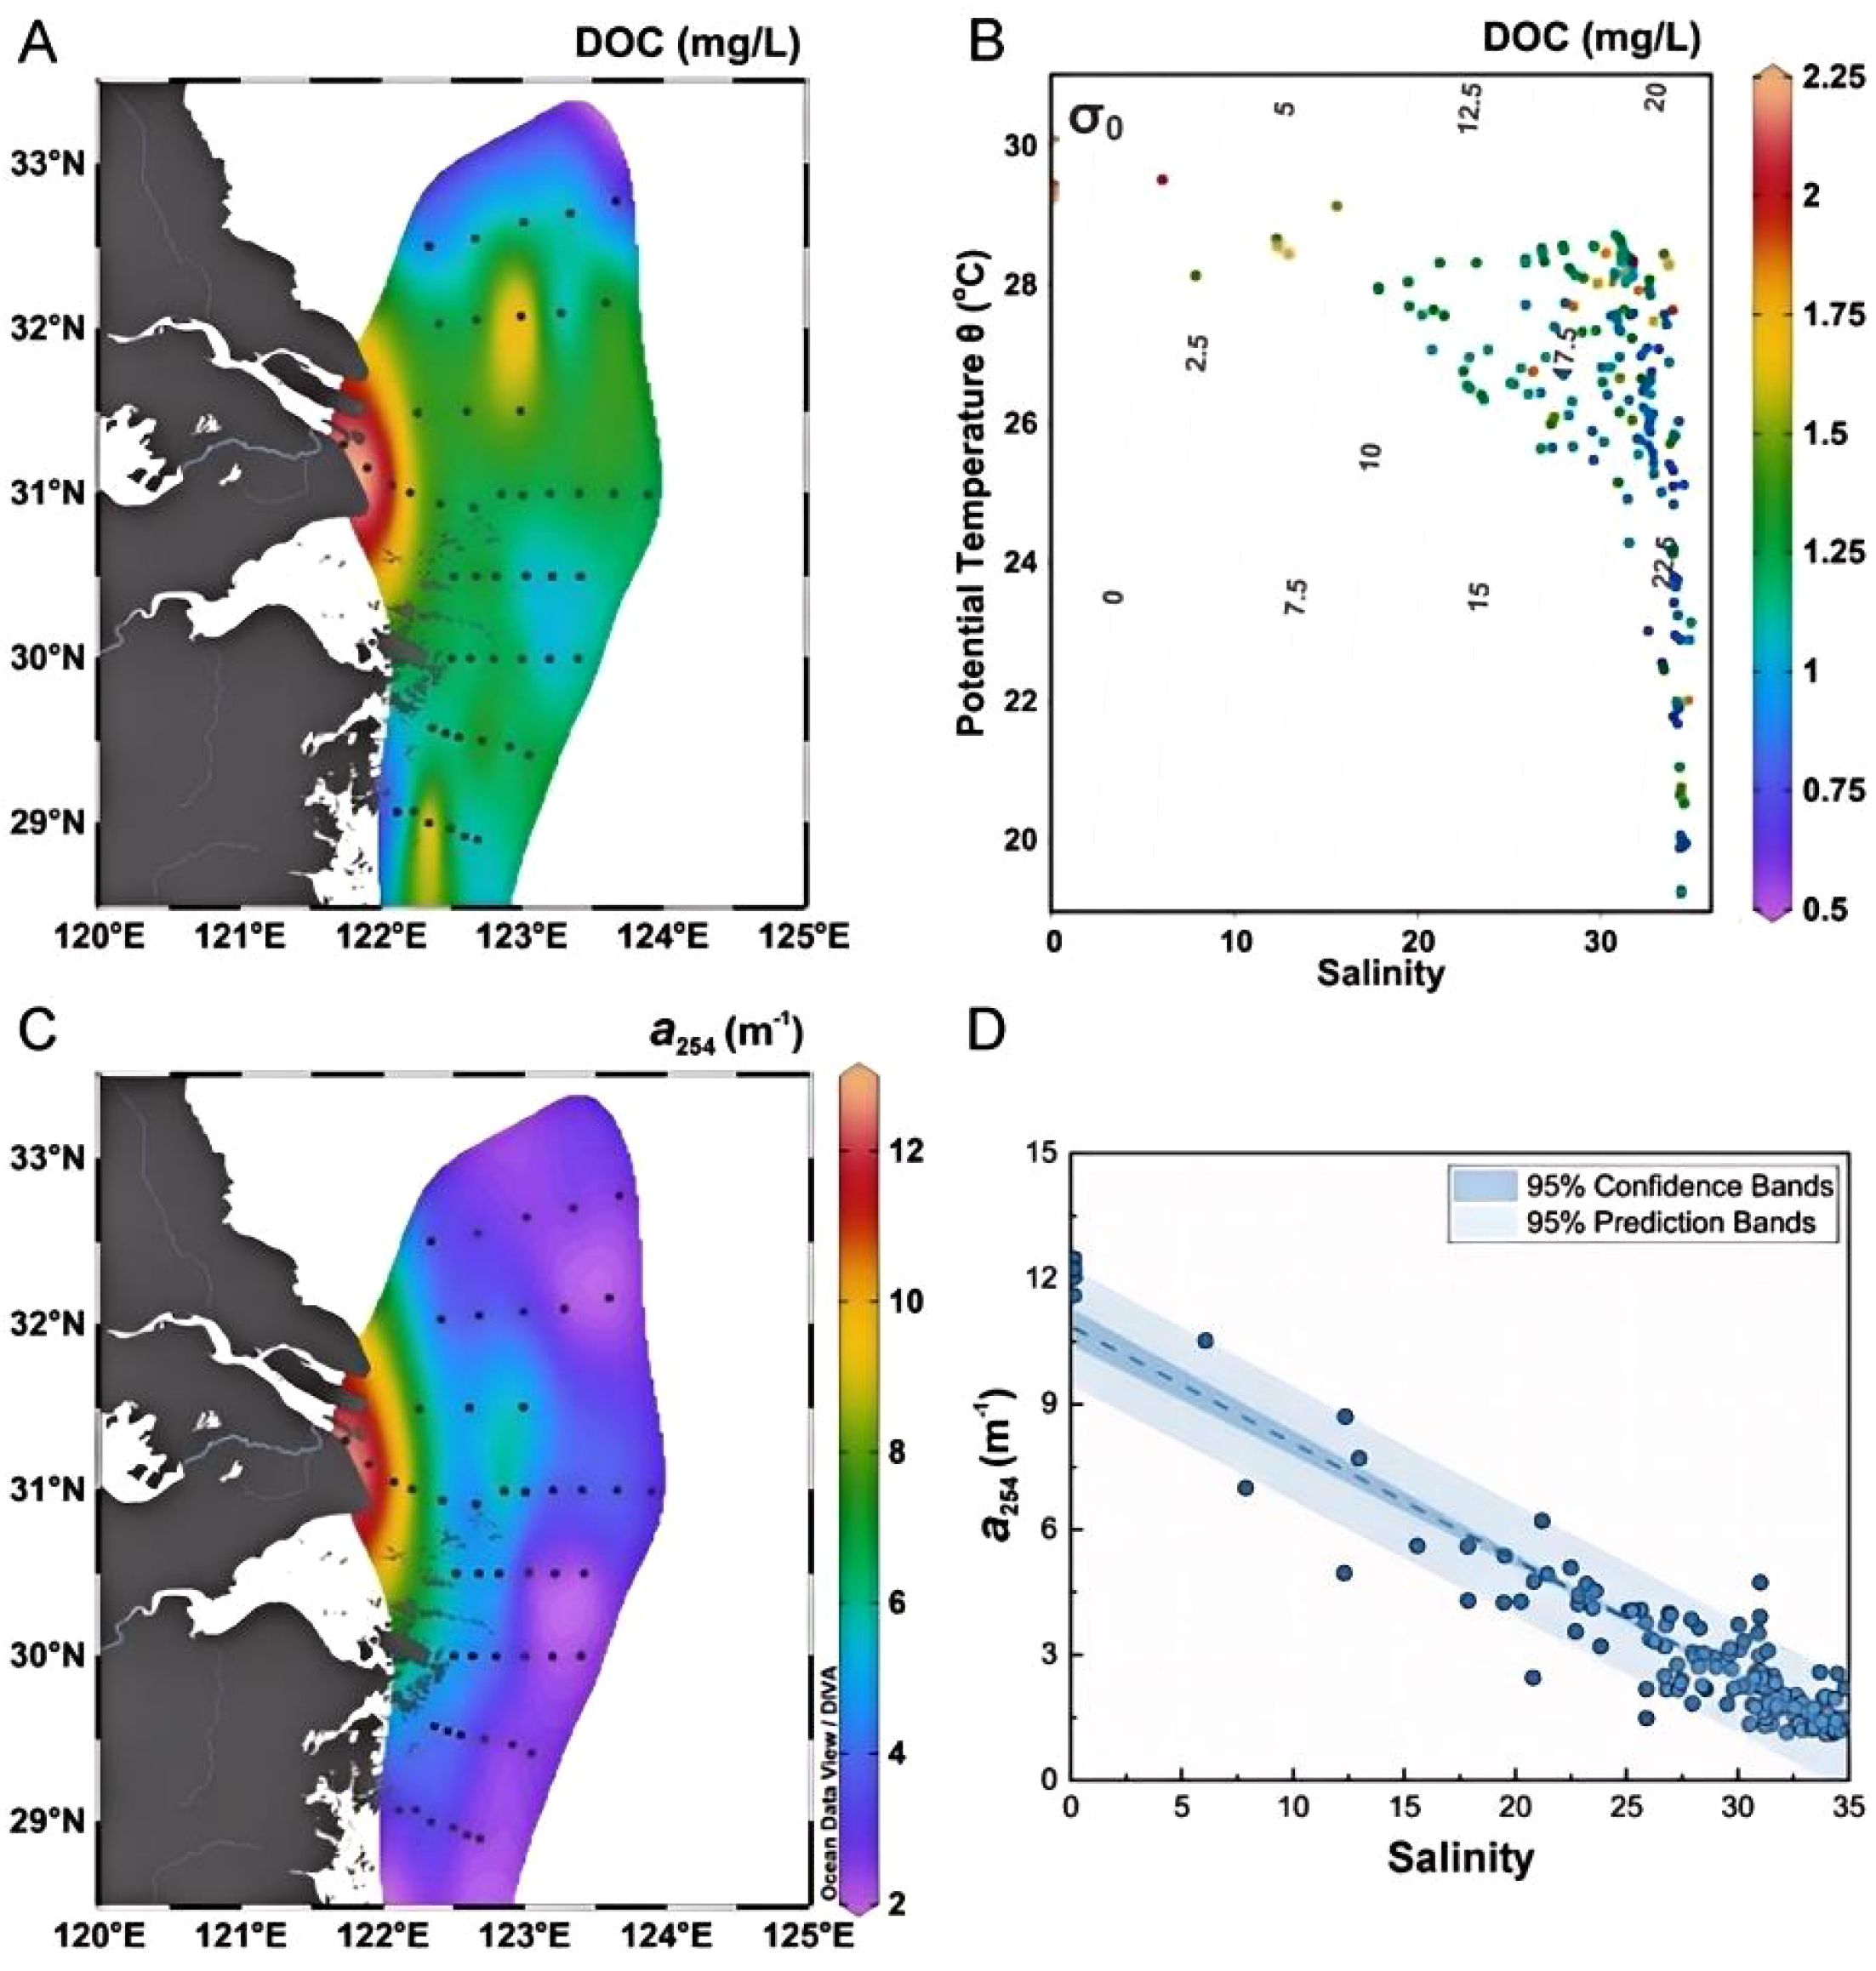
Figure 3. (A) The distribution of DOC concentrations (mg/L) in the surface water; (B) Temperature-salinity (T-S) diagram of water mass distribution in the study area with the color bar representing DOC concentrations. (C) The distribution of a254 (m-1) in the surface water; (D) The correlation between the a254 (m-1) and salinity.
Concentrations of CDOM (a254) range from 1.11 m-1 to 12.48 m-1, with an average of 2.69 ± 1.99 m-1, exhibiting obvious spatial heterogeneity (Figure 3C). a254 shows high level in the river mouth (i.e. ~12 m-1), and decreases from inshore to offshore. A strong negative correlation between a254 and salinity (Figure 3D; r = -0.94, p< 0.01), suggesting that the CDOM in the shelf waters was predominantly sourced from freshwater and exhibited conservative behavior in terms of its quantity.
Based on the salinity, the study area was divided into two regions: estuary (salinity ≤ 25) and nearshore (salinity > 25) (Table 1). In the estuary, the concentrations of DOC and CDOM were higher than that in nearshore. SUVA254 and spectral slope can provide more information about the general characteristics of CDOM (e.g. source and diagenesis) (Fichot and Benner, 2012; Helms et al., 2008). Opposite trends are observed between the SUVA254 and S275-295. SUVA254 shows higher values in the estuary (average of 4.15 ± 0.88 L·mg C-1·m-1) and lower ones in nearshore (average of 1.92 ± 0.63 L·mg C-1·m-1), while the averages of S275–295 in the estuary and nearshore are 0.0200 ± 0.0027 nm-1 and 0.0298 ± 0.0071 nm-1, respectively.
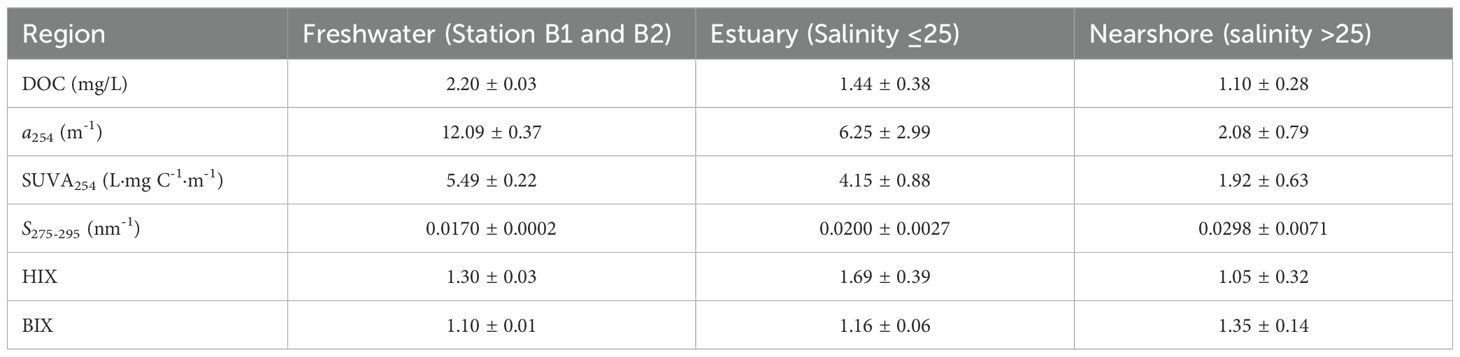
Table 1. Comparisons of different biogeochemical parameters in freshwater (station B1 and B2), estuary (salinity ≤ 25) and nearshore (salinity > 25) at depths from surface to bottom in August 2021.
3.3 Fluorescent components identified by parallel factor
Three fluorescent components, including two humic-like components (C1 and C2) and one protein-like component (C3), were identified in this study. Table 2. provides the spectral characteristics of the fluorescent components, including the maximum of excitation and emission, the range of maximum fluorescence in R.U., probable sources, and some examples of matching components identified by other researchers in various aquatic environments. Contour plots of excitation and emission of individual PARAFAC components are given in Figures 4A–C.
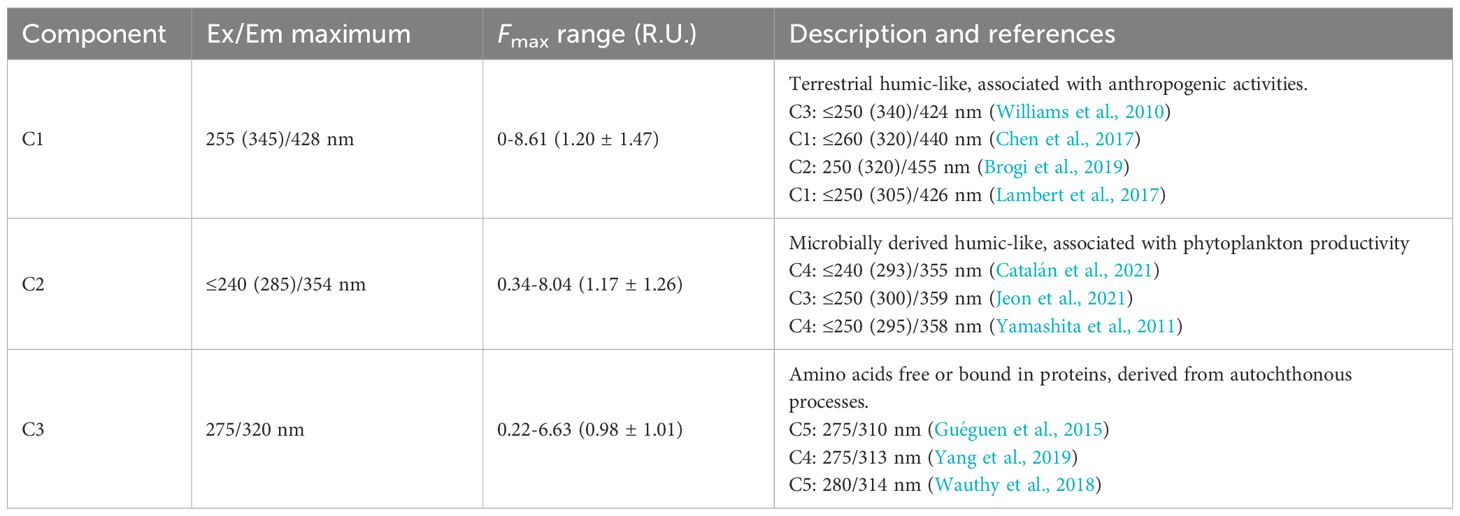
Table 2. The characteristics of the three components (C1, C2 andC3) identified by the PARAFAC (parallel factor) model (including peak positions (Excitation/Emission maximum) with secondary excitation bands in brackets, fluorescence maximum (Fmax) range, classification by traditional peak (Coble, 1996; Coble et al., 1998), and brief description).
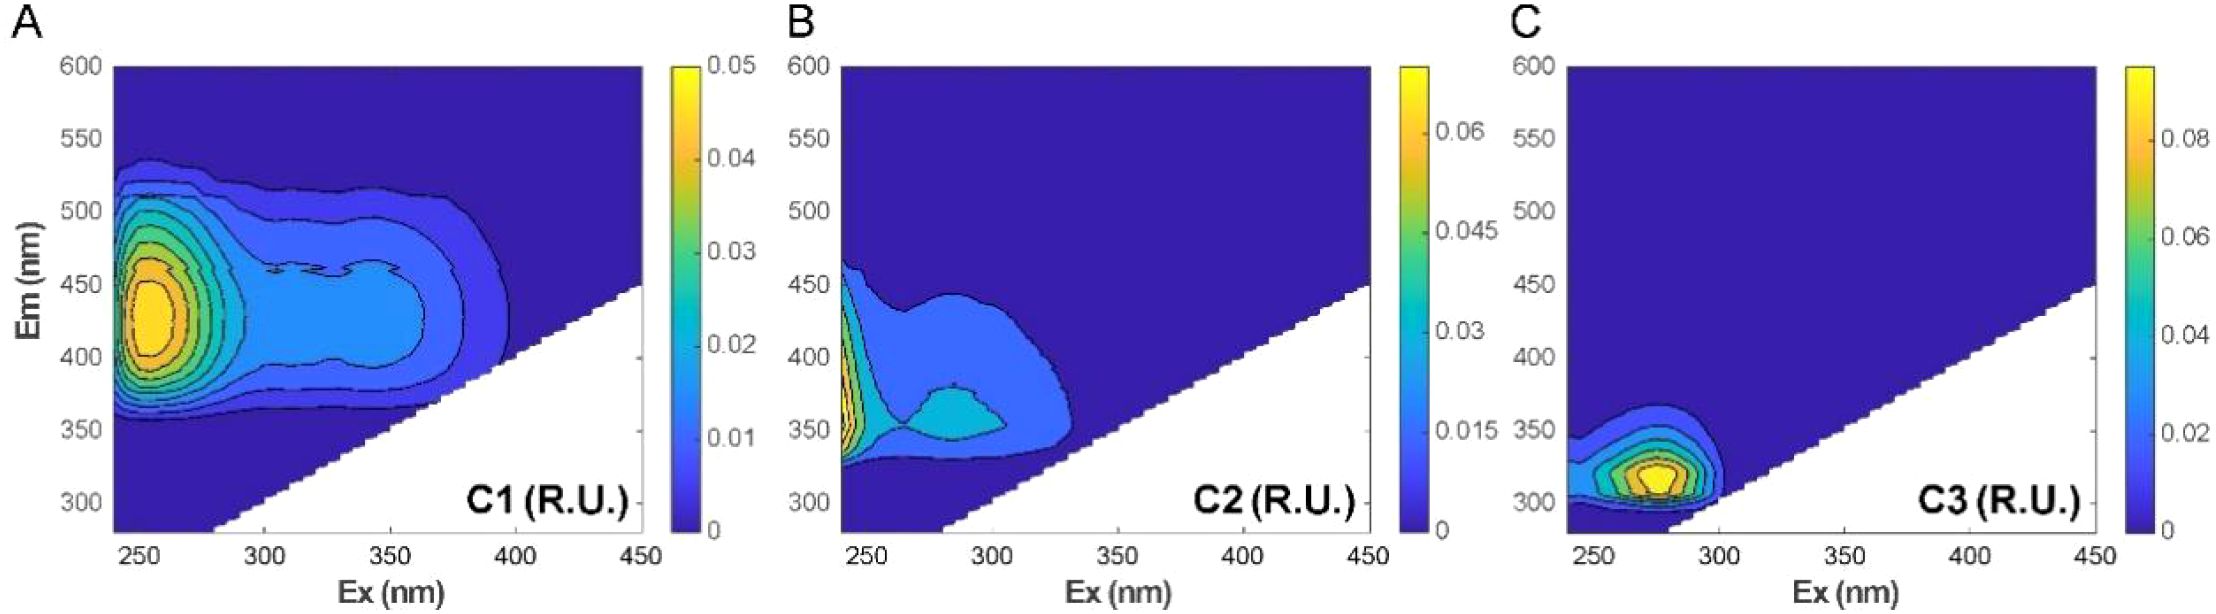
Figure 4. Fluorescence excitation-emission matrix contours of the components identified by PARAFAC: (A) C1, (B) C2 and (C) C3.
Component 1 (C1) has a primary (and secondary) fluorescence peaks at an Ex/Em wavelength of 255(345)/428 nm, classifying it as a humic-like substance of terrestrial origin enriched with fulvic acids. The optical characteristics of C1 are similar to the oxidized quinone-like component identified by Cory and Mcknight (2005), which could play an important role in the redox reactivity of DOM. C1 could also be produced by microbial metabolism since an increase of content has been observed during the bacterial processing of DOM (Amaral et al., 2016). Component 2 (C2) is composed of a primary peak at ≤240 nm excitation and 354 nm emission and a secondary excitation peak at 285 nm, that seems to be a combination of peak N, a microbially derived humic-like, and an uncommon fluorophore. Component C3 has a peak at 275 nm excitation and 320 nm emission, which resembles a fluorescent protein-like substance, associated with the autochthonous production of DOM in freshwater (Stedmon and Markager, 2005a). Compared with humic-like, the protein-like is susceptible to both photo- and microbial degradation (Stedmon and Markager, 2005b). In our study, C1, C2 and C3 show similar distributions in the water column with rapid decreasing trend in the upper layers, and constant low values with increasing depth. The maximum values of the three components mostly occurred in the surface, reflecting the extremely weak photodegradation due to the high turbidity of water.
4 Discussion
4.1 The nonconservative behavior of DOM
For samples exhibiting salinity ≤ 25, a significant negative correlation was observed between DOC and salinity (r = -0.95, p< 0.01). In contrast, no statistically significant correlation existed between DOC and salinity within samples characterized by salinity > 25. Consequently, the DOC-salinity relationship within the study area cannot be explained by a simple two end-member mixing model. Based on salinity gradients, the study area was partitioned into two distinct regions: the estuary (salinity ≤ 25) and the nearshore zone (salinity > 25). The pronounced negative DOC-salinity correlation within the estuary indicates mixing between two primary end-members: freshwater discharge from the Changjiang River (characterized by elevated DOC concentrations) and seawater from the East China Sea (ECS), exhibiting low DOC concentrations, low temperature, and high salinity. However, a nearshore warm water mass featuring high salinity and intermediate DOC concentrations also contributed to the mixing dynamics (Figure 3B). Considering the complex hydrography of the ECS, a third end-member potentially represents the Taiwan Warm Current (TWC). During early summer and autumn, DOC concentrations within the TWC were reported to be higher than those of the Kuroshio Current Water but lower than Coastal Current Water (Guo et al., 2018). Given the residence time of shelf waters in the ECS (Men and Liu, 2015), the residual dissolved organic matter (DOM) within the TWC is likely refractory, in contrast to the more bioavailable DOM characteristic of coastal waters. In situ biological production is a probable key source of DOC addition, particularly within high-salinity waters (>25). The absence of a DOC-salinity correlation within these high-salinity waters (>25) and the significant DOC enrichment observed in offshore regions (Figure 3A) further support this interpretation.
Significant positive liner correlations between DOC and a254 were both observed in the estuary and nearshore, but samples were assembled into two groups with different slopes (Figure 5A). It means that the behaviors of DOC and CDOM were not matching all the time. The distribution of DOC was driving by the mixing process of water masses with different features, while CDOM in Changjiang Estuary was affected strongly by the intensity of degradation.
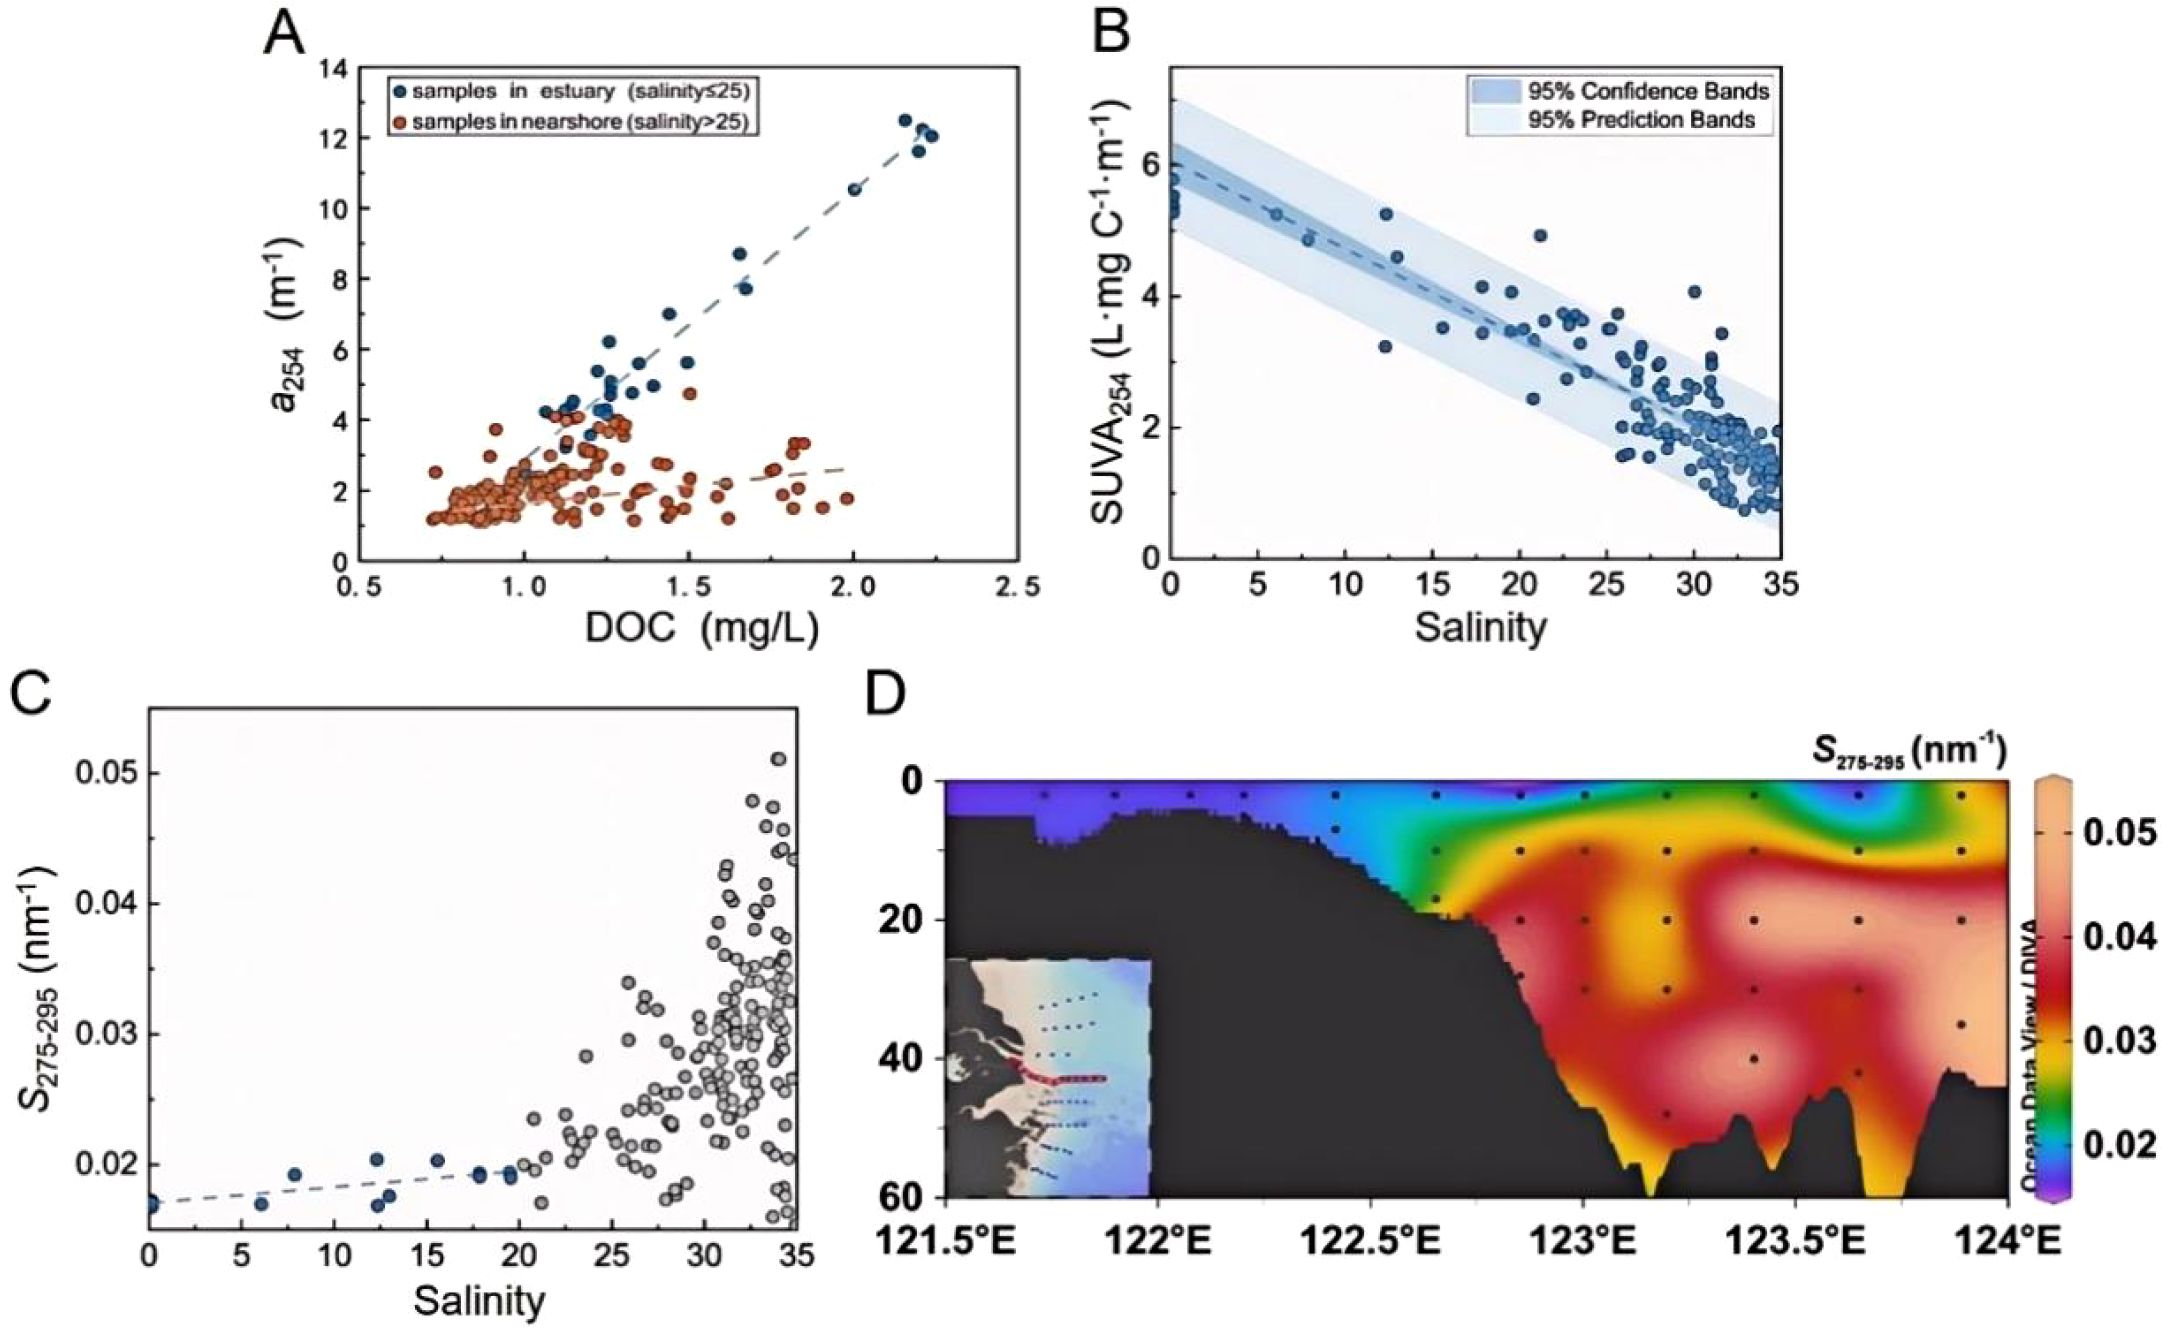
Figure 5. (A) Relationship between the a254 (m-1) and DOC (mg/L); (B) Relationship between the salinity and SUVA254 (L·mg C-1·m-1); (C) Relationship between the salinity and S275-295 (nm-1; blue dots represented the samples of salinity lower than 20 and gray dots represented the rest of samples); (D) The transect distribution (section B) of S275-295 (nm-1).
SUVA254 values decreased rapidly with increasing salinity (Figure 5B; r = -0.88, p< 0.01) reflecting that the aromaticity of CDOM was regulated by the two end-members, freshwater from Changjiang River and seawater from the ECS, and terrestrial substance being gradually removed via biochemical processes in the estuarine mixing (Gao et al., 2019). By contrast, the correlation of S275–295 and salinity is insignificant (Figure 5C). In the area of salinity< 20, the S275–295 increased slowly with salinity (r = 0.71, p< 0.01), which may result from the high turbidity of coastal waters. The transformation of CDOM is mainly caused by microbial processes rather than photobleaching, since the depth of UV-photic zone for photodegradation in turbid water rarely exceeds 10 cm (Kowalczuk et al., 2003). In the area with salinity< 25, the turbidity of surface water (< 10 m) is high, and reach 300–400 NTU in the turbidity maxima zone (Tang et al., 2020). The rapid increase of S275–295 with increased salinity suggests a shift from high molecular weight (HMW) to low molecular weight (LMW) of CDOM, implying the intense photobleaching without optical confinement (Ji et al., 2021; Gonçalves-Araujo et al., 2015; Yamashita et al., 2013). However, the strong correlation between a254 and salinity indicates that the change of the optical properties, which is the transformation of CDOM, is not accompanied by large change in terms of quantity (Gao et al., 2019). In the water column, S275–295 increased rapidly at shallow waters (above ~15 m; Figure 5D), indicating that most transformations, especially photodegradation, occurred in the upper euphotic zone (Swan et al., 2012). In the intermediate and deep waters, the CDOM was mainly dominated by the mixture of different water masses. The values of S275–295 generally decreased in the bottom water, which may result from the exudation of HMW CDOM from underlying sediments (Chen et al., 2017; Chen et al., 2016).
4.2 Tracing the organic matter using fluorescence spectra
The horizontal distributions of the fluorescent components are similar to that of CDOM (a254). The fluorescence intensities of C1, C2 and C3 show strong positive correlations with each other (C1&C2: r = 0.96, p< 0.01; C2&C3: r = 0.95, p< 0.01; C1&C3: r = 0.86, p< 0.01) and negative ones with salinity (C1&salinity: r = -0.96, p< 0.01; C2&salinity: r = -0.93, p< 0.01; C3&salinity: r = -0.84, p< 0.01), indicating the same source of the three fluorescent components, i.e. terrestrial input from Changjiang River.
HIX (the degree of humification of DOM) and BIX (an indicator of autotrophic productivity) are proposed for studying the complex DOM dynamics in estuarine systems (Fellman et al., 2010a; Huguet et al., 2009; Yang et al., 2019b, Guo et al., 2020). As the humification of DOM proceeds, the H:C ratio decreases, resulting in a shift toward longer emission wavelengths (Fellman et al., 2010a; Zsolnay et al., 1999). High values are used as an indicator of strongly humified organic matter, mainly of terrestrial origin. In the study area, the HIX varies from 0.33 to 3.10, with the average of 1.14 ± 0.40. With the increase of salinity, the HIX increases in the area of salinity< 15, since the estuarine water is normally too turbid to favor photodegradation, the humic-like components were reserved and collected. The high values are recorded in the region with salinity between 10 and 20, that corresponds the turbidity maxima zone (Tang et al., 2020; Huguet et al., 2009), indicating the existence of highly modified organic matter. Then HIX decreases to low levels due to the intensified photobleaching and mixing with seawater where salinity > 20 (Figure 6B). However, in Hangzhou Bay the HIX are as low as open sea (the average of HIX< 1, unpublished data), which is related to the high degradation of terrigenous DOM after long residence time.
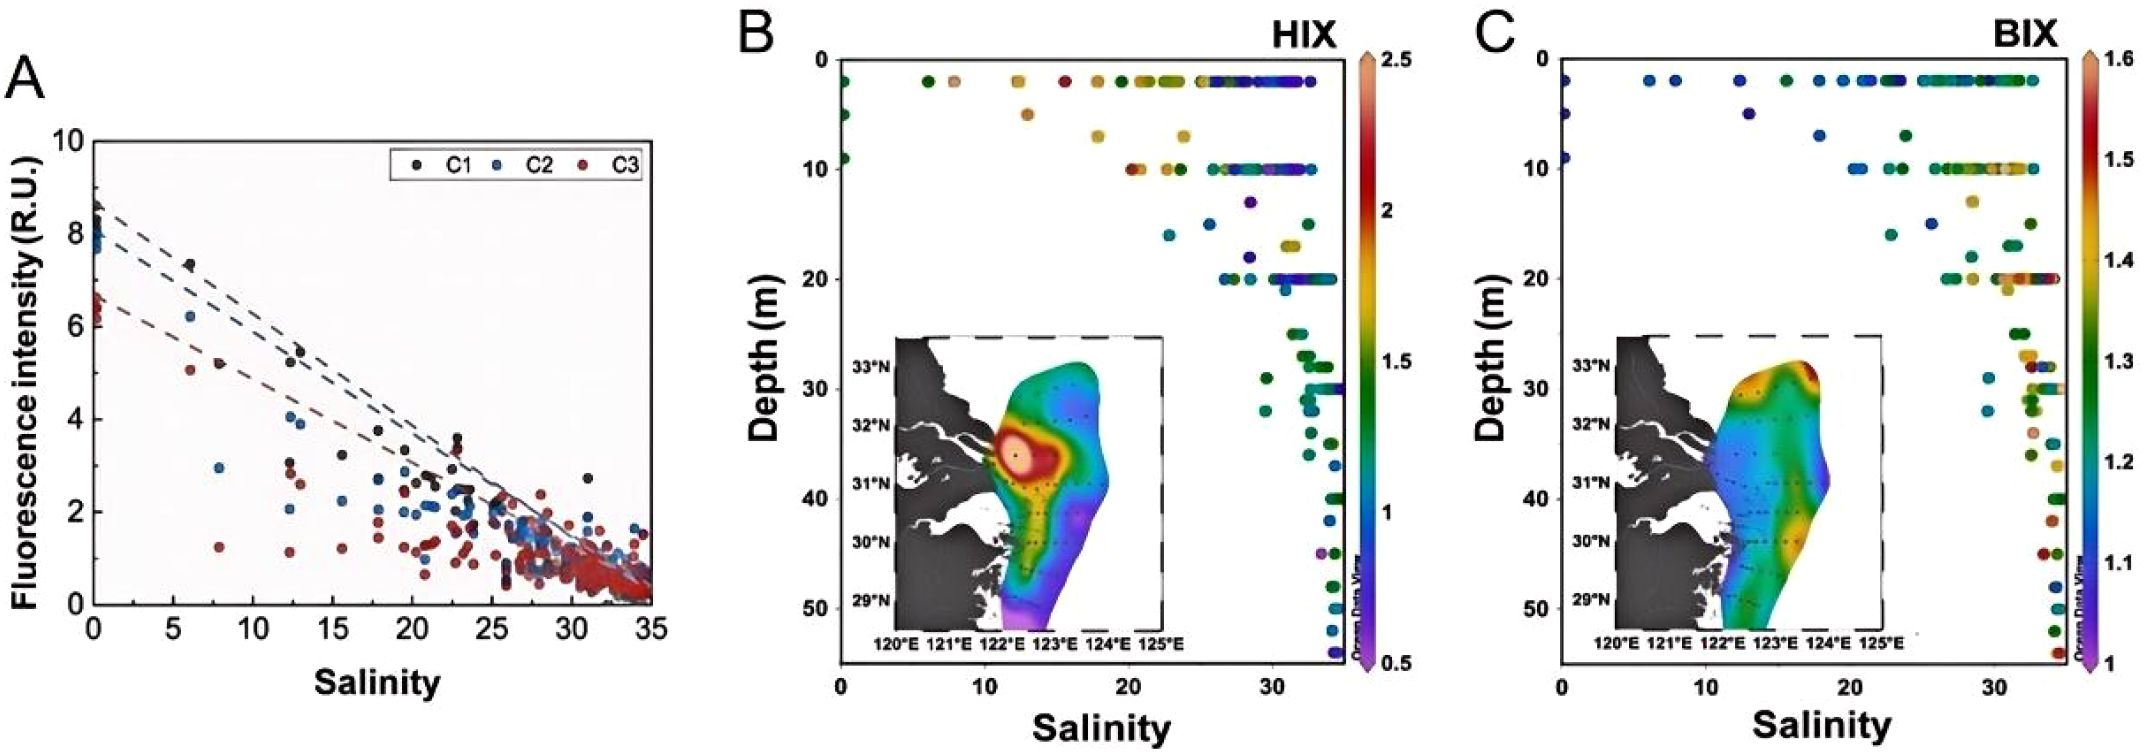
Figure 6. (A) The variations of the fluorescence intensities with salinity (C1, C2 and C3 are shown in gray, blue and red dots respectively; the dashed lines are plotted by linking the freshwater and seawater end-members); (B, C) The surface distribution and variation with depth and salinity of (B) HIX values and (C) BIX values.
The intensity ratio of C1+C2 and C3 (IHumic/IProtein) represents the recalcitrant and labile component in FDOM. IHumic/IProtein shows roughly the same changes as HIX (r = 0.96, p< 0.01), and further reflects the transformation of FDOM in estuarine mixing process. As shown in Figure 6A, the deviations from the dots to the lines connecting two end-members roughly represent the degraded part of each component. In salinity< 25 waters, IHumic/IProtein increase mainly resulted from the removal of protein-like components (C3). It has been reported that the microbial decomposition processes of protein-like is relatively strong in low-salinity estuary (Fellman et al., 2010b; Lønborg et al., 2010). Although the production of dissolved organic matter from phytoplankton is present as well (Yamashita et al., 2008; Fellman et al., 2010b), the primary production is limited due to the high levels of turbidity inducing limit light in the water column. With the proceed of mixing, IHumic/IProtein decreases as the photodegradation becomes more and more intense, or the dilution of humic-like and production of protein-like. The humic-like component C1, corresponding to peak A+C ubiquitous in aquatic environments, seems to be relatively stable in estuarine systems. In previous studies, this component showed strong correlation with lignin phenol (Walker et al., 2009). Considering the linear relationship with salinity and conservative behaviors in estuarine mixing, we suppose it’s applicable to trace freshwater input from rivers in Changjiang Estuary. BIX was introduced based on the broadening of the emission spectrum due to the presence of β fluorophore, which could represent the autochthonous biological activity in waters. In the estuaries and oceans, BIX > 1 is associated with the autochthonous origin of DOM recently produced (Huguet et al., 2009). The BIX values in the Changjiang Estuary are relatively constant (~1.1) and then increase with salinity from inner to outer estuary, suggesting the high primary production in the marine environment (Figure 6C). The maximum values of BIX are in the upper-middle waters characterized by high microbial activities. Several high values are observed in the bottom water, due to the creatures living in continental slope or seabed. It is noteworthy that the BIX of all samples are higher than 1 (1.06-1.70, with the average of 1.32 ± 0.15), indicating quite a few autochthonous DOM freshly produced in the whole study area. In the area with coastal upwelling outer the turbidity maxima zone, the abundant nutrients in seawater cause a high productivity. The phytoplankton blooms can be induced by the front-released internal waves, which increases the phytoplankton retention and vertical mixing (Tang et al., 2020). The potential productivity in this area should be high although the water in the estuary was turbid.
However, the fluorescence spectra offers a glimpse of DOM in the Changjiang Estuary. In the complex aquatic ecosystems, the sources and transference of DOM was multiple. Atmospheric deposition contributes little to the estuary carbon reservoir, but widely involved in the biochemical processes in surface water (Bao et al., 2018; Yang et al., 2019). In the bottom, DOM exchange in the sediment-water interface was driven by DOC concentration gradient and hydrodynamic force. The DOM sources of sediment porewater included microbial production and byproducts of processed sediments, and degradation of terrestrial organic matter in muddy areas (Zhou et al., 2022).
5 Conclusions
This study investigated the characteristics and mixing behavior of DOM in the Changjiang Estuary and its adjacent sea during the late flooding season in August 2021. The expansion of the Changjiang Diluted Water (CDW) to the northeast and south along the coast was observed, influenced by the persistent cyclones in the summer. This expansion was accompanied by a reduction in stratification. The bulk DOC and CDOM displayed comparable distribution patterns in the surface waters, with a decline observed from the inner to the outer estuary. This was primarily due to the mixing of freshwater from the Changjiang and seawater from the East China Sea (ECS). The terrestrial input was identified as the primary source of CDOM in the study area, although autochthonous DOM was also detected. While the quantity of CDOM appeared to be conservative, its composition and properties underwent extensive transformations, including reductions in aromaticity and molecular weight. Three fluorescent components were identified within the study area, comprising two humic-like and one protein-like component, further indicating the nonconservative behavior of CDOM. With increasing salinity (>20 PSU) and associated attenuation of light limitation, photochemical bleaching became the dominant mechanism for DOM removal in the mid-to-high salinity estuarine zones, effectively functioning as a photochemical reactor for terrestrial organic matter degradation. Our findings reveal the dynamics of DOM characteristics and mixing behavior in a major river-dominated estuary during late flood season, highlighting the interplay between terrestrial inputs and coastal processes.
Data availability statement
The raw data supporting the conclusions of this article will be made available by the authors, without undue reservation.
Author contributions
ZL: Writing – original draft, Writing – review & editing. RZ: Writing – original draft, Writing – review & editing. XM: Writing – review & editing. XW: Writing – review & editing. LS: Writing – review & editing. HL: Writing – review & editing. HJ: Writing – review & editing. JZ: Writing – review & editing. JC: Project administration, Supervision, Writing – review & editing.
Funding
The author(s) declare financial support was received for the research and/or publication of this article. This work was funded in part by the National Key Research and development Program of China (2024YFF0507000), Zhejiang Provincial Natural Science Foundation of China (ZCLZ25D0601), the National Natural Science Foundation of China (U23A2034), the Oceanic Interdisciplinary Program of Shanghai Jiao Tong University (SL2023MS019), and the Key Research & Development Program of Zhejiang (2022C03044, 2021YFC3101702).
Conflict of interest
The authors declare that the research was conducted in the absence of any commercial or financial relationships that could be construed as a potential conflict of interest.
The author(s) declared that they were an editorial board member of Frontiers, at the time of submission. This had no impact on the peer review process and the final decision.
Generative AI statement
The author(s) declare that no Generative AI was used in the creation of this manuscript.
Any alternative text (alt text) provided alongside figures in this article has been generated by Frontiers with the support of artificial intelligence and reasonable efforts have been made to ensure accuracy, including review by the authors wherever possible. If you identify any issues, please contact us.
Publisher’s note
All claims expressed in this article are solely those of the authors and do not necessarily represent those of their affiliated organizations, or those of the publisher, the editors and the reviewers. Any product that may be evaluated in this article, or claim that may be made by its manufacturer, is not guaranteed or endorsed by the publisher.
References
Amaral V., Graeber D., Calliari D., and Alonso C. (2016). Strong linkages between DOM optical properties and main clades of aquatic bacteria. Limnology Oceanography 61, 906–918. doi: 10.1002/lno.10258
Bao H., Wu Y., and Zhang J. (2015). Spatial and temporal variation of dissolved organic matter in the Changjiang: Fluvial transport and flux estimation. J. Geophys. Res. Biogeosci. 120, 1870–1886. doi: 10.1002/2015JG002948
Bao H., Yi Y., Wang C., Spencer R. G. M., Deng X., and Guo W. (2018). Dissolved organic matter in coastal rainwater: Concentration, bioavailability and depositional flux to seawater in southeastern China. Mar. Chem. 205, 48–55. doi: 10.1016/j.marchem.2018.07.008
Bianchi T. S., Garcia-Tigreros F., Yvon-Lewis S. A., Shields M., Mills H. J., Butman D., et al. (2013). Enhanced transfer of terrestrially derived carbon to the atmosphere in a flooding event. Geophysical Res. Lett. 40, 116–122. doi: 10.1029/2012GL054145
Blough N. V. and Del Vecchio R. (2002). “Chapter 10 - chromophoric DOM in the coastal environment,” in Biogeochemistry of marine dissolved organic matter. Eds. Hansell D. A. and & Carlson C. A. (Academic Press, San Diego).
Brogi S. R., Jung J. Y., Ha S. Y., and Hur J. (2019). Seasonal differences in dissolved organic matter properties and sources in an Arctic fjord: Implications for future conditions. Sci. Total Environ. 694, 133740.1–133740.9. doi: 10.1016/j.scitotenv.2019.133740
Catalán N., Pastor A., Borrego C. M., Casas-Ruiz J. P., Hawkes J. A., Gutiérrez C., et al. (2021). The relevance of environment vs. composition on dissolved organic matter degradation in freshwaters. Limnology Oceanography 66, 306–320. doi: 10.1002/lno.11606
Chang P.-H., Isobe A., Kang K.-R., Ryoo S.-B., Kang H.-S., and Kim Y.-H. (2014). Summer behavior of the Changjiang diluted water to the East/Japan Sea: A modeling study in 2003. Continental Shelf Res. 81, 7–18. doi: 10.1016/j.csr.2014.03.007
Changjiang Sediment Bulletin (2021). Press of ministry of water resources of the people’s republic of China. Available online at: http://www.cjh.com.cn/ (Accessed July 4, 2022).
Chen M., Jung J., Lee Y. K., and Hur J. (2018). Surface accumulation of low molecular weight dissolved organic matter in surface waters and horizontal off-shelf spreading of nutrients and humic-like fluorescence in the Chukchi Sea of the Arctic Ocean. Sci. Total Environ. 639, 624–632. doi: 10.1016/j.scitotenv.2018.05.205
Chen M., Kim S.-H., Jung H.-J., Hyun J.-H., Choi J. H., Lee H.-J., et al. (2017). Dynamics of dissolved organic matter in riverine sediments affected by weir impoundments: Production, benthic flux, and environmental implications. Water Res. 121, 150–161. doi: 10.1016/j.watres.2017.05.022
Chen M., Kim J.-H., Nam S.-I., Niessen F., Hong W.-L., Kang M.-H., et al. (2016). Production of fluorescent dissolved organic matter in Arctic Ocean sediments. Sci. Rep. 6, 39213. doi: 10.1038/srep39213
Chen X., Seo H., Han H., Seo J., Kim T., and Kim G. (2021). Conservative behavior of terrestrial trace elements associated with humic substances in the coastal ocean. Geochimica Cosmochimica Acta 308, 373–383. doi: 10.1016/j.gca.2021.05.020
Chowdhury and Shakhawat (2013). Trihalomethanes in drinking water: Effect of natural organic matter distribution. Water SA 37, 1–17. doi: 10.4314/wsa.v39i1.1
Coble P. G. (1996). Characterization of marine and terrestrial DOM in seawater using excitation-emission matrix spectroscopy. Mar. Chem. 51, 325–346. doi: 10.1016/0304-4203(95)00062-3
Coble P. G., Del Castillo C., and Avril B. (1998). Distribution and optical properties of CDOM in the Arabian Sea during the 1995 Southwest Monsoon. Deep-Sea Res. Pt. II 45, 2195–2223. doi: 10.1016/S0967-0645(98)00068-X
Cory R. M. and Mcknight D. M. (2005). Fluorescence spectroscopy reveals ubiquitous presence of oxidized and reduced quinones in dissolved organic matter. Environ. Sci. Technol. 39, 8142–8149. doi: 10.1021/es0506962
Deng B., Zhang J., and Wu Y. (2006). Recent sediment accumulation and carbon burial in the East China Sea. Global Biogeochemical Cycles 20, GB3014. doi: 10.1029/2005GB002559
Dias A., Kurian S., and Thayapurath S. (2020). Influence of environmental parameters on bio-optical characteristics of colored dissolved organic matter in a complex tropical coastal and estuarine region. Estuarine Coast. Shelf Sci. 242, 106864. doi: 10.1016/j.ecss.2020.106864
Fellman J., Hood E., and Spencer R. (2010a). Fluorescence spectroscopy opens new windows into dissolved organic matter dynamics in freshwater ecosystems: A review. Limnology Oceanography 55, 2452–2462. doi: 10.4319/lo.2010.55.6.2452
Fellman J. B., Spencer R. G. M., Hernes P. J., Edwards R. T., D’Amore D. V., and Hood E. (2010b). The impact of glacier runoff on the biodegradability and biochemical composition of terrigenous dissolved organic matter in near-shore marine ecosystems. Mar. Chem. 121, 112–122. doi: 10.1016/j.marchem.2010.03.009
Fichot C. and Benner R. (2012). The spectral slope coefficient of chromophoric dissolved organic matter (S275–S295) as a tracer of terrigenous dissolved organic carbon in river-influenced ocean margins. Limnology Oceanography 57, 1453–1466. doi: 10.4319/lo.2012.57.5.1453
Gao L., Gao Y., Zong H., and Guo L. (2019). Elucidating the hidden nonconservative behavior of DOM in large river-dominated estuarine and coastal environments. J. Geophysical Research: Oceans 124, 4258–4271. doi: 10.1029/2018JC014731
Gonçalves-Araujo R., Stedmon C. A., Heim B., Dubinenkov I., Kraberg A., Moiseev D., et al. (2015). From fresh to marine waters: characterization and fate of dissolved organic matter in the lena river delta region, siberia. Front. Mar. Sci. 2. doi: 10.3389/fmars.2015.00108
Gong G. C., Chen Y. L. L., and Liu K. K. (1996). Chemical hydrography and chlorophyll a distribution in the East China Sea in summer: Implications in nutrient dynamics. Continental Shelf Res. 16, 1561–1590. doi: 10.1016/0278-4343(96)00005-2
Gong G., Liu K., Chiang K., Hsiung T., Chang J., Chen C., et al. (2011). Yangtze River floods enhance coastal ocean phytoplankton biomass and potential fish production. Geophys. Res. Lett. 38, L13603. doi: 10.1029/2011GL047519
Guéguen C., Itoh M., Kikuchi T., Eert J., and Williams W. J. (2015). Variability in dissolved organic matter optical properties in surface waters in the Amerasian Basin. Front. Mar. Sci. 2. doi: 10.3389/fmars.2015.00078
Guo J.-Q., Liang S.-K., Li X.-J., Li W., Wang Y.-F., and Su R.-G. (2018). Composition and bioavailability of dissolved organic matter in different water masses of the East China sea. Estuarine Coast. Shelf Sci. 212, 189–202. doi: 10.1016/j.ecss.2018.07.009
Guo J., Liang S., Wang X., and Pan X. (2021). Distribution and dynamics of dissolved organic matter in the changjiang estuary and adjacent sea. J. Geophysical Research: Biogeosciences 126, e2020JG006161.
Guo L., Santschi P. H., and Warnken K. W. (1995). Dynamics of dissolved organic carbon (DOC) in oceanic environments. Limnology Oceanography 40, 1392–1403. doi: 10.4319/lo.1995.40.8.1392
Guo W., Stedmon C. A., Han Y., Wu F., Yu X., and Hu M. (2007). The conservative and non-conservative behavior of chromophoric dissolved organic matter in Chinese estuarine waters. Mar. Chem. 107, 357–366. doi: 10.1016/j.marchem.2007.03.006
Guo W., Wang C., Li Y., Qu L., Lang M., Deng Y., et al. (2020). Characterization of aquatic dissolved organic matter by spectral analysis: From watershed to deep ocean. Adv. Earth Sci. 35, 933–947.
Guo W., Yang L., Hong H., Stedmon C. A., Wang F., Xu J., et al. (2011). Assessing the dynamics of chromophoric dissolved organic matter in a subtropical estuary using parallel factor analysis. Mar. Chem. 124, 125–133. doi: 10.1016/j.marchem.2011.01.003
Helms J., Stubbins A., Ritchie J., Minor E., Kieber D., and Mopper K. (2008). Absorption spectral slopes and slope ratios as indicators of molecular weight, source, and photobleaching of chromophoric dissolved organic matter. Limnology Oceanography 53, 955–969. doi: 10.4319/lo.2008.53.3.0955
Hu C., Muller-Karger F. E., and Zepp R. G. (2002). Absorbance, absorption coefficient, and apparent quantum yield: A comment on common ambiguity in the use of these optical concepts. Limnology Oceanography 47, 1261–1267. doi: 10.4319/lo.2002.47.4.1261
Huguet A., Vacher L., Relexans S., Saubusse S., Froidefond J.-M., and Parlanti E. (2009). Properties of fluorescent dissolved organic matter in the gironde estuary. Organic Geochemistry 40, 706–719. doi: 10.1016/j.orggeochem.2009.03.002
Hung J.-J., Pao-Lin L., and Kon-Kee L. (2000). Dissolved and particulate organic carbon in the southern East China Sea. Continental Shelf Res. 20, 545–569. doi: 10.1016/S0278-4343(99)00085-0
Ittekkot V. (1988). Global trends in nature of organic matter in river suspensions. Nature 332, 436–438. doi: 10.1038/332436a0
Jeon M. H., Jung J., Park M. O., Aoki S., Kim T.-W., and Kim S.-K. (2021). Tracing Circumpolar Deep Water and glacial meltwater using humic-like fluorescent dissolved organic matter in the Amundsen Sea, Antarctica. Mar. Chem. 235, 104008. doi: 10.1016/j.marchem.2021.104008
Ji C.-X., Chen Y., and Yang G.-P. (2021). Seasonal variation, degradation, and bioavailability of dissolved organic matter in the changjiang estuary and its adjacent east China sea. J. Geophysical Research: Oceans 126, e2020JC016648.
Jørgensen L., Stedmon C. A., Kragh T., Markager S., Middelboe M., and Søndergaard M. (2011). Global trends in the fluorescence characteristics and distribution of marine dissolved organic matter. Mar. Chem. 126, 139–148. doi: 10.1016/j.marchem.2011.05.002
Jung J., Son J. E., Lee Y. K., Cho K.-H., Lee Y., Yang E. J., et al. (2021). Tracing riverine dissolved organic carbon and its transport to the halocline layer in the Chukchi Sea (western Arctic Ocean) using humic-like fluorescence fingerprinting. Sci. Total Environ. 772, 145542. doi: 10.1016/j.scitotenv.2021.145542
Kowalczuk P., Cooper W. J., Whitehead R. F., Durako M. J., and Sheldon W. (2003). Characterization of CDOM in an organic-rich river and surrounding coastal ocean in the South Atlantic Bight. Aquat. Sci. 65, 384–401. doi: 10.1007/s00027-003-0678-1
Lambert T., Bouillon S., Darchambeau F., Morana C., Roland F. A. E., Descy J.-P., et al. (2017). Effects of human land use on the terrestrial and aquatic sources of fluvial organic matter in a temperate river basin (The Meuse River, Belgium). Biogeochemistry 136, 191–211. doi: 10.1007/s10533-017-0387-9
Lawaetz A. J. and Stedmon C. A. (2009). Fluorescence intensity calibration using the Raman scatter peak of water. Appl. Spectrosc 63, 936–940. doi: 10.1366/000370209788964548
Li M., Xu K., Watanabe M., and Chen Z. (2007). Long-term variations in dissolved silicate, nitrogen, and phosphorus flux from the Yangtze River into the East China Sea and impacts on estuarine ecosystem. Estuarine Coast. Shelf Sci. 71, 3–12. doi: 10.1016/j.ecss.2006.08.013
Lin C. Y., Shyu C. Z., and Shih W. H. (1992). The kuroshio fronts and cold eddies off northeastern Taiwan observed by NOAA-AVHRR imageries. Terrestrial Atmospheric Oceanic Sci. 3, 225–242. doi: 10.3319/TAO.1992.3.3.225(KEEP)
Liu K.-K., Peng T.-H., Shaw P.-T., and Shiah F.-K. (2003). Circulation and biogeochemical processes in the East China Sea and the vicinity of Taiwan: an overview and a brief synthesis. Deep Sea Res. Part II: Topical Stud. Oceanography 50, 1055–1064.
Lønborg C., Álvarez-Salgado X. A., Davidson K., Martínez-García S., and Teira E. (2010). Assessing the microbial bioavailability and degradation rate constants of dissolved organic matter by fluorescence spectroscopy in the coastal upwelling system of the Ría de Vigo. Mar. Chem. 119, 121–129.
Ludwig W., Suchet P., and Probst J.-L. (1996). River discharges of carbon to the world’s oceans: Determining local inputs of alkalinity and of dissolved and particulate organic carbon. Comptes Rendus l’Academie Sci. - Serie IIa: Sci. la Terre Des. Planetes 323, 1007–1014.
Luterbacher J., Werner J. P., Smerdon J. E., Fernández-Donado L., González-Rouco F. J., Barriopedro D., et al. (2016). European summer temperatures since Roman times. Environ. Res. Lett. 11, 024001. doi: 10.1088/1748-9326/11/2/024001
Makarewicz A., Kowalczuk P., Sagan S., Granskog M. A., Pavlov A. K., Zdun A., et al. (2018). Characteristics of chromophoric and fluorescent dissolved organic matter in the Nordic Seas. Ocean Sci. 14, 543–562. doi: 10.5194/os-14-543-2018
Men W. and Liu G. (2015). Distribution of 226Ra and the residence time of the shelf water in the Yellow Sea and the East China Sea. J. Radioanalytical Nucl. Chem. 303, 2333–2344. doi: 10.1007/s10967-014-3749-y
Miao Y., Wang B., Li D., Sun X., Xu Z., Sun Q., et al. (2023). Observational studies of the effects of wind mixing and biological process on the vertical distribution of dissolved oxygen off the Changjiang Estuary. Front. Mar. Sci. 10. doi: 10.3389/fmars.2023.1081688
Murphy K. R., Stedmon C. A., Wenig P., and Bro R. (2014). OpenFluor- an online spectral library of auto-fluorescence by organic compounds in the environment. Analytical Methods 6, 658–661. doi: 10.1039/C3AY41935E
Ohno T. (2002). Fluorescence inner-filtering correction for determining the humification index of dissolved organic matter. Environ. Sci. Technol. 36, 742–746. doi: 10.1021/es0155276
Osburn C. L., Boyd T. J., Montgomery M. T., Bianchi T. S., Coffin R. B., and Paerl H. W. (2016). Optical proxies for terrestrial dissolved organic matter in estuaries and coastal waters. Front. Mar. Sci. 2, 127. doi: 10.3389/fmars.2016.00127
Shuang X., Chao W., Zhaohong Z., Youtao S., and Qiang L. (2016). Photodegradation of dissolved organic matter in ice under solar irradiation. Chemosphere 144, 816–826. doi: 10.1016/j.chemosphere.2015.09.059
Song S., Bellerby R., Liu J., Guo W., Yu P., Ge J., et al. (2023). Impacts of an extreme Changjiang flood on variations in carbon cycle components in the Changjiang Estuary and adjacent East China Sea. Cont. Shelf Res. 269, 105137. doi: 10.1016/j.csr.2023.105137
Stedmon C. and Bro R. (2008). Characterizing dissolved organic matter fluorescence with parallel factor analysis: A tutorial. Limnology Oceanography 6, 572–579.
Stedmon C. and Markager S. (2005a). Resolving the variability in dissolved organic matter fluorescence in a temperate estuary and its catchment using PARAFAC analysis. Limnology Oceanography - LIMNOL OCEANOGR 50, 686–697. doi: 10.4319/lo.2005.50.2.0686
Stedmon C. and Markager S. (2005b). Tracing the production and degradation of autochthonous fractions of dissolved organic matter by fluorescence analysis. Limnology Oceanography 50, 1415–1426. doi: 10.4319/lo.2005.50.5.1415
Stedmon C. A., Markager S., and Bro R. (2003). Tracing dissolved organic matter in aquatic environments using a new approach to fluorescence spectroscopy. Mar. Chem. 82, 239–254. doi: 10.1016/S0304-4203(03)00072-0
Su J. L. (2001). A review of circulation dynamics of the coastal oceans near China (in Chinese). Acta Oceanol. Sin. 23, 1–16.
Swan C. M., Nelson N. B., Siegel D. A., and Kostadinov T. S. (2012). The effect of surface irradiance on the absorption spectrum of chromophoric dissolved organic matter in the global ocean. Deep Sea Res. Part I: Oceanographic Res. Papers 63, 52–64.
Tang T. Y., Tai J. H., and Yang Y. J. (2000). The flow pattern north of Taiwan and the migration of the Kuroshio. Continental Shelf Res. 20, 349–371. doi: 10.1016/S0278-4343(99)00076-X
Tang S. F., Tang J. C., Yuan D. L., Wang Z. T., Zhang Y. T., and Rao Y. D. (2020). Elimination of humic acid in water: comparison of UV/PDS and UV/PMS. Rsc Adv. 10, 17627–17634. doi: 10.1039/D0RA01787F
Twardowski M. S., Boss E., Sullivan J. M., and Donaghay P. L. (2004). Modeling the spectral shape of absorption by chromophoric dissolved organic matter. Mar. Chem. 89, 69–88. doi: 10.1016/j.marchem.2004.02.008
Walker S. A., Amon R. M. W., Stedmon C., Duan S., and Louchouarn P. (2009). The use of PARAFAC modeling to trace terrestrial dissolved organic matter and fingerprint water masses in coastal Canadian Arctic surface waters. J. Geophysical Research: Biogeosciences 114. doi: 10.1029/2009JG000990
Wang B., Chen J., Jin H., Li D., Gao S., Tian S., et al. (2023). Subsurface oxygen minima regulated by remineralization and bottom flushing along 123°E in the inner East China Sea. Front. Mar. Sci. 9. doi: 10.3389/fmars.2022.1081975
Wauthy M., Rautio M., Christoffersen K. S., Forsström L., Laurion I., Mariash H. L., et al. (2018). Increasing dominance of terrigenous organic matter in circumpolar freshwaters due to permafrost thaw. Limnology Oceanography Lett. 3, 186–198. doi: 10.1002/lol2.10063
Weishaar J. L., Aiken G. R., Bergamaschi B. A., Fram M. S., Fujii R., and Mopper K. (2003). Evaluation of specific ultraviolet absorbance as an indicator of the chemical composition and reactivity of dissolved organic carbon. Environ. Sci. Technol. 37, 4702–4708. doi: 10.1021/es030360x
Williams C. J., Yamashita Y., Wilson H. F., Jaffé R., and Xenopoulos M. A. (2010). Unraveling the role of land use and microbial activity in shaping dissolved organic matter characteristics in stream ecosystems. Limnology Oceanography 55, 1159–1171. doi: 10.4319/lo.2010.55.3.1159
Wiltshire K. H. and Manly B. F. J. (2004). The warming trend at Helgoland Roads, North Sea: Phytoplankton response. Helgoland Mar. Res. 58, 269–273. doi: 10.1007/s10152-004-0196-0
Yamashita Y., Jaffé R., Maie N., and Tanoue E. (2008). Assessing the dynamics of dissolved organic matter (DOM) in coastal environments by excitation emission matrix fluorescence and parallel factor analysis (EEM-PARAFAC). Limnology Oceanography 53, 1900–1908. doi: 10.4319/lo.2008.53.5.1900
Yamashita Y., Nosaka Y., Suzuki K., Ogawa H., Takahashi K., and Saito H. (2013). Photobleaching as a factor controlling spectral characteristics of chromophoric dissolved organic matter in open ocean. Biogeosciences 10, 7207–7217. doi: 10.5194/bg-10-7207-2013
Yamashita Y., Panton A., Mahaffey C., and Jaffé R. (2011). Assessing the spatial and temporal variability of dissolved organic matter in Liverpool Bay using excitation–emission matrix fluorescence and parallel factor analysis. Ocean Dynamics 61, 569–579. doi: 10.1007/s10236-010-0365-4
Yang L., Cheng Q., Zhuang W. E., Wang H., and Chen W. (2019). Seasonal changes in the chemical composition and reactivity of dissolved organic matter at the land-ocean interface of a subtropical river. Environ. Sci. pollut. Res. 26, 24595–24608. doi: 10.1007/s11356-019-05700-2
Yang L., Hong H., Guo W., Chen C. T. A., Pan P. I., and Feng C. C. (2012). Absorption and fluorescence of dissolved organic matter in submarine hydrothermal vents off ne Taiwan. Mar. Chem. 128, 64–71. doi: 10.1016/j.marchem.2011.10.003
Yang F., Huang Q., Li J., and Zhu X. (2007). Characterization of chromophoric dissolved organic matter in the Yangtze Estuary by absorption and fluorescence spectroscopy. J. Environ. Sci. Sustain. Soc. 1, 55–60.
Ye J., Yao P., Xu Y., Wang J., and Zhao B. (2019). Distribution, sources and mixing behavior of different carbon species along a salinity gradient in the Changjiang Estuary. Haiyang Xuebao 41, 15–26. doi: 10.3969/j.issn.0253-4193.2019.04.002
Zhang J., Zhao J., Yang G., and Liu W. (2019). Concentration and characterization of colored dissolved organic matter in the surface microlayer and subsurface water of the yellow sea and the east China sea. J. Ocean Univ. China 18, 383–393. doi: 10.1007/s11802-019-3763-3
Zhao L., Gao L., and Guo L. (2021). Seasonal variations in molecular size of chromophoric dissolved organic matter from the lower changjiang (yangtze) river. J. Geophysical Research: Biogeosciences 126, e2020JG006160.
Zhao R., Li Z., Aye A. A., Zheng H., Jin W., Zhang J., et al. (2023). Characteristics of chromophoric dissolved organic matter in the Northern Andaman Sea. Front. Mar. Sci. 9. doi: 10.3389/fmars.2022.1043194
Zheng H., Yan Z., Chen J., Jin H., Chen C.-T. A., Liu M., et al. (2018). Seasonal variations of dissolved organic matter in the east China sea using EEM-PARAFAC and implications for carbon and nutrient cycling. Sustainability 10, 1444. doi: 10.3390/su10051444
Zhou F., Gao X., Song J., Chen C. T. A., Yuan H., and Xing Q. (2018). Absorption properties of chromophoric dissolved organic matter (CDOM) in the East China Sea and the waters off eastern Taiwan. Continental Shelf Res. 159, 12–23. doi: 10.1016/j.csr.2018.03.005
Zhou Y., Zhao C., He C., Li P., Wang Y., Pang Y., et al. (2022). Characterization of dissolved organic matter processing between surface sediment porewater and overlying bottom water in the Yangtze River Estuary. Water Res. 215, 118260. doi: 10.1016/j.watres.2022.118260
Zhu W. Z., Zhang J., and Yang G. P. (2018). Mixing behavior and photobleaching of chromophoric dissolved organic matter in the Changjiang River estuary and the adjacent East China Sea. Estuarine Coast. shelf Sci. 207, 422–434. doi: 10.1016/j.ecss.2017.07.019
Keywords: Changjiang Estuary, dissolved organic matter, chromophoric DOM, fluorescence-EEM, nonconservative behavior
Citation: Li Z, Zhao R, Ma X, Wang X, Su L, Li H, Jin H, Zeng J and Chen J (2025) Biogeochemical dynamics of dissolved organic matter in the Changjiang Estuary during a late flooding season. Front. Mar. Sci. 12:1631710. doi: 10.3389/fmars.2025.1631710
Received: 20 May 2025; Accepted: 11 August 2025;
Published: 09 September 2025.
Edited by:
Liyang Yang, Fuzhou University, ChinaReviewed by:
Laodong Guo, University of Wisconsin–Milwaukee, United StatesYasong Wang, Shanghai Ocean University, China
Copyright © 2025 Li, Zhao, Ma, Wang, Su, Li, Jin, Zeng and Chen. This is an open-access article distributed under the terms of the Creative Commons Attribution License (CC BY). The use, distribution or reproduction in other forums is permitted, provided the original author(s) and the copyright owner(s) are credited and that the original publication in this journal is cited, in accordance with accepted academic practice. No use, distribution or reproduction is permitted which does not comply with these terms.
*Correspondence: Jianfang Chen, amZjaGVuQHNpby5vcmcuY24=