Abstract
The Arctic is undergoing rapid environmental transformation, with intensified glacial and permafrost melt fundamentally altering freshwater discharge regimes and biogeochemical fluxes to coastal fjord systems. Here, we investigate how seasonal meltwater dynamics shape protistan plankton communities along a terrestrial – marine gradient in Isfjorden (Svalbard) during the exceptionally warm year of 2018. Sampling across three distinct melt season stages – pre-freshet (May), spring freshet (June), and late summer runoff (August) – revealed pronounced temporal and spatial shifts in community structure, strongly linked to evolving environmental gradients. In May, cold, clear, unstratified waters and marine nutrient inputs supported a typical late spring bloom, led by Phaeocystis pouchetii, which significantly contributed to the particulate organic carbon pool, and was followed by diatoms of the genera Chaetoceros and Thalassiosira. The June freshet triggered sharp stratification and nutrient enrichment from glacial and terrestrial sources, driving an unprecedented proliferation of small flagellates, notably Chrysochromulina and two morphologically distinct, yet unidentified taxa. However, by August, escalating turbidity from intensified meltwater inputs and sediment resuspension severely constrained photic conditions, suppressing protistan biomass despite sustained nutrient availability. Across the season, community dynamics were governed by complex interactions between nutrient supply, light limitation, and physical forcings such as stratification and advection. Our findings suggest that ongoing Arctic warming may increasingly favor opportunistic, small flagellates over traditional diatom-dominated blooms, with major implications for carbon cycling and food web dynamics in Arctic fjords.
1 Introduction
The Arctic is experiencing amplified warming compared to the global average (Cohen et al., 2014). This unprecedented rise in temperature is reshaping regional physical and biogeochemical systems through increased precipitation variability (Bintanja and Andry, 2017; McCrystall et al., 2021), declining terrestrial snow cover (van Pelt et al., 2016), and accelerated glacier melt and permafrost thaw (Comiso and Hall, 2014). These changes are significantly enhancing freshwater discharge into Arctic coastal systems, particularly during summer months (Hopwood et al., 2020).
Fjord systems are primary conduits for meltwater entering the Arctic Ocean and represent key transition zones between terrestrial and marine environments. Through complex cross-fjord circulation, exchange, and mixing processes, fjords act as dynamic biogeochemical interfaces and ecological hotspots (Bianchi et al., 2020; Skogseth et al., 2020). These environments serve as important zones of carbon sequestration and provide critical habitat and food resources for both pelagic and benthic communities (Kuliński et al., 2014). As dynamic land-sea interfaces, fjord and estuarine reservoirs can also support high biological productivity. Understanding fjord-scale processes is therefore essential to assessing how climate-driven meltwater inputs affect Arctic hydrography and biological communities (Hegseth and Tverberg, 2013; Hopwood et al., 2020).
Svalbard, a key location for Arctic climate research, has shown clear evidence of regional warming and reduced sea ice cover. The processes occurring in this archipelago are considered early indicators of broader change in the European Arctic (Skogseth et al., 2020). Projections suggest substantial glacier mass loss by the end of the 21st century, with reductions ranging from 20–50% under Representative Concentration Pathway (RCP) 2.6 and from 40–85% under RCP 8.5, accompanied by areal losses of 10–50% and 30–80%, respectively (Lee et al., 2023).
Isfjorden, the largest fjord system on the west coast of Spitsbergen, exemplifies the impacts of ocean-climate interactions. Its hydrographic complexity – driven by the interplay of Atlantic and Arctic water masses – creates a mosaic of habitats, from turbid, stratified, freshwater-influenced inner fjords to clearer, saline, nutrient-rich outer regions, across relatively small spatial scales. These gradients provide a unique natural laboratory for investigating marine ecosystem responses to both oceanic forcing, such as Atlantic inflow and temperature variability, and terrestrial forcing, including glacial melt, runoff, and sediment delivery. Unlike many Arctic fjords, Isfjorden lacks a shallow sill at its entrance, allowing direct exchange with the adjacent shelf and slope. Warm Atlantic Water (AW) from the West Spitsbergen Current (WSC) and colder Arctic Water (ArW) from the Spitsbergen Polar Current enter the fjord, undergo modification during transit, and exit via a broad northern outflow (Nilsen et al., 2008). In addition to oceanic influence, Isfjorden is heavily affected by terrestrial processes including glacier melt, coastal erosion, and permafrost thaw (Pogojeva et al., 2022). Up to 90% of total freshwater runoff occurs between June and August, with peak discharge in July (Svendsen et al., 2002). Snowmelt typically begins in mid-May to early June, coinciding with air temperatures rising above 0 °C. The melt season is characterized by a bimodal discharge pattern: early–season runoff driven by snow and ice melt, followed later by enhanced flow from active layer thaw and rainfall-induced floods (Majchrowska et al., 2015). These hydrological processes, modulated by meteorological variability, influence freshwater and sediment fluxes to the fjord, altering water column stratification, light availability, nutrient delivery, and biological productivity.
Within planktonic communities, protists are highly responsive indicators of environmental change due to their short generation times, high turnover rates, and close coupling to light-dependent surface waters (Foissner and Hawksworth, 2009). At the same time, they play central roles in Arctic food webs – as primary producers and mediators of energy and carbon transfer. In Svalbard fjord systems, observed trends toward fresher, more turbid surface waters have been linked to alterations in biogeochemical processes and ecosystem dynamics (Konik et al., 2021). Protistan communities, in particular, show increasing dominance of small, motile flagellates (e.g., Kubiszyn et al., 2014; Piwosz et al., 2009, 2015), which are well adapted to stratified and turbid environments through efficient nutrient uptake, phagotrophy, and the ability to exploit particle-rich microhabitats. Climate-driven increases in meltwater input may reinforce this compositional shift, fundamentally restructuring pelagic-benthic trophic linkages and polar ecosystem functioning (Thackeray et al., 2016). Despite extensive research in the Svalbard region (e.g., Isfjorden-Adventfjorden: Marquardt et al., 2016; Vader et al., 2025; Kongsfjorden: Assmy et al., 2023), key knowledge gaps remain, particularly regarding the seasonal dynamics and ecological roles of understudied flagellate taxa. These groups are often underrepresented in ecological assessments due to their small size and historically lower perceived importance compared to diatoms and dinoflagellates. Understanding how these transitions unfold across seasonal and spatial gradients requires multi-year datasets that capture natural variability, including contributions from focused seasonal studies like the present one – especially during critical, yet logistically challenging, periods such as spring and early summer.
This study aims to clarify how protist communities (here and throughout referring specifically to nano- and microplankton) respond to seasonal, meltwater-driven gradients in freshening, turbidity, and light availability-factors expected to intensify under future climate scenarios. We investigated protistan plankton communities in Isfjorden during three key stages of the 2018 melt season: pre-freshet (May), spring freshet (June), and late summer runoff (August) – a year marked by anomalously warm temperatures and reduced sea ice extent (Osborne et al., 2018). Specifically, we examined:
-
The spatial and temporal variations in protistan community structure along a land-sea gradient from inner to outer fjord regions;
-
The relationships between protistan community patterns and environmental conditions, with a focus on potential responses to projected increases in freshwater runoff.
2 Materials and methods
2.1 Fieldwork
Sampling was conducted in May (10–11), June (18–24), and August (16–24) 2018 at 17 stations across Isfjorden, spanning a gradient from coastal waters to the outer fjord (Figure 1). Sampling was primarily conducted using a small boats, with additional collections carried out aboard R/V Helmer Hanssen and R/V Clione (for details, see McGovern et al., 2020). The study area included several side fjords of Isfjorden, each characterized by distinct freshwater regimes during the melt season. Adventfjorden, in the southwest, is primarily influenced by riverine discharge from Adventelva and Longyearelva, along with urban runoff. Billefjorden, in the northeast, is more enclosed (sill depth ~50 m) and receives seasonal meltwater from Nordenskiöldbreen and Ebbaelva, leading to persistent stratification and high turbidity. Tempelfjorden, in the southeast, is fed mainly by Tunabreen – a surging tidewater glacier that episodically releases large volumes of meltwater – and the land-terminating Von Postbreen, together with substantial input from the river Sassenelva. Smaller seasonal streams, including DeGeerelva and Gipsdalselva, provide additional freshwater locally, particularly during peak melt. These differences in freshwater input shape local gradients in salinity, turbidity, and light availability, and were considered in the spatial context of sampling and habitat classification. Due to ice cover in May (Figure 2), the number of accessible stations varied. Additional transect stations (B-Ice, T-Ice) were sampled along the land-fast ice edge in the fjord arms, while the innermost stations remained inaccessible.
Figure 1

Sampling stations in Isfjorden during the TerrACE 2018 campaign. The map was adapted from Vereide (2019) and Delpech et al. (2021). Sampling design for each month, reflecting logistical constraints, is detailed in Figure 2. Symbol colors correspond to marine habitats and riverine stations, as consistently used throughout the text. The dotted line indicates the ice edge on May 11, derived from the Norwegian Ice Service (https://cryo.met.no). The map was created using the PlotSvalbard package (version 0.8.11) in R (Vihtakari, 2019). The basemap originates from the Norwegian Polar Institute (2020, CC BY 4.0 license), and bathymetric data are from the Norwegian Mapping Authority (2020, CC BY 4.0 license).
Figure 2
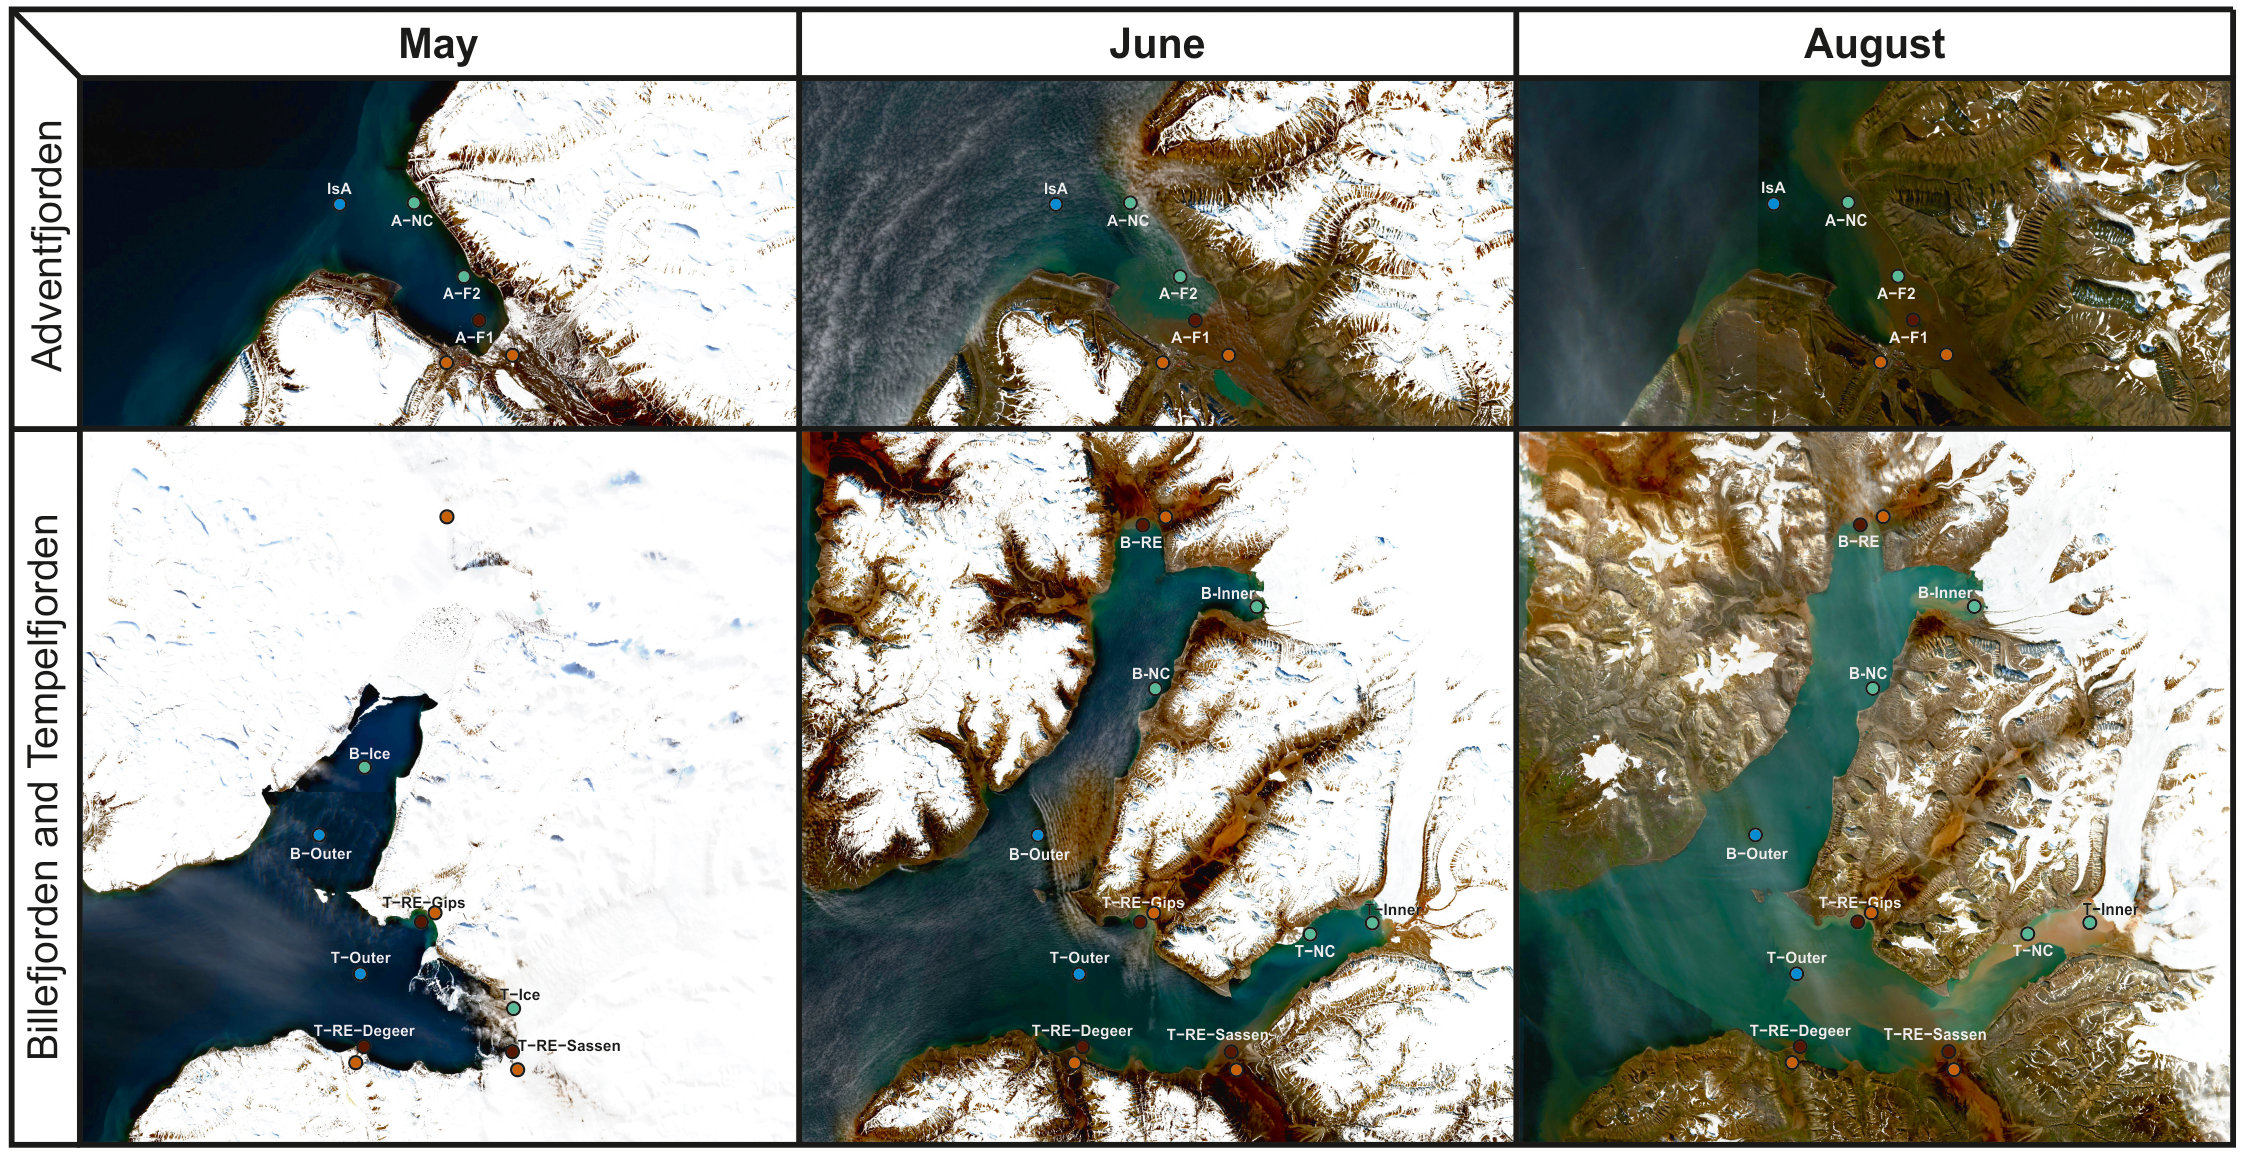
Satellite images of Adventfjorden, Billefjorden, and Tempelfjorden, derived from Sentinel Hub by Sinergise (https://dataspace.copernicus.eu/), showing the sampling locations, sea-ice coverage, and surface riverine and glacial runoff during each sampling period. Stations in the main basin (MB: IsG, IsK, ME-3), located outside the image frames, were visited in each month. Cloud-free images were selected as close as possible to the sampling dates, which are indicated in the captions as follows: satellite image from May 14 corresponding to the May 10–11 sampling; June 22 for the June 18–24 sampling; and August 6 for the August 16–24 sampling, except for Billefjorden in May, where the image corresponds to May 18 – the nearest date with minimal cloud cover over the fjord.
Water clarity was assessed using a Secchi disk (20–30 cm diameter), lowered on a marked line until it disappeared from view. The Secchi depth (SD [m]) was used as a proxy for euphotic zone depth, assuming the euphotic layer extends to approximately twice the Secchi depth (EZ ≈ 2 × SD; Preisendorfer, 1986).
Water samples were collected using a 10 L Niskin bottle (KC Denmark, Silkeborg) at just below the surface and at 15 m depth. These depths were selected based on prior observations from Isfjorden, indicating that peak plankton concentrations often occur within the upper 15 m (Szeligowska et al., 2020) and for logistical reasons, as real-time CTD profiling and detection of the chlorophyll a maximum were not feasible from the small boats. At stations shallower than 17 m, samples were taken from the surface and approximately 2 m above the seafloor. Immediately upon collection, temperature, salinity, and turbidity were measured using a multiparameter probe (HI 98195, Hanna Instruments) and a handheld turbidity meter (Thermo Scientific Eutech TN-100).
For protistan analysis, 200 mL subsamples were preserved in dark bottles with a mixture of acidic Lugol’s solution and glutaraldehyde (1–2% final concentration), following recommendations for the preservation of fixation-sensitive taxa, including soft-bodied flagellates (Rousseau et al., 1994). Approximately 15 L of water from each depth was transported to the laboratory for subsequent filtration and analysis of suspended particulate matter (SPM), particulate organic carbon (POC), chlorophyll a, and nutrient concentrations. All samples were stored at 4°C in the dark until processing.
2.2 Laboratory analyses
2.2.1 Water chemistry
Water chemistry parameters (SPM, POC, both expressed in g m-³; nutrients in mmol m-³) were analyzed following protocols previously described in McGovern et al. (2020). Briefly, SPM and POC were determined gravimetrically and via acid-fumigation of GF/F filters, respectively. Dissolved inorganic nitrogen (DIN: NO2- + NO3- + NH4+), phosphate (PO4³-), and silica (SiO2) were analyzed at NIVA (Oslo) using a Flow Solution IV Analyzer and accredited protocols (Kaste et al., 2018). Chlorophyll a concentrations were determined fluorometrically on a Turner 10-AU fluorometer after methanol extraction (Parsons, 2013).
2.2.2 Protist identification and enumeration
Qualitative and quantitative analyses of planktonic protists were performed at the Marine Ecology Department of the Institute of Oceanology, Polish Academy of Sciences (IO PAN), following established protocols (Utermöhl, 1958; Edler, 1979). Subsamples of 10–50 mL were transferred to sedimentation chambers and allowed to settle for 24 hours prior to examination. Protists were identified and enumerated using an inverted microscope (Nikon Eclipse TE-300) equipped with phase-contrast and interference optics. Due to high concentrations of suspended solids that hindered protist identification, eight samples from August and one from June, collected near river inlets and at the glacier front, were excluded from the analysis (details in Supplementary Table 1). Microplankton (>20 µm) were counted across the entire chamber surface at 100× magnification, while nanoplankton (3–20 µm) were enumerated at 400× magnification by scanning three transverse transects. For the most abundant taxa, counts were performed until at least 50 individuals were recorded, with the number of fields of view adjusted as necessary. Taxa were identified to the lowest possible taxonomic level and assigned to major taxonomic groups (class or phylum) according to the World Register of Marine Species (WoRMS; http://www.marinespecies.org). Cells were further classified by size into three categories: small nanoplankton (≤10 µm), large nanoplankton (10–20 µm), and microplankton (>20 µm). Indeterminate flagellates ≤13 µm were categorized as mono- or biflagellates and assigned to Eukaryota incertae sedis, following the nomenclature used in the European Arctic long-term monitoring program (IO PAN and UiT-The Arctic University of Norway). Additionally, two distinct unidentified taxa were recognized: “Indeterminate 1” and “Indeterminate 2”, corresponding to the IO PAN-UiT database entries Eukaryota incertae sedis (“ring”) and “cf. Raphidophyceae/Heterosigma”, respectively. These forms were distinguished by (1) unique morphological traits, (2) their notable contribution to the protist assemblages, and (3) potential for future taxonomic resolution. “Indeterminate 1” resembles a representative of the genus Telonema (class Telonemea), and its size places it near the upper limit of currently described members of this group. “Indeterminate 2” is most likely a member of Raphidophyceae, with at least some observed cells potentially belonging to Heterosigma, based on their numerous peripheral golden-brown discoid chloroplasts and a blackberry-like appearance – a response typical of this genus after fixation. Additional support for the possible link to Heterosigma comes from its bloom typically occurring in mid-summer in cold-temperate coastal waters, as well as from previous records in the Svalbard region. However, without molecular confirmation, both assignments remain tentative and based solely on morphological traits observed under light microscopy. Due to the limitations of Lugol’s fixative, including masking of chlorophyll fluorescence (Stoecker et al., 1994), trophic classification was not attempted.
2.3 Data analysis
2.3.1 Habitat classification
To minimize the influence of highly localized conditions and to better capture the dominant environmental gradients across Isfjorden, sampling stations were grouped into four habitat categories (Figure 1). These were defined as follows: river estuary (RE), located near river mouths; inner fjord (IF), situated in the innermost parts of the sub-fjords, either adjacent to glaciers or close to the shoreline; outer fjord (OF), positioned at the mouths of the sub-fjords and farther offshore than the inner stations; and the main basin (MB), representing the marine endpoints of the fjord system, with minimal terrestrial influence. This habitat classification was consistent with that used in the complementary zooplankton study by Vereide (2019), facilitating direct comparisons between the two datasets.
2.3.2 Water mass composition and freshening
Water masses were classified using Ocean Data View (version 5.6.2), following definitions previously identified for Isfjorden (Nilsen et al., 2008): surface waters (SW) = Sal < 34, T > 1 °C, intermediate waters (IW) = 34 < Sal < 34.7, T > 1 °C, Atlantic waters (AW) = Sal > 34.9, T > 3 °C), transformed Atlantic water (TAW) = Sal > 34.7, T > 1 °C, Arctic water (ArW) = 34.4 < Sal < 34.8, -1.5 > T < 1 °C, winter cooled water (WCW) = Sal > 34.74, T < -0.5 °C) and local water (LW) = T < 1 °C. Freshwater content (FWC) within the upper 10 m of the water column – representing freshwater influence in Isfjorden – was calculated from CTD profiles at all stations using the method described by Proshutinsky et al. (2009). A reference salinity of 34.7 was applied, corresponding to the boundary between surface and advected waters in Isfjorden (Nilsen et al., 2008). In addition, the salinity difference between the surface and 10 m depth (dS) was calculated as an index of water column stratification at the time of sampling.
2.3.3 Protist abundance and biomass
Subsamples were grouped by month and habitat to investigate temporal and spatial dynamics in protistan communities across the melt season and associated environmental gradients. This approach follows the methodology applied by Delpech et al. (2021) for bacterial and archaeal communities.
Analyses focused on overall protist abundance, with particular attention given to main groups – defined as those contributing at least 5% to total abundance – and to dominant taxa within those groups, as in the year-round Isfjorden study by Kubiszyn et al. (2017). In addition, total biomass (mg m-3) was estimated using taxon-specific average carbon content, based on size classes and taxonomic identity. Biomass conversion factors were derived from the HELCOM Phytoplankton Expert Group (Olenina, 2006) and IO PAN internal datasets. These values were also applied in the food-web modeling study based on the same field campaign (McGovern et al., in preparation). Due to methodological constraints, ciliates were excluded from biomass estimates. Accurate quantification of ciliate biomass requires specialized fixation and preparation (Quantitative Protargol Staining, QPS; Montagnes and Lynn, 1993) to avoid significant shrinkage and morphological distortion (Stoecker et al., 1994). Furthermore, the dark coloration of Lugol’s fixative complicates ciliate identification under optical microscopy. Although ciliates contributed less than 1% to total abundance, their exclusion likely results in a slight underestimation of total biomass. Accordingly, statistical analyses were performed exclusively on abundance data. Supplementary Table 1 contains total abundance and biomass data for protist classes recorded during this study.
2.3.4 Statistical analyses
Associations between environmental variables and protistan community metrics were evaluated using Spearman’s rank-order correlation, performed in R version 4.4.0 (R Core Team, 2024) with the vegan package version 2.5-6 (Oksanen et al., 2017). Correlation matrices were visualized using the corrplot package (Wei and Simko, 2017).
Additional statistical analyses were conducted in PRIMER 7 (PRIMER-E, Plymouth, UK) with the PERMANOVA+ add-on (Anderson, 2008). Except for diversity estimates, all statistical analyses were based on abundance data from the main protist groups.
Community richness, diversity, and evenness were estimated using Hill’s numbers: N0, N1, and N2 (Hill, 1973; Chao et al., 2014), based on protists identified at the species level to minimize bias from potential overestimation of taxa assigned to higher taxonomic ranks. Specifically, N0 represented species richness, treating rare and abundant taxa equally; N1 indicated diversity, with moderate emphasis on common taxa; and N2 emphasized dominant taxa, reflecting the number of equally abundant species. To assess community evenness, the ratio of N2/N1 was calculated, representing the proportion of very abundant species relative to common species (Birks et al., 2016). A ratio of 1 indicated complete evenness across taxa.
To test for differences in community composition among months and habitats, and their interaction, permutational analysis of variance (PERMANOVA) with Monte Carlo sampling was applied. Pairwise post hoc comparisons were conducted using Monte Carlo sampling as well. Community structure variability was further explored using principal coordinates analysis (PCO) based on log-transformed abundance data and Bray-Curtis dissimilarities.
To identify the environmental variables most strongly influencing protistan community structure throughout the melt season, distance-based linear models (DistLM) were constructed and visualized with distance-based redundancy analysis (dbRDA), both based on Bray-Curtis distances. Marginal tests were initially performed to evaluate the effect of each explanatory variable individually. Subsequently, a stepwise forward selection procedure, based on the adjusted R² criterion (Legendre and Anderson, 1999), was used to build the final model, accounting for the combined influence of multiple environmental drivers.
Seasonal associations of protist taxa were illustrated using a heatmap, showing the contributions of taxa (representing >0.01% of total abundance) to overall community composition (cells m-3). Community groupings were further examined using Similarity Profile (SIMPROF) tests and hierarchical clustering of taxa based on Bray-Curtis dissimilarity.
All boxplots were generated in OriginPro 2021 (version 9.8.0.200, OriginLab Corporation, Northampton, MA, USA) and finalized in CorelDRAW 2018 (Corel Corporation, Ottawa, ON, Canada).
3 Results
3.1 Environmental conditions
Broad hydrographic and biogeochemical patterns during the 2018 melt season have been described in detail by McGovern et al. (2020); here, we briefly summarize the main environmental features observed during the melt season period.
Sampling took place in May while land-fast ice still covered the inner parts of Isfjorden (Figure 2). Lower salinity at RE and IF stations was likely influenced by sea ice melt (Figure 3). River discharge, particularly from Adventelva, was already underway and significantly affected optical properties in Adventfjorden. Elevated turbidity was observed near river mouths and ice edges. POC and nutrient levels generally increased toward the MB area, except for NH4+, which peaked at RE stations. SPM varied across sites, with the highest values recorded at RE and OF. Hydrographic conditions indicated the presence of LW and ArW water masses (Figure 4).
Figure 3
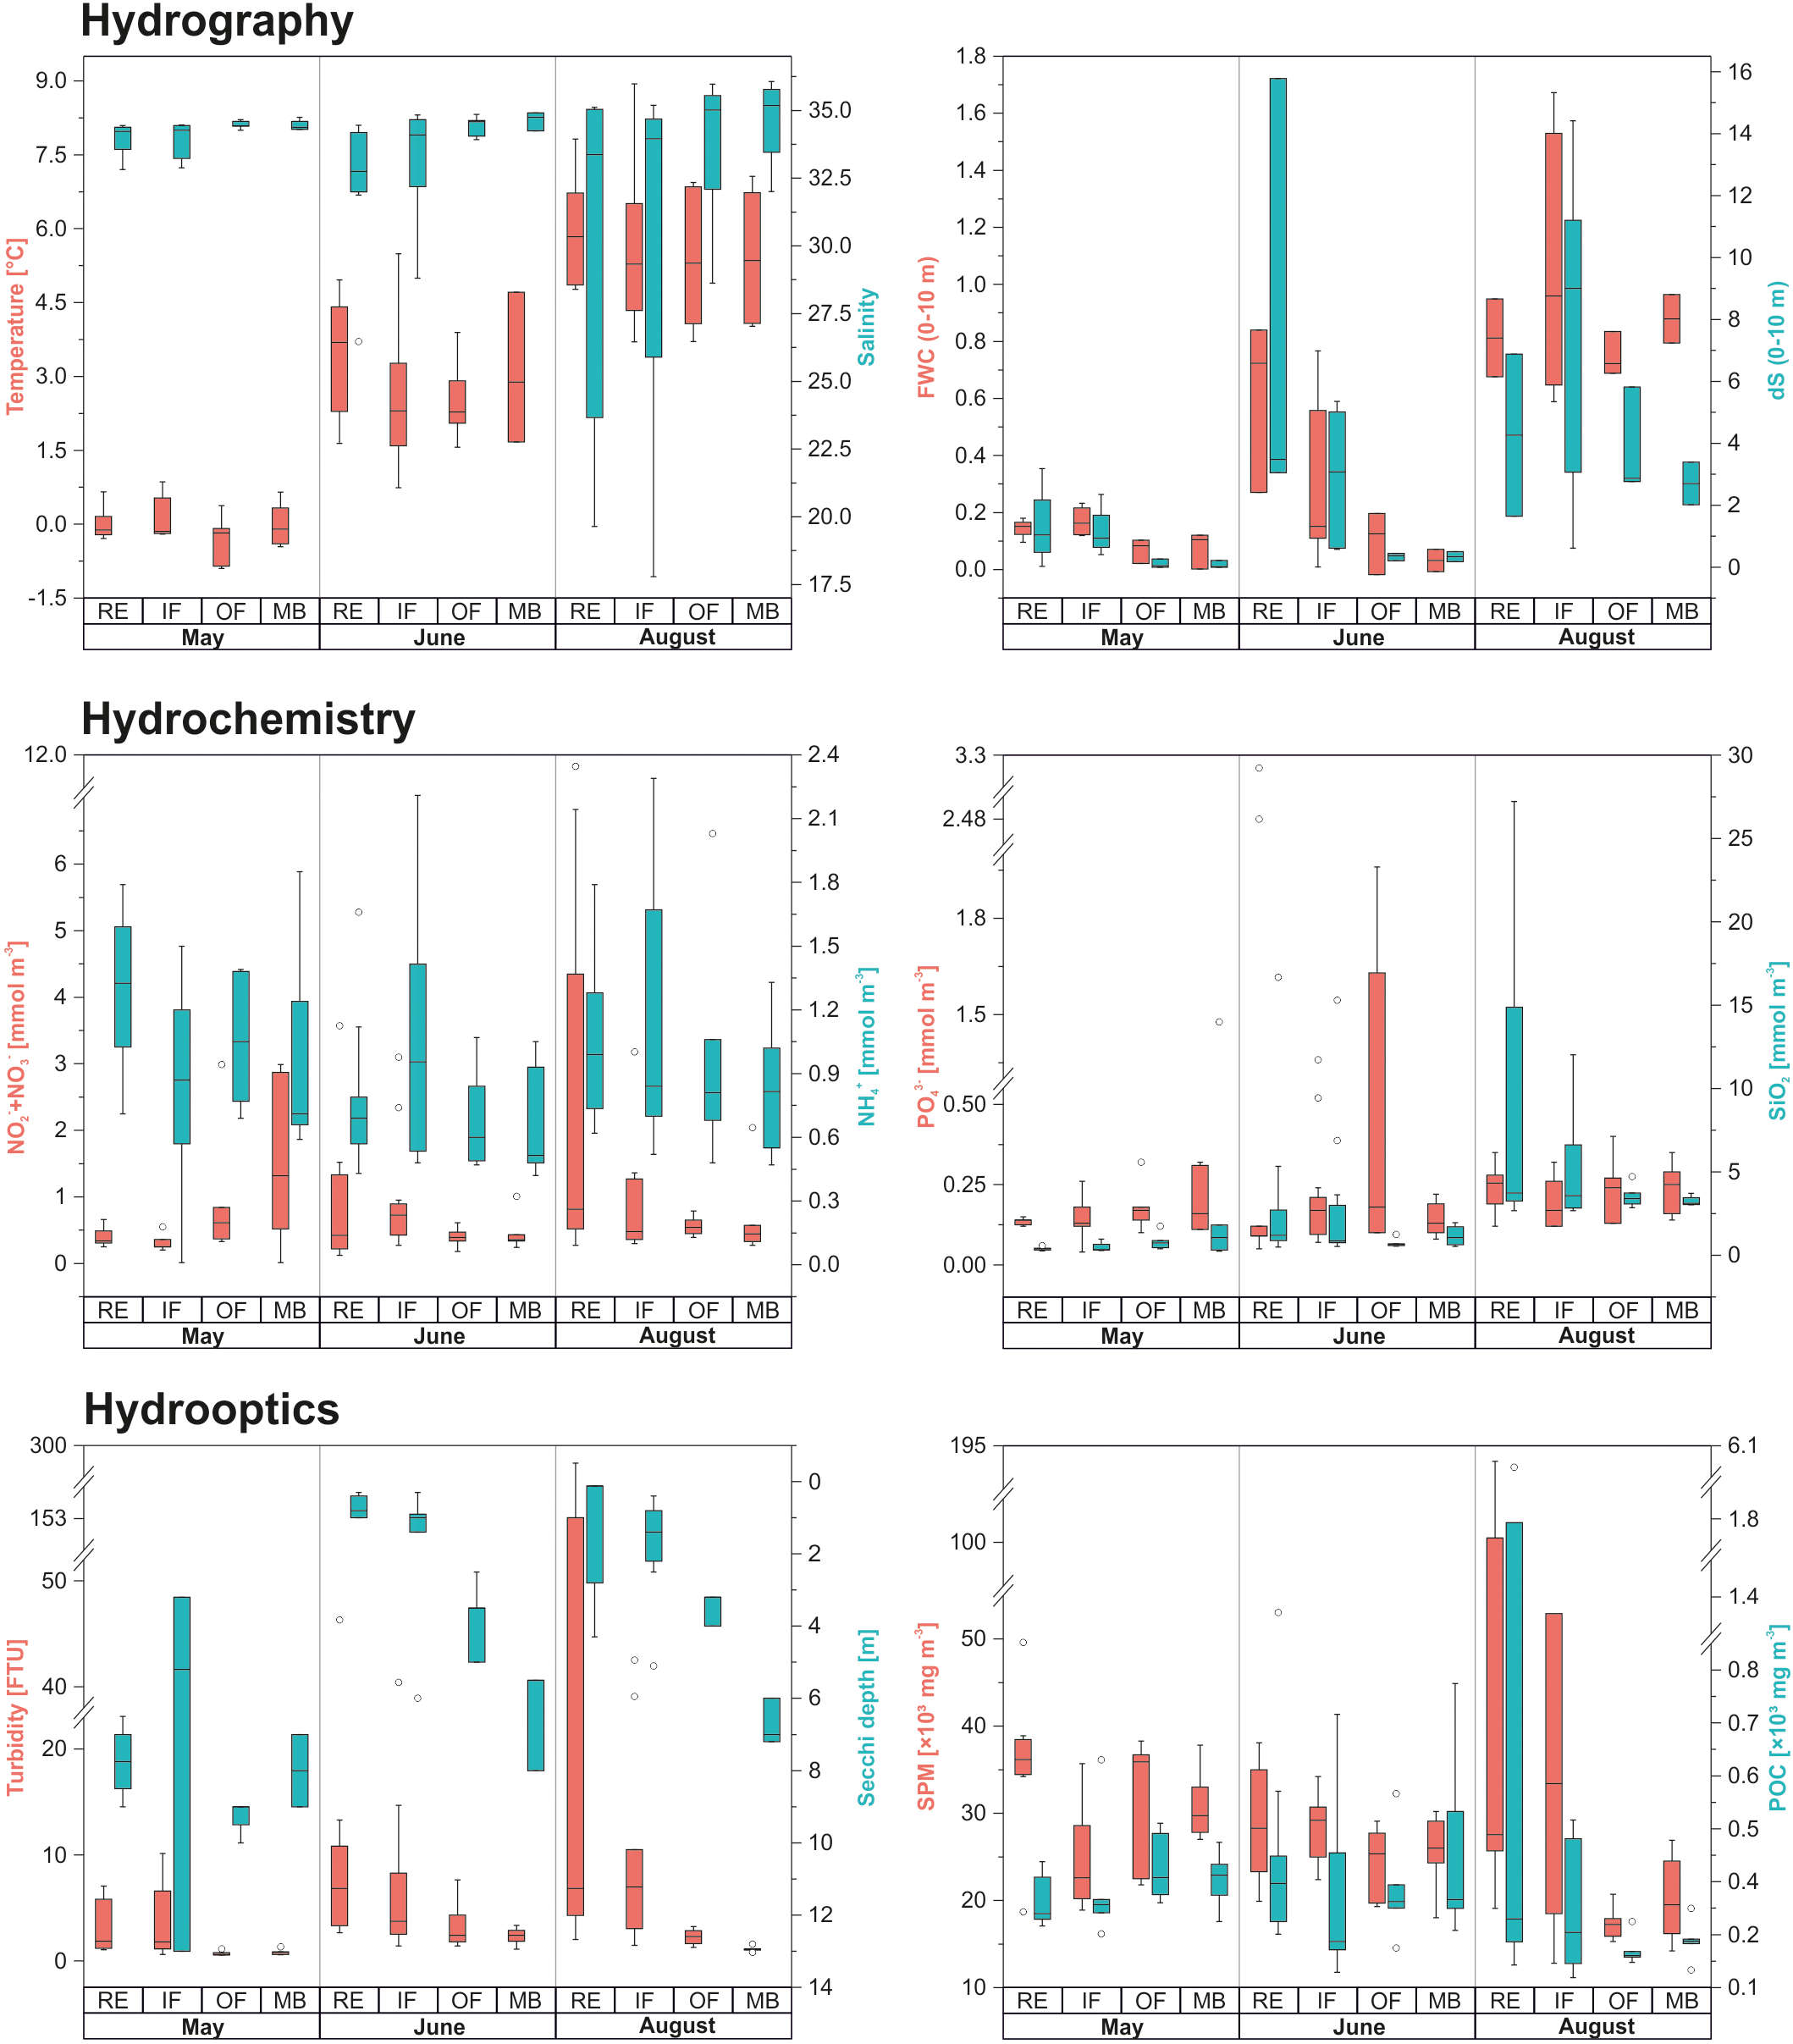
Environmental conditions observed during the study period. The Secchi depth scale [m] is inverted to reflect the vertical distribution of the euphotic zone, with lower values indicating shallower light penetration. In this and subsequent figures, boxplot center lines represent medians, box edges correspond to the 25th and 75th percentiles, whiskers indicate the 5th and 95th percentiles, and circles denote outliers.
Figure 4
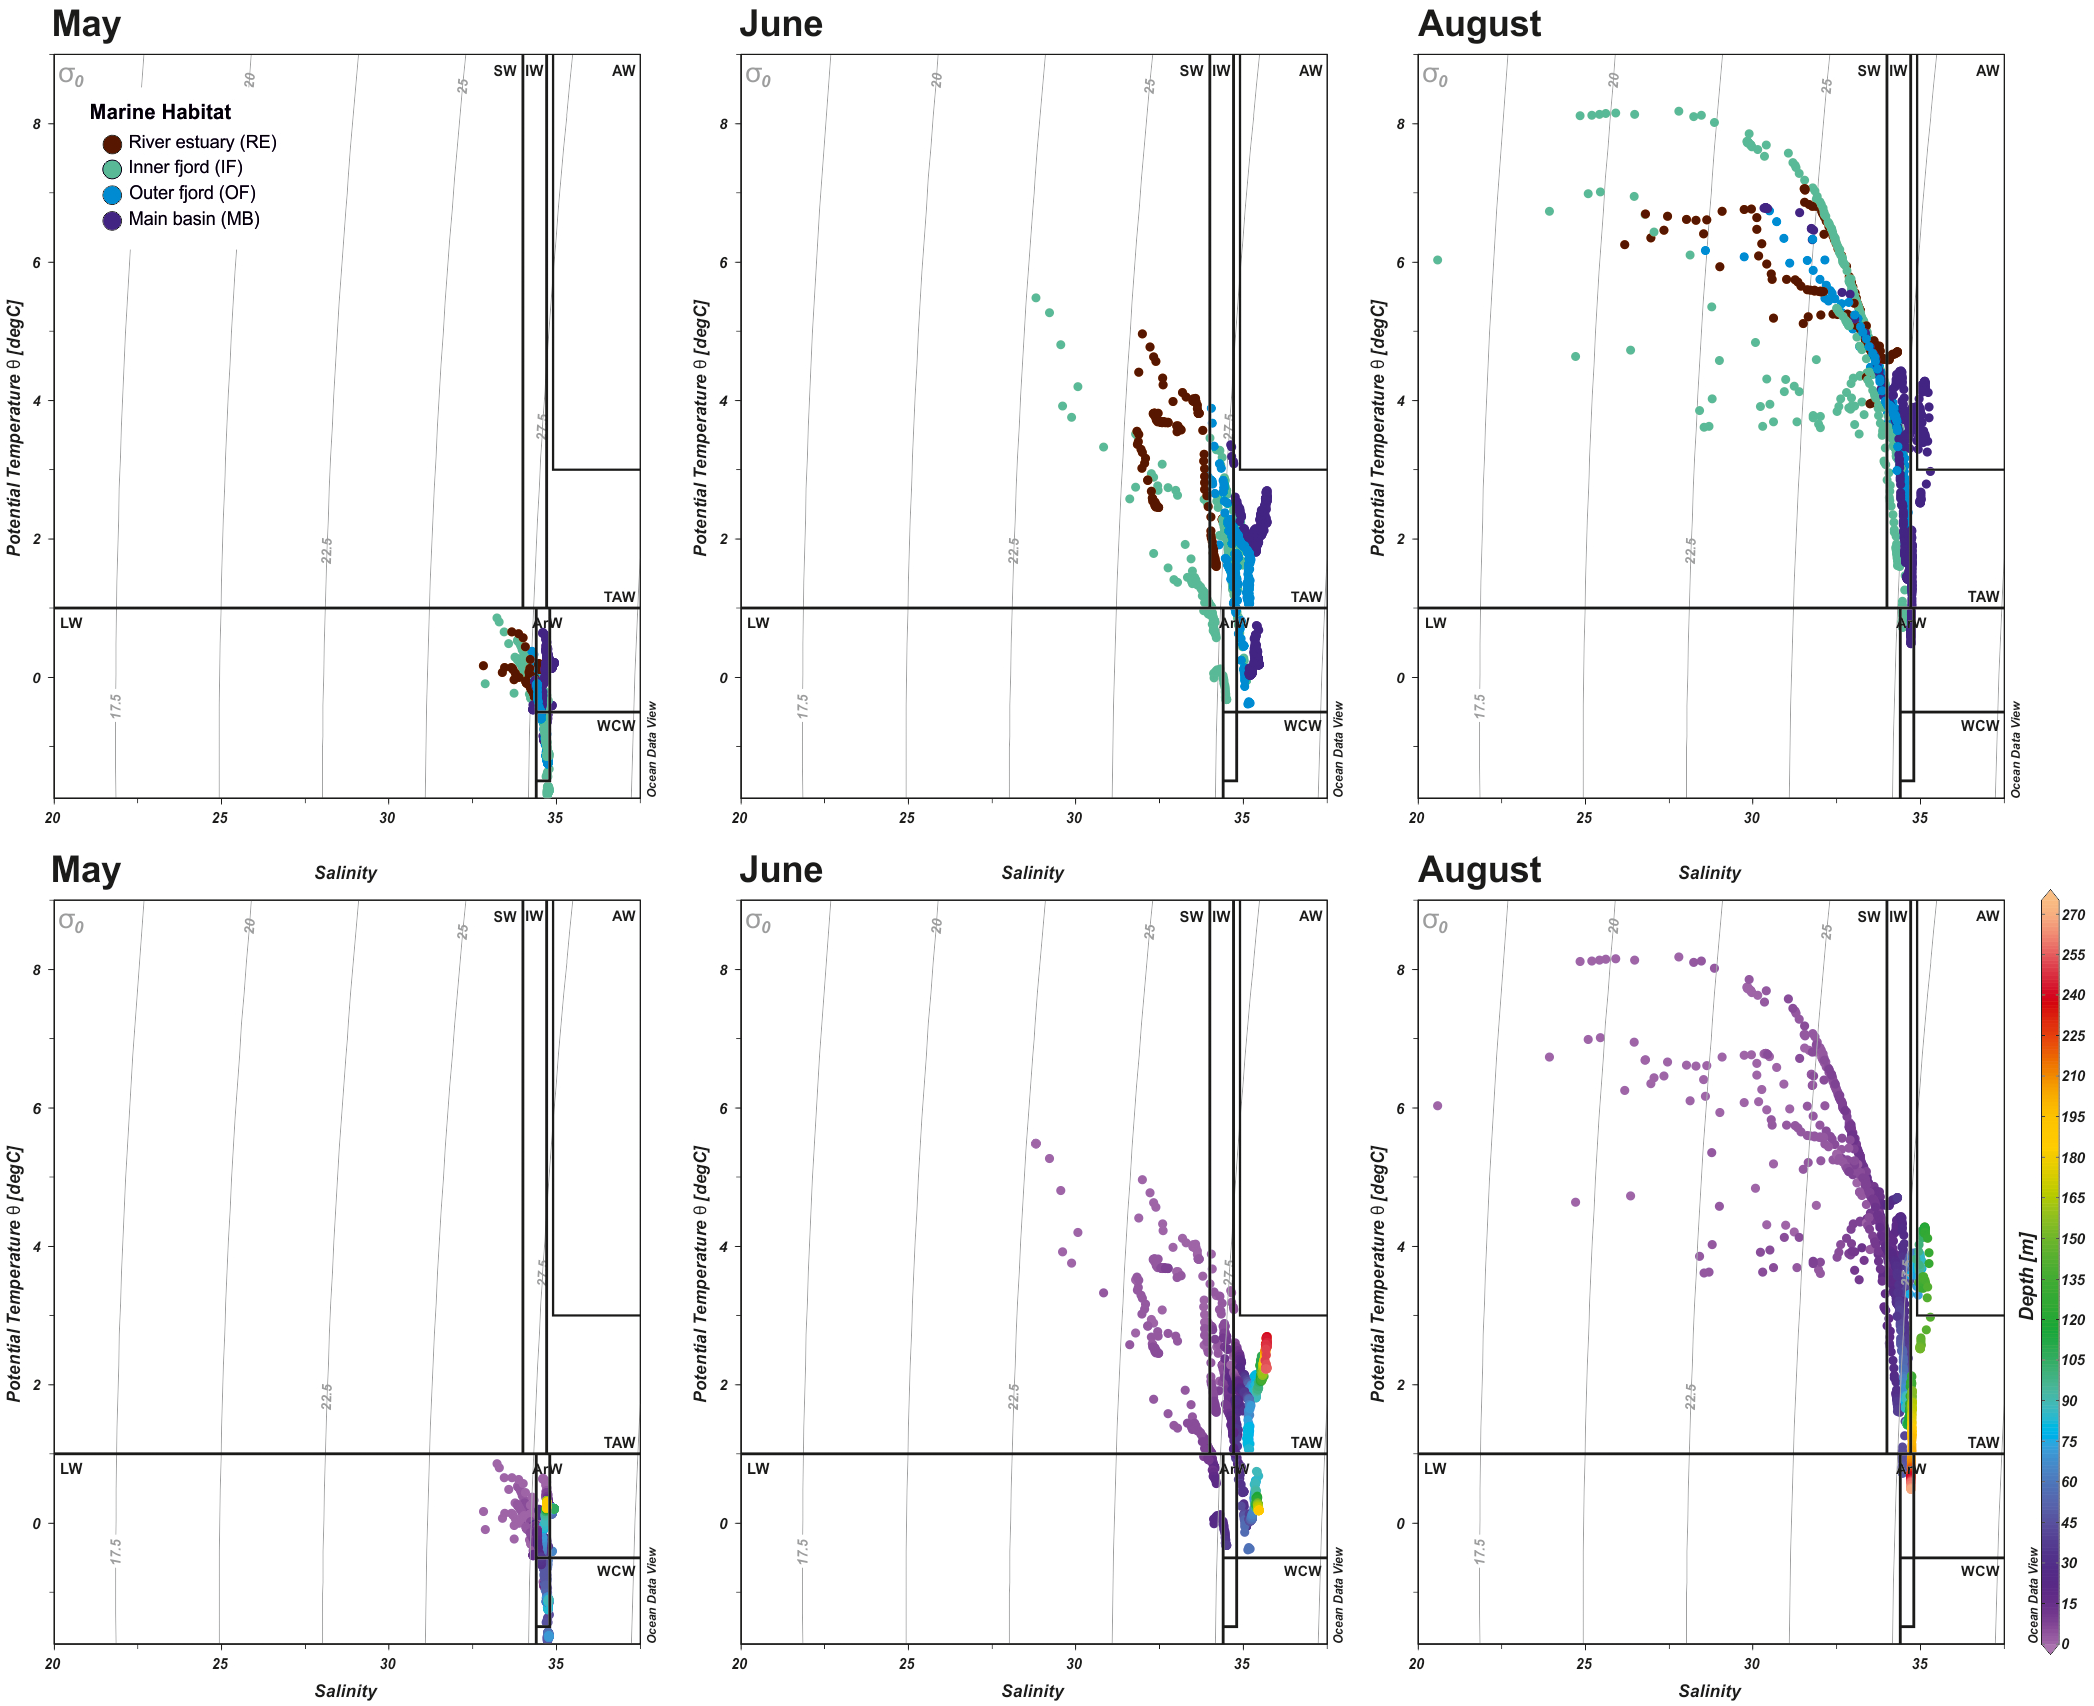
Temperature–salinity (TS) diagrams derived from monthly CTD profiles, presented by habitat (upper panels) and by depth (lower panels). Water masses were classified according to categories specific to Isfjorden, as defined by Nilsen et al. (2008).
As the melt season progressed into June, hydrographic conditions shifted markedly (Figure 3). The warmest and freshest surface waters, with salinity as low as 26.47, were observed in the RE area, reflecting intensified freshwater input during the spring freshet. This led to stronger stratification, as indicated by increased salinity gradients (dS) and FWC of the upper water column, particularly in RE and IF. IW separated SW from underlying TAW in deeper layers of OF and MB (Figure 4). Increased freshwater runoff also raised turbidity in RE and IF, which, as indicated by reduced SD, resulted in a shallower euphotic zone. Nutrient levels peaked where freshwater influence was strongest, although high PO43- concentrations were also noted in the OF area near Billefjorden, diverging from this overall pattern.
In August, a 2–3 °C rise in air and water temperatures intensified glacial melt and coastal runoff, delivering high loads of SPM and POC to nearshore areas (Figure 3). This formed turbid freshwater plumes that reduced water clarity, as indicated by lower SD, with their influence decreasing offshore. As a result, a clear salinity and turbidity gradient developed along Isfjorden – from fresh, DIN- and SiO2-rich inner waters in RE and IF to more saline, clearer conditions in OF and MB. At the same time, advected AW occupied the deeper layers of MB (Figure 4).
3.2 Protist communities
3.2.1 Taxonomic composition
A total of 107 taxa were identified at the species (s) level and 64 at the genus (g) level, spanning 18 classes. The identified taxa included: Bacillariophyceae (31 s, 22 g); Chlorophyceae (1 g); Choanoflagellatea (2 s); Chrysophyceae (2 s, 1 g); Ciliophora: Gymnostomatea (1 g), Hypotrichea (1 g), Litostomatea (1 s), Oligotrichea (16 s, 7 g), Prostomatea (1 s); Cryptophyceae (2 s, 2 g), Cryptophyta incertae sedis (1 s); Dictyochophyceae (3 s); Dinophyceae (40 s, 25 g); Euglenoidea (1 g); Imbricatea (1 s); Prasinophyceae (3 s, 2 g); Prymnesiophyceae (3 s, 1 g); Telonemea (1 s). Due to the absence of distinct morphological features, several individuals were identified only to higher taxonomic levels. These included: Bacillariophyceae (Pennales indet. 5-140 µm); Ciliophora indet. 20-160 µm and Oligohymenophorea indet.; Cryptophyceae indet.; Dinophyceae (Gymnodiniales 20-60 µm, Peridiniales 5-60 µm); Euglenoidea indet. Additionally, non-identified mono- and biflagellates (3–13 µm), classified as Eukaryota incertae sedis, were present in the samples. Two morphologically distinct yet taxonomically unresolved taxa were also recorded, categorized as “Indeterminate 1” and “Indeterminate 2.” These are illustrated in Figure 5.
Figure 5
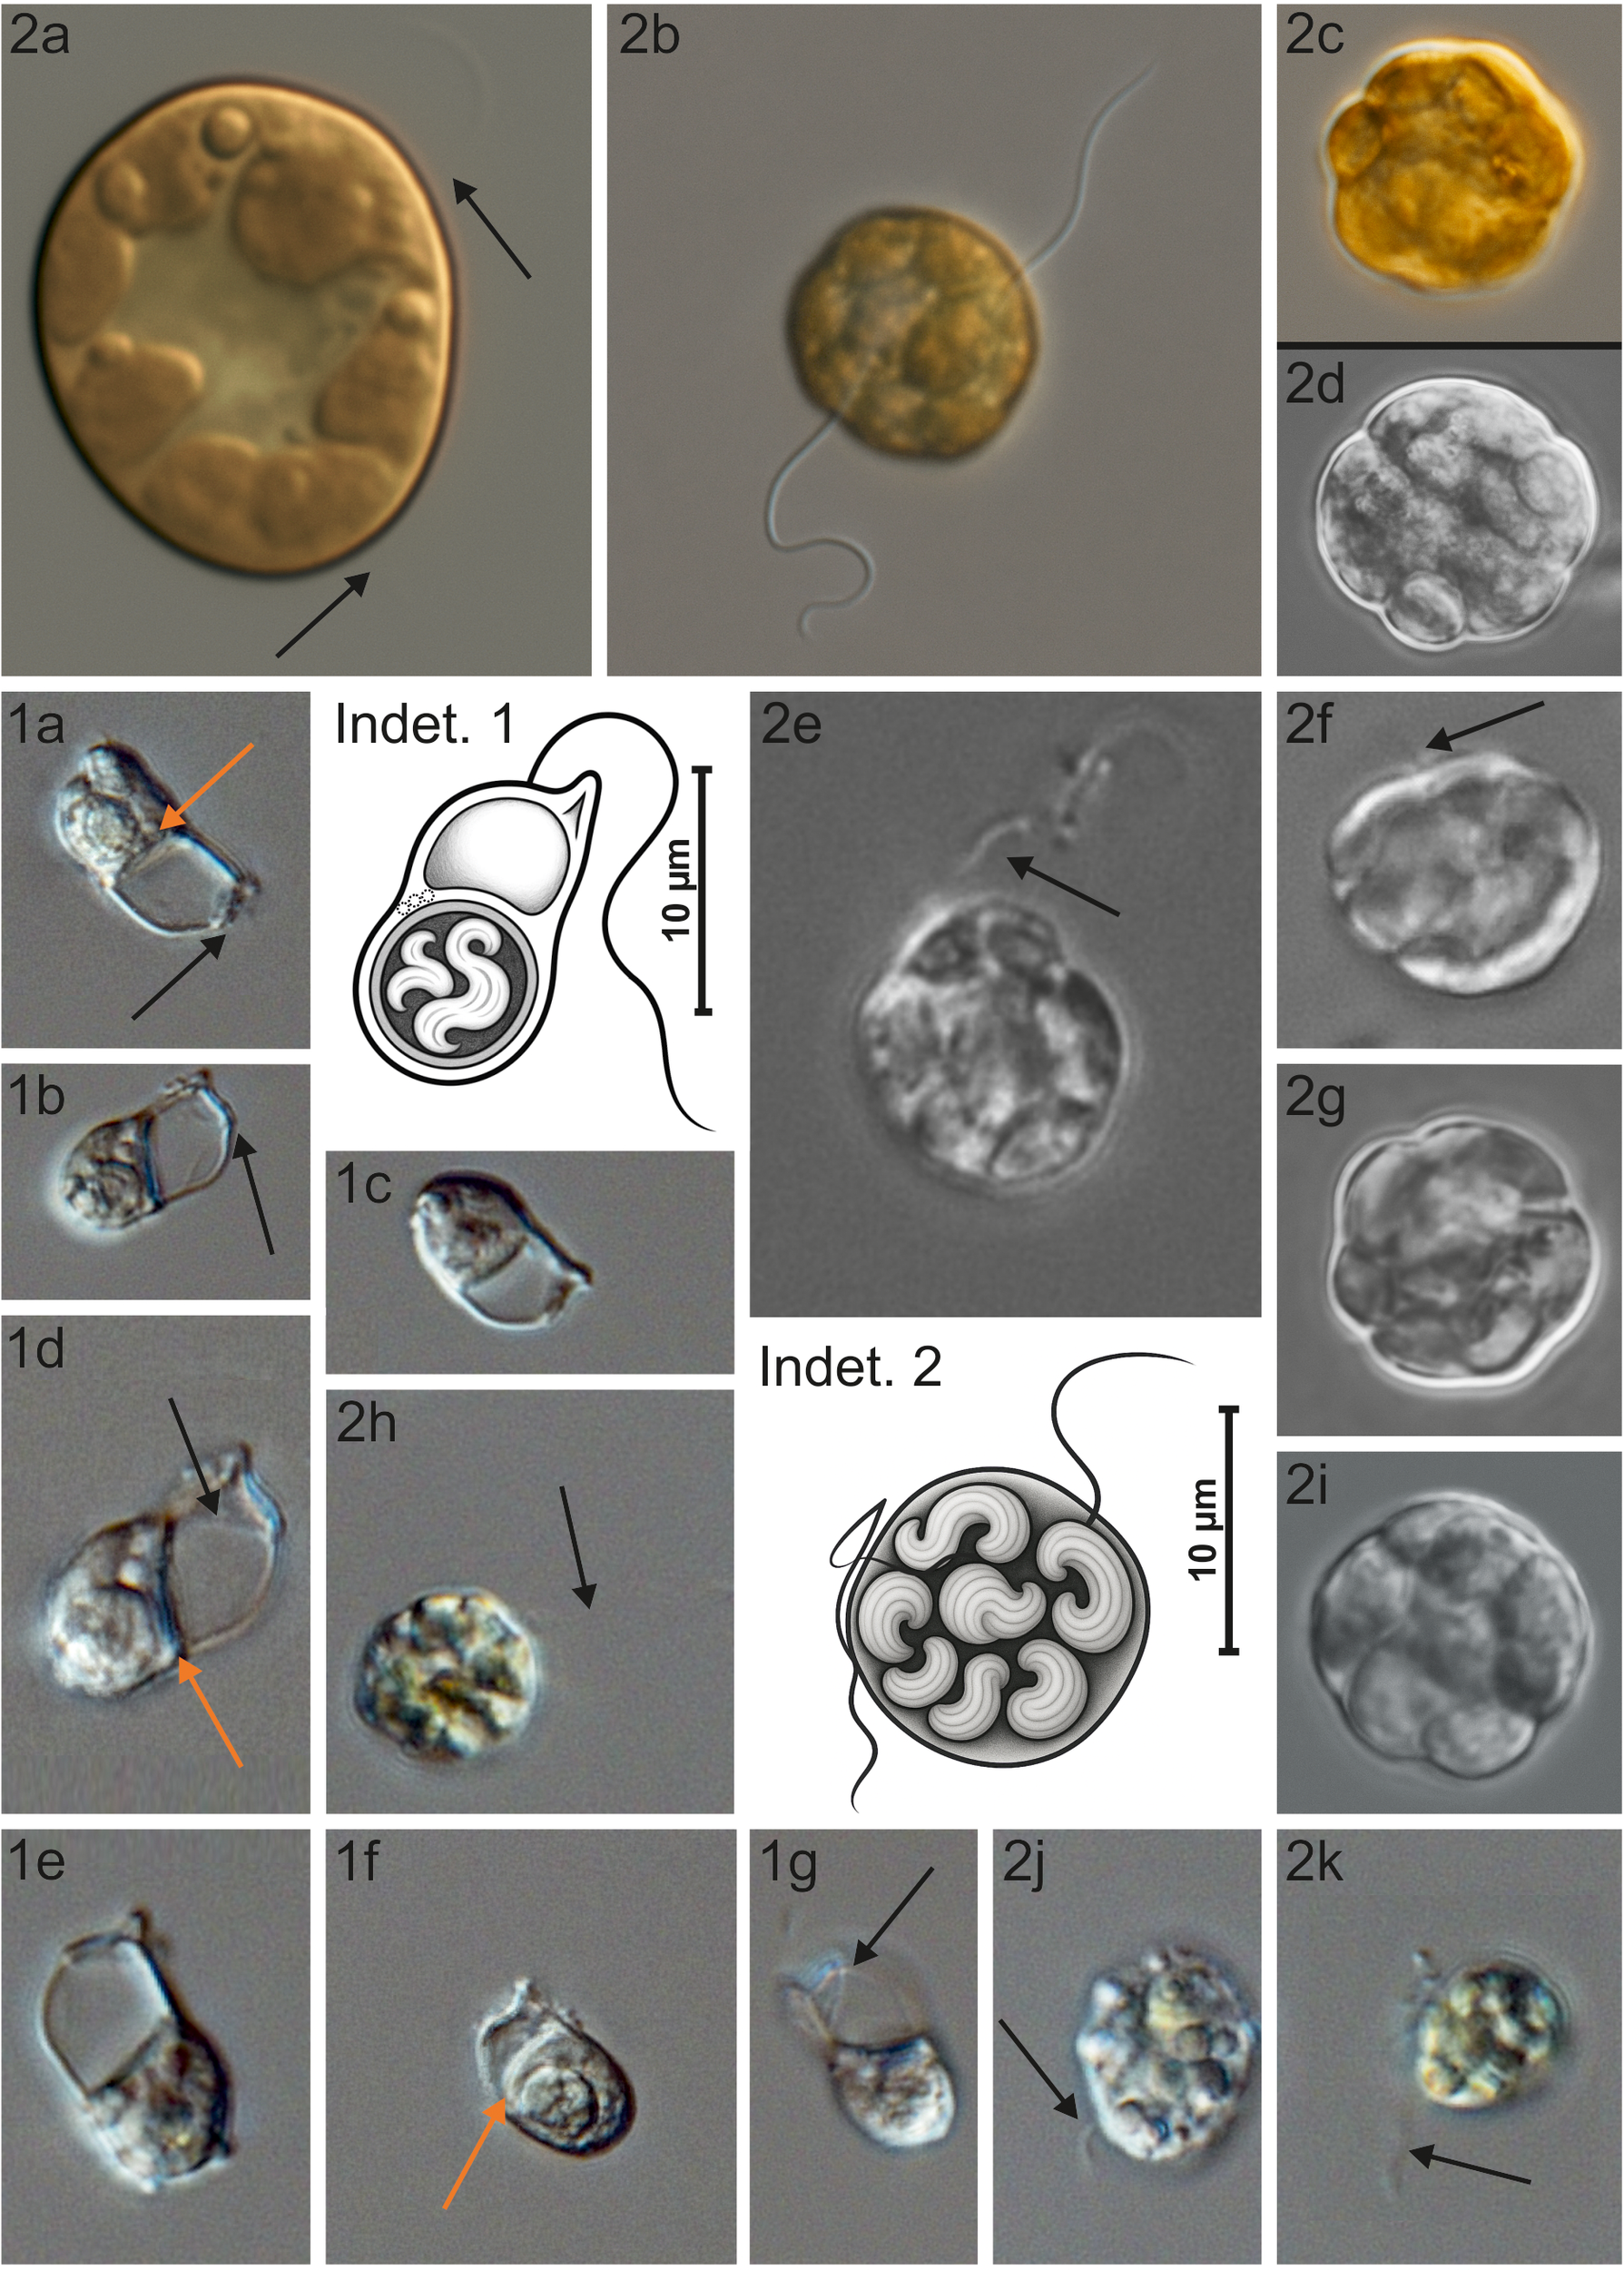
Illustrations of two unidentified protists commonly observed across the European Arctic: “Indeterminate 1” (1a–g) and “Indeterminate 2” (2a–k). Images were acquired using Z-stack imaging (Nikon) at 400× and 600× magnifications. Scale bars are shown only in schematic drawings. Black arrows indicate flagella, which are barely visible under light microscopy; their absence in some cells may result from subapical insertion or loss during fixation. Orange arrows mark structures resembling ejectosomes, known from some heterotrophic protists; they are also shown schematically in the drawing, though their number and arrangement may vary between cells. “Indeterminate 2” (a–i) was imaged in 2019; (j–k) in 2025 during follow-up analyses. Differences between the image sets suggest that “Indeterminate 2” is prone to morphological alteration during long-term storage, a pattern not observed in “Indeterminate 1”.
Alpha diversity exhibited clear seasonal and spatial variability (Supplementary Figure 1). Species richness (N0) peaked in May, particularly at the outer stations (MB, OF), while nearshore river-influenced sites (RE) consistently displayed the lowest N0 values across all months, with a general increasing trend toward the main basin. Diversity indices N1 (expected number of equally common taxa) and N2 (expected number of equally abundant taxa) showed broadly similar patterns, both reaching notably higher values in June when comparing habitats across months. Across all months, N1 and N2 values generally increased along the gradient from the innermost fjord regions toward the open waters. An exception to this trend was observed in the IF stations during May and June, where both the median and variability of the diversity indices were substantially higher than in adjacent habitats. In May, the N2/N1 ratio – an indicator of community evenness – suggested greater equitability in less terrestrially influenced locations (MB, OF). By contrast, in June and August, the N2/N1 ratio revealed the highest evenness in nearshore habitats, particularly within the inner fjords (IF), with increasing dominance (lower evenness) observed toward the outer fjord areas (OF, MB).
3.2.2 Quantitative composition
Protistan abundance and size structure exhibited substantial spatial and temporal variability throughout the study period (Figure 6). Seasonal patterns in total abundance closely mirrored biomass trends, which, in turn, corresponded well with variations in chlorophyll a concentrations – a proxy for primary producer biomass. Notably, these patterns differed markedly between the inner fjord areas (RE, IF) and the outer regions (OF, MB).
Figure 6
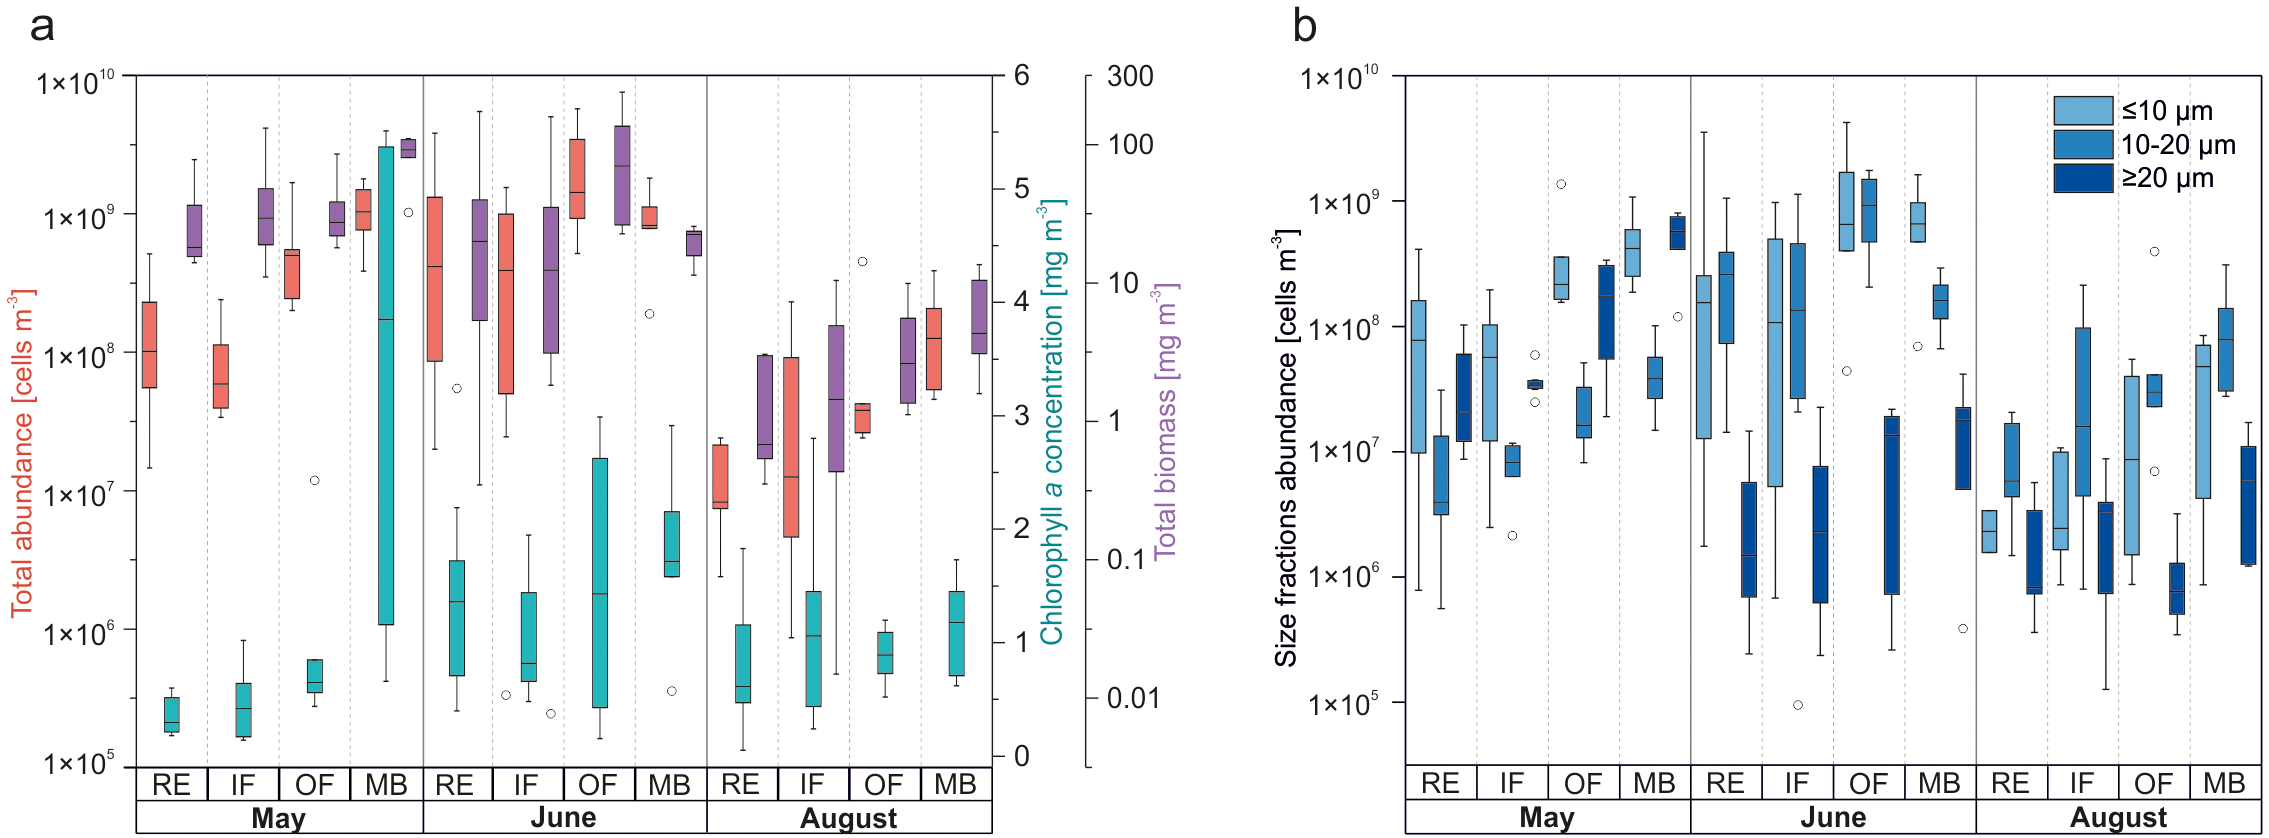
(a) Comparison of total protist community abundance (cells m-3), total chlorophyll a concentration (mg m-3), and total biomass excluding ciliates (mg m-3); (b) Protist abundance (cells m-3) by size fraction: small nanoplankton (≤10 µm), large nanoplankton (10–20 µm), and microplankton (≥20 µm), presented by habitat and month. To improve resolution given the wide range of abundance and biomass values, data were logarithmically transformed (n = log10(data)), with y-axis values inversely transformed (10n). The same transformation approach was applied in Figure 7.
A limited number of protist groups, hereafter referred to as the main groups, accounted for the majority of the community composition, each contributing at least 5% to the total abundance (Figure 7). These dominant groups included Bacillariophyceae, Cryptophyceae, Dinophyceae, Eukaryota incertae sedis (non-identified mono- and biflagellates, predominantly 3–7 µm in size), “Indeterminate 1”, “Indeterminate 2”, and Prymnesiophyceae. Collectively, these groups represented over 97% of total protist abundance.
Figure 7
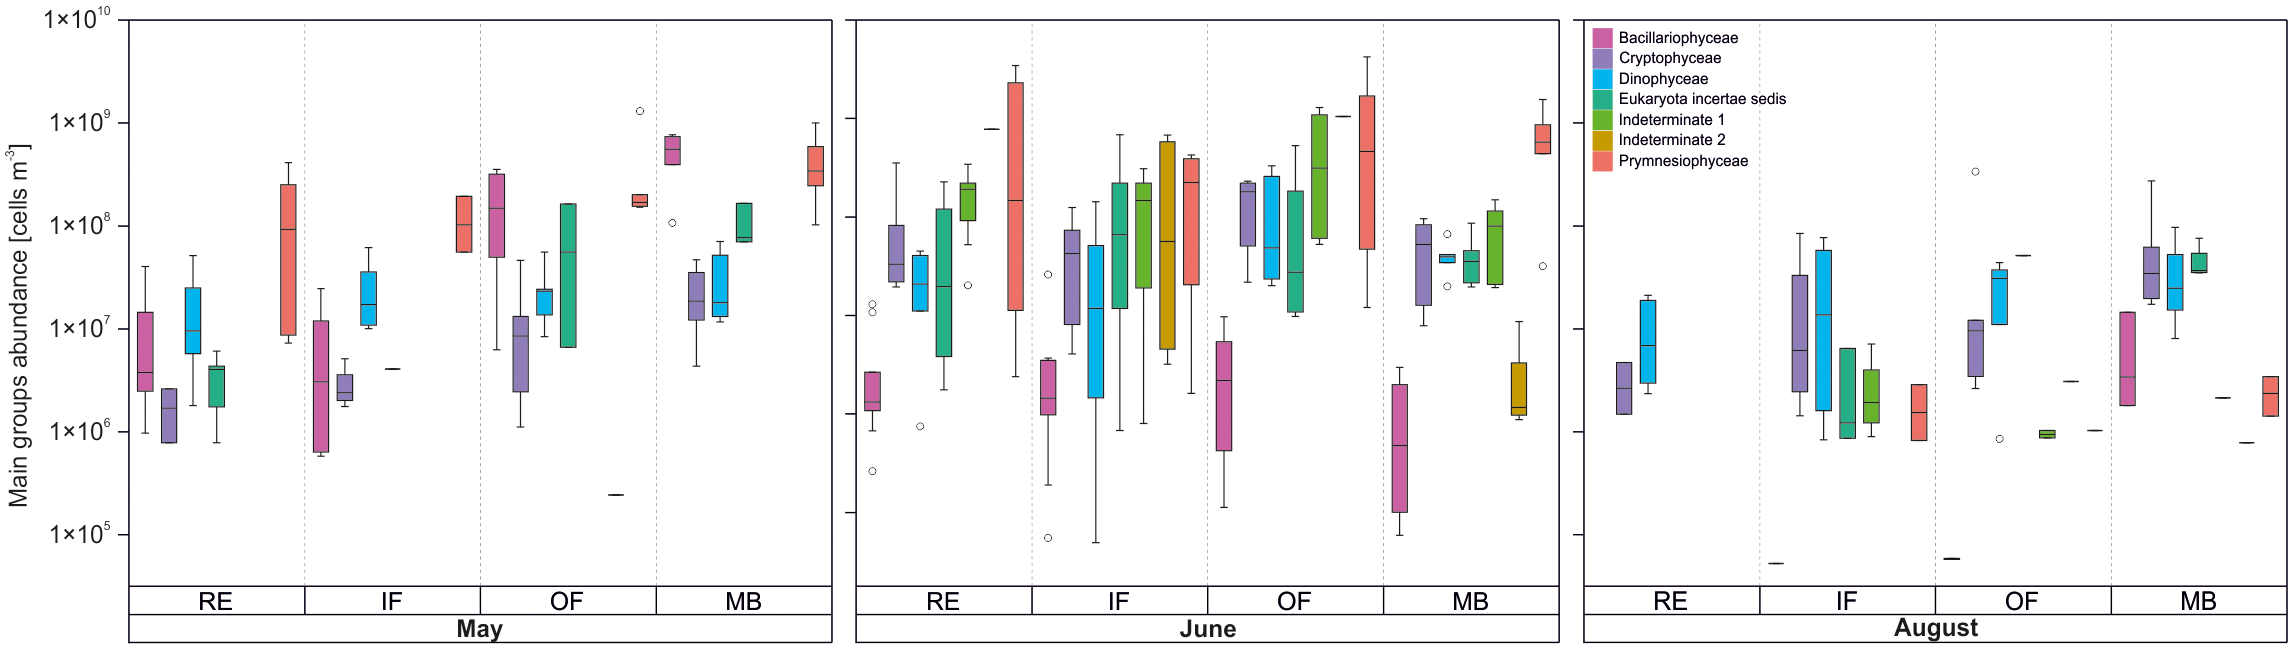
Abundance of main protist groups (≥5% of total abundance) in each month–habitat category. The remaining groups contributed a combined 2.77%.
Subsequent analyses based on these main groups revealed significant temporal and spatial variation in community composition. PERMANOVA confirmed significant differences between months (Pseudo-F = 24.975, p(perm) = 0.001), as well as significant interactions between month and habitat (Pseudo-F = 2.3994, p(perm) = 0.007), indicating considerable intra-seasonal and spatial heterogeneity in protistan communities.
In May, overall protist abundance was high, typical of the spring bloom period (Figure 6a), with a maximum of 17.84 × 10⁸ cells m-3 recorded in surface waters at station IsG. This peak was primarily driven by massive colonies of the prymnesiophyte Phaeocystis pouchetii (≤10 µm), likely in its vegetative (mixotrophic) stage, which accounted for approximately 51% of total abundance across the study area (Figures 7, 8). Microplanktonic Bacillariophyceae, mainly Chaetoceros furcillatus and Thalassiosira nordenskioeldii, contributed around 36%, while mono- and biflagellates (approximately 4.7% of total abundance), potentially including flagellated forms of P. pouchetii, dominated in outer waters (OF, MB).
Figure 8
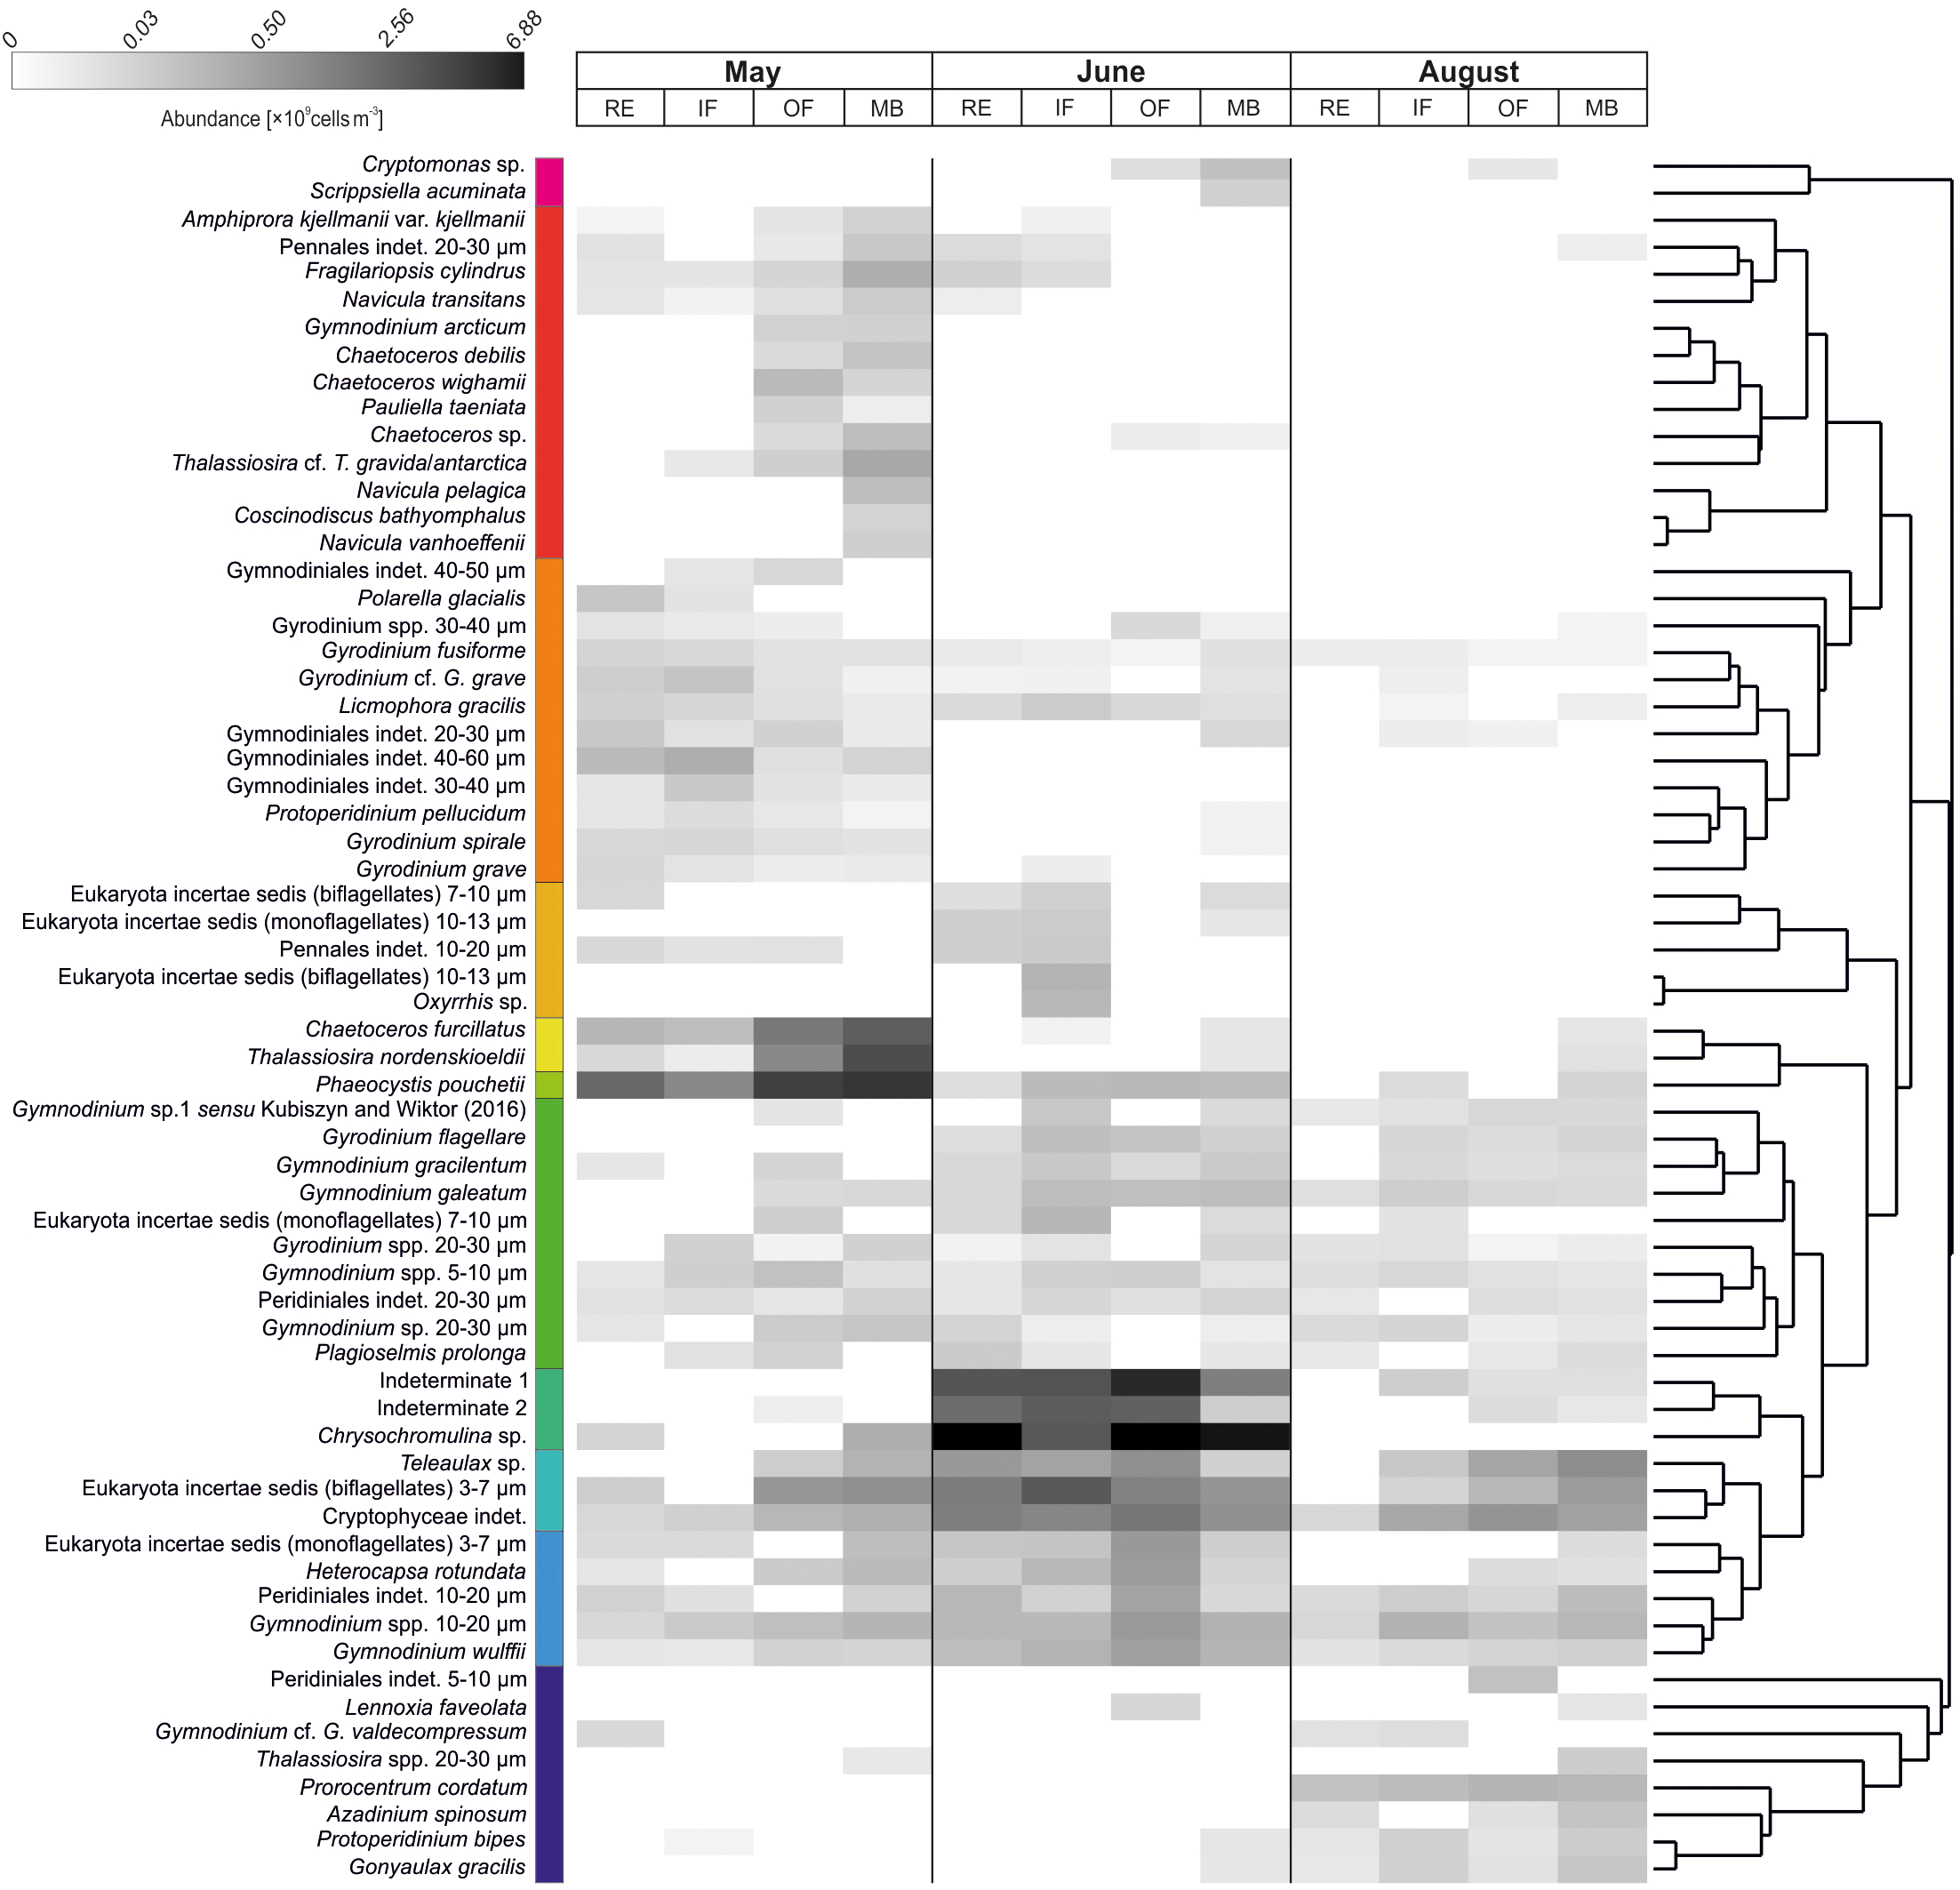
Heatmap of the main protist groups, showing key contributors with relative abundances ≥0.01% across all samples. Community groupings were identified using Similarity Profile (SIMPROF) analysis and hierarchical clustering (nearest neighbor method) based on Bray-Curtis dissimilarities among taxa. To preserve the spatial gradient from inner Isfjorden habitats to the marine endpoint, samples (habitats) were displayed without clustering.
Spatially, the community structure exhibited a clear dichotomy: higher abundances were observed in the outer fjord (MB: 53.2%, OF: 30.2%), while inner habitats (RE: 10.8%, IF: 5.8%) supported lower proportions of total abundance, a pattern also reflected in community composition differences (Table 1). In inner habitats, flagellates – particularly nano- and microplanktonic dinoflagellates of the order Gymnodiniales (Gymnodinium and Gyrodinium) – were the dominant contributors.
Table 1
| Habitats | May | June | August | ||||||
|---|---|---|---|---|---|---|---|---|---|
| t | p (perm) | p (MC) | t | p (perm) | p (MC) | t | p (perm) | p (MC) | |
| RE, IF | 1.8134 | 0.049 | 0.058 | 0.74649 | 0.508 | 0.502 | 1.8685 | 0.015 | 0.037 |
| RE, FO | 1.6364 | 0.09 | 0.128 | 1.5868 | 0.064 | 0.131 | 1.9017 | 0.075 | 0.063 |
| RE, MB | 2.399 | 0.006 | 0.013 | 1.7419 | 0.058 | 0.098 | 3.9074 | 0.003 | 0.001 |
| IF, OF | 2.0077 | 0.025 | 0.044 | 1.1625 | 0.289 | 0.244 | 0.85918 | 0.565 | 0.482 |
| IF, MB | 2.3468 | 0.013 | 0.017 | 1.1214 | 0.315 | 0.296 | 1.0944 | 0.371 | 0.337 |
| OF, MB | 0.67303 | 0.677 | 0.619 | 1.493 | 0.149 | 0.148 | 1.4666 | 0.125 | 0.132 |
Results of PERMANOVA pairwise tests with corresponding Monte Carlo tests, assessing the effects of habitat and month on log-transformed protistan community composition in Isfjorden.
Statistically significant results based on Monte Carlo tests (p(MC)) are indicated in bold.
Biomass distribution diverged from abundance patterns. The highest biomass was recorded in MB, with a median of 91.66 mg C m-3, compared to lower values across other habitats (median 24.44 mg C m-3). This was accompanied by elevated chlorophyll a concentrations in MB (median 3.85 mg m-3) relative to other areas (0.30–0.65 mg m-3). Dinophyceae accounted for the largest share of total biomass (49.9%, mainly in IF and RE), followed by Bacillariophyceae (30.8%, primarily in MB), and Prymnesiophyceae (18.0%, mostly in MB and OF).
By June, the community had shifted toward a dominance of nanoplanktonic flagellates spanning the full class size range (3–20 µm; Figure 6b). Numerically, the community was dominated by Chrysochromulina (Prymnesiophyceae), along with two unidentified taxa (“Indeterminate 1” and “Indeterminate 2”; Figures 7, 8). Chrysochromulina and “Indeterminate 1” were widespread, with Chrysochromulina peak abundances at stations B-Outer (OF: 59.07 × 10⁸ cells m-3) and B-RE (RE: 57.61 × 10⁸ cells m-3), and with “Indeterminate 1” peak abundance at B-Outer (23.81 × 10⁸ cells m-3).
In contrast, “Indeterminate 2” was limited to the stations in Adventfjorden, with the highest abundance in RE (station A-F1, 7.79 × 10⁸ cells m-3), slightly lower densities in IF at 15 m depth (4.94–6.79 × 10⁸ cells m-3), and a secondary peak in OF (IsA: 10.49 × 10⁸ cells m-3). Overall, community abundance in June was exceptionally high for the post-spring-bloom period and showed minimal spatial differences (Table 1). Compared to May, total protist abundance increased markedly across most habitats. Respective totals (× 108 cells m-3) for May and June were: RE (13.21; 98.58), IF (7.07; 65.22), OF (36.80; 135.93), and MB (64.99; 55.57). Biomass during this transitional period also remained high, surpassing spring values in the OF area (median June: 80.91 mg C m-3vs. May: 27.51 mg C m-3). Biomass variability increased, particularly in inner habitats (RE, IF). Besides the dominant flagellates, unidentified biflagellates, Cryptophyceae, and Gymnodiniales (Dinophyceae) contributed substantially to the communities across Isfjorden.
By August, protistan communities were substantially depleted in both abundance and biomass, representing a taxonomic legacy of the early-summer assemblage (Figure 6a). The community, dominated by large nanoplankton (10–20 µm; Figure 6b), varied significantly along the side fjords (RE vs. IF) and between extreme habitats (RE vs. MB; Table 1). The lowest protist abundances were recorded in the RE area, increasing gradually along the fjord axis toward the MB region. Station IsG, located at the outermost part of Isfjorden, recorded the highest protist abundance (5.89 × 10⁸ cells m-3) and biomass (26.48 mg C m-3).
In addition to previously observed flagellates (Cryptophyceae and naked dinoflagellates), the community included thecate Dinophyceae, such as autotrophic Prorocentrum cordatum, Azadinium spinosum, Gonyaulax gracilis, and the heterotrophic Protoperidinium bipes (Figure 8). Bacillariophyceae were largely restricted to the MB area and occurred at low abundances (maximum 0.18 × 10⁸ cells m-3 at IsG). The assemblage was composed primarily of Thalassiosira spp. (20–30 µm), Lennoxia faveolata, Chaetoceros furcillatus, Thalassiosira nordenskioeldii, Licmophora gracilis, and unidentified pennate diatoms (20–30 µm).
3.3 Environmental drivers
Spearman rank correlation analysis indicated that water column stratification (dS) was significantly negatively correlated with the majority of the main protist groups, including Bacillariophyceae, “Indeterminate 1”, Prymnesiophyceae, Dinophyceae, and Eukaryota incertae sedis (mono- or biflagellates) (Supplementary Figure 2). Additionally, Bacillariophyceae showed negative correlations with both temperature and turbidity, while Dinophyceae were negatively correlated with turbidity alone. “Indeterminate 1” displayed a significant negative correlation with NH4+ concentrations and a weaker inverse relationship with NO2- + NO3-. In contrast, positive correlations were observed between “Indeterminate 2” and SPM, as well as between Cryptophyceae and chlorophyll a.
Both PCO and dbRDA analyses indicated pronounced temporal variability in protist community composition, reflecting seasonal shifts in community structure (Figure 9). The first two axes of the dbRDA ordination explained 93.4% of the fitted variation and 33.7% of the total variation. Marginal tests within the DistLM framework identified temperature, stratification (dS, 0–10 m), NO2- + NO3-, SPM, and POC as significant environmental drivers of community structure (Table 2).
Figure 9
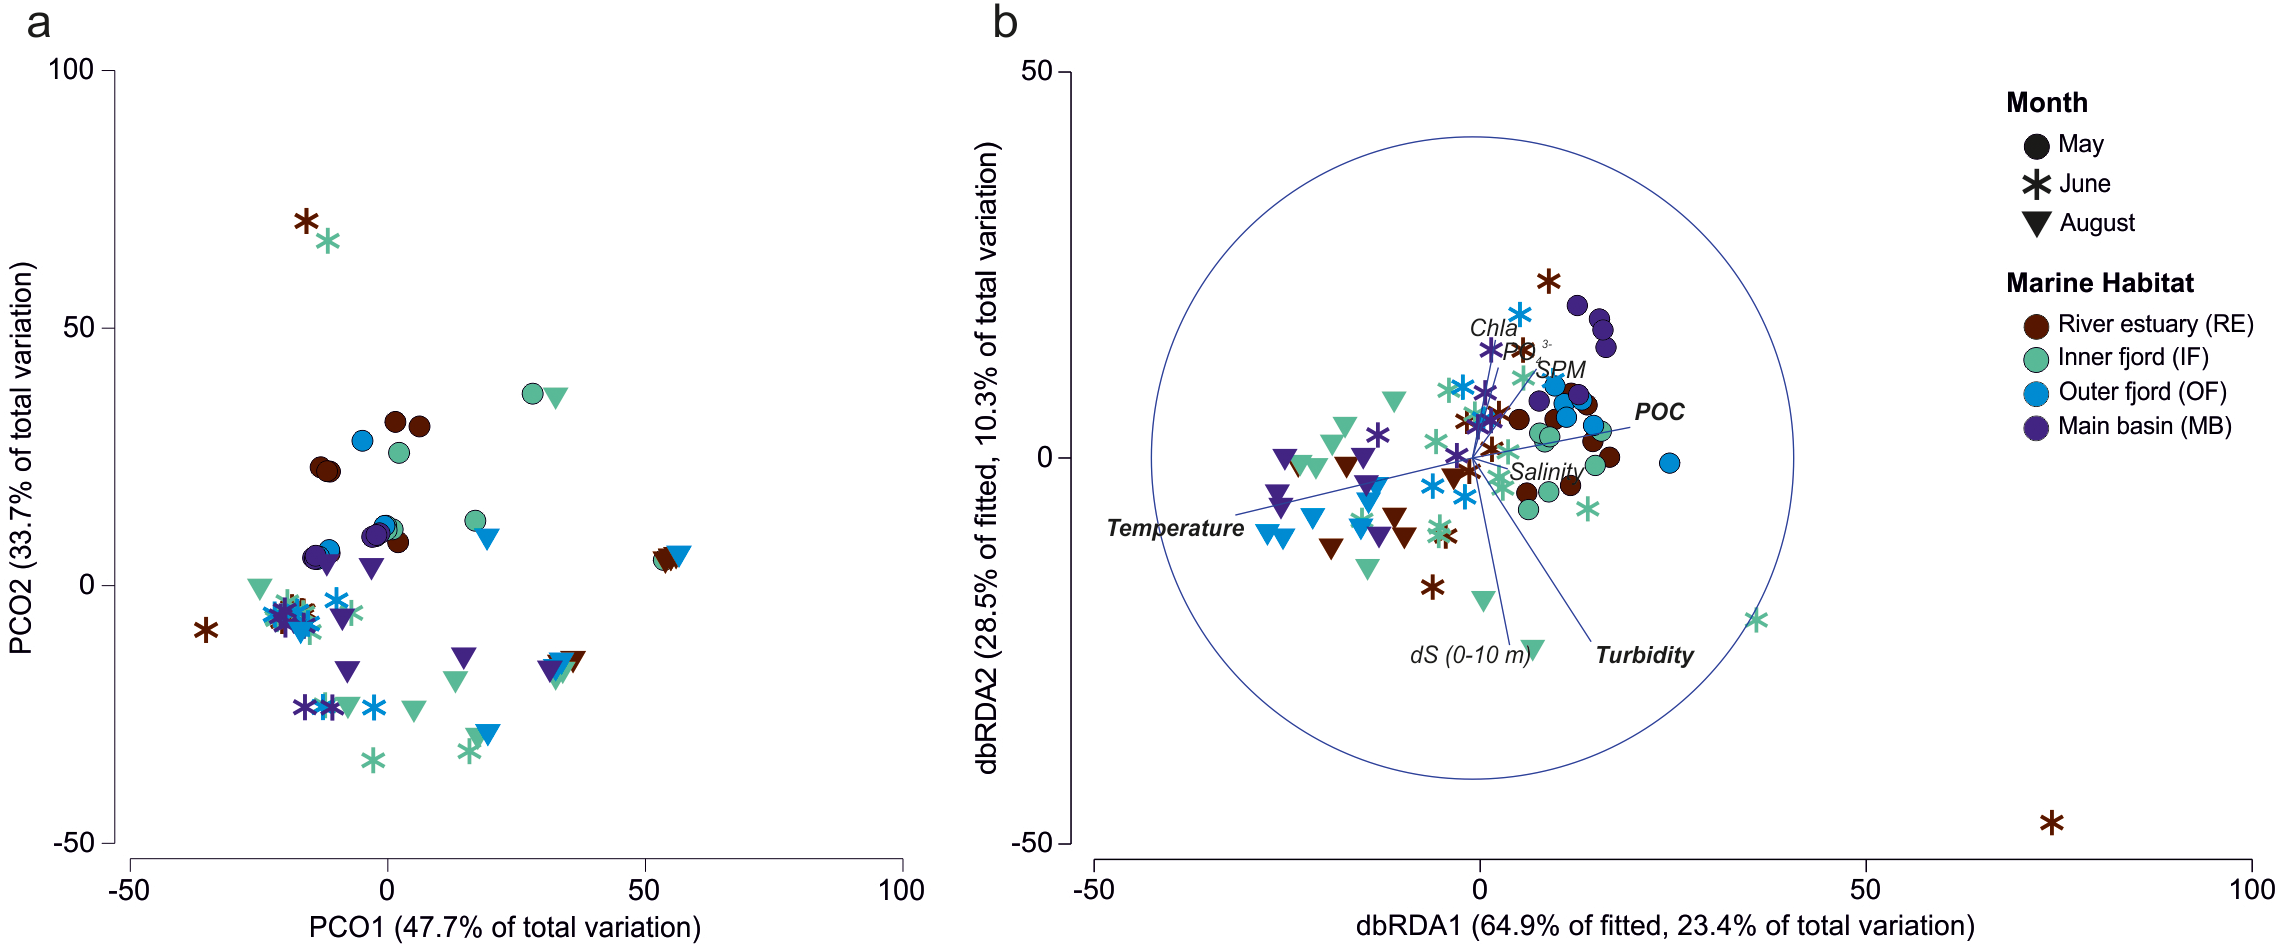
Protist community patterns visualized by (a) principal coordinates analysis (PCO) based on Bray-Curtis dissimilarities of log-transformed community data, and (b) distance-based redundancy analysis (dbRDA) illustrating relationships between protist communities and selected environmental variables. Factors shown in bold were statistically significant according to the DistLM model (Table 2). The legend applies to both panels.
Table 2
| Variable | Marginal tests | Sequential tests | |||||
|---|---|---|---|---|---|---|---|
| Pseudo-F | p | Adj. R2 | SS (trace) | Pseudo-F | p | Cumul. | |
| Temperature | 13.415 | 0.001 | 0.12744 | 12304 | 13.415 | 0.001 | 0.13771 |
| Turbidity | 9.536 | 0.001 | 0.23729 | 10501 | 13.098 | 0.001 | 0.25523 |
| POC | 9.4157 | 0.001 | 0.25699 | 2499.8 | 3.2006 | 0.033 | 0.28321 |
| dS (0–10 m) | 4.4738 | 0.018 | 0.27304 | 2148.1 | 2.811 | 0.053 | 0.30725 |
| SPM | 3.8869 | 0.018 | 0.28285 | 1588.6 | 2.1073 | 0.12 | 0.32503 |
| PO43- | 1.2708 | 0.264 | 0.28993 | 1342 | 1.7979 | 0.153 | 0.34005 |
| Chlorophyll a | 2.3144 | 0.07 | 0.29253 | 960.08 | 1.291 | 0.273 | 0.3508 |
| Salinity | 1.22 | 0.297 | 0.29405 | 866.66 | 1.1679 | 0.327 | 0.3605 |
| NH4+ | 1.2289 | 0.311 | |||||
| NO2- + NO3- | 6.1342 | 0.004 | |||||
Environmental drivers of protistan community structure across all months, as identified by DistLM marginal and sequential tests.
Variables in bold were statistically significant in the sequential selection model (p-value). NO2- + NO3- and NH4+ were excluded during sequential model selection, as they did not improve the model’s explanatory power (cumulative adjusted R²).
However, when variables were combined in the sequential selection model, only gradients of temperature (strongly positively correlated with FWC in the upper 10 m and with SiO2), turbidity (strongly negatively correlated with SD), and POC remained significant, collectively explaining 26% of the variation in community composition. Of these, temperature emerged as the most influential factor, accounting for approximately 13% of the total variance when considered individually (Table 2).
Seasonally, the May community structure was associated with higher POC concentrations and lower temperatures, whereas the August community displayed the opposite pattern. In contrast, the June community was primarily influenced by turbidity levels (Figure 9b).
4 Discussion
Our findings reveal a clear seasonal and spatial trajectory in Isfjorden’s protistan plankton communities, shaped by meltwater-driven changes in hydrography, nutrient availability, and light conditions (Figure 10). In May, cold, clear, unstratified waters enriched with marine-derived nutrients supported a robust spring bloom dominated by diatoms and Phaeocystis pouchetii, which contributed substantially to primary production and the POC pool. By June, the onset of the spring freshet introduced strong stratification and nutrient-rich runoff from glacial and terrestrial sources, shifting community structure toward small, opportunistic flagellates – notably Chrysochromulina and unidentified taxa such as “Indeterminate 1” and “Indeterminate 2” – thriving under freshened, nutrient-enriched, but increasingly turbid conditions. In August, elevated temperatures, intensified stratification, and turbidity from glacial melt and sediment resuspension severely limited light penetration. Despite sustained nutrient availability and high SPM and POC concentrations, protist abundance remained low, suggesting that late-summer carbon pools were driven more by terrestrial input and resuspension than by in situ production. Throughout the melt season, protist community dynamics reflected a shifting balance between nutrient supply and light limitation, shaped by physical processes such as stratification and oceanic advection. Spatial differences across fjord regions (RE, IF vs. OF, MB) mirrored the variable expression of these gradients. Importantly, our results suggest that continued freshening and darkening of Arctic coastal waters may favor small, motile, mixotrophic nanoflagellates adapted to low-light conditions, while disadvantaging larger, obligately phototrophic diatoms. This emerging functional divergence highlights potential “winners” and “losers” under future climate scenarios, with cascading implications for primary production, trophic transfer, and carbon export in Arctic fjord ecosystems.
Figure 10
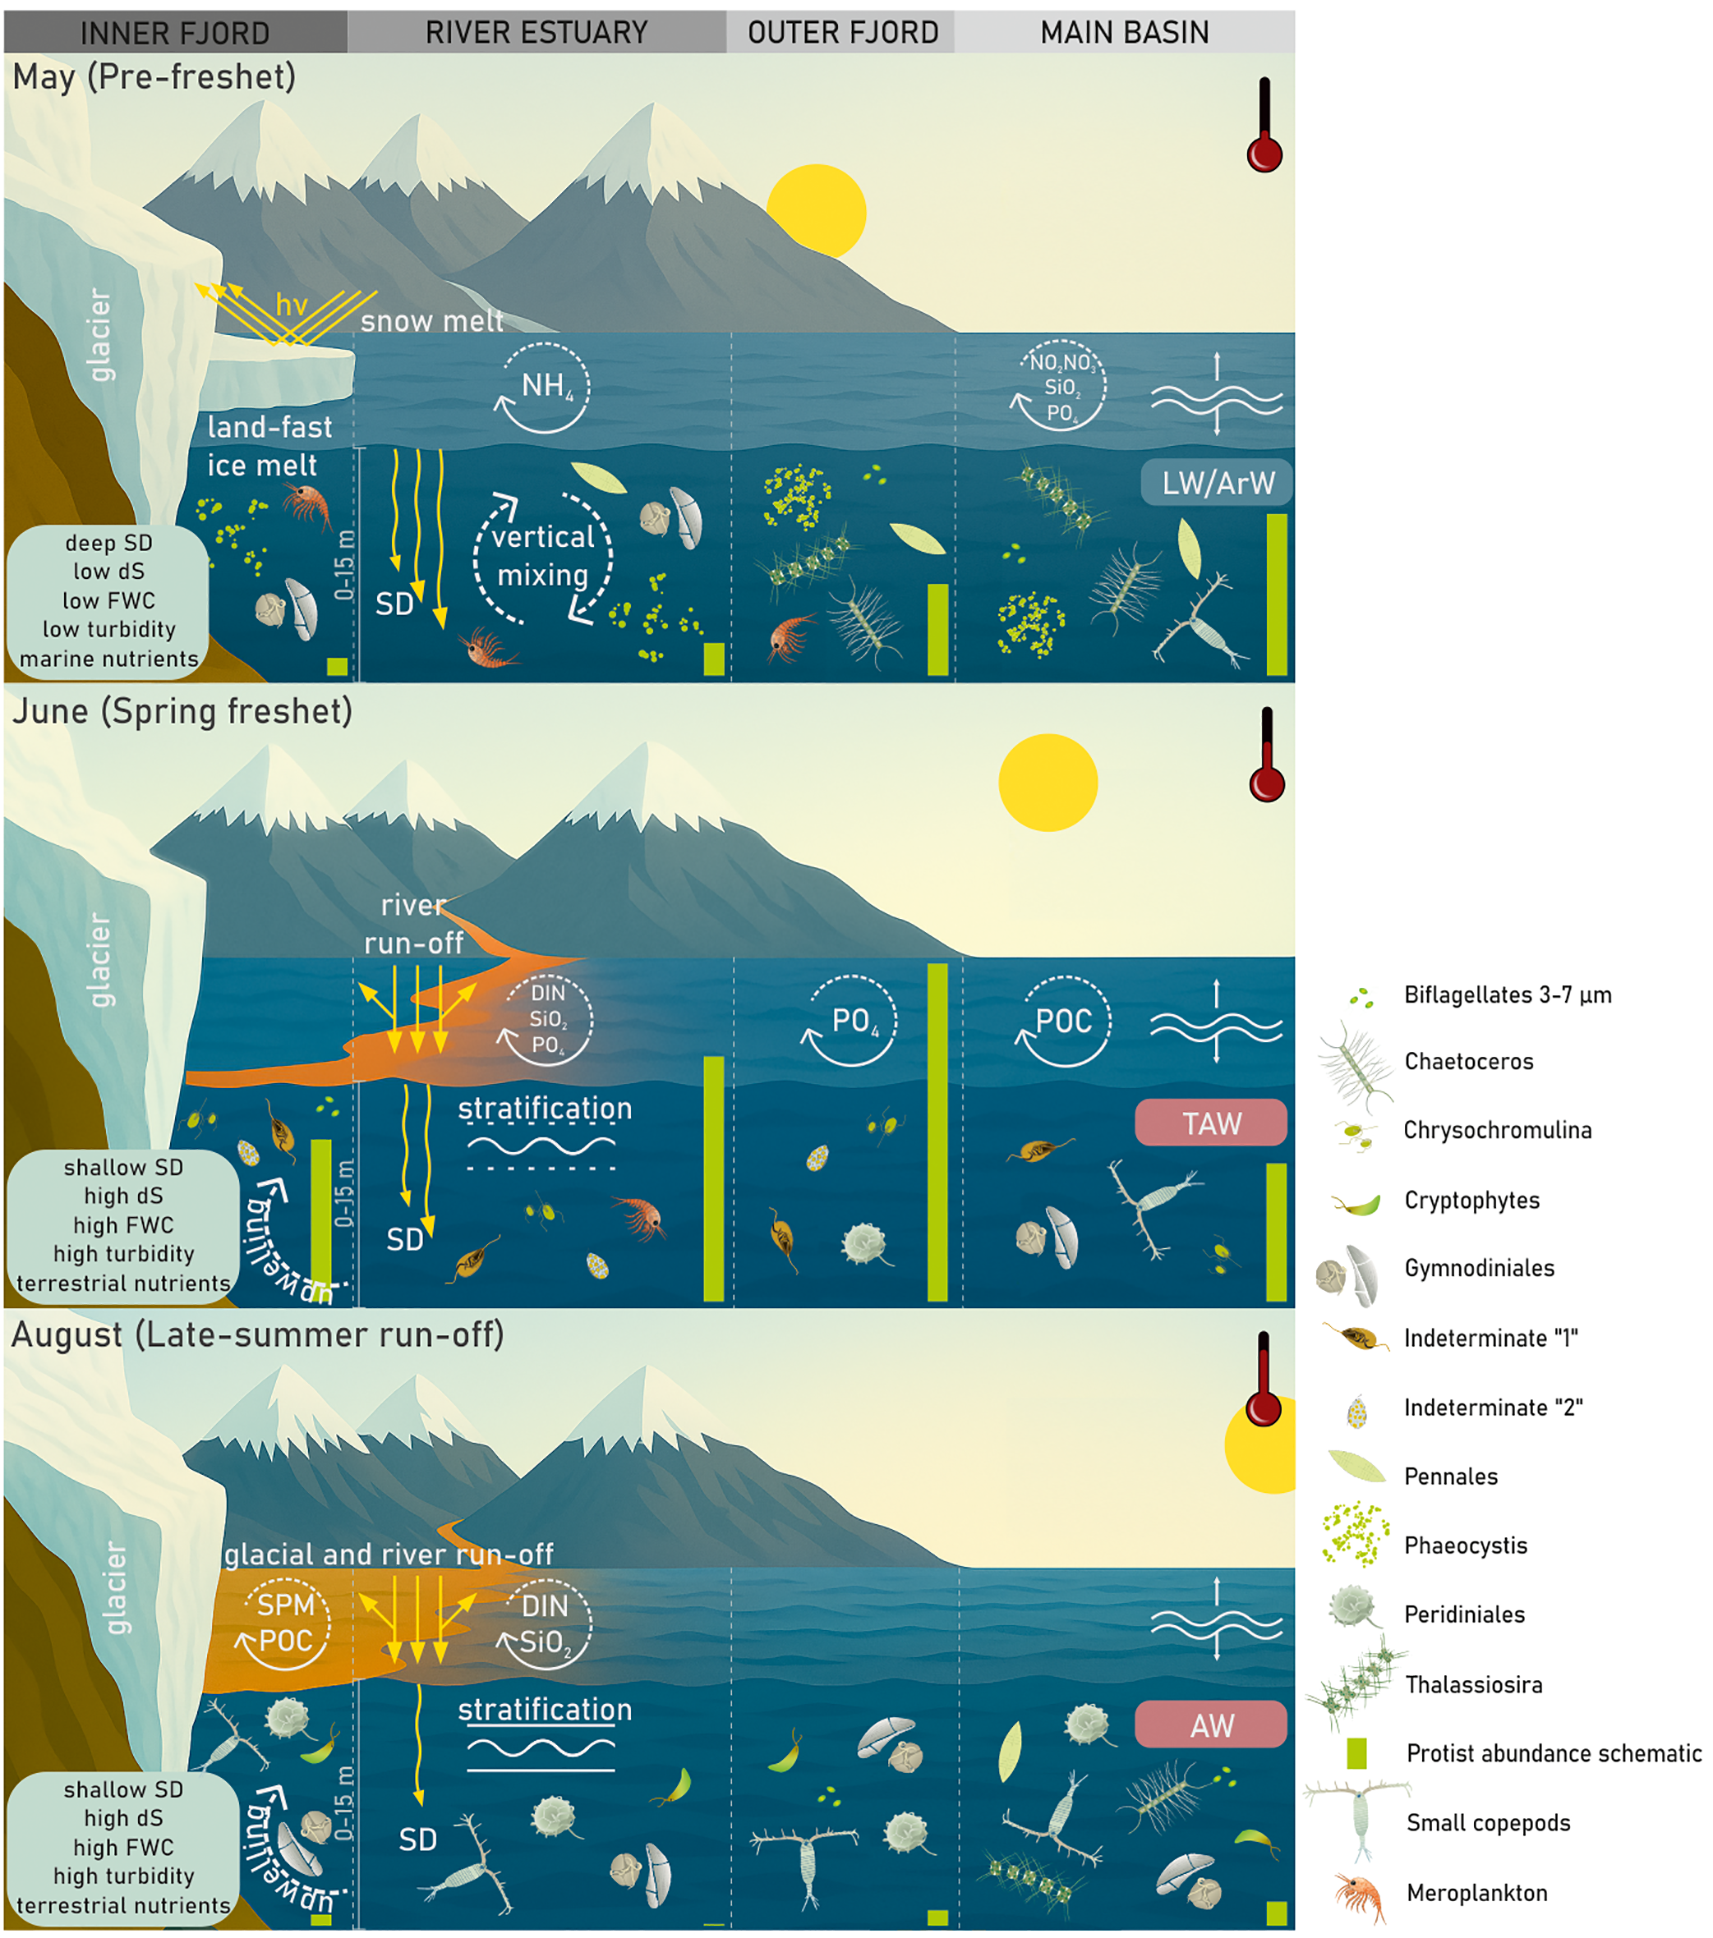
Summary of the principal findings of this study. In May, sea ice still covered the inner arms of Isfjorden, while the late spring bloom was dominated by Phaeocystis, accompanied by dinoflagellates in the inner fjord and diatoms in the outer regions. This bloom was sustained by nutrient inputs from the open ocean and the entrainment of NH4+ from shallow benthic sources. The onset of the spring freshet in June delivered substantial terrestrial inputs, markedly altering nutrient availability and reducing light penetration in the highly stratified, turbid surface waters. These conditions favored the early summer proliferation of diverse nanoflagellates, which outnumbered the spring assemblages. By August, surface waters exhibited elevated SPM and FWC, intensifying turbidity and maintaining strong stratification. Despite continued nutrient inflows from terrestrial sources, protistan communities were depauperate, comprising primarily cryptophytes and dinoflagellates, with diatoms intermittently introduced into the main basin via advection.
The following sections examine these seasonal and spatial patterns in greater detail, with particular focus on the dominant protistan groups characterizing each stage of the melt season.
4.1 Pre-freshet in May
4.1.1 Spring bloom phase determination
Spring blooms in the West Spitsbergen fjords typically occur between April and June, triggered by water column stabilization and increasing solar irradiance, and sustained by nutrient replenishment from winter convection (Hegseth and Tverberg, 2013; Hoppe et al., 2024). Their timing and species composition are shaped by a complex interplay of physical (light availability modulated by snow and ice cover, AW advection, wind-driven mixing), chemical (nutrient concentrations), and biological factors (micro- and mesozooplankton grazing, as well as “seed” populations from the water column, sea ice, or surface sediments) (Hegseth and Tverberg, 2013; Hegseth et al., 2019; Assmy et al., 2023). In highly advective systems such as Isfjorden, blooms may arise from locally germinating resting stages or be advected from distant open ocean regions, including the Fram Strait (Lampe et al., 2021).
Daily surface chlorophyll a concentrations derived from satellite data (CMEMS biogeochemical products, 4 km resolution, April 1 – May 11 2018) for the Nordic Seas (10°W–30°E, 70–82°N) revealed a notable increase in phytoplankton biomass in the second half of April on the West Spitsbergen Shelf, progressively advancing towards Isfjorden, where peak values were detected in early May. This timing places the bloom approximately two weeks earlier than reported by Lampe et al. (2021), who described two distinct blooms in the Atlantic sector of the Fram Strait in 2018: the first in mid-May, followed by a stronger bloom in mid-June. These discrepancies likely stem from methodological differences in data collection. Lampe et al. (2021) employed a 15-day moving average over a broader spatial domain (southeastern Fram Strait), whereas our study focused on daily chlorophyll a values in the waters adjacent to the Svalbard shelf. Given this localized approach, we propose that AW inflows and the associated offshore bloom could have influenced fjord bloom development. Supporting this, mooring data from Skogseth and Ellingsen (2019), deployed at the mouth of Isfjorden (78°03.653′N, 13°31.346′E; 30 m depth) between October 2017 and August 2018, recorded substantial inflows of TAW in mid-April (10–23 April), just before the satellite-detected phytoplankton peak in Isfjorden.
Further insights from high-resolution in situ data collected at the “Isfjorden Adventfjorden” (IsA) time series station (UNIS, 2011–2019; Vader et al., 2020, 2024) suggest that the 2018 bloom was relatively early, with lower chlorophyll a concentrations compared to 2012–2016 but similar to 2017–2019. The bloom at IsA peaked around 1 May (≥5 mg m-3), consistent with satellite observations and supported by Nyeggen (2019), who reported similar values (3.59 mg m-3) for the same date. By the time of our sampling (10–11 May), chlorophyll a concentrations at IsA had declined to approximately 0.5 mg m-3 in surface waters, while UNIS data for the same site indicated subsurface maxima at ~75 m depth (IsA station depth: 86 m), reaching ~3 mg m-3 – half the value of the early bloom peak. In comparison, chlorophyll a concentrations at our main basin (MB) stations ranged from 0.7 to 5.5 mg m-3 at the surface (median: 2.8 mg m-3) and from 1.2 to 5.4 mg m-3 at 15 m depth (median: 5.0 mg m-3), with the highest concentrations observed at stations IsK and ME-3. These findings suggest that, at IsA, the bloom had shifted to deeper layers, likely driven by nutrient depletion in surface waters and increased turbidity from Adventelva runoff, fostering subsurface chlorophyll a maxima, as observed previously by Meire et al. (2016). Additionally, given IsA’s location along the southern inflow pathway into Isfjorden, it is plausible that phytoplankton populations there were advected into the fjord alongside intruding oceanic waters, representing remnants of the offshore bloom.
Collectively, the comparison of our data with high-resolution seasonal UNIS observations, satellite records, and mooring data supports the conclusion that our sampling captured the late phase of the spring bloom (approximately one week after the peak), at chlorophyll a concentrations consistent with bloom thresholds (Nöthig et al., 2015). Furthermore, low nutrient concentrations at inner stations suggest that the bloom was already in decline in these areas, in contrast to the outer stations, where nutrient levels remained higher. Notably, the satellite-detected peak bloom in Isfjorden during 2018 coincided with bloom timing in 2013 and 2015, as reported by Chitkara et al. (2024). Across 2012–2018, these years exhibited similar patterns of sea ice cover in Isfjorden from late April to mid-May (primarily in Billefjorden and Tempelfjorden; https://cryo.met.no/), accompanied by nearly parallel chlorophyll a dynamics for both >10 µm and GFF fractions (Vader et al., 2020, 2024, 2025). Thus, similar spring bloom dynamics appear to emerge in years characterized by comparable sea ice conditions, as also demonstrated by Meire et al. (2016) in Godthåbsfjord (SW Greenland). However, the lower phytoplankton biomass recorded in spring 2018 relative to 2013 and 2015 indicates that additional factors beyond sea ice extent play a decisive role in controlling bloom intensity.
4.1.2 Protist community structure
During our May sampling, protist communities reflected a typical late-bloom scenario, dominated by spore-forming diatoms (Chaetoceros, Thalassiosira) and the colony-forming prymnesiophyte Phaeocystis pouchetii, mirroring the floristic composition observed in Isfjorden during the springs of 2012–2014 (Kubiszyn et al., 2017; Chitkara et al., 2024). For most diatom taxa, we recorded a clear gradient along the fjord axis, with increasing cell numbers and community diversity towards the outer fjord. Only Chaetoceros furcillatus colonies and long chains of Thalassiosira nordenskioeldii were relatively widespread throughout the fjord, yet they still followed this spatial pattern.
P. pouchetii, commonly found in springtime assemblages across Svalbard fjords (e.g., Kongsfjorden: Piquet et al., 2014; Hornsund: Smoła et al., 2017; Van Mijenfjorden: Kvernvik et al., 2021), emerged as the overwhelmingly dominant species in May. This prymnesiophyte, often regarded as a biological indicator of Atlantification (Hegseth and Tverberg, 2013; Kubiszyn et al., 2017; Bischof et al., 2019; Orkney et al., 2020), typically succeeds diatoms in Arctic bloom succession, particularly under silicate-depleted conditions or elevated nitrate-to-silicate ratios – both characteristic of the late spring bloom (Ardyna and Arrigo, 2020). The species appears to rely on diatom cells or colonies in spring to initiate its own colony formation, a potential dependency that could help explain its variable expression under differing hydrographic conditions (Hegseth et al., 2019). Under low-light or deeply mixed conditions, environments less favorable for diatoms, it often occurs as single cells or small colonies, forming subsurface chlorophyll maxima (Sakshaug and Skjoldal, 1989; Rokkan Iversen and Seuthe, 2011; Lacour et al., 2017; Assmy et al., 2023; Hoppe et al., 2024). Beyond its capacity to persist across variable hydrographic settings, P. pouchetii may have further benefited from limited top-down control, which appears to have played little role in constraining bloom development. This reduced grazing pressure likely reflects the fact that P. pouchetii colonies are less readily consumed than diatoms (Ray et al., 2016). High zooplankton densities observed in May, particularly meroplanktonic cirriped nauplii (~20,000 ind. m-3 in the RE and ~12,000 ind. m-3 in the OF; Vereide, 2019), support the idea that colony formation provides an effective size-based refuge from predation (Nejstgaard et al., 2007; Grattepanche et al., 2011; Ryderheim et al., 2022). Altogether, the combination of favorable physical structure, physiological traits, and reduced grazing pressure likely contributed to the persistence of the May bloom. The abundance of herbivorous zooplankton further supports the notion of an early bloom onset, likely initiated in the innermost fjord regions (Vereide, 2019).
Our observations of P. pouchetii dominance in May align with broader Arctic trends that suggest an increasing prevalence of this taxon under ongoing climate change. Shifts favoring Phaeocystis over diatoms are expected to increase the proportion of organic carbon that is remineralized within the water column, thereby weakening the coupling between primary producers and traditional pelagic–benthic food webs (Rousseau et al., 2000). Changes in phytoplankton composition may also influence summer succession, as shown by the late-summer diatom bloom in Kongsfjorden in 2019, which capitalized on silicic acid remaining unutilized during the Phaeocystis-dominated spring bloom (Assmy et al., 2023). The rising prominence of P. pouchetii in the European Arctic therefore has significant implications for carbon cycling and trophic transfer efficiency, underscoring the need for sustained, long-term studies to understand the ecological interplay between Phaeocystis, diatoms, and changing environmental conditions.
The Phaeocystis–diatom assemblage was accompanied by a diverse but relatively low-biomass community of dinoflagellates and small flagellates, predominantly ≤10 µm in size, which were evenly distributed across Isfjorden. Among the dinoflagellates, unarmored (naked) taxa were more prevalent than thecate (armored) forms. Members of the order Gymnodiniales, particularly Gymnodinium and Gyrodinium species, were especially numerous. Due to fragile cell structures and limited distinguishing morphological features, many Gymnodinium and Gyrodinium taxa were identified only to the genus level with associated size classes – an approach commonly used in studies of this group (Kubiszyn and Wiktor, 2016). Improved resolution of these taxa will require integrative methodologies, including scanning electron microscopy (SEM), live-cell observations, or combined morphological and molecular analyses of micromanipulated specimens. Nonetheless, identifiable species within Gymnodinium included G. arcticum, G. gracilentum, G. galeatum, and G. wulffii, while the Gyrodinium assemblage was largely composed of G. fusiforme, G. grave, and G. spirale. These species are well-documented constituents of dinoflagellate communities in West Spitsbergen waters (Kubiszyn and Wiktor, 2016) and form persistent elements of the protistan plankton throughout much of the year (Błachowiak-Samołyk et al., 2015; Marquardt et al., 2016; Hegseth et al., 2019; Meshram et al., 2017; Dąbrowska et al., 2021). Additionally, unidentified nanoflagellates (≤10 µm), particularly biflagellates (3–7 µm), were detected primarily in the outer fjord areas (OF, MB), and likely represented the flagellated stages of P. pouchetii.
Marine-derived particulate organic matter predominated in May, likely sustained by early-season protists; however, near river inlets (RE), early signs of the approaching freshet – such as reduced salinity, elevated turbidity, higher NH4+ concentrations, and the presence of potentially ice-associated diatoms (Pennales 20–30 µm, Fragilariopsis cylindrus, Navicula transitans) – foreshadowed the transition to a regime increasingly shaped by terrestrial inputs (McGovern et al., 2020). Increased NH4+ concentrations, a typical regeneration product from bacterial activity, suggest rapid remineralization and entrainment from shallow benthic sources following sediment resuspension. This additional nitrogen input may play a pivotal role in shaping fjord-scale productivity, particularly in shallow sub-fjord regions where NH4+ can be released from sediments or subglacial upwelling (Halbach et al., 2019; Hopwood et al., 2020). Moreover, the significant negative correlation observed between NH4+ availability and both total chlorophyll a concentrations and the abundance of certain nanoflagellates (“Indeterminate 1”, Cryptophyceae, Prymnesiophyceae) highlights the potential importance of NH4+ in structuring protistan communities and influencing their development in subsequent seasons.
4.2 Spring-freshet in June
In June, Isfjorden experienced a distinct early summer bloom, characterized by higher protist abundances and chlorophyll a concentrations compared to the late spring bloom in May, except at marine basin stations (notably IsK and ME-3), where diatom-driven peaks had already occurred in May. These patterns are consistent with high-frequency observations from Adventfjorden (IsA) in 2018 reported by Nyeggen (2019), based on sampling conducted approximately every 2–3 weeks from March to November, suggesting sustained biomass beyond the typical spring peak. Communities were dominated by a mixture of small flagellates, with the mixotrophic prymnesiophyte Chrysochromulina (<10 µm) and two unidentified taxa (“Indeterminate 1” and “Indeterminate 2”, both 10–20 µm) as the most abundant components. In addition, cryptophytes, dinoflagellates, and the motile, biflagellate morphotypes of Phaeocystis pouchetii (3–7 µm), typical of the bloom’s declining stage, were present in significant numbers. Similar proliferations of nano-sized protists later in the season (early August) were previously reported by Szeligowska et al. (2020) for Isfjorden (2013–2019).
The Chrysochromulina bloom observed in June 2018 echoes earlier observations in West Spitsbergen fjords. In Adventfjorden (summer 2013), it comprised 75–81% of the community, with abundances comparable to spring bloom levels (Dąbrowska et al., 2021). At the same time, in Hornsund, it reached 18.00 × 10⁸ cells m-3, accounting for 93% of protist abundance (unpublished data). These cases highlight the strong bloom potential of Chrysochromulina in shallow fjord waters, where it can almost entirely dominate the community. However, accurate species identification remains challenging. In Hornsund (2013), live material analyzed onboard revealed Chrysochromulina ericina (now Haptolina ericina), while preserved samples showed extensive cellular degradation and flagella loss – illustrating how delicate flagellates with thin cell walls are particularly prone to damage during fixation and storage, especially at certain life cycle stages. This underscores the importance of immediate analysis for reliable taxonomic resolution.
In the early summer 2018, Chrysochromulina was abundant across nearly all stations, peaking in Billefjorden at stations B-RE and B-Outer. Maximum surface abundances reached 34.63 × 10⁸ and 42.20 × 10⁸ cells m-3, respectively. Even at 15 m depth, concentrations remained elevated, albeit reduced by 1.5–2.5 times. Similarly high values were recorded at station IsK in the marine basin (15.55 × 10⁸ cells m-3), suggesting possible downstream advection from Billefjorden. Notably, these bloom hotspots in Billefjorden coincided with markedly elevated phosphate concentrations. PO4³- levels reached 2.48 mmol m-3 at the surface and 3.26 mmol m-3 at 15 m at B-RE, and 1.96 and 1.63 mmol m-3 at B-Outer, respectively. Other nearby stations also showed locally elevated values, such as B-NC (1.36 mmol m-3 at the surface) and B-Inner (0.52 mmol m-3 at 15 m), while the fjord-wide median remained at ~0.1 mmol m-3.
Multiple sources likely contributed to this enrichment. Exceptionally warm air and water temperatures in mid-summer 2018 (Szeligowska et al., 2020) likely accelerated meltwater delivery from the Nordenskiöldbreen glacier, enhancing phosphorus fluxes to coastal waters. Reduced exchange across the bathymetric sill at the fjord mouth may have promoted local nutrient accumulation. Additional phosphorus inputs from glacial erosion, sediment remineralisation, and possible anthropogenic contamination – such as phosphogypsum waste from the Skansbukta mine – cannot be ruled out (Hawkings et al., 2016). Furthermore, significant seabird colonies on the Gåsøyane islands, the slopes of De Geerfjellet, and along Billefjorden’s eastern shore likely contributed guano-derived nutrients during their peak nesting season (Descamps et al., 2021; Tůmová et al., 2024). Comparable nutrient enrichment from seabird colonies has been reported elsewhere in Isfjorden (Hovinen, 2014; Szymański et al., 2023; Finne et al., 2024) and in other Svalbard fjords (Zmudczyńska et al., 2012; Zwolicki et al., 2013), indicating that this phenomenon is not unique to Billefjorden. Finally, although cell lysis from Chrysochromulina could hypothetically release phosphorus, this is unlikely to account for the observed enrichment, as blooms typically coincide with nutrient drawdown rather than accumulation. The unexpectedly high PO43- levels, despite active blooms, therefore point to external inputs exceeding biological demand.
It is worth noting that comparable Chrysochromulina-dominated events have been observed in other systems with similar seasonal freshwater influences and stratification dynamics. For instance, John et al. (2022) described a Ch. leadbeateri bloom in northern Norway, linked to terrestrial organic nitrogen inputs following intense river runoff. The species, known to utilize organic nitrogen under conditions of inorganic nitrogen limitation (Glibert and Legrand, 2006), reached cell densities of ~49 million cells L-¹ and caused severe ecological impacts, including mass salmon mortality (Grann-Meyer, 2020). Taken together with our findings, this highlights the capacity of freshwater runoff to strongly influence protist community dynamics during the spring freshet, promoting the growth of Chrysochromulina and other nanoflagellates that thrive under elevated temperature, nutrient enrichment, and reduced salinity.
The distribution of Chrysochromulina closely resembled that of “Indeterminate 1”, which reached its maximum at B-Outer (10.91–12.90 × 10⁸ cells m-3, maximum at 15 m depth). Despite its repeated detection in Arctic monitoring programs (Nordic Seas, Barents Sea, and Svalbard fjords), it has historically remained numerically marginal and poorly characterized. Due to its low abundance and uncertain taxonomic placement, residual data for this taxon have been underreported. Previous attempts at identification, including efforts under the TaxMArc project, failed to resolve its taxonomic position, though multiple experts recognized it from various Arctic regions. Given its episodic dominance, future work will prioritize comprehensive taxonomic resolution of this and similar unclassified protists.
The second unidentified protist, “Indeterminate 2”, was primarily confined to Adventfjorden. Subsurface maxima (15 m) ranged from 4.94 to 7.79 × 10⁸ cells m-3 at stations near the river mouth (A-F1) and fjord interior (AF-2, A-NC), with the highest surface abundance (10.49 × 10⁸ cells m-3) recorded at the fjord entrance (IsA). Meltwater influence in Adventfjorden was evidenced by declining DIN (from 3.57 to 0.47 mmol m-3), decreasing SiO2 (16.68 to 1.25 mmol m-3), and a marked turbidity gradient (46.33 to 4.33 FTU) with increasing distance from the runoff source. Secchi depth correspondingly increased from 0.3 to 2.5 m. Interestingly, PO43- – with maximum concentrations over ten times lower than in Billefjorden – exhibited a reverse gradient, decreasing from the outer (0.23 mmol m-3) to the inner (0.05 mmol m-3) sites, in contrast to both other nutrients in Adventfjorden and the shoreward increase observed in Billefjorden.
Of note, “Indeterminate 2” reappeared in late August 2022 in Hornsund (Gåshamna, unpublished data), at a site similarly influenced by river runoff, where a Chrysochromulina bloom had been documented in July 2013. Such coincidences suggest comparable environmental preferences, indicating strong adaptation to freshened, turbid surface waters. Although the association of some “Indeterminate 2” cells with the genus Heterosigma remains tentative, morphological characteristics support this interpretation. Given the ecological significance of Heterosigma, particularly its co-occurrence with potentially harmful Chrysochromulina blooms, these findings raise concerns about the risk of harmful algal blooms in Svalbard’s runoff-influenced summer waters.
The widespread dominance of small flagellates across all habitats in June also prompts consideration of their role as a food base for zooplankton. Zooplankton abundances were notably lower than in May, with highest densities in the river estuary (~5000 ind. m-3) and approximately half that in other regions (~2500 ind. m-3; Vereide, 2019). Along the estuary-offshore gradient, meroplankton, particularly cirriped nauplii and bivalve veligers, declined from ~70% at inner sites to ~12% at outer sites. The elevated zooplankton abundances in fresher, stratified inner regions may reflect intensified grazing pressure due to reduced dilution effects (Behrenfeld, 2010), potentially facilitating efficient feeding on small flagellates, especially larger nanoplanktonic cells (>10 µm) that may be more susceptible to zooplankton grazing.
4.3 Late-summer runoff in August
As the melt season progressed from snowmelt in June to intensified glacial and permafrost runoff in August, protistan plankton communities declined in abundance while retaining a composition reminiscent of early summer. Such a qualitatively similar but quantitatively diminished continuation of the early-season community typically characterizes the West Spitsbergen fjords in late summer (e.g., Piwosz et al., 2009; Kubiszyn et al., 2014; Szeligowska et al., 2020, 2021). In addition to ubiquitous naked dinoflagellates and cryptophytes (Teleaulax sp., Cryptophyceae indet.), the community also included small thecate dinoflagellates such as Prorocentrum cordatum, Azadinium spinosum, Protoperidinium bipes, Gonyaulax gracilis, and other free-living forms (5–10 µm). These taxa were absent or rare earlier in the season but have been previously observed in mid-summer Isfjorden waters (2–3 August 2018; Szeligowska et al., 2020). Although the abundance of thecate dinoflagellates remained low compared to athecate forms, their persistent presence in turbid late-summer waters may reflect mixotrophic capabilities, enabling survival and growth when light availability limits photosynthesis (Seuthe et al., 2011), or purely heterotrophic feeding on phytoplankton and other protists. This aligns with Levinsen and Nielsen (2002), who noted the generally lower abundance of thecate dinoflagellates in Arctic waters, but increasing contributions under high-sediment conditions.
The least abundant protistan communities were recorded in river estuaries (maximum 0.24 × 10⁸ cells m-3) and glacier-dominated inlets, such as Billefjorden and Tempelfjorden (maximum 0.07 × 10⁸ cells m-3), despite elevated concentrations of DIN and SiO2 associated with intensified meltwater runoff. This decoupling between nutrient supply and phytoplankton abundance aligns with previous studies showing that turbidity-driven light limitation in glacially influenced fjords can suppress primary production even in nutrient-rich environments (e.g., Caroppo et al., 2017; Hoshiba et al., 2024). McGovern et al. (2020) demonstrated that meltwater and permafrost inputs can substantially elevate inorganic nutrient concentrations, with riverine NO2- + NO3- levels reaching up to 12 times those measured in adjacent fjord waters. However, extremely high turbidity (such as the 297.33 FTU recorded at T-RE-Sassen) reduced Secchi depth to just 0.12 m, likely limiting light availability and constraining primary productivity. Comparable conditions observed at nearby sites (e.g., T-Inner, B-Inner) further support this interpretation.
Protist abundances increased progressively with distance from the inner fjord (approximately doubling between successive stations), following a pattern observed in Arctic glacier-fed systems – for example, Sejr et al. (2022) reported a tenfold increase in primary production from turbid inner regions to shelf waters outside a northeastern Greenland fjord. In Adventfjorden, where no marine-terminating glaciers are present, protist abundances near the river mouth were comparable to other estuarine sites, but increased notably along the axis. At station IsA, the highest abundance observed across all stations (4.53 × 10⁸ cells m-3) was dominated by cryptophytes – a group known to thrive under low-light and stratified conditions (e.g., Mendes et al., 2023).
With the exception of a few planktonic and benthic diatoms recorded at T-Inner and IsA, the group was largely confined to the outer fjord stations. More diverse and abundant assemblages – including Thalassiosira, Pseudo-nitzschia, Lennoxia, Chaetoceros, Cylindrotheca, and small pennate diatoms (5–30 µm) – were observed at IsK and IsG, near the fjord entrance. This spatial pattern is likely driven by the inflow of AW, as indicated by TS diagrams, which may have facilitated diatom advection into these regions and enhanced nutrient availability. Additionally, improved underwater light conditions in these clearer areas (SD up to 7.2 m) likely supported phototrophic growth, enabling diatoms to persist and diversify compared to the more turbid inner fjord zones.
Despite AW influence, zooplankton communities did not mirror patterns of advection. Small copepods (dominated by Oithona similis, followed by Pseudocalanus spp. and Microcalanus spp.) accounted for ~70% of zooplankton across all habitats, with modest overall densities (~3000 ind. m-3 in estuaries, peaking at ~4000 ind. m-3 in outer fjord areas, and declining to ~2000 ind. m-3 at marine endpoints; Vereide, 2019). This suggests limited zooplankton advection during this period, potentially influenced by seasonal vertical migration or interannual variability (Gluchowska et al., 2016).
Of the early summer dominants, only non-identified nanoflagellates persisted, but in minimal numbers. “Indeterminate 2” was restricted to the central part of Isfjorden (IsK, IsA; 0.01–0.03 × 10⁸ cells m-3), while “Indeterminate 1” was present across all habitats except RE, peaking at station A-NC (0.07 × 10⁸ cells m-3). Chrysochromulina, a key player in June, was entirely absent by late summer. As in previous months, ciliates, mainly represented by Oligotrichea (~95% of identified taxa), remained a minor component of the community (~1% of total protist abundance). Most (0.18 × 10⁸ cells m-3) were found in Adventfjorden at A-NC (15 m), composed almost entirely (99.47%) of Lohmanniella oviformis. The overall low ciliate abundance is consistent with previous observations that these taxa favor open shelf and oceanic waters over West Spitsbergen fjords (Kubiszyn et al., 2014). Notably, Szeligowska et al. (2020) documented a higher ciliate contribution (~50%) at IsA in early August 2018, dominated by L. oviformis and Acanthostomella norvegica. However, this was likely a transient advective event, coinciding with mid-July AW inflow (Skogseth and Ellingsen, 2019), as suggested by the concurrent temporary presence of P. pouchetii, a hallmark species of Atlantic intrusions, absent in our late summer observations.
While our study, spatially limited to Isfjorden and vertically constrained to the upper water column, cannot fully resolve ciliate distributions and habitat preferences, the declining abundances of this group across the melt season (May: 3.15 × 10⁸; June: 1.37 × 10⁸; August: 0.26 × 10⁸ cells m-3) merit attention. Although ciliates were present in the majority of samples, their abundances were generally low, with slightly higher values recorded only in May during the pre-freshet phase of the melt season, particularly in the RE and IF regions. The highest abundance was observed at station T-RE-Sassen (0.15 × 10⁸ cells m-3). Potential drivers of their minimal contribution during later months of intensified meltwater input – beyond grazing by planktonic consumers – include clogging of feeding structures by fine sediments, cell aggregation increasing sinking rates, osmotic stress from surface freshening, and reduced vertical migration due to enhanced stratification. These processes may act in combination, as demonstrated by Boenigk and Novarino (2004) and Henjes and Assmy (2008). Given the central role of ciliates in microbial food webs, facilitating organic matter decomposition and energy transfer (Sherr and Sherr, 1987), understanding their responses to Arctic warming and meltwater-driven turbidity is critical for predicting ecosystem function (Weisse et al., 2016).
4.4 Picophytoplankton: a missing piece
Although only nano- and microplankton were quantified in our study, environmental conditions and the observed community composition suggest that picophytoplankton likely co-occurred and contributed to ecosystem processes. The persistent dominance of nanoflagellates throughout the melt season, particularly during the spring freshet, coincided with conditions that typically favor picophytoplankton (≤2 µm): strong stratification, high turbidity, and reduced light availability (Li et al., 2009; Rokkan Iversen and Seuthe, 2011; Meire et al., 2023). These environmental factors, common in glacially influenced fjords, create ecological niches where both nano- (especially ≤10 µm) and picoplankton – with shared functional traits such as mixotrophy and flagellar motility (Stoecker and Lavrentyev, 2018) – are likely to thrive and respond similarly to meltwater-driven gradients.
Yet despite their ecological relevance, picophytoplankton remain among the least studied components of Arctic plankton communities, including those in Svalbard waters (Piquet et al., 2014; Zhang et al., 2019). This knowledge gap stems largely from methodological limitations. In particular, epifluorescence microscopy (especially in silicate-rich, detritus-laden surface waters) suffers from poor resolution due to light scattering, hindering the detection of small cells (Moreira-Turcq et al., 2001; Booth et al., 2023). Without the application of targeted techniques such as flow cytometry, molecular profiling, or size-fractionated chlorophyll a analysis, the abundance and role of picophytoplankton remain poorly constrained. In glacial systems, however, suspended particulate matter may interfere with size-fractionation by clogging filters or altering effective pore retention, making the choice of collection and preservation techniques – including filter type and pore size – a critical methodological consideration (e.g., Carlson and Simpson, 1996; Wei et al., 2022). Similar interference can affect flow cytometry, where high inorganic particle signals may obscure microbial counts (Paulsen et al., 2017); in such cases, sample dilution has been used as a potential mitigation strategy.
Despite these challenges, existing studies offer valuable insight into the seasonal dynamics and distribution of picophytoplankton in Svalbard coastal waters. Eukaryotic picoplankton, particularly Micromonas spp. (e.g., Lovejoy et al., 2007), are known to dominate under low-light, hydrographically stable conditions, especially in early spring and autumn (Sørensen et al., 2012; Marquardt et al., 2016). These taxa have also been observed in spring and summer in outer fjord basins, although their presence may partly reflect advection from the open ocean (Piquet et al., 2014; Piwosz et al., 2015; Zhang et al., 2019). In winter, heterotrophic and mixotrophic taxa such as MASTs, Picozoa, and MALVs tend to dominate (Marquardt et al., 2016), while Micromonas, capable of bacterivory (Stoecker and Lavrentyev, 2018), can persist even through the polar night (Vader et al., 2015).
As with larger planktonic fractions (e.g., Hegseth and Tverberg, 2013; Kubiszyn et al., 2014), the seasonality of picophytoplankton appears increasingly modulated by the progressing Atlantification of the Arctic Ocean and the associated sea-ice decline – processes that enhance surface stratification and constrain vertical nutrient supply (Ardyna and Arrigo, 2020). These changes, together with ocean warming and declining nitrate concentrations, favor small, slow-sinking cells with high nutrient affinity and efficient light use (Li et al., 2009). As a result, communities increasingly shift toward sub-Arctic taxa such as Micromonas commoda and M. pusilla, along with prokaryotic picophytoplankton (Hörstmann et al., 2024; Ribeiro et al., 2024; Susort, 2025).
Although our conclusions are based solely on nano- and microplankton, the observed patterns may nonetheless reflect broader trends reported for the entire microbial community, including picophytoplankton. Freshwater-driven stratification and nutrient enrichment appear to support elevated productivity of small, motile protists in nearshore waters – even under high turbidity and limited light availability. These findings align with in vitro experiments by Andersen (2022), who replicated our 2018 station layout and sampling depths in Adventfjorden and demonstrated elevated bacterial and primary productivity in similarly glacially influenced waters using radioactively labelled substrates. Although picoplankton were not explicitly targeted, such productivity likely includes contributions from this fraction. Taken together, the results support the idea that nano- and picoplankton may respond in lockstep to Arctic amplification and meltwater-driven gradients, indicating a coordinated restructuring of microbial communities under climate pressure, as demonstrated, for instance, in the Fram Strait (Nöthig et al., 2015). Additional evidence comes from epifluorescence microscopy data from the Isfjorden transect (stations BAB, ISF, ISA; 10 August 2015 and 9–10 August 2016; unpublished; Szeligowska et al., 2020), which indicate a widespread presence of picophytoplankton within the surface layer (0–15 m). In comparison to 2016, when meltwater influence was reduced, both nano- and picoplankton exhibited notably higher abundances in 2015, reflecting the stronger meltwater impact during that year. This functional overlap underscores the importance of looking beyond traditional grazer-based food web models. As key players in the microbial loop, picophytoplankton may increasingly redirect carbon through microbial pathways, thereby reducing transfer efficiency to mesozooplankton and higher trophic levels (Atkinson et al., 2021; Di Pane et al., 2024). Neglecting this fraction can blur interpretations of community structure and overstate the role of larger protists in bloom dynamics and carbon flux. Recognizing their role is thus essential – not only for understanding ongoing changes in Arctic microbial food webs, but also for guiding future research toward size-fractionated approaches that explicitly quantify their contribution.
Statements
Data availability statement
The original contributions presented in the study are included in the article/Supplementary Material. Further inquiries can be directed to the corresponding author/s.
Author contributions
AD: Conceptualization, Data curation, Formal analysis, Investigation, Methodology, Software, Supervision, Validation, Visualization, Writing – original draft, Project administration. MaM: Conceptualization, Data curation, Funding acquisition, Investigation, Methodology, Project administration, Resources, Writing – review & editing. MiM: Methodology, Writing – review & editing. AP: Conceptualization, Data curation, Funding acquisition, Investigation, Methodology, Project administration, Resources, Writing – review & editing.
Funding
The author(s) declare financial support was received for the research and/or publication of this article. This study received funding from the Norwegian Research Council (TerrACE project, grant no. 268458) and the GRIEG programme, financed by the Norwegian Financial Mechanism 2014-2021 (grant agreement UMO-2019/34/H/ST10/00504).
Acknowledgments
We thank the students, colleagues, and the UNIS logistics team, as well as the crews of RV Helmer Hansen and Clione, for their invaluable assistance during fieldwork. We are also grateful to Józef Wiktor (IO PAN) for insightful discussions of the results, to Anna Vader (UNIS) for sharing multi-year environmental and biological data from the IsA Arctic marine time series, and to Philipp Assmy (NPI) for valuable insights into the 2018 environmental conditions in the West Spitsbergen fjords. Special thanks go to Małgorzata Merchel (IO PAN) for selecting and analyzing satellite data and producing the chlorophyll a concentration maps.
Conflict of interest
The authors declare that the research was conducted in the absence of any commercial or financial relationships that could be construed as a potential conflict of interest.
Generative AI statement
The author(s) declare that no Generative AI was used in the creation of this manuscript.
Any alternative text (alt text) provided alongside figures in this article has been generated by Frontiers with the support of artificial intelligence and reasonable efforts have been made to ensure accuracy, including review by the authors wherever possible. If you identify any issues, please contact us.
Publisher’s note
All claims expressed in this article are solely those of the authors and do not necessarily represent those of their affiliated organizations, or those of the publisher, the editors and the reviewers. Any product that may be evaluated in this article, or claim that may be made by its manufacturer, is not guaranteed or endorsed by the publisher.
Supplementary material
The Supplementary Material for this article can be found online at: https://www.frontiersin.org/articles/10.3389/fmars.2025.1631963/full#supplementary-material
References
1
Andersen S. D. (2022). “Turbid Arctic coastal waters: potential hotspots for primary productivity,” in Riverine influence on microbial productivity in High Arctic fjords (UiT Norges arktiske universitet). Available online at: https://munin.uit.no/handle/10037/25871.
2
Anderson M. (2008). “PERMANOVA+ for PRIMER: guide to software and statistical methods,” in Primer-E limited. Available online at: https://cir.nii.ac.jp/crid/1370572092711312918.
3
Ardyna M. Arrigo K. (2020). Phytoplankton dynamics in a changing Arctic Ocean. Nat. Climate Change10, 892903. doi: 10.1038/s41558-020-0905-y
4
Assmy P. Kvernvik A. C. Hop H. Hoppe C. J. Chierici M. Duarte P. et al . (2023). Seasonal plankton dynamics in Kongsfjorden during two years of contrasting environmental conditions. Prog. Oceanography213, 102996. doi: 10.1016/j.pocean.2023.102996
5
Atkinson A. Lilley M. K. S. Hirst A. G. McEvoy A. J. Tarran G. A. Widdicombe C. et al . (2021). Increasing nutrient stress reduces the efficiency of energy transfer through planktonic size spectra. Limnology Oceanography66, 422–437. doi: 10.1002/lno.11613
6
Behrenfeld M. J. (2010). Abandoning Sverdrup’s Critical Depth Hypothesis on phytoplankton blooms. Ecology91, 977–989. doi: 10.1890/09-1207.1
7
Bianchi T. S. Arndt S. Austin W. E. Benn D. I. Bertrand S. Cui X. et al . (2020). Fjords as aquatic critical zones (ACZs). Earth-Science Rev.203, 103145. doi: 10.1016/j.earscirev.2020.103145
8
Bintanja R. Andry O. (2017). Towards a rain-dominated Arctic. Nat. Clim Change7, 263–267. doi: 10.1038/nclimate3240
9
Birks H. J. B. Felde V. A. Bjune A. E. Grytnes J.-A. Seppä H. Giesecke T. (2016). Does pollen-assemblage richness reflect floristic richness? A review of recent developments and future challenges. Rev. Palaeobotany Palynology228, 1–25. doi: 10.1016/j.revpalbo.2015.12.011
10
Bischof K. Convey P. Duarte P. Gattuso J.-P. Granberg M. Hop H. et al . (2019). “Kongsfjorden as harbinger of the future Arctic: knowns, unknowns and research priorities,” in The ecosystem of Kongsfjorden, Svalbard. Eds. HopH.WienckeC. (Springer International Publishing, Cham), 537–562. doi: 10.1007/978-3-319-46425-1_14
11
Błachowiak-Samołyk K. Wiktor J. M. Hegseth E. N. Wold A. Falk-Petersen S. Kubiszyn A. M. (2015). Winter Tales: the dark side of planktonic life. Polar Biol.38, 23–36. doi: 10.1007/s00300-014-1597-4
12
Boenigk J. Novarino G. (2004). Effect of suspended clay on the feeding and growth of bacterivorous flagellates and ciliates. Aquat. Microbial Ecol. - AQUAT Microb. Ecol.34, 181–192. doi: 10.3354/ame034181
13
Booth A. Fleck J. Pellerin B. A. Hansen A. Etheridge A. Foster G. M. et al . (2023). “Field techniques for fluorescence measurements targeting dissolved organic matter, hydrocarbons, and wastewater in environmental waters: Principles and guidelines for instrument selection, operation and maintenance, quality assurance, and data reporting,” in US geological survey. Available online at: https://pubs.usgs.gov/publication/tm1D11/full.
14
Carlson R. Simpson J. (1996). A coordinator’s guide to volunteer lake monitoring methods. North American Lake Management Society (NALMS)96, 305.
15
Caroppo C. Pagliara P. Azzaro F. Miserocchi S. Azzaro M. (2017). Late summer phytoplankton blooms in the changing polar environment of the Kongsfjorden (Svalbard, Arctic). Cryptogamie Algologie38, 53–72. doi: 10.7872/crya/v38.iss1.2017.53
16
Chao A. Gotelli N. J. Hsieh T. C. Sander E. L. Ma K. H. Colwell R. K. et al . (2014). Rarefaction and extrapolation with Hill numbers: a framework for sampling and estimation in species diversity studies. Ecol. Monogr.84, 45–67. doi: 10.1890/13-0133.1
17
Chitkara C. Juul-Pedersen T. Krawczyk D. Søreide J. E. Vader A. Gradinger R. et al . (2024). Seasonality in phytoplankton communities and production in three Arctic fjords across a climate gradient. Prog. Oceanography227, 103317. doi: 10.1016/j.pocean.2024.103317
18
Cohen J. Screen J. A. Furtado J. C. Barlow M. Whittleston D. Coumou D. et al . (2014). Recent Arctic amplification and extreme mid-latitude weather. Nat. Geosci.7, 627–637. doi: 10.1038/ngeo2234
19
Comiso J. C. Hall D. K. (2014). Climate trends in the Arctic as observed from space. WIREs Climate Change5, 389–409. doi: 10.1002/wcc.277
20
Dąbrowska A. M. Wiktor J. M. Wiktor J. M. Jr. Kristiansen S. Vader A. Gabrielsen T. (2021). When a year is not enough: Further study of the seasonality of planktonic protist communities structure in an ice-free high Arctic fjord (Adventfjorden, West Spitsbergen). Water13. doi: 10.3390/w13141990
21
Delpech L.-M. Vonnahme T. R. McGovern M. Gradinger R. Præbel K. Poste A. E. (2021). Terrestrial inputs shape coastal bacterial and archaeal communities in a high Arctic fjord (Isfjorden, svalbard). Front. Microbiol.12. doi: 10.3389/fmicb.2021.614634
22
Descamps S. Merkel B. Strøm H. Choquet R. Steen H. Fort J. et al . (2021). Sharing wintering grounds does not synchronize annual survival in a high Arctic seabird, the little auk. Mar. Ecol. Prog. Ser.676, 233–242. doi: 10.3354/meps13400
23
Di Pane J. Bourdaud P. Horn S. Moreno H. D. Meunier C. L. (2024). Global change alters coastal plankton food webs by promoting the microbial loop: An inverse modelling and network analysis approach on a mesocosm experiment. Sci. Total Environ.921, 171272. doi: 10.1016/j.scitotenv.2024.171272
24
Edler L. (1979). Recommendations on methods for marine biological studies in the Baltic Sea. Phytoplankton and chlorophyll (Sweden: Baltic Marine Biologists BMB). Available online at: https://agris.fao.org/agris-search/search.do?recordID=SE8000984.
25
Finne E. A. Varpe Ø. Durant J. M. Gabrielsen G. W. Poste A. E. (2024). Nutrient fluxes from an Arctic seabird colony to the adjacent coastal marine ecosystem. Polar Biol.47, 859–872. doi: 10.1007/s00300-022-03024-5
26
Foissner W. Hawksworth D. L. (2009). Protist diversity and geographical distribution. (Dordrecht, The Netherlands: Springer Science & Business Media).
27
Glibert P. Legrand C. (2006). The diverse nutrient strategies of harmful algae: focus on osmotrophy163–175. doi: 10.1007/978-3-540-32210-8_13
28
Gluchowska M. Kwasniewski S. Prominska A. Olszewska A. Goszczko I. Falk-Petersen S. et al . (2016). Zooplankton in Svalbard fjords on the Atlantic–Arctic boundary. Polar Biol.39, 1785–1802. doi: 10.1007/s00300-016-1991-1
29
Grann-Meyer E. (2020). Chrysochromulina leadbeateri-Understanding the presumed causal agent behind the harmful algal bloom of 2019 (UiT The Arctic University of Norway). Available online at: https://munin.uit.no/handle/10037/19284.
30
Grattepanche J.-D. Vincent D. Breton E. Christaki U. (2011). Microzooplankton herbivory during the diatom–Phaeocystis spring succession in the eastern English Channel. J. Exp. Mar. Biol. Ecol.404, 87–97. doi: 10.1016/j.jembe.2011.04.004
31
Halbach L. Vihtakari M. Duarte P. Everett A. Granskog M. A. Hop H. et al . (2019). Tidewater glaciers and bedrock characteristics control the phytoplankton growth environment in a fjord in the Arctic. Front. Mar. Sci.6. doi: 10.3389/fmars.2019.00254
32
Hawkings J. Wadham J. Tranter M. Telling J. Bagshaw E. Beaton A. et al . (2016). The Greenland Ice Sheet as a hot spot of phosphorus weathering and export in the Arctic. Global Biogeochemical Cycles30, 191–210. doi: 10.1002/2015GB005237
33
Hegseth E. N. Assmy P. Wiktor J. M. Wiktor J. Kristiansen S. Leu E. et al . (2019). “Phytoplankton seasonal dynamics in Kongsfjorden, Svalbard and the adjacent shelf,” in The ecosystem of Kongsfjorden, Svalbard. Eds. HopH.WienckeC. (Springer International Publishing, Cham), 173–227. doi: 10.1007/978-3-319-46425-1_6
34
Hegseth E. N. Tverberg V. (2013). Effect of Atlantic water inflow on timing of the phytoplankton spring bloom in a high Arctic fjord (Kongsfjorden, Svalbard). J. Mar. Syst.113–114, 94–105. doi: 10.1016/j.jmarsys.2013.01.003
35
Henjes J. Assmy P. (2008). Particle availability controls agglutination in pelagic tintinnids in the Southern Ocean. Protist159, 239–250. doi: 10.1016/j.protis.2007.10.003
36
Hill M. O. (1973). Diversity and evenness: A unifying notation and its consequences. Ecology54, 427–432. doi: 10.2307/1934352
37
Hoppe C. J. Wolf K. K. Cottier F. Leu E. Maturilli M. Rost B. (2024). “The effects of biomass depth distribution on phytoplankton spring bloom dynamics and composition in an Arctic fjord,” in Elementa-Sci. Anthrop., vol. 12. Available online at: https://online.ucpress.edu/elementa/article/12/1/00137/203978.
38
Hopwood M. J. Carroll D. Dunse T. Hodson A. Holding J. M. Iriarte J. L. et al . (2020). Review article: How does glacier discharge affect marine biogeochemistry and primary production in the Arctic? Cryosphere14, 1347–1383. doi: 10.5194/tc-14-1347-2020
39
Hörstmann C. Hattermann T. Thomé P. C. Buttigieg P. L. Morel I. Waite A. M. et al . (2024). Biogeographic gradients of picoplankton diversity indicate increasing dominance of prokaryotes in warmer Arctic fjords. Commun. Biol.7, 256. doi: 10.1038/s42003-024-05946-8
40
Hoshiba Y. Matsumura Y. Kanna N. Ohashi Y. Sugiyama S. (2024). Impacts of glacial discharge on the primary production in a Greenlandic fjord. Sci. Rep.14, 15530. doi: 10.1038/s41598-024-64529-z
41
Hovinen J. E. H. (2014). . Foraging, reproduction and survival of the zooplanktivorous seabird Little Auk (Alle alle) in the Arctic in relation to climatic and environmental variability. PhD thesis, Tromsø: UiT The Arctic University of Norway. Available online at: https://munin.uit.no/handle/10037/6385.
42
John U. Šupraha L. Gran-Stadniczenko S. Bunse C. Cembella A. Eikrem W. et al . (2022). Spatial and biological oceanographic insights into the massive fish-killing bloom of the haptophyte Chrysochromulina leadbeateri in northern Norway. Harmful Algae118, 102287. doi: 10.1016/j.hal.2022.102287
43
Kaste Ø. Skarbøvik E. Greipsland I. Gundersen C. B. Austnes K. Skancke L. B. et al . (2018). “The Norwegian river monitoring programme–water quality status and trends 2017,” in NIVA-rapport. Norway: Miljødirektoratet. Available online at: https://niva.brage.unit.no/niva-xmlui/handle/11250/2588692.
44
Konik M. Darecki M. Pavlov A. K. Sagan S. Kowalczuk P. (2021). Darkening of the Svalbard fjords waters observed with satellite ocean color imagery in 1997–2019. Front. Mar. Sci.8, 699318. doi: 10.3389/fmars.2021.699318
45
Kubiszyn A. M. Piwosz K. Wiktor J. M. Wiktor J. M. (2014). The effect of inter-annual Atlantic water inflow variability on the planktonic protist community structure in the West Spitsbergen waters during the summer. J. Plankton Res.36, 1190–1203. doi: 10.1093/plankt/fbu044
46
Kubiszyn A. M. Wiktor J. M. (2016). The Gymnodinium and Gyrodinium (Dinoflagellata: Gymnodiniaceae) of the West Spitsbergen waters, (1999–2010): biodiversity and morphological description of unidentified species. Polar Biol.39, 1739–1747. doi: 10.1007/s00300-015-1764-2
47
Kubiszyn A. M. Wiktor J. M. Wiktor J. M. Griffiths C. Kristiansen S. Gabrielsen T. M. (2017). The annual planktonic protist community structure in an ice-free high Arctic fjord (Adventfjorden, West Spitsbergen). J. Mar. Syst.169, 61–72. doi: 10.1016/j.jmarsys.2017.01.013
48
Kuliński K. Kędra M. Legeżyńska J. Gluchowska M. Zaborska A. (2014). Particulate organic matter sinks and sources in high Arctic fjord. J. Mar. Syst.139, 27–37. doi: 10.1016/j.jmarsys.2014.04.018
49
Kvernvik A. C. Hoppe C. J. M. Greenacre M. Verbiest S. Wiktor J. M. Gabrielsen T. M. et al . (2021). Arctic sea ice algae differ markedly from phytoplankton in their ecophysiological characteristics. Mar. Ecol. Prog. Ser.666, 31–55. doi: 10.3354/meps13675
50
Lacour T. Larivière J. Babin M. (2017). Growth, Chl a content, photosynthesis, and elemental composition in polar and temperate microalgae. Limnol. Oceanogr.62, 43–58. doi: 10.1002/lno.10369
51
Lampe V. Nöthig E.-M. Schartau M. (2021). Spatio-temporal variations in community size structure of Arctic protist plankton in the Fram Strait. Front. Mar. Sci.7, 579880. doi: 10.3389/fmars.2020.579880
52
Lee H. Calvin K. Dasgupta D. Krinner G. Mukherji A. Thorne P. et al . (2023). “IPCC 2023: climate change 2023: synthesis report, summary for policymakers,” in Contribution of working groups I, II and III to the sixth assessment report of the intergovernmental panel on climate change. Eds. LeeH.RomeroJ. (IPCC, Geneva, Switzerland). Available online at: https://mural.maynoothuniversity.ie/17886/.
53
Legendre P. Anderson M. J. (1999). Distance-based redundancy analysis: testing multispecies responses in multifactorial ecological experiments. Ecol. Monogr.69, 1–24. doi: 10.1890/0012-9615(1999)069[0001:DBRATM]2.0.CO;2
54
Levinsen H. Nielsen T. G. (2002). The trophic role of marine pelagic ciliates and heterotrophic dinoflagellates in Arctic and temperate coastal ecosystems: A cross-latitude comparison. Limnol. Oceanogr.47, 427–439. doi: 10.4319/lo.2002.47.2.0427
55
Li W. K. W. McLaughlin F. A. Lovejoy C. Carmack E. C. (2009). Smallest algae thrive as the Arctic Ocean freshens. Science326, 539–539. doi: 10.1126/science.1179798
56
Lovejoy C. Vincent W. F. Bonilla S. Roy S. Martineau M. Terrado R. et al . (2007). Distribution, phylogeny, and growth of cold-adapted picoprasinophytes in Arctic seas. J. Phycology43, 78–89. doi: 10.1111/j.1529-8817.2006.00310.x
57
Majchrowska E. Ignatiuk D. Jania J. Marszałek H. Wąsik M. (2015). Seasonal and interannual variability in runoff from the Werenskioldbreen catchment, Spitsbergen. Polish Polar Res.197–224, 197224. doi: 10.1515/popore-2015-0014
58
Marquardt M. Vader A. Stübner E. I. Reigstad M. Gabrielsen T. M. (2016). Strong seasonality of marine microbial eukaryotes in a high-Arctic fjord (Isfjorden, in west spitsbergen, Norway). Appl. Environ. Microbiol.82, 1868–1880. doi: 10.1128/AEM.03208-15
59
McCrystall M. R. Stroeve J. Serreze M. Forbes B. C. Screen J. A. (2021). New climate models reveal faster and larger increases in Arctic precipitation than previously projected. Nat. Commun.12, 6765. doi: 10.1038/s41467-021-27031-y
60
McGovern M. Pavlov A. K. Deininger A. Granskog M. A. Leu E. Søreide J. E. et al . (2020). Terrestrial inputs drive seasonality in organic matter and nutrient biogeochemistry in a high Arctic fjord system (Isfjorden, Svalbard). Front. Mar. Sci.7. doi: 10.3389/fmars.2020.542563
61
Meire L. Mortensen J. Rysgaard S. Bendtsen J. Boone W. Meire P. et al . (2016). Spring bloom dynamics in a subarctic fjord influenced by tidewater outlet glaciers (Godthåbsfjord, SW Greenland). JGR Biogeosciences121, 1581–1592. doi: 10.1002/2015JG003240
62
Meire L. Paulsen M. L. Meire P. Rysgaard S. Hopwood M. J. Sejr M. K. et al . (2023). Glacier retreat alters downstream fjord ecosystem structure and function in Greenland. Nat. Geosci.16, 671–674. doi: 10.1038/s41561-023-01218-y
63
Mendes C. R. B. Costa R. R. Ferreira A. Jesus B. Tavano V. M. Dotto T. S. et al . (2023). Cryptophytes: An emerging algal group in the rapidly changing Antarctic Peninsula marine environments. Global Change Biol.29, 1791–1808. doi: 10.1111/gcb.16602
64
Meshram A. R. Vader A. Kristiansen S. Gabrielsen T. M. (2017). Microbial eukaryotes in an Arctic under-ice spring bloom north of Svalbard. Front. Microbiol.8. doi: 10.3389/fmicb.2017.01099
65
Montagnes D. Lynn D. (1993). A quantitative protargol stain (QPS) for ciliates and other protists. Handb. Methods Aquat. Microb. Ecol.27, 229–240. doi: 10.1201/9780203752746-28
66
Moreira-Turcq P. F. Cauwet G. Martin J. M. (2001). Contribution of flow cytometry to estimate picoplankton biomass in estuarine systems. Hydrobiologia462, 157–168. doi: 10.1023/A:1013138317897
67
Nejstgaard J. C. Tang K. W. Steinke M. Dutz J. Koski M. Antajan E. et al . (2007). Zooplankton grazing on Phaeocystis: a quantitative review and future challenges. Biogeochemistry83, 147–172. doi: 10.1007/s10533-007-9098-y
68
Nilsen F. Cottier F. Skogseth R. Mattsson S. (2008). Fjord–shelf exchanges controlled by ice and brine production: The interannual variation of Atlantic Water in Isfjorden, Svalbard. Continental Shelf Res.28, 1838–1853. doi: 10.1016/j.csr.2008.04.015
69
Nöthig E.-M. Bracher A. Engel A. Metfies K. Niehoff B. Peeken I. et al . (2015). Summertime plankton ecology in Fram Strait—a compilation of long- and short-term observations. Polar Res.34, 23349. doi: 10.3402/polar.v34.23349
70
Nyeggen M. U. (2019). Seasonal zooplankton dynamics in Svalbard coastal waters: The shifting dominance of mero-and holoplankton and timing of reproduction in three species of Copepoda (The University of Bergen). Available online at: https://bora.uib.no/bora-xmlui/handle/1956/20058.
71
Oksanen J. Blanchet F. G. Friendly M. Kindt R. Legendre P. McGlin D. et al . (2017). Vegan: Community Ecology Package. R package version 2.4-3.
72
Olenina I. (2006). Biovolumes and size-classes of phytoplankton in the Baltic Sea. Available online at: https://epic.awi.de/id/eprint/30141/1/bsep106.pdf (Accessed March 26, 2025).
73
Orkney A. Platt T. Narayanaswamy B. E. Kostakis I. Bouman H. A. (2020). Bio-optical evidence for increasing Phaeocystis dominance in the Barents Sea. Phil. Trans. R. Soc A.378, 20190357. doi: 10.1098/rsta.2019.0357
74
Osborne E. Richter-Menge J. Jeffries M. (2018). Arctic Report Card 2018: Effects of persistent Arctic warming continue to mount. Online: www.arctic.noaa.gov/Report-Card (Accessed January 3, 2024).
75
Parsons T. R. (2013). A manual of chemical & biological methods for seawater analysis. Elsevier. Available online at: https://books.google.com/books?hl=pl&lr=&id=ilAvBQAAQBAJ&oi=fnd&pg=PP1&dq=Parsons,+T.+R.+(2013).+A+Manual+of+Chemical+%26+Biological+Methods+for+Seawater+Analysis.+Kent:+Elsevier&ots=Z8aGpJw-rZ&sig=6bWzp8y_fvzS-rGktfKE5ykVEmY (Accessed March 26, 2025).
76
Paulsen M. L. Nielsen S. E. B. Müller O. Møller E. F. Stedmon C. A. Juul-Pedersen T. et al . (2017). Carbon bioavailability in a high Arctic fjord influenced by glacial meltwater, NE Greenland. Front. Mar. Sci.4. doi: 10.3389/fmars.2017.00176
77
Piquet A. M.-T. van de Poll W. H. Visser R. J. W. Wiencke C. Bolhuis H. Buma A. G. J. (2014). Springtime phytoplankton dynamics in Arctic Krossfjorden and Kongsfjorden (Spitsbergen) as a function of glacier proximity. Biogeosciences11, 2263–2279. doi: 10.5194/bg-11-2263-2014
78
Piwosz K. Spich K. Całkiewicz J. Weydmann A. Kubiszyn A. M. Wiktor J. M. (2015). Distribution of small phytoflagellates along an Arctic fjord transect. Environ. Microbiol.17, 2393–2406. doi: 10.1111/1462-2920.12705
79
Piwosz K. Walkusz W. Hapter R. Wieczorek P. Hop H. Wiktor J. (2009). Comparison of productivity and phytoplankton in a warm (Kongsfjorden) and a cold (Hornsund) Spitsbergen fjord in mid-summer 2002. Polar Biol.32, 549–559. doi: 10.1007/s00300-008-0549-2
80
Pogojeva M. Polukhin A. Makkaveev P. Staalstrøm A. Berezina A. Yakushev E. (2022). Arctic inshore biogeochemical regime influenced by coastal runoff and glacial melting (Case study for the Templefjord, Spitsbergen). Geosciences12, 44. doi: 10.3390/geosciences12010044
81
Preisendorfer R. W. (1986). Secchi disk science: Visual optics of natural waters 1. Limnol. Oceanogr.31, 909–926. doi: 10.4319/lo.1986.31.5.0909
82
Proshutinsky A. Krishfield R. Timmermans M. Toole J. Carmack E. McLaughlin F. et al . (2009). Beaufort Gyre freshwater reservoir: State and variability from observations. J. Geophys. Res.114, 2008JC005104. doi: 10.1029/2008JC005104
83
Ray J. L. Althammer J. Skaar K. S. Simonelli P. Larsen A. Stoecker D. et al . (2016). Metabarcoding and metabolome analyses of copepod grazing reveal feeding preference and linkage to metabolite classes in dynamic microbial plankton communities. Mol. Ecol.25, 5585–5602. doi: 10.1111/mec.13844
84
R Core Team (2024). R: A Language and Environment for Statistical Computing. Vienna: R Foundation for Statistical Computing. Available online at: https://www.r-project.org/.
85
Ribeiro C. G. Lopes Dos Santos A. Trefault N. Marie D. Lovejoy C. Vaulot D. (2024). Arctic phytoplankton microdiversity across the marginal ice zone: Subspecies vulnerability to sea-ice loss. Elem Sci. Anth12, 00109. doi: 10.1525/elementa.2023.00109
86
Rokkan Iversen K. Seuthe L. (2011). Seasonal microbial processes in a high-latitude fjord (Kongsfjorden, Svalbard): I. Heterotrophic bacteria, picoplankton and nanoflagellates. Polar Biol.34, 731–749. doi: 10.1007/s00300-010-0929-2
87
Rousseau V. Becquevort S. Parent J.-Y. Gasparini S. Daro M.-H. Tackx M. et al . (2000). Trophic efficiency of the planktonic food web in a coastal ecosystem dominated by Phaeocystis colonies. J. Sea Res.43, 357–372. doi: 10.1016/S1385-1101(00)00018-6
88
Rousseau V. Vaulot D. Casotti R. Cariou V. Lenz J. Gunkel J. et al . (1994). The life cycle of Phaeocystis (Prymnesiophycaea): evidence and hypotheses. J. Mar. Syst.5, 23–39. doi: 10.1016/0924-7963(94)90014-0
89
Ryderheim F. Hansen P. J. Kiørboe T. (2022). Predator field and colony morphology determine the defensive benefit of colony formation in marine phytoplankton. Front. Mar. Sci.9, 829419. doi: 10.3389/fmars.2022.829419
90
Sakshaug E. Skjoldal H. R. (1989). “Life at the ice edge,” in Ambio, vol. 18, 60–67. (Sweden). Available online at: https://agris.fao.org/search/en/providers/122495/records/647751cbf2e6fe92b364c24e.
91
Sejr M. K. Bruhn A. Dalsgaard T. Juul-Pedersen T. Stedmon C. A. Blicher M. et al . (2022). Glacial meltwater determines the balance between autotrophic and heterotrophic processes in a Greenland fjord. Proc. Natl. Acad. Sci.119, e2207024119. doi: 10.1073/pnas.2207024119
92
Seuthe L. Rokkan Iversen K. Narcy F. (2011). Microbial processes in a high-latitude fjord (Kongsfjorden, Svalbard): II. Ciliates and dinoflagellates. Polar Biol.34, 751–766. doi: 10.1007/s00300-010-0930-9
93
Sherr E. B. Sherr B. F. (1987). High rates of consumption of bacteria by pelagic ciliates. Nature325, 710–711. doi: 10.1038/325710a0
94
Skogseth R. Ellingsen P. G. (2019). Mooring data from the Isfjorden mouth—North (IN) during 5 Oct 2017 to 24 Aug 2018. Norwegian Polar Institute. doi: 10.21334/npolar.2019.e9106051
95
Skogseth R. Olivier L. L. A. Nilsen F. Falck E. Fraser N. Tverberg V. et al . (2020). Variability and decadal trends in the Isfjorden (Svalbard) ocean climate and circulation – An indicator for climate change in the European Arctic. Prog. Oceanography187, 102394. doi: 10.1016/j.pocean.2020.102394
96
Smoła Z. T. Tatarek A. Wiktor J. M. Wiktor J. M. Kubiszyn A. Węsławski J. M. (2017). Primary producers and production in Hornsund and Kongsfjorden–comparison of two fjord systems. Polish Polar Res., 351–373. doi: 10.1515/popore-2017-0013
97
Sørensen N. Daugbjerg N. Gabrielsen T. M. (2012). Molecular diversity and temporal variation of picoeukaryotes in two Arctic fjords, Svalbard. Polar Biol.35, 519–533. doi: 10.1007/s00300-011-1097-8
98
Stoecker D. K. Gifford D. J. Putt M. (1994). Preservation of marine planktonic ciliates: losses and cell shrinkage during fixation. Mar. Ecol. Prog. Ser., 293–299. doi: 10.3354/meps110293
99
Stoecker D. K. Lavrentyev P. J. (2018). Mixotrophic plankton in the polar seas: A pan-Arctic review. Front. Mar. Sci.5. doi: 10.3389/fmars.2018.00292
100
Susort Å. (2025). Mamiellophyceae abundance and species composition in relation to atlantification in a High-Arctic time series (IsA, Svalbard) (NTNU). Available online at: https://ntnuopen.ntnu.no/ntnu-xmlui/handle/11250/3204692.
101
Svendsen H. Beszczynska-Møller A. Hagen J. O. Lefauconnier B. Tverberg V. Gerland S. et al . (2002). The physical environment of Kongsfjorden–Krossfjorden, an Arctic fjord system in Svalbard. Polar Res.21, 133–166. doi: 10.3402/polar.v21i1.6479
102
Szeligowska M. Trudnowska E. Boehnke R. Dąbrowska A. M. Dragańska-Deja K. Deja K. et al . (2021). The interplay between plankton and particles in the Isfjorden waters influenced by marine- and land-terminating glaciers. Sci. Total Environ.780, 146491. doi: 10.1016/j.scitotenv.2021.146491
103
Szeligowska M. Trudnowska E. Boehnke R. Dąbrowska A. M. Wiktor J. M. Sagan S. et al . (2020). Spatial patterns of particles and plankton in the warming Arctic fjord (Isfjorden, West Spitsbergen) in seven consecutive mid-summers (2013–2019). Front. Mar. Sci.7. doi: 10.3389/fmars.2020.00584
104
Szymański W. Zwolicki A. Zmudczyńska-Skarbek K. Stempniewicz L. (2023). Impact of planktivorous little auks (Alle alle) on soil organic matter in Spitsbergen, High Arctic. Available online at: https://ruj.uj.edu.pl/entities/publication/f9ad94c9-6700-407e-abdb-b3358504cf90 (Accessed April 3, 2025).
105
Thackeray S. J. Henrys P. A. Hemming D. Bell J. R. Botham M. S. Burthe S. et al . (2016). Phenological sensitivity to climate across taxa and trophic levels. Nature535, 241–245. doi: 10.1038/nature18608
106
Tůmová M. Jílková V. Macek P. Devetter M. (2024). Tardigrade distribution in soils of high Arctic habitats. Ecol. Evol.14, e11386. doi: 10.1002/ece3.11386
107
Utermöhl H. (1958). Zur Vervollkommnung der quantitativen Phytoplankton-Methodik: Mit 1 Tabelle und 15 abbildungen im Text und auf 1 Tafel. SIL Communications 1953-19969, 1–38. doi: 10.1080/05384680.1958.11904091
108
Vader A. Chitkara C. Ericson Y. Marquardt M. Gabrielsen T. M. Thompson S. et al . (2024). Nutrients from the marine ISA time series station in Svalbard. [Data set]. doi: 10.11582/2024.00003
109
Vader A. Chitkara C. Marquardt M. Søreide J. E. Gabrielsen T. M. (2020). ISA_Svalbard_Chlorophyll_A_2011_2019. doi: 10.11582/2020.00063
110
Vader A. Handler E. Skogseth R. Larsen A. Gabrielsen T. M. (2025). Seasonality and interannual variability of an Arctic marine time series, IsA. Arctic Sci.11, 1–17. doi: 10.1139/as-2024-0044
111
Vader A. Marquardt M. Meshram A. R. Gabrielsen T. M. (2015). Key Arctic phototrophs are widespread in the polar night. Polar Biol.38, 13–21. doi: 10.1007/s00300-014-1570-2
112
van Pelt W. J. J. Kohler J. Liston G. E. Hagen J. O. Luks B. Reijmer C. H. et al . (2016). Multidecadal climate and seasonal snow conditions in Svalbard. J. Geophysical Research: Earth Surface121, 2100–2117. doi: 10.1002/2016JF003999
113
Vereide E. H. (2019). Seasonal zooplankton community patterns along a gradient from land to sea in Isfjorden, Svalbard. Available online at: https://www.duo.uio.no/bitstream/handle/10852/74253/1/MSc-Thesis-2019-Emilie-Hernes-Vereide.pdf (Accessed March 26, 2025).
114
Vihtakari M. (2019). PlotSvalbard: PlotSvalbard-Plot research data from Svalbard on maps. R package version 0.8.0. Available online at: https://github.com/MikkoVihtakari/PlotSvalbard.
115
Wei Y. Cui Z. Wang X. Teng G. Qu K. Sun J. (2022). Comparative analysis of total and size-fractionated chlorophyll a in the Yellow Sea and Western Pacific. Front. Microbiol.13, 903159. doi: 10.3389/fmicb.2022.903159
116
Wei T. Simko V. (2017). R package “corrplot”: visualization of a correlation matrix (Version 0.84). Available online at: https://github.com/taiyun/corrplot (Accessed May 15, 2025).
117
Weisse T. Sonntag B. Witzany G. (2016). “Ciliates in planktonic food webs: communication and adaptive response,” in Biocommunication of ciliates Eds. WitzanyG.NowackiM. (Springer International Publishing), 351–372, (Cham). doi: 10.1007/978-3-319-32211-7_19
118
Zhang F. Cao S. Gao Y. He J. (2019). “Distribution and environmental correlations of picoeukaryotes in an Arctic fjord (Kongsfjorden, Svalbard) during the summer,” in Polar Res. Available online at: https://polarresearch.net/index.php/polar/article/view/3390.
119
Zmudczyńska K. Olejniczak I. Zwolicki A. Iliszko L. Convey P. Stempniewicz L. (2012). Influence of allochtonous nutrients delivered by colonial seabirds on soil collembolan communities on Spitsbergen. Polar Biol.35, 1233–1245. doi: 10.1007/s00300-012-1169-4
120
Zwolicki A. Zmudczyńska-Skarbek K. M. Iliszko L. Stempniewicz L. (2013). Guano deposition and nutrient enrichment in the vicinity of planktivorous and piscivorous seabird colonies in Spitsbergen. Polar Biol.36, 363–372. doi: 10.1007/s00300-012-1265-5
Summary
Keywords
European Arctic, phytoplankton succession, flagellated protists, nanoplankton blooms, Chrysochromulina , warming impact, turbidity effects, nutrient dynamics
Citation
Dąbrowska AM, McGovern M, Mazurkiewicz M and Poste A (2025) Seasonal patterns and environmental drivers of protistan plankton along a terrestrial–marine gradient in Isfjorden (Svalbard). Front. Mar. Sci. 12:1631963. doi: 10.3389/fmars.2025.1631963
Received
20 May 2025
Accepted
25 August 2025
Published
18 September 2025
Volume
12 - 2025
Edited by
Erin Kunisch, Norwegian University of Science and Technology, Norway
Reviewed by
Maria Lund Paulsen, Ministry of Environment (Denmark), Denmark
Miriam Marquardt, UiT The Arctic University of Norway, Norway
Updates
Copyright
© 2025 Dąbrowska, McGovern, Mazurkiewicz and Poste.
This is an open-access article distributed under the terms of the Creative Commons Attribution License (CC BY). The use, distribution or reproduction in other forums is permitted, provided the original author(s) and the copyright owner(s) are credited and that the original publication in this journal is cited, in accordance with accepted academic practice. No use, distribution or reproduction is permitted which does not comply with these terms.
*Correspondence: Anna Maria Dąbrowska, dabrowska@iopan.pl; Maeve McGovern, maeve.mcgovern@niva.no
Disclaimer
All claims expressed in this article are solely those of the authors and do not necessarily represent those of their affiliated organizations, or those of the publisher, the editors and the reviewers. Any product that may be evaluated in this article or claim that may be made by its manufacturer is not guaranteed or endorsed by the publisher.