Abstract
This study investigates the seasonal and spatial variability of hydrochemical parameters and organic carbon pools between the South Andaman Islands (SAI) and North Andaman Islands (NAI) under contrasting monsoonal regimes. Seawater temperature (26.1 – 33.5°C) was consistently higher in SAI due to reef-associated stratification, while NAI exhibited greater variability. Salinity (25.2 – 35.9) and pH were more stable in SAI, whereas NAI showed lower values and higher variability driven by freshwater inputs from the Bay of Bengal river systems. Turbidity and dissolved inorganic nutrients (DIN, DIP, DSi) were significantly higher in NAI, reflecting strong terrestrial and riverine influence. Dissolved organic carbon (DOC; 103 – 772 µM) and particulate organic carbon (POC; 22 – 168 µM) concentrations were consistently higher in NAI, particularly during the spring intermonsoon (SIM) and northeast monsoon (NEM), while SAI exhibited lower but more variable concentrations linked to reef metabolism. Seasonal drivers included freshwater and terrestrial inputs enhancing DOC during SIM and NEM, and monsoon-induced mixing reducing concentrations during the southwest monsoon (SWM). POC levels were enriched in NAI throughout, whereas SAI showed greater variability related to reef-derived particulate cycling. The POC: DOC ratio (0.04 – 0.83) highlighted contrasting biogeochemical regimes, with NAI dominated by particulate-rich terrestrial inputs and SAI characterized by variable phytoplankton- and reef-driven processes. These findings emphasize the role of monsoonal forcing in shaping carbon dynamics across the Andaman Islands and the contrasting influence of terrestrial inputs in NAI versus reef-associated processes in SAI, with implications for regional carbon cycling and ecosystem functioning.
1 Introduction
Marine ecosystems, which are vital for sustaining tropical island environments, depend on energy flow and complex ecological interactions (Hutchinson, 1959; Odum, 1971; Paine, 1980; Osterholz et al., 2021). Oceanic and coastal ecosystems provide essential benefits to human societies, including fisheries, aquaculture, water purification, shoreline protection, and recreational opportunities (Barbier et al., 2008; Halpern et al., 2012; Narayan et al., 2016; Sachithanandam et al., 2022). In recent decades, rapid changes in these ecosystems, driven largely by climate change, have negatively impacted tropical island populations and marine biodiversity (Hutchinson, 1959; Sachithanandam et al., 2020). Coastal regions are dynamic environments that play a critical role in the cycling of dissolved organic carbon (DOC) and particulate organic carbon (POC), which directly influence nutrient availability (Osterholz et al., 2021). Coral reefs, among the world’s most productive ecosystems, release carbon-rich organic material that fuels biogeochemical processes and promotes rapid nutrient recycling (Naumann et al., 2012). However, these ecosystems face increasing threats from rising seawater temperatures, cyclones, droughts, and invasive species, highlighting the urgent need for monitoring and conservation (Sachithanandam et al., 2022). Nearshore coastal ecosystems, enriched by light availability and terrestrial nutrient runoff, are particularly important for DOC and POC cycling in tropical island settings (Osterholz et al., 2021). Despite this, the impacts of climate change on ocean biogeochemistry and organic carbon cycling remain uncertain, underscoring the importance of long-term observations in dynamic systems such as the Andaman Sea (Sachithanandam et al., 2020).
The Andaman Sea (AS), located in the northeastern Indian Ocean and bordered by Myanmar, Thailand, and Malaysia, is a semi-enclosed basin that exchanges water dynamically with the Bay of Bengal (BoB) through the Preparis, Ten Degree, and Great Channels (Sachithanandam et al., 2013, 2022). Seasonal inflow and outflow between the BoB and AS regulate the water column structure and properties (Kiran, 2017; Liao et al., 2020; Sachithanandam et al., 2022). The region receives substantial precipitation during the South Asian monsoon seasons, along with freshwater discharge from the Irrawaddy and Salween Rivers, which lowers surface salinity and contributes to the formation of a barrier layer (Sprintall and Tomczak, 1992; Varkey et al., 1996). The BoB hosts one of the most extensive oxygen minimum zones (OMZs) in the tropics, primarily due to the decomposition of organic matter and the microbial consumption of dissolved organic matter (DOM), processes further intensified by the barrier layer (Paulmier and Ruiz-Pino, 2009). Despite the ecological importance of this region, research on DOC and POC dynamics in the Andaman Sea remains limited compared to the more extensively studied coastal waters of the BoB (Sachithanandam et al., 2022). This study aims to examine seasonal changes in the characteristics of organic carbon in the nearshore coastal waters of the Andaman and Nicobar Islands (ANI). Particular focus is given to the influence of terrestrial inputs from the northern BoB and the role of coral reefs in the ANI. The study further seeks to provide baseline information and improve the understanding of carbon biogeochemistry in this ecologically sensitive tropical island system.
2 Materials and methods
2.1 Study area
The Andaman and Nicobar Islands (ANI), spanning from 92° to 94° Longitude (E) and 6° to 14° Latitude (N), comprise 572 tropical islands, constituting approximately 30% (0.60 million sq. km) of the Indian exclusive economic zone (EEZ) in the Bay of Bengal (BoB) (Figure 1). The ANI’s EEZ contributes around 10% of the total Indian EEZ’s potential fishery resources (Sachithanandam et al., 2012). Covering a total land area of approximately 8,249 km2, the ANI features tropical evergreen rainforests and diverse marine ecosystems, including coral reefs, seagrasses, seaweeds, and mangroves (Sachithanandam et al., 2012; Sarkar and Ghosh, 2013). The summer monsoon typically arrives earlier on the ANI than on the mainland India, starting in Maywith the high-precipitation season usually over by early July (Fasullo and Webster, 2003; Sachithanandam et al., 2013, 2014; ANI, 2017; Sachithanandam et al., 2020). The rainy season lasts around 8 - 9 months, with an average annual rainfall of 3,100 mm, with about 95% of this precipitation occurring between May and December (2,935 mm) (Karthik et al., 2017; Sachithanandam et al., 2020).
Figure 1
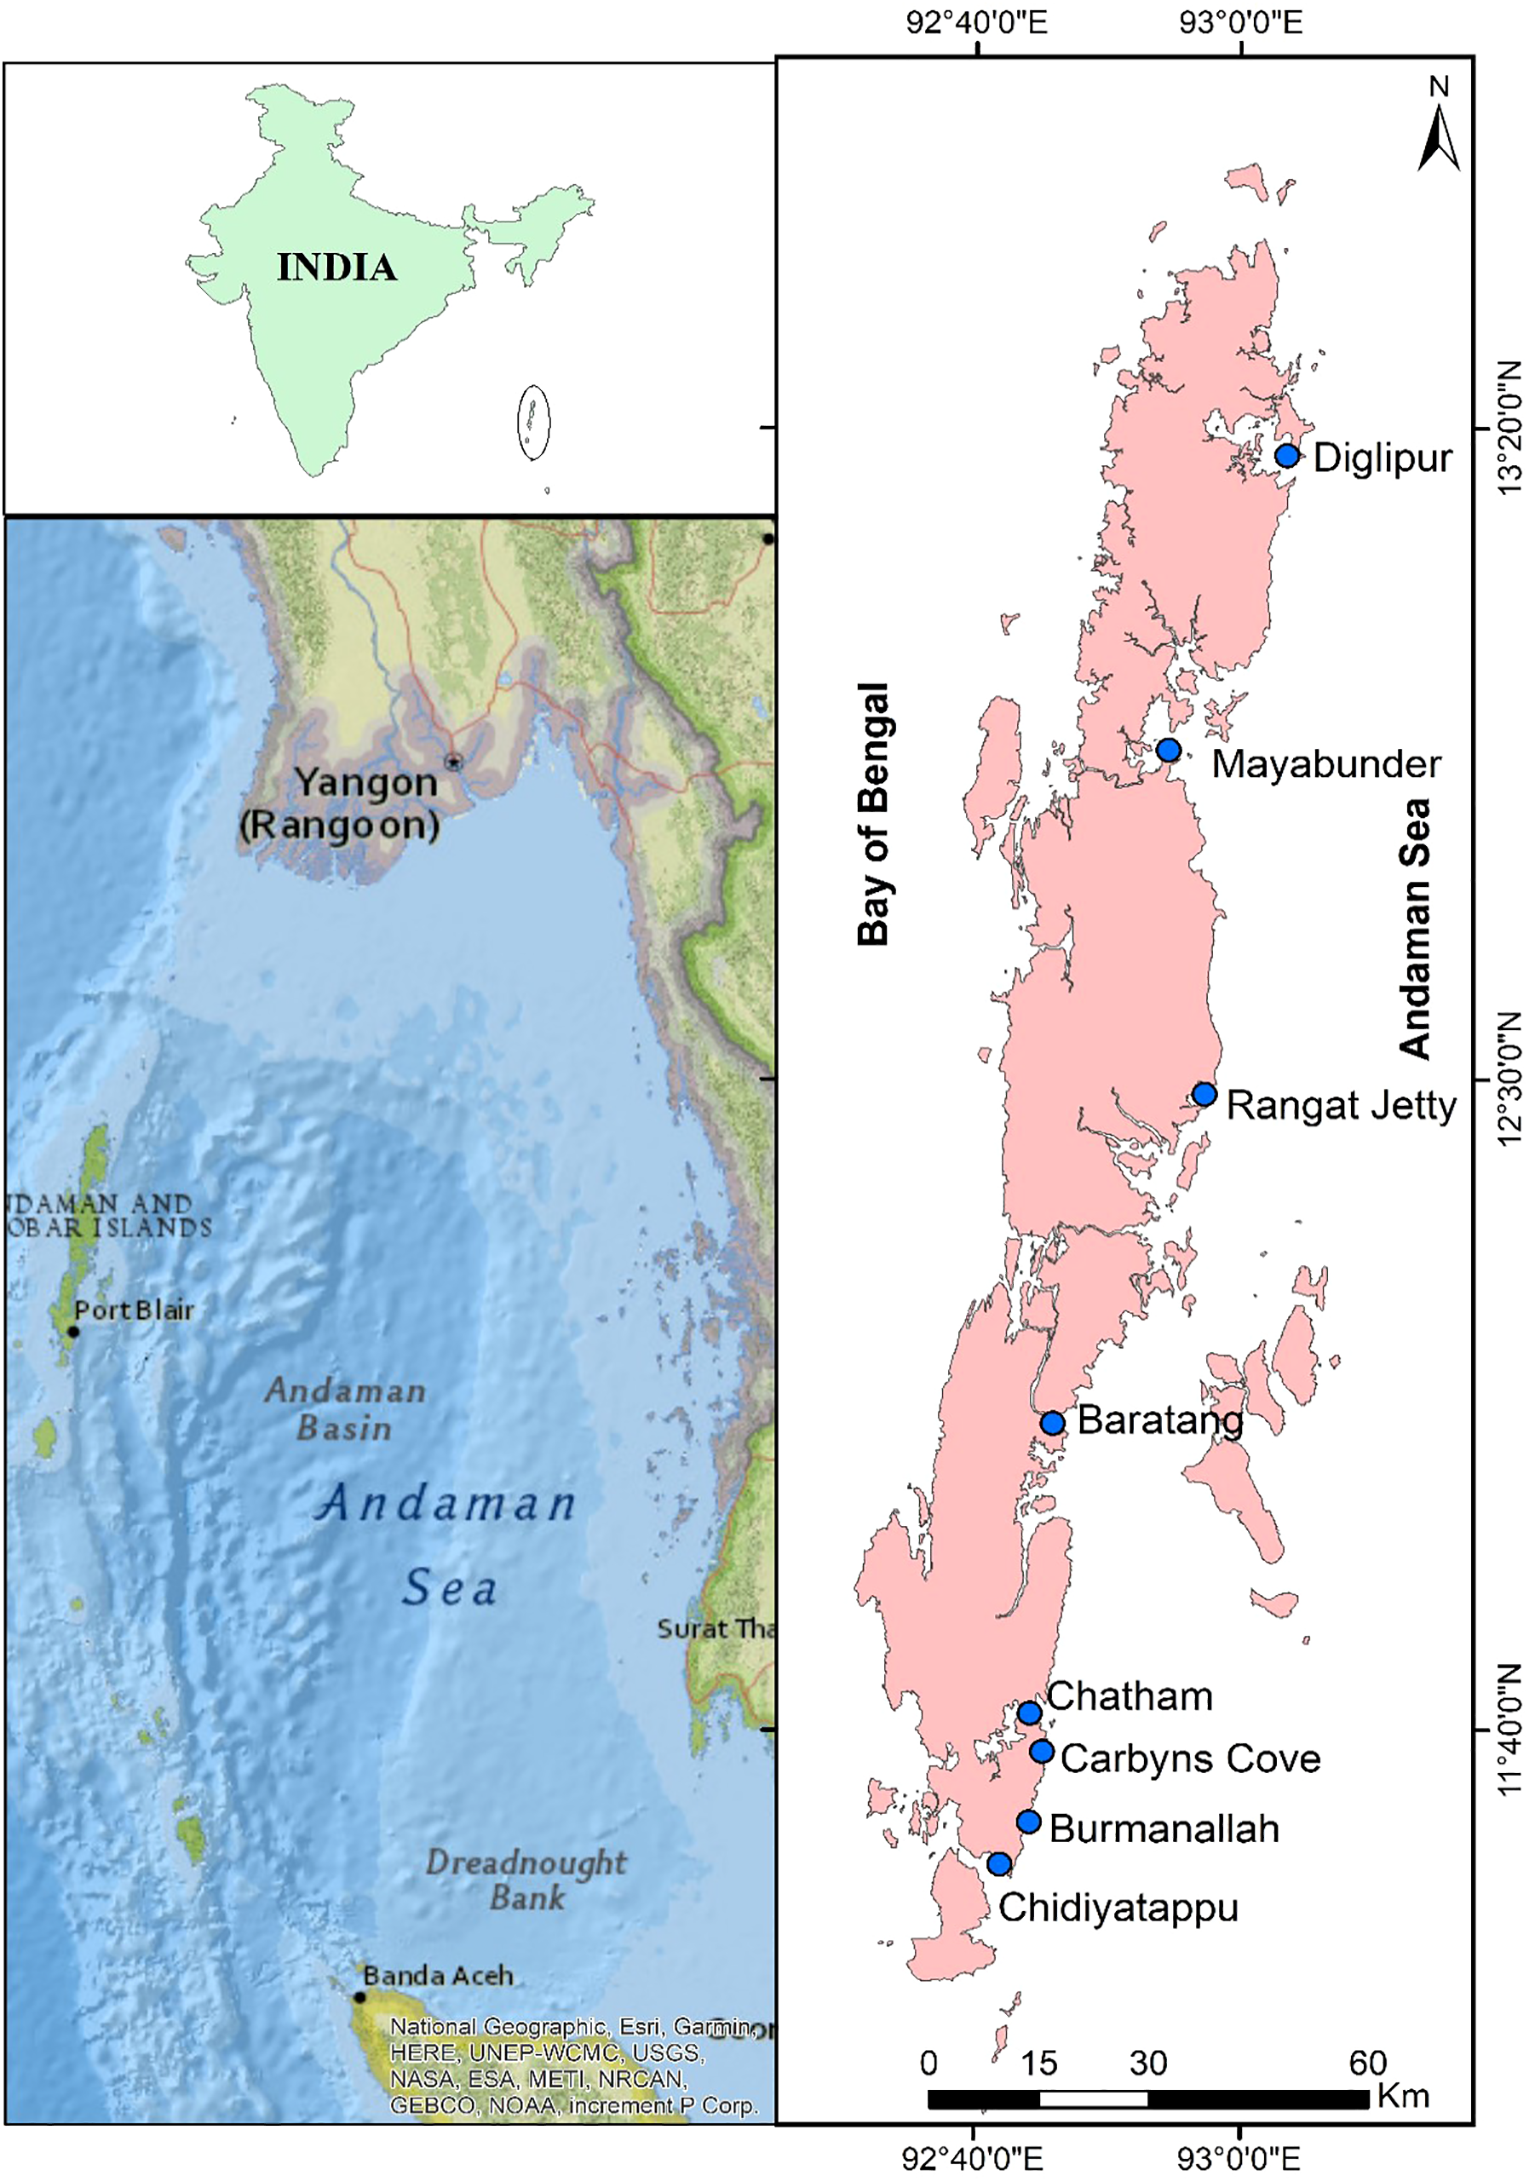
Study area and sampling stations.
The Andaman Islands, formed by the uplift of the Sunda Trench accretionary prism, consist of late Cretaceous to Miocene sedimentary rocks atop ophiolitic volcanic and basalts (Sachithanandam et al., 2014). These sedimentary rocks, primarily delivered by the Irrawaddy River, result from the Himalayan orogeny (Garzanti et al., 2013; Pargaonkar and Vinayachandran, 2022). The Indo-Burman Ranges (IBR) in the north to the Nicobar fan in the south are covered by sediments with similar composition and zircon ages (Kumar et al., 2007; Allen et al., 2008; McNeill et al., 2017). Neogene Archipelago group sandstones, chalk, and limestones deposited on the slope can be found on the smaller surrounding islands with abundant coral reefs. The ANI remains mostly undisturbed, with dense rainforests extending to the beaches and coral reefs, as the islands are sparsely populated, with most development centered around Port Blair, the capital (Sachithanandam et al., 2020; ANI, 2017). Mangrove forests and glades are present next to the reefs in low-lying areas, offering a rare opportunity to study the baseline data generation of dissolved organic carbon (DOC) and particulate organic carbon (POC) in virtually undisturbed reef ecosystems of the Andaman Islands. For this study, eight stations were selected to cover the coastlines of the Andaman Sea (AS) from the South Andaman Islands (SAI) to the North Andaman Islands (NAI). Figure 1 illustrates the map of the stations investigated. The SAI are represented by four study sites: (i) Chidiyatappu, (ii) Burmanallah, (iii) Carbyns Cove, and (iv) Chatham. The remaining four study sites fall under the NAI, namely (v) Barantang, (vi) Rangat Jetty, (vii) Mayabunder, and (viii) Diglipur.
2.2 Sampling and methods
Samples were collected with seasonally representing Spring Inter Monsoon (SIM), South West Monsoon (SWM) and North East Monsoon (NEM) during the year 2014 to 2015 from the surface and subsurface (15m) depth water regions of the tropical islands ecosystem from the North Andaman to the South Andaman (Figure 1) by using Niskin water sampler. For the hydrographi data in situ continuous profiles of temperature, pH, salinity, turbidity, and depth were measured using Quanta Hydrolab (USA) sensors. For nutrients samples were collected in plastic bottles immediately filtered through GF/F filter and frozen subsequently, analyzed for nitrate, nitrite, ammonium, silicate, and phosphate using wet-chemistry methods as described by APHA (2005). For the determination of Dissolved organic carbon (DOC) samples prefiltered through a GF/F filter were analyzed using a Total Organic Carbon Analyzer (Shimadzu TOC-VCSH) with a precision of ±0.5%. About 25 mL of the filtered sample was collected in pre-combusted glass vials, acidified with 10% ortho-phosphoric acid (to remove the dissolved inorganic carbon), and used for the analysis of DOC. The accuracy of DOC measurements was checked with CRM (supplied by Dr. D. Hansell, University of Miami, USA) and with internal standards prepared using potassium hydrogen phthalate (0 – 2 mg L−1). For the determination of particulate organic carbon (POC) followed Martin’s (1993) protocol. The residue-laden filter paper (GF/F), pre combusted at 450°C from seawater filtration was stored at -20°C until further processing. Subsequently, the sample filters were dried, positioned on the combusted glass petri plates, and subjected to acidification overnight in a desiccator using saturated HCl fumes. To achieve saturation, an open container of HCl was placed at the bottom of the desiccator. Following acidification, the HCl was removed, and the samples were dried for 48 hours at 60°C. The total filter weight was measured, considering that half of the 25mm filter was approximated. The percentage of the filter paper analyzed was then calculated. The portion of the filter paper earmarked for analysis was folded with the sample facing outward and compacted into a 9 x 10mm tin capsule. Finally, the samples underwent analysis using the CHNO Analyzer in accordance with the manufacturer’s instructions (Make: Thermo-Flash, 2000CHNS/O Analyzers). The analytical precision for the estimation of C was ±0.03% (relative standard deviation).
2.3 Statistical analysis
Statistical correlations were conducted using Microsoft Excel. The Pearson correlation coefficient (r) was calculated as the square root of the R2 value obtained from the Excel scatter plot. The significance (two-tailed probability) was determined by substituting the n and r values into the following online calculator: Pearson Correlation Coefficient Calculator Link: https://www.danielsoper.com/statcalc/calculator.aspx?id=44.
3 Results
3.1 Seasonal variation of hydrochemical parameters
The seawater temperature ranged from 26.12°C to 33.51°C during the study period, with higher values during the SIM and lower values during the NEM. Consistently higher temperatures were observed in the SAI, while the NAI showed greater variability, except during the SWM (Figure 2A). Salinity varied between 25.23 and 35.94, with lower values with higher variability in the NAI than compared to the SAI during all the seasons (Figure 2B). Turbidity ranged from 12 to 125 NTU and was significantly higher in the NAI than compared to the SAI during all the seasons with higher variability during SIM (Figure 2C). The pH ranged from 7.05 to 8.96, with no significant variation from SAI to NAI during all the seasons whereas higher variability in the NAI (Figure 2D). DIN (NO2 + NO3) concentrations ranged from 0.03 to 2.94 µM, with higher values during the SWM and a gradual increase from SAI to NAI, whereas in other seasons no significant spatial variation was observed (Figure 3A). DIP concentrations ranged from 0 to 0.25 µM during the study period and did not show significant seasonal or spatial variation (Figure 3B). DSi concentrations ranged from 0.02 to 3.40 µM and were higher during the SWM (Figure 3C). An increasing trend from SAI to NAI was observed during the SWM, while no significant variation was noted during the other seasons.
Figure 2
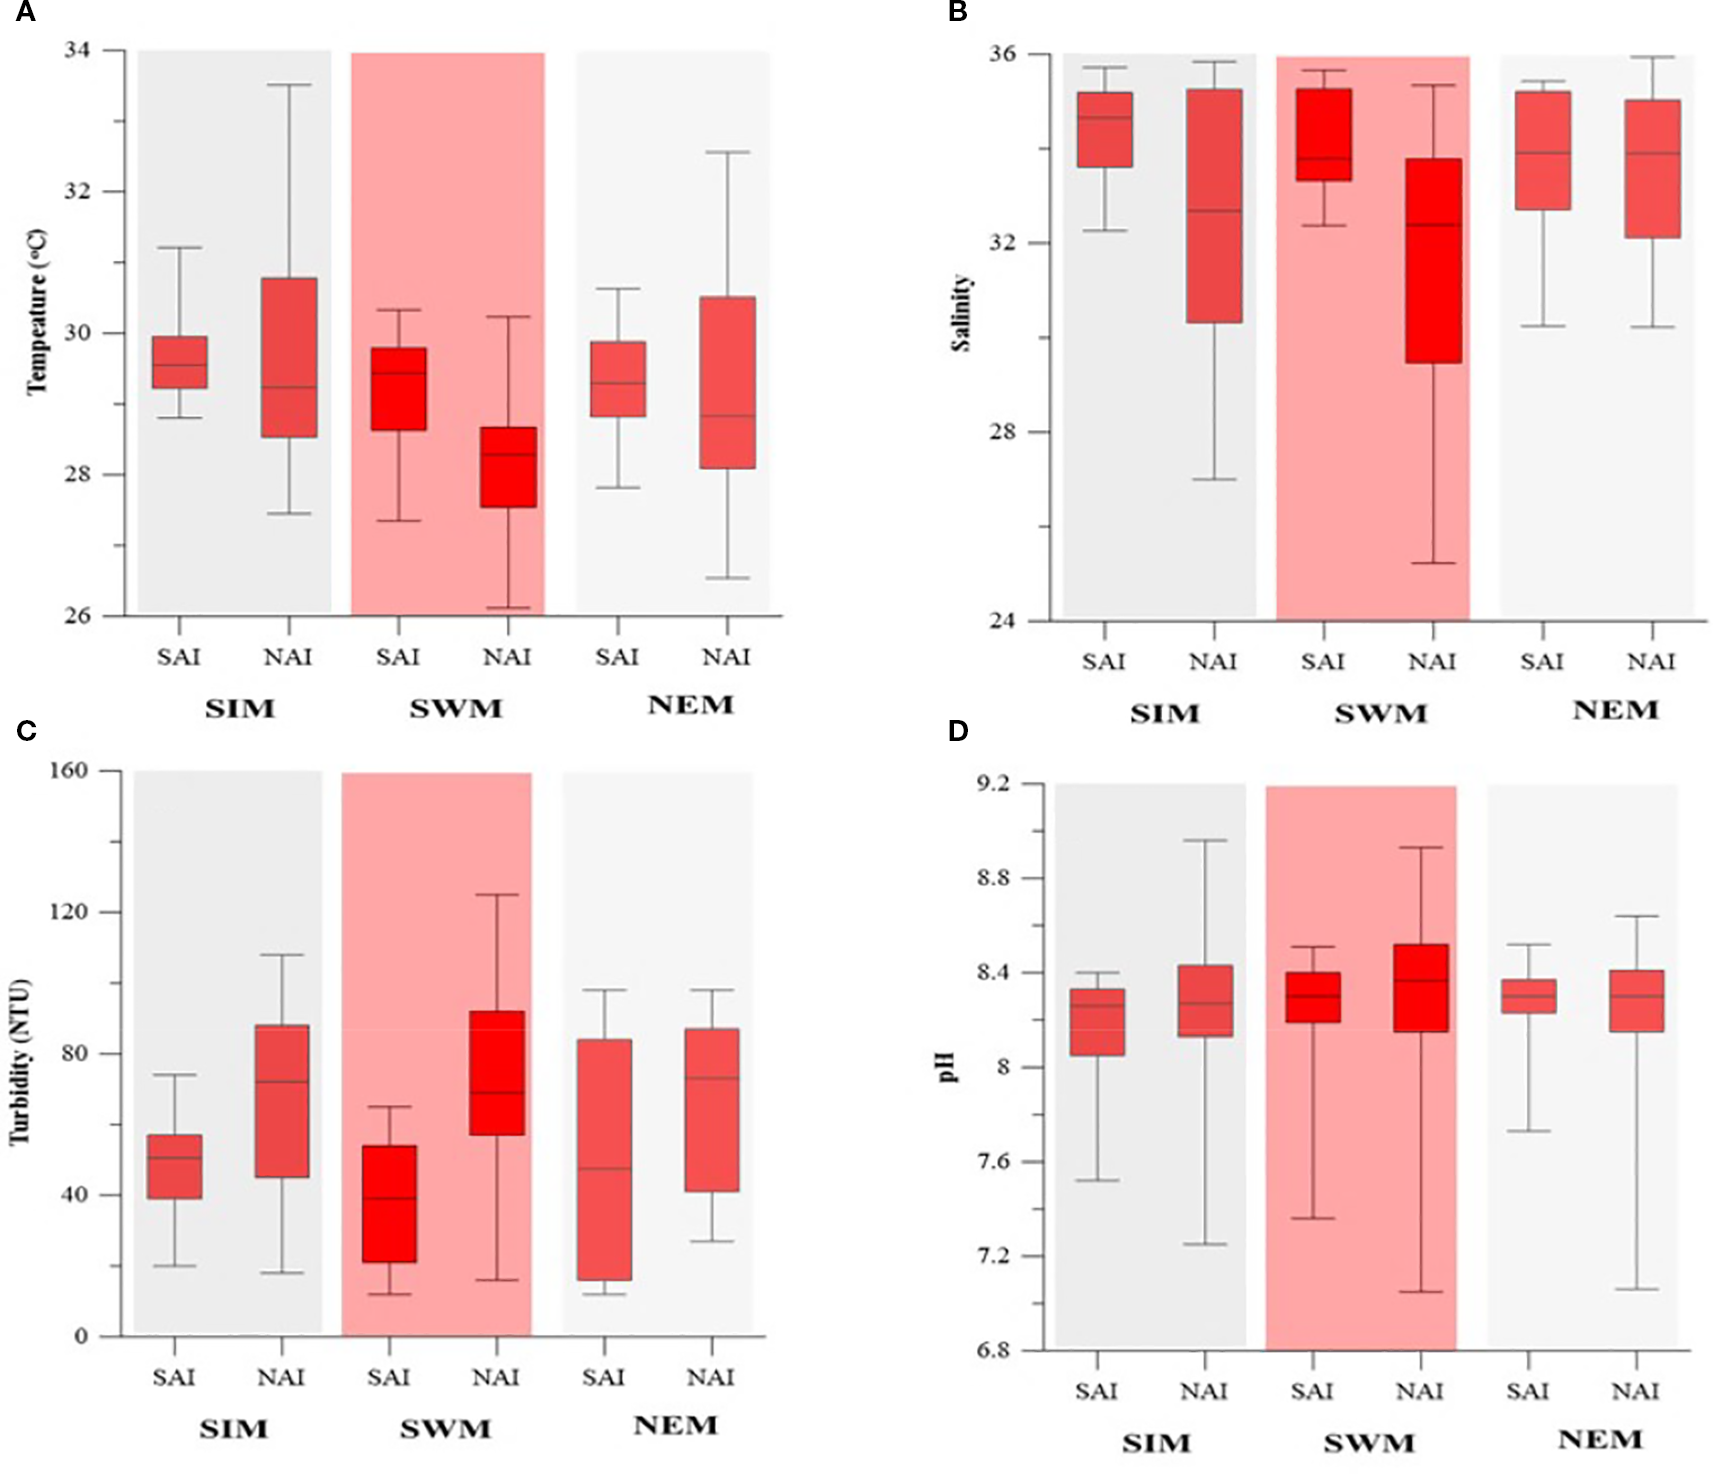
Seasonal variability of (A) Temperature., (B) Salinity, (C) Turbidity and (D) pH in SAI and NAI.
Figure 3
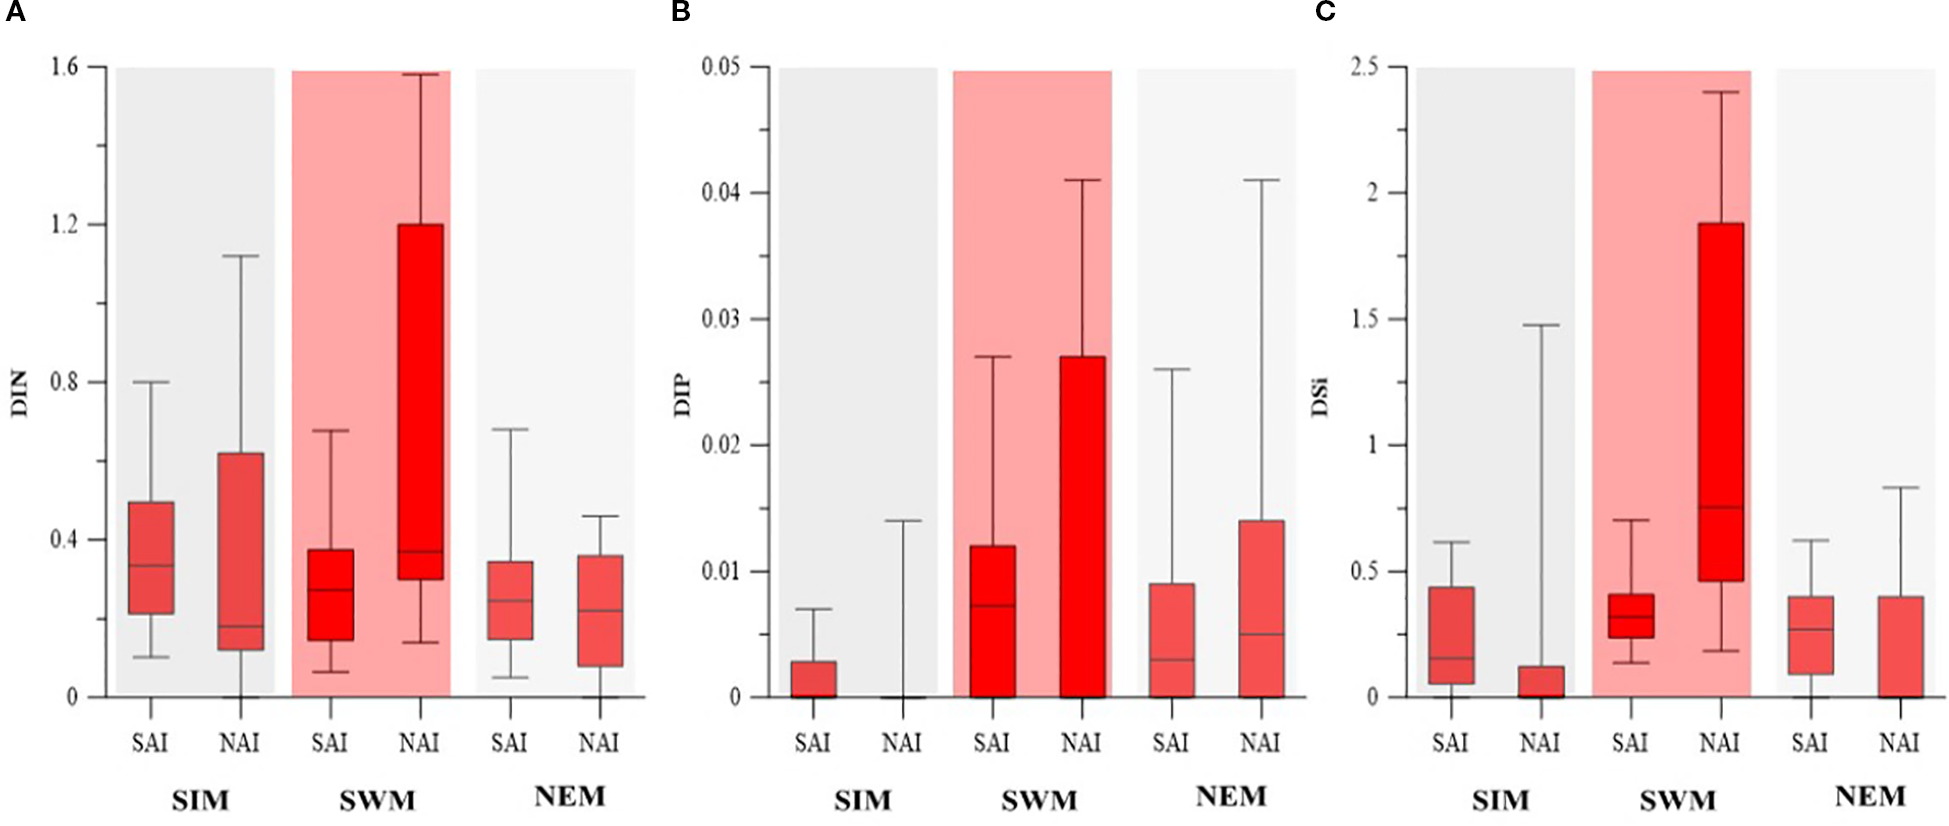
Seasonal variability of (A) DIN., (B) DIP, and (C) DSi in SAI and NAI.
3.2 Seasonal variation of DOC and POC
DOC concentrations ranged from 103 to 772 µM during the study period. During the SIM, DOC concentrations ranged widely in SAI and NAI, with slightly higher median values in NAI (Figure 4A). In the SWM, SAI exhibited greater variability, while NAI showed relatively stable but moderate DOC concentrations. During the NEM, DOC was higher in NAI with a wide range, whereas SAI showed lower values. POC concentrations ranged from 22 to 168 µM during the study period. During the SIM, POC concentrations were lower in SAI but higher and less variable in NAI (Figure 4B). In the SWM, both regions showed similar median values with slight wider variability in NAI. During the NEM, POC was higher in NAI compared to SAI. Overall, DOC and POC concentrations were more variable in SAI but showed higher in the NAI across all the seasons. The POC: DOC ratio ranged from 0.04 to 0.83 during the study period. During the SIM, the ratio was moderate in both regions, with higher variability in SAI (Figure 4C). In the SWM, values were comparable between SAI and NAI, showing a similar median and range. During the NEM, the ratio was higher and more variable in SAI, while NAI showed relatively lower and stable values.
Figure 4
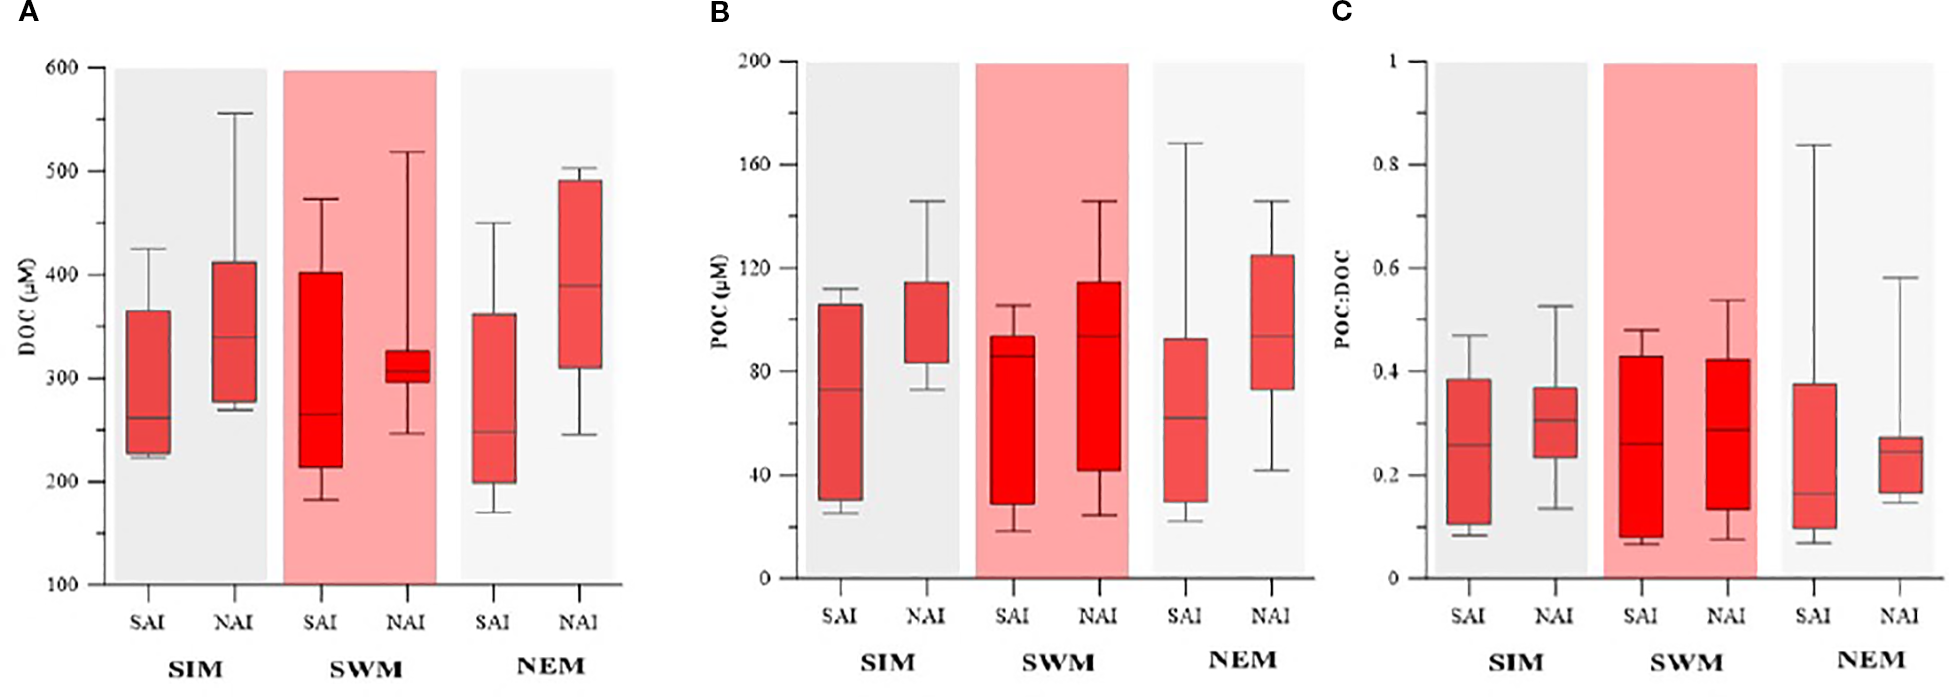
Seasonal variability of (A) DOC., (B) POC, and (C) POC:DOC in SAI and NAI.
3.3 Correlations of hydrochemical parameters with DOC and POC
In the SAI, DOC showed a significant (n=8, p<0.05) negative correlation with salinity and a positive correlation with nutrients (DIN, IP, and DSi) during the SIM (Figure 5A). DOC also showed a significant (n=9, p<0.05) negative correlation with salinity during the SWM (Figure 5B). However, in the NAI, DOC did not show any significant correlation with the measured parameters during any of the seasons. In contrast, POC did not show significant (n=10, p<0.05) variation in the SAI during all seasons. In the NAI, POC showed a significant positive correlation with DSi and DIN during the SWM (Figure 6A), and a significant (n=11, p<0.05) positive correlation with temperature and a negative correlation with pH during the NEM (Figure 6B).
Figure 5
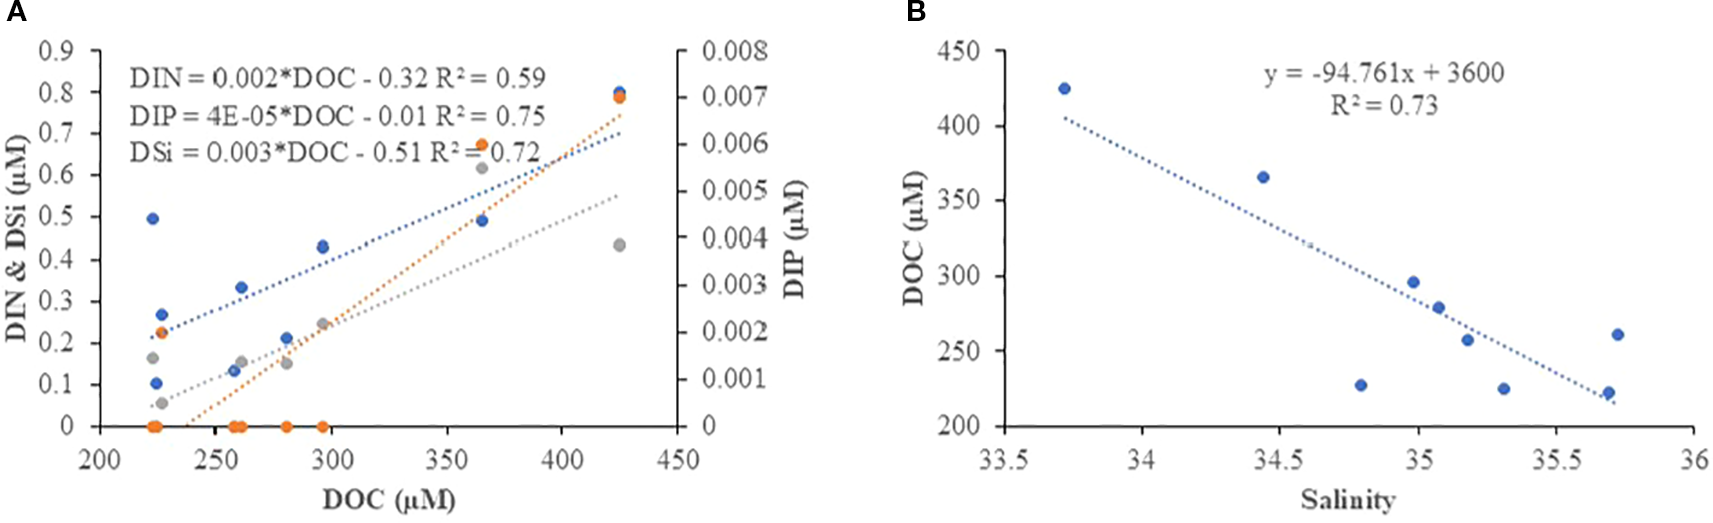
Correlation between DOC and (A) Nutrients (DIN, DIP and DSi) (B) Salinity in the SAI during SIM and SWM respectively.
Figure 6
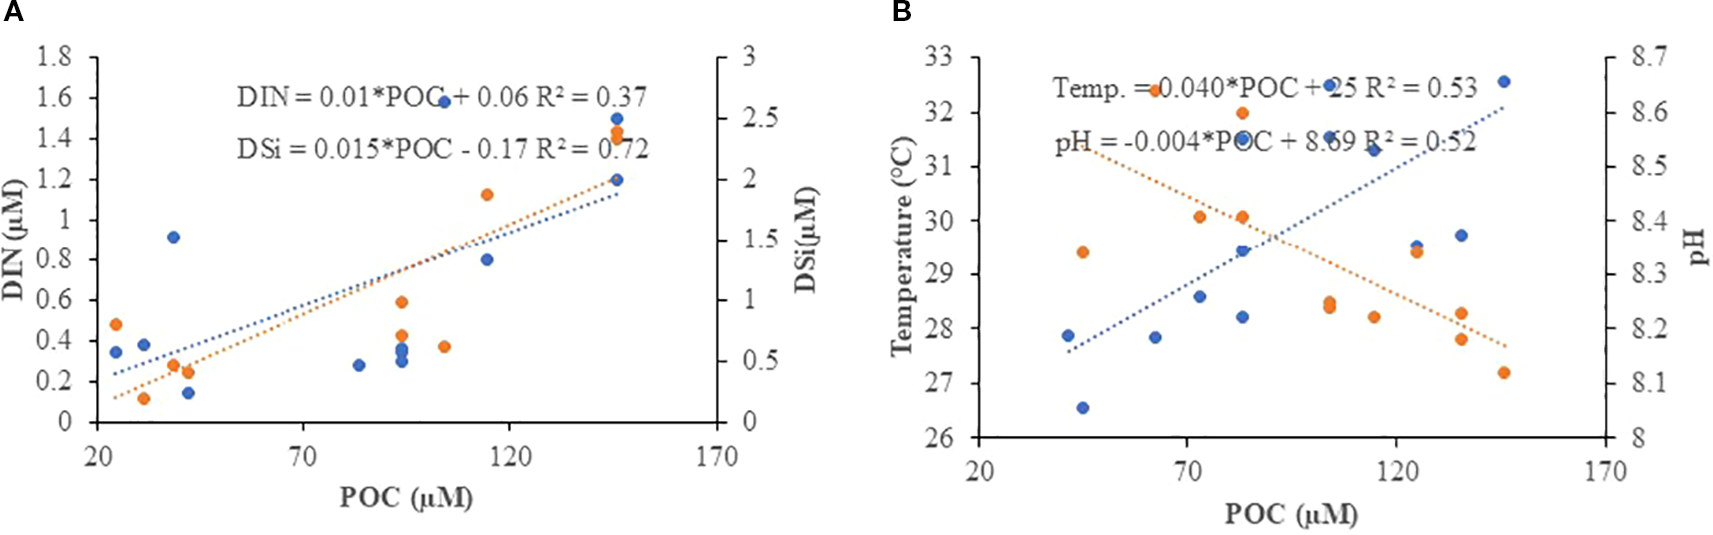
Correlation between POC and (A) Nutrients (DIN and DSi) and (B) Temperature and pH in the SAI during SWM and NEM respectively.
4 Discussion
The ANI experience diverse physical processes driven by strong seasonal variations in monsoonal winds, tides, and ocean circulation. During the SWM, strong southwesterly winds drive northeastward currents, heavy rainfall lowers salinity, and eddies form around the islands, while the Irrawaddy River plume significantly influences the region (Pargaonkar and Vinayachandran, 2022). In the NEM, winds and currents reverse southward, with lower rainfall compared to SWM, whereas the SIM is characterized by weak winds, calm seas, and high temperatures. The shallow shelves around the islands enhance vertical mixing of the water column. Notably, the southern ANI, rich in coral reefs, shows shifts in faunal diversity, promotes heterotrophic metabolism, and alters carbon biogeochemistry compared to non-reef areas (Zhao and Gao, 2019; Osterholz et al., 2021).
4.1 Seasonal variation in the hydrochemical characteristics of SAI and NAI
Higher temperatures were observed in the in the SAI attributed to shallow depths associated with reef structures and localized stratification, which together enhance solar heating, reduce water exchange, and trap heat in the surrounding waters. Such thermal characteristics are well-documented in coral reef environments, where lagoonal and nearshore waters often record higher sea surface temperatures than adjacent open waters (McClanahan et al., 2007; Chollett et al., 2012). Reduced flushing and restricted water exchange in reef lagoons further intensify thermal buildup, which alters the balance between autotrophy and heterotrophy in the ecosystem (Gattuso et al., 1999). The high saline condition in SAI could be due to the weakening of the monsoon current and intensification of eddy-mediated Kinetic energy from Wyrtki Jet, which brings the high saline waters to AS (Chen et al., 2018; Pasula and Subramani, 2023). Lower salinity and higher variability in the NAI compared to the SAI can be attributed to the stronger influence of freshwater inputs from rivers, rainfall, and runoff from the northern Bay of Bengal, where large river systems such as the Irrawaddy and Ganges–Brahmaputra discharge substantial freshwater into the region (Pargaonkar and Vinayachandran, 2022; Sarma et al., 2018). These inputs carry suspended sediments and organic matter, enhancing turbidity and variability, which is more pronounced in the north than in the relatively oligotriphic SAI. The fresh water inpus from the north and turbidity modify the biological activity and remineralization processes in the NAI causing fluctuations in dissolved inorganic carbon and alkalinity, and thereby increasing pH variability. In contrast, the SAI are more oceanic, with stable salinity and reduced terrestrial influence, resulting in relatively stable pH conditions (Sarma et al., 2018; Frankignoulle et al., 1994; Pargaonkar and Vinayachandran, 2022). The terrestrial water inputs supply large amounts of nutrients and suspended matter, which are transported southward by monsoon-driven circulation, leading to elevated concentrations of DIN, DIP and DSi in the NAI than compared to the SAI waters. In contrast, during the SIM, and NEM, reduced precipitation and weaker river influence result in limited nutrient inputs, and no significant spatial variation is observed (Sarma et al., 2018; Pargaonkar and Vinayachandran, 2022; Kumar M. D. et al., 2004). DIP and DSi were lower during the SIM in the NAI despite terrestrial inputs, mainly due to strong stratification caused by calm conditions and high solar heating, which limits vertical mixing and nutrient replenishment from deeper layers. In addition, rapid biological uptake by phytoplankton during periods of enhanced light availability depletes surface DIP and DSi, offsetting the influence of terrestrial inputs. As a result, nutrient concentrations (DIP and DSi) remain low in NAI during SIM (Prasanna Kumar et al., 2002; Kumar et al., 2004; Sarma et al., 2018). Previous studies in this region stated that the availability of nutrients and heat transport were mainly influenced by eddies, which play a critical role in marine productivity in the study area (Pasula and Subramani, 2023).
4.2 Seasonal variation in the DOC in SAI and NAI
DOC concentrations were higher in the NAI waters during the SIM and NEM compared to the SWM, with greater variability linked to enhanced terrestrial runoff, soil leaching, vegetation-derived inputs, and in situ biological production and decomposition. Local anthropogenic discharges combined with terrestrial inputs during these seasons deliver large quantities of dissolved and particulate organic matter, elevating DOC levels in coastal and island systems (Ittekkot and Laane, 1991; Opsahl and Benner, 1997; Osburn and Stedmon, 2011). In contrast, during the SWM, heavy rainfall, vertical mixing, and circulation-driven dilution reduce the influence of localized sources, resulting in lower and more stable DOC concentrations (D’Sa and DiMarco, 2009; Cai, 2011). In the SAI waters, DOC concentrations were generally lower than in NAI, and during SIM, DOC exhibited a negative correlation with salinity and a positive correlation with nutrients (Figure 5A). This reflects the impact of freshwater inflow, terrestrial runoff, and soil leaching, which lower salinity while delivering organic carbon and nutrients (Figure 5B). Additionally, the presence of coral reefs surrounding SAI likely contributes to nutrient release through mineralization and decomposition of reef-associated organic matter, but such processes may promote nutrient enrichment with comparatively lower DOC accumulation. Similar freshwater-driven DOC–nutrient linkages associated with salinity dilution are widely reported in tropical estuaries and coastal ecosystems (Ittekkot and Laane, 1991; D’Sa and DiMarco, 2009; Osburn and Stedmon, 2011). In contrast, the NAI waters did not show significant correlations with salinity or nutrients (Figure not shown), suggesting that DOC variability there is more strongly regulated by in situ biological processes and open-ocean mixing, rather than direct terrestrial influence (Opsahl and Benner, 1997; Cai, 2011).
4.3 Seasonal variation in the POC in SAI and NAI
During the SIM, POC concentrations were lower in the coral reef–dominated SAI waters but higher and less variable in the North Andaman Island (NAI) waters. The lower POC in SAI can be explained by the ecological functioning of coral reef ecosystems. Coral reefs are highly efficient at recycling organic matter through tight benthic–pelagic coupling, microbial degradation, and the uptake of nutrients and organic particles by reef organisms. Corals and reef-associated biota release large amounts of DOC, but this DOC is rapidly utilized by reef microbes, while particulate matter is trapped in coral mucus and sediments, leading to reduced suspended POC in the water column (Ferrier-Pagès et al., 1998; Wild et al., 2004; Naumann et al., 2012). Consequently, reef-dominated systems often appear oligotrophic in terms of suspended particulate matter. In contrast, the NAI waters showed higher and less variable POC concentrations, which are attributed to terrestrial influences such as runoff, soil erosion, and mangrove-derived inputs, as well as sediment resuspension processes. These inputs contribute to elevated particulate organic loads that remain relatively stable compared to the biologically driven fluctuations in reef-dominated regions (Ittekkot and Laane, 1991; Bouillon et al., 2008; Bhaskar et al., 2021). Moreover, the geomorphology of NAI, with greater proximity to riverine discharges and mangrove ecosystems, enhances the supply of allochthonous organic carbon. This leads to spatial heterogeneity, where the south is influenced by reef nutrient cycling and the north by land–ocean interactions and terrestrial carbon fluxes (Rao et al., 2013; Alongi, 2014). During the SWM, POC concentrations showed comparable median values between the SAI and NAI waters, with slightly higher values in the north. This can be attributed to enhanced terrestrial runoff, riverine input, and sediment resuspension, processes that are intensified during the monsoon due to heavy rainfall and strong physical mixing. These inputs supply allochthonous organic carbon and maintain relatively elevated POC concentrations supported with the positive correlation with DIN and DSi (Figure 6A) independent of reef-associated recycling (Ittekkot and Laane, 1991; Bouillon et al., 2008; Bhaskar et al., 2021). Additionally, strong winds and currents during the SWM promote water column mixing and resuspension, further contributing to higher particulate matter in NAI compared to reef-dominated SAI waters (Kumar et al., 2004; Madhupratap et al., 2003). SAI waters, dominated by coral reef ecosystems, showed greater variability in POC during NEM. This is attributed to the release of organic matter from reef organisms can be highly dynamic, fluctuating with reef metabolic activity, hydrodynamic forcing, and episodic events such as storms or localized resuspension. As a result, SAI waters tend to show greater short-term variability in POC compared to the more stable, whereas in the NAI, enhanced stratification and elevated surface temperatures that stimulate phytoplankton growth and organic carbon production, while concurrent decreases in pH (Figure 6B), likely driven by elevated respiration and CO₂ accumulation, promote further release and transformation of organic matter, thereby increasing POC concentrations.
4.4 Variation of POC: DOC in SAI and NAI
The higher POC: DOC ratio and lower variability in the NAI waters during the SIM are attributed to the stronger influence of riverine and terrestrial inputs from the Ganga–Brahmaputra–Irrawaddy system and Myanmar rivers. These inputs deliver suspended particulate matter that enhances POC, while relatively lower DOC supply and stable stratified conditions reduce fluctuations, resulting in higher and more consistent POC: DOC ratios (Ittekkot and Laane, 1991; Benner and Amon, 2015). In contrast, the SAI waters, being more oceanic and less affected by terrestrial discharges, are dominated by phytoplankton-derived production, where the balance between POC and DOC is more variable under changing biological and hydrographic conditions (Madhupratap et al., 2003; Rao and Kumar, 2002). Higher variability of POC: DOC ratio in the NAI and SAI island waters and slight enrichment in the north during SWM could be due to the experiences strong wind-driven mixing, coastal upwelling, and heavy rainfall, which enhance nutrient availability and fuel phytoplankton blooms, thereby increasing particulate organic carbon (POC) production relative to dissolved organic carbon (DOC) (Madhupratap et al., 2003; Kumar et al., 2010). In the NAI, proximity to the Ganga–Brahmaputra river system and enhanced runoff from Myanmar introduces terrestrial-derived DOC and suspended particulate matter. When coupled with higher primary productivity driven by nutrient-rich waters, this results in a slight enrichment of POC relative to DOC during SWM, raising the POC: DOC ratio (Borges and Gypens, 2010). In contrast, the SAI, being farther from large riverine inputs, are relatively more influenced by open-ocean exchange and local precipitation, leading to lower terrestrial DOC supply. This causes greater variability in the POC: DOC ratio due to episodic phytoplankton blooms and variable mixing regimes rather than consistent terrestrial contributions (Rao and Kumar, 2002; Sarma et al., 2018). During the NEM, the POC: DOC ratio was more variable in the SAI than in the NAI because SAI waters are strongly influenced by episodic freshwater inflow, local precipitation, and variable biological productivity, which alter the balance between particulate and dissolved organic carbon (Madhupratap et al., 2003; Sarma et al., 2018). In contrast, NAI waters, although receiving terrestrial inputs from large river systems, are more consistently influenced by sustained freshwater and DOC supply, resulting in comparatively lower variability in the ratio (Ittekkot and Laane, 1991).
5 Conclusion
The present study highlights pronounced seasonal and spatial contrasts in hydrochemical parameters and organic carbon pools between the South Andaman Islands (SAI) and North Andaman Islands (NAI). Hydrography in the SAI was characterized by higher and more stable temperatures and salinities due to reef-associated stratification and reduced freshwater influence, whereas NAI exhibited stronger variability in salinity, turbidity, and pH driven by terrestrial inputs from the Bay of Bengal and large river systems. DOC and POC concentrations were consistently higher in the NAI, reflecting terrestrial and mangrove-derived inputs, while SAI waters, strongly influenced by coral reef metabolism, showed lower but more variable organic carbon dynamics. Seasonal shifts in monsoonal forcing further regulated these distributions: DOC was elevated during SIM and NEM due to freshwater and terrestrial inputs, while dilution and vertical mixing during SWM led to lower and more stable concentrations. POC was enriched in NAI throughout, with greater variability in SAI linked to reef metabolic processes. The POC: DOC ratio revealed distinct biogeochemical regimes, with NAI dominated by particulate-rich, river-influenced carbon pools, and SAI showing more variable phytoplankton- and reef-driven organic matter cycling. Overall, the results underscore the contrasting influence of terrestrial inputs in the NAI and reef-associated processes in the SAI, with monsoonal seasonality acting as the primary driver of hydrochemical and carbon dynamics across the Andaman Islands. Further studies are required related to the to identify the ecosystem changes with the biological processes.
Statements
Data availability statement
The raw data supporting the conclusions of this article will be made available by the authors, without undue reservation.
Author contributions
PM: Data curation, Writing – original draft, Formal analysis, Project administration, Resources. RK: Data curation, Investigation, Methodology, Writing – original draft. JJ: Resources, Software, Validation, Visualization, Writing – review & editing. MP: Validation, Formal analysis, Writing – review & editing. SS: Validation, Data curation, Resources, Writing – review & editing. NC: Data curation, Validation, Software, Writing – review & editing. SC: Supervision, Writing – review & editing. VS: Conceptualization, Data curation, Validation, Writing – original draft, Writing – review & editing.
Funding
The author(s) declare financial support was received for the research and/or publication of this article. The authors extend their gratitude to the Indian Institute of Tropical Meteorology (IITM), Ministry of Earth Sciences, Pune, for funding this research (Grant No. CCCR/Fluxnet/PMM/2012/207, Date: 15/06/2010), and Indian National Centre for Ocean Information Services (INCOIS) for sharing buoy data from the Andaman Sea.
Acknowledgments
Moreover, the authors acknowledge the authorities of Pondicherry University, Puducherry, for their support and facilitation of this study.
Conflict of interest
The authors declare that the research was conducted in the absence of any commercial or financial relationships that could be construed as a potential conflict of interest.
Generative AI statement
The author(s) declare that no Generative AI was used in the creation of this manuscript.
Any alternative text (alt text) provided alongside figures in this article has been generated by Frontiers with the support of artificial intelligence and reasonable efforts have been made to ensure accuracy, including review by the authors wherever possible. If you identify any issues, please contact us.
Publisher’s note
All claims expressed in this article are solely those of the authors and do not necessarily represent those of their affiliated organizations, or those of the publisher, the editors and the reviewers. Any product that may be evaluated in this article, or claim that may be made by its manufacturer, is not guaranteed or endorsed by the publisher.
References
1
Allen R. Najman Y. Carter A. Barfod D. Bickle M. J. Chapman H. J. (2008). Provenance of the Tertiary sedimentary rocks of the Indo-Burman Ranges, Burma (Myanmar): Burman arc or Himalayan-derived? J. Geol. Soc165, 1045–1057. doi: 10.1144/0016-76492007-143
2
Alongi D. M. (2014). Carbon cycling and storage in mangrove forests. Annu. Rev. Mar. Sci.6, 195–219. doi: 10.1146/annurev-marine-010213-135020
3
ANI (2017). Andaman and Nicobar Islands basic statistics (Port Blair, India: Directorate of Economics and Statistics, ANI Administration), 235.
4
APHA (2005). Standard Methods of Water and Wastewater. 21st (Washington, DC: American Public Health Association), 2–61.
5
Barbier E. B. Koch E. W. Silliman B. R. Hacker S. D. Wolanski E. Primavera J. (2008). Coastal ecosystem-based management with nonlinear ecological functions and values. Science319, 321–323. doi: 10.1126/science.1150349
6
Benner R. Amon R. M. W. (2015). The size-reactivity continuum of major bioelements in the ocean. Annu. Rev. Mar. Sci.7, 185–205. doi: 10.1146/annurev-marine-010213-135126
7
Borges A. V. Gypens N. (2010). Carbonate chemistry in the coastal zone responds more strongly to eutrophication than ocean acidification. Limnol. Oceanogr.55, 346–353. doi: 10.4319/lo.2010.55.1.0346
8
Bouillon S. Connolly R. M. Lee S. Y. (2008). Mangrove production and carbon sinks: A revision of global budget estimates. Global Biogeochem. Cycles22, GB2013. doi: 10.1029/2007GB003052
9
Cai W. J. (2011). Estuarine and coastal ocean carbon paradox: CO2 sinks or sites of terrestrial carbon incineration? Annu. Rev. Mar. Sci.3, 123–145. doi: 10.1146/annurev-marine-120709-142723
10
Chen G. Li Y. Xie Q. Wang D. (2018). Origins of eddy kinetic energy in the Bay of Bengal. J. Geophys. Res.: Oceans. 123 (3), 2097–2115. doi: 10.1002/2017JC013455
11
Chollett I. Mumby P. J. Cortés J. (2012). Upwelling areas do not guarantee refuge for coral reefs in a warming ocean. Mar. Ecol. Prog. Ser.416, 47–56. doi: 10.3354/meps08775
12
D’Sa E. J. DiMarco S. F. (2009). Seasonal variability and controls on chromophoric dissolved organic matter in a large river-dominated coastal margin. Limnol. Oceanography54, 2233–2242. doi: 10.4319/lo.2009.54.6.2233
13
Fasullo J. Webster P. J. (2003). A hydrological definition of Indian monsoon onset and withdrawal. J. Climate. 16 (19), 3200–3211. doi: 10.1175/1520-0442(2003)016<3200a:AHDOIM>2.0.CO;2
14
Ferrier-Pagès C. Gattuso J. P. Cauwet G. Jaubert J. Allemand D. (1998). Release of dissolved organic matter and nutrients by the zooxanthellate coral Stylophora pistillata. J. Exp. Mar. Biol. Ecol.229, 135–160.
15
Frankignoulle M. Canon C. Gattuso J. P. (1994). Marine calcification as a source of carbon dioxide: Positive feedback of increasingatmospheric CO2. Limnol. Oceanography39, 458–462. doi: 10.4319/lo.1994.39.2.0458
16
Garzanti E. Limonta M. Resentini A. Bandopadhyay P. C. Najman Y. Andò S. (2013). Sediment recycling at convergent plate margins (Indo-Burman ranges and Andaman–Nicobar ridge). Earth Sci. Rev.123, 113–132. doi: 10.1016/j.earscirev.2013.04.008
17
Gattuso J.-P. Allemand D. Frankignoulle M. (1999). Photosynthesis and calcification at cellular, organismal and community levels in coral reefs: A review on interactions and control by carbonate chemistry. Am. Zool.39, 160–183. doi: 10.1093/icb/39.1.160
18
Halpern B. Longo C. Hardy D. (2012). An index to assess the health and benefits of the global ocean. Nature488, 615–620. doi: 10.1038/nature11397
19
Hutchinson G. E. (1959). Homage to Santa Rosalia, or why are there so many kinds of animals? Am. Natural.93, 145–159. doi: 10.1086/282070
20
Ittekkot V. Laane R. (1991). “Fate of riverine particulate organic matter,” in Biogeochemistry of Major World Rivers, eds DegensE. T.et al. (Wiley), 233–243.
21
Karthik R. Padmavati G. Elangovan S. S. Sachithanandam V. (2017). Monitoring the Diatom bloom of Leptocylindrusdanicus (Cleve 1889, Bacillariophyceae) in the coastal waters of South Andaman Island. Indian J. Geo-Marine Sci.46, 958–965. Available online at: https://www.researchgate.net/publication/316889044
22
Kiran S. R. (2017). General circulation and principal wave modes in Andaman Sea from observations. Indian J. Sci. Technol.10, 1–11. doi: 10.17485/ijst/2017/v10i24/115764
23
Kumar M. D. Naqvi S. W. A. Narvekar P. V. George M. D. (2004). Nutrients in the Bay of Bengal: Spatial and temporal variability. . Deep-Sea Res. Part II.: Topical Stud. Oceanography51, 139–154.
24
Kumar S. P. Nuncio M. Ramaiah N. Sardessai S. Narvekar J. Fernandes V. et al . (2007). Eddy-mediated biological productivity in the Bay of Bengal during fall and spring intermonsoons. Deep-Sea Res.-I.54, 1619–1640. doi: 10.1016/j.dsr.2007.06.002
25
Kumar S. P. Roshin R. P. Narvekar J. Kumar P. K. D. Vivekanandan E. (2010). What drives increased phytoplankton biomass in the Arabian Sea. Curr. Sci.99, 101–106.
26
Liao J. Peng S. Wen X. (2020). On the heat budget and water mass exchange in the Andaman Sea. Acta Oceanol. Sin.39, 32–41. doi: 10.1007/s13131-019-1627-8
27
Madhupratap M. Gauns M. Ramaiah N. Prasanna Kumar S. Muraleedharan P. M. de Souza S. N. et al . (2003). Biogeochemistry of the Bay of Bengal during summer monsoon 2001. Deep Sea Res. Part II.50, 881–896. doi: 10.1016/S0967-0645(02)00611-2
28
Martin H. J. (1993). Determination of Particulate Organic Carbon (POC) and Nitrogen (PON) in Seawater. p. 37–40. In KadarS.LeinenM.J.MurrayW. [eds.], United States Joint GlobalOcean Flux Study: Equatorial Pacific Study—sampling and an-alytical protocols. U. S. JGOFS, Woods Hole.
29
McClanahan T. R. Ateweberhan M. Graham N. A. J. Wilson S. K. Sebastián C. R. Guillaume M. M. M. et al . (2007). Climate change and coral reef bleaching: An ecological assessment of long-term impacts, recovery trends and future outlook. Estuarine Coast. Shelf. Sci.80, 435–471.
30
McNeill L. C. Dugan B. Backman J. Pickering K. T. Pouderoux H. F. A. Henstock T. J. (2017). Understanding Himalayan erosion and the significance of the Nicobar Fan. Earth Planet Sci. Lett.475, 134–142. doi: 10.1016/j.epsl.2017.07.019
31
Narayan S. Beck M. W. Reguero B. G. Losada I. J. van Wesenbeeck B. (2016). The effectiveness, costs and coastal protection benefits of natural and nature-based defences. PloS One11, e0154735. doi: 10.1371/journal.pone.0154735
32
Naumann M. S. Richter C. Mott C. el-Zibdah M. Manasrah R. Wild C. (2012). Budget of coral-derived organic carbon in a fringing coral reef of the Gulf of Aqaba, Red Sea. J. Mar. Syst.105, 20–29. doi: 10.1016/j.jmarsys.2012.05.007
33
Odum E. P. (1971). Fundamentals of Ecology. 2nd (Philadelphia: Saunders).
34
Opsahl S. Benner R. (1997). Distribution and cycling of terrigenous dissolved organic matter in the ocean. Nature386, 480–482. doi: 10.1038/386480a0
35
Osburn C. L. Stedmon C. A. (2011). Linking chemical and optical properties of dissolved organic matter to differentiate sources and transformations. Mar. Chem.126, 281–294. doi: 10.1016/j.marchem.2011.06.007
36
Osterholz H. Burmeister C. Busch S. Dierken M. Frazão H. C. Hansen R. et al . (2021). Nearshore dissolved and particulate organic matter dynamics in the southwestern baltic sea: environmental drivers and time series analysis, (2010–2020). Front. Mar. Sci.8. doi: 10.3389/fmars.2021.795028
37
Paine R. T. (1980). Food webs: linkage, interaction strength and community infrastructure. J. Anim. Ecol.49, 667–685. doi: 10.2307/4220
38
Pargaonkar S. M. Vinayachandran P. N. (2022). The irrawaddy river jet in the andaman sea during the summer monsoon. Front. Mar. Sci.9. doi: 10.3389/fmars.2022.849179
39
Pasula A. Subramani D. N. (2023). Cause and impact of Andaman Sea’s salinity variability: A modeling study. Deep-Sea Res. Part II. 209, 105291. doi: 10.1016/j.dsr2.2023.105291
40
Paulmier A. Ruiz-Pino D. (2009). Oxygen minimum zones (OMZs) in the modern ocean. Prog. Oceanography80, 113–128. doi: 10.1016/j.pocean.2008.08.001
41
Prasanna Kumar S. Muraleedharan P. M. Prasad T. G. Gauns M. Ramaiah N. de Souza S. N. et al . (2002). Why is the Bay of Bengal less productive during summer monsoon compared to the Arabian Sea?. Geophys. Res. Lett.29, 2235. doi: 10.1029/2002GL016013
42
Sachithanandam V. Mageswaran T. Sridhar R. Purvaja R. Ramesh R. (2014). Assessment of Cyclone Lehar’s impact on seagrass meadows in Ross and Smith Islands, North Andaman. Nat. Hazards72, 1253–1258. doi: 10.1007/s11069-014-1040-8
43
Sachithanandam V. Mohan P. M. Karthik R. Elangovan S. S. Padmavati G. (2013). Climate changes influence the phytoplankton bloom (prymnesiophyceae: phaeocystis spp.) in North Andaman coastal region. Indian J. Mar. Sci.42, 58–66.
44
Sachithanandam V. Mohan P. M. Muruganandam N. Chaaithanya I. K. Dhivya P. Baskaran R. (2012). DNA barcoding, phylogenetic study of Epinephelus spp. from Andaman coastal region, India. Indian J. Geo-Marine Sci.41, 203–212.
45
Sachithanandam V. Parthasarathy P. Elangovan S. S. Kasilingam K. Dhivya P. Mageswaran T. et al . (2020). A baseline study on trace metals concentration and its ecological risk assessment from the coast of South Andaman Island, India. Reg. Stud. Mar. Sci.36, 101242. doi: 10.1016/j.rsma.2020.101242
46
Sachithanandam V. Reddy B. S. Mageswaran T. Singh K. S. Vimala J. Sridhar R. et al . (2022). Effect of hydrodynamic conditions on seagrass ecosystems during Cyclone Lehar in the South Andaman Islands, India. Ecohydrol. Hydrobiol.22, 640–659. doi: 10.1016/j.ecohyd.2022.07.006
47
Sarkar S. Ghosh A. K. (2013). Coral bleaching a nemesis for the Andaman reefs: building an improved conservation paradigm. Ocean Coast. Manage.71, 153–162. doi: 10.1016/j.ocecoaman.2012.09.010
48
Sprintall J. Tomczak M. (1992). Evidence of the barrier layer in the surface layer of the tropics. J. Geophysical Res.: Oceans97, 7305–7316. doi: 10.1029/92JC00407
49
Varkey M. J. Murty V. Suryanarayana A. (1996). Physical oceanography of the bay of Bengal. Oceanogr. Mar. Biol. Annu. Rev.34, 1–70.
50
Wild C. Huettel M. Klueter A. Kremb S. G. Rasheed M. Y. Jørgensen B. B. (2004). Coral mucus functions as an energy carrier and particle trap in the reef ecosystem. Nature428, 66–70. doi: 10.1038/nature02344
51
Zhao L. Gao L. (2019). Dynamics of dissolved and particulate organic matter in the Changjiang (Yangtze River) Estuary and the adjacent East China Sea shelf. J. Mar. Syst. 198, 103188. doi: 10.1016/j.jmarsys.2019.103188
Summary
Keywords
Andaman Sea, coastal waters, dissolved organic carbon, coral reefs, particulate organic carbon
Citation
Mohan PM, Kumari RK, Chari NVHK, S. SE, Jeevamani JJJ, Prasad MH, Chakraborty S and Sachithanandam V (2025) Seasonal dynamics of dissolved and particulate organic carbon in nearshore waters of the Andaman Islands. Front. Mar. Sci. 12:1632099. doi: 10.3389/fmars.2025.1632099
Received
20 May 2025
Accepted
26 August 2025
Published
16 September 2025
Volume
12 - 2025
Edited by
Nadimikeri Jayaraju, Yogi Vemana University, India
Reviewed by
Daniel Pech, El Colegio de la Frontera Sur, Mexico
Robert T. Letscher, University of New Hampshire, United States
Updates
Copyright
© 2025 Mohan, Kumari, Chari, S., Jeevamani, Prasad, Chakraborty and Sachithanandam.
This is an open-access article distributed under the terms of the Creative Commons Attribution License (CC BY). The use, distribution or reproduction in other forums is permitted, provided the original author(s) and the copyright owner(s) are credited and that the original publication in this journal is cited, in accordance with accepted academic practice. No use, distribution or reproduction is permitted which does not comply with these terms.
*Correspondence: V. Sachithanandam, pondiunisachin@gmail.com, vsachithanandamniot@gmail.com
†Present addresses: N. V. H. K. Chari, Centre for Marine Living Resources and Ecology, Ministry of Earth Sciences, Kochi, India; Sai Elangovan S., Centre for Marine Living Resources and Ecology, Ministry of Earth Sciences, Kochi, India; V. Sachithanandam, Deep Ocean Mission V6, Advanced Marine Station for Ocean Biology, Marine Biotechnology Division, NIOT, Chennai, Tamil Nadu, India
Disclaimer
All claims expressed in this article are solely those of the authors and do not necessarily represent those of their affiliated organizations, or those of the publisher, the editors and the reviewers. Any product that may be evaluated in this article or claim that may be made by its manufacturer is not guaranteed or endorsed by the publisher.