Abstract
Methane emissions from cold seeps play an important role in oceanic carbon cycling and climate regulation, yet their temporal dynamics and controlling mechanisms remain poorly understood. We conducted long-term in situ monitoring at the Formosa Ridge (Site F), southwest of Taiwan, using a self-developed ocean observation platform that integrates an acoustic Doppler current profiler (ADCP), conductivity–temperature–depth (CTD) sensors, current meters, and other instruments, enabling multi-parameter correlation analysis. The observations revealed pronounced temporal variability in gas emissions, with emission intensity closely correlated with bottom pressure fluctuations controlled by tidal cycles. The results suggest that hydrostatic pressure changes promote or inhibit hydraulic fracturing, thereby modulating gas release. These findings support a conceptual model of the seep’s fluid system, characterized by a constant subsurface methane supply and tidally modulated episodic bubble discharge, a mechanism likely applicable to other cold seep environments globally and offering new insights into the dynamics of marine methane emissions.
1 Introduction
Natural marine gas bubble emissions have been found at numerous sites around the world’s ocean margins, providing an effective transport pathway for light hydrocarbons from the sediments into the water column. Several studies focused on quantifying the amount of emanating gas entering the hydrosphere, e.g. in the Black Sea (Nikolovska et al., 2008; Sahling et al., 2009; Römer et al., 2012a), the Makran continental margin (Römer et al., 2012b), the Cascadia margin at southern Hydrate Ridge (Torres et al., 2002), as well as the Håkon Mosby mud volcano (Sauter et al., 2006). The fraction of released methane reaching the sea-air boundary was studied to evaluate its contribution to climate warming as a powerful greenhouse gas in the atmosphere. Most studies providing methane flow quantifications do not account for spatial and temporal variability since short-term observations and measurements were usually acquired during research cruises, limiting the time for experiments. However, natural gas emissions have been most often observed to be highly transient in a variety of time scales (Tryon et al., 1999; Boles et al., 2001; Varadharajan and Hemond, 2012; Kannberg et al., 2013).
To date, the spatial variability and temporal fluctuations of methane gas bubble emissions from seabed sources are scarcely investigated due to the technology limits, leaving global estimates poorly constrained (Ferré et al., 2020). Methane gas bubble emissions might be controlled by fluid flow rates mediated by microbial processes in marine sediments or physical changes in bottom pressure (Fechner-Levy and Hemond, 1996; Leifer and Boles, 2005; Scandella et al., 2011), which can be influenced by, e.g., bottom water currents, storms, tides, or swell. Furthermore, a correlation of fluid emissions with earthquakes has been postulated in several studies (Kessler et al., 2005; Mau et al., 2007; Lapham et al., 2008; Fischer et al., 2013) and even hypothesized for the study area (Lapham et al., 2013), although possibly due to the lack of large earthquakes in the time series, such a correlation could not be proven. Lapham et al. (2013) also discussed a possible tidal influence on fluid flow activation, but unfortunately, the pore fluid sampling frequency did not allow for resolving tidal cycles.
Previous studies have shown that natural gas emissions from the seafloor are not only spatially heterogeneous but also temporally variable across a range of timescales (Tryon et al., 1999; Boles et al., 2001; Varadharajan and Hemond, 2012; Kannberg et al., 2013). Among the controlling factors, tidal forcing has emerged as a key driver of short-term variability in gas bubble fluxes. For example, increased gas emission rates have been observed during falling tidal pressure at sites such as Coal Oil Point (Boles et al., 2001), Hydrate Ridge (Torres et al., 2002), offshore Taiwan (Hsu and Kuan, 2013), and Cape Lookout Bight (Martens and Klump, 1980). These studies suggest a dynamic coupling between hydrostatic pressure variations and subsurface gas venting activity. Measurements using benthic flux meters further support this association, revealing episodic methane release events that correlate with tidal cycles. In particular, acoustic imaging in offshore SW Taiwan has shown that the most intense gas emissions—accompanied by elevated CH4 and CO2 concentrations and tremor-like signals—occur during the rising phase of high tides. These findings support the hypothesis that tidal-scale sea level fluctuations can significantly modulate methane fluxes at seep sites. Building on these insights, our study aims to explore the extent to which tidal constituents influence gas emissions at Site F, using long-term data from the LOOP and MINI-LOOP platforms. By resolving temporal variations in seep activity, we seek to clarify the physical mechanisms that control gas release from the seabed and improve predictive understanding of these dynamic systems.
In this study, we use long-term monitoring data of gas bubble observations by a long-term ocean observation platform (LOOP) at a seep site in Site F to characterize the gas emission variability and analyze the factors influencing its activity (Figure 1). In addition, we repeated the experiment using a novel next-generation “mini” long-term ocean observing platform (MINI-LOOP). By providing detailed long-term observations, we aim better to understand the significance of naturally driven hydrocarbon gas emissions. Further, the seafloor installations equipped with numerous sensors enable the correlation of the methane gas emissions with bottom pressure changes, which helps to elucidate the possible trigger mechanisms at the studied seep site. Our results from gas emissions of Site F might be transferred to similar seep sites and should provide a better understanding of controlling factors in such fluid systems.
Figure 1

(A) Location of the study site (modified from the GEBCO world map 2014, https://www.gebco.net). (B) Seabed relief map of the southern summit of the Formosa Ridge. (C) Methane-rich bubbles captured by LOOP observations. (D) Schematic illustration of the equipment deployed on MINI LOOP. (E) Operating interface of the MINI LOOP system.
2 Study area
The South China Sea lies at the convergence of the Eurasian, Pacific, and Indo-Australian plates, encompassing both passive and active continental margins characterized by high sedimentation rates (Chen et al., 2016). Formosa Ridge, located on the northern continental margin of the South China Sea, offshore southwestern Taiwan, features a canyon incised into the eastern margin of the basin (Figure 1A). The ridge extends approximately 30 km in length and 5 km in width, with elevations ranging from 200 m to 2800 m. Notably, active venting is restricted to the southern summit, where chemosynthetic cold seep communities were first documented in 2008 (Liu et al., 2008) (Figure 1B).
Seismic profiles reveal a prominent and continuous Bottom Simulating Reflector (BSR) underlying the ridge, except within the cold seep area (Zhang et al., 2016). These profiles also record a pull-up reflection beneath the active seep and identify a 110 m-wide seafloor mound. An apparent gas chimney beneath the cold seep provides a conduit for gas migration from deeper sediments to the seafloor. The BSR is disrupted by this chimney structure, indicating vertical fluid migration and active gas bubble release at the seabed (Wang et al., 2018). Furthermore, previous studies have shown that gas hydrates beneath the seafloor serve as a substantial methane source for venting (Chen et al., 2010; Feng et al., 2018; Lv et al., 2022).
In addition to its tectonic and sedimentary features, the Formosa Ridge region is subject to strong ocean tidal forcing, which plays a crucial role in controlling the temporal variability of methane emissions. Tidal records from the nearby Xiaoliuchiu tide gauge station in the south west of Taiwan indicate a mixed tidal regime dominated by diurnal (O1, K1) and semidiurnal (M2, K2) constituents, with higher-order constituents (M3, MK3, M6) contributing to complex tidal stress patterns on the seabed (Zhao et al., 2015). Although the associated pressure variations are relatively small (a few kilopascals), such fluctuations are sufficient to influence methane transport in over pressured sediments by modulating effective stress, fracture permeability, and gas hydrate stability (Zhao et al., 2015). Observations at Site F in this study reveal that gas plume activity varies systematically with tidal cycles, particularly during rising tides toward higher high water and falling tides toward lower low water, underscoring the importance of tidal stress fluctuations as a key driver of methane release in the Formosa Ridge cold seep system.
3 Materials and methods
3.1 Experimental settings
The first-generation long-term ocean observation platform was developed for in situ, long-term monitoring of deep-sea ecosystems and is described in detail by Du et al. (2023); Zhang et al. (2023). While effective in continuous environmental monitoring, its deployment and recovery required complex equipment, large oceanographic vessels, and specialized crews, resulting in high operational costs.
To address these challenges, a second-generation “mini” long-term observation platform was developed. This upgraded system incorporates an automatic floating recovery function and improved deployment instrumentation, enabling cost-effective operations from smaller research vessels and expanding opportunities for repeated field campaigns.
To investigate the long-term variability of methane bubble emissions at Site F, we collected echo intensity and current velocity data using upward-looking Acoustic Doppler Current Profilers (ADCPs) mounted on both the first-generation (LOOP) and second-generation (MINI-LOOP) platforms. And we infer the presence of methane bubbles using acoustic contrast signals reflected in the ADCP’s echo intensity. Such an application has been presented in previous studies to detect methane bubbles (Wiggins et al., 2015; Philip et al., 2016). Because a bubble has much a lower density than the surrounding seawater, the bubble-seawater interface has high impedance contrast. As a result, an ADCP would record high signal intensities of echos returning from the bubbles when they intersect the ADCP beams (Figure 2).
Figure 2
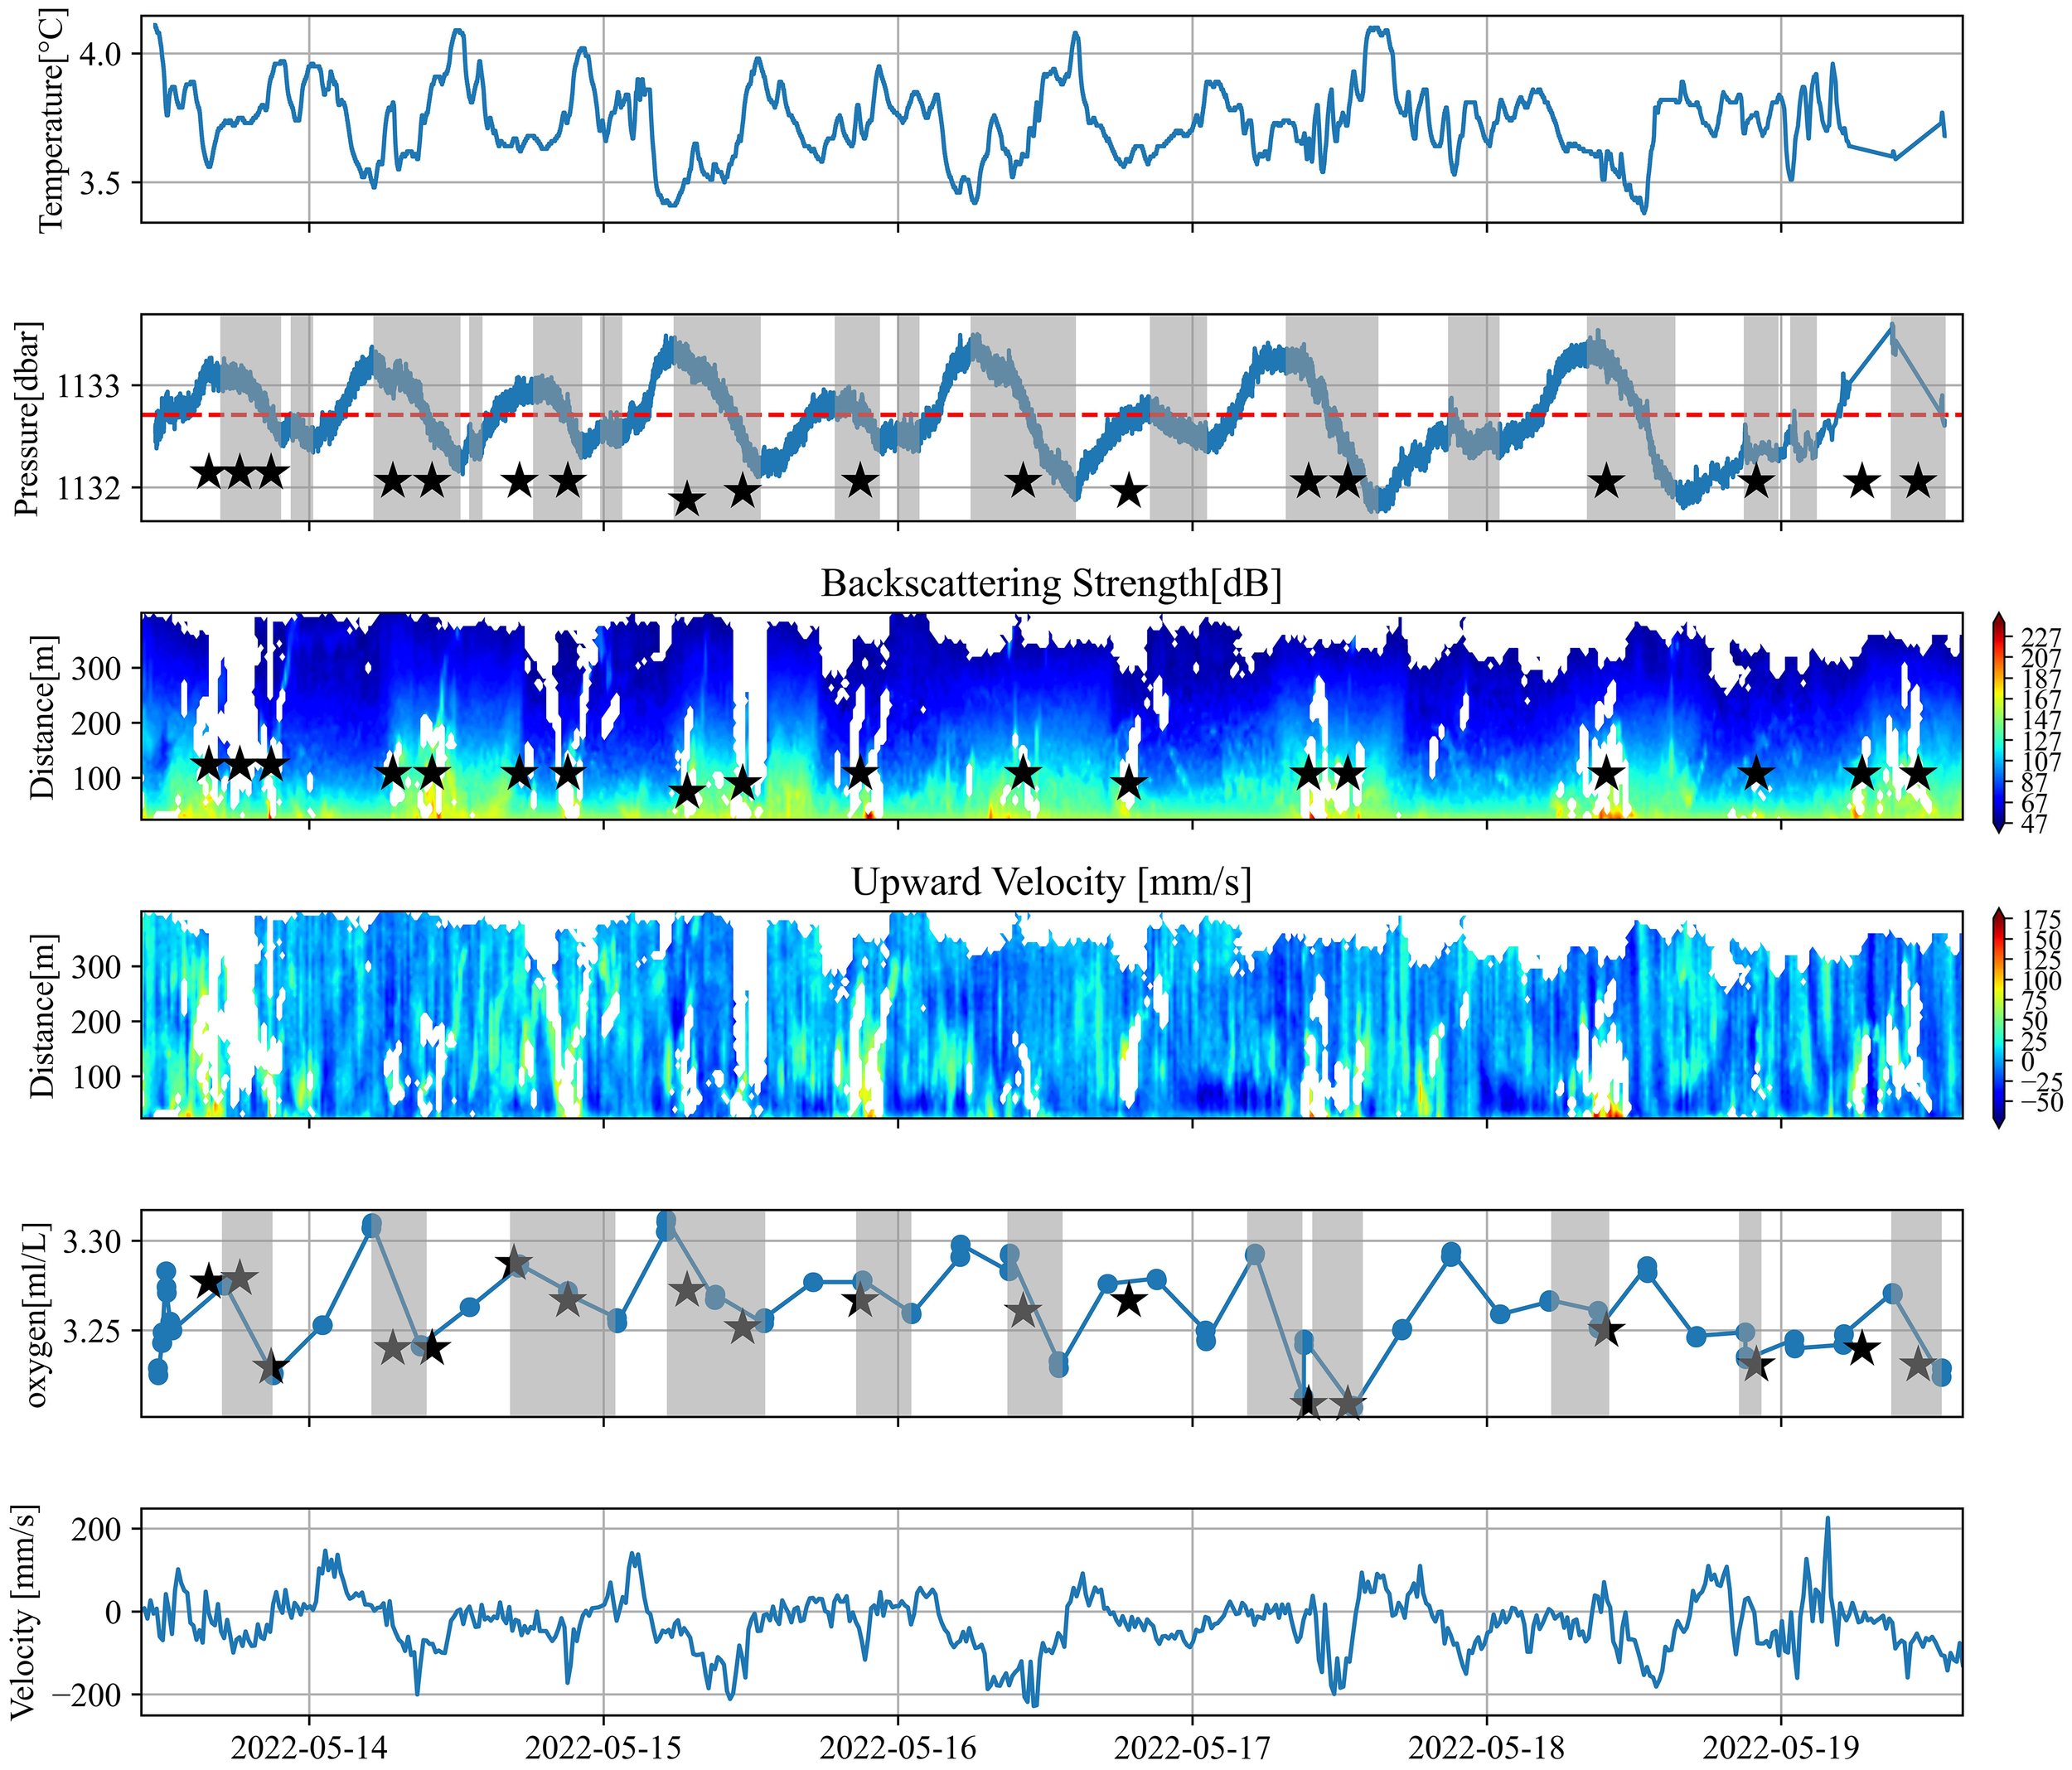
Temporal variations of key oceanographic parameters recorded during the MINI-LOOP deployment (2022). From top to bottom: chlorophyll-a, salinity, dissolved oxygen, temperature, pressure, ADCP backscatter intensity (beam 4), and vertical seawater velocity. Grey shaded areas indicate the tidal downturn phase. Black pentagrams denote the occurrence of gas emission events.
3.2 Platform design and observation strategy
In both deployments, the ADCPs were configured with a vertical resolution of 8 m, starting 15.88 m above the seafloor (after correcting for transducer depth) and transmitted acoustic pulses every 20 s. In addition to measuring vertical current profiles via Doppler frequency shift, they recorded high-resolution acoustic backscatter data to assess the frequency, vertical extent, and variability of bubble plumes.
As shown in Figure 1, both platforms were deployed near the summit of Formosa Ridge, an active seepage area on the northern continental slope of the South China Sea. The LOOP deployment occurred from 2 to 18 July 2016 at a depth of ~1174 m, while the MINI-LOOP was deployed from 13 to 19 May 2022 at a depth of ~1133 m, approximately 20 m northwest of the 2016 site. Both were positioned close to the main bubble plume axis; however, local bottom currents—particularly a northwestward flow—occasionally deflected the bubble stream away from the ADCP’s vertical beam path.
Instrumentation differed between deployments: LOOP carried turbidity, CTD, dissolved oxygen, and ADCP sensors, whereas MINI-LOOP lacked a turbidity sensor. This difference is noted in Section 4.2 and was considered when interpreting the time-series data. A schematic diagram (Figure 1B) illustrates the deployment sites, bubble plume location, and influence of bottom currents on plume trajectory relative to the ADCP.
3.3 Data processing
In the context of this study, backscattered volume scattering strength refers to the intensity of acoustic energy reflected back to the transducer from suspended particles or gas bubbles in the water column. It is a function of the acoustic impedance contrast between bubbles and surrounding seawater. Because methane bubbles have significantly lower density and sound speed than water, they strongly reflect acoustic signals, resulting in elevated backscatter levels. Thus, backscattered volume backscattering strength (Sv) serves as a proxy indicator for the presence and temporal variability of methane bubble plumes in the water column, and received intensities can be converted into backscattering strength by the equation presented (Christie and Neill, 2022) (Equation 1):
where is a constant that depends on each measuring equipment, is the water temperature (°C), is the distance between the acoustic sensor and scatterers (m), is a term related to pulse length (dB), and represents the transmission output (dB). Furthermore, is the acoustical absorption coefficient (dB/m), is the correction term to convert the measured amplitude counts on the ADCP to decibels (dB/count), is the RSSI (returned signal strength indicator) for each beam (count), and is the RSSI for noisy environments without signal (count). Therefore, the backscattering strength can be very easily calculated using Equation 1 with the measured echo intensity by applying the equipment parameters summarized in Table 1.
Table 1
| C | Tx | LDBM | PDBW | α | kc | Er |
|---|---|---|---|---|---|---|
| −140.87 dB | 3.44 °C | −0.4576 dB | 14.0 dB | 0.025 dB/m | 0.45 dB/count | 40 count |
Parameters for equipment setting.
However, there are many cases where the operator does not know the equipment parameters. To deal with this situation, we also tried to calculate the backscattering strength directly from the volume reverberation using the sonar (Equation 2) (Bae et al., 2022).
where the received level (RL) reflected from the bubble cluster can be expressed as (Equation 3):
and the source level (SL) can be expressed as (Equation 4):
Here, is the volume steering by the transmitted beam. is the transmission loss containing the absorption. This varies according to the marine environment, so there are several formulas to define it. Teledyne RD Instruments suggested (Mullison; Deines, 1999). Flagg and Smith (1989) and Kang and Na (1994) suggested (Flagg and Smith, 1989; Kang and Na, 1994). Instead, Jurng (1996) applied as a TL formula for the environment (Bae et al., 2022). In this paper, we followed Jurng (1996)’s approach. is the bin size for the ADCP. represents the output voltage (115 W) and represents the transmission directivity index (19.32 dB). is the geometrically calculated steering volume induced by the beam, which is obtained by applying 2.2◦ of a 3 dB beamwidth and 0.9 m of pulse length. Finally, the volume scattering strength for the bubble can be estimated using the depth-dependent echo intensity acquired by the ADCP and the above-described sonar equation.
4 Results
4.1 In-situ observation of LOOP
From July 2 to July 18, 2016, CTD measurements at Site F recorded bottom water pressures between 1172.66 and 1176.06 dbar (mean ± SD: 1174.43 ± 0.57 dbar; Figure 3). Bottom water temperatures ranged between 3.04°C and 4.22°C, with a mean of 3.54°C and a standard deviation of 0.18°C. Salinity values varied between 34.44 and 34.59 PSU (mean ± SD: 34.52 ± 0.01 PSU), and dissolved oxygen concentrations ranged from 2.75 to 3.48 ml l-¹ (mean ± SD: 2.88 ± 0.07 ml l-¹). Turbidity values ranged from 28.11 to 28.46 FTU (mean ± SD: 28.24 ± 0.04 FTU). All parameters displayed semi-diurnal variability.
Figure 3
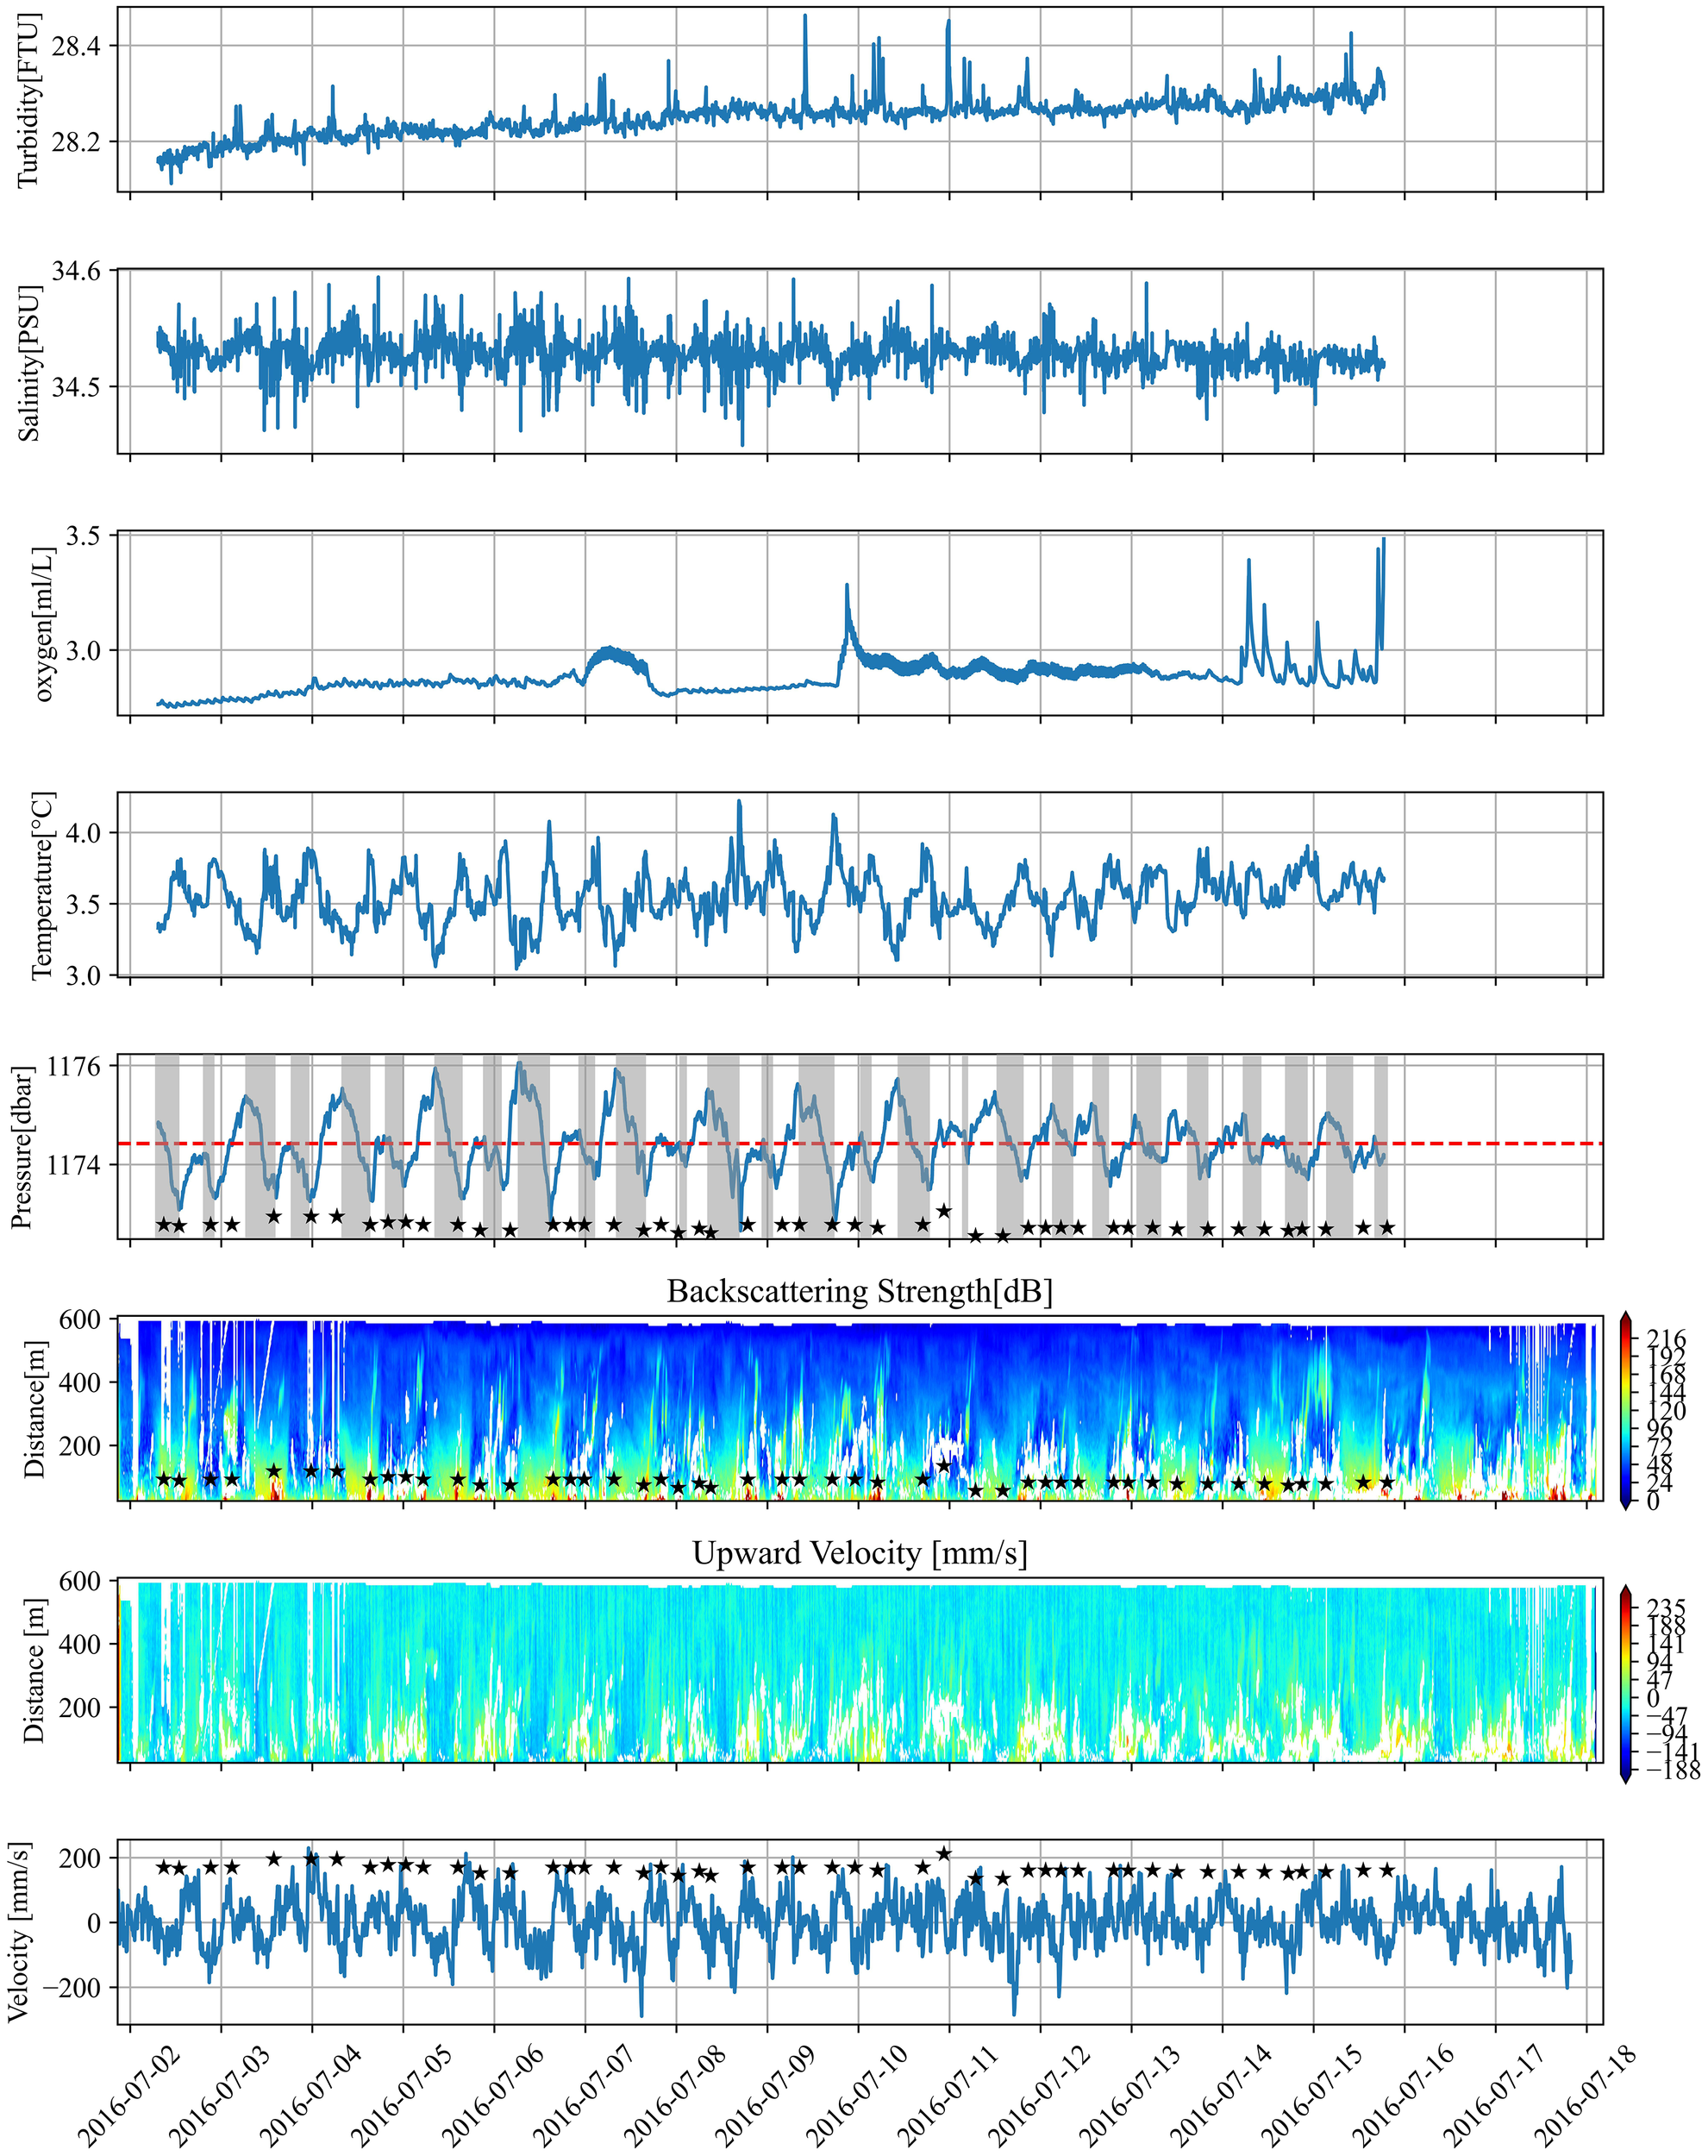
Physical and oceanographic parameters recorded simultaneously during the LOOP deployment (July 2–18, 2016). From top to bottom: chlorophyll-a, turbidity, salinity, dissolved oxygen, temperature, pressure, ADCP backscatter intensity (beam 4), and vertical seawater velocity. Grey shaded areas indicate the tidal downturn phase. Black pentagrams denote the occurrence of gas emission events.
ADCP data indicated that current velocities in the upper 200–400 m of the water column were higher than those at greater depths (Figure 4). Near the seafloor, currents were primarily aligned with the northwestward flow. Vertical velocities were generally non-negative, showing semi-diurnal fluctuations between near-zero values (0 to +250 mm s-¹) and upward motions exceeding 150 mm s-¹. These upward motions extended up to ~400 m above the seafloor and were associated with intermittent gaps in ADCP velocity profiles across all four beams.
Figure 4
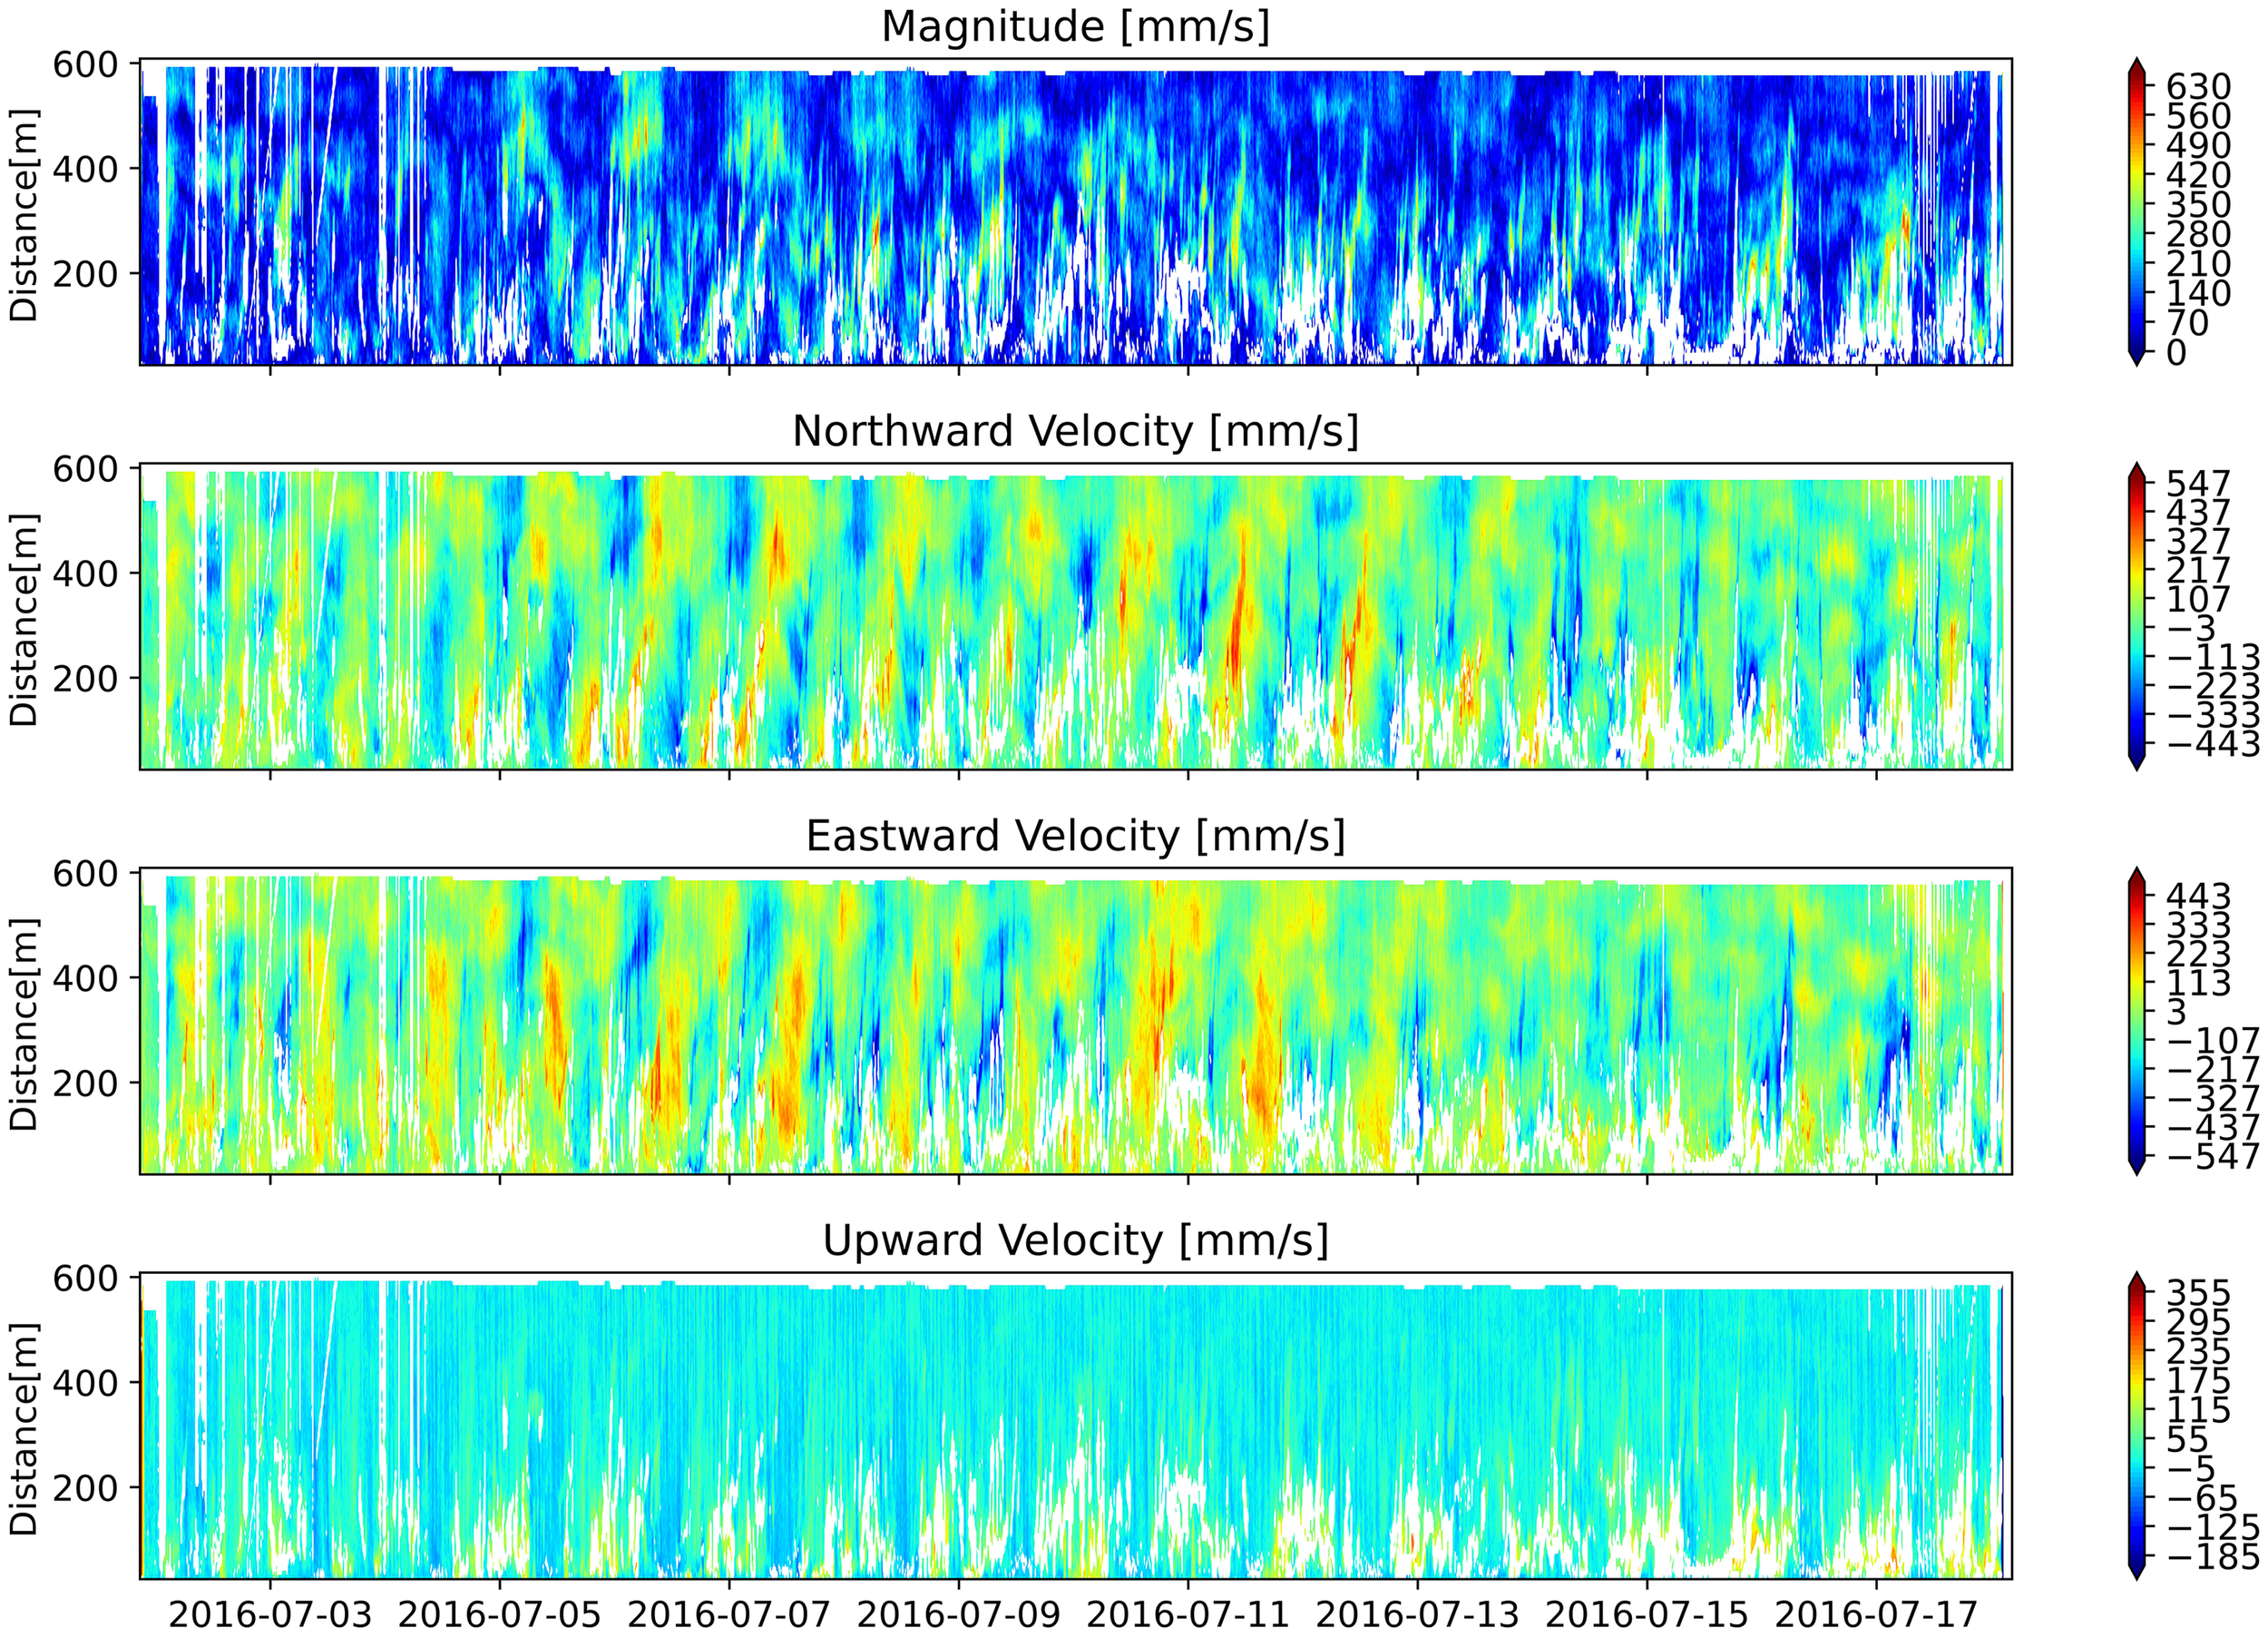
ADCP velocity measurements. White areas in the velocity plots represent data gaps, primarily caused by the interference of bubble plumes with the ADCP acoustic beam (Philip et al., 2016).
4.2 In-situ observation of MINI-LOOP
Between May 13 and May 19, 2022, CTD measurements at Site F recorded bottom water pressures between 1131.76 and 1133.60 dbar (mean ± SD: 1132.71 ± 0.02 dbar; Figure 2). Bottom water temperatures ranged between 3.38°C and 4.11°C, with a mean of 3.73°C and a standard deviation of 0.14°C. Dissolved oxygen concentrations ranged from 3.21 to 3.31 ml l-¹. Temperature, salinity, and pressure variability during this period showed the same semi-diurnal pattern described in Section 4.1.
ADCP data revealed relatively high current speeds at ~200 m depth (Figure 5). Near the seafloor, currents were oriented predominantly northwestward. Vertical velocities below 400 m were mainly non-negative, with intermittent upward velocities exceeding 170 mm s-¹ that extended up to ~400 m above the seafloor. Above this height, upward velocities were markedly reduced. As in 2016, upward velocity events coincided with intermittent gaps in ADCP beam data.
Figure 5
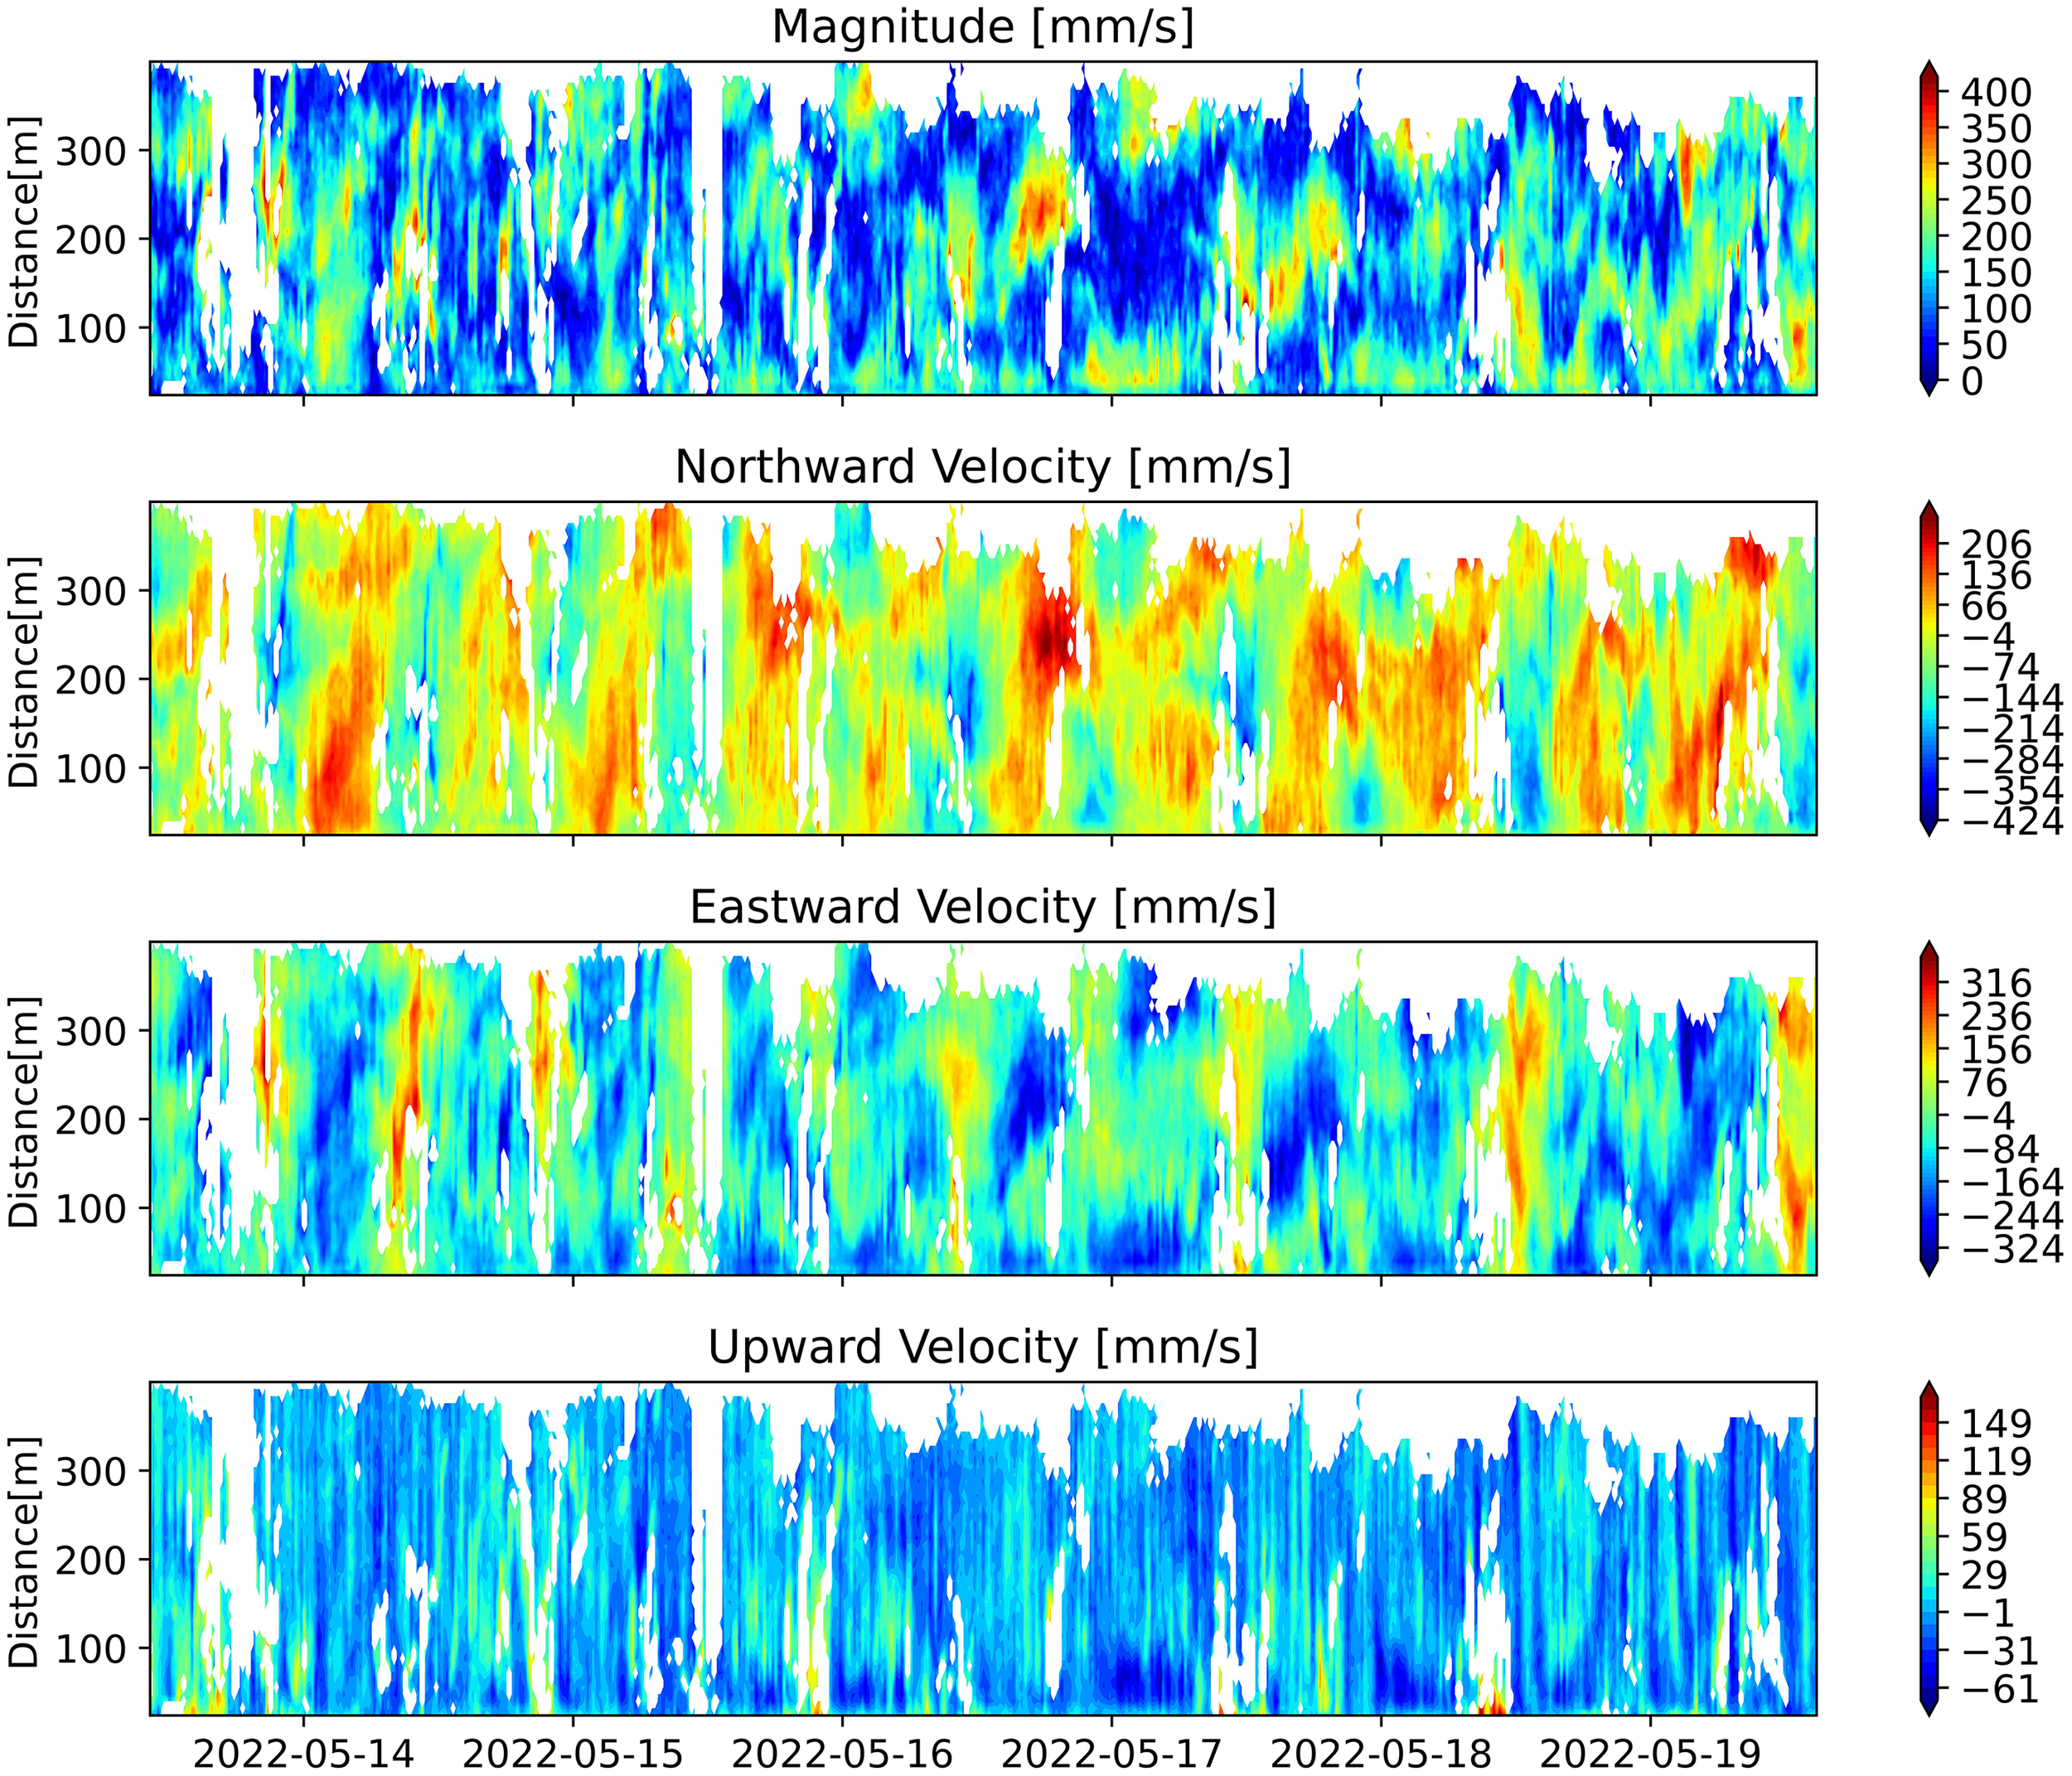
ADCP velocity measurements. White regions in the plots represent data gaps, primarily caused by interference from bubble plumes with the ADCP acoustic beam (Philip et al., 2016).
During both deployment periods (2016 and 2022), elevated values of backscattering strength were observed near the known active seep location. Peaks in echo intensity consistently coincided with tidal lows, suggesting that methane bubble emissions increase during falling tide phases. The backscatter values ranged from 0–240 dB in 2016 and 30–247 dB in 2022, consistent with previous characterizations of bubble plumes. These observations confirm that the backscattering strength measured by the ADCP is a reliable indicator of episodic methane release, with clear tidal modulation. Furthermore, no significant increases were observed in background periods, supporting the specificity of this method for active seepage detection.
5 Discussion
During the LOOP deployment in 2016, a total of 49 gas emission events were recorded, of which 34 events (69.38%) occurred during low tide, and 15 events (30.62%) during high tide. Among the low-tide emissions, 93.33% occurred below the mean tidal pressure, highlighting that reduced hydrostatic pressure provides favorable conditions for gas escape from the seafloor (Figure 6). In contrast, during the MINI-LOOP deployment in 2022, 18 gas emission events were observed, with 14 events (77.78%) occurring during high tide and only four events during low tide (Figure 6).
Figure 6
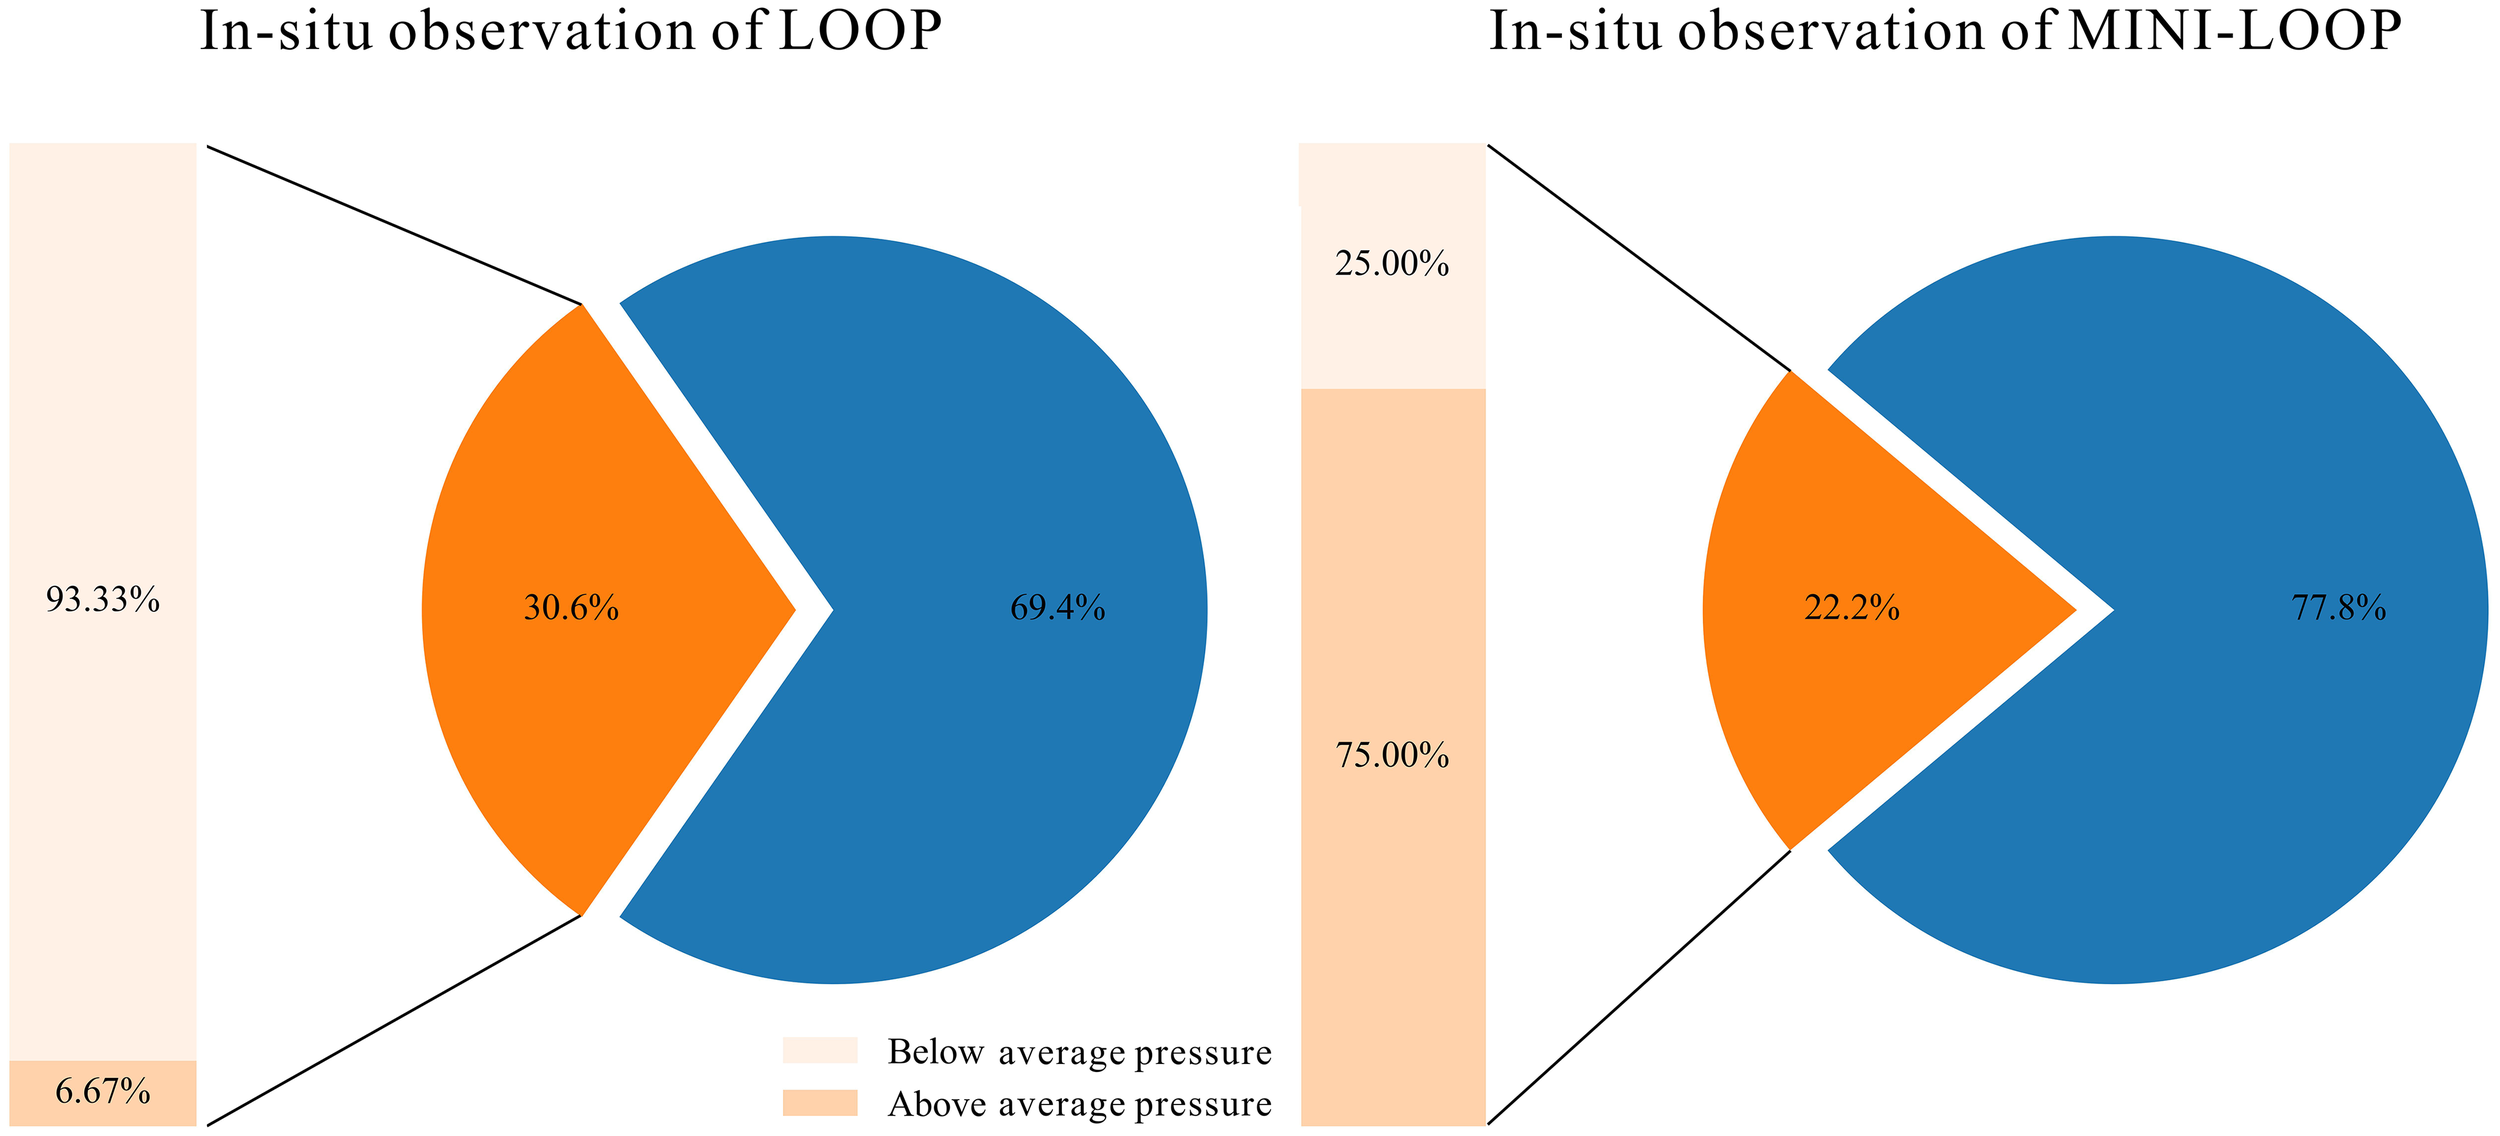
Distribution of gas emission events relative to tidal stage and seafloor pressure at Site F. Blue segments of the pie charts represent events occurring at low tide. Orange segments represent events at high tide, with darker orange indicating the total high-tide events and two lighter orange segments showing the proportion of events occurring above and below the mean seafloor pressure during high tide. The bars indicate the relative seafloor pressure at the time of gas emission events during high tide. This visualization highlights the role of tidal forcing and pressure variations in modulating methane release patterns.
Comparative analysis of the two observation periods demonstrates notable temporal variability in the tidal dependence of methane emissions. While there is a general tendency for emissions to occur during low-tide phases, the proportion of high-tide events varied between deployments, indicating that tidal forcing alone does not fully govern the timing of bubble plume initiation or high ebullition events. This variability suggests that additional environmental and geological factors—such as local bottom currents, pressure anomalies, or sediment characteristics—also modulate gas release from the seafloor.
Figure 6 further illustrates the relationship between tidal stage and methane emissions at Site F. Low-tide events (blue) are more frequent, corresponding to periods of reduced seafloor hydrostatic pressure, whereas high-tide events (orange) are less frequent due to elevated confining pressure. Within the high-tide category, two lighter orange segments denote the proportion of events occurring above and below the mean seafloor pressure, providing additional insight into the influence of pressure variations during high tide. The accompanying bars show the relative seafloor pressure at the time of high-tide events, emphasizing the combined role of tidal and pressure dynamics in modulating methane emissions.
5.1 Gas plume distribution at site F
Extensive research has underscored the significance of chemosynthetic communities at cold seep sites in elucidating the characteristics and dynamics of cold seep fluids (Sibuet and Olu, 1998; Hovland, 2002; Vanreusel et al., 2009; Levin et al., 2016; Sen et al., 2018). At the Site F cold seep, the remarkable density and biomass of these communities, coupled with high methane (CH4) levels, suggest active and substantial seepage (Zhang et al., 2023). The authigenic carbonate mound at this Site F offers an efficient pathway for the sustained release of cold seep fluids to the seabed, thus supporting these ecosystems. The spatial distribution and forms of the benthic communities act as precise indicators for the discharge points of seep fluids, especially at the intersections of gas conduits within the carbonate mound and the seabed. Notably, Site F shows advanced ecological development, characterized by a well-formed carbonate hardground that facilitates the growth of bathymodiolin mussels. This environment, enriched by continuous seepage, harbors a diverse assemblage of chemosymbiotic mussels, galatheid crabs, and an array of grazers and predators (Feng and Chen, 2015; Feng et al., 2018).
Recent integrations of acoustic and visual data, along with in-situ geochemical analysis, have led to a conceptual model of the subsurface cold seep fluid conduits at Site F (Wang et al., 2021). Essentially, the authigenic carbonate mound contains conduits that channel cold seep fluids, causing focused discharge at conduit-seabed junctions, which sustains the dense benthic communities. Furthermore, these carbonate formations divert some fluids to peripheral seeps, resulting in altered sediment composition. Additional studies, such as carbonate oxygen isotope analysis (Feng and Chen, 2015) and observations of gas hydrate formation along venting channel walls (Zhang et al., 2017), support the hypothesis that gas hydrates may form and be stored within the mound’s cavities and conduits, as well as in adjacent sediment layers.
5.2 Temporal variations
In their study, Kunath et al. (2022) employed high-resolution 3D seismic data to visualize stratigraphic and structural relationships related to fluid expulsion. This analysis offered insights into the temporal and spatial constraints of the gas hydrate system at various depths, as well as the occurrence of methane seepage in both contemporary and ancient seafloor settings. The accumulation of gas beneath the gas hydrate stability base reached a critical thickness, leading to hydraulic fracturing, vertical gas conduit propagation, and the formation of morphological features (referred to as “mounds”) at ancient seafloor horizons. These mounds document multiple distinct gas migration episodes occurring between 300,000 and 127,000 years ago, interspersed with dormant periods. Notably, episodic seepage continues to occur today, as indicated by the presence of two separate fronts of ascending gas within the conduits (Kunath et al., 2022). This gas release at the Site F summit alternates between active and inactive phases and is supplied with free gas from the hydrate reservoir through a network of fractures.
Based on their model, Kunath et al. (2022) suggest that venting at the Site F is periodic, alternating between quiescent and active phases over decades. However, this model does not fully explain the high-frequency variability observed in local gas release. Our study, along with Wang et al (2021), has observed simultaneous bubble release at multiple points across the Site F summit, with activation and intensity of each plume showing variations within a day. This pattern is particularly evident from our systematic monitoring, which reveals that individual plumes can start and stop within as little as a few hours, sometimes less than two hours. Despite such localized variations, the broader scale of gas release at the Site F summit appears to be persistent and continuous. According to Zhang et al. (2023), gas emission has likely been ongoing throughout both our current and past monitoring periods, influenced by bottom pressure changes associated with the barotropic tide. Intriguingly, this tidal influence is also observed at the level of individual vents and bubble plumes, which often exhibit rapid temporal fluctuations in sync with bottom pressure changes. Yet, the pattern of alternating active and inactive phases in venting is not clearly defined and cannot be solely attributed to tidal influences. Our data indicate potential interactions among vents. This section further explores the role of tides in actively triggering bubble release, while recognizing that tidal forces are not the only factors influencing the commencement and termination of bubble plumes and high ebullition events.
5.2.1 Tidal modulation
The possibility of a tidal control over the gas emissions at Site F has been subject to discussion, but previously could neither be confirmed nor rejected due to the lack of systematic observations over multiple tidal cycles. Our study demonstrates that even in long-lived seep systems, methane emissions can exhibit intermittent activity at both long (e.g., glacial-interglacial) and short (e.g., tidal to seasonal) timescales. While regional-scale processes—such as sea-level fluctuations and bottom-water warming—are known to trigger gas hydrate dissociation over geological timescales (Biastoch et al., 2011; Boetius and Wenzhöfer, 2013; Levin et al., 2016), these factors may not be necessary triggers for the short-term variability observed in our high-resolution time series. Instead, our results reveal a clear and consistent correlation between gas bubble emissions and ocean tides (Figure 6), particularly with the diurnal and semidiurnal constituents, consistent with earlier observations (Hsu et al., 2013).
The prevailing understanding in the field indicates that methane bubble fluxes generally increase when bottom pressure decreases, as evidenced by the findings of Boles et al. (2001); Jackson et al. (1998); Leifer and Boles (2005); Martens and Klump (1980); Römer et al. (2016); Von Deimling et al. (2010), and Tryon et al. (1999). This trend is attributed to the effect of tidal loading and unloading cycles on sediment pore pressure and permeability, as described by Wang et al. (1998), which in turn affects the rate of gas release. During low tides, the reduction in hydrostatic pressure eases the dilation of fractures, enabling pore gas pressure to exceed the total stress, leading to rapid gas discharge. This process is detailed in studies by (Tryon et al., 1999, Tryon et al., 2002; Leifer and Boles, 2005; Liu and Flemings, 2009; Scandella et al., 2011).
This understanding is further supported by recent in-situ pore pressure measurements in gas-rich sediments at the Vestnesa Ridge in NW Svalbard, at depths ranging from 910 to 1,330 meters. The study by Sultan et al. (2020) confirmed that tidal variations in hydrostatic pressure induce local pore pressure gradients, which facilitate the release of gas into the water column during periods of decreasing tide. These findings are consistent with our observations, where an increase in gas emissions is frequently noted during periods of tidal unloading, reinforcing the concept of pressure control overactive gas emissions.
Scandella et al. (2011) suggest that the volume of gas released into the water column is contingent upon the depth at which flow conduits dilate, a process largely influenced by the extent of hydrostatic pressure reduction. Observations of free gas both beneath the BSR and within conduits throughout the Gas Hydrate Stability Zone (GHSZ) at Southern Hydrate Ridge (SHR). Wang et al. (2021)and Kunath et al. (2022) demonstrated similar models of conduits expansion at Site F. This model aligns with our findings that gas emissions intensify during low tides, in contrast to high tides. High tides, distinguished by larger hydrostatic loading/unloading cycles, are likely to induce deeper dilation in flow conduits than neap-tides, potentially leading to a more substantial release of gas.
Our time-series analysis of methane emissions reveals that bubble activity systematically varies with tidal stage, as illustrated in the revised conceptual model (Figure 7). During high tide, elevated hydrostatic pressure at the seafloor suppresses gas escape, resulting in minimal bubble emissions. At mid tide, as tidal pressure decreases, the overlying stress on sediments is reduced, allowing moderate bubble release. The highest emission frequency occurs during low tide, when tidal pressure is at its minimum and accumulated pore pressure is most readily released. Following low tide, tidal pressure begins to rise again, reducing bubble flux and allowing pore pressure to accumulate beneath the gas hydrate stability zone, completing the cycle.
Figure 7
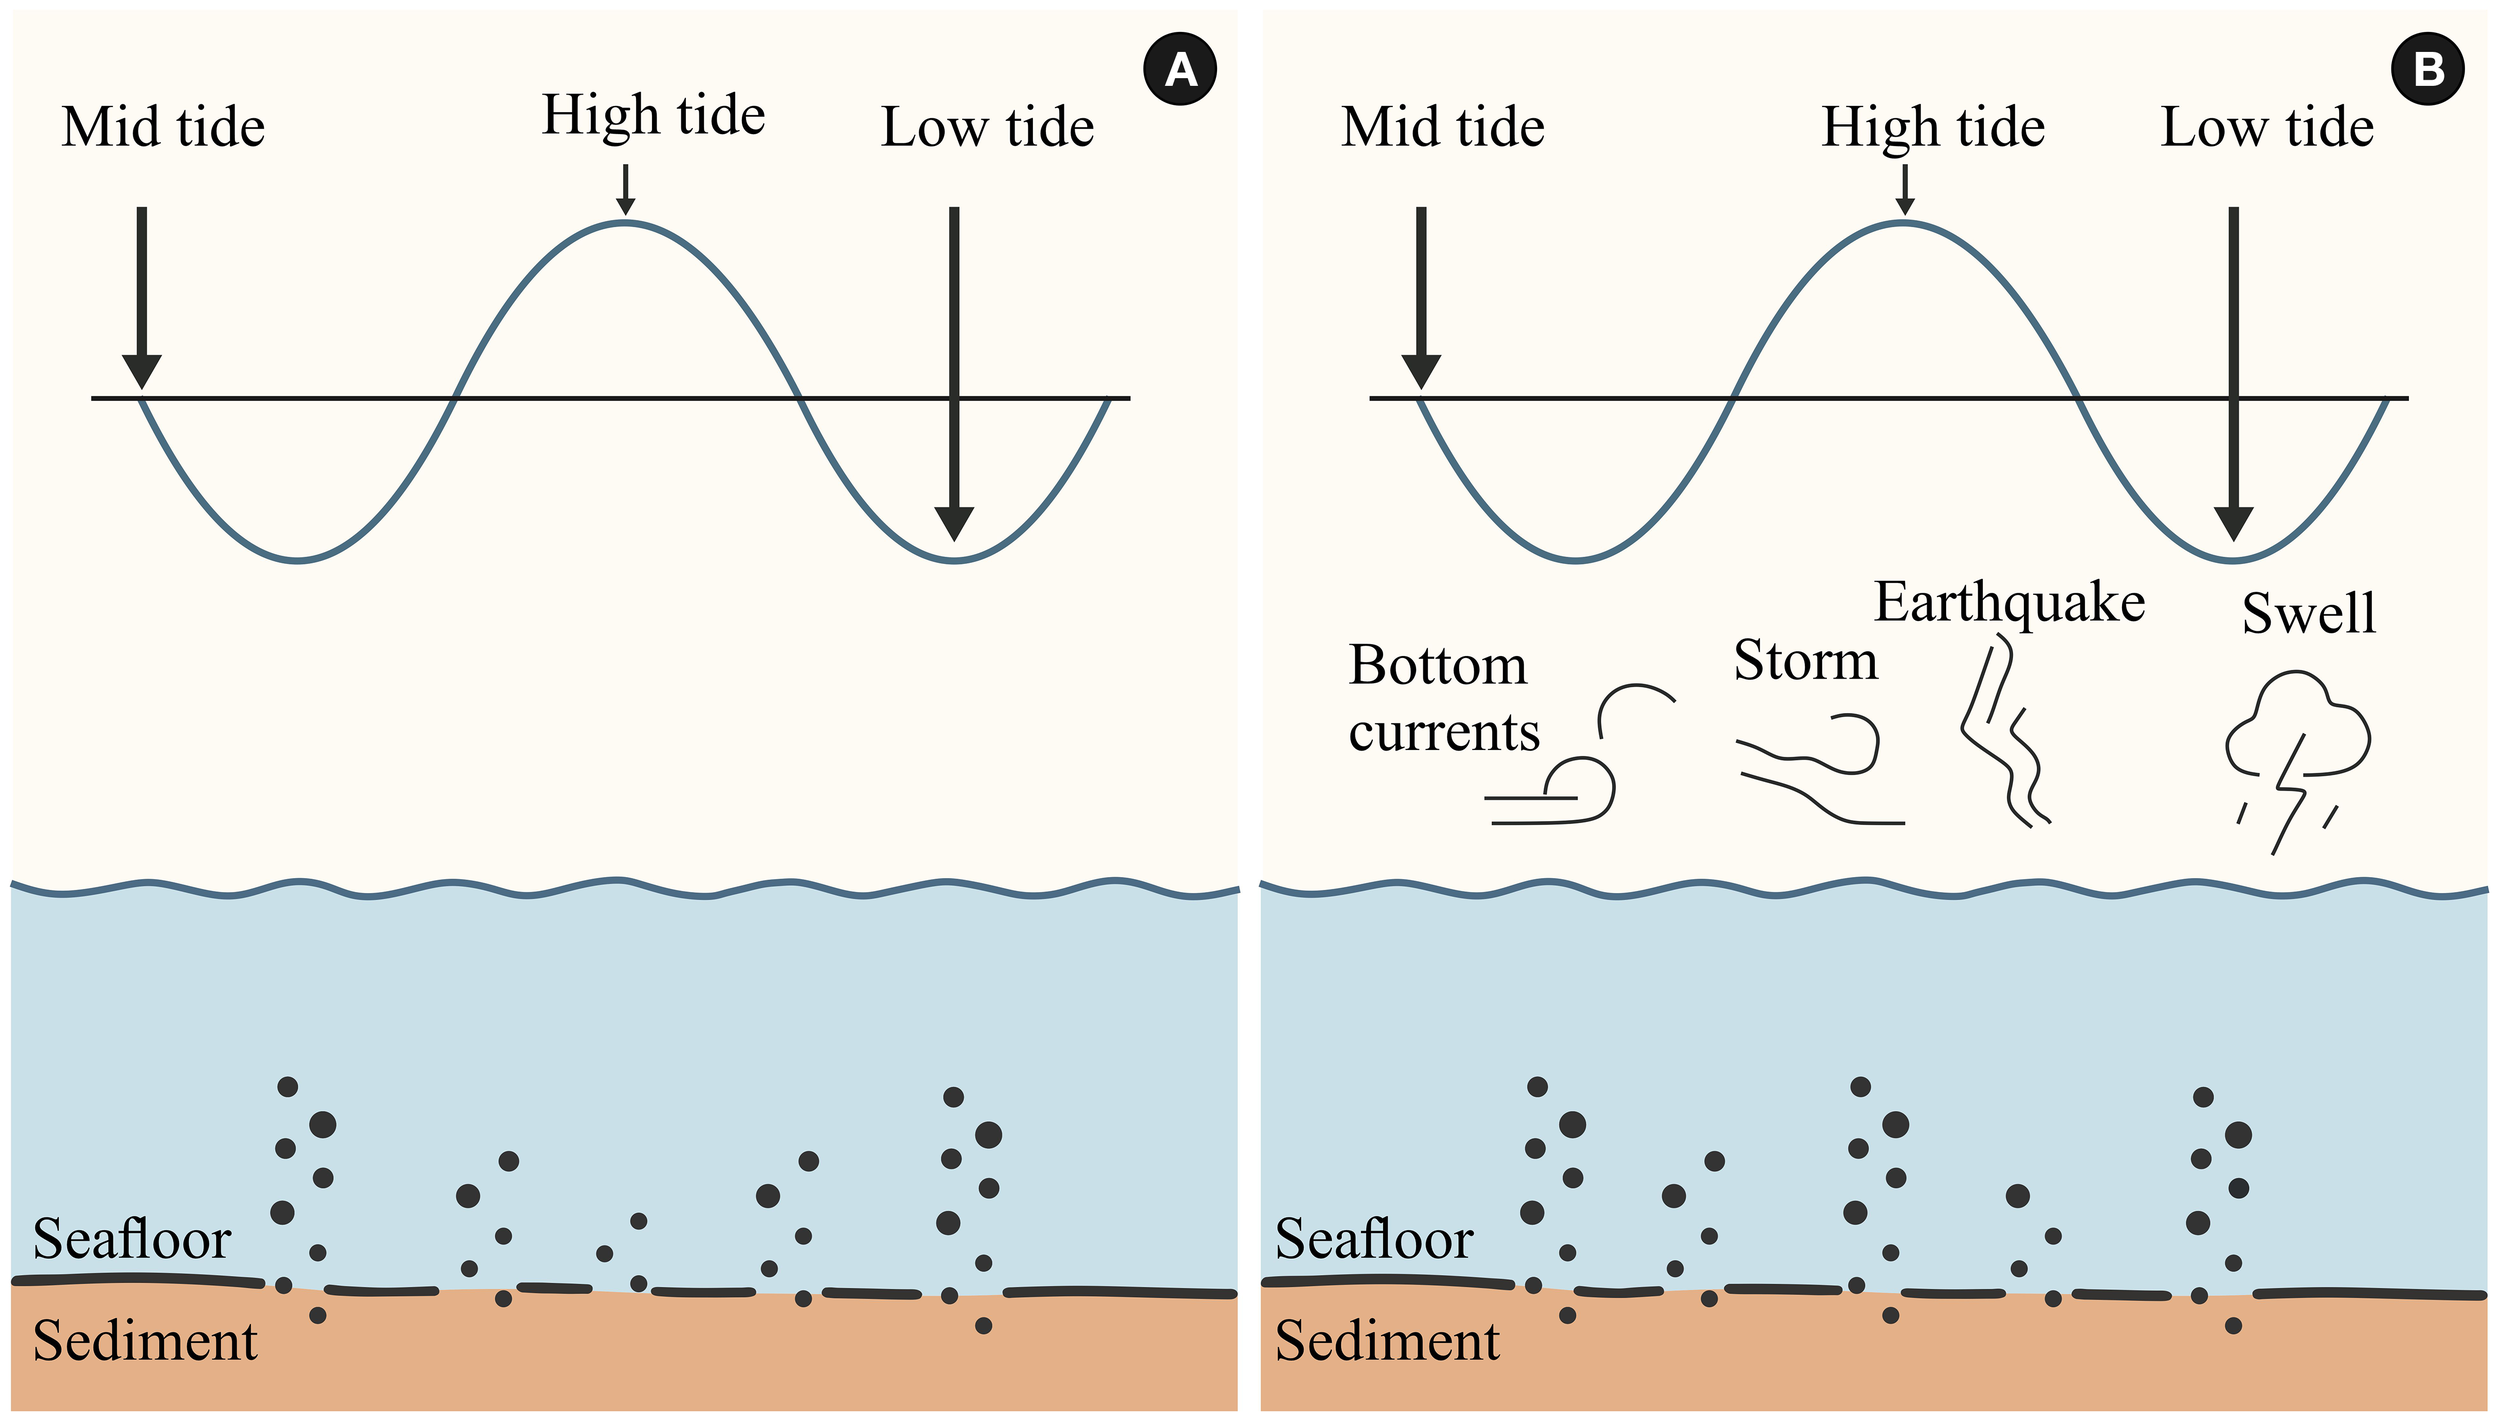
Conceptual model of long-term bubble emission behavior at Site (F) Bubble density is positively correlated with emission intensity. (A) Under tidal control, bubble emissions are strongest at low tide, weaken at mid tide, and are weakest at high tide. (B) When additional factors—such as bottom currents, storms, earthquakes, and swells—interact with tidal forcing, tidal influence becomes secondary, and bubble emissions display more random patterns. This conceptual model highlights the interplay of multiple environmental drivers, with tides acting as an important but not exclusive factor.
5.2.2 Non-periodic variability
Our data largely supports the theory that tidal forces impact methane emissions, yet it is important to recognize that not all emission peaks can be attributed solely to variations in bottom pressure. Our observations reveal that sudden ebullition events, marked by rapid bubble release, sometimes begin during flood tides, albeit less frequently than during ebb tides (Figure 6). ROV investigations have discovered that gas flares, typically indicated by bubbles emerging from centimeter-sized openings, primarily occur within authigenic carbonate mounds surrounded by dense biological communities. This finding points to a key aspect of variability: gas flares observed in earlier dives were absent in subsequent dives during the same expedition, despite similar activity levels recorded on two different research cruises two years apart (Wang et al., 2021). This suggests that gas emissions at these sites are dynamic and transient, indicating that factors beyond tidal forces are influential.
Episodic seepage in the northern South China Sea has been documented previously (Liang et al., 2017; Feng et al., 2018), with some studies correlating seepage events to sea-level lowstands and bottom-water warming—both of which can destabilize gas hydrates and promote methane release over longer timescales. In our context, however, we observe that short-term variability in seepage appears to be modulated by more dynamic and local mechanisms. For instance, strong bottom currents (as indicated by ADCP data, Figures 2 , 6) may erode shallow hydrate layers, enhancing their dissolution and weakening the physical barriers to gas migration (Thomsen et al., 2012). Similar processes have been reported elsewhere [e.g (Nash and Moum, 2001)];, where seabed turbulence alters pore pressure regimes and increases sediment permeability. Additionally, variations in seafloor morphology, carbonate mound structure, and biological cover could locally influence seep activity. These non-periodic mechanisms—distinct from both long-term climate forcing and short-term tidal modulation—may account for irregularities in emission patterns that cannot be attributed to tidal loading alone.
6 Conclusion
Our observations of gas emission activity at the cold seep site, Site F, revealed a predominant tidal influence on seep activity. We propose a conceptual framework for Site F in which gas emissions are regulated over short timescales (hours to days) by tidal forcing, as well as by longer-period variations in the surrounding oceanographic regime (spanning months to possibly years). Our findings indicate that the same seep site can exhibit highly variable behavior, ranging from nearly continuous gas release to periods of minimal activity with only brief bursts of emissions. Quantifying gas fluxes from such dynamic systems is extremely challenging. While estimating the total carbon flux from the seafloor to the ocean remains a critical objective, such estimates must be approached with caution due to substantial uncertainties. To reduce these uncertainties, additional long-term monitoring at similar seep sites over extended periods is necessary. Such efforts are essential to better constrain the contribution of seafloor carbon flux to the global ocean and to address its implications for broader issues such as ocean acidification and the effects of ocean warming.
Statements
Data availability statement
The raw data supporting the conclusions of this article will be made available by the authors, without undue reservation.
Author contributions
XOZ: Conceptualization, Funding acquisition, Resources, Supervision, Investigation, Validation, Writing – review & editing. XZ: Data curation, Formal analysis, Investigation, Methodology, Software, Validation, Visualization, Writing – original draft, Writing – review & editing, Conceptualization. ZL: Software, Investigation, Writing – review & editing. ZD: Investigation, Software, Writing – review & editing. LL: Investigation, Software, Writing – review & editing. SX: Investigation, Software, Writing – review & editing. CL: Investigation, Software, Writing – review & editing.
Funding
The author(s) declare financial support was received for the research and/or publication of this article. This research was supported by the following grants: the National Natural Science Foundation of China (92358301, 42327805, 42221005), Data and samples were collected onboard of R/V “Dongfanghong 3” implementing the open research cruise NORC2021-582 supported by NSFC Shiptime Sharing Project (grant No. 42049582).
Conflict of interest
The authors declare that the research was conducted in the absence of any commercial or financial relationships that could be construed as a potential conflict of interest.
Generative AI statement
The author(s) declare that no Generative AI was used in the creation of this manuscript.
Any alternative text (alt text) provided alongside figures in this article has been generated by Frontiers with the support of artificial intelligence and reasonable efforts have been made to ensure accuracy, including review by the authors wherever possible. If you identify any issues, please contact us.
Publisher’s note
All claims expressed in this article are solely those of the authors and do not necessarily represent those of their affiliated organizations, or those of the publisher, the editors and the reviewers. Any product that may be evaluated in this article, or claim that may be made by its manufacturer, is not guaranteed or endorsed by the publisher.
References
1
Bae H. S. Kim W. K. Son S. U. Kim W. S. Park J. S. (2022). An estimation of the backscattering strength of artificial bubbles using an acoustic doppler current profiler. Sensors (Basel)22. doi: 10.3390/s22051812
2
Biastoch A. Treude T. Rüpke L. H. Riebesell U. Roth C. Burwicz E. B. et al (2011). Rising Arctic Ocean temperatures cause gas hydrate destabilization and ocean acidification. Geophysical Res. Lett.38. doi: 10.1029/2011GL047222
3
Boetius A. Wenzhöfer F. (2013). Seafloor oxygen consumption fuelled by methane from cold seeps. Nat. Geosci.6, 725–734. doi: 10.1038/ngeo1926
4
Boles J. Clark J. Leifer I. Washburn L. (2001). Temporal variation in natural methane seep rate due to tides, Coal Oil Point area, California. J. Geophysical Research: Oceans106, 27077–27086. doi: 10.1029/2000JC000774
5
Chen F. Hu Y. Feng D. Zhang X. Cheng S. Cao J. et al (2016). Evidence of intense methane seepages from molybdenum enrichments in gas hydrate-bearing sediments of the northern South China Sea. Chem. Geology443, 173–181. doi: 10.1016/j.chemgeo.2016.09.029
6
Chen S.-C. Hsu S.-K. Tsai C.-H. Ku C.-Y. Yeh Y.-C. Wang Y. (2010). Gas seepage, pockmarks and mud volcanoes in the near shore of SW Taiwan. Mar. Geophysical Res.31, 133–147. doi: 10.1007/s11001-010-9097-6
7
Christie D. Neill S. P. (2022). Measuring and observing the ocean renewable energy resource. Compr. Renewable Energy8, 149–175. doi: 10.1016/B978-0-12-819727-1.00083-2
8
Deines K. L. (1999). “Backscatter estimation using broadband acoustic Doppler current profilers,” in Proceedings of the IEEE Sixth Working Conference on Current Measurement (Cat. No. 99CH36331) (San Diego, CA: IEEE), 249–253.
9
Du Z. Zhang X. Lian C. Luan Z. Xi S. Li L. et al (2023). The development and applications of a controllable lander for in-situ, long-term observation of deep sea chemosynthetic communities. Deep Sea Res. Part I: Oceanographic Res. Papers193. doi: 10.1016/j.dsr.2022.103960
10
Fechner-Levy E. J. Hemond H. F. (1996). Trapped methane volume and potential effects on methane ebullition in a northern peatland. Limnology Oceanography41, 1375–1383. doi: 10.4319/lo.1996.41.7.1375
11
Feng D. Chen D. (2015). Authigenic carbonates from an active cold seep of the northern South China Sea: new insights into fluid sources and past seepage activity. Deep sea Res. Part II: topical Stud. oceanography122, 74–83. doi: 10.1016/j.dsr2.2015.02.003
12
Feng D. Qiu J.-W. Hu Y. Peckmann J. Guan H. Tong H. et al (2018). Cold seep systems in the South China Sea: An overview. J. Asian Earth Sci.168, 3–16. doi: 10.1016/j.jseaes.2018.09.021
13
Ferré B. Jansson P. G. Moser M. Serov P. Portnov A. Graves C. A. et al (2020). Reduced methane seepage from Arctic sediments during cold bottom-water conditions. Nat. Geosci.13, 144–148. doi: 10.1038/s41561-019-0515-3
14
Fischer D. Mogollón J. M. Strasser M. Pape T. Bohrmann G. Fekete N. et al (2013). Subduction zone earthquake as potential trigger of submarine hydrocarbon seepage. Nat. Geosci.6, 647–651. doi: 10.1038/ngeo1886
15
Flagg C. N. Smith S. L. (1989). On the use of the acoustic Doppler current profiler to measure zooplankton abundance. Deep Sea Res. Part A. Oceanographic Res. Papers36, 455–474. doi: 10.1016/0198-0149(89)90047-2
16
Hovland M. (2002). On the self-sealing nature of marine seeps. Continental Shelf Res.22, 2387–2394. doi: 10.1016/S0278-4343(02)00063-8
17
Hsu S. Kuan P.-Y. (2013). The impact of multilevel factors on technology integration: The case of Taiwanese grade 1–9 teachers and schools. Educ. Technol. Res. Dev.61, 25–50. doi: 10.1007/s11423-012-9269-y
18
Hsu S.-K. Wang S.-Y. Liao Y.-C. Yang T. F. Jan S. Lin J.-Y. et al (2013). Tide-modulated gas emissions and tremors off SW Taiwan. Earth Planetary Sci. Lett.369-370, 98–107. doi: 10.1016/j.epsl.2013.03.013
19
Jackson D. R. Williams K. L. Wever T. F. Friedrichs C. T. Wright L. D. (1998). Sonar evidence for methane ebullition in Eckernförde Bay. Continental Shelf Res.18, 1893–1915. doi: 10.1016/S0278-4343(98)00062-4
20
Jurng M. (1996). Estimation of zooplankton biomass by volume scattering strength in coastal waters (Korea: Seoul National University Seoul).
21
Kang D. Na J. (1994). Comparison of the temperature profile with the backscattering strength by the ADCP data in the southwestern part of the east sea. J. Korean Soc Oceanogr29, 287–295.
22
Kannberg P. K. Tréhu A. M. Pierce S. D. Paull C. K. Caress D. W. (2013). Temporal variation of methane flares in the ocean above Hydrate Ridge, Oregon. Earth Planetary Sci. Lett.368, 33–42. doi: 10.1016/j.epsl.2013.02.030
23
Kessler J. Reeburgh W. Southon J. Varela R. (2005). Fossil methane source dominates Cariaco Basin water column methane geochemistry. Geophysical Res. Lett.32. doi: 10.1029/2005GL022984
24
Kunath P. Crutchley G. Chi W. C. Berndt C. Liu C. S. Elger J. et al (2022). Episodic venting of a submarine gas seep on geological time scales: Formosa Ridge, northern South China Sea. J. Geophysical Research: Solid Earth127, e2022JB024668. doi: 10.1029/2022JB024668
25
Lapham L. L. Alperin M. Chanton J. Martens C. (2008). Upward advection rates and methane fluxes, oxidation, and sources at two Gulf of Mexico brine seeps. Mar. Chem.112, 65–71. doi: 10.1016/j.marchem.2008.06.001
26
Lapham L. Wilson R. Riedel M. Paull C. K. Holmes M. E. (2013). Temporal variability of in situ methane concentrations in gas hydrate-bearing sediments near Bullseye Vent, Northern Cascadia Margin. Geochemistry Geophysics Geosystems14, 2445–2459. doi: 10.1002/ggge.20167
27
Leifer I. Boles J. (2005). Measurement of marine hydrocarbon seep flow through fractured rock and unconsolidated sediment. Mar. Petroleum Geology22, 551–568. doi: 10.1016/j.marpetgeo.2004.10.026
28
Levin L. A. Baco A. R. Bowden D. A. Colaco A. Cordes E. E. Cunha M. R. et al (2016). Hydrothermal vents and methane seeps: rethinking the sphere of influence. Front. Mar. Sci.3, 195812. doi: 10.3389/fmars.2016.00072
29
Liang Q. Hu Y. Feng D. Peckmann J. Chen L. Yang S. et al (2017). Authigenic carbonates from newly discovered active cold seeps on the northwestern slope of the South China Sea: Constraints on fluid sources, formation environments, and seepage dynamics. Deep Sea Res. Part I: Oceanographic Res. Papers124, 31–41. doi: 10.1016/j.dsr.2017.04.015
30
Liu X. Flemings P. (2009). Dynamic response of oceanic hydrates to sea level drop. Geophysical Res. Lett.36. doi: 10.1029/2009GL039821
31
Liu C.-S. Morita S. Liao Y.-H. Ku C.-Y. Machiyama H. Lin S. et al . (2008). “High-resolution seismic images of the Formosa Ridge off Southwestern Taiwan where ‘hydrothermal’ chemosynthetic community is present at a cold seep site,” in Proceedings of the 6th International Conference on Gas Hydrates, (Vancouver, British Columbia, Canada: ICGH).
32
Lv Y. Yang S. Xiao X. Zhang Y. (2022). Stimulated organic carbon cycling and microbial community shift driven by a simulated cold-seep eruption. mBio13, e00087–e00022. doi: 10.1128/mbio.00087-22
33
Martens C. S. Klump J. V. (1980). Biogeochemical cycling in an organic-rich coastal marine basin—I. Methane sediment-water exchange processes. Geochimica Cosmochimica Acta44, 471–490. doi: 10.1016/0016-7037(80)90045-9
34
Mau S. Valentine D. L. Clark J. F. Reed J. Camilli R. Washburn L. (2007). Dissolved methane distributions and air-sea flux in the plume of a massive seep field, Coal Oil Point, California. Geophysical Res. Lett.34. doi: 10.1029/2007GL031344
35
Mullison J. (2017). “Backscatter estimation using broadband acoustic Doppler current profilers–updated.” In: Proceedings of the ASCE Hydraulic Measurements & Experimental Methods Conference. Durham, NH, USA: American Society of Civil Engineers (ASCE).
36
Nash J. D. Moum J. N. (2001). Internal hydraulic flows on the continental shelf: High drag states over a small bank. J. Geophysical Research: Oceans106, 4593–4611. doi: 10.1029/1999JC000183
37
Nikolovska A. Sahling H. Bohrmann G. (2008). Hydroacoustic methodology for detection, localization, and quantification of gas bubbles rising from the seafloor at gas seeps from the eastern Black Sea. Geochemistry Geophysics Geosystems9. doi: 10.1029/2008GC002118
38
Philip B. T. Denny A. R. Solomon E. A. Kelley D. S. (2016). Time-series measurements of bubble plume variability and water column methane distribution above S outhern H ydrate R idge, O regon. Geochemistry Geophysics Geosystems17, 1182–1196. doi: 10.1002/2016GC006250
39
Römer M. Riedel M. Scherwath M. Heesemann M. Spence G. D. (2016). Tidally controlled gas bubble emissions: A comprehensive study using long-term monitoring data from the NEPTUNE cabled observatory offshore Vancouver Island. Geochemistry Geophysics Geosystems17, 3797–3814. doi: 10.1002/2016gc006528
40
Römer M. Sahling H. Pape T. Bahr A. Feseker T. Wintersteller P. et al (2012a). Geological control and magnitude of methane ebullition from a high-flux seep area in the Black Sea—the Kerch seep area. Mar. Geology319, 57–74. doi: 10.1016/j.margeo.2012.07.005
41
Römer M. Sahling H. Pape T. Bohrmann G. Spieß V. (2012b). Quantification of gas bubble emissions from submarine hydrocarbon seeps at the Makran continental margin (offshore Pakistan). J. Geophysical Research: Oceans117. doi: 10.1029/2011JC007424
42
Sahling H. Bohrmann G. Artemov Y. G. Bahr A. Brüning M. Klapp S. A. et al (2009). Vodyanitskii mud volcano, Sorokin trough, Black Sea: Geological characterization and quantification of gas bubble streams. Mar. Petroleum Geology26, 1799–1811. doi: 10.1016/j.marpetgeo.2009.01.010
43
Sauter E. J. Muyakshin S. I. Charlou J.-L. Schlüter M. Boetius A. Jerosch K. et al (2006). Methane discharge from a deep-sea submarine mud volcano into the upper water column by gas hydrate-coated methane bubbles. Earth Planetary Sci. Lett.243, 354–365. doi: 10.1016/j.epsl.2006.01.041
44
Scandella B. P. Varadharajan C. Hemond H. F. Ruppel C. Juanes R. (2011). A conduit dilation model of methane venting from lake sediments. Geophysical Res. Lett.38. doi: 10.1029/2011GL046768
45
Sen A. Åström E. K. Hong W.-L. Portnov A. Waage M. Serov P. et al (2018). Geophysical and geochemical controls on the megafaunal community of a high Arctic cold seep. Biogeosciences15, 4533–4559. doi: 10.5194/bg-15-4533-2018
46
Sibuet M. Olu K. (1998). Biogeography, biodiversity and fluid dependence of deep-sea cold-seep communities at active and passive margins. Deep Sea Res. Part II: Topical Stud. Oceanography45, 517–567. doi: 10.1016/S0967-0645(97)00074-X
47
Sultan N. Plaza-Faverola A. Vadakkepuliyambatta S. Buenz S. Knies J. (2020). Impact of tides and sea-level on deep-sea Arctic methane emissions. Nat. Commun.11, 5087. doi: 10.1038/s41467-020-18899-3
48
Thomsen L. Barnes C. Best M. Chapman R. Pirenne B. Thomson R. et al (2012). Ocean circulation promotes methane release from gas hydrate outcrops at the NEPTUNE Canada Barkley Canyon node. Geophysical Res. Lett.39. doi: 10.1029/2012GL052462
49
Torres M. E. McManus J. Hammond D. De Angelis M. Heeschen K. Colbert S. et al (2002). Fluid and chemical fluxes in and out of sediments hosting methane hydrate deposits on Hydrate Ridge, OR, I: Hydrological provinces. Earth Planetary Sci. Lett.201, 525–540. doi: 10.1016/S0012-821X(02)00733-1
50
Tryon M. D. Brown K. M. Torres M. E. (2002). Fluid and chemical flux in and out of sediments hosting methane hydrate deposits on Hydrate Ridge, OR, II: Hydrological processes. Earth Planetary Sci. Lett.201, 541–557. doi: 10.1016/S0012-821X(02)00732-X
51
Tryon M. D. Brown K. M. Torres M. E. Tréhu A. M. McManus J. Collier R. W. (1999). Measurements of transience and downward fluid flow near episodic methane gas vents, Hydrate Ridge, Cascadia. Geology27, 1075–1078. doi: 10.1130/0091-7613(1999)027<1075:MOTADF>2.3.CO;2
52
Vanreusel A. ANdERSEN A. C. BoETIUS A. Connelly D. Cunha M. R. Decker C. et al (2009). Biodiversity of cold seep ecosystems along the European margins. Oceanography22, 110–127. doi: 10.5670/oceanog.2009.12
53
Varadharajan C. Hemond H. F. (2012). Time-series analysis of high-resolution ebullition fluxes from a stratified, freshwater lake. J. Geophysical Research: Biogeosciences117. doi: 10.1029/2011JG001866
54
Von Deimling J. S. Greinert J. Chapman N. Rabbel W. Linke P. (2010). Acoustic imaging of natural gas seepage in the North Sea: Sensing bubbles controlled by variable currents. Limnology Oceanography: Methods8, 155–171. doi: 10.4319/lom.2010.8.155
55
Wang K. Davis E. E. van der Kamp G. (1998). Theory for the effects of free gas in subsea formations on tidal pore pressure variations and seafloor displacements. J. Geophysical Research: Solid Earth103, 12339–12353. doi: 10.1029/98JB00952
56
Wang B. Du Z. Luan Z. Zhang X. Wang M. Wang X. et al (2021). Seabed features associated with cold seep activity at the Formosa Ridge, South China Sea: Integrated application of high-resolution acoustic data and photomosaic images. Deep Sea Res. Part I: Oceanographic Res. Papers177. doi: 10.1016/j.dsr.2021.103622
57
Wang X. J. Liu B. Qian J. Zhang X. Guo Y. Q. Su P. B. et al (2018). Geophysical evidence for gas hydrate accumulation related to methane seepage in the Taixinan Basin, South China Sea. J. Asian Earth Sci.168, 27–37. doi: 10.1016/j.jseaes.2017.11.011
58
Wiggins S. M. Leifer I. Linke P. Hildebrand J. A. (2015). Long-term acoustic monitoring at North Sea well site 22/4b. Mar. Petroleum Geology68, 776–788. doi: 10.1016/j.marpetgeo.2015.02.011
59
Zhang X. Du Z. Luan Z. Wang X. Xi S. Wang B. et al (2017). In situ raman detection of gas hydrates exposed on the seafloor of the south China sea. Geochemistry Geophysics Geosystems18, 3700–3713. doi: 10.1002/2017gc006987
60
Zhang X. Du Z. Zheng R. Luan Z. Qi F. Cheng K. et al . (2016). “In situ Raman-based detections of the hydrothermal vent and cold seep fluids,” in EGU General Assembly Conference Abstracts. (Vienna, Austria: European Geosciences Union). EPSC2016–3428.
61
Zhang X. Luan Z. Du Z. Xi S. Li L. Lian C. et al (2023). Gas hydrates in shallow sediments as capacitors for cold seep ecosystems: Insights from in-situ experiments. Earth Planetary Sci. Lett.624. doi: 10.1016/j.epsl.2023.118469
62
Zhao Y. Liu Z. Zhang Y. Li J. Wang M. Wang W. et al (2015). In situ observation of contour currents in the northern South China Sea: Applications for deepwater sediment transport. Earth Planetary Sci. Lett.430, 477–485. doi: 10.1016/j.epsl.2015.09.008
Summary
Keywords
methane emissions, cold seeps, tidal modulation, gas hydrates, in-situ observation
Citation
Zhang X, Luan Z, Du Z, Li L, Xi S, Lian C and Zhang X (2025) Tidal modulation and temporal dynamics of methane emissions at the Formosa Ridge: insights from in-situ observations. Front. Mar. Sci. 12:1633033. doi: 10.3389/fmars.2025.1633033
Received
22 May 2025
Accepted
29 August 2025
Published
22 September 2025
Volume
12 - 2025
Edited by
Xiaoyong Duan, Qingdao Institute of Marine Geology (QIMG), China
Reviewed by
Cong Hu, Ocean University of China, China
Jianfeng Su, Tongji University, China
Updates
Copyright
© 2025 Zhang, Luan, Du, Li, Xi, Lian and Zhang.
This is an open-access article distributed under the terms of the Creative Commons Attribution License (CC BY). The use, distribution or reproduction in other forums is permitted, provided the original author(s) and the copyright owner(s) are credited and that the original publication in this journal is cited, in accordance with accepted academic practice. No use, distribution or reproduction is permitted which does not comply with these terms.
*Correspondence: Xin Zhang, xzhang@qdio.ac.cn
Disclaimer
All claims expressed in this article are solely those of the authors and do not necessarily represent those of their affiliated organizations, or those of the publisher, the editors and the reviewers. Any product that may be evaluated in this article or claim that may be made by its manufacturer is not guaranteed or endorsed by the publisher.