 Riccardo Martellucci1*†
 Carlotta Dentico1,2†
 Laurent Coppola3,4
 Ingunn Skjelvan5
 Michele Giani1
 Sara Pensieri6
 Carolina Cantoni7
 Vanessa Cardin1
 Marine Fourrier3,4
 Roberto Bozzano6
 Melf Paulsen8
 Elena Mauri1
- 1National Institute of Oceanography and Applied Geophysics (OGS), Trieste, Italy
- 2Department of Environmental Sciences, Informatics and Statistics, Università Cà Foscari, Venice, Italy
- 3Sorbonne Université, CNRS, Laboratoire d'Océanographie de Villefranche (LOV), Villefranche-sur-Mer, France
- 4Sorbonne Université, CNRS OSU STAMAR – UAR2017, Paris, France
- 5NORCE Research, Bjerknes Centre for Climate Research.Bergen, Norway
- 6Institute for the Study of Anthropic Impact and Sustainability in the Marine Environment, National Research Council of Italy, Genoa, Italy
- 7National Research Council-Institute of Marine Sciences (CNR-ISMAR), Trieste, Italy
- 8GEOMAR Helmholtz Centre for Ocean Research Kiel, Kiel, Germany
Introduction: The ATL2MED mission, conducted between October 2019 and July 2020, investigated the variability of air–sea CO2 exchange in the Eastern Atlantic and the Mediterranean Sea. The main objectives were to assess the spatial and temporal variability of the seawater partial pressure of CO2 (pCO2sw), identify its controlling physical and biogeochemical processes, estimate the CO2 fluxes across the sea–air interface, and evaluate the performance of neural network-based predictions (CANYON-MED) in contrasting oceanographic regions.
Methods: High-resolution autonomous measurements were collected using Saildrone Unmanned Surface Vehicles (USVs), complemented by fixed ocean stations, gliders, and research vessels. Data quality was ensured through cross-validation among platforms, despite challenges such as sensor drift caused by biofouling.
Results: The results reveal pronounced regional differences in pCO2sw and CO2 fluxes, driven by thermal effects, biological activity, and physical mixing. In the Eastern Atlantic, upwelling systems off northwest Africa induced strong outgassing, while the western Mediterranean acted as a CO2 sink during the spring bloom. Conversely, the Adriatic Sea exhibited episodic CO2 outgassing, particularly in its southern and northern basins, associated with thermal stratification, river plumes, and coastal upwelling.
Discussion: Saildrone measurements successfully resolved sub-mesoscale processes typically missed by fixed platforms, demonstrating their potential to enhance ocean CO2 observations in under-sampled or logistically constrained regions. The good agreement with neural network-based estimates further supports the robustness of the dataset. Overall, these findings emphasize the value of high-resolution, multi-platform approaches for accurately quantifying CO2 fluxes and improving predictive capabilities in a changing ocean.
1 Introduction
The atmospheric carbon dioxide (CO2) concentration has increased by more than 50% since pre-industrial time and has currently reached a concentration of 419.31 ppm (Friedelingstein et al., 2025). The increase is due to human activities (IPCC, 2021) and would have been even greater if the ocean and land would have not absorbed approximately 28% each of the emissions and thus dampening the effect of anthropogenic CO2. The ocean interior stores about 60 times more CO2 than the atmosphere, but this comes at a cost. Increasing levels of inorganic carbon in the ocean are affecting marine ecosystems by increasing hydrogen ion concentration and decreasing pH, which is referred to as ocean acidification (Gattuso and Hansson, 2011).
The variability of seawater CO2 partial pressure (pCO2sw) results from a complex interplay of physical–chemical, biological, and dynamic oceanic processes that regulate both the exchange of CO2 across the air–sea interface and the long-term oceanic carbon sequestration (Zeebe, 2012; Middelburg, 2019; Tanhua et al., 2021; Bakker et al., 2023; Chakraborty et al., 2023). Among the physical drivers, sea surface temperature (SST) plays a dominant role: warming reduces CO2 solubility, thereby increasing pCO2sw, whereas cooling enhances CO2 uptake (Weiss, 1974; Jersild and Ito, 2020; Gu et al., 2023; Li et al., 2025). Furthermore, increasing temperature also affects the thermodynamic constants of the carbonic acids equilibria shifting toward an increase of dissolved CO2. Salinity also modulates solubility: although its large-scale impact is comparatively small, short-term and regional variability in freshwater inputs from rivers, precipitation, or evaporation can significantly alter pCO2sw and delineate distinct biogeochemical regimes (Jersild and Ito, 2020; Curbelo-Hernández et al., 2024). Ocean circulation and mixing further redistribute pCO2sw. Mesoscale and submesoscale eddies contribute to CO2 variability in contrasting ways: cyclonic eddies are often associated with lower SST and enhanced net community production, thereby increasing the CO2 uptake, while anticyclonic eddies may initially promote outgassing, this process can also enhance uptake through vertical pCO2sw transport (Ford et al., 2023; Guo and Timmermans, 2024; Gregor et al., 2024; Liu et al., 2025; Li et al., 2025). Upwelling events bring CO2 and nutrient-rich waters to the surface, typically increasing pCO2sw but simultaneously stimulating primary production that draws it down, creating a dynamic interplay between physical and biological effects (Damien et al., 2022; Chakraborty et al., 2023; Roobaert et al., 2024). Vertical mixing and winter convection can also inject into surface CO2-rich waters from depth, leading to transient outgassing (Rodgers et al., 2023; Peter et al., 2025). Finally, air–sea gas transfer is strongly influenced by wind speed and wave dynamics, with short-term fluctuations (days to weeks) leaving a pronounced imprint on CO2 flux estimates (Wanninkhof, 2014; Landschützer et al., 2020; Song et al., 2025).
Biological processes exert an equally important control. Phytoplankton photosynthesis lowers surface pCO2sw through CO2 fixation, whereas respiration and remineralization return CO2 to the water column (Chakraborty et al., 2023; Kerr et al., 2025). Nutrient availability, particularly nitrate, phosphate, silicate, and iron, sets the potential for biological uptake, and as described before in upwelling region, physical and biological controls often become competing drivers and generate strong spatial and temporal variability (Chakraborty et al., 2023; Rodgers et al., 2023). To disentangle these contributions, pCO2sw variability is frequently decomposed into thermal and non-thermal components (see section 2.3). Finally, air–sea gas transfer is strongly influenced by wind speed and wave dynamics, with short-term fluctuations (days to weeks) leaving a pronounced imprint on CO2 flux estimates (Wanninkhof, 2014; Landschützer et al., 2020; Song et al., 2025).
This complexity underlines the need for sustained and co-located observations of both physical and biogeochemical variables, as emphasized by recent studies reporting a worrying decline in standardized datasets, especially after 2017 (Tanhua et al., 2021; Hassoun et al., 2022; Bakker et al., 2023). This gap is particularly evident in the Mediterranean Sea, where many sub-basins, straits, channels, and deep- and intermediate-water formation areas are still poorly investigated (Hassoun et al., 2022).
In this context the Integrated Carbon Observation System (ICOS-ERIC) provides high-quality measurements of CO2 and other GHGs across the atmosphere, the European terrestrial biosphere, the Atlantic Ocean, and the Mediterranean Sea. Its ocean network, consisting of research vessels, commercial ships, and fixed observatories, focuses on air–sea gas exchange, ocean acidification, and their impacts through long-term surface pCO2sw observations and ancillary variables (Steinhoff et al., 2019). The frequency of these measurements is limited by power constraints, moreover, some of the data obtained from sea campaigns do not support comprehensive studies of CO2 flux variability at the basin scale over several years. To overcome these issues, recent European initiatives such as EMSO ERIC (https://emso.eu), Euro-Argo One (https://www.euro-argo.eu/EU-Projects/Euro-Argo-ONE-2025-2027 focused on the BGC-Argo mission) and the GEORGE project (https://george-project.eu/) have made efforts towards the technological development of sensors aimed at autonomous in situ measurements of a variety of variables from fixed ocean stations and mobile platforms, including pCO2sw and, for some observatories, also atmospheric pCO2 (pCO2atm). While waiting for progress on these initiatives, the ocean community frequently uses membrane sensors which usually perform in situ analyses of gas with zero CO2 but lack daily calibrations with one or more span gases, relying only on factory calibrations. To address these challenges, we organised a mission including two Unmanned Surface Vehicles (USV) from Saildrone Inc. (USA), which operated in the space between and around fixed ocean stations, gliders, and a research vessel (Skjelvan et al., 2021; Martellucci et al., 2024). By bridging the gaps between fixed ocean stations, this approach enabled the study of air-sea gas exchange over a vast area. The demonstration mission was especially notable during the COVID pandemic when access to marine platforms and ship visits were restricted.
The present study investigates the variability of CO2 in seawater and of CO2 fluxes between air and water. The CO2 exchanges were estimated based on direct measurements of the wind speed as well as pCO2sw and pCO2atm carried out in the East Atlantic Ocean and in the Mediterranean Sea, focusing on the factors driving regional differences in these ocean areas. Moreover the data acquired by USVs were compared with pCO2 measurements from fixed ocean stations and estimates obtained through neural network-based methods, i.e., CANYON-MED (Fourrier et al., 2020) which have proven to be a promising approach to overcome data limitations and fill the gaps in CO2 measurements (e.g., Landschützer et al., 2014; Ben Mustapha et al., 2014; Fourrier et al., 2020, 2022). The data used in this study are primarily derived from the ATL2MED mission that took place between 18 October 2019 and 17 July 2020 in the East Atlantic (encompassing both subtropical and tropical regions) and the Mediterranean Sea (Figure 1). Several European academic institutions took part in the ATL2MED mission experiment, which encompassed fixed ocean stations, gliders, research vessels, and USVs (see Supplementary Table S1 in the Supplementary material).

Figure 1. The map shows the sailing route of the two Saildrone vehicles (SD 1030: black lines and SD 1053: red lines) during the ATL2MED mission from 19 October 2019 to 17 July 2020. The East Atlantic Ocean encompasses subtropical and tropical regions, the Mediterranean Sea includes the Strait of Gibraltar, the Alboran Sea, and several regions in the northwestern and central Mediterranean sea such as the Ligurian Sea, the Tyrrhenian Sea, the Ionian Sea and the Adriatic Sea.
2 Data and methods
2.1 Study areas
The study area encompasses marine regions with diverse climatic and oceanographic characteristics, including the tropical Atlantic off the west African coast and various basins of the Mediterranean Sea.
The Tropical North Atlantic, is characterised by a clockwise circulation that drives water masses southwards along the northwestern coast of Africa as the Canary Current, which in turn feeds into the westward North Equatorial Current. The relatively cold Canary Current generates numerous eddies along the West African coast and is warming at a rate of 0.20 ± 0.05 °C decade-1 over the period 1980-2020 (Kessler et al., 2022). The Eastern Boundary Upwelling System off northwest Africa is one of the four major Eastern Boundary Current systems within the trade wind belts of the subtropics. This system is driven by the interaction of winds and ocean currents, leading to the upwelling of nutrient and CO2-rich water to the surface (Cropper et al., 2014; Fischer et al., 2016). In the southern area (from 10°N to 19°N) weak seasonal coastal upwelling occurs in winter and spring. In the northern region, from the Canary Islands to the Strait of Gibraltar, the year-round upwelling is weak in winter and spring and intense in summer and fall (Pelegrí and Benazzouz, 2015). The permanent upwelling region (20-26°N) is always a source of CO2, except in spring when biological consumption prevails, causing a sink of CO2 (Lefèvre et al., 2023). However, during autumn, González-Dávila et al. (2017) found that only the area between 20 and 23°N acted as a source of CO2, while the rest was almost in equilibrium. Using merchant ships equipped with underway CO2 systems from 2010 to 2022, Lefèvre et al. (2023) showed that off the northwest African coast, the pCO2sw increased at a rate ranging from 1.82 μatm yr−1 to 2.10 μatm yr−1 close to the atmospheric increase and the pH decreased at a rate between 0.0016 and 0.0022 yr− 1.
The Mediterranean Sea is characterised by a basin-wide counterclockwise circulation, with numerous cyclonic and anticyclonic eddies populating the entire basin as well as three areas of deep water formation (the northwestern Mediterranean, the Adriatic Sea, and the Aegean Sea). It is the only basin in the temperate latitudes where the deep open ocean convection reaches the seafloor (Testor et al., 2018). The Mediterranean Sea is a hotspot of climate change such as temperature increase (Reale et al., 2022; Marullo et al., 2023; Kubin et al., 2023; Pirro et al., 2024), decrease in precipitation, and occurrence and frequency of extreme events (e.g., Tintoré et al., 2019). This area hosts 30% of the world’s tourism and is crossed by 30% of the world’s maritime trade in volume. It has been identified as an important region for anthropogenic carbon storage, where the column inventory can be much higher than in the Atlantic or Pacific Oceans (e.g., Schneider et al., 2010). The Mediterranean Sea is affected by ocean acidification, which is detectable even in deep water masses and could have a considerable impact on the biodiversity of Mediterranean ecosystems (Hassoun et al., 2022). In the coastal waters of the northwestern Mediterranean Sea the surface pCO2sw increases at a rate of 3.53 μatm yr-1 and pH decreases by -0.0028 yr-1 (Kapsenberg et al., 2017) whereas in the open sea the estimated increase of pCO2sw is of 2.30 ± 0.23 μatm yr-1 (Merlivat et al., 2018). The northern Adriatic Sea is an effective CO2 sink during winter, spring and autumn and a source in summer (Cantoni and Luchetta, 2024 and references therein). In the northern Adriatic, Cantoni et al. (2024) found that pH decreases by 0.003 pHT units yr-1, similarly to the estimates for the Mediterranean open waters (Yao et al., 2016), for the surface coastal waters of the northwestern Mediterranean sea (Kapsenberg et al., 2017) and for the Strait of Gibraltar (Garcia-Ibañez et al., 2024).
2.2 Dataset
Only the facilities which performed pCO2sw measurements during the ATL2MED mission were considered in this work: the fixed ocean stations DYFAMED, W1M3A, E2M3A, PALOMA, and MIRAMARE, the R/V Meteor, and the Saildrone vehicle (hereafter SD) 1030. In addition, the data of SD 1053 were used to supplement the data of SD 1030. Details of the data, infrastructures, and various sensors, including CO2 sensors used, were described in detail in Skjelvan et al. (2021); Martellucci et al. (2024), and in Supplementary Table S2.
Moreover we use high resolution observations and output from numerical models provided by the Copernicus Marine Service:
1. Global Ocean OSTIA Sea Surface Temperature and Sea Ice Analysis (https://doi.org/10.48670/moi-00165) (Good et al., 2020).
2. High-resolution and ultra-high-resolution satellite data of the sea surface temperature of the Mediterranean Sea (https://doi.org/10.48670/moi-00172) (Buongiorno Nardelli et al., 2013).
3. Global Ocean Colour (Copernicus-GlobColour), Bio-Geo-Chemical, L4 (monthly and interpolated) from Satellite Observations (Near Real Time) (https://doi.org/10.48670/moi-00279).
4. Mediterranean Sea, Bio-Geo-Chemical, L4, monthly means, daily gapfree and climatology Satellite Observations (1997-ongoing) (https://doi.org/10.48670/moi-00300) (Volpe et al., 2018).
5. Mediterranean Sea Physics Reanalysis (https://doi.org/10.25423/CMCC/MEDSEA_MULTIYEAR_PHY_006_004_E3R1) (Escudier et al., 2020, 2021; Nigam et al., 2021).
6. Copernicus Climate Change Services: ERA5 wind data at individual levels from 1940 to present (DOI: 10.24381/cds.adbb2d47) (Hersbach et al., 2023).
Ancillary satellite and model data were used to evaluate the SST, sea surface salinity (SSS) and chlorophyll a (Chl-a) distribution during the mission. The data were represented as isosurface maps.
During the ALT2MED mission, the SD’s speed was influenced by wind, ocean currents, and hull friction, which significantly reduced its velocity and complicated the mission planning and station visits. In addition, the long deployment (9 months) in biologically active regions led to sensor drift due to biofouling and technological limitations. Despite these challenges, extensive data cleaning and correction for SSS, dissolved oxygen (O2), and pCO2sw was carried out as documented in the recent publication by Martellucci et al. (2024).
The SSS data from the SD were compared with a few available in situ SSS observations, which revealed substantial differences and drift. Therefore the SD SSS data were corrected by aligning daily averages with CMEMS reanalysis products (Global Ocean 1/12° Physics Analysis and Forecast and Mediterranean Sea Physics Analysis and Forecast) using a linear regression method with a significance level of p < 0.05, while no correction was applied during periods when initial differences were smaller than 0.1. O2 data, lacking discrete validation samples, were adjusted through an in-air calibration approach adapted from the Argo program (Bittig et al., 2018) and a daily gain factor obtained from the ratio between expected and measured values was applied to raw O2 data after excluding outliers. The corrected O2 concentrations were consistent with variability driven by temperature and phytoplankton biomass as indicated by Chl-a. The pCO2sw dataset was obtained from SD 1030, equipped with a PMEL ASVCO2 system measuring xCO2 with an infrared detector after equilibration, and although initially calibrated before deployment, post-mission evaluation revealed that the span gas was set too low, necessitating recalibration at PMEL and the derivation of new coefficients. The corrected SD pCO2sw showed consistency with station data, especially at DYFAMED and MIRAMARE, and reflected ecosystem variability when compared with temperature and satellite-derived Chl-a. These approaches allowed the production of a homogenized and reliable dataset despite the limited availability of in situ validation, supporting the use of SD data for the study of air–sea interactions.
Here, we present the corrected data with the aim of interpreting the variability of the biogeochemical measurements.
2.3 Thermal and non-thermal components of pCO2sw
The temporal and spatial variability of surface ocean pCO2sw can be attributed to several factors (e.g., Zeebe, 2012; Middelburg, 2019), leading to fluctuations across timescales from days to decades (Chakraborty et al., 2023; Rodgers et al., 2023). To distinguish these contributions, pCO2sw variability is decomposed into thermal and non-thermal components, with the latter encompassing the effects of circulation, changes in SSS, dissolved inorganic carbon (DIC), and total alkalinity (TA), and biological activity (Fassbender et al., 2022; Rodgers et al., 2023).
The decomposition of pCO2sw was following equations proposed by Takahashi et al. (2002):
where pCO2sw (μatm) was measured during the study period, mean(pCO2sw) is the mean pCO2sw over the studied period in every study area (as shown in Figure 2), SSTmean (°C) is the average sea surface temperature (during the whole demonstration mission), and SSTobs (°C) is the in situ sea surface temperature. The pCO2sw_TD refers to changes in pCO2sw driven only by temperature variations, while the pCO2sw_N refers to changes in pCO2sw that are not directly caused by temperature variations but rather by other factors such as biological activity (photosynthesis and respiration), mixing or advective processes, and gas exchange with the atmosphere.

Figure 2. Time series of (A) sea surface temperature (SST; °C), (B) pCO2sw (μatm) and pCO2atm (μatm) drown in black and yellow respectively, (C) fluxes of CO2 (mmol CO2 m-2 d-1) and wind speed (m s-1) represented by the magenta line and grey dots respectively acquired by the SD 1030. The periods without data correspond to the different maintenance events, see Martellucci et al. (2024).
The ratio (R) of between the thermal (pCO2sw_TD) and non-thermal (pCO2sw_N) components is used to identify the dominant driver of variability. An R value greater than one indicates that thermal effect prevail, whereas an R value less than one points to the dominance of non-thermal contribution.
2.4 CO2 flux calculations
The fluxes of CO2 (FCO2) were calculated according to:
where K0 is the solubility of CO2 (mol m-3 atm-1), ks is the gas transfer velocity (cm h-1) from Sweeney et al. (2007), and pCO2sw and pCO2atm were measured from the SD 1030 using an ASVCO2 sensor (Sutton et al., 2014). Wind speed was measured on both SDs, but for the SD 1030, wind measurements were discontinued in March 2020. Additional information was therefore required to determine the wind speed over the entire duration of the mission. When the two SDs were closer than 12 nautical miles, the wind measurements of SD 1053 were used to compute the CO2 fluxes. When the distance between the two SD was larger, wind data from the ERA5 reanalysis product (0.25° x 0.25° grid; Hersbach et al., 2023) were used to fill the gaps. Finally, to achieve the true wind speed, the wind speed was corrected for the movement of the SD.
Supplementary Figure S1 (Supplementary Material), compares the mole fraction of atmospheric CO2 (xCO2atm in ppm) measured by the SD 1030 with xCO2atm measurements from two atmospheric stations in the East Atlantic and one in the Mediterranean Sea: Izaña Atmospheric Observatory (Tenerife, Spain), Cape Verde Atmospheric Observatory (CVAO, Cape Verde), and ENEA Station for Climate Observations (Lampedusa, Italy). The deviation between the xCO2atm measurements of the atmospheric stations and the SD 1030 varied between 3.5 and 4.6 ppm during the first 4 months of the demonstration mission (October 2019 - February 2020) and was reduced to 2.5 ppm in June 2020 (Supplementary Table S2). This deviation might be related to the prevailing winds and the distance between the atmospheric stations and SD 1030, but further investigation is beyond the scope of this work.
2.5 Neural-network derived carbon data
Carbonate system variables (DIC, TA and pH) were predicted along the SD tracks using the CANYON-MED neural network (Fourrier et al., 2020). This neural network was employed in the Western Mediterranean Sea, and produced estimates for DIC, TA, pH, and nutrients. From this, the pCO2sw long trends in surface, intermediate, and deep waters in the Western Mediterranean were predicted (Fourrier et al., 2022). In brief, neural network ensembles for each variable were developed and the network was trained with a reference dataset, facilitating a densification of the dataset. This neural network-based method allows the prediction of the carbonate system variables from geolocation, time of sampling, pressure, SST and O2 concentration specifically for the Mediterranean Sea. In this study, the spring and summer 2020 data from the SD 1030 and SD 1053 were used to complement in situ pCO2sw data retrieved from SD 1030 after employing the Python PyCO2SYS toolbox for pCO2sw estimation (Humphreys et al., 2022). The method was applied to the SSS and O2 of both SD 1030 and SD 1053. The predicted carbonate variables were quality controlled and pCO2sw was calculated using DIC and pH as input in the CO2SYSv2 (Orr et al., 2018) and further, compared to pCO2sw from the SD 1030 and from discrete sampling along the track (DYFAMED, PALOMA, MIRAMARE). The uncertainty of the predicted pCO2sw was based on a combination of the error of predicted DIC (12 µmol kg-1) and pH (0.014) of CANYON-MED for the Mediterranean Sea (Fourrier et al., 2022). The error package of the CO2SYS toolbox (Orr et al., 2018) provided a pCO2sw uncertainty estimated at 13.3 μatm using the constants K1 and K2 from Lueker et al. (2000).
3 Results and discussion
This study first examines the fluxes of CO2 comparing the East Atlantic with the Mediterranean Sea with a particular focus on their temporal and spatial variability. This large-scale view is followed by an investigation of regional and local processes and features that were observed during the duration of the ATL2MED mission. Specifically, local processes influencing the pCO2sw such as primary production and respiration, air-sea gas exchange, mixing, advection of water masses and temperature changes are discussed.
3.1 Large scale view
The ATL2MED mission contributed with pCO2sw data of higher spatial density than ever before for the study area, allowing for a deeper investigation of the carbon dynamics in the eastern Atlantic and the Mediterranean Sea. During their path, the SDs crossed different geographical regions in different times of the year, resulting in large variability in SST and pCO2sw, that ranged between 14 and 29°C (Figure 2A) and 320 and 520 µatm (Figure 2B), respectively. At the beginning of the mission (from the end of October to the end of December 2019), when the SDs crossed the eastern Atlantic, the area was a CO2 source (Figure 2C) driven by the presence of a permanent upwelling system off the coast of Africa. When the SDs moved further south, the efflux of CO2 to the atmosphere decreased due to local dynamics (see section 3.2.1).
In total, the Eastern Atlantic absorbed more than 0.6 mol CO2 m-2 over 4.5 months (18 October 2019 to 6 March 2020). This is higher than the CO2 flux into the ocean (0.16 mol CO2 m-2) between December and May estimated by González-Dávila et al. (2017), who used data between 2005 and 2012 from the Mauritanian - Cape Verde upwelling area (10-27°N, 15-18°E). This difference can be due to the slightly different time of year in González-Dávila et al. (2017) and to the proximity to the shore of their area compared to our area and thus, their results might be more affected by upwelled water oversaturated with CO2. Pérez et al. (2024) used interpolated in situ pCO2sw data from the SOCAT database (Bakker et al., 2016) to estimate the CO2 uptake in the North Atlantic Subtropical Gyre over the period 1985-2018. Their Figure 5 indicates an average winter flux of 1 mol CO2 m-2 yr-1, which is larger than our CO2 estimate. However, their values are based on data from a much larger area than that along the SD tracks in the eastern Atlantic.
As the SDs moved from the tropical region to the Strait of Gibraltar (December 2019 to March 2020), and the water column became well-mixed due to winter storms and cooling, photosynthetic activity was reduced, leading to less CO2 uptake by phytoplankton, which kept pCO2sw relatively high (Figure 2B).
In the Mediterranean Sea, the SD measurements highlighted a more complex interplay between physical and biological factors. Here, along the SDs tracks, strong seasonal shifts in CO2 content and CO2 fluxes were also driven by regional variations of SST and wind speed.
In March 2020 highly negative (-85 mmol CO2 m-2 d-1) CO2 fluxes (Figure 2C) were observed between the Alboran Sea and Gulf of Lion in response to water mixing and the active primary productivity usually observed in the area in this season.
In the Ligurian Sea the fluxes were generally close to zero with episodic events of strong CO2 sink concurrently with wind increase and water cooling.
At the beginning of May 2020, the CO2 fluxes showed positive values, as the pCO2atm was lower than the pCO2sw (Figure 2B). Until early June, the SDs did not acquire data, due to maintenance activities. Moving from the Ionian Sea to the Adriatic Sea (mid-June 2020), the pCO2sw increased to well above the pCO2atm and reached the highest values recorded during the mission (530 µatm) at the beginning of July 2020 in the southern Adriatic (Figure 2B). This resulted in a strong efflux of CO2 to the atmosphere. This was even more evident in the northern Adriatic, where the highest positive CO2 fluxes (up to 80 mmol m-2 d-1) recorded during the demonstration mission was observed (Figure 2C).
In total, the Mediterranean absorbed approximately 2.3 mol CO2 m-2 over 4.5 months (7 March to 17 July 2020). However, when splitting this sea into regions, the west and northwestern Mediterranean Sea clearly acted as a sink absorbing 205.5 mol CO2 m-2 over 2.5 months (7 March to 26 May 2020), while the area from the Ionian and the Adriatic Sea acted as a source of CO2 emitting 314.2 mol CO2 m-2 over 3.5 weeks (6 June to 17 July 2020).
These findings are consistent with previous studies highlighting the marked spatial variability of CO2 fluxes in the Mediterranean Sea, where the northwestern sub-basins and the Adriatic often act as carbon sinks on an annual scale (e.g., Copin-Montégut and Bégovic, 2002; Urbini et al., 2020; Cossarini et al., 2021; Cantoni et al., 2024), while the southeastern basins tend to act as sources (Cossarini et al., 2021). Our high-resolution measurements further emphasize the importance of sampling strategies capable of resolving seasonal and regional dynamics: for instance, data collected in the northwestern Mediterranean revealed a strong CO2 uptake, likely enhanced by the timing of observations during a productive period when phytoplankton blooms can rapidly draw down CO2 and generate transient sinks (Roobaert et al., 2024; Frazão et al., 2025). In contrast, summer measurements in the Adriatic indicated a source of CO2, reflecting the dominant role of thermal forcing in shaping seasonal variability of surface pCO2 (Takahashi et al., 2002; Jersild and Ito, 2020; Roobaert et al., 2024);. Mesoscale features encountered during the mission also revealed pronounced short-term variability in CO2 fluxes, particularly in the Eastern Atlantic, consistent with evidence that mesoscale eddies and circulation patterns modulate surface carbon exchange in many oceanic regions (Harrison et al., 2018; Ford et al., 2023; Guo and Timmermans, 2024; Liu et al., 2025). The high-frequency resolution of our dataset proved crucial in capturing such variability, which is generally underrepresented in large-scale climatologies (Landschützer et al., 2020; Hassoun et al., 2022).
3.2 Regional events
3.2.1 The northwest African upwelling system in the East Atlantic
The CO2 flux to the atmosphere in the East Atlantic during November 2019 was driven by upwelled water with low SST, low Chl-a concentration and high wind speed (Supplementary Figure S3, Supplementary Material). In this context, the physical upwelling of CO2-rich deep waters to the surface can exceed the capacity of biological drawdown, leading to persistent CO2 outgassing (Siddiqui et al., 2023; Roobaert et al., 2024).
The pCO2sw thermal component (pCO2sw_TD) followed the changes in SST and decreased by more than 100 µatm from the beginning of November 2019, when the region was characterised by elevated temperature (> 24 °C), to January 2020 over a period of which SST decreased more than 14 °C (Supplementary Figure S2, Supplementary Material). However, the non-thermal component, pCO2sw_N, counteracted the changes in pCO2sw_TD by increasing approximately 100 µatm over the same period (Supplementary Figure S2, Supplementary Material). Between 25 and 28 October 2019 the SD 1030 moved southward and crossed an area with higher Chl-a, which primarily affected the pCO2sw_N and decreased the CO2 flux. In the first weeks of November 2019, heading southwards, the CO2 flux was positive (directed into the atmosphere), mainly driven by the SST increase (Figure 3B) and the relatively low Chl-a concentrations. During this period, some small negative CO2 flux values were observed concurrently with a strong reduction in pCO2sw (Figure 3D) suggesting that the SDs crossed an area previously characterised by elevated primary productivity (e.g., Supplementary Figure S3A, 28 October 2019. After 28 November 2019, the SDs crossed an upwelling area with lower SST and the pCO2sw increased by about 30 µatm as the surface water was enriched with CO2 from below (Figures 3A, D). Here, the CO2 flux was mainly driven by the non-thermal component (pCO2sw_N). After 6 December 2019, the SDs moved away from the upwelling area, and a sharp decrease in pCO2sw was observed concurrently with an increase in SST. Until 16 December the flux was almost close to zero with the exception of a strong peak that occurred on 12 December, mainly triggered by wind driven coastal upwelling (i.e., increase in wind speed and strong decrease in SST; Supplementary Figure S3, Supplementary Material). From January to early March 2020, moving northwards from the Canary upwelling system, the SDs sampled an area characterised by low variability in pCO2sw and pCO2atm. In this period the thermal and non-thermal components of pCO2sw were relatively similar, and at the end of this period, the non-thermal component started to increase inversely to the thermal component (Supplementary Figure S2, Supplementary Material).

Figure 3. (A) Map of SD trajectory in the East Atlantic from 18 October to 16 December 2019. Temporal evolution of (B) sea surface temperature (SST; °C) and sea surface salinity (SSS), (C) dissolved oxygen concentration (O2; μmol kg-1) and oxygen saturation (%), (D) pCO2sw (µatm) and ratio between thermal and non-thermal components of pCO2sw (R), (E) CO2 flux (FCO2; mmol CO2 m-2 day-1) and wind speed (m s-1) in the East Atlantic from 18 October to 16 December 2019.
Eddies are frequently observed in this area (McGillicuddy et al., 2003; Katzenmeier et al., 2024), which was also the case during the R/V Meteor cruise (M160) in fall 2019. Cyclonic eddies promote the upwelling of deeper water rich in CO2 and nutrients from remineralized organic matter. Inside these eddies, the surface pCO2sw can easily exceed the pCO2atm, and thus facilitating the CO2 efflux to the atmosphere. The CO2 flux may also have been influenced by the island orography, which affected wind patterns and led to the formation of small frontal systems. North of Cape Verde and towards the Strait of Gibraltar, the sea surface was significantly undersaturated with respect to CO2, which resulted in CO2 influx.
A particularly interesting aspect is the high variability in SST, SSS, and O2 (Figure 3C) concentration observed between 11 and 16 December, coinciding with measurements conducted by METEOR (Devresse et al., 2023). During this period, the SD crossed twice a small cyclonic eddy, and the CO2 flux response was markedly different in the same area just two days apart (Supplementary Figure S4). The signal clearly indicates the presence of an upwelling, as evidenced by a sudden decrease in SST accompanied by a corresponding increase in SSS, which is also clearly observed in the METEOR data (Devresse et al., 2023), along with a strong increase in O2 concentration and oxygen supersaturation coinciding with the SST minima.
This structure, which was identified as a cyclonic eddy (Brava eddy, Devresse et al., 2023) caused a general increase in CO2, mainly due to outgassing associated with upwelled deep waters enriched in CO2. In the core of the eddy the water mass was colder with higher concentration of dissolved inorganic nitrogen and Chl-a concentrations than the surrounding waters with a strong doming of the nitracline. This could explain the sudden changes of CO2 fluxes observed around mid-December (Figure 3E). Furthermore, wind effects, which were stronger on the 11th December than on the 16th December, influenced phytoplankton biomass, leading to its increase following the reduction in wind intensity. The non-thermal component of pCO2sw increased, resulting in a decrease in R. This can be explained by the initial upwelling-driven outgassing, enhanced by wind, followed by a reversal of the CO2 flux toward the ocean due to the biological response associated with primary production, which removed CO2 from the surface waters. This highlights how high resolution observations are essential to capture the strong variability of CO2 fluxes associated with fine-scale oceanographic features such as mesoscale and submesoscale eddies.
3.2.2 Alboran Sea
After 7 March 2020 the SDs reached the Mediterranean and crossed the Alboran Sea in almost a week (Figure 4A). The area showed strong variations in SST and SSS (Figure 4B), which influenced the biogeochemical variables. In early March 2020 the variability of pCO2sw increased, and pCO2sw reached the lowest value recorded during the mission (350 µatm). The observed variability can be explained taking into account the characteristics of the region, where Atlantic and Mediterranean waters are coexisting and interact at different spatial and temporal scales (Capó et al., 2021; Poulain et al., 2021). Respiration processes, winter mixing, and spring blooms played a key role when the SDs moved from the Alboran Sea to the Ligurian Sea. Eddies are widespread in the area, as shown in Figure 4A which highlights the anticyclonic eddies in both the western and eastern Alboran Sea from satellite SST images. These eddies are caused by the surface inflow of Atlantic water that crosses the Strait of Gibraltar, which gradually mixes with the resident Mediterranean water (Tintoré et al., 1991; Mojica et al., 2018; Sánchez-Garrido and Nadal, 2022).
In the Alboran Sea, the SDs crossed two chlorophyll fronts (Chl-a >1.5 mg m-3, Figure 4A), as evidenced by the O2 supersaturation (Figure 4C). This influenced both the pCO2sw concentrations, which in the region was mostly driven by non thermal processes (Figure 4D), and CO2 flux (Figure 4E). Indeed as observed by Roobaert et al. (2024) and Frazão et al. (2025) phytoplankton blooms can rapidly draw down CO2, creating transient CO2 sinks during productive seasons especially in temperate ocean where spring blooms can induce sharp declines in pCO2sw over a few days to weeks, often exceeding the influence of temperature during the bloom peak (Lévy et al., 2024).
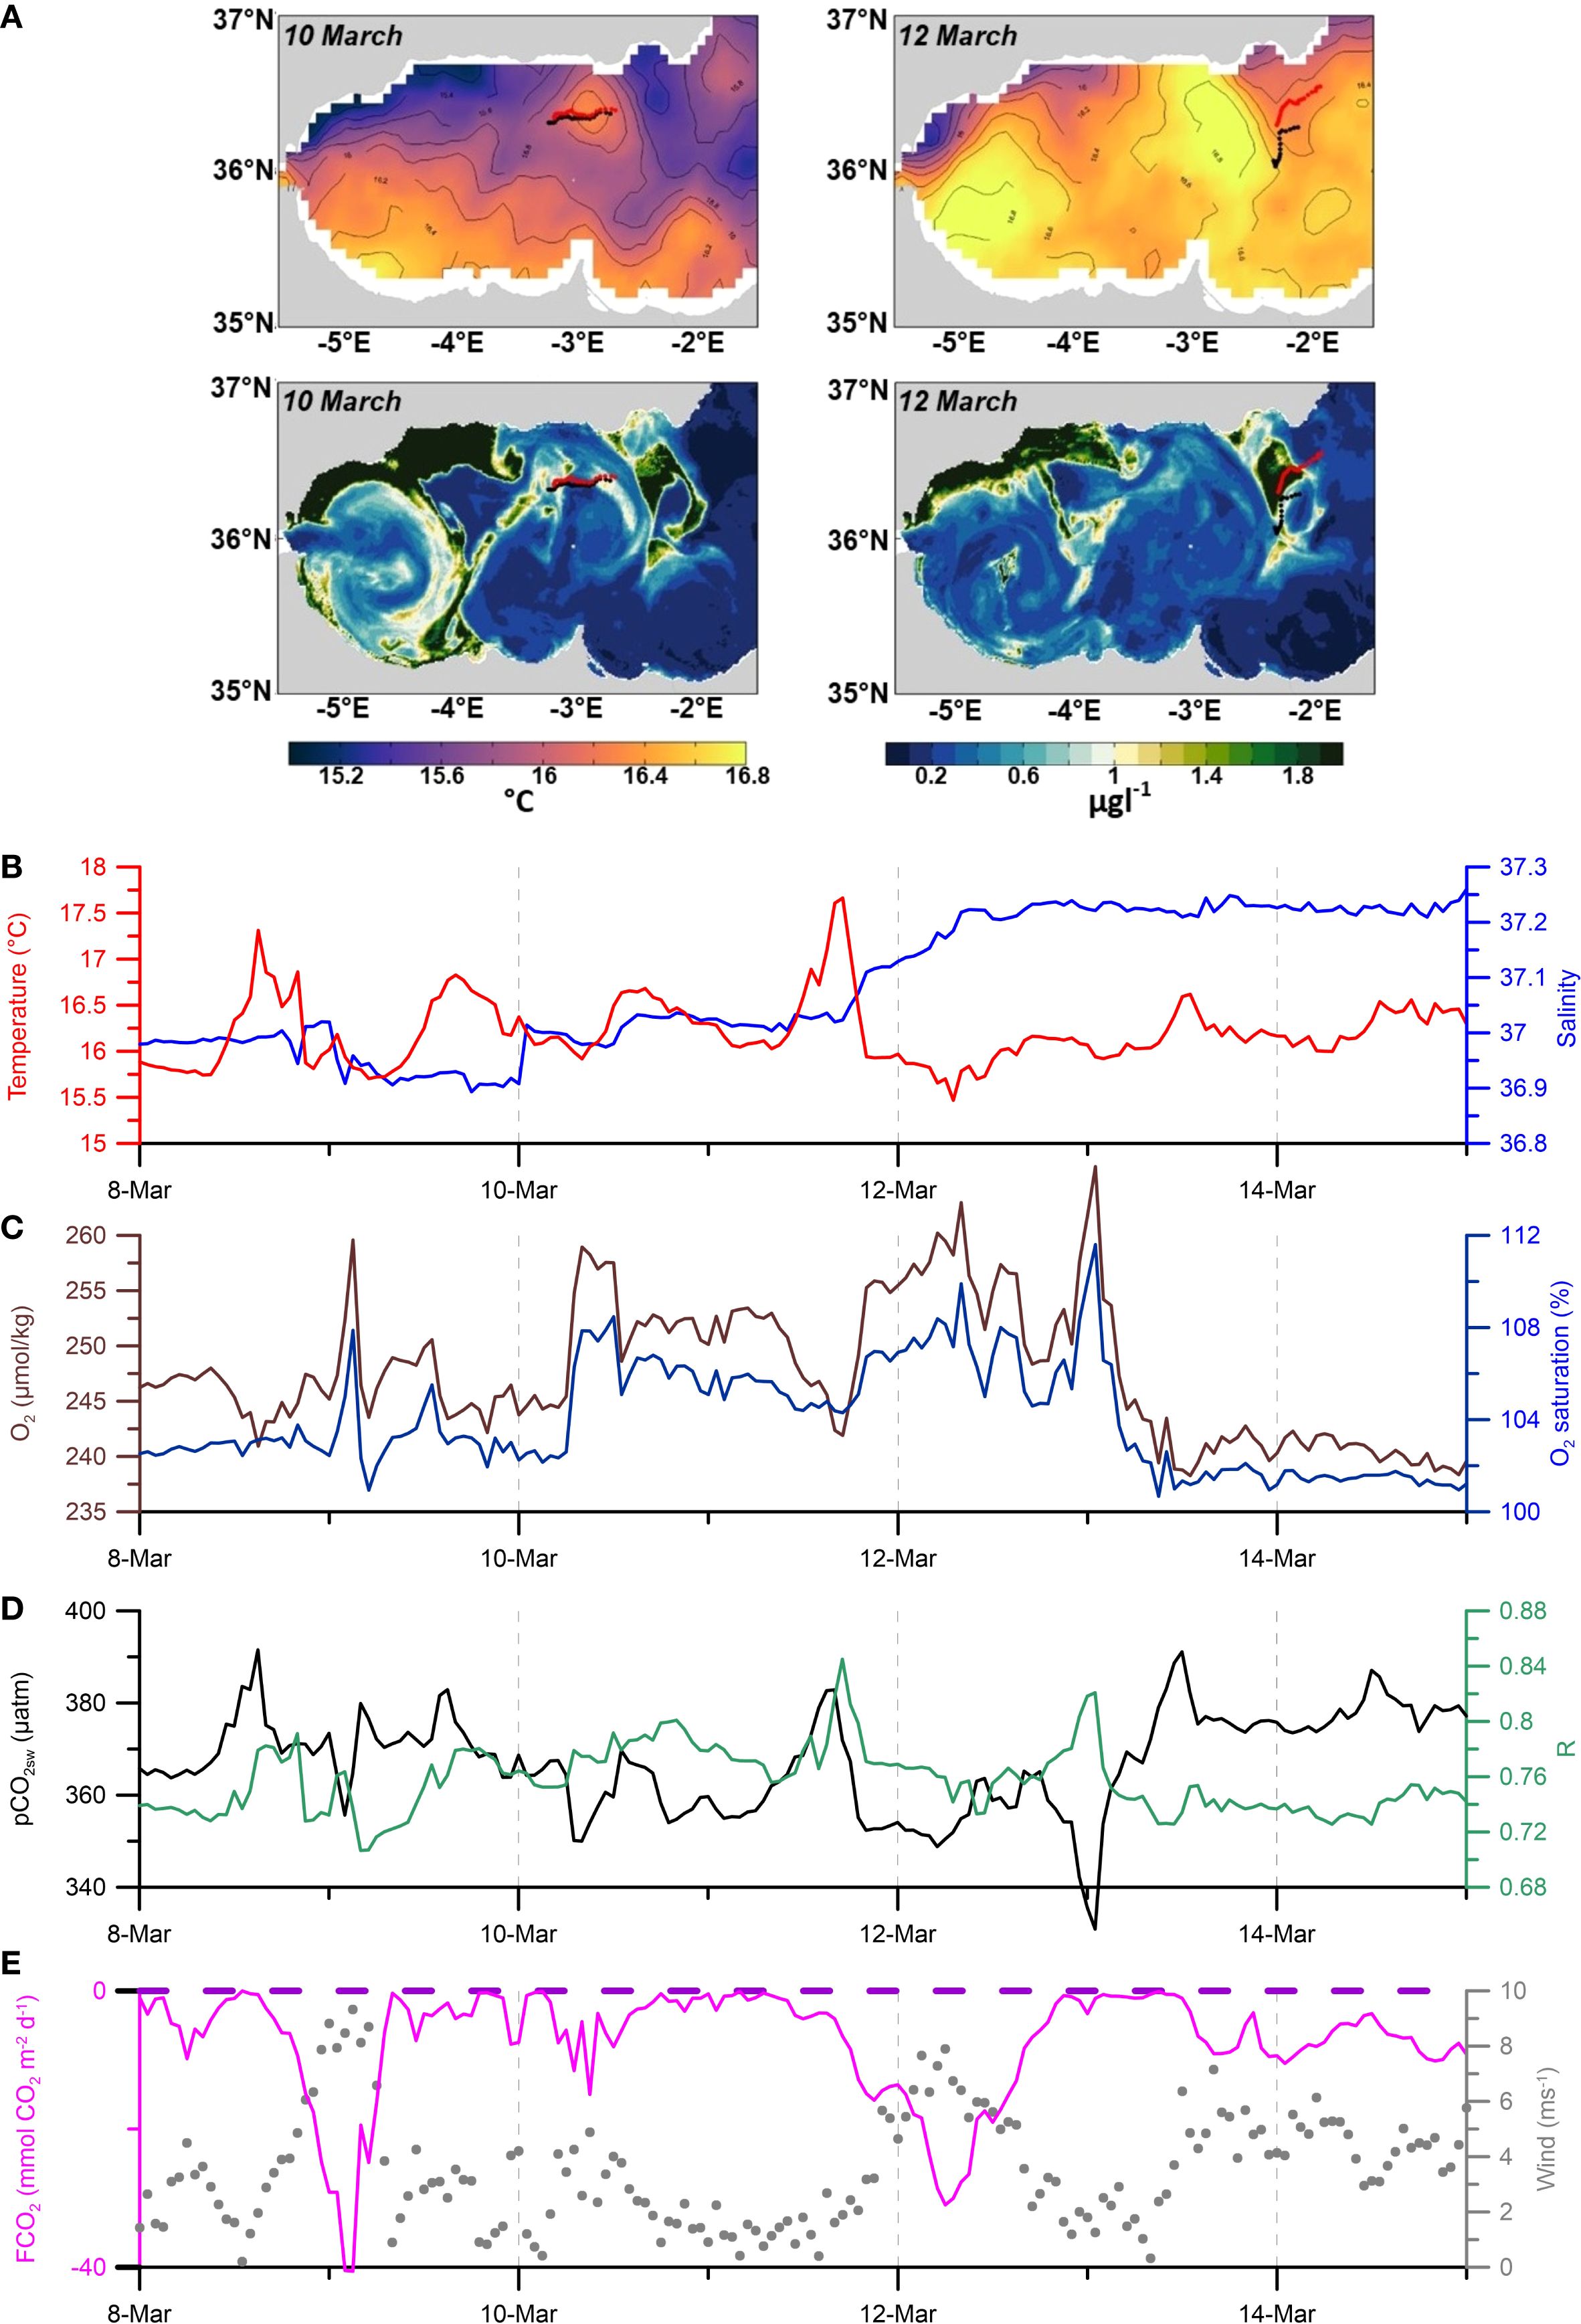
Figure 4. (A) Map of sea surface temperature (SST), chlorophyll a (Chl-a) concentration and SDs trajectory (SD 1030 and SD 1053 in black and red respectively) in the Alboran Sea on 10 and 12 March 2020. Temporal evolution of (B) sea surface temperature (SST; °C) and sea surface salinity (SSS), (C) dissolved oxygen concentration (O2; µmol kg–1) and oxygen saturation (%), (D) pCO2sw (µatm) and ratio between thermal and non-thermal components of pCO2sw (R), (E) CO2 flux (FCO2; mmol CO2 m—2 day–1) and wind speed (m s–1) in the Alboran Sea from 8 to 15 March 2020.
The Alboran Sea is one of the most productive areas of the Mediterranean Sea according to estimates based on satellite data by Uitz et al. (2012). The Chl-a concentration in boreal spring along the northern flank of the Alboran Sea is influenced by the El Niño Southern Oscillation (ENSO) that is responsible for the development of anomalous distribution patterns of Chl-a. Furthermore, ENSO influences the western Mediterranean by altering the winds over the Alboran region and, consequently, the wind-driven upwelling that occurs along the southern Spanish coast in spring. This, in turn, modifies the surface Chl-a concentration: a high (low) Chl-a concentration in the northern Alboran Sea during spring is expected under La Niña (El Niño) conditions in the tropical Pacific during the preceding winter (Lopez-Parages et al., 2022). Also in the past elevated Chl-a concentrations have been reported for the western Alboran Sea (Minas et al., 1991; Rodríguez et al., 1998; Lopez-Parages et al., 2022), while particulate primary production can reach up to 632 mg C m–2 d–1 along a coast-to-coast gradient crossing the western Alboran Sea gyre (Moran and Estrada, 2001) and 700 mg C m–2 d–1 in the northern part of the eastern gyre (Videau et al., 1994).
3.2.3 Ligurian Sea
The SDs arrived in the Ligurian Sea at the beginning of April 2020 after crossing the Gulf of Lion (Figure 5A). The pCO2sw fluctuation was high and the pCO2sw concentration low in the northwestern Mediterranean at this time of year. The area was characterised by low SST and undersaturated O2 concentrations highlighting the presence of intense vertical mixing (see Figure 5A in Martellucci et al., 2024). Convection can be intense in February and March in the Gulf of Lion due to cold and dry winds and preconditioning events (Schroeder et al., 2008; Houpert et al., 2016; Testor et al., 2018; Many et al., 2021), which refers to the set of oceanic conditions that favour deep convection, such as the presence of a weakly stratified water column and the accumulation of dense water from previous winters. These conditions induce an increase of surface water density sensitive to the winds blowing. The convection process is less pronounced in the Ligurian Sea where wind forcing and air-sea heat flux are usually less intense (Coppola et al., 2018). A recent study from Ulses et al. (2023) demonstrated that the deep convection zone in the northwestern Mediterranean Sea served as a moderate CO2 sink for the atmosphere in the years 2012 to 2013, when convection was particularly strong. Between the beginning of March and the end of April 2020, the pCO2sw_N dominated the pCO2sw signal (Supplementary Figure S2, Supplementary Material). From the Alboran Sea to the Ligurian Sea, respiration possibly prevailed over photosynthesis, increasing the pCO2sw_N while O2 was consumed. In the western Mediterranean, the end of deep vertical mixing favours the onset of a spring phytoplankton bloom with a peak in primary production and phytoplankton concentration at the surface which generally occurs in April in this region (Mayot et al., 2017; Kessouri et al., 2020). The 2020 spring bloom produced a strong increase in Chl-a between March and April 2020 (Supplementary Figure S4, Supplementary Material) resulting in a pronounced uptake of CO2 from the water (Figure 5E), decreasing pCO2sw_N, while O2 production increased during the bloom event (Osat > 106, Figure 5C).

Figure 5. (A) Map of SD trajectory in the northwestern Mediterranean from 9 April to 12 May 2020, glider measurements (green dots), DYFAMED (red star) and W1M3A (blue star). Temporal evolution of (B) sea surface temperature (SST; °C) and sea surface salinity (SSS), (C) dissolved oxygen concentration (O2; µmol/kg) and oxygen saturation (%), (D) pCO2sw (µatm) and ratio between thermal and non-thermal components of pCO2sw (R), blue and red diamonds represent the pCO2sw recorded at fixed stations (see Figures 10a and b in Martellucci et al., 2024), and (E) CO2 flux (FCO2; mmol CO2 m-2 day-1) and wind speed (m s-1) in the East Atlantic from 18 October to 16 December 2019.
On 9 April 2020 the SDs left the area off Toulon moving towards the W1M3A site and sailing about 40 km from the coast. The area is characterized by the Northern Current (NC) that is a key boundary current in the western Mediterranean (Berta et al., 2018). This current originates in the Ligurian Sea from the convergence of the Western and Eastern Corsica currents. At surface, it transports the old Atlantic Water (AW) southwest ward, influencing the circulation of the northwest Mediterranean. The NC extends about 40 km off the coast and its variability is influenced by winds and freshwater inputs. This pattern was clearly detected by the SDs until 15th of April (Figure 5B). Until then the pCO2sw values ranged from 360 to 400 µatm and the SST varied by 2 °C. This can be ascribed to the presence of strong mixing processes, driven by northwesterly winds, that influenced the pathways of the NC current forming a frontal zone near the coast, separating warm coastal waters from colder mixed waters of the Gulf of Lion (Prieur et al., 2020).
From mid-April 2020 SST increased as the SDs moved eastwards (Figure 5A), and pCO2sw increased from 360 µatm to 400 µatm. This increase was consistent with the values reported by Coppola et al. (2020) for the seasonal cycle in the Ligurian Sea. Here, pCO2sw values usually range from 300 to 550 μatm, as already reported for the DYFAMED site. The glider deployed during the mission helps to spatially characterize the observed area and to generate predicted carbonate system variables using the CANYON-MED neural network (see Section 2.5). The glider moving from Nice to Calvi measured SST similar to those measured by the two SDs at matching locations.
The O2 concentration decreased from 260 µmol kg-1 to almost 230 µmol kg-1 as the SDs left the Ligurian Sea. pCO2sw was comparable between the platforms.
In the Ligurian Sea, the main processes governing the pCO2sw at the sea surface on an annual scale, after removing the temperature effect, are vertical mixing and biological production (Copin-Montégut et al., 2004; Merlivat et al., 2018; Coppola et al., 2023). However, during the studied period, in the Ligurian Sea the non-thermal component of pCO2sw prevailed over the thermal one (R<1; Figure 5D) suggesting that biological activity might have influenced the pCO2sw variability in this area during April 2020 (Supplementary Figure S4, Supplementary Material).
In early May 2020, the pCO2sw started to increase (from 350 µatm to 450 µatm) crossing the Tyrrhenian Sea, concurrently with temperature increase (Figure 2A). The pCO2sw_TD reflected the change in SST, being predominant in the overall pCO2sw signal in the region.
The neural network (CANYON-MED) derived estimates of pCO2sw closely matched the SD measurements (SD 1030, R2 = 0.95, p<0.05; SD 1030, R2 = 0.88, p<0.05), with only a small offset of 15–20 µatm observed as the SD moved along its path (Figure 6, Supplementary Figure S6). This offset fell within the expected error range of the neural network-derived pCO2sw estimates (see section 2.5) and aligned with data collected by the W1M3A fixed ocean station. However, it is important to note that between 28 April and 1 May 2020, when the SDs circled the W1M3A station, sea conditions shifted from calm to very rough (significant wave height of 2.5 m), leading to water mixing that may have influenced the measurements. By 4 May 2020, sea conditions had returned to calm.
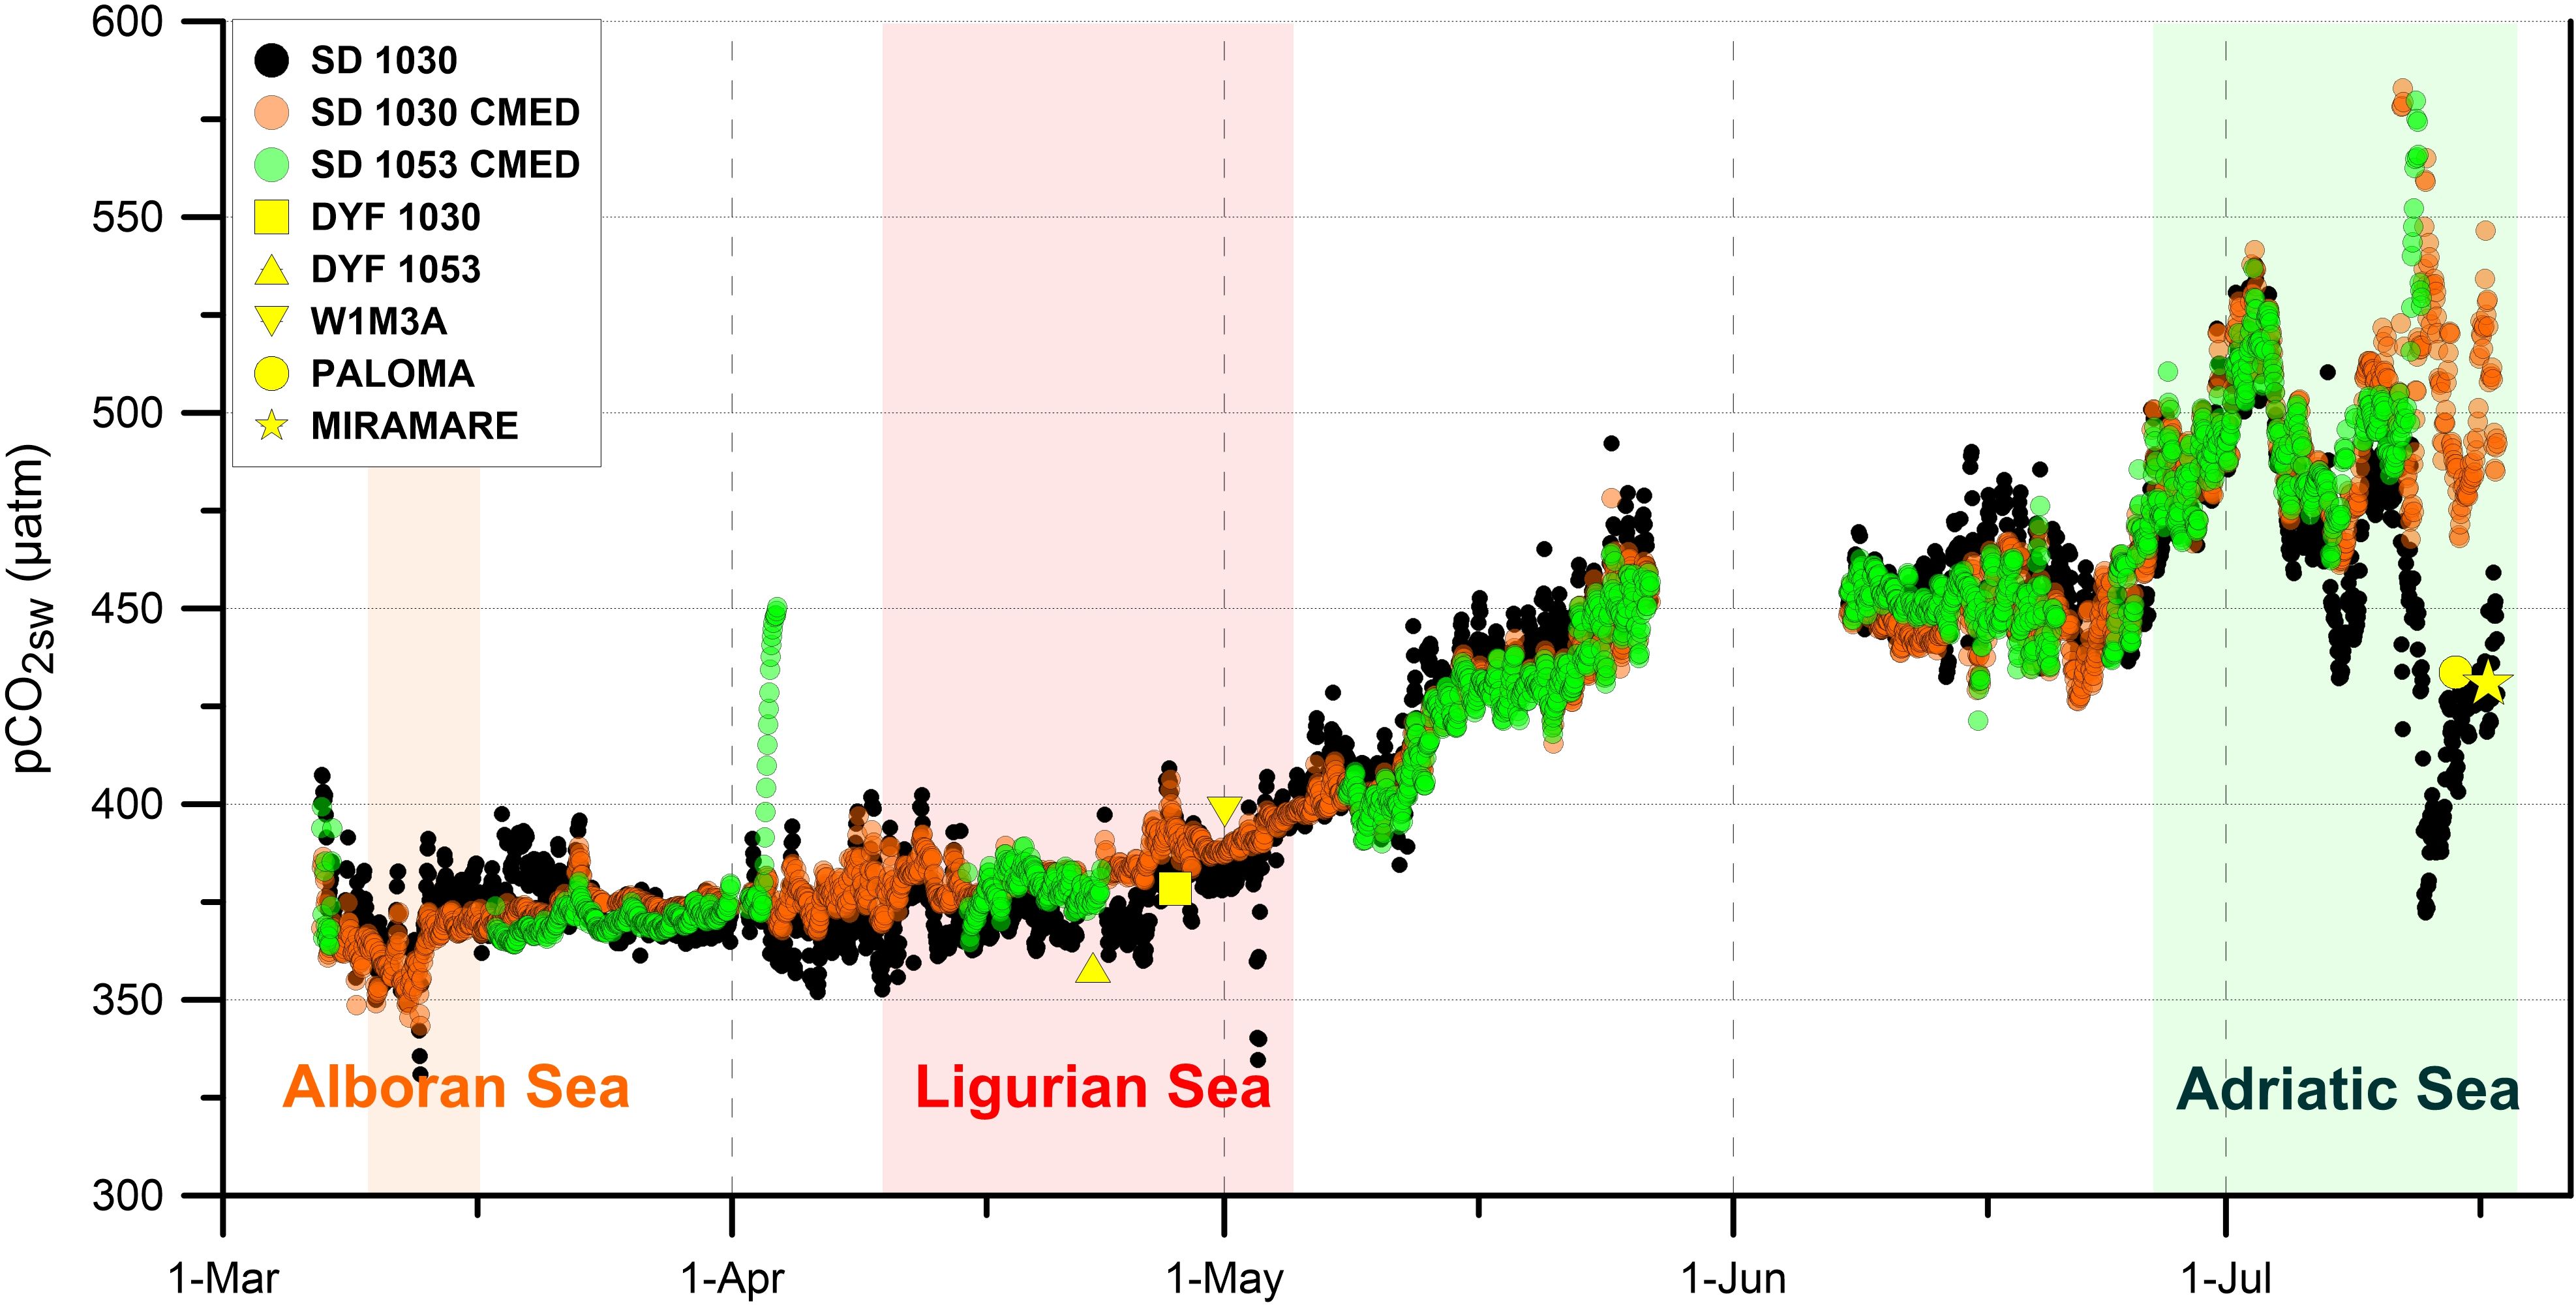
Figure 6. Time series of pCO2sw in the Mediterranean Sea obtained from CANYON-MED (CMED) neural networks for SD 1030 (in orange) and SD 1053 (in green), alongside pCO2sw data from SD 1030 (in black). The reference data are derived from fixed stations equipped with pCO2sw sensors, corresponding to the dates when SD 1030 (and SD 1053 for DYFAMED) was in proximity to these sites: DYFAMED (represented by a yellow square and triangle), W1M3A (yellow triangle down), PALOMA (yellow circle), and MIRAMARE (yellow star).
Further analysis of discrepancies between pCO2sw measurements from W1M3A and the SD revealed that differences primarily stemmed from the total gas stream pressure measurement provided which was used to calculate pCO2sw. In contrast, better agreement was observed when comparing xCO2sw measurements, with an absolute mean error of 3.9 ppm. Figure 6 illustrates that CANYON-MED predictions for pCO2sw are consistent with direct measurements from SD 1030 and sensors deployed on fixed buoys (DYFAMED and W1M3A).
Occasionally, discrepancies in pCO2sw between CANYON-MED predictions and in situ measurements are seen (Figure 6). These are mainly due to the neural network’s limited spatial resolution, which cannot capture sub-mesoscale variability. This is especially evident in the northern Adriatic Sea, where complex coastal influences (e.g., river inputs, groundwater discharges) fall outside the neural network original training scope (open sea in the Mediterranean Sea), leading to notable mismatches with data from SDs and fixed stations like PALOMA and MIRAMARE. Despite these limitations near the coast, CANYON-MED performs well in offshore regions such as the Ligurian, Ionian, and southern Adriatic Sea, where its predictions align closely with SD measurements. This suggests that CANYON-MED can effectively complement the in situ measurements and help fill observational gaps where direct pCO2sw measurements are unavailable due to sensor failure or maintenance.
3.2.4 Southern Adriatic Sea
Starting from mid-June to the beginning of July 2020, the SDs crossed the southern Adriatic Sea (Figure 7A). This area exhibits a strong variability triggered by the inflow of cold and less salty water from the northern Adriatic and warm and salty water entering the basin through the Otranto strait in the south (Ingrosso et al., 2017; Cantoni et al., 2024; Martellucci et al., 2024). This, drives the formation of small scale eddies (e.g., baroclinic instability) mixing these different water masses. The SD pCO2sw showed an increasing trend over the entire period (25 June - 1 July 2020) which was similar to the measurements at the E2M3A site (Figure 7D). This was likely due to the increasing SST (Figure 7B) as confirmed by the analysis of the thermal and non-thermal components of pCO2sw suggesting a strong influence of temperature rather than biological processes (R>1; Figure 7D). This was also highlighted by very low fluctuation in the O2 concentration Figure 7C over the period that could have been related to biological processes, as the southern Adriatic is an oligotrophic area. Pronounced day-night variations of SD pCO2sw were also evident in correspondence with SST relative maxima. The CO2 fluxes (Figure 7E) showed positive values over the entire period indicating CO2 outgassing from the sea. While Ingrosso et al. (2017) reported that dense water formation was among the primary drivers of CO2 uptake in the area in winter, the SD measurements highlighted an opposite pattern during summer. In addition, the CO2 fluxes calculated from SD measurements and the fluxes calculated from the pCO2sw data of E2M3A show again good agreement in their general patterns (R2 = 0.72, p ≤ 0.05). SST and SSS measured by the two SDs between 25 June and 1 July 2020 showed similar values at distance less than 10 km apart and also a good agreement with the E2M3A data (R2 = 0.72, p < 0.005; in contrast to the other fixed stations, the SD surrounded E2M3A for a sufficient amount of time to perform reliably statistics). However, during 26–28 June 2020, when the SDs sailed eastward along the Bari-Dubrovnik track, the SSS decreased from that measured at E2M3A, evidencing that the SDs entered the less salty coastal waters.

Figure 7. (A) Map of the SD trajectory in the southern Adriatic Sea. Glider measurements (green dots), the E2M3A site (magenta star) are also displayed. The measurements were performed during June-July 2020. Temporal evolution of (B) sea surface temperature (SST; °C) and sea surface salinity (SSS), (C) dissolved oxygen concentration (O2; μmol kg-1) and oxygen saturation (%), (D) pCO2sw (µatm) and ratio between thermal and non-thermal components of pCO2sw (R), where red diamonds represent the pCO2sw, recorded at E2M3A (the temporal discrepancy between the two time series is due to the different frequency of data acquisition: every hour and every four hours for SD and E2M3A respectively), and (E) flux of CO2 (FCO2; mmol CO2 m-2 day-1) and wind speed (m s-1).
3.2.5 Northern Adriatic Sea
The carbonate balance and dynamics in the shallow (mean depth is approx. 30 m) northern Adriatic sea is strongly influenced by river discharges. The Po river is the major source of freshwater and nutrients in the area (e.g., Cozzi and Giani, 2011), but also smaller rivers influence the carbon chemistry of the region (Giani et al., 2023). Between 13 and 14 July 2020, the SDs crossed a plume of the Po river in the northern Adriatic (Figure 8A). The plume extended eastward from the Po delta on the western Italian coast as evidenced by the lower SSS and higher SST measured by the SD (Figure 8B). The eastward extension of the plume was caused by the northeasterly katabatic Bora wind blowing in the area from 12 to 15 July (Supplementary Figure S6, Supplementary Material). Chl-a in the plume was higher (Supplementary Figure S7, Supplementary Material) as a response to the river borne nutrients, and the corresponding phytoplankton bloom caused a marked decrease in pCO2sw reaching its lowest values of about 370 µatm which resulted in a CO2 influx (Figures 8D, E). The CO2 drawdown by phytoplankton can be seen by the increase in the pCO2 ratio (green line in Figure 8D, Supplementary Figure S2) due to the decrease of the non thermal pCO2. This was the only occurrence of CO2 influx in the Adriatic Sea during the demonstration mission (Figure 2B).
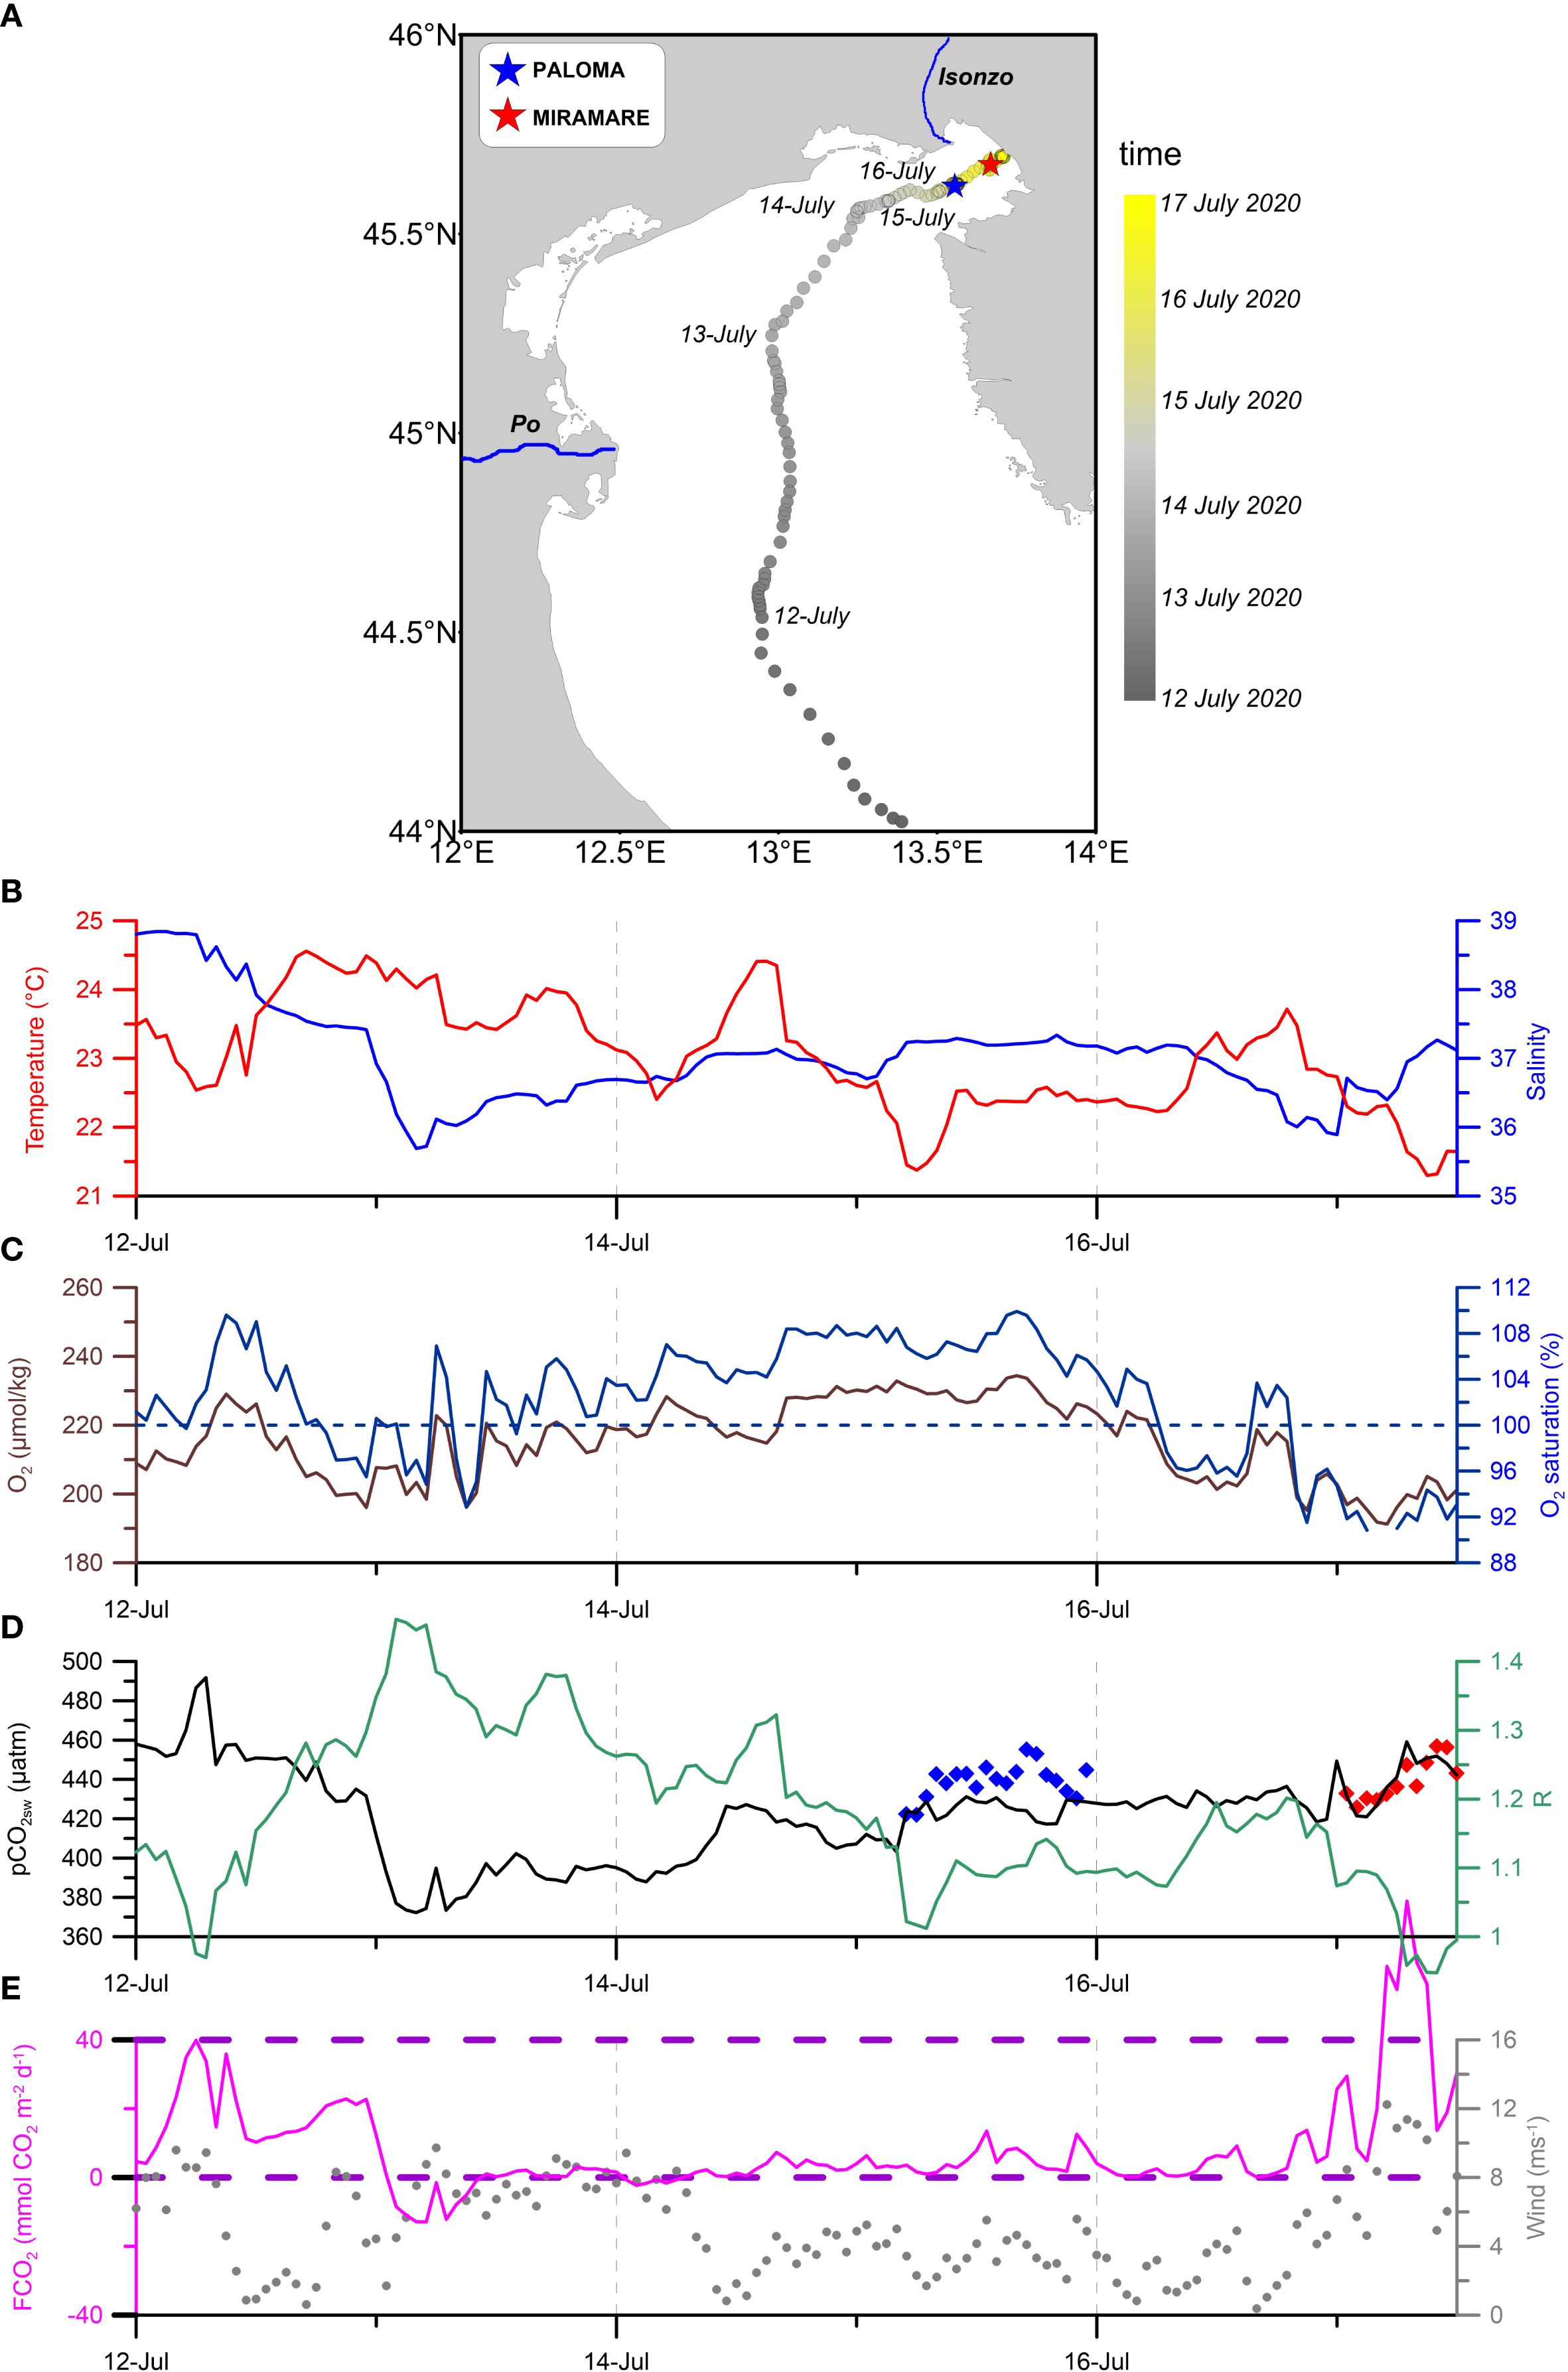
Figure 8. (A) Map of the SD tracks in the northern Adriatic Sea between 12 and 17 July 2020. The position of PALOMA (blue star) and MIRAMARE (red star) stations are indicated. Time series of (B) sea surface temperature (SST; °C) and sea surface salinity (SSS), (C) dissolved oxygen concentration (O2; μmol kg-1) and oxygen saturation (%), (D) pCO2sw (µatm) and ratio between thermal and non-thermal components of pCO2sw, and (E) flux of CO2 (FCO2; mmol CO2 m-2 day-1) and wind speed (m s-1). In d), pCO2sw acquired from PALOMA and MIRAMARE are indicated as blue and red diamonds, respectively.
On 16 July 2020, before entering the Gulf of Trieste, the SDs crossed the Isonzo river plume (Figure 8A) as marked by a decrease in SSS (~ -1.6) and increase in SST (~ +1.1°C) (Figure 8B). However, differently from the crossing of the Po river plume, the SDs did not record marked pCO2sw changes. The pCO2sw increase due to the thermal effect was compensated by the non-thermal decrease presumably due to the CO2 drawdown caused by primary productivity as also suggested by the increase of O2 saturation (Figure 8C). Successively, from 17 to 18 of July 2020 a new outburst of the Bora wind was associated to an increase in pCO2sw, despite the decrease in SST (~ -1.0 °C) and a switch from thermal (R = 1.14) to non thermal (R = 0.95) control. Strong positive CO2 fluxes from the sea, up to 80 mmol m-2d-1, were measured (Figure 8E) turning the Gulf of Trieste from a weak (FCO2 = 2.6 mmol m-2d-1 on average) to a strong (FCO2 = 30.7 mmol m-2d-1 on average) CO2 source. Contrary to what might be expected due to CO2 outgassing, this increase in pCO2sw can be explained by the mixing with bottom waters induced by northeasterly winds, which promote coastal upwelling. When the SDs entered the Gulf of Trieste, the water column was strongly stratified, with bottom waters depleted in O2 (down to 132 µmol kg-1; 56% O2 sat) and enriched in CO2 (up to 641 µatm in the middle of the gulf; Supplementary Figure S8, Supplementary Material). The increase of DIC and pCO2sw and the decrease of pH and O2 concentration below the pycnocline is typically observed in the Gulf of Trieste (Cantoni et al., 2012; Ingrosso et al., 2016a, b) during summer when the microbial respiration prevails over the primary production (Fonda Umani et al., 2012). The results reported here are consistent with previous findings by Turk et al. (2010); Cossarini et al. (2015) and Urbini et al. (2020) and further strengthens the role of this area as a CO2 source during summer and highlights the interplay of multiple factors in controlling sea surface pCO2sw variability. This phenomenon further strengthens the role of this area as a CO2 source during summer and highlights the interplay of multiple factors in controlling sea surface pCO2sw variability.
4 Conclusion
The nine months of the ATL2MED mission provided insights into the regional air-sea CO2 exchange dynamics of the East Atlantic and the Mediterranean Sea, two areas that are generally under-sampled (Landschützer et al., 2020; Tanhua et al., 2021; Hassoun et al., 2022; Bakker et al., 2023; Chakraborty et al., 2023). At a broad and regional scale, our measurements revealed that the Eastern Atlantic and the Mediterranean Sea exhibit distinct CO2 flux patterns driven by different processes. However, it must be kept in mind that the ATL2MED mission took place over three seasons, in which different processes contributed to the pCO2sw variations, making direct comparisons between the regions challenging.
In the northwest African upwelling system, specifically in the upwelled waters characterized by low Chl-a concentration and strong winds, the pCO2sw variability was mainly driven by the thermal component pCO2sw_TD however in the cyclonic eddy also the primary productivity contributed to reverse the CO2 fluxes from the sea to the atmosphere.
On the contrary, in the highly productive regions of the Alboran sea and the Gulf of Lion biological activity played a significant role in driving the variability of pCO2sw, resulting in strongly negative CO2 fluxes, occurring during the spring bloom season. In these areas, the non-thermal component of pCO2sw (pCO2sw_N) was dominant over pCO2sw_TD. This is due to the low temperature and the presence of upwelling, which brings CO2-rich deep waters to the surface, counterbalancing the CO2 uptake by phytoplankton. In the Adriatic during the summer the pCO2 increase was mainly driven by the seasonal warming, observed in the high values of pCO2sw_TD, leading to the highest CO2 effluxes recorded during the mission, and also strong wind and respiration processes further increased the CO2 efflux. However in presence of riverine inputs (i.e. Po river in the northern Adriatic), the pCO2 strongly decreases driven by the uptake of phytoplankton, causing an influx of pCO2 from the atmosphere reflecting the high variability of the area. Indeed as observed in Borges et al., 2018 and Chen et al., 2020, river-borne nutrients can stimulate primary production, promoting a transient atmospheric CO2 sink during phytoplankton blooms. These measurements captured fine-scale processes, including the influence of small eddies (i.e. eastern Atlantic), localized mixing events, and the impact of river plumes (i.e. northern Adriatic), which are often masked by broader-scale observations. Such localized phenomena can drive rapid and substantial changes in CO2 exchange dynamics, highlighting the need for high-resolution measurements to fully understand the interplay between physical and biogeochemical processes at the air-sea interface. Moreover, the ATL2MED mission showed a close match between the CANYON-MED derived pCO2sw estimates and the SD measurements, where the offset of 15–20 µatm fell within the expected error range of the neural network-derived pCO2sw estimates. Due to limited spatial resolution of CANYON-MED, there are some differences when comparing to the SD pCO2sw measurements, however CANYON-MED complements pCO2sw measurements from other platforms like the SDs. It is also confirmed that while these models effectively capture broader patterns, they may overlook important sub-mesoscale features critical for precise CO2 flux estimation as for the northern Adriatic case.
Despite the various challenges of the ATL2MED mission (e.g., the Covid pandemic), the SDs have proven to be a valuable tool for increasing the spatial pCO2 data density, underscoring the complementary role that autonomous vehicles such as Saildrones can play in global carbon monitoring efforts. Overall, these findings emphasize that a multi-scale monitoring approach is essential to refining our understanding of marine carbon dynamics and improving predictive capabilities in a changing climate.
Data availability statement
The datasets presented in this study can be found in online repositories. The names of the repository/repositories and accession number(s) can be found below: https://doi.org/10.5194/essd-16-5333-2024, 2024.
Author contributions
RM: Data curation, Formal analysis, Investigation, Methodology, Visualization, Writing – original draft. CD: Data curation, Formal analysis, Investigation, Writing – original draft. LC: Conceptualization, Data curation, Formal analysis, Funding acquisition, Investigation, Methodology, Project administration, Resources, Writing – original draft, Writing – review & editing, Software. IS: Conceptualization, Funding acquisition, Project administration, Resources, Supervision, Writing – original draft, Writing – review & editing. MG: Conceptualization, Data curation, Formal analysis, Investigation, Methodology, Supervision, Writing – original draft, Writing – review & editing, Visualization. SP: Data curation, Formal analysis, Funding acquisition, Investigation, Resources, Writing – original draft, Writing – review & editing, Methodology. CC: Conceptualization, Data curation, Formal analysis, Funding acquisition, Investigation, Methodology, Resources, Validation, Writing – original draft, Writing – review & editing. VC: Funding acquisition, Project administration, Resources, Supervision, Writing – review & editing. MF: Data curation, Formal analysis, Investigation, Methodology, Writing – original draft. RB: Funding acquisition, Project administration, Resources, Supervision, Writing – review & editing. MP: Data curation, Formal analysis, Resources, Validation, Writing – review & editing. EM: Data curation, Funding acquisition, Project administration, Resources, Supervision, Writing – review & editing.
Funding
The author(s) declare financial support was received for the research and/or publication of this article. The ATL2MED mission received support regarding coordination, operation, and data deliverance from Saildrone Inc. and funding from the US company PEAK 6 Invest, GEOMAR Helmholtz Centre for Ocean Research (GEOMAR), Integrated Carbon Observation System -Ocean Thematic Centre (ICOS-OTC), the French National Centre for Scientific Research (CNRS), Oceanography Laboratory of Villefranche (LOV), the Oceanic Platform of the Canary Islands (PLOCAN), Ocean Science Centre Mindelo (OSCM), the Hydrographic Institute of Portugal (IH), Balearic Islands Coastal Observing and Forecasting System (SOCIB), Italian National Institute of Oceanography and Applied Geophysics (OGS), Helmholtz Zentrum Geesthacht (HZG), Centre Scientifique de Monaco (CSM), National Research Council-Institute of Marine Sciences (CNR-ISMAR), and National Research Council -Institute for the study of Anthropic Impact and Sustainability in the Marine Environment (CNR-IAS). PEAK 6 Invest was not involved in the study design, collection, analysis, interpretation of data, the writing of this article, or the decision to submit it for publication.
Acknowledgments
We thank the OGS engineers Paolo Mansutti and Giuseppe Siena for the assistance during the final recovery of the SDs, and Piero Zuppelli, Riccardo Gerin, Antonio Bussani and Massimo Pacciaroni for piloting the OGS glider. Furthermore, we thank Benjamin Pfeil and Björn Fiedeler for initialising the mission and Fiedeler for executing the first phase of the mission. Finally, we are very grateful for the help from Adrienne Sutton and Stacy Manner regarding correction of the ASVCO2 pCO2sw and pCO2atm data. The authors would like to thank the ICOS Ocean Thematic Centre for providing the data of the SAILDRONE mission and of the ICOS stations (W1M3A, E2M3A, Paloma and MIRAMARE).
Conflict of interest
The authors declare that the research was conducted in the absence of any commercial or financial relationships that could be construed as a potential conflict of interest.
The author(s) declared that they were an editorial board member of Frontiers, at the time of submission. This had no impact on the peer review process and the final decision.
Generative AI statement
The author(s) declare that no Generative AI was used in the creation of this manuscript.
Any alternative text (alt text) provided alongside figures in this article has been generated by Frontiers with the support of artificial intelligence and reasonable efforts have been made to ensure accuracy, including review by the authors wherever possible. If you identify any issues, please contact us.
Publisher’s note
All claims expressed in this article are solely those of the authors and do not necessarily represent those of their affiliated organizations, or those of the publisher, the editors and the reviewers. Any product that may be evaluated in this article, or claim that may be made by its manufacturer, is not guaranteed or endorsed by the publisher.
Supplementary material
The Supplementary Material for this article can be found online at: https://www.frontiersin.org/articles/10.3389/fmars.2025.1633617/full#supplementary-material
References
Bakker D. C. E., Alin S. R., Bates N., Becker M., Feely R. A., Gkritzalis T., et al. (2023). Surface ocean CO2 Atlas Database version 2023 (SOCATv2023) (NOAA National Centres for Environmental Information Dataset).
Bakker D. C. E., Pfeil B., Landa C. S., Metzl N., O’Brien K. M., Olsen A., et al. (2016). A multi-decade record of high-quality data in version 3 of the Surface Ocean Atlas (SOCAT). Earth Syst. Sci. Data 8, 383–413. doi: 10.5194/essd-8-383-2016
Ben Mustapha Z., Alvain S., Jamet C., Loisel H., and Dessailly D. (2014). Automatic classification of water-leaving radiance anomalies from global SeaWiFS imagery: application to the detection of phytoplankton groups in open ocean waters. Remote Sens. Environ. 146, 97–112. doi: 10.1016/j.rse.2013.08.046
Berta M., Bellomo L., Griffa A., Magaldi M. G., Molcard A., Mantovani C., et al. (2018). Wind-induced variability in the Northern Current (northwestern Mediterranean Sea) as depicted by a multi-platform observing system. Ocean Sci. 14, 689–710. doi: 10.5194/os-14-689-2018
Bittig H. C., Körtzinger A., Neill C., Van Ooijen E., Plant J. N., Hahn J., et al. (2018). Oxygen optode sensors: principle, characterization, calibration, and application in the ocean. Front. Mar. Sci 4, 429. doi: 10.3389/fmars.2017.00429
Buongiorno Nardelli B., Tronconi C., Pisano A., and Santoleri R. (2013). High and Ultra-High resolution processing of satellite Sea Surface Temperature data over Southern European Seas in the framework of MyOcean project. Remote Sens. Environ. 129, 1–16. doi: 10.1016/j.rse.2012.10.012
Cantoni C., De Vittor C., Faganeli J., Giani M., Kovač N., Malej A., et al. (2024). Carbonate system and acidification of the Adriatic Sea. Mar. Chem. 267, 104462. doi: 10.1016/j.marchem.2024.104462
Cantoni C. and Luchetta A. (2024). PALOMA fixed station data collected as part of the ATL2MED demonstration experiment 2019-2020. Available online at: https://hdl.handle.net/11676/an-PJSKTiEVHj3H0gA8ak3lG (Accessed May 15, 2024).
Cantoni C., Luchetta A., Celio M., Cozzi S., Raicich F., and Catalano G. (2012). Carbonate system variability in the Gulf of Trieste (North Adriatic Sea). Estuarine Coast. Shelf Sci 115, 51–62. doi: 10.1016/j.ecss.2012.07.006
Capó E., McWilliams J. C., Mason E., and Orfila A. (2021). Intermittent frontogenesis in the Alboran Sea. J. Phys. Oceanogr 51, 1417–1439. doi: 10.1175/JPO-D-20-0277.1
Chakraborty K., Joshi A. P., Ghoshal P. K., Ghosh J., Akhand A., Bhattacharya T., et al. (2023). Mechanisms and drivers controlling spatio-temporal evolution of pCO2 and air-sea CO2 fluxes in the southern Java coastal upwelling system. Estuarine Coast. Shelf Sci 293, 108509. doi: 10.1016/j.ecss.2023.108509
Copin-Montégut C. and Bégovic M. (2002). Distributions of carbonate properties and oxygen along the water column (0–2000 m) in the central part of the NW Mediterranean Sea (Dyfamed site): influence of winter vertical mixing on air–sea CO2 and O2 exchanges. Deep Sea Res. Part II: Topical Stud. Oceanography 49, 2049–2066. doi: 10.1016/S0967-0645(02)00027-9
Copin-Montégut C., Bégovic M., and Merlivat L. (2004). Variability of the partial pressure of CO2 on diel to annual time scales in the Northwestern Mediterranean Sea. Mar. Chem. 85, 169–189. doi: 10.1016/j.marchem.2003
Coppola L., Boutin J., Gattuso J., Lefevre D., and Metzl N. (2020). “The carbonate System in the Ligurian Sea,” in The Mediterranean Sea in the Era of Global Change 1. Eds. Migon C., Nival P., and Sciandra A. (Wiley), 79–103. doi: 10.1002/9781119706960.ch4
Coppola L., Fourrier M., Pasqueron de Fommervault O., Poteau A., Riquier E. D., and Béguery L. (2023). High-resolution study of the air-sea CO2 flux and net community oxygen production in the Ligurian Sea by a fleet of gliders. Front. Mar. Sci. 15. doi: 10.3389/fmars.2023.1233845
Coppola L., Legendre L., Lefevre D., Prieur L., Taillandier V., and Diamond Riquier E. (2018). Seasonal and inter-annual variations of dissolved oxygen in the northwestern Mediterranean Sea (DYFAMED site). Prog. Oceanogr. 162, 187–201. doi: 10.1016/j.pocean.2018.03.001
Cossarini G., Feudale L., Teruzzi A., Bolzon G., Coidessa G., Solidoro C., et al. (2021). High-resolution reanalysis of the mediterranean sea biogeochemistry, (1999–2019). Front. Mar. Sci. 8. doi: 10.3389/fmars.2021.741486
Cossarini G., Lazzari P., and Solidoro C. (2015). Spatiotemporal variability of alkalinity in the Mediterranean Sea. Biogeosciences 12, 1647–1658. doi: 10.5194/bg-12-1647-2015
Cozzi S. and Giani M. (2011). River water and nutrient discharges in the Northern Adriatic Sea: Current importance and long term changes. Continental Shelf Res. 31, 1881–1893. doi: 10.1016/j.csr.2011.08.010
Cropper T. E., Hanna E., and Bigg G. R. (2014). Spatial and temporal seasonal trends in coastal upwelling off Northwest Africa 1981–2012. Deep-Sea Res. Pt. I 86, 94–111. doi: 10.1016/j.dsr.2014.01.007
Curbelo-Hernández D., González-Santana D., González-González A., Santana-Casiano J. M., and González-Dávila M. (2024). Spatio-temporal variations in surface Marine Carbonate System properties across the Western Mediterranean Sea using Volunteer Observing Ship data. Biogeosciences 22, 3329–3356. doi: 10.5194/egusphere-2024-2709
Damien P., Deutsch C., McWilliams J. C., Kessouri F., and Renault L. (2022). Enhanced biogeochemical cycling along the U.S. West Coast shelf. Global Biogeochem. Cycles 37, e2022GB007572. doi: 10.1029/2022GB007572
Devresse Q., Becker K. W., Dilmahamod A. F., Ortega-Retuerta E., and Engel A. (2023). Dissolved organic matter fluorescence as a tracer of upwelling and microbial activities in two cyclonic eddies in the Eastern Tropical North Atlantic. J. Geophys. Res. Oceans 128, e2023JC019821. doi: 10.1029/2023JC019821
Escudier R., Clementi E., Cipollone A., Pistoia J., Drudi M., Grandi A., et al. (2021). A High Resolution reanalysis for the mediterranean sea. Front. Earth Sci. 9. doi: 10.3389/feart.2021.702285
Escudier R., Clementi E., Omar M., Cipollone A., Pistoia J., Aydogdu A., et al. (2020). Mediterranean sea Physical Reanalysis (CMEMS MED-Currents) (Version 1) (Copernicus Monitoring Environment Marine Service (CMEMS). doi: 10.25423/CMCC/MEDSEA_MULTIYEAR_PHY_006_004_E3R1
Euro-Argo ONE (2025). Available online at: https://www.euro-argo.eu/EU-Projects/Euro-Argo-ONE-2025-2027 (Accessed April 11, 2025).
Fassbender A. J., Palevsky H. I., and Sutton A. J. (2022). Quantifying the role of seasonality in the marine carbon cycle feedback. Global Biogeochem. Cycles 36, e2021GB007018. doi: 10.1029/2021GB007018
Fischer G., Romero O., Merkel U., Donner B., Iversen M., Nowald N., et al. (2016). Deep ocean mass fluxes in the coastal upwelling off Mauritania from 1988 to 2012: variability on seasonal to decadal timescales. Biogeosciences 13, 3071–3090. doi: 10.5194/bg-13-3071-2016
Fonda Umani S., Malfatti F., and Del Negro P. (2012). Carbon fluxes in the pelagic ecosystem of the Gulf of Trieste (Northern Adriatic Sea). Estuarine Coast. Shelf Sci 115, 170–185. doi: 10.1016/j.ecss.2012.04.006
Ford D. J., Tilstone G. H., Shutler J. D., Kitidis V., Sheen K. L., Dall’Olmo G., et al. (2023). Mesoscale eddies enhance the air-sea CO2 sink in the South Atlantic Ocean. Geophys. Res. Lett. 50, e2022GL102137. doi: 10.1029/2022GL102137
Fourrier M., Coppola L., Claustre H., D’Ortenzio F., Sauzède R., and Gattuso J.-P. (2020). A regional neural network approach to estimate water-column nutrient concentrations and carbonate system variables in the mediterranean sea: CANYON-MED. Front. Mar. Sci. 7. doi: 10.3389/fmars.2020.00620
Fourrier M., Coppola L., D’Ortenzio F., Migon C., and Gattuso J. (2022). Impact of intermittent convection in the northwestern mediterranean sea on oxygen content, nutrients, and the carbonate system. J. Geophys. Res. Oceans 127, e2022JC018615. doi: 10.1029/2022JC018615
Frazão H. C., Send U., Sutton A. J., Ohman M. D., Lankhorst M., Martz T. R., et al. (2025). Open ocean versus upwelling regimes: Air-sea CO2 fluxes and pCO2 inter-annual variability in the Southern California Current System. J. Geophys. Res. Oceans 130, e2024JC022126. doi: 10.1029/2024JC022126
Friedelingstein P., O’Sullivan M., Jones M. W., Andrew R. M., Bakker D. C. E., Hauck J., et al. (2025). Global carbon budget 2024. Earth Syst. Sci. Data 17, 965–1039. doi: 10.5194/essd-17-965-2025
Garcia-Ibañez M. I., Guallart E. F., Lucas A., Pascual J., Gasol J. M., Marrasé C., et al. (2024). Two new coastal time- series of seawater carbonate system variables in the NW Mediterranean Sea: rates and mechanisms controlling pH changes. Front. Mar. Sci. 11. doi: 10.3389/fmars.2024.1348133
GEORGE (2024). Available online at: https://george-project.eu (Accessed August 10, 2024).
Giani M., Ogrinc N., Tamše S., and Cozzi S. (2023). Elevated river inputs of the total alkalinity and dissolved inorganic carbon in the Northern Adriatic Sea. Water 15, 894. doi: 10.3390/w15050894
Global ocean colour (Copernicus-globColour), Bio-Geo-Chemical, L4 (monthly and interpolated) from Satellite Observations (Near Real Time) (E.U. Copernicus MarineService (CMEMS). doi: 10.48670/moi-00279
González-Dávila M., Santana Casiano J. M., and Machín F. (2017). Changes in the partial pressure of carbon dioxide in the Mauritanian–Cap Vert upwelling region between 2005 and 2012. Biogeosciences 14, 3859–3871. doi: 10.5194/bg-14-3859-2017
Good S., Fiedler E., Mao C., Martin M. J., Maycock A., Reid R., et al. (2020). The current configuration of the OSTIA system for operational production of foundation sea surface temperature and ice concentration analyses. Remote Sens 12, 720. doi: 10.3390/rs12040720
Gregor L., Shutler J., and Gruber N. (2024). High-resolution variability of the ocean carbon sink. Global Biogeochem. Cycles 38, e2024GB008127. doi: 10.1029/2024GB008127
Gu Y., Katul G. G., and Cassar N. (2023). Multiscale temporal variability of the global air-sea CO2 flux anomaly. JGR Biogeosciences 128, e2022JG006934. doi: 10.1029/2022JG006934
Guo Y. and Timmermans M.-L. (2024). The role of ocean mesoscale variability in air-sea CO2 exchange: A global perspective. Geophys. Res. Lett. 51, e2024GL108373. doi: 10.1029/2024GL108373
Harrison C. S., Stock C. A., and John J. G. (2018). Mesoscale effects on carbon export: A global perspective. Global Biogeochem. Cycles 32, 682–702. doi: 10.1002/2017GB005751
Hassoun A. E. R., Bantelman A., Canu D., Comeau S., Galdies C., Gattuso J.-P., et al. (2022). Ocean acidification research in the Mediterranean Sea: Status, trends and next steps. Front. Mar. Sci. 9. doi: 10.3389/fmars.2022.892670
Hersbach H., Bell B., Berrisford P., Biavati G., Horányi A., Muñoz S., et al. (2023). ERA5 hourly data on single levels from 1940 to present (Copernicus Climate Change Service (C3S) Climate Data Store (CDS). doi: 10.24381/cds.adbb2d47
Houpert L., Durrieu De Madron X., Testor P., Bosse A., D’Ortenzio F., Bouin M. N., et al. (2016). Observations of open-ocean deep convection in the northwestern Mediterranean Sea: Seasonal and interannual variability of mixing and deep water masses for the 2007–2013 Period: DEEP CONVECTION OBS. NWMED 2007-2013. J. Geophys. Res. Oceans 121, 8139–8171. doi: 10.1002/2016JC011857
Humphreys M. P., Lewis E. R., Sharp J. D., and Pierrot D. (2022). PyCO2SYS v1.8: marine carbonate system calculations in Python. Geosci. Model. Dev. 15, 15–43. doi: 10.5194/gmd-15-15-2022
Ingrosso G., Bensi M., Cardin V., and Giani M. (2017). Anthropogenic CO2 in a dense water formation area of the Mediterranean Sea. Deep-Sea Res. I: Oceanographic Res. Papers 123, 118–128. doi: 10.1016/j.dsr.2017.04.004
Ingrosso G., Giani M., Cibic T., Karuza A., Kralj M., and Del Negro P. (2016b). Carbonate chemistry dynamics and biological processes along a river-sea gradient (Gulf of Trieste, northern Adriatic Sea). J. Mar. Syst. 155, 35–49. doi: 10.1016/j.jmarsys.2015.10.013
Ingrosso G., Giani M., Comici C., Kralj M., Piacentino S., De Vittor C., et al. (2016a). Drivers of the carbonate system seasonal variations in a Mediterranean gulf. Estuarine Coast. Shelf Sci 168, 58–70. doi: 10.1016/j.ecss.2015.11.001
IPCC (2021). “Summary for policymakers,” in Climate change 2021: the physical science basis. Contribution of working group I to the sixth assessment report of the intergovernmental panel on climate change. Eds. Masson-Delmotte V., Zhai P., Pirani A., Connors S. L., Péan C., Berger S., Caud N., Chen Y., Goldfarb L., Gomis M. I., Huang M., Leitzell K., Lonnoy E., Matthews J. B. R., Maycock T. K., Waterfield T., Yelekçi O., Yu R., and Zhou B. (Cambridge University Press, Cambridge, United Kingdom and New York, NY, USA), 3–32. doi: 10.1017/9781009157896.001
Jersild A. and Ito T. (2020). Physical and biological controls of the drake passage pCO2 variability. Global Biogeochem. Cycles 34, e2020GB006644. doi: 10.1029/2020GB006644
Kapsenberg L., Alliouane S., Gazeau F., Mousseau L., and Gattuso J.-P. (2017). Coastal ocean acidification and increasing total alkalinity in the northwestern Mediterranean Sea. Ocean Sci. 13, 411–426. doi: 10.5194/os-13-411-2017
Katzenmeier S. N., Nothof M., Breiner H.-W., Fischer T., and Stoeck T. (2024). Mesoscale cyclinic eddies born in an eastern boundary upwelling system enhance microbial eukaryote diversity in oligotrophic offshore waters. Deep Sea Res. II 218, 105425. doi: 10.1016/j.dsr2.2024.105425
Kerr R., Orselli I. B. M., Mello M. S., and Dynarski B. Y. (2025). Physical-biological processes regulating summer sea-air CO2 exchanges along the Drake Passage and northern Antarctic Peninsula. Continental Shelf Res. 296, 105151. doi: 10.1016/j.marchem.2025.104497
Kessler A., Goris N., and Lauvset S. K. (2022). Observation-based Sea surface temperature trends in Atlantic large marine ecosystems. Prog. Oceanogr. 208, 102902. doi: 10.1016/j.pocean.2022.102902
Kessouri F., Ulses C., Estournel C., Marsaleix P., Severin T., Pujo-Pay M., et al (2020). Nitrogen and phosphorus budgets in the northwestern mediterranean deep convection region. J. Geophys. Res. Oceans 122, 9429–9454. doi: 10.1002/2016JC012665
Kubin E., Menna M., Mauri E., Notarstefano G., Mieruch S., and Poulain P.-M. (2023). Heat content and temperature trends in the Mediterranean Sea as derived from Argo float data. Front. Mar. Sci. 10. doi: 10.3389/fmars.2023.1271638
Landschützer P., Gruber N., Bakker D. C. E., and Schuster U. (2014). Recent variability of the global ocean carbon sink. Glob. Biogeochem. Cycles 28, 927–949. doi: 10.1002/2014GB004853
Landschützer P., Laruelle G. G., Roobaert A., and Regnier P. (2020). A uniform pCO2 climatology combining open and coastal oceans. Earth System Sci Data 12, 2537–2553. doi: 10.5194/essd-12-2537-2020
Lefèvre N., Veleda D., and Hartman S. E. (2023). Outgassing of CO2 dominates in the coastal upwelling off the northwest African coast. Deep Sea Res. Part I: Oceanographic Res. Papers 200, 104130. doi: 10.1016/j.dsr.2023.104130
Lévy M., Couespel D., Haëck C., Keerthi M. G., Mangolte I., and Prend C. J. (2024). The impact of fine-scale currents on biogeochemical cycles in a changing ocean. Annu. Rev. Mar. Sci 16, 191–215. doi: 10.1146/annurev-marine-020723-020531
Li X., Gan B., Zhang Z., Cao Z., Qiu B., Chen Z., et al. (2025). Oceanic uptake of CO2 enhanced by mesoscale eddies. Sci Adv. 11, eadt4195. doi: 10.1126/sciadv.adt4195
Liu X., Wu H., Fan Y., Ji Y., Zhou W., Wang L., et al. (2025). The impact of long-lived cycle mesoscale eddies on air–sea CO2 flux in the South Atlantic: focus on the full life cycle of the eddy. Environ. Res. Lett. 20, 034033. doi: 10.1088/1748-9326/adb59d
Lopez-Parages J., Gomara I., Rodríguez-Fonseca B., and García-Lafuente J. (2022). Potential SST drivers for Chlorophyll-a variability in the Alboran Sea: A source for seasonal predictability? Front. Mar. Sci 9, 931832. doi: 10.3389/fmars.2022.931832
Lueker T. J., Dickson A. G., and Keeling C. D. (2000). Ocean pCO2 calculated from dissolved inorganic carbon, alkalinity, and equations for K1 and K2: validation based on laboratory measurements of CO2 in gas and seawater at equilibrium. Mar. Chem. 70, 105–119. doi: 10.1016/S0304-4203(00)00022-0
Many G., Ulses C., Estournel C., and Marsaleix P. (2021). Particulate organic carbon dynamics in the Gulf of Lion shelf (NW Mediterranean) using a coupled hydrodynamic–biogeochemical model. Biogeosciences 18, 5513–5538. doi: 10.5194/bg-18-5513-2021
Martellucci R., Giani M., Mauri E., Coppola L., Poulsen M., Fourrier M., et al. (2024). CO2 and hydrography acquired by autonomous surface vehicles from the Atlantic Ocean to the Mediterranean Sea: data correction and validation. Earth Syst. Sci. Data 16, 5333–5356. doi: 10.5194/essd-16-5333-2024
Marullo S., Serva F., Iacono R., Napolitano E., Di Sarra A., Meloni D., et al. (2023). Record-breaking persistence of the 2022/23 marine heatwave in the Mediterranean Sea. Environ. Res. Lett. 18, 114041. doi: 10.1088/1748-9326/ad02ae
Mayot N., D’Ortenzio F., Taillandier V., Prieur L., De Fommervault O. P., Claustre H., et al. (2017). Physical and biogeochemical controls of the phytoplankton blooms in north western mediterranean sea: A multiplatform approach over a complete annual cycle (2012–2013 DEWEX experiment). J. Geophys. Res. Oceans 122, 9999–10019. doi: 10.1002/2016JC012052
McGillicuddy J. J., Anderson L. A., Doney S. C., and Maltrud M. E. (2003). Eddy-driven sources and sinks of nutrients in the upper ocean: Results from a 0.1° resolution model of the North Atlantic. Global Biogeochem Cy 17, 4–20. doi: 10.1029/2002GB001987
Mediterranean Sea, Bio-Geo-Chemical, L4, monthly means, daily gapfree and climatology Satellite Observations (1997–ongoing). (). doi: 10.48670/moi-00300
Merlivat L., Boutin J., Antoine D., Beaumont L., Golbol M., and Vellucci V. (2018). Increase of dissolved inorganic carbon and decrease in pH in near-surface waters in the Mediterranean Sea during the past two decades. Biogeosciences 15, 5653–5662. doi: 10.5194/bg-15-5653-2018
Middelburg J. J. (2019). Marine carbon biogeochemistry: A primer for earth system scientists (Cham: Springer Nature), 118. doi: 10.1007/978-3-030-10822-9
Minas H. J., Coste B., Le Corre P., Minas M., and Raimbault P. (1991). Biological and geochemical signatures associated with the water circulation through the Strait of Gibraltar and in the western Alboran Sea. J. Geophys. Res. 96, 8755–8771. doi: 10.1029/91JC00360
Mojica J. F., Sallarès V., and Biescas B. (2018). High-resolution diapycnal mixing map of the Alboran Sea thermocline from seismic reflection images. Ocean Sci. 14, 403–415. doi: 10.5194/os-14-403-2018
Morán X. A. G. and Estrada M. (2001). Short-term variability of photo -synthetic parameters and particulate and dissolved primary production in the Alboran Sea (SW Mediterranean). Mar. Ecol-Prog. Ser. 212, 53–67. doi: 10.3354/meps212053
Nigam T., Escudier R., Pistoia J., Aydogdu A., Omar M., Clementi E., et al. (2021). Mediterranean sea physical reanalysis INTERIM (CMEMS MED-currents, E3R1i system) (Version 1) (Copernicus Monitoring Environment Marine Service (CMEMS).
Orr J. C., Epitalon J.-M., Dickson A. G., and Gattuso J.-P. (2018). Routine uncertainty propagation for the marine carbon dioxide system. Mar. Chem. 207, 84–107. doi: 10.1016/j.marchem.2018.10.006
Pelegrí J. L. and Benazzouz J. (2015). Coastal upwelling off North-West Africa. In: Oceanographic and biological features in the Canary Current Large Marine Ecosystem. Available online at: https://unesdoc.unesco.org/ark:/48223/pf0000258912 (Accessed May 15, 2024).
Pérez F. F., Becker M., Goris N., Gehlen M., López-Mozos M., Tjiputra J., et al. (2024). An assessment of CO2 storage and sea-air fluxes for the atlantic ocean and mediterranean sea between 1985 and 2018. Glob. Biogeochem. Cycl. 38, e2023GB007862. doi: 10.1029/2023GB007862
Peter R., Kuttippurath J., Sunanda N., and Chakraborty K. (2025). Effect of thermal and non-thermal processes on the variability of ocean surface pCO2 and buffering capacity in the north Indian Ocean. Sci Total Environ. 976, 173511. doi: 10.1016/j.pocean.2025.103442
Pirro A., Martellucci R., Gallo A., Kubin E., Mauri E., Juza M., et al. (2024). Subsurface warming derived from Argo floats during the 2022 Mediterranean marine heat wave. of the Copernicus Ocean State Report (OSR8). Eds. von Schuckmann K., Moreira L., Grégoire M., Marcos M., Staneva J., Brasseur P., Garric G., Lionello P., Karstensen J., and Neukermans G. State Planet, 4-osr8, 1–12 (Copernicus Publications, State Planet).
Poulain P.-M., Centurioni L., Özgökmen T., Tarry D., Pascual A., Riuz S., et al. (2021). On the structure and kinematics of an Algerian eddy in the southwestern mediterranean sea. Remote Sens-Basel 13, 3039. doi: 10.3390/rs13153039
Prieur L., D’ortenzio F., Taillandier V., and Testor P. (2020). “Physical oceanography of the ligurian sea,” in The Mediterranean Sea in the era of global change 1, 1st ed. Eds. Migon C., Nival P., and Sciandra A. (Wiley), 49–78. doi: 10.1002/9781119706960.ch3
Reale M., Cossarini G., Lazzari P., Lovato T., Bolzon G., Masina, et al. (2022). Acidification, deoxygenation, nutrient and biomasses decline in a warming Mediterranean Sea. Biogeosci 19, 4035–4065. doi: 10.5194/bg-19-4035-2022
Rodgers K. B., Bultan S., Gruber N., Sarmiento J. L., Chau T. T. T., Fassbender A. J., et al. (2023). Seasonal variability of the surface ocean carbon cycle: A synthesis. Global Biogeochem. Cycles 37, e2023GB007798. doi: 10.1029/2023GB007798
Rodríguez J., Blanco J. M., Jiménez-Gómez F., Echevarría F., Gil J., Rodríguez V., et al. (1998). Patterns in the size structure of the phytoplankton community in the deep fluorescence maximum of the Alboran Sea (southwestern Mediterranean). Deep-Sea Res. 45, 1577–1593. doi: 10.1016/S0967-0637(98)00030-2
Roobaert A., Resplandy L., Laruelle G. G., Liao E., and Regnier P. (2024). Unraveling the physical and biological controls of the global coastal CO2 sink. Global Biogeochem. Cycles 38, e2023GB007799. doi: 10.1029/2023GB007799
Sánchez-Garrido J. C. and Nadal I. (2022). The Alboran Sea circulation and its biological response: A review. Front. Mar. Sci. 9. doi: 10.3389/fmars.2022.933390
Schneider A., Tanhua T., Körtzinger A., and Wallace D. W. (2010). High anthropogenic carbon content in the eastern Mediterranean. J. @ Geophys. Res. Oceans 115, C12. doi: 10.1029/2010JC006171
Schroeder K., Ribotti A., Borghini M., Sorgente R., Perilli A., and Gasparini G. P. (2008). An extensive western Mediterranean deep water renewal between 2004 and 2006. Geophys. Res. Lett. 35, 2008GL035146. doi: 10.1029/2008GL035146
Siddiqui C., Rixen T., Lahajnar N., van der Plas A. K., Louw D. C., Lamont T., et al. (2023). Regional and global impact of CO2 uptake in the Benguela Upwelling System through preformed nutrients. Nat. Commun. 14, 2582. doi: 10.1038/s41467-023-38208-y
Skjelvan I., Coppola L., Cardin V., Juza M., Bozzano R., Pensieri S., et al. (2021). The ATL2MED mission - experiences and lessons learnt (ICOS-OTC). doi: 10.18160/9HK5-807K
Song R., DeVries T., Li R., Sutton A., Send U., and Frazão H. C. (2025). High-frequency correlations between winds and pCO2 change the california current CO2 sink estimate. Geophys. Res. Lett. 52, e2025GL115470. doi: 10.1029/2025GL115470
Steinhoff T., Gkritzalis T., Lauvset S. K., Jones S., Schuster U., Olsen A., et al. (2019). Constraining the oceanic uptake and fluxes of greenhouse gases by building an ocean network of certified stations: the ocean component of the integrated carbon observation system, ICOS-oceans. Front. Mar. Sci. 6. doi: 10.3389/fmars.2019.00544
Sutton A. J., Sabine C. L., Maenner-Jones S., Lawrence-Slavas N., Meinig C., Feely R. A., et al. (2014). A high-frequency atmospheric and seawater data set from 14 open-ocean sites using a moored autonomous system. Earth Syst. Sci. Data 6, 353–366. doi: 10.5194/essd-6-353-2014
Sweeney C., Gloor E., Jacobson A. R., Key R. M., McKinley G., Sarmiento J. L., et al. (2007). Constraining global air-sea gas exchange for CO2 with recent bomb 14C measurements. Glob. Biogeochem. Cycl. 21, 2006GB002784. doi: 10.1029/2006GB002784
Takahashi T., Sutherland S. C., Sweeney C., Poisson A., Metzl N., Tilbrook B., et al. (2002). Global sea–air CO2 flux based on climatological surface ocean pCO2, and seasonal biological and temperature effects. Deep Sea Res. Part II: Topical Stud. Oceanography 49, 1601–1622. doi: 10.1016/S0967-0645(02)00003-6
Tanhua T., Lauvset S. K., Lange N., Olsen A., Álvarez M., Diggs S., et al. (2021). A vision for FAIR ocean data products. Commun. Earth Environ. 2, 136. doi: 10.1038/s43247-021-00209-4
Testor P., Bosse A., Houpert L., Margirier F., Mortier L., Legoff H., et al. (2018). Multiscale observations of deep convection in the northwestern mediterranean sea during winter 2012–2013 using multiple platforms. J. Geophys. Res. Oceans 123, 1745–1776. doi: 10.1002/2016JC012671
Tintoré J., Gomis D., Alonso S., and Parrilla G. (1991). Mesoscale dynamics and vertical motion in the Alborán Sea. J. Phys. Oceanogr. 21, 811–823. doi: 10.1175/1520-0485(1991)021<1:MDAVMI>2.0.CO;2
Tintoré J., Pinardi N., Álvarez-Fanjul E., Aguiar E., Álvarez-Berastegui D., Bajo M., et al. (2019). Challenges for sustained observing and forecasting systems in the mediterranean sea. Front. Mar. Sci. 6. doi: 10.3389/fmars.2019.00568
Turk D., Malačič V., DeGrandpre M. D., and McGillis W. R. (2010). Carbon dioxide variability and air-sea fluxes in the northern Adriatic Sea. J. Geophys. Res. Oceans 115, C10 (2010). doi: 10.1029/2009JC006034
Uitz J., Stramski D., Gentilli B., D’Ortenzio F., and Claustre H. (2012). Estimates of phytoplankton class-specific and total primary production in the Mediterranean Sea from satellite ocean colour observations. Glob. Biogeochem. Cycl. 26. doi: 10.1029/2011GB004055
Ulses C., Estournel C., Marsaleix P., Soetaert K., Fourrier M., Coppola L., et al. (2023). Seasonal dynamics and annual budget of dissolved inorganic carbon in the northwestern Mediterranean deep-convection region. Biogeosciences 20, 4683–4710. doi: 10.5194/bg-20-4683-2023
Urbini L., Ingrosso G., Djakovac T., Piacentino S., and Giani M. (2020). Temporal and spatial variability of the CO2 system in a riverine influenced area of the mediterranean sea, the northern adriatic. Front. Mar. Sci. 7. doi: 10.3389/fmars.2020.00679
Videau C., Sournia A., Prieur L., and Fiala M. (1994). Phytoplankton and primary production characteristics at selected sites in the geostrophic Almeria-Oran front system (SW Mediterranean Sea). J. Mar. Syst. 5, 235–250. doi: 10.1016/0924-7963(94)90049-3
Volpe G., Buongiorno Nardelli B., Colella S., Pisano A., and Santoleri R. (2018). “An operational interpolated ocean colour product in the mediterranean sea,” in New frontiers in operational oceanography. Eds. Chassignet E. P., Pascual A., Tintorè J., and Verron J., 227–244. doi: 10.17125/gov2018.ch09
Wanninkhof R. (2014). Relationship between wind speed and gas exchange over the ocean revisited. Limnol. Oceanogr. Methods 12, 351–362. doi: 10.4319/lom.2014.12.351
Weiss R. F. (1974). Carbon dioxide in water and seawater: the solubility of a non-ideal gas. Mar. Chem. 2, 203–215. doi: 10.1016/0304-4203(74)90015-2
Yao K. M., Marcou O., Goyet C., Guglielmi V., Touratier F., and Savy J.-P. (2016). Time variability of the north-western Mediterranean Sea pH over 1995–2011. Mar. Environ. Res. 116, 51–60. doi: 10.1016/j.marenvres.2016.02.016
Keywords: oceanic CO2 system, air-sea CO2 fluxes, autonomous platforms, East Atlantic, Subtropical Atlantic, Mediterranean Sea
Citation: Martellucci R, Dentico C, Coppola L, Skjelvan I, Giani M, Pensieri S, Cantoni C, Cardin V, Fourrier M, Bozzano R, Paulsen M and Mauri E (2025) Air-sea CO2 exchange in the Eastern Atlantic and the Mediterranean Sea based on autonomous surface measurements. Front. Mar. Sci. 12:1633617. doi: 10.3389/fmars.2025.1633617
Received: 22 May 2025; Accepted: 29 September 2025;
Published: 20 November 2025.
Edited by:
Jun Sun, Tianjin University of Science and Technology, ChinaReviewed by:
Humberto Marotta, Fluminense Federal University, BrazilBenjamin Lowin, University of Georgia, United States
Copyright © 2025 Martellucci, Dentico, Coppola, Skjelvan, Giani, Pensieri, Cantoni, Cardin, Fourrier, Bozzano, Paulsen and Mauri. This is an open-access article distributed under the terms of the Creative Commons Attribution License (CC BY). The use, distribution or reproduction in other forums is permitted, provided the original author(s) and the copyright owner(s) are credited and that the original publication in this journal is cited, in accordance with accepted academic practice. No use, distribution or reproduction is permitted which does not comply with these terms.
*Correspondence: Riccardo Martellucci, cm1hcnRlbGx1Y2NpQG9ncy5pdA==
†These authors have contributed equally to this work