Abstract
This paper examines the conditions leading to development and the course of the double storm surge event associated with cyclones Marie and Nadine in January 2022. The study also analyses the resulting changes of the dune coast following both surges. The findings are based on field measurements of morphological changes in beaches and dunes across various sections of the Polish coastline. The extent of coastal dune erosion was assessed with respect to storm surge parameters, including sea level height and wave run-up. Additionally, the relationship between beach height, wave run-up, and dune erosion volume was investigated. The maximum recorded sea level reached + 1.28 m, with wave run-up heights ranging between 3.0 and 3.3 m. Average erosion, measured as the retreat of the dune toe, was 4.3 m, though significantly higher retreat (4 to 8 m) was observed in areas where beach elevation was lower than the wave run-up. The most severe erosion, up to 8 m, occurred in cape-like sections where the coastline changes direction. Key factors influencing dune erosion volume included sea level and wave run-up heights, beach elevation, and the coast’s exposure to wind and wave action.
1 Introduction
Sandy coastlines are important environments under continuous development that are threatened by sea level rise and an increase in storm surges (Short and Hesp, 1982; Vellinga, 1982; van de Graaff, 1994; Morton and Sallenger, 2003; Houser and Ellis, 2013; Castelle et al., 2015). In general extent, form and relief of coastal dunes are related to several broad and small-scale factors, including sediment size and supply, wind and wave climate, vegetation type and dynamics and human influences (Short and Hesp, 1982; Sarre, 1989; Sherman and Bauer, 1993; Carter and Wilson, 1990; Carter et al., 1990; Psuty, 1993; Pye and Neal, 1994; Houser et al., 2008, 2015). The erosion of the beach/dune system is observed during storm surges related to large-scale air pressure systems. As a consequence, there are numerous descriptions of near-instantaneous beach and dune erosion due to storms, especially strong or so-called cluster storms (van de Graaff, 1994; Morton and Sallenger, 2003; Forbes et al., 2004; Stockdon et al., 2007; Roelvink et al., 2009; Esteves et al., 2011; Dissanayake et al., 2015; Houser et al., 2015; Kandrot et al., 2016; Masselink et al., 2016; Castelle et al., 2015; 2017).
Studies show that the vulnerability of coastal dunes and sandy shores depends on the water level during storm surge relative to the coast morphology (Short and Hesp, 1982; Sherman and Bauer, 1993; Morton and Sallenger, 2003, Forbes et al., 2004; Houser et al., 2008; Castelle et al., 2015; Kandrot et al., 2016). Studies from Baltic Sea shores underlying that the rate of coast retreat depends both on the sea surge height and its duration (Tõnisson et al., 2008; Furmańczyk et al., 2011; Kelpšaite and Dailidienė, 2011; Łabuz and Kowalewska-Kalkowska, 2011; Ryabchuk et al., 2011; Łabuz, 2014, 2022; Bobykina and Stont, 2015; Jarmalavicius et al., 2016; Kelpšaite-Rimkiene et al., 2021). However, the response of a beach-dune system to an extreme storm depends on the elevation of the backshore in relation to wave run-up during surge (Sallenger, 2000; Morton and Sallenger, 2003; Stockdon et al., 2006; Di Luccio et al., 2018).
The Baltic Sea is a non-tidal sea, where shores and coasts of its southern, western and eastern parts are mainly affected by constant sea level rise (SLR) and annual sea level fluctuations related to wind and wave action during storm surge (Zeidler et al., 1995; Cyberski and Wróblewski, 1999; Johansson et al., 2001; Sztobryn et al., 2005; Kelpšaite and Dailidienė, 2011; Jaagus and Suursaar, 2013; Surkova et al., 2015; Weisse and Weidemann, 2017; Wolski and Wiśniewski, 2020). The impact of storms on shores and coastal dunes are natural process. As a result of the increasing sea level and the frequency of strong storm surges, dune coasts of the Baltic Sea are subject to erosion and are exposed to flooding (Dailidienė et al., 2006; Eberhards et al., 2006; Didenkulova and Pelinovsky, 2008; Tõnisson et al., 2008, 2012; Koltsova and Belakova, 2009; Furmańczyk et al., 2011; Kelpšaite and Dailidienė, 2011; Bobykina and Stont, 2015; Jarmalavicius et al., 2016; Bobykina et al., 2021).
The storm surges in the southern Baltic Sea are characterized by a rapid and large increase above the present minimum sea level or an increase that exceeds the average by +0.7 m above mean sea level (Majewski et al., 1983; Majewski, 1998; Sztobryn et al., 2005; Wiśniewski and Wolski, 2009).
Storm surges on the southern coast of the Baltic Sea result from high-velocity wind that is caused by cyclones passing over this part of Europe (Trzeciak, 2001; Andersson, 2002; Sztobryn et al., 2005; Wolski et al., 2014; Hünicke et al., 2015; Kowalewska-Kalkowska, 2018). In this region, storm surges are caused by wind that blows from the sea sector NW or NE towards the coast (Zeidler et al., 1995; Trzeciak, 2001). Deeper and longer-lasting cyclones result in the development of longer and larger storm surges that are developed from both directions obliquely to the shore, mostly exposed to the North (Sztobryn et al., 2005). In the autumn and winter season (Oct-Feb), the largest storm surges are observed on the southern coast of the Baltic Sea (Johansson et al., 2001; Trzeciak, 2001; Sztobryn et al., 2005; Wolski et al., 2014; Wolski and Wiśniewski, 2020). Following autumn-winter storm seasons or significant episodic storm events, coastal dunes tend to retreat.
In the autumn and winter season of 2021/22, 37 different storm surges occurred on the southern coast of the Baltic Sea (Łabuz, 2023b). In January 2022, two cyclones named Marie and Nadine were passing through Scandinavia and the Baltic Sea to Belarus, one after another (Figures 1A–D). As a result, two storm surges occurred, leading to significant erosion of dunes on the Polish Sea coast. The highest sea level (HSL) was + 1.28 m AMSL (above mean sea level). Two surges, one after another, is an extremely rare phenomenon, with many smaller and average ones preceding both, is so far the first such season in 21st century.
Figure 1

Synoptic maps of M&N lows shift (based on www.wetterpate.de). (A) Development of Marie low over the north Atlantic, 25.01.2022. (B) After passing the Baltic Sea, Marie low over Estonia, new Nadine over Iceland, 28.01.2022. (C) Low Nadine over Scandinavia, and Marie over Belarus, 29.01.2022. (D) Low Nadine over Belarus, 31.01.2022.
This paper aims to present the characteristics of this double storm surge and its influence on the volume of dune and beach erosion on the Polish Southern Baltic Sea coast (Figure 2). Understanding the response of the beach-dune to changes in sea level and water run-up during storm surge is essential to preparation management or resilience plans for threatened coast in changing climate.
Figure 2
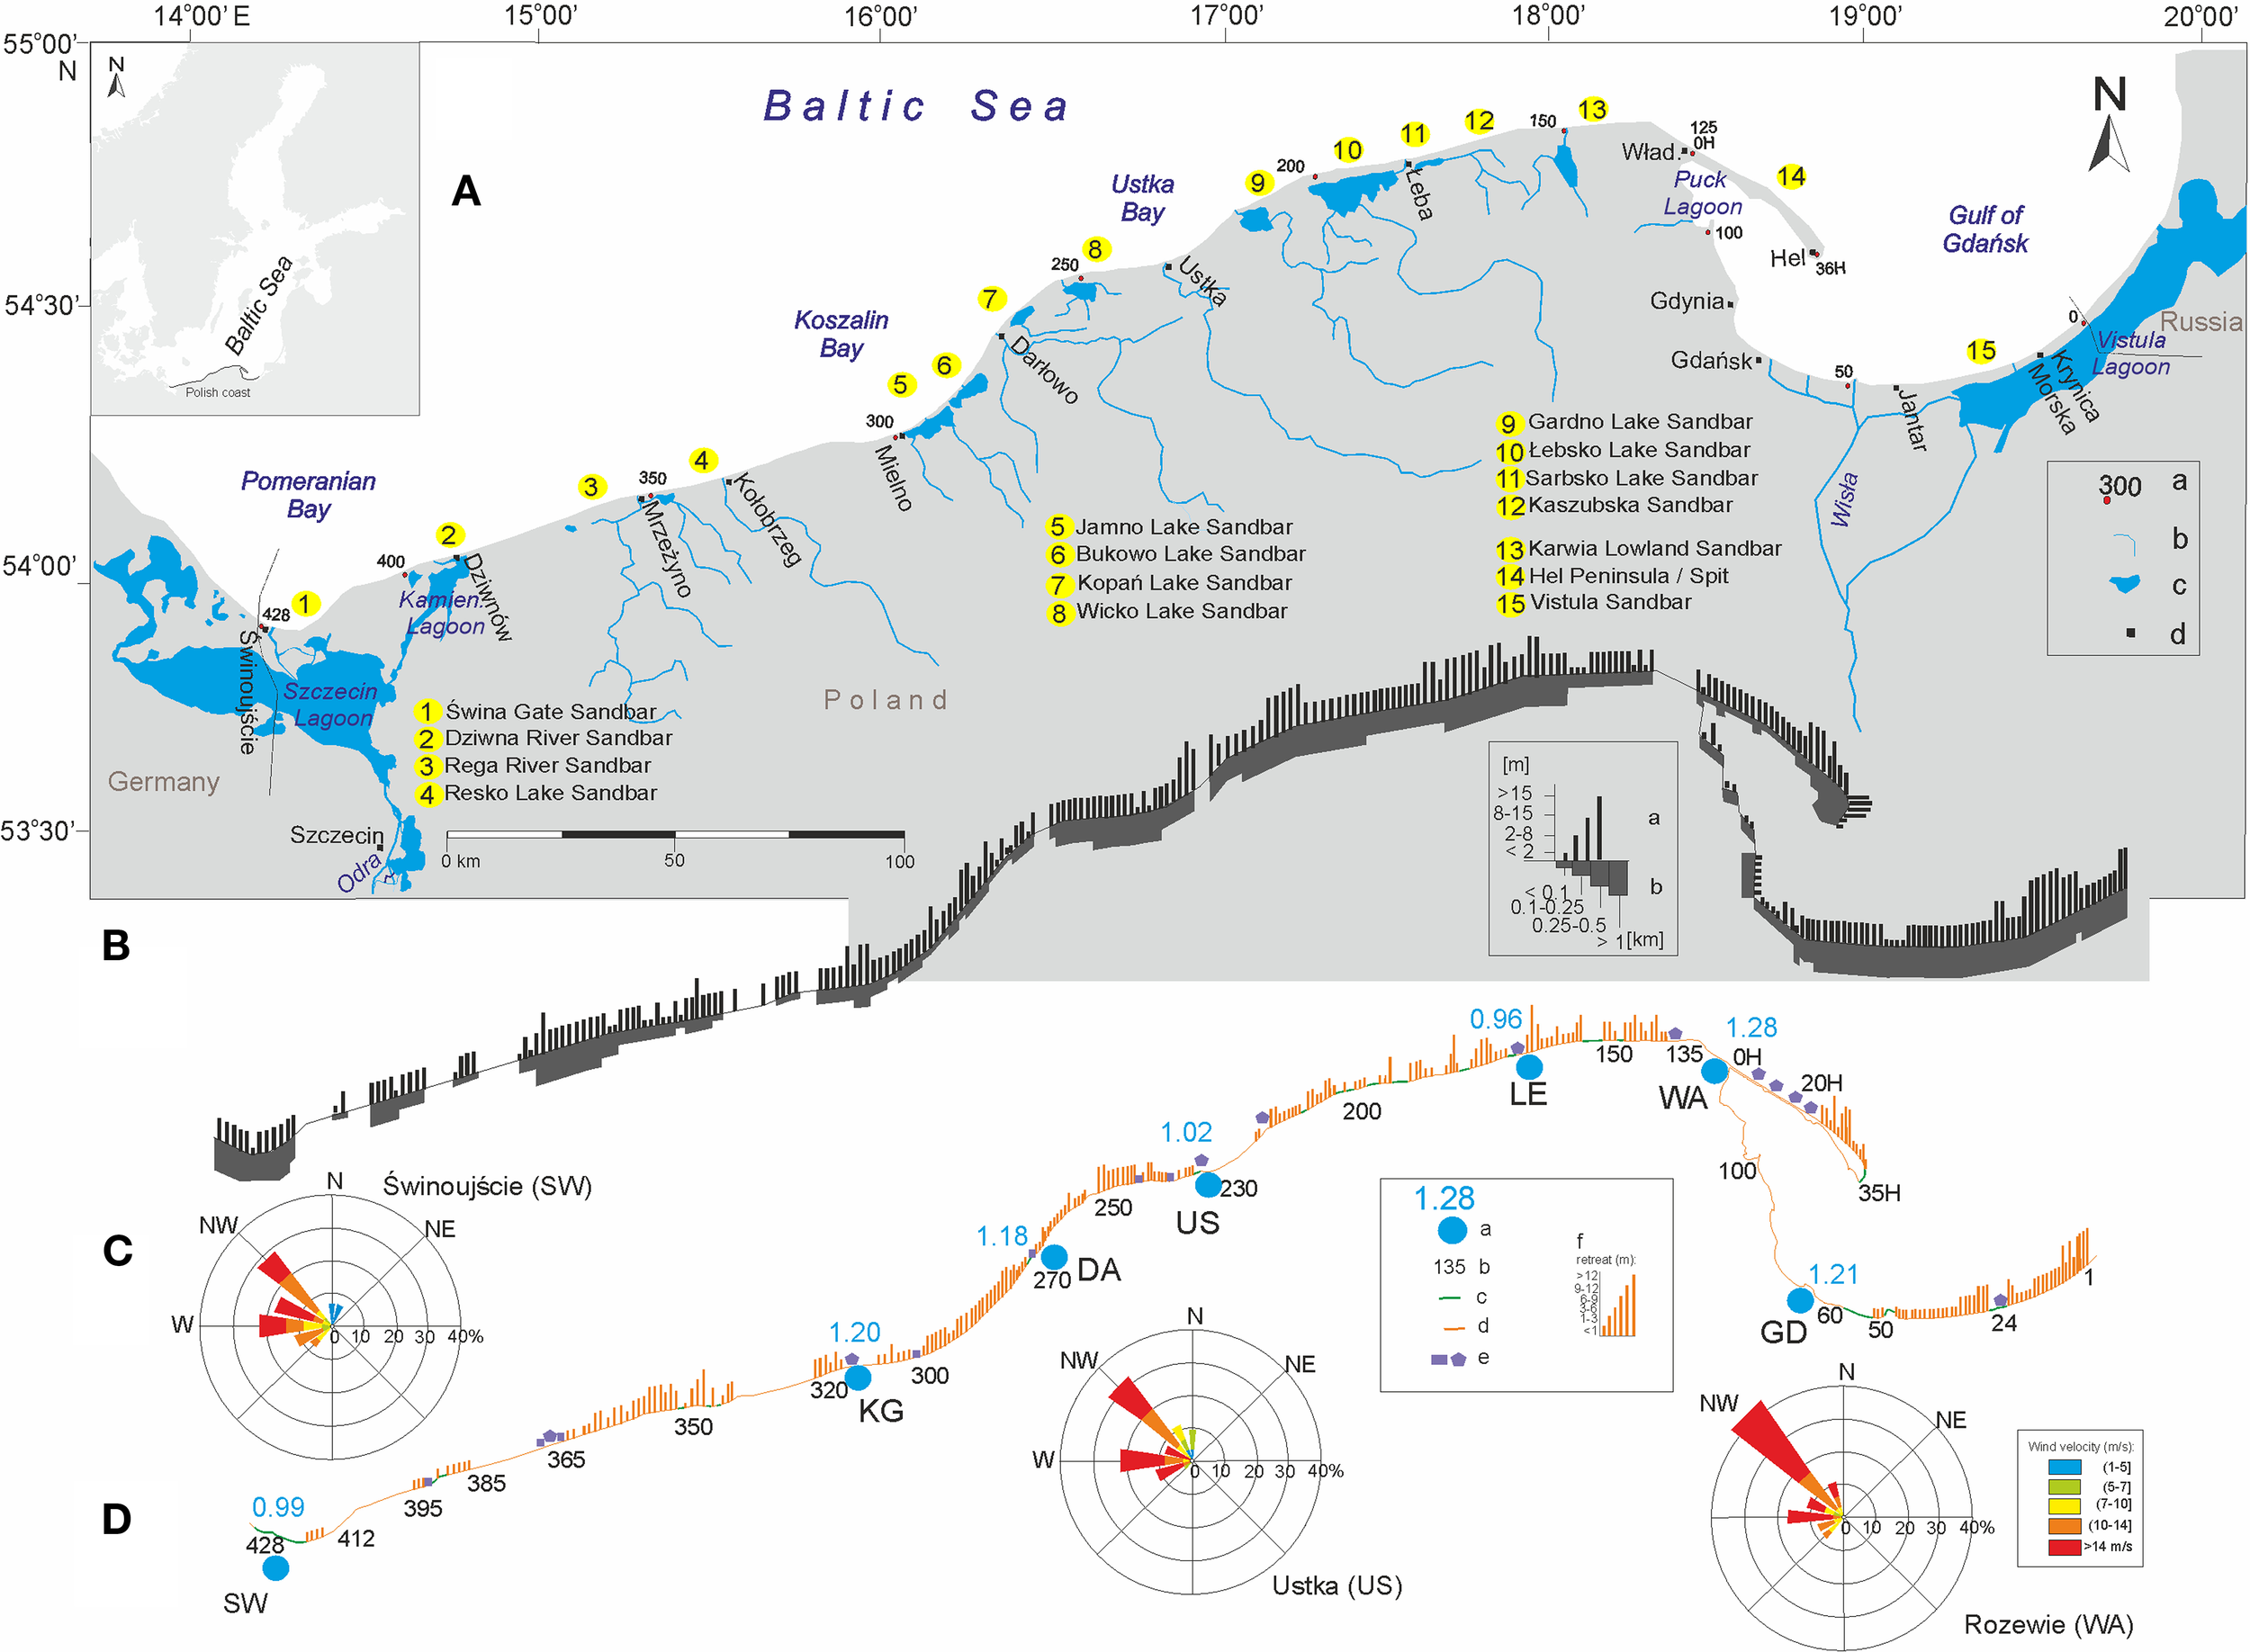
Polish Baltic Sea coast. (A) Sandbars location, a – coast kilometrage 0-428, b – rivers, c – lakes and lagoons, d – main towns. (B) Spatial location of coastal dunes, a – height, b – width. (C) Wind roses during surges M&N, (D) The value of dune coast retreat by M&N storm surges, a – water-gauge stations with max. SL during M&N surge, b – coast main kilometrage, c – sections with no retreat, d – shoreline, e – coast with nourished beach and protected by bands.
2 Research area
The Polish section of the Baltic Sea coast is almost 500 km long, including 440 km of open seacoast and 60 km inside the Puck Bay (Figure 2A). More than 345 km of the 440 km of open-sea coast are sandbars with dune coast, which accounts for approx. 80% of the total coast length (Łabuz, 2013). This type of coast consists of dunes of various shapes and origins.
These dune coasts vary in morphology and origin, encompassing classic foredune ridges, high aeolian dune forms, and low inland deflation areas. In regions where coastal retreat is dominant, the shoreline forms either high scarps (up to 15 m) or low (down to 3 m) eroded slopes with narrow, often elevated beaches. Alternating zones of foredunes and high dunes are characteristic features found along nearly every sandbar stretch of the Polish coast (Figure 2B). Moraine cliff coast-not included in the current research covers 93 km of the total coast length. However, around 10 km of cliffs fronted by low dune ridges were included in the study. Beach sediments typically exhibit a mean grain diameter of 0.35–0.5 mm, while dune sands are finer, ranging from 0.12–0.35 mm (Łabuz and Sydor, 2016).
The dunes on sandbars are in various phases of development, with eroded sections dominant (Figure 2B). Approximately 15% of dune coasts show accumulative tendencies, whereas over 35% are undergoing active erosion, leading to measurable coastline retreat (Łabuz, 2013). These proportions are dynamic and shift with ongoing sediment accumulation and retreat processes.
The primary drivers of erosion are storm surges and the coast’s geological and geomorphological context (Pruszak and Zawadzka, 2005; Zawadzka-Kahlau, 1999; 2012). Human-engineered coastal protections such as breakwaters, bulwarks, and submerged sills have altered natural sediment dynamics, often resulting in beach disappearance and dune erosion (Dubrawski and Zawadzka-Kahlau, 2006). In contrast, artificial beach nourishment has been employed around seaside resorts to mitigate erosion. These nourished zones, where dune retreat is currently minimal, are excluded from analyses on storm impacts due to their modified conditions.
In the 20th century, large annual erosion changes in the southern Baltic Sea coast were found for certain sections in the period 1961-1983 (Pruszak and Zawadzka, 2005; Zawadzka-Kahlau, 1999). These changes followed large storm surges that occurred during that time, i.e. in 1962, 1972, 1975, and 1983 (Majewski et al., 1983; Basiński, 1995; Majewski, 1998). In areas severely affected by these events, the average dune base retreat reached 2–3 m per year, classifying them as erosion bays (Zawadzka-Kahlau, 1999; 2012).
Later, in the 21st century, large dune erosion was observed on the Polish coast after storms with HSL > 1.3 m AMSL in the years 2004, 2006, 2007, 2012, 2017, and 2019. Mean dune erosion during these storms exceeded 4–5 m, while maximum erosion was over 10–15 m (Łabuz, 2009; 2014; Łabuz and Kowalewska-Kalkowska, 2011). In January 2017, after the Axel storm developed from NW to NE direction, the maximum erosion reached even 18–20 and 42 m (Łabuz, 2023a).
The continuous retreat of the shoreline consisting of coastal dunes has been observed in the south Baltic coast in the territory of Poland (Zawadzka-Kahlau, 1999; 2012; Łabuz, 2013). The erosion does not occur throughout the whole coastline and not every year, but it is caused by the largest storm surges with the sea level HSL > 1.4 m AMSL (Łabuz, 2022) or medium surges with HSL > 0.6 m AMSL that occur frequently in one autumn and winter season (Łabuz, 2023b). After large storms, the retreat of the dune base reaches, on average, 3–6 m, up to a maximum of 6–11 m (Basiński, 1995; Łabuz, 2014; 2022). The largest retreat is noted on erosion-prone sections, where the beach is low above sea level (Łabuz, 2023a; 2023c).
3 Research methodology and data
The workflow of research and methods is structured in several steps, starting with the analysis of storm surge indicators, through field measurement techniques, relief change computations, to comparison of selected indicators of studied variables of the investigated environment.
3.1 Storm surge data
This research includes the analysis of hydrological and meteorological data related to the development of the storm surges under discussion. The meteorological data on wind direction and velocity were obtained from the Institute of Meteorology and Water Management (IMGW, https://hydro.imgw.pl/, Institute of Meteorology and Water Management and National Research Institute, 2022). Hydrological data on the sea level and duration of the storm were obtained from the Polish Harbor Offices and publications of the IMGW (https://hydro.imgw.pl/). Presented sea level (SL) is related to the Amsterdam sea level since 2012. The names of storm surges originate from the names of cyclones that are recorded and published on the website of the Institute of Meteorology of the Freie Universität Berlin (Institut für Meteorologie, Freie Universität Berlin, https://www.wetterpate.de). Additional remarks on meteorological conditions during both storm surges were obtained from the Meteorological Service in Germany (wetterzentrale.de). Wind maps (Figure 3) were obtained from a model presented for each hour from the meteorological web page (windy.com). Significant wave heights (Hws) for the open coast located closest to the gauge stations were obtained from WAM wave model for the Baltic Sea. Data was obtained during surges from an online ICM model held by the University of Warsaw (Numerical Weather Forecast ICM, https://old.meteo.pl/).
Figure 3
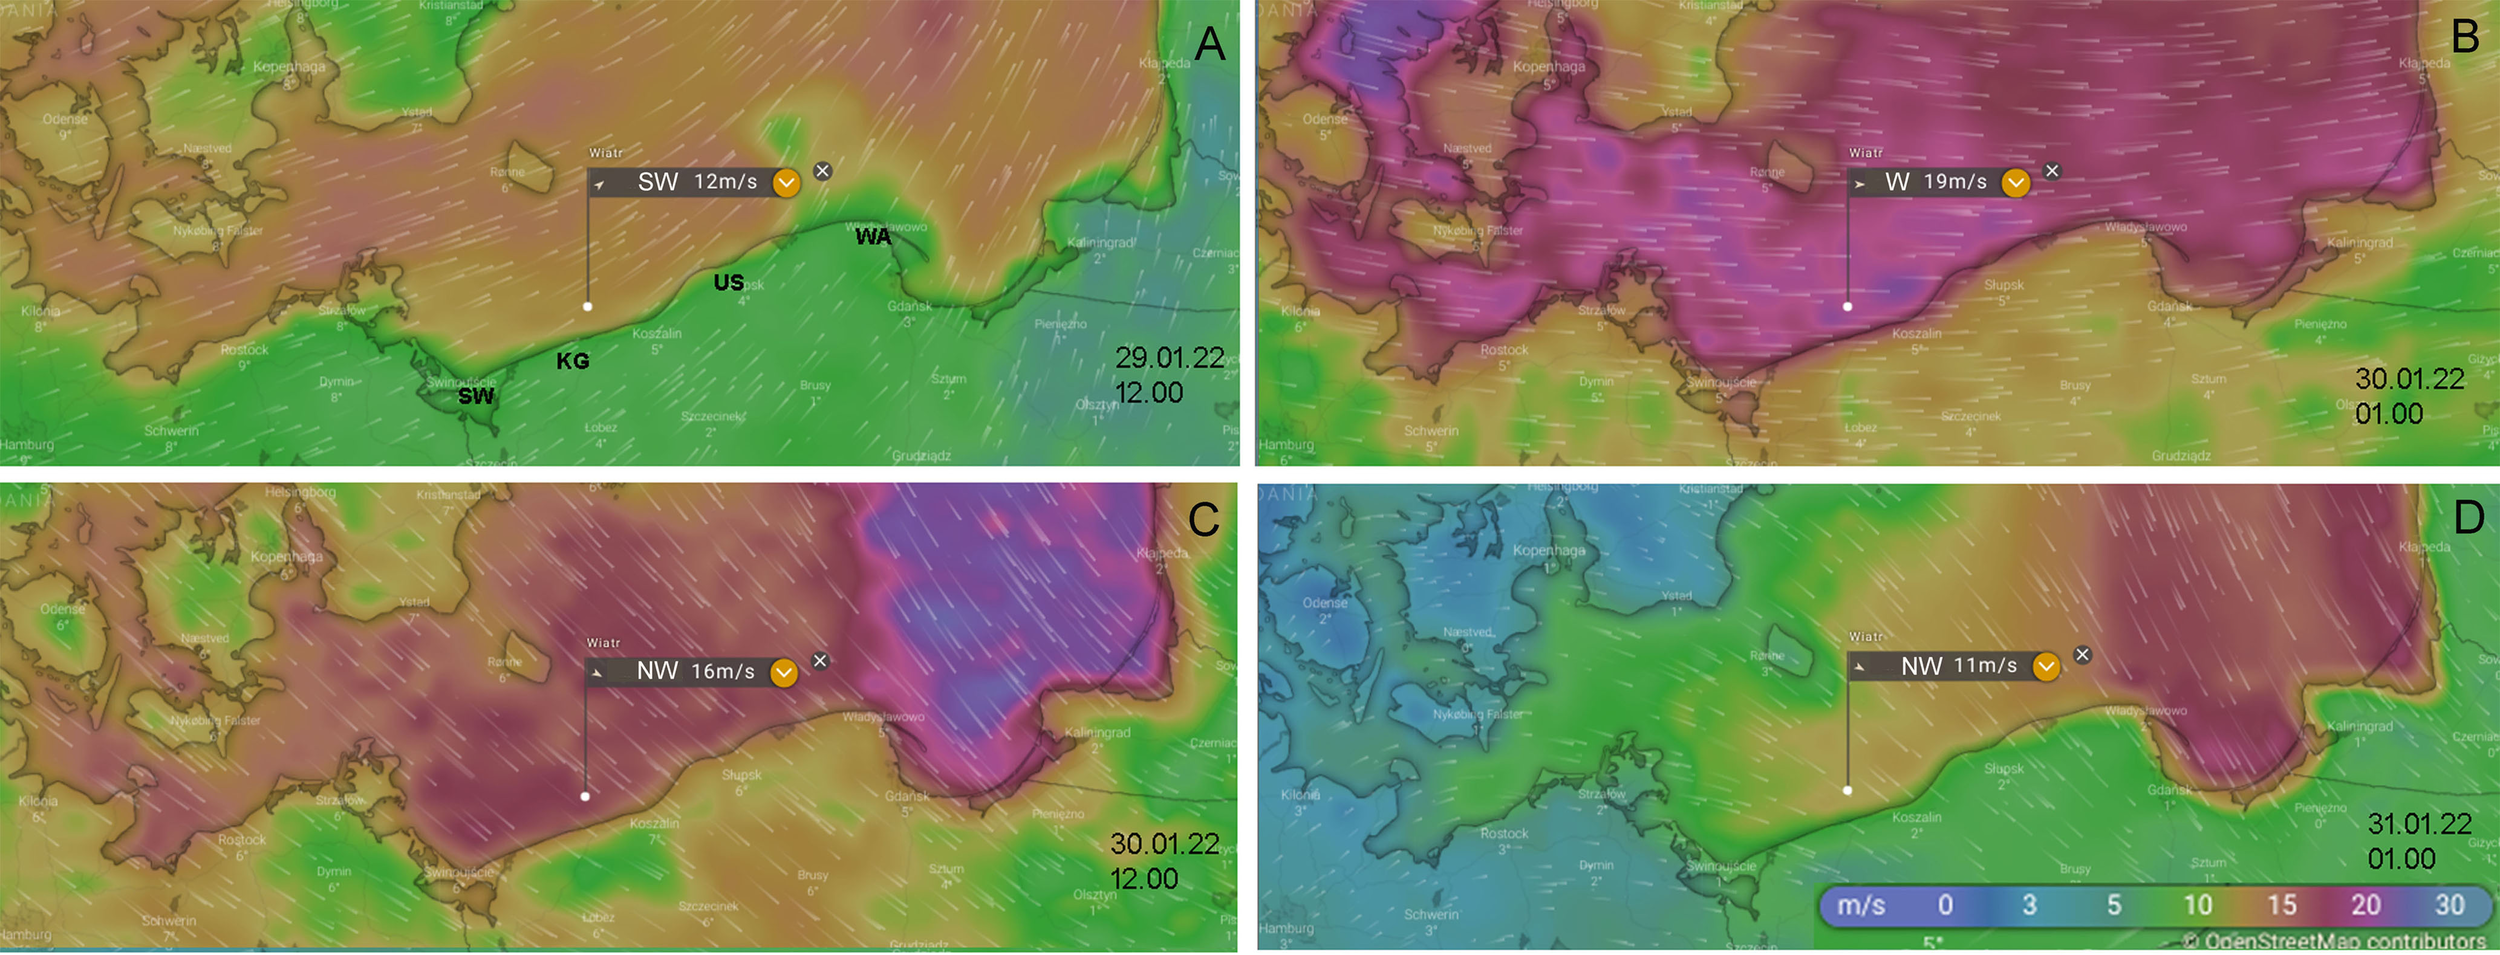
Wind changes over the South Baltic during the passage of Nadine low. (A) The start of the surge with SW wind caused the sea level to decrease when the low system over Scandinavia, 29.01. (B) Wind speed increased, changed to W and forced the sea level to rise on the East coast, low over Latvia, 30.01. (C) Wind changed to NW related to high sea level, with low over Latvia, 30.01. D – zone of strong wind shifted toward the East with a low over Belarus, 31.01 abbreviations SW to GD - marked main gauge stations location, see Figure 2D (source: windy.com).
These materials were the basis for the determination of the velocity and direction of the wind during storm surges (Figure 2C) and the course of the changes in sea level, including the characteristic values (resultant or maximum). The analyses presented below take into consideration the changes in sea level on the western coast from the data from the sea level meter in Świnoujście (SW code, used on figs) and on the eastern coast from Władysławowo (WA code). The analyzed sea level data for the central part of the coast were collected from the data from Kołobrzeg (KG code) and Ustka (US code). The analyses also considered the changes in sea level during all significant storm surges that were recorded in the harbors on the Polish coast in the Autumn-Winter period 2021/22 (Table 1). Those were studied to exclude additional dune retreat before Marie&Nadine surges (M&N). The data in this material only explains the coast retreat after significant SL during both surges.
Table 1
| Harbour, gauge station (location Figure 2 ) | SW | KG | DA | US | LE | WA | GD | ||||
|---|---|---|---|---|---|---|---|---|---|---|---|
| Geographical location of harbours | 53055N 14016E | 54011N 15033E | 54026N 16022E | 54045N 16051E | 54046N 17033E | 54047N 18025E |
54021N 18039E |
||||
| Alarm of sea level in the harbour (m AMSL) | 0.8 | 1.1 | 1.1 | 1.0 | 1.1 | 0.7 | 0.7 | ||||
| No | Date | Name of low | Wind speed (m/s) | Wind, wave direction | Max sea level (m AMSL) | ||||||
| 1 | 20-23.10.21 | Hendrik | 11-15 | WSW-NW | 0.57 | 0.70 | 0.73 | 0.63 | 0.53 | 0.70 | 0.61 |
| 2 | 04-08.11.21 | Rudolf I & II | 10-13 | WSW-WNW | 0.93 | 0.70 | 0.73 | 0.63 | 0.52 | 0.64 | 0.60 |
| 3 | 17-19.01.22 | Gerhild | 10-17 | WSW-NW | 0.85 | 0.95 | 1.04 | 0.84 | 0.71 | 0.74 | 0.92 |
| 4 | 19-22.01.22 | Ida I & II | 9-15 | WSW-NNE | 1.00 | 1.06 | 1.09 | 1.01 | 0.88 | 1.07 | 1.07 |
| 5 | 27-29.01.22 | Marie | 10-15 | WSW-NW | 0.78 | 0.84 | 0.89 | 0.78 | 0.70 | 0.89 | 0.79 |
| 6 | 29-31.01.22 | Nadine | 14-20 | WSW-NNW | 0.99 | 1.20 | 1.18 | 1.02 | 0.96 | 1.28 | 1.21 |
| 7 | 20-22.02.22 | Antonia | 12-16 | WSW-NW | 0.84 | 0.96 | 0.95 | 0.92 | 0.82 | 0.93 | 0.89 |
Characteristics of the highest storm surges in the period 2021/22.
Source: own data sheet based on IMGW-PIB: https://www.imgw.pl/, IM-FUB: http://www.met.fu-berlin.de/wetterpate (Institute of Meteorology of the Free University of Berlin, 2022), Polish Maritime Office
Bold, studied surges.
3.2 Field measurement techniques
The volume of dune erosion was analyzed based on field measurements. All measures were done between former small surges and ongoing M&N surges. The measurement date was between January 22 and 28, just after surges named Gerhild and Ida (Table 1). The measurements were repeated in February and then in June 2022. This method allows for obtaining changes of the coast directly after each selected surge, including the main one studied in this paper. The materials included topographic measurements of coastal dunes and beaches conducted in the field and on sandbar shores with dune sections of the coastline. The work was conducted based on a predefined and systematically completed network of measurement points located at distances of 1–2 km along the sandbars (Figure 2D). Topographic measurements were taken along the transverse profiles from benchmark points to the waterline with elevation accuracy to 1 cm. Measurements on profiles were taken with the use of a leveller or the GPS RTK device Topcon HiPer SR (Figures 4C, D). Moreover, in some areas, mapping was conducted between the measurement points, along with recording changes in beach width and locating erosion formations, including washover fans and debris accumulations as a result of water flowing onto the shore or coast, so-called run-up. The height of run-up on the shore or coast was determined based on debris and wreck material and compared to the sea level elevation at the nearest measurement station. In total 304 cross-shore profiles from 320 km of dune coast were used in further analyses. The maximum value of water run-up on the coast, shore or waterfront is defined as the maximum wave uprush measured from the water level (Stockdon et al., 2006; Melby et al., 2012).
Figure 4
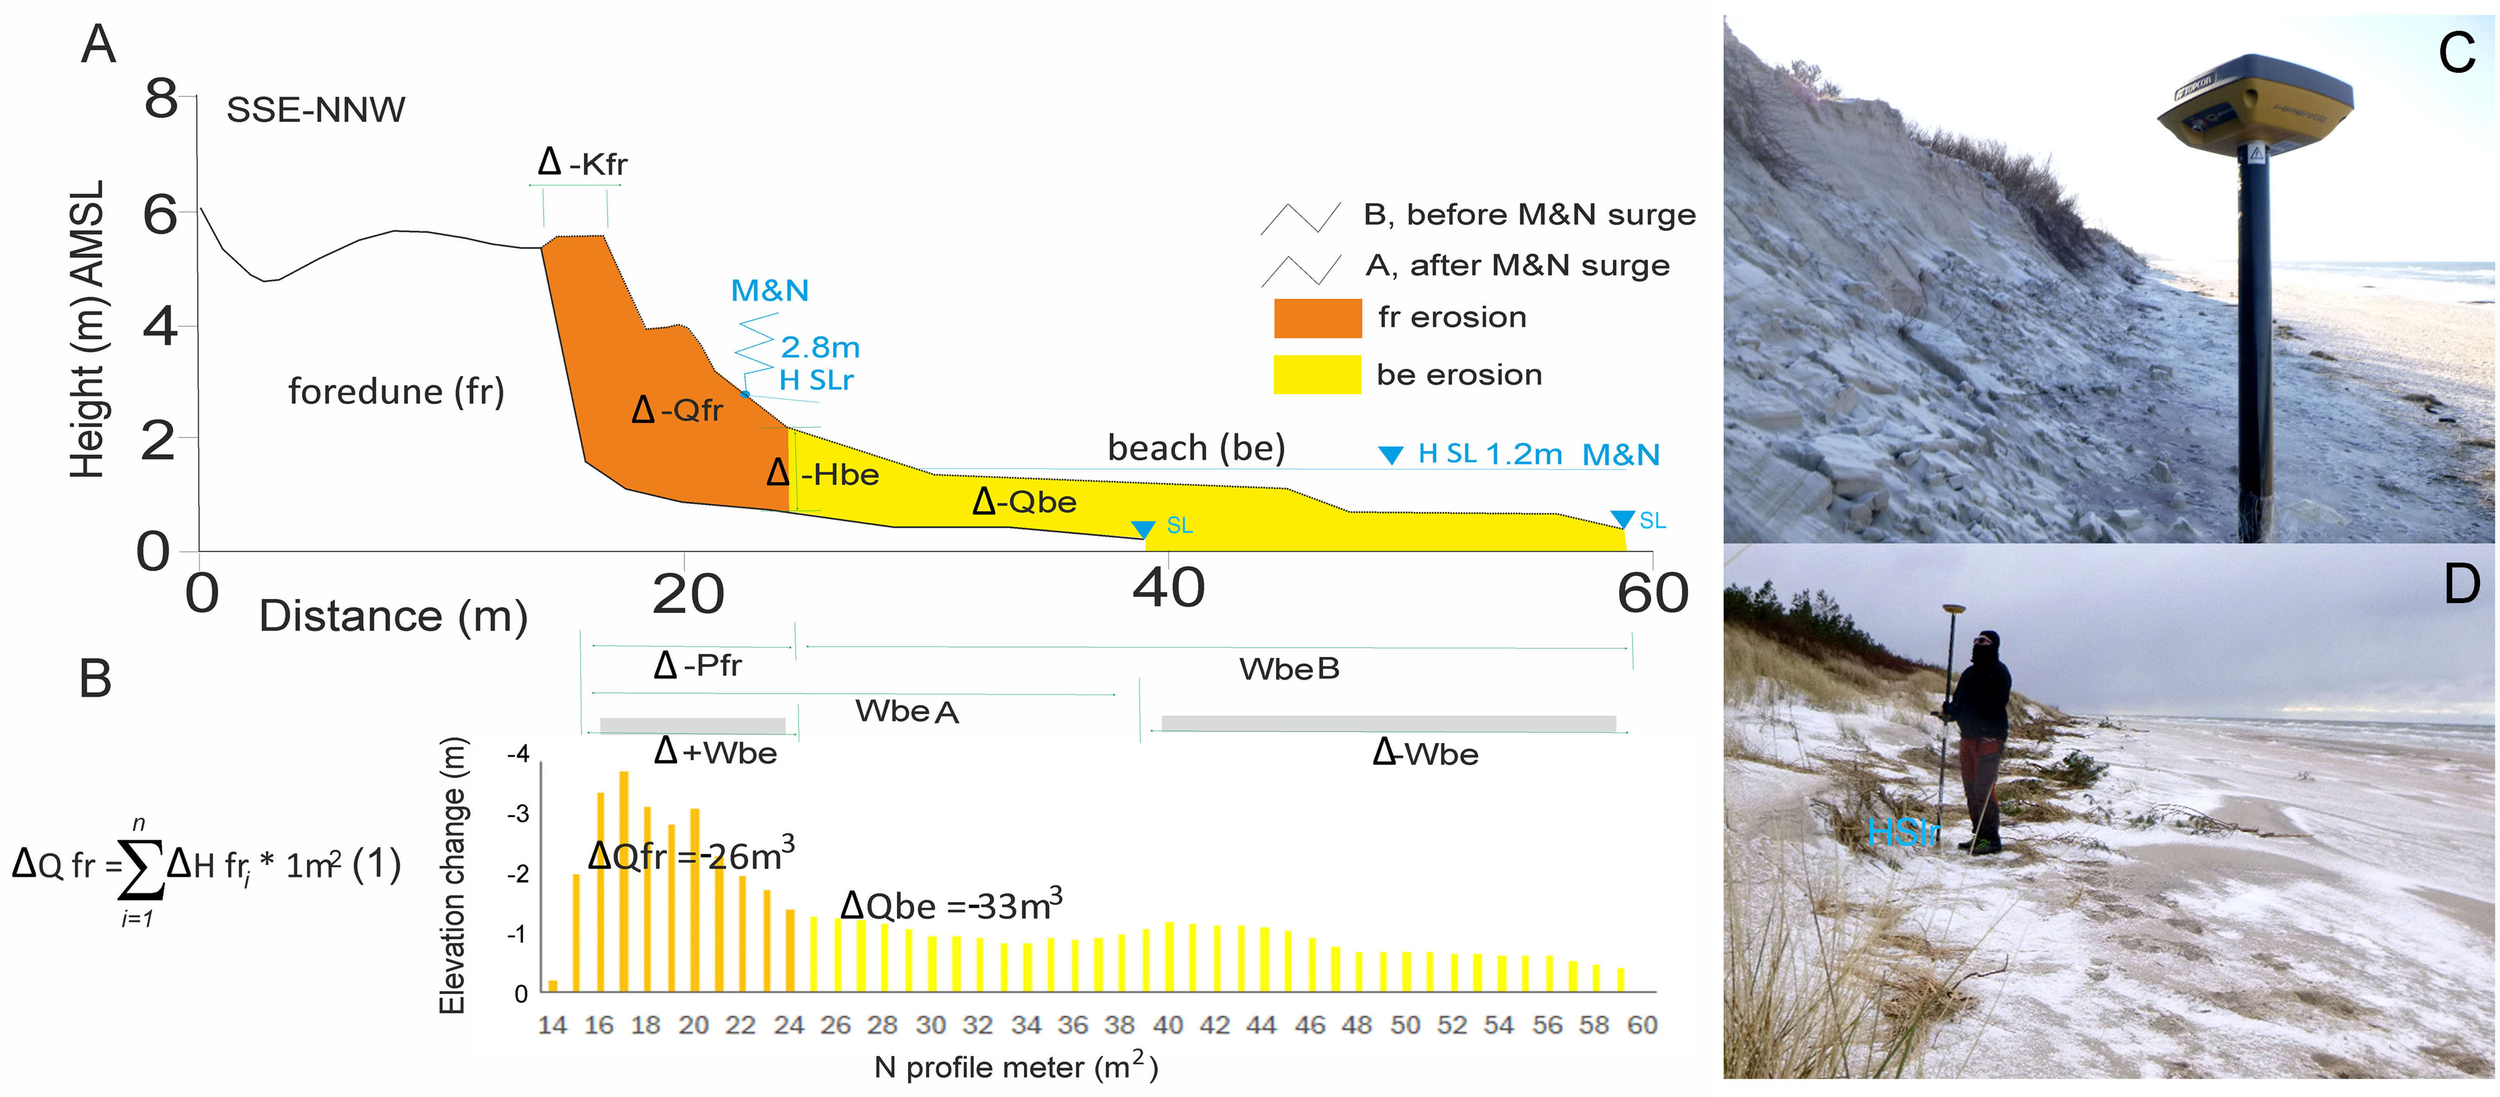
Parameters of relief forms measured along the profile and indicators of their dynamics. (A) Cross-section profile with analysed variables, ΔHbe – beach height change, Wbe – beach width, ΔWbe – beach width change, ΔQbe – beach sand volume change, ΔPfr – foredune foot change, ΔKfr – foredune top/edge change, ΔQfr – foredune sand volume change, SL – max. sea level, SLr– max. water run-up. (B) Relief height change and volume analysis. (C) The measure of the foot (Pfr) of the fresh scarp in the dune with fresh landslides. (D) The measure of water run-up on the shore (HSLr).
3.3 Data analysis
The storm characteristics data were compared with the results of measurements that were conducted before and after both storms Marie&Nadine in January 2022 in selected areas. For each cross-shore profile, several indicators were analyzed (Figure 4). The main index of the dune erosion is the value of the toe retreat (ΔPfr) (Łabuz, 2016; 2022). Beach height (Hbe) indicates the places that will be subject to erosion due to a specific sea level with run-up. The influence of these variables on the size of the erosion and the retreat of dunes concerning the sea level was analyzed. The parameters of the relief were calculated based on the juxtaposition of the transverse profiles before the storms (before B) and after the storms (after A). Calculations were performed with the use of Grapher Golden Software and Excel Office software, with the additional tool for volume measurement between two profile lines (Grabit)!. The results were then compared to specific values of storm surges in the harbors that were nearest to the analyzed areas. The following parameters of the coastline morphology were analyzed:
-
wind: maximum velocity (Vw), time (t hw) Vw >10 m/s,
-
shore/coast azimuth (Azw),
-
sea height (HSL), duration in hours (t hSL), including HSL >1 m AMSL,
-
surge wave run-up height (HSLr) and significant wave height (Hsw) from the model,
-
beach (be): width (Wbe), height (Hbe), volume (Qbe), changes (ΔXbe),
-
foredune (fr): toe (Pfr), top (Kfr), volume (Qfr), changes (ΔXfr).
The variable (x) associated with morphological forms parameters (fe and be) was a variable that reflected the pre-storm (B-before) and post-storm (A-after) values change (Δ) as value x difference (Equation 1):
Those changes were expressed as a sum of each meter (i) of the form distance (d) by equations as presented for foredune toe retreat P fr (Equation 2) and volume change Q fr (Equation 3):
The analysis and interpretation of relief changes (Δ) took into consideration the following hydrological and meteorological factors: maximum sea level (HSL), run-up of the water on the coast (HSLr), presenting highest range of the sea level (HSL) and significant wave height (Hsw), duration of the surge (t), wind velocity (Vw), and the coast azimuth (Azw). The morphological changes were presented on selected transverse profiles and marked in the form of summary histograms for the sandbars and for the whole analyzed coast. For the specific independent and dependent variables, Pearson’s correlation was tested. Basic statistical analyses of the dependencies of variables were carried out. Statistical significance, dependence and normal distribution were analyzed. Main statistical parameters of dune retreat were conducted, including mean, median, 25 and 75% percentiles and maximum value for separate sandbars or their longer sections.
4 Results
4.1 Characteristics of the Marie and Nadine storm surges
On the 27-31.01.2022, two cyclones: Marie and Nadine passed over the Baltic Sea (Figure 1). During the passage, there was high-velocity wind blowing from the W and NW directions (Figure 2D). This caused an increase in sea undulating and in the sea level up to + 1.2 m above average (Tables 1, 2).
Table 2
| Harbour, gauge station | Świnoujście (SW) | Kołobrzeg (KG) | Darłowo (DA) | Ustka (US) | Łeba (LE) | Władysła-wowo (WA) | Gdańsk (GD) |
|---|---|---|---|---|---|---|---|
| Geographical location of harbours | 53055N 14016E | 54011N 15033E | 54026N 16022E | 54045N 16051E | 54046N 17033E | 54047N 18025E | 54021N 18039E |
| Alarm SL (m AMSL) | 0.8 | 1.1 | 1.1 | 1.0 | 1.1 | 0.7 | 0.7 |
| Max. SL, Marie (m AMSL) | 0.78 | 0.84 | 0.89 | 0.78 | 0.70 | 0.89 | 0.79 |
| Max. SL, Nadine (m AMSL) | 0.99 | 1.20 | 1.18 | 1.02 | 0.96 | 1.28 | 1.21 |
| Average wind speed, V (m/s) | 13.0 | 13.5 | 13.7 | 14.0 | 13.6 | 14.0 | 13.3 |
| Max. wind speed V (m/s) | 22.2 | 23.1 | 23.0 | 23.1 | 22.3 | 22.0 | 21.0 |
| Time of wind along shore, WSW-W, t (%) | 34 | 34 | 34a | 34 | 32 | 26 | 24b |
| Time of onshore wind WNW-NNW, t (%) | 45 | 48 | 50 | 52 | 61 | 66 | 61b |
| Time of wind V > 10 m/s, t (hours) | 41 | 42 | 40 | 36 | 38 | 40 | 36 |
| Significant wave height Hsw (m) | 1.8 | 2.7 | 3.0 | 2.4 | 2.5 | 3.3 | 1.9 |
| Significant wave direction (degree) | 3300 | 3300 | 3100 | 3260 | 3370 | 3400 | 900 |
| Length of SL H > 0.6 m, t (hours) |
36 | 43 | 41 | 42 | 40 | 58 | 48 |
| Length of SL H > 0.8 m, t (hours) |
16 | 25 | 20 | 17 | 15 | 27 | 19 |
| Length of SL H > 1.0 m, t (hours) |
0 | 8 | 4 | 5 | 0 | 12 | 13 |
| Length of SL H > 1.2 m, t (hours) |
0 | 1 | 0 | 0 | 0 | 2 | 1 |
Hydro-meteorological characteristics of the Marie&Nadine surges in January 2022 along the Polish coast (gauge station location on Figure 2).
*- wave height from model ICM, a- in the harbour (DA) this wind direction is also onshore, b- in the harbour (GD), both directions are offshore
Source: own data sheet based on IMGW-PIB: https://www.imgw.pl/, IM-FUB: http://www.met.fu-berlin.de/wetterpate (Institute of Meteorology of the Free University of Berlin, 2022), Polish Maritime Office and ICM model: https://old.meteo.pl/
The cyclone named Marie formed on the 25th of January 2022 above the Northern Atlantic (Figure 1A). On the 26th of January, the cyclone passed over central Scandinavia. This resulted in the development of strong wind on the western coast of the Baltic Sea. The wind was blowing from the south-western direction to the center of the cyclone. In the initial phase of the storm, on the 27th of January, the dominant winds on the Polish sea coast blew from the SSW-W direction with a velocity of 11–13 m/s. The wind blew from the coast to the north-east, causing a short-term decrease in the sea level (Figure 3A). The direction and velocity of wind during both storm surges on the Polish coast of the southern Baltic Sea are presented in Figure 2D.
The decrease of sea level in the western part of the coast (Świnoujście, Kołobrzeg, see Figure 2A) was higher than in the eastern part (Władysławowo). This resulted from the fact that the water level in the eastern part of the Baltic Sea remained high after the previous storms (Table 1). At the same time, the cyclone Marie was moving from Estonia to Belarus (Figure 1B). As a result, the wind direction changed to W and WNW during the night of the 28th of January (Figure 3B). On the Polish coast, the impact of that wind led to undulation and another surge of the water. An increase in the sea level by 0.6 to 0.8 m above average was noted in harbors (Table 2). The highest sea level was noted in the central part of the coast, in Koszalin Bay, where the coast was exposed to the strongest wind from the WNW direction. There, the sea level reached 0.89 m AMSL (Table 2). As the cyclone was moving into the continent (Figure 1C), wind velocity over the Baltic Sea decreased, and its direction changed to South. The strong wind from the sea lasted for a short time; therefore, the sea level also decreased rapidly.
The decreasing wind velocity towards the end of the Marie cyclone was accompanied by an almost immediate increase in wind velocity from the SW direction to 14 m/s. This signaled the start of another storm, caused by the Nadine cyclone (Figures 1B–D). On the 28th of January, Nadine was over Iceland, while on the next day, the 29th, it had already moved to central Scandinavia. Early on the 29th of January, the wind on the Polish coast was blowing from the SW direction towards the center of the cyclone, which was located over Scandinavia (Figure 3A). The sea level decreased to +0.2-0.4 m below average (Figure 5A). Higher decreases were noted in the western part of the coast, where stronger winds from the land were blowing for a longer time. This was caused by the fact that the velocity of the wind blowing from land was higher, and the levels remained lower after the passing of the Marie cyclone. During several subsequent hours, the sea level increased 1 m above the average (Figure 5A), because of the change in the wind direction from SW to W, and the wind velocity up to 20 m/s (Figures 3B, 5B). As a result of the log-term influence of the wind blowing from the W and NW direction, on the 30th of January, the sea level on the central and eastern part of the coast exceeded + 1.1 m AMSL, while in the western part, the maximum sea level was only up to 1 m above the average (SW - Świnoujście).
Figure 5

Hydro-meteorological conditions of surge M&N in selected harbours of the Polish Baltic coast. (A) Changes in the sea level. (B) Changes of the max. wind velocity and direction (source: raw data IMGW-PIB, Polish Maritime and Harbour Office).
The increase in the sea level was similar throughout the coast, but the maximum increase was lower in the western part because of the larger decrease between the Marie and Nadine storms. A large surge in the sea level, up to 1.2 m above average, occurred between the western and central parts of the coast (KG - Kołobrzeg and DA - Darłowo). In the eastern part, where the sea level remained high after the previous storm (Marie), high-velocity wind caused the sea level to increase even further, to + 1.28 m above average (WA - Władysławowo). On the 31st of January, the Nadine cyclone moved to Latvia and further on to the south-east (Figures 1D, 3D). The wind direction changed from NNW to NNE, and the velocity decreased. As a result, the sea level decreased to approximately + 0.5 m AMSL on the 1st of February. Such analysis is important to understand the relation of the highest SL level versus the start position of the water table, which could be much lower than average, due to air-pressure changes or the impact of previous weather action (wind).
4.2 Dune erosion caused by the Marie & Nadine storms
The Marie&Nadine cyclone system, which occurred in January 2022, produced a sequence of two combined storm surges. The effects of dune erosion discussed in this study refer to the cumulative impact of both events. The resulting erosion was extensive and observed along the entire investigated stretch of the southern Baltic coastline (Figure 2D).
In the western part of the coast, the sea level rise did not exceed 1.0 m AMSL, qualifying as a medium-intensity surge. Consequently, dune erosion was relatively minor on the Świna Gate Sandbar, the Dziwna Sandbar, and the Rega River Sandbar (Figure 2D). In contrast, more substantial erosion occurred on the eastern coast, where sea levels reached up to 1.2 m AMSL, indicating a high-intensity storm surge.
Dune erosion varied significantly across sandbars, with the most severe retreat ranging from 5 to 8 meters, recorded on shoreline capes (Figures 6, 7B). These dynamic coastal segments, where the coastline orientation shifts every 1–2 km (typically NW to N), are particularly vulnerable due to their exposure to prevailing storm wave directions. In areas where beach elevation exceeded the storm wave run-up, no dune erosion was observed (Figures 2D, green line; 7A). Figure 7 presents examples of cross-shore profiles showing morphological changes under varying sea levels (HSL), run-up heights (HSLr), and beach heights (Hbe). The value of dune retreat was directly correlated with these parameters and is summarized as average values for each of the studied sandbar (Figure 8).
Figure 6
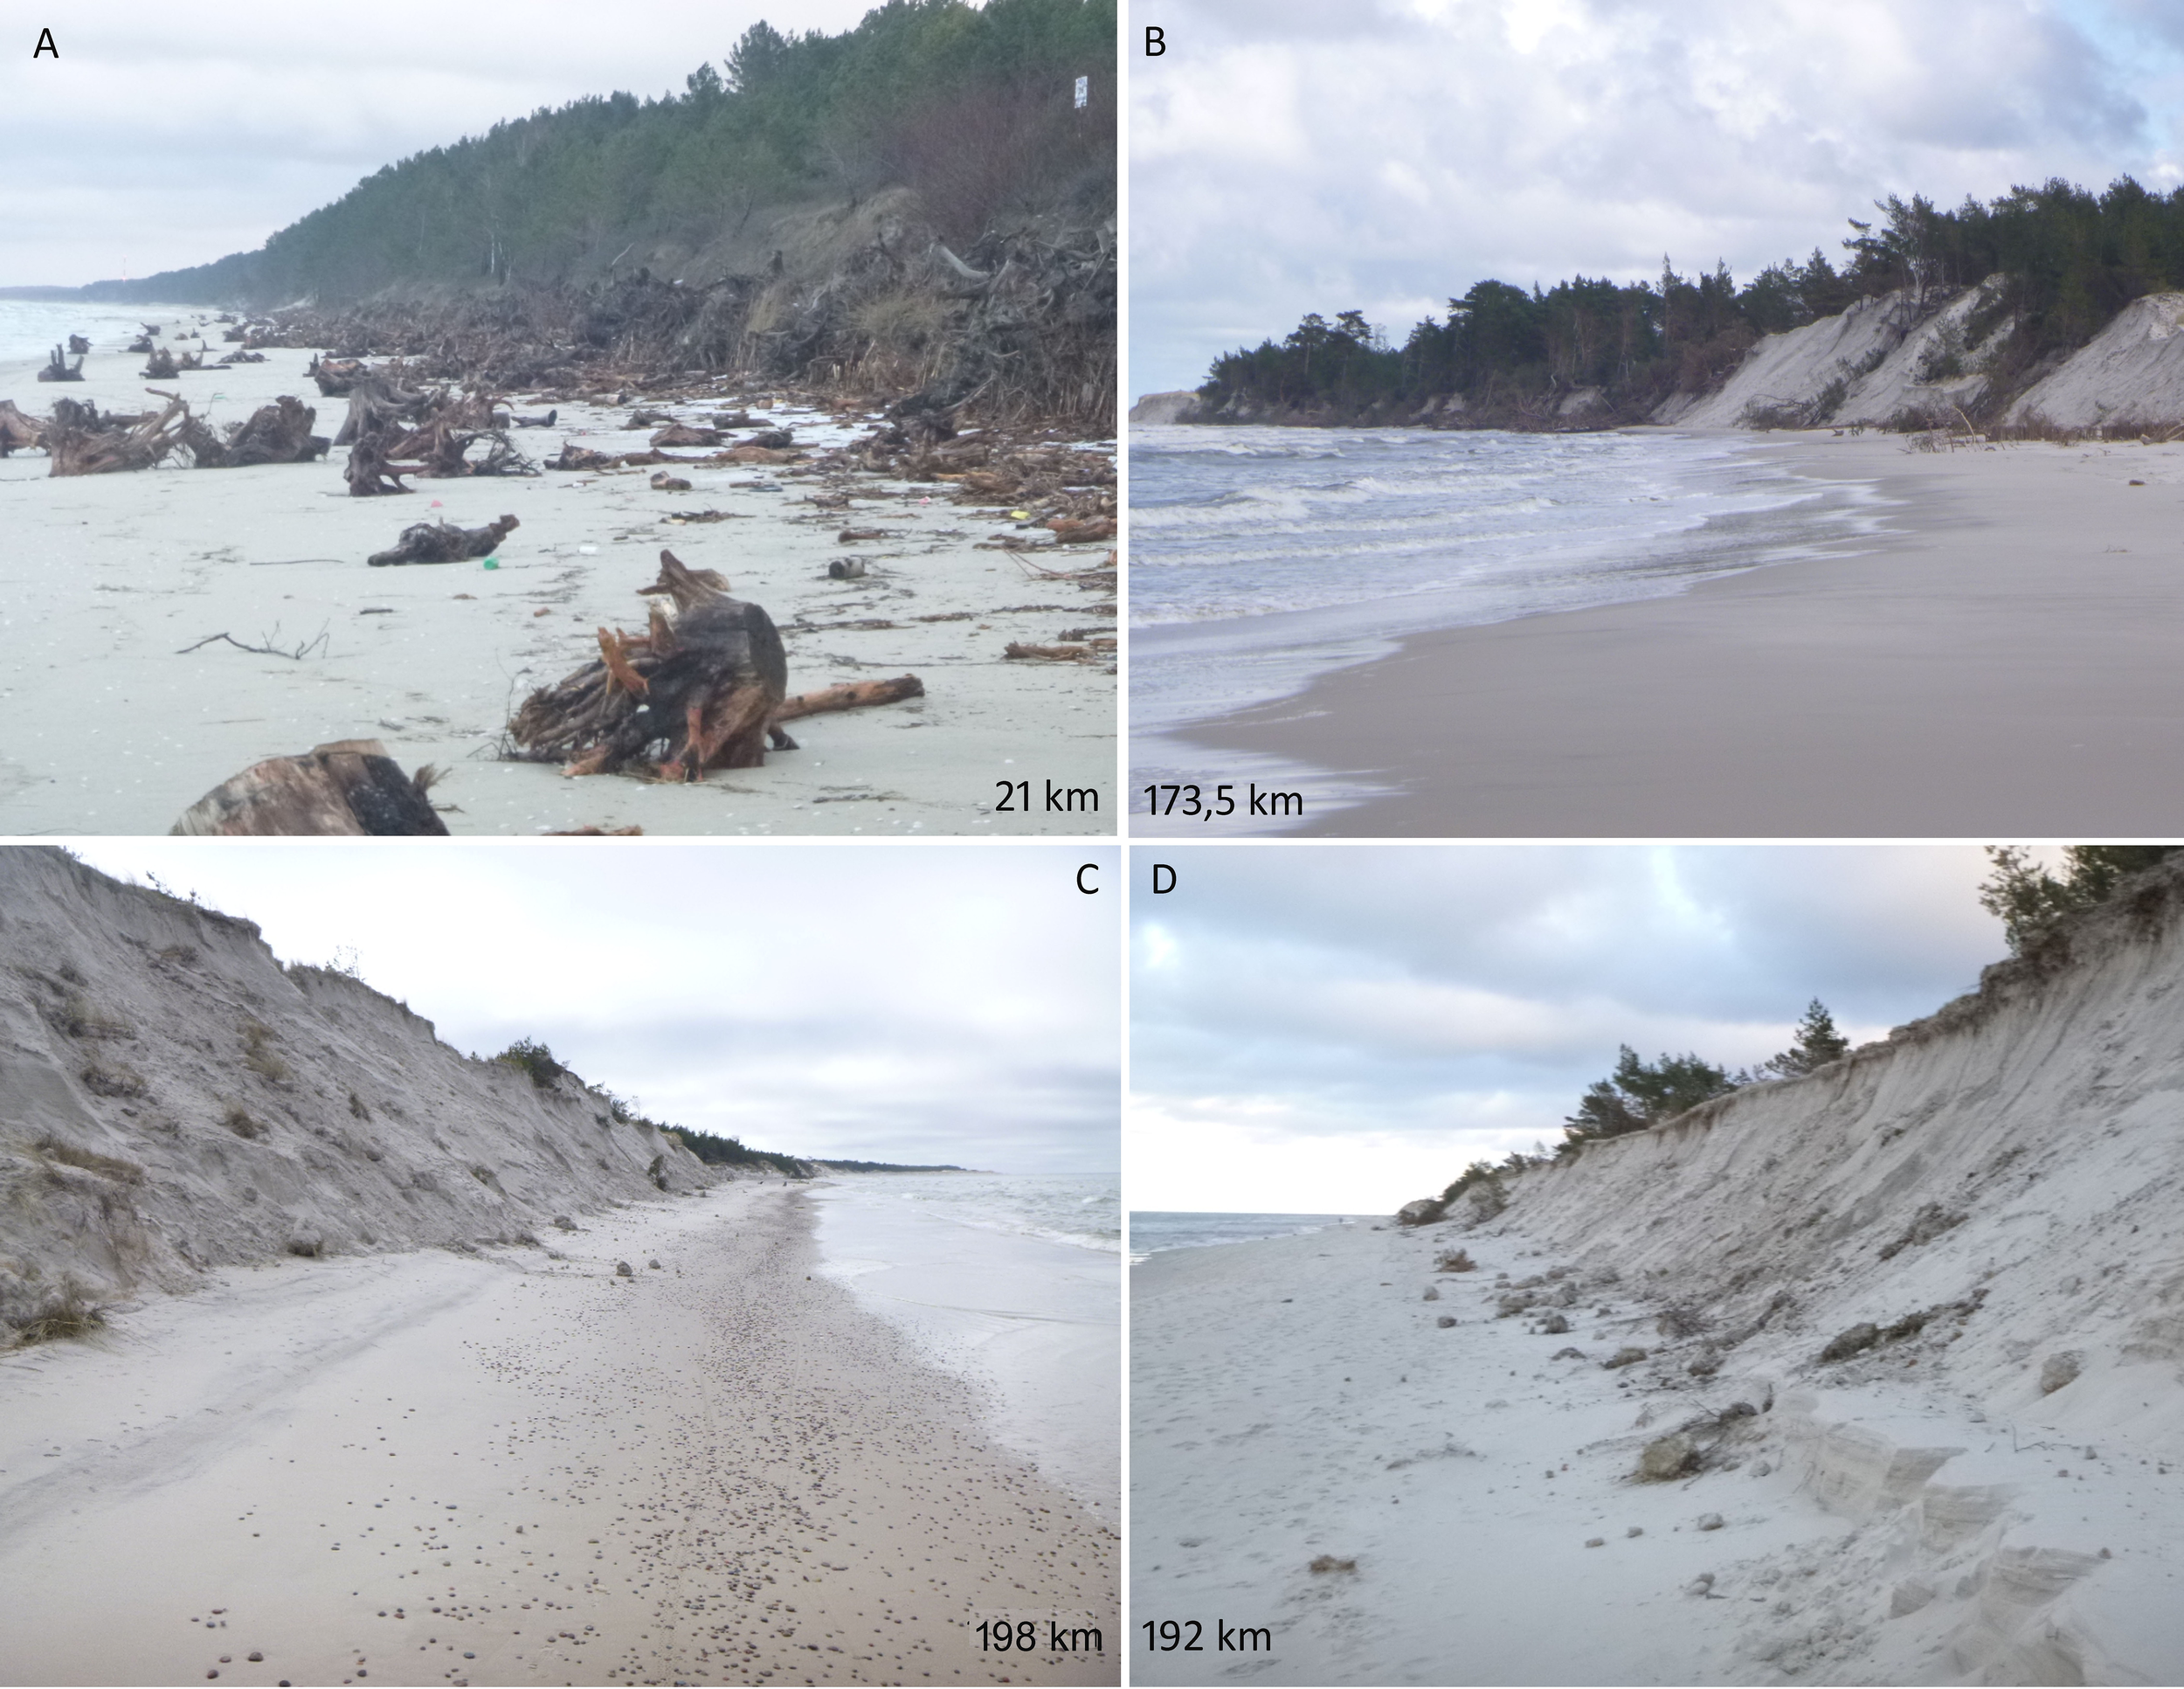
Large dune erosion after storm surges N&N on the promontories with a low beach. (A) Vistula Sandbar, tree trunks from the provisional protective band are scattered on the beach. (B) Sarbsko Sandbar. (C) Łebsko Sandbar. (D) Łebsko Sandbar.
Figure 7
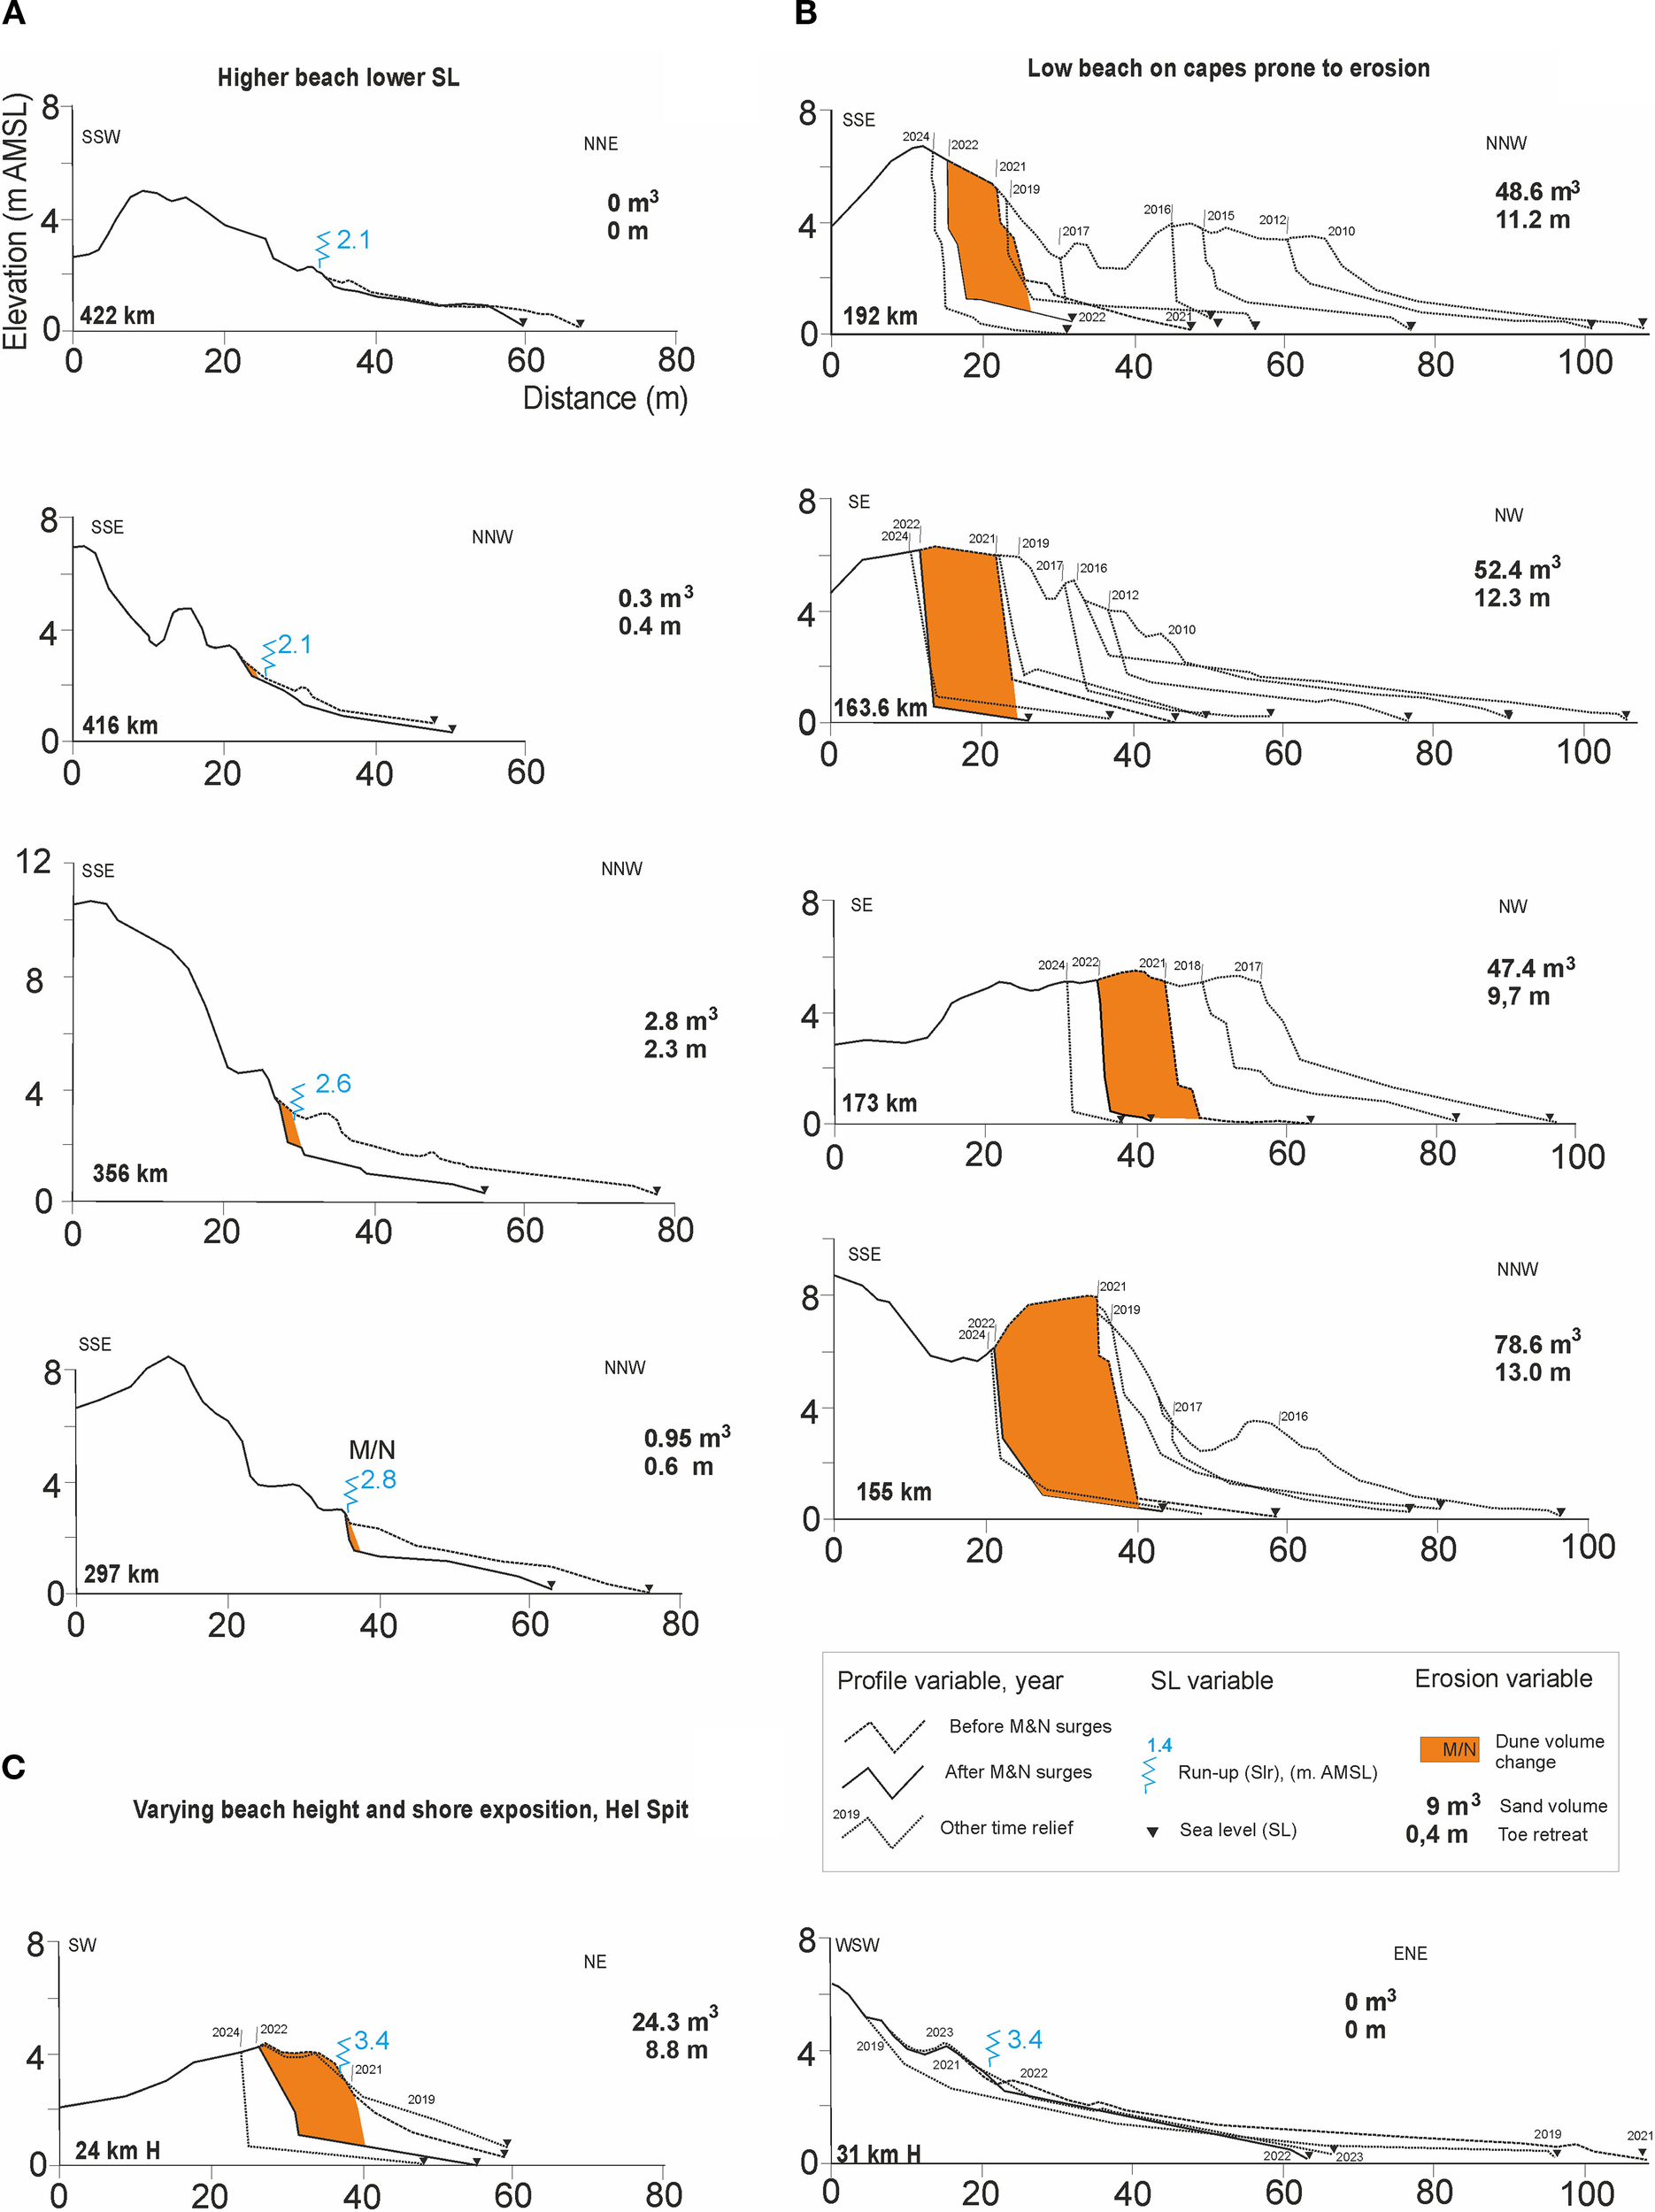
Examples of the dune erosion quantity on the coast varied in SL, SLr and orientation to M&N surge. (A) West coast with lower SL. (B) Maximum dune erosion on promontories on the east coast with high SL. (C) Differences in dune erosion on Hel Spit in areas of varied coast orientation to storm surge.
Figure 8
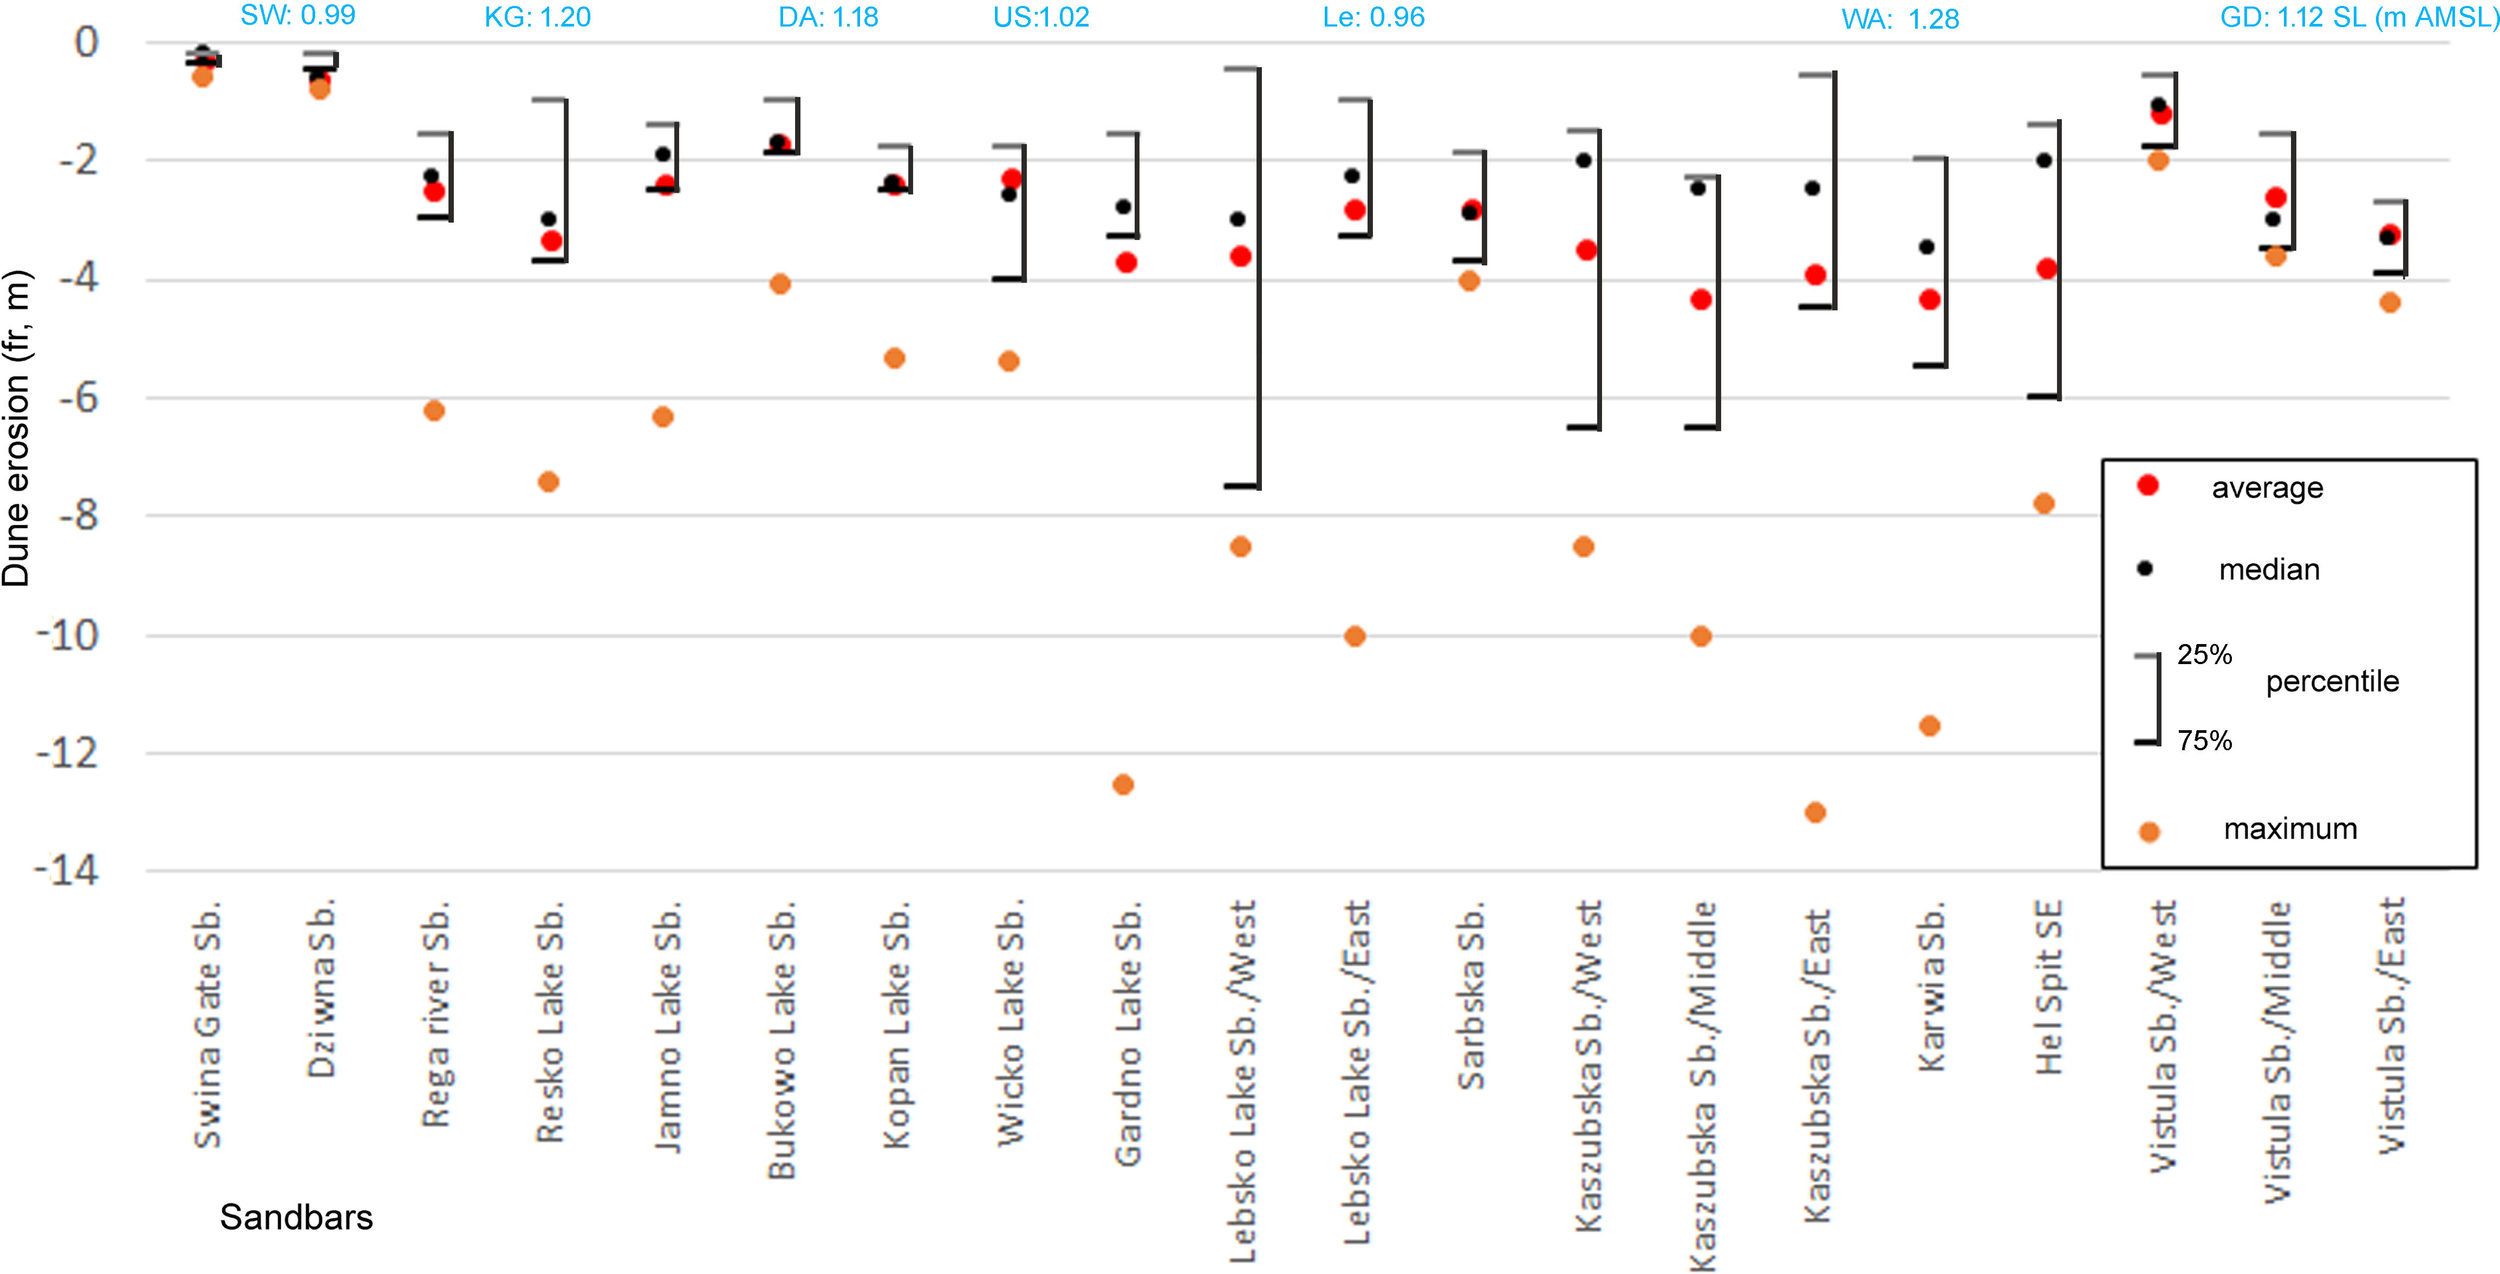
Statistical values of dune retreat on the Polish sandbars after storm surges M&N, (location: Figure 2) compared to max. SL (m AMSL) on the section (abbreviations of towns with gauge, on Figure 2D).
On the Świna Gate Sandbar, dune erosion was confined to its eastern portion (km 412–416), which is exposed to NW wave action, as during the investigated surges. Here, the maximum retreat reached only 0.5–2 meters (Figure 8). More extensive erosion was recorded further east, where sea levels were higher. In Kołobrzeg (KG) and Władysławowo (WA), water levels exceeded 1.2 m AMSL. In Kołobrzeg, dune retreat ranged between 2 and 5 meters. Variations in erosion intensity were influenced by both beach height and the historical development trends of the coastline. Sections already experiencing long-term erosion, typically with beach elevations not exceeding 1.0-1.5 m AMSL underwent more severe retreat, averaging 5–7 m (Figure 7B). Nearly all locations with pre-storm beach elevations below 2 m AMSL experienced significant erosion. Previous storm events in 2021/22 primarily affected sections with similarly low beach profiles.
Even greater erosion occurred on the sandbars of the Koszalin Bay (sandbars no. 5-7), which are exposed to NW wind and wave directions (Figures 2D, 8). In this region, average dune toe retreat reached 3 meters, with maximum values of 5–6 m.
Considerable erosion was also noted along the eastern coast, from Rowy to Karwia (Figure 2D) where SL was the highest +1.28 m. The most pronounced erosion was observed on low-elevation beach sections, especially those previously affected by minor surges. Erosion was particularly severe on the western flanks of small capes, where the coastline projects northward. On the Gardno and Łeba Sandbars (approx. 36 km total length), erosion varied, with more exposed NW-facing sections suffering the greatest impacts (Figures 7, 8). On the Gardno Sandbar, average dune retreat reached 3.8 meters, with maximum values up to 13 meters, largely due to the highest sea levels recorded during the Nadine storm. On the Łeba Sandbar, erosion was more variable, ranging from 0.2 to 10 m, depending primarily on local beach elevation, where the coast with lower beaches suffered more significant retreat.
Along the 47 km section encompassing the Sarbsko, Kashubian, and Karwia sandbars, average dune retreat ranged from 3 to 4.5 m (Figure 8). The most severe erosion occurred on capes where the shoreline orientation shifted northward. These capes, particularly on their western sides, were fully exposed to NW wave activity. In the eastern Sarbsko Sandbar, dune retreat reached up to 5–9 meters on a 1 km section (km 173–174.5). Similar erosion patterns were observed at other capes on the Kashubian and Karwia sandbars (km 163, 168, 155, 150, and 144). On capes, usually on 100–200 m long sections, the beaches are significantly narrowed and lowered to a height of 0.5 m, and the base of the dunes is subject to stronger erosion. The lowering of beaches in these locations was caused by the previous, smaller storm surges. These areas were intensely eroded during the Marie&Nadine surges.
On the Hel Spit, dune erosion was highly variable. It was most severe where the orientation of the coastline changed and minimal in areas where the beach elevation exceeded wave run-up (Figures 7C, 8). Although the Hel Spit is predominantly oriented NE, opposite the NW storm wave direction, strong erosion occurred. During NW storms, resultant currents and wave energy were directed obliquely along the coast, particularly affecting narrow beaches preceding small capes. In these zones, the coastline bends southward, and the narrow, low-lying beaches are exposed to consistent NW erosion. Conversely, the southeastern shores, exposed to E-SE directions, had wider and higher beaches, and thus remained stable (Figure 2D, section no. 14). This created an alternating pattern of eroded and stable zones along the southern part of the Hel Spit. The northern part of the spit, comprising approximately 20 km of artificially nourished beach, was not included in this analysis.
On the Vistula Sandbar, significant dune erosion occurred in the eastern sector, particularly along coastlines exposed to NW directions (east of the new canal and Krynica Morska). The central and western parts, protected by the Hel Peninsula, typically experience lower erosion intensity. Maximum dune retreat on the Vistula Sandbar reached up to 4.0 m. In the eastern part, average retreat was 3.7 m, while in the central section it was up to 2.0 m (Figure 8). The average and maximum erosion were lower on the Vistula Sandbar due to higher beaches before surges.
4.3 Sea level and run-up height vs coast erosion
The previous analyses revealed that each increase in the sea level is linked to a proportionate height of run-up of water on the shore. It is the sum of the sea level and the height of waves that result from wind velocity. The height of run-up is determined by the maximum reach of water on the shore (Nielsen and Hanslow, 1991; Stockdon et al., 2006; Łabuz, 2022). The stronger the storm, the higher the sea level and wave height. Both are causing the observed run-up on the shore. The significant wave height from the ICM model was between 2.6-3.3 m. These values are not strictly related to the water range on the shore but can make the prognosis of storm strength on the coast (Sallenger, 2000). The height of the run-up determines the height of the coast where the dune (or cliff) waterfront will be eroded. Based on that, one may determine the locations where the strongest erosion may occur or has occurred due to high water run-up. The comparison of SL and separately SLr to foredune retreat presented a significant relation (Tab. 3). Dune erosion, expressed as the retreat of the dune toe, was most strongly correlated with the measured wave run-up height. While high sea levels (SL), including those exceeding 1.0 or 1.2 m AMSL, and their duration (t, in hours), contributed to the erosional process, their influence was less significant in statistical analyses. This trend was also confirmed by observations at individual field profiles. A crucial additional factor influencing erosion was the pre-storm beach height (Hbe), particularly its relative elevation compared to the sea level and run-up parameters.
At sea level up to 0.6 m above average, the run-up of water during the lower storms in Autumn-Winter 2021/22 ranged from 0.9 to 1.1 m AMSL. During these surges, only beaches up to 1.2 m high were eroded. During M&N surges sea level of + 1.2 m AMSL was related to 2.8 – 3.3. m high run-up. The run-up resulted in erosion of the beaches lower than the run-up range 3.3 m. In areas with SL + 1 m AMSL coast was safe up to 2 m height. Dune erosion was observed where the beach was lower than this elevation above run-up related to sea level and wave uprush to the shore. The main remark is that SL is not a valuable variable for determining probable coastal erosion without analyzing run-up height (SLr) and shore (beach) height before SL rise. The value of significant wave height from the achieved model did not prove a relation to shore or coast change.
4.4 Dune erosion concerning beach height, shore orientation and parameters of the storm surges
The erosion of dunes in the given section depended on the height of the beach related to SL and SLr. An example might be the large difference in beach height and dune erosion that results from maximum run-up, as presented in Figure 7. Dune erosion was low or not observed in areas where the beach (Hbe) was higher than the sea run-up (HSLr) (Figure 7A). Sections with lower beach height were influenced by higher erosion (Figure 7B). Dune toe retreat (erosion) occurred in places where the beaches were significantly lower than the run-up of water on the shore. Dune retreat was higher on sections with measured higher SL plus SLr. The correlation of these variables was significant (Table 3). Dune volume erosion did not show a strong correlation with other independent storm-related variables. In contrast, beach volume erosion was primarily influenced by the initial height and width of the beach prior to the surge. Wider and higher beaches experienced greater sediment loss, whereas narrower and lower beaches, already lacking in sediment, exhibited minimal volume change regardless of storm parameters.
Table 3
| Dependent variable | Δ Hbe (m) | Δ Wbe (m) | Δ Qbe (m3) | Δ Pfr (m) | Δ Qfr (m3) |
|---|---|---|---|---|---|
| Independent variable | 1 | 2 | 3 | 4 | 5 |
| HSL max. (m) | 0.48 | 0.14 | 0.34 | 0.09 | 0.21 |
| HSL (t h) > 1.0m | 0.62 | 0.60 | 0.24 | 0.13 | 0.32 |
| HSL (t h) > 1.2m | 0.73 | 0.54 | 0.43 | 0.36 | 0.39 |
| V (t h) > 10 m/s | 0.21 | 0.11 | 0.23 | 0.06 | 0.17 |
| HSLr (m AMSL) | 0.75 | 0.49 | 0.47 | 0.77 | 0.24 |
| Hsw (m) | 0.32 | 0.46 | 0.43 | 0.28 | 0.16 |
| Hbe (m AMSL) | -0.59 | 0.24 | 0.52 | -0.63 | -0.24 |
| Wbe (m) | -0.46 | 0.38 | 0.68 | -0.47 | -0.15 |
Correlation of the variables analyses (p < 0.05).
Source: own data sheet
Bold, significant dependency.
During the Marie&Nadine storm events, the average dune toe retreat reached 3.0-4.5 m, with maximum values of up to 8–13 m in areas where the coastline orientation shifted significantly. The most intense erosion was recorded in sections of the coast that were fully exposed to dominant wind and wave action from the W to NW direction, such as Koszalin Bay, Ustka Bay, and the eastern parts of both the Vistula Sandbar and the Świna Gate Sandbar (Figure 2D). Changes in dune volume were primarily dependent on dune height and, to a lesser extent, on the magnitude of toe retreat. As a result, using volume change alone, especially when expressed solely through elevation differences is not a reliable indicator of erosion risk.
Sections where SL was higher than beach height were affected by larger dune retreats, including those with high beaches. Sections with beaches up to 2 m AMSL were eroded differently depending on shore orientation. The comparison of SL and beach dune changes presented a low correlation but was statistically significant (p > 0.05). The highest similarity was between max. HSL, time of high SL and beach height change. The HSLr variable presented a better correlation to dune retreat than sea level parameters or wave height. As was expected, there was no relation between wind velocity and wave height in sections with observed erosion.
On sections with beaches of the height of 3-3.5 m a.s.l., erosion was not observed. There, after a surge was observed even wider beach, which was related to sediment accumulation. It was not observed, either, on the western coast of Poland on a low beach shore, where the sea level was lower than 1 m AMSL (Figures 2D, 7). Because the height of most of the beaches ranges from 1.5 and 2.5 m, most coasts are eroded by a run-up of 2.8-3.4 m AMSL. Figure 9 presents the relationship between beach height before surges to dune toe retreat during different SL. The variables are divided into sections with three different SL related to the analyzed coast sections. The aggregate data shows that dune retreat grows with beach height decrease in relation of SL. This trend is similar for all SL heights. A beach’s height rather than its width is more important as protection against coastal erosion.
Figure 9
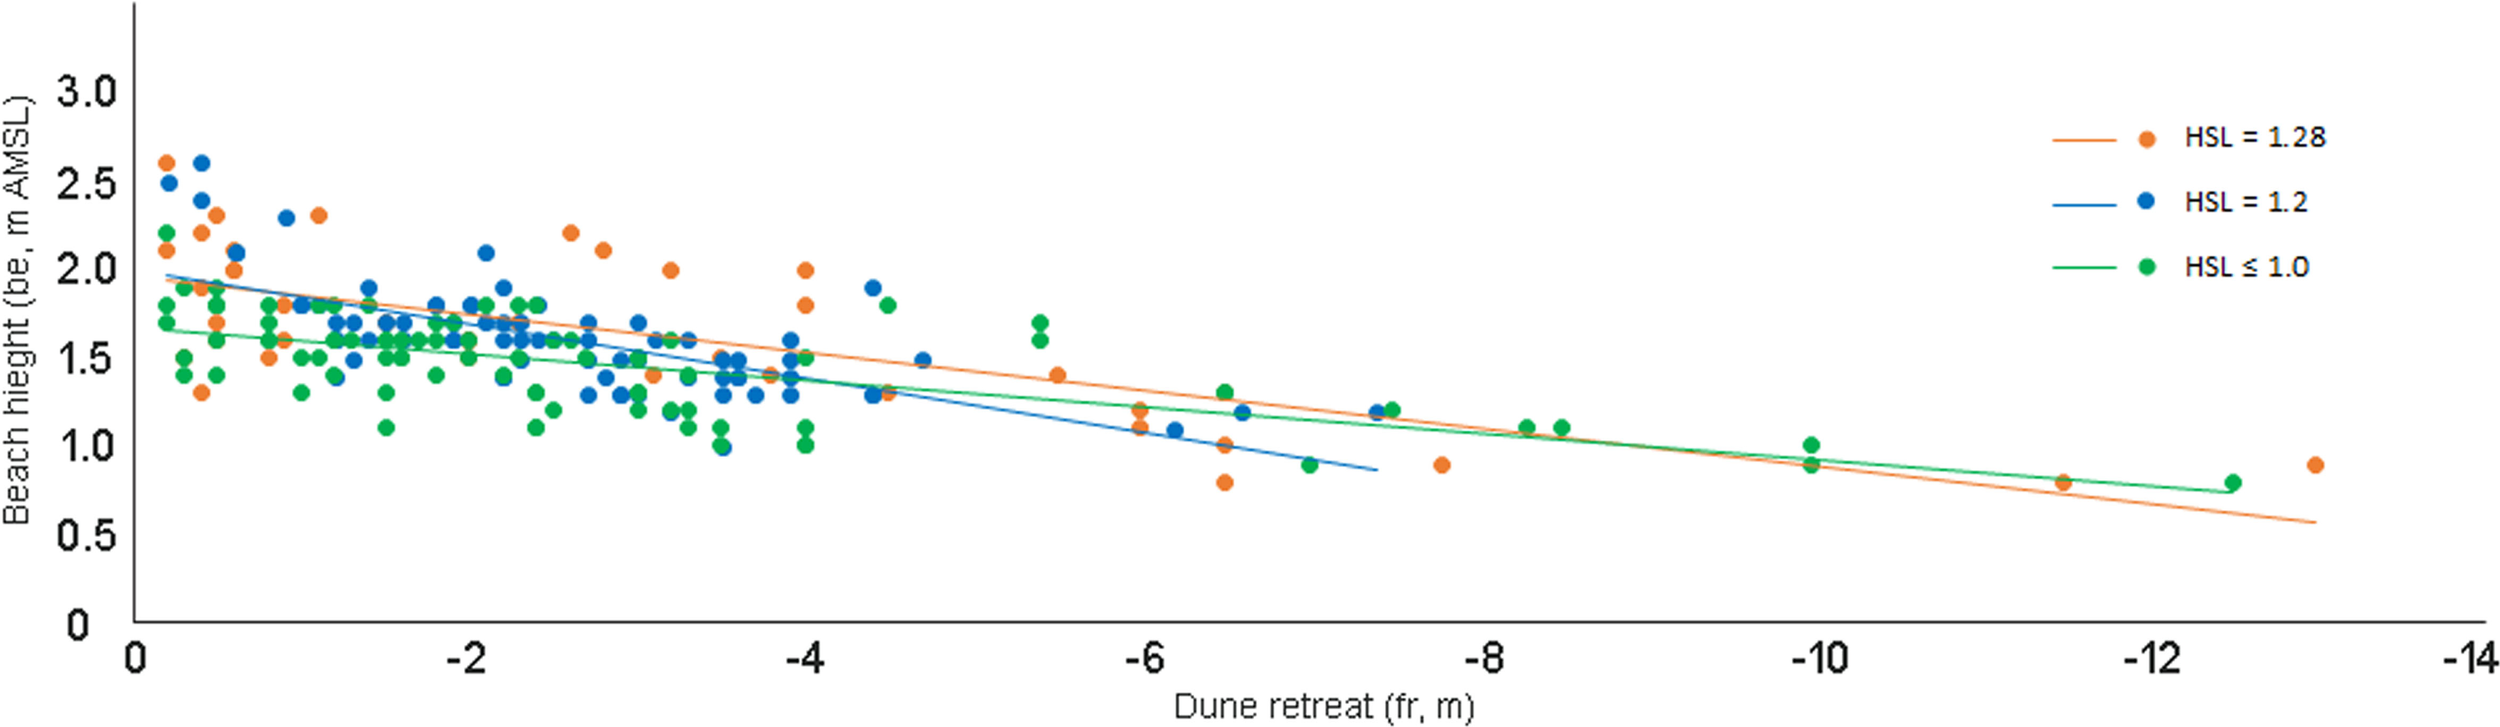
Relation of dune retreat to beach height before storm in areas of varied HSL (m) during M&N surge.
The greatest erosion occurs in periods when a large storm is preceded by smaller ones that cause a lowering of the beaches. In erosion-prone sections with low beaches, smaller surges also lead to the erosion of dunes. The size of the dune retreat depends on:
-
the height of the beach before the storm,
-
the number of storm surges in the given period,
-
the duration of high sea level during the storm,
-
the orientation of the coast to the main direction of the wind and undulation,
-
the maximum run-up, which is a sea level plus wave range on shore that depends mostly on shore elevation.
In general, as a rule, the higher the sea level is, the stronger the erosion of dunes (toe retreat). The erosion of dune volume is not the key factor. It is related to the dune height, not its retreat value. The likelihood of dune (cliff) erosion during storm phenomena increases on coastal sections with low beaches. They are usually eroded even during smaller storm surges. The consequence is a permanent dune retreat. Therefore, the erosion along the coastline is highly differentiated, as the height of beaches varies even in adjacent sections.
5 Discussion
The autumn and winter of 2021/22 were among the warmest recorded in the last two decades. From mid-September 2021 through April 2022, atmospheric circulation over the Baltic Sea was predominantly from the west, with winds ranging from the southwest (SW) to northwest (NW) directions. This pattern resulted from a series of cyclones moving from west to east across the Baltic basin (Łabuz, 2023b).
During this period, a total of 37 storm surges were recorded along the southern Baltic coast, including one major surge in which sea level exceeded 1.2 m above the long-term average (Łabuz, 2023b). The smaller storm events during the season were typically driven by SW to W winds, while the more intense surges were associated with wind directions from SW to NW or occasionally NNE.
The 2021/22 season stands out for having the highest number of storm surges recorded in the 21st century on the southern Baltic coast. For comparison, large number of storm surge activity ranging from 6 to 12 events, was previously observed during the 2001/02, 2006/07, 2011/12, and 2018/19 seasons, with 16 storm surges occurring during the winter of 2019/20. This present regularity each several years. However, the occurrence of storm surges is not regular, and extreme events do not necessarily happen every year (Kowalewska-Kalkowska, 2018).
Until the first decade of the 21st century, no significant trend in the frequency of storm surges had been detected (Wiśniewski and Wolski, 2009). More recently, however, studies indicate a growing number of low-intensity surges and increased variability in the frequency of higher surges (Gräwe and Burchard, 2012; Weisse and Weidemann, 2017; Kowalewska-Kalkowska, 2018). This increase correlates with a rise in the number of cyclonic systems observed during the autumn and winter months, largely driven by the advection of warm air masses from the Atlantic Ocean and the dominance of southwesterly air circulation (Trzeciak, 2001; Andersson, 2002; Sztobryn et al., 2005; Surkova et al., 2015).
In warm winters, winds are predominantly from the southwest, and shifts to west or northwest directions typically depend on the trajectory and speed of passing cyclones over the Baltic region (Majewski et al., 1983; Trzeciak, 2001; Sztobryn et al., 2005; Surkova et al., 2015).
The largest increase in the sea level on the southern Baltic Sea coast is noted when the winds blow from the W to NW and NE directions (Zeidler et al., 1995; Sztorbyn et al., 2005; Girjatowicz et al., 2016). At the highest sea level during the Marie&Nadine storms, the average wind velocity exceeded 13 m/s, while the maximum velocity reached 20–22 m/s. In the Beaufort scale, the wind of the velocity V > 15 m/s generates waves that are up to 3–4 meters high (Trzeciak, 2001; Sztobryn et al., 2005). During the analyzed surges maximum height of significant wave (Hsw) exceeded 2.5-3.3 m on shore adjacent to gauge stations with HSL > 1.2. m AMSL. Its angle 300–3400 was influenced by strong wind from NW-NNW direction. This resulted in the high water run-up on the shore up to 3.4 m AMSL, which flooded all beaches below this elevation. A large extent of water inflow to the shore resulted in measured dune erosion.
The height of wave run-up in relation to shore/coast elevation is an important indicator used to determine the locations of erosion (Nielsen and Hanslow, 1991; Stockdon et al., 2006). Run-up is commonly defined as the maximum vertical extent of wave uprush on the shore, representing the sum of sea level and wave height at the coastline (Stockdon et al., 2006; Melby et al., 2012). Accurate prediction of wave run-up is essential for coastal risk assessments, particularly in the context of storm surge-related hazards (Didenkulova and Pelinovsky, 2008; Di Luccio et al., 2018). In simplified terms, run-up height can be represented as (Equation 4):
where HSL denotes max. sea level and Hsw indicates significant wave height close to the shoreline. However, this is not a strict mathematical equation but rather a conceptual representation of the cumulative effect of both variables.
Field investigations conducted during the Marie&Nadine surges, as well as previous storm events, have demonstrated that sea level alone is not a sufficient predictor of coastal erosion and flooding. In the absence of reliable shoreline wave height data, the total run-up height (HSLr) serves as the most meaningful indicator of potential coastal threat, as it directly correlates with observed erosion and dune retreat. Similar findings were reported along the Sefton coast in the United Kingdom, where erosion was attributed to the combined effect of extreme sea levels and significant wave heights (Esteves et al., 2011).
On the southern Baltic Sea coast, smaller storm surges characterized by sea levels around HSL + 0.8 m typically result in water encroachment up to approximately 1.6 m AMSL (Łabuz, 2022). During moderate storm surges with sea levels approaching 1.0 m AMSL, wave run-up may reach elevations of 2.0–2.3 m AMSL. When sea levels exceed 1.3 m AMSL, nearly all beach segments below 3.5 m AMSL are susceptible to erosion.
The Nadine surge, with sea levels exceeding 1.2 m AMSL, posed a significant threat across much of the coast. Dune retreat was recorded along all surveyed profiles affected by this SL, including those with previously accumulative trends and elevated beaches. Conversely, in areas where sea levels remained close or below + 1.0 m AMSL, dune erosion was generally limited to sections with pre-existing erosion tendencies and beach elevations lower than 2.0 m AMSL.
The intensity of dune erosion is primarily governed by the interaction of sea level and wave-induced run-up in relation to beach height. While beach erosion in terms of width reduction or sediment volume loss does occur, it is the elevation of the beach that most strongly determines the risk of dune retreat under storm surge conditions.
The largest storm surge on the Baltic Sea coast with high sea levels of 1.3 to 1.5 m AMSL appears each several years (Sztobryn et al., 2005; Orviku et al., 2007; Weisse and Weidemann, 2017; Jaagus and Suursaar, 2013; Łabuz, 2022) and causes coast erosion in different Baltic states (Suursaar et al., 2003; Eberhards et al., 2006; Orviku et al., 2007; Tõnisson et al., 2008, 2012; Furmańczyk et al., 2011, Ryabchuk et al., 2011; Jaagus and Suursaar, 2013; Bobykina and Stont, 2015; Jarmalavicius et al., 2016; Kowalewska-Kalkowska, 2018; Bobykina et al., 2021). These observed surges have usually affected the coast oriented perpendicularly to the storm landfall. During these surges, the maximum dune retreat was 8–27 m. The highest dune erosion in 21st century was observed during storm surge Axel in January 2017 with sea level 1.4 to 1.6 m AMSL and with average retreat 5 m and extreme up to 20–25 m (Łabuz, 2023a). These values are similar to the observed average and maximum dune erosion after Marie&Nadine surges in January 2022 with retreat 8 to 13 m with SL + 1.2 to + 1.28 m AMSL. Such stronger surges on the western coast of Poland occur every 2–3 years (Kowalewska-Kalkowska, 2018; 2021; Łabuz, 2022), i.e. more often than those noted in the 20th century (Wiśniewski and Wolski, 2009). The greatest erosion occurs in periods when a large storm is preceded by smaller ones that cause a lowering of the beaches.
Recent studies are showing an increase in erosion after clustering storms, which appear one after another (Houser et al., 2008; Bobykina and Stont, 2015; Dissanayake et al., 2015; Kandrot et al., 2016; Masselink et al., 2016; Castelle et al., 2017; Stont et al., 2023). As a result of the development of the large, double storm surge Marie&Nadine at the end of January 2022, large dune erosion, understood as the retreat of the dune toe, was observed. In coastal sections where the shoreline is oriented transversely to the predominant wave and wind direction (NW), erosion was significantly greater than in adjacent areas with a northern exposure. This pattern was particularly evident along the eastern shores of sandbars in the Pomeranian Bay, the Gulf of Gdańsk, and in the central part of the Polish coast. The most severe erosion occurred on the western sides of coastal capes, which were directly exposed to wind and wave energy during both storm surges. In contrast, their eastern flanks facing north, experienced substantially less impact. These capes correspond to erosion-prone zones within small bay and cape coastal systems, often situated adjacent to sediment accumulation areas (Pruszak and Zawadzka, 2005; Zawadzka-Kahlau, 1999; 2012). The western faces of the capes are regularly exposed to wave attack from the NW, often approaching at near-perpendicular angles (Łabuz, 2023a). Consequently, beaches in these locations are typically lower and narrower, and they undergo continuous erosion.
Beach height has been identified as a critical factor influencing both the extent of coastal erosion and the beach’s capacity to recover following storm events. Erosive coastlines characterized by low and narrow beaches, tend to continue retreating, while coastlines with accumulative tendencies have the potential to rebuild after major surges. However, these dynamics may shift over time, depending on the cumulative effects of successive storm events. This pattern has been observed following clustered storms on the French Atlantic coast (Castelle et al., 2015; 2017) and along the southern Baltic Sea (Bobykina and Stont, 2015, Bobykina et al., 2021; Łabuz, 2022). Long-term coastal dynamics are thus closely linked to prevailing morphodynamic tendencies, particularly beach elevation. Dune retreat is primarily driven by the maximum wave run-up height relative to the beach surface elevation beneath the dune toe.
6 Conclusions
The analysis of changes along the sandbar, dune coasts of the southern Baltic Sea following a significant storm surge event confirmed previously established relationships between the extent of erosion, beach elevation, and maximum wave run-up during storm conditions. The most extensive erosion averaging between 3 and 6 m, occurred during two consecutive storms, named Marie&Nadine, which struck the southern Baltic coast in late January 2022. These surges were generated by strong winds from the W-NW sector, associated with the passage of both cyclones.
The most severe erosion was observed on coastal sections oriented towards the W, NW, or NNW, which are highly susceptible to storm surge impacts. These areas were fully exposed to wind and wave action during both storms. Particularly vulnerable were the western flanks of the capes formed along the sandbars of the Polish Baltic coast, where the shoreline extends northward. Significant erosion was also noted on shores exposed to W-NW winds in the Pomeranian Bay, the Gulf of Gdańsk, and the middle sandbar-dominated coastline.
A clear correlation was identified between the duration of elevated sea levels exceeding 1.0 m AMSL and the intensity of beach and dune erosion. The length of time that high water levels persist during a surge was found to be a key factor influencing dune retreat. In contrast, changes in beach width were not a reliable indicator of coastal vulnerability, as beach widening can occur due to adjacent dune erosion. Beach elevation emerged as the primary factor in protecting the coast from dune toe retreat. The extent of dune retreat at a given site was largely determined by the pre-storm height of the beach. Erosion was more pronounced on sections where prolonged high sea levels coincided with relatively low beach elevations, allowing wave run-up to reach and erode the dune toe. Thus, beach height, rather than width is the critical parameter in assessing coastal resilience to storm surge impacts. Notably, the pre-storm width of the beach showed no significant correlation with the severity of dune erosion.
The greatest dune and beach erosion was observed on the coast perpendicular to the prevailing wave direction and subject to the highest sea level. Coastal erosion resulting from storm surge events must therefore be assessed using multiple variables, as outlined in this study. Forecasting the potential for dune erosion during storm events requires accurate field-based data on beach elevation and expected wave run-up. Both indicators of coastal vulnerability can only be reliably determined through in situ measurements conducted before and after storm surges.
Statements
Data availability statement
The raw data supporting the conclusions of this article will be made available by the authors, without undue reservation.
Author contributions
TŁ: Validation, Methodology, Formal Analysis, Conceptualization, Project administration, Supervision, Data curation, Software, Writing – original draft, Visualization, Investigation, Writing – review & editing, Resources, Funding acquisition.
Funding
The author(s) declare financial support was received for the research and/or publication of this article. The research is part of the own project ANDDY (Anthropogenic-Natural Dunes Dynamics, http://polishdunes.usz.edu.pl/). co-financed by the Polish Minister of Science under the “Regional Excellence Initiative” Program for 2024–2027 (RID/SP/0045/2024/01).
Acknowledgments
This research is related to the topic “New Challenges for Baltic Sea Earth System Research” of the 5th Baltic Earth conference held in Jurmala, Latvia 13–17 May 2024.
Conflict of interest
The authors declares that the research was conducted in the absence of any commercial or financial relationships that could be construed as a potential conflict of interest.
Generative AI statement
The author(s) declare that no Generative AI was used in the creation of this manuscript.
Any alternative text (alt text) provided alongside figures in this article has been generated by Frontiers with the support of artificial intelligence and reasonable efforts have been made to ensure accuracy, including review by the authors wherever possible. If you identify any issues, please contact us.
Publisher’s note
All claims expressed in this article are solely those of the authors and do not necessarily represent those of their affiliated organizations, or those of the publisher, the editors and the reviewers. Any product that may be evaluated in this article, or claim that may be made by its manufacturer, is not guaranteed or endorsed by the publisher.
References
1
Andersson H. C. (2002). Influence of long-term regional and large-scale atmospheric circulation on the Baltic sea level. Tellus A: Dynamic Meteorology Oceanography54, 76–88. doi: 10.3402/tellusa.v54i1.12125
2
Basiński T. (1995). “ Dune erosion during storm surges,” in Polish coast past, present and future, Ed. RotnickiK. (Poland) J. Coast. Res. SI, 22, 267–270.
3
Bobykina V. P. Stont Z. I. (2015). Winter storm activity in 2011–2012 and its consequences for the Southeastern Baltic coast. Water Resource42, 371–377. doi: 10.1134/S0097807815030021
4
Bobykina V. P. Stont Z. Kileso A. W. (2021). Deformations of the sea shore of the Curonian Spit (southeastern Baltic) under the influence of storms autumn-winter season 2018-2019. Series: Natural and Medical Sciences 2 C ( Bulletin of the Baltic Federal University I. Kant), 73–83.
5
Carter R. W. G. Hesp P. A. Nordstrom K. F. (1990). Erosional landforms in coastal dunes, in Coastal Dunes: Form and Process. Eds. NordstromK. F.PsutyN. P.CarterR. W. G. (London: Wiley), 217–249.
6
Carter R. W. G. Wilson P. (1990). The geomorphological, ecological and pedological development of coastal foredunes at Magilligan Point, Northern Ireland, in Coastal Dunes: Form and Process. Eds. NordstromK. F.PsutyN. P.CarterR. W. G. (London: Wiley), 129–157.
7
Castelle B. Bujan S. Ferreira S. Dodet G. (2017). Foredune morphological changes and beach recovery from the extreme 2013/2014 winter at a high-energy sandy coast. Mar. Geology385, 41–55. doi: 10.1016/j.margeo.2016.12.006
8
Castelle B. Marieu V. Bujan S. Splinter K. D. Robinet A. Sénéchal N. et al . (2015). Impact of the winter 2013–2014 series of severe Western Europe storms on a double-barred sandy coast: Beach and dune erosion and megacusp embayments. Geomorphology238, 135–148. doi: 10.1016/j.geomorph.2015.03.006
9
Cyberski J. Wróblewski A. (1999). Recent and forecast changes in sea level along the Polish coast during the period 1900-2011. Quaternary Stud. Poland3, 77–83.
10
Dailidienė I. Davuliene L. Tilickis B. Stankevicius A. Myrberg K. (2006). Sea level variability at the Lithuanian coast of the Baltic Sea. Boreal Environ. Res.11, 109–121.
11
Didenkulova I. Pelinovsky E. (2008). Run-up of long waves on a beach: the influence of the incident wave form. Oceanology48, 1–6. doi: 10.1134/S0001437008010013
12
Di Luccio D. Benassai G. Budillon G. Mucerino L. Montella R. Carratelli E. P. (2018). Wave run-up prediction and observation in a micro-tidal beach. Natural Hazards Earth System Sci.18, 2841–2857. doi: 10.5194/nhess-18-2841-2018
13
Dissanayake P. Brown J. Wisse P. Karunarathna H. (2015). Effects of storm clustering on beach/dune evolution. Mar. Geology370, 63–75. doi: 10.1016/j.margeo.2015.10.010
14
Dubrawski R. Zawadzka-Kahlau E. (2006). The future of Polish coast protection (Gdańsk: Instytut Morski w Gdańsku).
15
Eberhards G. Lapinskis J. Saltupe B. (2006). Hurricane Erwin 2005 coastal erosion in Latvia. Baltica19, 10–19.
16
Esteves L. S. Brown J. M. Williams J. J. Lymbery G. (2011). Quantifying thresholds for significant dune erosion along the Sefton Coast, Northwest England. Geomorphology, 143–144, 52–61. doi: 10.1016/j.geomorph.2011.02.029
17
Forbes D. L. Parkes G. S. Manson G. K. Ketch L. A. (2004). Storms and shoreline retreat in the southern Gulf of St. Lawrence. Mar. Geology210, 169–204. doi: 10.1016/j.margeo.2004.05.009
18
Furmańczyk K. K. Dudzińska-Nowak J. Furmańczyk K. A. Paplińska-Swerpel B. Brzezowska N. (2011). Dune erosion as a result of the significant storms at the western Polish coast (Dziwnow Spit example). J. Coast. Res.64, 756–759.
19
Girjatowicz J. P. Światek M. Wolski T. (2016). The influence of atmospheric circulation on the water level on the southern coast of the Baltic Sea. J. Climatology36, 4534–4547. doi: 10.1002/joc.4650
20
Gräwe U. Burchard H. (2012). Storm surges in the Western Baltic Sea: The present and a possible future. Climate Dynamics39, 165–183. doi: 10.1007/s00382-011-1185-z
21
Houser C. Ellis J. (2013). Beach and dune interaction. Treatise Geomorphology10, 267–288. doi: 10.1016/B978-0-12-374739-6.00283-9
22
Houser C. Hapke C. Hamilton S. (2008). Controls on coastal dune morphology, shoreline erosion and barrier island response to extreme storms. Geomorphology100, 223–240. doi: 10.1016/j.geomorph.2007.12.007
23
Houser C. Wernette P. Rentschlar E. Jones H. Hammond B. Trimble S. (2015). Post-storm beach and dune recovery: Implications for barrier island resilience. Geomorphology234, 54–63. doi: 10.1016/j.geomorph.2014.12.044
24
Hünicke B. Zorita E. Soomere T. Madsen K. S. Johansson M. Suursaar Ü. et al . (2015). “ Recent change – sea level and wind waves,” in Second assessment of climate change for the Baltic Sea Basin. The BACC II Author Team Eds. Regional Climate Studies (Cham: Springer), 155–185. doi: 10.1007/978-3-319-16006-1_9
25
Institute of Meteorology and Water Management National Research Institute (2022). Available online at: https://www.imgw.pl/ (Accessed March 15, 2022).
26
Institute of Meteorology of the Free University of Berlin (2022). Available online at: http://www.met.fu-berlin.de/wetterpate/ (Accessed March 10, 2022).
27
Jaagus J. Suursaar Ü. (2013). Long-term storminess and sea level variations on the Estonian coast of the Baltic Sea in relation to large-scale atmospheric circulation. Estonian J. Earth Sci.62, 73–92. doi: 10.3176/earth.2013.07
28
Jarmalavicius D. Šmatas V. Stankunavicius G. Pupienis D. Žilinskas G. (2016). Factors controlling coastal erosion during storm events. J. Coast. Res.75, 1112–1116. doi: 10.2112/SI75-223.1
29
Johansson M. Boman H. Kahma K. K. Launiainen J. (2001). Trends in sea level variability in the Baltic Sea. Boreal Environ. Res.6, 159–179.
30
Kandrot S. Farrell E. Devoy R. (2016). The morphological response of foredunes at a breached barrier system to winter 2013/2014 storms on the southwest coast of Ireland. Earth Surface Processes Landforms41, 2123–2136. doi: 10.1002/esp.4003
31
Kelpšaite L. Dailidienė I. (2011). Influence of wind wave climate change to the coastal processes in the eastern part of the Baltic Proper. J. Coast. Res.64, 220–224.
32
Kelpšaite-Rimkiene L. Parnell K. E. Žaromskis R. Kondrat V. (2021). Cross-shore profile evolution after an extreme erosion event—Palanga, Lithuania. J. Mar. Sci. Eng.9, 1–15. doi: 10.3390/jmse9010038
33
Koltsova T. Belakova J. (2009). “ Storm surges on the southern coast of Gulf of Riga: Case study of the Lielupe River,” in Jones, J.A.A., Vardanian, T.G., Hakopian, C. (eds). Threats to Global Water Security. NATO Science for Peace and Security, Series C: Environmental Security II, (Dordrecht: Springer) 91–97. doi: 10.1007/978-90-481-2344-5_10
34
Kowalewska-Kalkowska H. (2018). Frequency and strength of storm surges in the Oder River mouth area. Acta Scientarium Polonorium Formatio Circumiectus17, 55–65. doi: 10.15576/ASP.FC/2018.17.3.55
35
Kowalewska-Kalkowska H. (2021). Storm-surge induced water level changes in the Odra river mouth area (southern Baltic coast). Atmosphere12, 1559. doi: 10.3390/atmos12121559
36
Łabuz T. A. (2009). The West Pomerania coastal dunes – alert state of their development. Z. der Deutschen Gesellschaft für Geowissenschaften160, 113–122.
37
Łabuz T. A. (2013). Polish coastal dunes – affecting factors and morphology. Landform Anal.22, 33–59. doi: 10.12657/landfana.022.004
38
Łabuz T. A. (2014). Erosion and its rate on an accumulative Polish dune coast: the effects of the January 2012 storm surge. Oceanologia56, 307–326. doi: 10.5697/oc.56-2.307
39
Łabuz T. A. (2016). A review of field methods to survey coastal dunes - experience based on research from the South Baltic coast. J. Coast. Conserv.20, 175–190. doi: 10.1007/s11852-016-0428-x
40
Łabuz T. A. (2022). Storm surges versus shore erosion: 21 years, (2000–2020) of observations on the Świna Gate Sandbar (southern Baltic coast). Quaestiones Geographicae41, 5–31. doi: 10.1515/quageo-year-00XX
41
Łabuz T. A. (2023a). Causes and effects of coastal dunes erosion during storm surge Axel in January 2017 on the southern Baltic Polish coast. Quaestiones Geographicae42, 67–87. doi: 10.14746/quageo-2023-0024
42
Łabuz T. A. (2023b). Influence of meteorological conditions in autumn/winter 2021–2022 on the development of storm surges and the dune erosion on the Polish Baltic coast as a result of climate changes. Studia Quaternaria40, 91–114. doi: 10.24425/sq.2023.148035
43
Łabuz T. A. (2023c). Erosion of the Polish dune coast by storm surges in the 2018/19 season, including the Zeetje surge. Landform Anal.42, 77–98. doi: 10.12657/landfana-042-006
44
Łabuz T. A. Kowalewska-Kalkowska H. (2011). Coastal erosion caused by the heavy storm surge of November 2004 in the southern Baltic Sea. Climate Res.48, 93–101. doi: 10.3354/cr00927
45
Łabuz T. A. Sydor P. (2016). “ Lithology of surface sediments of dune coast as an indicator of aeolian processes on accumulative sections of the Polish coast,” in Selected issues of aeolian geomorphology. Eds. ŚwiętochowiczJ.MichnoA. ( Uniwersytet Jagielloński, Kraków), 63–86.
46
Majewski A. (1998). Catastrophic storms and floods on the southern shores of the Baltic Sea. Inżynieria Morska i Geotechnika2, 67–69.
47
Majewski A. Dziadziuszko Z. Wiśniewska A. (1983). Monograph of storm floods 1951-1975 (Warszawa: Wydawnictwa Komunikacji i Łączności).
48
Masselink G. Scott T. Poate T. Russell P. Davidson M. E. Conley D. C. (2016). The extreme 2013/2014 winter storms: hydrodynamic forcing and coastal response along the southwest coast of England. Earth Surface Processes Landforms41, 378–391. doi: 10.1002/esp.3836
49
Melby J. Caraballo-Nadal N. Kobayashi N. (2012). Wave runup prediction for flood mapping. Coast. Eng. Proc.1 (33), management.79. doi: 10.9753/icce.v33.management.79. management 79.
50
Meteorological Service in Germany ( Wetterzentrale). Available online at: wetterzentrale.de (Accessed March 10, 2022).
51
Morton R. A. Sallenger A. H. (2003). Morphological impact of extreme storms on sand beaches and barriers. J. Coast. Res.19, 560–574.
52
Nielsen P. Hanslow D. (1991). Wave run-up distributions on natural beaches. J. Coast. Res.7, 1139–1153.
53
Numerical Weather Forecast ICM ( Warsaw University). Available online at: https://old.meteo.pl/ (Accessed February 2, 2022).
54
Orviku K. Suursaar Ü. Tõnisson H. Kullas T. Rivis R. Kont A. (2007). Coastal changes in Saaremaa Island, Estonia, caused by winter storms in 1999, 2001, 2005 and 2007. J. Coastal Res. SI56, 1651–1655
55
Pruszak Z. Zawadzka E. (2005). Vulnerability of Poland to sea-level rise. Coast. Eng.47, 131–155.
56
Psuty N. P. (1993). “ Foredune morphology and sediment budget, Perdido Key, FL, USA,” in The Dynamics and Environmental Context of Aeolian Sedimentary System. Ed. PyeK. ( Geological Society, London), 145–157.
57
Pye K. Neal A. (1994). Coastal dune erosion at Formby Point, north Merseyside, England: causes and mechanisms. Mar. Geology119, 39–56. doi: 10.1016/0025-3227(94)90139-2
58
Roelvink D. Reniers A. van Dongeren A. van Thiel de Vries J. McCall R. Lescinski J. (2009). Modelling storm impacts on beaches, dunes and barrier islands. Coast. Eng.56, 1133–1152. doi: 10.1016/j.coastaleng.2009.08.006
59
Ryabchuk D. Kolesov A. Chubarenko B. Spiridonov M. Kurennoy D. Soomere T. (2011). Coastal erosion processes in the eastern Gulf of Finland and their links with geological and hydrometeorological factors. Boreal Environ. Res.16, 117–137.
60
Sallenger A. H. (2000). Storm impact scale for barrier islands. J. Coast. Res.16, 890–895.
61
Sarre R. (1989). The morphological significance of vegetation and relief on coastal foredune processes. Z. Fur Geomorphologie N.F.73, 17–31.
62
Sherman D. J. Bauer B. O. (1993). Dynamics of beach-dune systems. Prog. Phys. Geogr.17, 413–447. doi: 10.1177/030913339301700402
63
Short A. D. Hesp P. A. (1982). Wave, beach and dune interactions in southeast Australia. Mar. Geology48, 259–284. doi: 10.1016/0025-3227(82)90100-1
64
Stockdon H. F. Holman R. Howd P. Sallenger A. (2006). Empirical parametrization of setup, swash and runup. Coast. Eng.53, 573–588. doi: 10.1016/j.coastaleng.2005.12.005
65
Stockdon H. F. Sallenger A. H. Holman R. Howd P. A. (2007). A simple model for the spatially-variable coastal response to hurricanes. Mar. Geology238, 1–20. doi: 10.1016/j.margeo.2006.11.004
66
Stont Z. Bobykina V. P. Ulyanova M. O. (2023). Diving cyclones and consequences of their impact on the coasts of the South-Eastern Baltic Sea. Russian J. Earth Sci.23, ES2001. doi: 10.2205/2023ES000827
67
Surkova G. Arkhipkin V. Kislov A. (2015). Atmospheric circulation and storm events in the Baltic Sea. Open Geosciences7, 332–341. doi: 10.1515/geo-2015-0030
68
Suursaar Ü. Kullas T. Otsmann M. Kõuts T. (2003). Extreme sea level events in the coastal waters of western Estonia. J. Sea Res.49, 295–303. doi: 10.1016/S1385-1101(03)00022-4
69
Sztobryn M. Stigge H. J. Wielbińska D. Weidig B. Stanisławczyk I. Kańska A. et al . (2005). Storm surges in the southern Baltic (western and central parts), ( Bundesamt für Seeschifffahrt und Hydrographie, Rostock/Hamburg). Report 39.
70
Tõnisson H. Orviku K. Jaagus J. Suursaar Ü. Kont A. Rivis R. (2008). Coastal damages on Saaremaa Island, Estonia, caused by the extreme storm and flooding on January 9, 2005. J. Coastal Res. 24 (3), 602–614. doi: 10.2112/06-0631.1
71
Tõnisson H. Suursaar Ü. Rivis. R. Kont A. Orviku K. (2012). “ Observation and analysis of coastal changes in the West Estonian Archipelago caused by storm Ulli (Emil) in January 2012,” in Proceedings 12th International Coastal Symposium, vol. 65. Eds. ConleyD. C.MasselinkG.RussellP. E.O’HareT. J. (Plymouth, England), 832–837. Journal of Coastal Research.
72
Trzeciak S. (2001). Storm winds on the Polish Baltic coast (Szczecin (in Polish: Wydawnictwa Wyższej Szkoły Morskiej 36).
73
van de Graaff J. (1994). Coastal and dune erosion under extreme conditions. J. Coast. Res.12, 253–262.
74
Vellinga P. (1982). Beach and dune erosion during storm surges. Coast. Eng.6, 361–387. doi: 10.1016/0378-3839(82)90007-2
75
Weisse R. Weidemann H. (2017). Baltic Sea extreme sea levels 1948-2011: Contributions from atmospheric forcing. Proc. IUTAM25, 65–69. doi: 10.1016/j.piutam.2017.09.010
76
Wiśniewski B. Wolski T. (2009). Catalogues of storm surges and depressions of sea levels and extreme water levels on the Polish coast (Szczecin: Wydawnictwo Akademii Morskiej w Szczecinie).
77
Wolski T. Wiśniewski B. Giza A. Kowalewska-Kalkowska H. Boman H. Grabbi K. et al . (2014). Extreme sea levels at selected stations on the Baltic Sea coast. Oceanologia56, 259–290. doi: 10.5697/oc.56-2.259
78
Wolski T. Wiśniewski B. (2020). Geographical diversity in the occurrence of extreme sea levels on the coasts of the Baltic Sea. J. Sea Res.159, 101890. doi: 10.1016/j.seares.2020.101890
79
Zawadzka-Kahlau E. (1999). Development trends of the Polish shores of the South Baltic Sea (Gdańsk: Gdańskie Towarzystwo Naukowe).
80
Zawadzka-Kahlau E. (2012). Morphodynamics of the dune coast in the southern Baltic Sea (Gdańsk: Wydawnictwo Uniwersytetu Gdańskiego).
81
Zeidler R. B. Wróblewski A. Miętus M. Dziadziuszko Z. Cyberski J. (1995). “ Wind, wave, and storm surge regime at the Polish Baltic coast,” in Polish coast past, present and future. Ed. RotnickiK.(Poland), 33–54. Journal of Coastal Research, SI 22.
Summary
Keywords
dune retreat, erosion factors, beach height, run-up height, double storm, Baltic Sea
Citation
Łabuz TA (2025) Coastal dune erosion under the influence of the Marie and Nadine storms in January 2022 on the Southern Baltic Sea coast. Front. Mar. Sci. 12:1634257. doi: 10.3389/fmars.2025.1634257
Received
23 May 2025
Accepted
29 August 2025
Published
25 September 2025
Volume
12 - 2025
Edited by
Grzegorz Różyński, Polish Academy of Sciences, Poland
Reviewed by
Junliang Gao, Jiangsu University of Science and Technology, China; Hannes Tõnisson, Tallinn University, Estonia
Updates
Copyright
© 2025 Łabuz.
This is an open-access article distributed under the terms of the Creative Commons Attribution License (CC BY). The use, distribution or reproduction in other forums is permitted, provided the original author(s) and the copyright owner(s) are credited and that the original publication in this journal is cited, in accordance with accepted academic practice. No use, distribution or reproduction is permitted which does not comply with these terms.
*Correspondence: Tomasz Arkadiusz Łabuz, tomasz.labuz@usz.edu.pl
Disclaimer
All claims expressed in this article are solely those of the authors and do not necessarily represent those of their affiliated organizations, or those of the publisher, the editors and the reviewers. Any product that may be evaluated in this article or claim that may be made by its manufacturer is not guaranteed or endorsed by the publisher.