Abstract
Introduction:
The discovery of microbial denitrification in non-extreme oxygen-deficient environments has drawn growing attention. At the same time, it is reshaping previous understanding of the spatial pattern of marine nitrogen (N) sinks. The non-hypoxic subsurface and intermediate waters of the South China Sea (SCS) basin possess potential favorable conditions for the occurrence of microbial denitrification, which are long-term overlooked and remained unexplored.
Methods:
Methods: In this study, a series of 15N-isotope tracers incubation experiments, combined with functional genes characterizations and hydro-chemical parameters analysis, were conducted during cruise. Rigorous statistical analysis was performed to reveal the correlations between environmental variables and denitrifying activity.
Results:
It showed that representative denitrification functional genes (narG and nirS) are ubiquitously presented at moderate abundances (0.1×10⁴~12×105 copies/L) across the water columns. In the intermediate waters (600~1500 m) with low dissolved oxygen (DO) saturation (20%~30%), weak in situ denitrification rates (0.2~1.1 nmol N2/L/d) were detected. However, under simulated anoxic conditions, active denitrification was detected in most sampling layers, with potential rates (0.2~33 nmol N2/L/d) comparable to those in typical oxygen-deficient zones (ODZs).
Discussion:
Significant correlations between suspended particulate matter (SPM) and particulate organic carbon (POC), contents with both denitrification rates and functional gene abundances were observed. It is inferred that low ambient DO levels, as well as hypoxic micro-niches in particulate matter, may together drive denitrification occurrence in the basin waters. Besides, particulate matter plays a critical role in influencing metabolic activity and spatial variability of denitrification in the basin. Since the mid-water of the SCS basin sustains a large particulate loading from terrestrial input and hydrodynamics, it is likely to maintain strong denitrification potential in the water body. We further propose a preliminary framework of coupling between particle transport driven by complex environmental dynamics and microbial N removal. Our study not only provides a potential implication for the need to re-evaluate the N budgets in the SCS basin, but also offers a new perspective of mechanism interpretation for microbial N removal in non-hypoxic marine environments.
1 Introduction
The size of the fixed-N pool regulates the productivity of phytoplankton in the upper ocean, which in turn determines the ability of the marine biological pump to sequestrate atmospheric carbon dioxide (CO2) (Codispoti, 1989; Sigman and Boyle, 2000). Heterotrophic denitrification, as one of the important microbial N metabolic processes, accounts for 30~50% of inorganic fixed-N removal in modern oceans (Gruber, 2008; Lam and Kuypers, 2011; Devol, 2015. Traditionally, microbial N removal was recognized only occur in extreme hypoxia (dissolved oxygen (DO) concentration less than 2 μmol/L) (Codispoti et al., 2001; Devol, 2008; Lam and Kuypers, 2011). However, more and more discoveries have reported the microbial N removal, including denitrification, observed in non-hypoxic and even oxygen-replete condition across different aquatic environments (Fuchsman et al., 2019; Xia et al., 2021; Müller et al., 2022; Wan et al., 2023). The probable mechanisms were attributed to the increase of DO tolerance threshold and hypoxic micro-environment existing in the particulate matter (Engel et al., 2022; Ciccarese et al., 2023; Cram et al., 2024). The discovery of “new” N sinks implies that the spatial area of microbial N removal may be broader, and the inducing factors are more diverse than prior cognitions, which challenges the traditional concept of aquatic N sink regime. For the oceanic environment, in-depth exploration of such potential N sink is undoubtedly crucial for accurately quantifying the transformation of marine fixed-N and therefore fully characterizing the marine N cycle.
The South China Sea (SCS), located in the western Pacific, is the largest semi-enclosed marginal sea in the world. The extensive continental shelf and adjacent to the Pearl River estuary in the north, the Mekong River in the west and the Philippine Sea in the east, make it play a special role in global marine carbon sinks (Chou et al., 2007; Dai et al., 2013), and thus becoming a hotspot in the studies of biogeochemical cycles. Meanwhile, strong land-sea interactions, as well as complex hydrodynamic conditions within the basin, including mesoscale eddies and upwelling systems, have promoted the active migration and transformation of N in the SCS (Yang et al., 2017; Xu et al., 2018; Tian et al., 2025), which provides an ideal place for depicting the patterns of marginal sea N cycle. Over the past years, evidence from molecular biological identifications showed that the typical genera with anaerobic metabolism functions were widely distributed in the water column of the SCS basin, including Pseudomonas and Alcaligenes which can carry out denitrification, and Planctomyces which can carry out anaerobic ammonia oxidation (Zhang et al., 2016; Li et al., 2021; Liu et al., 2021). Recently, through bacterial diversity analysis, it has also been found that several strains in the deep SCS possess the efficient denitrifying potentials (Wang et al., 2019; Chen et al., 2024). In addition, multi-years biogeochemical observations have confirmed that significant particulate matter inputs are common in the mid-waters of the SCS (Lahajnar et al., 2007; Schroeder et al., 2015; Ma et al., 2017; Zhang et al., 2019; Tan et al., 2020), which provides sufficient carriers for the formation of hypoxic micro-environments. Clearly, it could suppose that these potential conditions have laid a certain foundation for the occurrence of microbial denitrification in the SCS basin. However, since the SCS is a typical oligotrophic marginal sea (Liu et al., 2002) with relatively fast water exchange (Gong et al., 1992), the DO within water column would never reach extremely low level (generally higher than 70 μmol/L) (Li and Qu, 2006; Liu et al., 2011). Therefore, quantitative contribution of microbial denitrification to the N budgets of SCS basin was long been overlooked. And the inductions, spatial-temporal variations as well as modulations of denitrifying function in the SCS basin remain unknown so far.
In this study, a series of ship-boarded incubations by 15N-isotope tracers, combined with collections and analysis of representative functional genes narG/nirS and hydro-chemical factors, were carried out during the cruise survey. The stations located in the central basin of SCS were selected to determine the original denitrification rate under simulating in-situ environment of the water body, and the potential denitrification rate under deoxygenating amended. Our study preliminarily reveals the spatial pattern and induction of denitrifying metabolism within the SCS basin. Significance of the denitrification to basin-scale N cycling is also evaluated. Additionally, a mutual coupling framework between microbial N removals and complex particle-dynamic conditions in the non-hypoxic marginal basin is tried to be constructed.
2 Materials and methods
2.1 Sample collections
Supported by the National Natural Science Foundation of China’s Central South China Sea Basin Scientific Expedition Research Shared Voyage (Voyage No.: KK2102-2), from July 27 to August 20, 2021, seawater samples at vertical depths of five stations in the central SCS basin were collected along the 113°E meridian for denitrification incubating experiments and determinations of bio-chemical parameters (Figure 1). Seawaters were sampled with a Seabird SBE-911 plus conductivity-temperature-density (Figure 2A) and Rosette system. Samples for analysis of DO, dissolved inorganic nitrogen (DIN), SPM and POC were collected from surface to 1500 m layers. Determinations of denitrification potentials and the abundance of functional genes were targeted from 300 m to 1500 m range (Table 1), the depths of which covering the typical DO minimum zones in the SCS basin (Li and Qu, 2006; Liu et al., 2011).
Figure 1
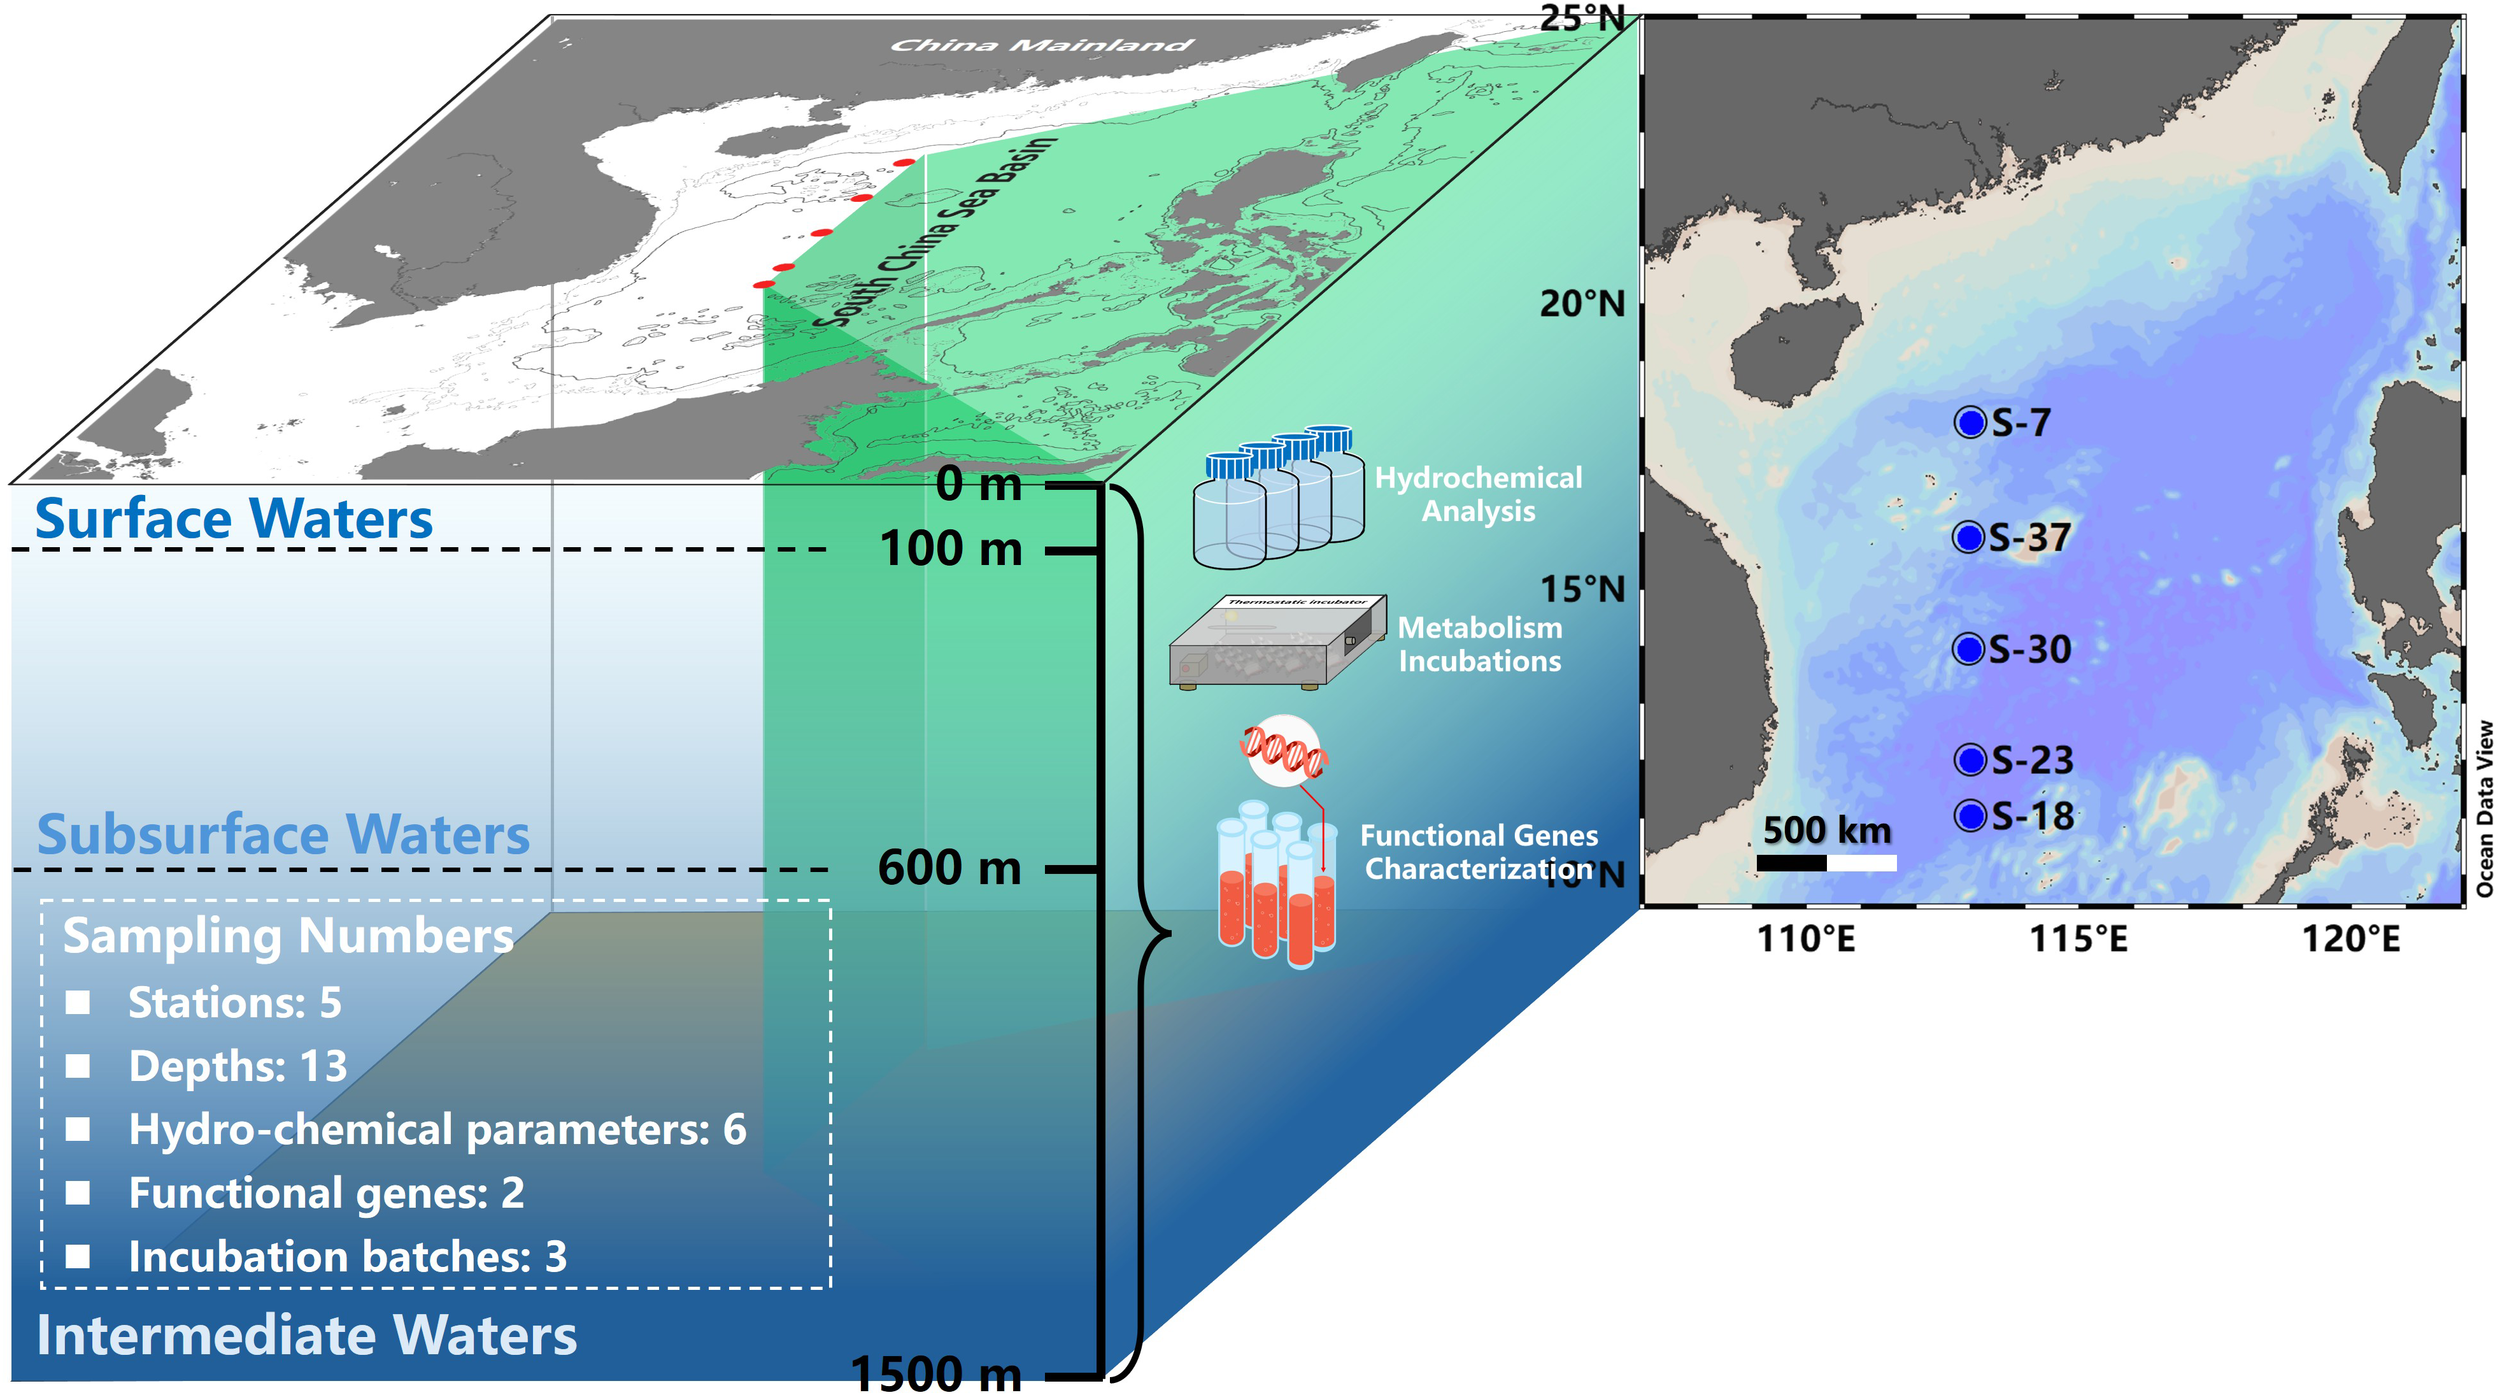
Map of sampling stations in the SCS basin during summer 2021 cruise. In this study, the upper 1500 m of sampling water column is divided into surface layer (0~100 m), subsurface layer (100~600 m) and intermediate layer (600~1500 m) according to previous hydrological definition.
Table 1
| Station | Longitude (°E) | Latitude (°N) | Bottom depth (m) | Sampling depth (m) | Parameter sampling | Proportion of 15N in-spike (%) * | ||
|---|---|---|---|---|---|---|---|---|
| 0~300 m | 300~1500 m | Rin-situ and Rpotential detection | Kinetics of NO3-N uptake detection § | |||||
| S-7 | 113.019 | 17.011 | 2931 | ☑ 5 ☑ 25 ☑ 50 ☑ 75 ☑ 100 ☑ 150 ☑ 300 ☑ 500 ☑ 600 ☑ 700 ☑ 800 ☑ 1000 ☑ 1500 |
☑ Temperature ☑ Salinity ☑ DO ☑ DIN ☑ SPM ☑ POC ☐ Denitrification ☐ narG gene ☐ nirS gene |
☑ Temperature ☑ Salinity ☑ DO ☑ DIN ☑ SPM ☑ POC ☑ Denitrification ☑ narG gene ☑ nirS gene |
☐ 0.05 ☐ 0.10 ☐ 0.20 ☐ 0.40 ☐ 0.60 ☐ 0.80 ☐ 1.0 ☑ 5.0~10 |
☑ 0.05 ☑ 0.10 ☑ 0.20 ☑ 0.40 ☑ 0.60 ☑ 0.80 ☑ 1.0 ☐ 5.0~10 |
| S-37 | 112.974 | 15.911 | 2167 | |||||
| S-30 | 112.973 | 13.955 | 2560 | |||||
| S-23 | 113.019 | 12.002 | 4158 | |||||
| S-18 | 113.020 | 11.023 | 4317 | |||||
Sampling strategy of bio-chemical parameters and incubation experiments through water columns of this research.
* Proportion of 15N denotes the 15N-labelled fraction in bulk NO3-N substrate of incubated seawater.
§ Kinetics of NO3-N uptake detections were only conducted in 700 m and 1000 m depths of Sta. S-7 and Sta. S-30.
In order to facilitate the following discussion, the sampling water columns from surface to 1500 m were divided into three layers in our study according to literature definition, i.e., surface waters (0~100 m), subsurface waters (100~600 m) and intermediate waters (600~1500 m) (Gong et al., 1992; Li and Qu, 2006; Chou et al., 2007).
2.2 Analysis of hydro-chemical parameters
The collection of DO was directly transferred from rosette-sampler to a 120 mL grinding glass bottle and then sealed and stored after overflowing 3 times the volume, with the concentration being measured onboard by the standard Winkler method (Hansen and Koroleff, 1999). 3~5 L of seawater was filtered with a pre-combusted (450°C, 4 h) and weighted glass fiber membrane (Advantec GF75, 0.3 μm pore size). SPM and POC were collected from each sampling layer, and the filters were frozen at −20°C. Back to land-based laboratory, the membranes were dried and weighed at 60°C to obtain the SPM content. After removing the inorganic carbon by fumigation with concentrated hydrochloric acid, the POC content was determined by an elemental analyzer (FlashSmart NCS, Thermo Scientific), with the detection limit of 0.1 μmol C of this instrument. While the filtrate of each layer seawater was collected into an acid-cleaned and sample rinsed high-density polyethylene bottle (Nalgene) and stored frozen (−20°C). After returning to land laboratory, the concentrations of nitrate (NO3-N) and nitrite (NO2-N) within the filtrates were determined by colorimetric method via continuous-flow Auto Analyzer III (AA3, BRAN-LUEBBE, Germany) (Kirkwood et al., 1996) (NOx was used to represent the sum of the two concentrations in this study). The detection limits for the measurement of NO2-N and NO3-N were 0.05 μmol/L and 0.2 μmol/L, respectively (hydro-chemical measurements data are available in the Supplementary Data Sheet).
2.3 Incubation experiments and the determination of denitrification rate
2.3.1 Simulated incubation under in-situ conditions
Collection of water samples for incubation experiments was modified from Chang et al. (2014)’s manipulation, with the samples transferred directly from rosette-bottles into pre-vacuumed 300 mL aluminum foil gas-tight sampling bags (BKMAM®), overfilled twice the volume to avoid air pollution. The microbial N removal processes (including denitrification and anammox) in water were synchronously traced using two isotopic labelling treatments, i.e., 15NO3-N and 15NH4-N+14NO2-N tracers, as a comparison (Holtappels et al., 2011). To maintain in situ levels of DO in water, K15NO3 (≥ 98.0% 15N, Sigma-Aldrich) or 15NH4Cl (99.0% 15N, Sigma-Aldrich) + Na14NO2 stock solution was added 5~10 μL separately into each of the two sets of aluminum foil bags via a micro-syringe following previous protocols without purging initially (Jensen et al., 2009; Bulow et al., 2010; Hietanen et al., 2012), with the final 15N abundance to be 5~10% in culture system. The water samples were incubated dark in a thermostatic oscillator to simulate in-situ water body environment of each sampling layer. At 0 h, 6 h, 12 h, 24 h, and 48 h timepoints, respectively, aliquots (10 mL) of water sample were transferred from the incubating bags to 12 mL Exetainer vials (Labco®) pre-aerated with He gas (99.999% purity), and 10 μL of saturated ZnCl2 solution was added to stop microbial activity. The vials were sealed by 2-mm butyl rubber septa in screw caps. To avoid contact with atmosphere, all the samples were parafilm membrane sealed and refrigerated (4°C) under water before determination (Zeng et al., 2018). All incubations were carried out in triplicates with duplicates at each timepoint.
2.3.2 Simulated incubation by deoxygenating amended
After collecting in pre-vacuumed 300 mL aluminum foil gas-tight sampling bags, the seawaters were degassed with He gas (99.999% purity) for 10~15 min prior to incubation to simulate hypoxic environment. Technically, high-pure He was introduced into the aluminum foil bag containing water sample through a polyvinyl chloride (PVC) tube connected to the valve inlet, and the background dissolved N2 and O2 were expelled from the valve outlet. After purging, K15NO3 or 15NH4Cl+Na14NO2 solution (5~10 μL) was injected separately into two sets of sampling bags with the final 15N abundance to be about 5~10%. And then, the amended seawater samples were incubated and preserved following the procedure described in Section 2.3.1 above.
2.3.3 Incubations of denitrifying NO3-N uptake kinetics
In this study, the seawaters of 700 m and 1000 m depths from two central basin sites (i.e., sta. S-7 and sta. S-30) were also chosen to explore the characteristics of NO3-N uptake kinetics by potential denitrification. Since the concentration of NO3-N in the SCS waters deeper than 500 m in the SCS is generally above 20 μmol/L (Chen et al., 2001; Wong et al., 2007), which is much higher than the documented typical half-saturation constant (Km) of denitrifying NO3-N absorption (Jensen et al., 2009; Dalsgaard et al., 2013), the Michaelis-Menten kinetic incubations cannot be performed directly through the NO3-N gradient setting. Therefore, a low 15NO3-N in-spike experiment was used to evaluate the uptake characteristics. The principle of this method is described in Section 2.3.5. In brief of procedure, after the seawaters being collected and deoxygenated following the procedure of Section 2.3.1, low K15NO3 tracer additions with 15N abundance between 0.05%~1.0% were set for incubations (Table 1) to detect the changes in the production rate of 15N-labeled N2 (29N2). Seawater samples were also split and preserved as Section 2.3.1.
2.3.4 Determinations of N2 isotopic composition and denitrification rate
When back to the land-based laboratory, incubated seawater samples stored in vials were priorly sonicated for 40 min at 40°C to equilibrate N2 between the headspace and solution. Compositions of 15N-labeled N2 species (29N2 and 30N2) in the headspace of vials were determined by a GasBench II system in combination with stable isotope ratio mass spectrometer (IRMS, DELTAPlus XP, Thermo Finnigan) (Zeng et al., 2018). The relative standard deviation of the measurement was less than 0.1%. The measured 15N-N2 was calibrated to eliminate background effects and the excess 29N2 and 30N2 were used to calculate the production of N2 (Zeng et al., 2014). Due to the failure detection of significant 29N2 production in the 15NH4-N+14NO2-N treatment incubations, this study disregards the potential contribution of anammox to N removal (Thamdrup et al., 2006; Hamersley et al., 2007; Bulow et al., 2010) and focuses exclusively on discussing the microbial denitrification process in the water body.
In 15NO3-N amended incubations, the denitrification rate could be calculated as Equation 1:
where R, r29 and r30 represent the production rate of total N2, 29N2 and 30N2 during incubation, respectively, and FN is the proportion of 15NO3-N in cultured system (Holtappels et al., 2011). The r29 and r30 were calculated by linear fitting of the 15N-N2 yielding at different incubation times. In order to eliminate the interference of 29N2 and 30N2 measurement errors on rate calculation, the final denitrification rate was obtained through arithmetic averaging as Equation 2:
The detection limit of the dissolved N2 measurement established in this study is 0.10 nmol N2/L. Therefore, a level of 0.10 nmol N2/L/d is regarded as the minimum detection threshold for denitrification rates. That is, when the calculated rate is below this threshold, it is considered that denitrification has not occurred (incubation rate data are available in the Supplementary Data Sheet).
2.3.5 Characterization of NO3-N uptake kinetics
As described in Section 2.3.4, the relationship between denitrification rate (R) and 29N2 production (r29) satisfies:
Meanwhile, according to the Michaelis-Menten equation, there is:
where Rmax represents the maximum denitrifying N2 production rate when NO3-N substrate supply is not limited; Km denotes the half-saturated constant of denitrification to NO3-N absorption; [S] is the bulk NO3-N concentration within incubating system.
Combining Equation 3 and 4 would obtain below:
Here [14N] and [15N] are used to denote the concentrations of 14NO3-N and 15NO3-N in system, respectively. Then it should deduce that under low 15NO3-N tracing treatment (FN<1%), the 15N proportion can be approximated by Equation 6:
and Equation 5 can be simplified as:
In Equation 7, Rmax, Km and [14N] could all be regarded as constants for a specific incubation, which means that under low 15NO3-N addition, the r29 against 15NO3-N concentration conforms a first-order kinetic pattern. Based on the correlation, the apparent first-order kinetic coefficient (k) of potential microbial denitrification in each sampling layer can easily be quantified via linear regression between r29 against [15N] (uptake kinetics data are available in the Supplementary Data Sheet).
2.4 Molecular biological analysis of denitrifying metabolism
2.4.1 DNA sampling and extraction
To characterize the typical functional genes of denitrification as well as their abundance in the SCS basin, about 4 L of seawater collected from each layer was filtered with 0.2 μm pore size polycarbonate membrane (Millipore, Ф = 47 mm) to enrich the environmental DNA samples. The membranes were frozen in liquid N priorly and then transferred to -80°C until further analysis. Total DNA was extracted from the particle samples in seawater with the PowerSoil DNA Isolation Kit (MO BIO Laboratories) according to the manufacturer’s protocol. The DNA was quantified with a Qubit® 2.0 fluorometer (Life Technologies), and the quality was checked via gel electrophoresis.
2.4.2 Determination of functional genes abundance
The extracted DNA was stained with SYBR GREEN method, and the characteristic functional genes narG (encoding NO3-N reductase) and nirS (encoding NO2-N reductase) of denitrification were determined by fluorescence quantitative PCR (qPCR). The specific procedures are as follows: the PCR-amplified bands containing the target gene narG and nirS were cloned as templates, then the plasmid DNA was extracted. A 10-fold dilution was performed to establish standard curves. Fluorescence quantitative analysis of functional genes narG and nirS were conducted using the extracted total DNA as a template. The primer pairs for narG were narG-1960m2f/narG-2050m2r (Lópezgutiérrez et al., 2004) and for nirS were Cd3aF/R3cd (Jarvis et al., 2004). The PCR amplification protocol included: denaturation (95°C/5 min), annealing (95°C/15 s), extension (60°C/30 s), and 40 cycles. The PCR reaction system (40 μL of total volume) comprised 20 μL of mixture A (18 μL of 2×SYBR real-time PCR premixture and 1 μL each of forward and reverse primers), 10 μL of diluted DNA template, and 10 μL of sterile distilled water. Sterilized seawater was taken as the negative control, and each sample was analyzed in triplicate. Quantitative analysis exhibited a reliable performance. For gene narG, the amplification efficiency of was 98.5%, with a standard curve R2 of 0.999 and a detection limit of 50 copies/mL. For gene nirS, the amplification efficiency of was 99.8%, with a standard curve R2 of 0.998 and a detection limit of 10 copies/mL (analytic raw data of functional genes are available in the Supplementary Data Sheet).
2.5 Statistical analysis
The stations mapping, statistical analysis, and data visualization were performed using ODV 7.5, SPSS 26.0, and Origin 10.0 software, respectively. In this study, the Shapiro-Wilk test was applied to assess the normality of experimental data, while Levene’s test was used to evaluate the homogeneity of variances. The significant differences between simulated incubation groups, the spatial distribution of environmental factors and the correlation coefficients of regressions were all tested via one-way ANOVA. When either test indicated a violation of the ANOVA assumptions (p < 0.05), significance was evaluated using the Kruskal-Wallis test, followed by the Wilcoxon test for post-hoc comparisons. Independence of observations was guaranteed by the randomized block design and confirmed by plotting residuals against predicted values; no discernible patterns or temporal autocorrelation were detected. Outliers with studentized residuals > 3 were examined and retained only when measurement errors could be ruled out. A significant threshold of p < 0.05 was used in all analyses. Correlations between variables were determined using Principal Component Analysis (PCA), Redundancy Analysis (RDA), and Spearman’s rank correlation analysis. To account for multiple comparisons, false discovery rate (FDR) adjustment was applied using the Benjamini-Hochberg procedure to all pairwise correlation tests, with an FDR-adjusted q-value threshold of 0.05 considered statistically significant.
3 Results
3.1 Spatial distributions of DO and NOx
The DO profiles of five sampling stations showed a consistent vertical pattern (Figures 2B, C). In the surface waters, there was a sharp DO decline to 120~130 μmol/L with a saturation of about 50%. In the subsurface waters, DO concentrations and saturations continued to decrease with depth but gradually. The typical DO minimum occurred in intermediate waters at 700~800 m, with the lowest DO concentrations among stations ranging between 78.8~90.6 μmol/L and the saturation at 25.3~28.7% level. Below this depth, DO exhibited a gradual increasing trend. The vertical DO pattern observed in our cruise was consistent with the previous reports (Gong et al., 1992; Li and Qu, 2006; Liu et al., 2011). Horizontally, both DO concentrations and saturations displayed an overall increasing trend from north to south among five stations.
Figure 2
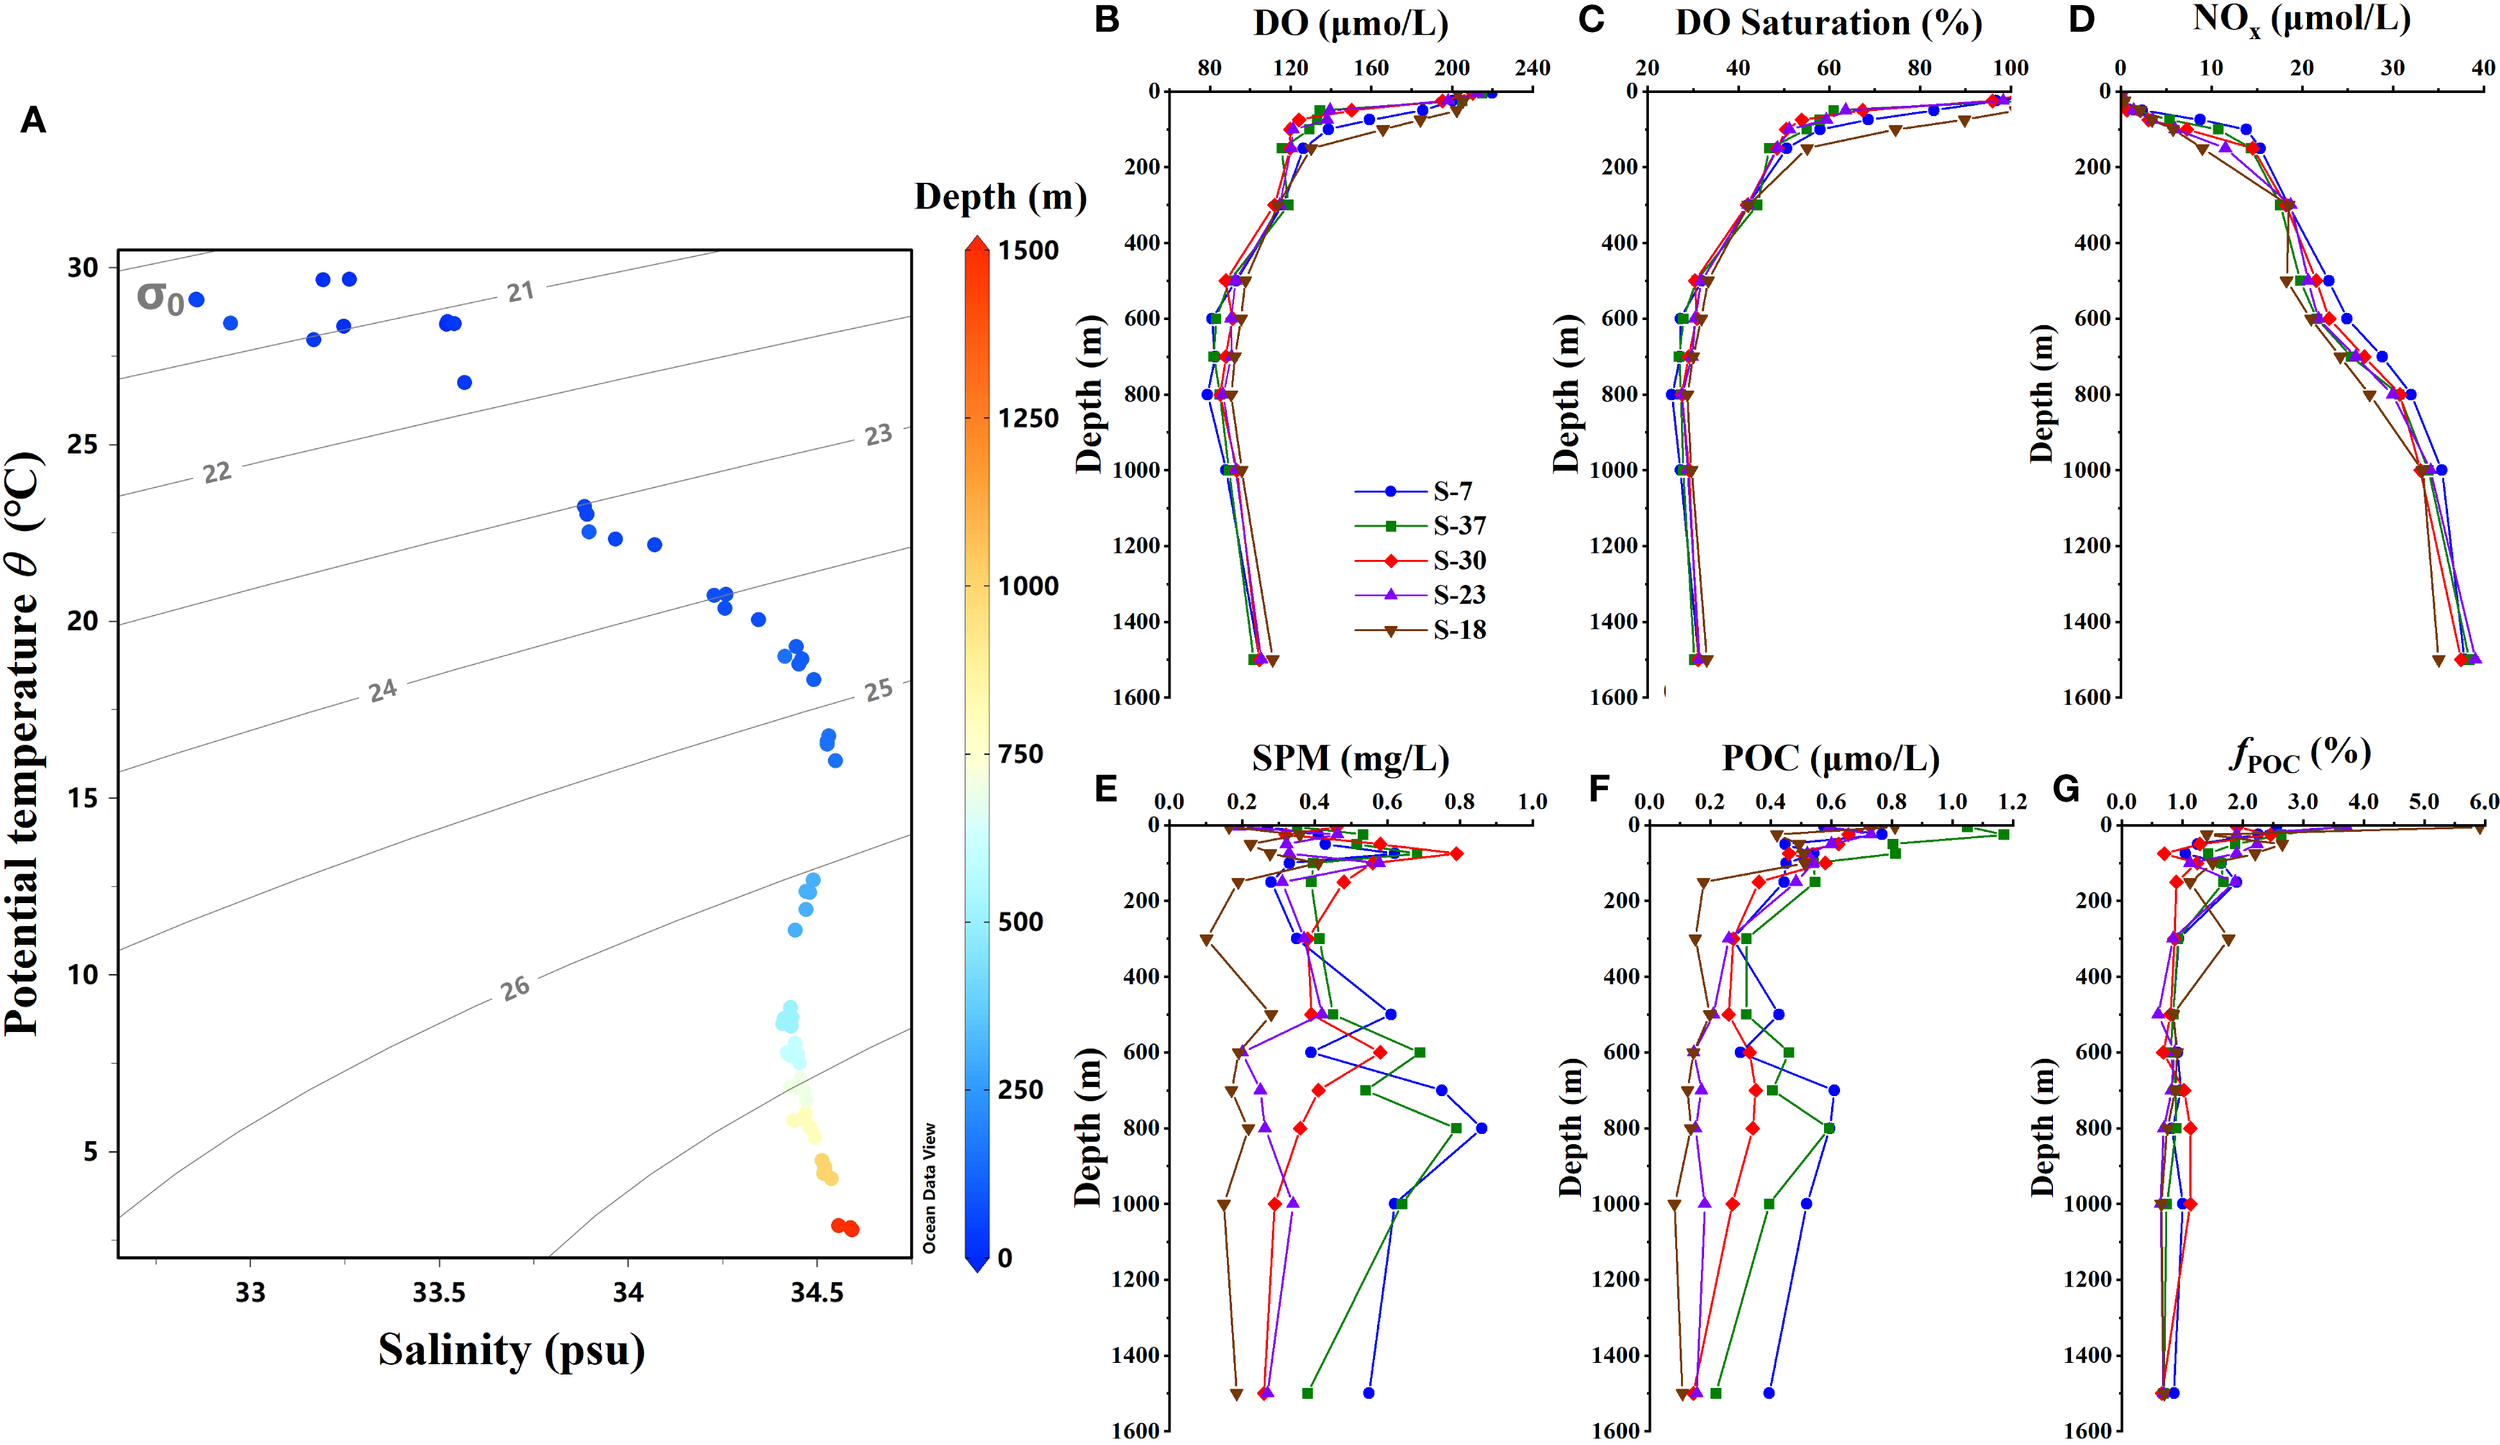
Distributions of hydro-chemical parameters across sampling stations. (A)θ-S diagram throughout the upper 1500 m depth; (B) Profiles of dissolved oxygen; (C) Profiles of dissolved oxygen saturation; (D) Profiles of total NO3-N + NO2-N in waters; (E) Profiles of suspended particulate matter; (F) Profiles of particulate organic matter; (G) Profiles of organic fraction in particulate matter.
The NOx concentrations increased with depth, ranging from 0.00 to 13.83 μmol/L in surface water and 8.98 to 24.93 μmol/L in subsurface water, both showing a spatial variance of higher in the north and lower in the south. While in the intermediate layers, NOx varied between 21.97 and 31.25 μmol/L with less variation across depths, and no significant differences were observed among sampling stations (Figure 2D) (ANOVA test, p > 0.05).
3.2 Spatial patterns of SPM and POC
During the sampling period, the SPM content across all stations ranged from 0.10 to 0.86 mg/L, with a pulse increase in each water layer (Figure 2E). An obvious SPM peak in the surface layer appeared at 75~100 m depths, with a content between 0.41~0.79 mg/L. In subsurface layer, a slight increase was observed at 500~600 m, with the content between 0.28~0.69 mg/L. In the intermediate layer, the peak appeared at depths of 800~1000 m, showing a larger variation among stations (0.22~0.87 mg/L). The POC concentrations in water column ranged from 0.08 to 1.17 μmol C/L. Vertically, all stations showed higher POC in surface waters and lower contents in subsurface and middle layers (Figures 2F, G). Although less pronounced than SPM, slightly elevated POC were still observed at depths of 500~600 m and 700~800 m across stations. The increased loading both of SPM and POC in the subsurface and intermediate waters implies potential contributions from external inputs within these two layers. Horizontally, both SPM and POC concentrations among stations generally exhibited a decreasing trend from north to south.
3.3 Denitrification rate in the water column
To ensure the reliability of denitrification rate measurements and exclude possible misinterpretation caused by detecting bias, data validation was conducted based on formula (1) in Section 2.3.4. If N2 only derived from microbial denitrification in the incubation system, the metabolism rates (R) calculated from r29 and r30 should be coincident. Regression analysis revealed that the N2 production rates calculated from r29 and r30 of all incubations followed a 1:1 linear relationship (R2 = 0.997, p < 0.001) (Figure 3A). This confirms that the detected 29N2 and 30N2 in the incubation system were exclusively derived from denitrifying yield (Hamersley et al., 2007; Holtappels et al., 2011).
Figure 3
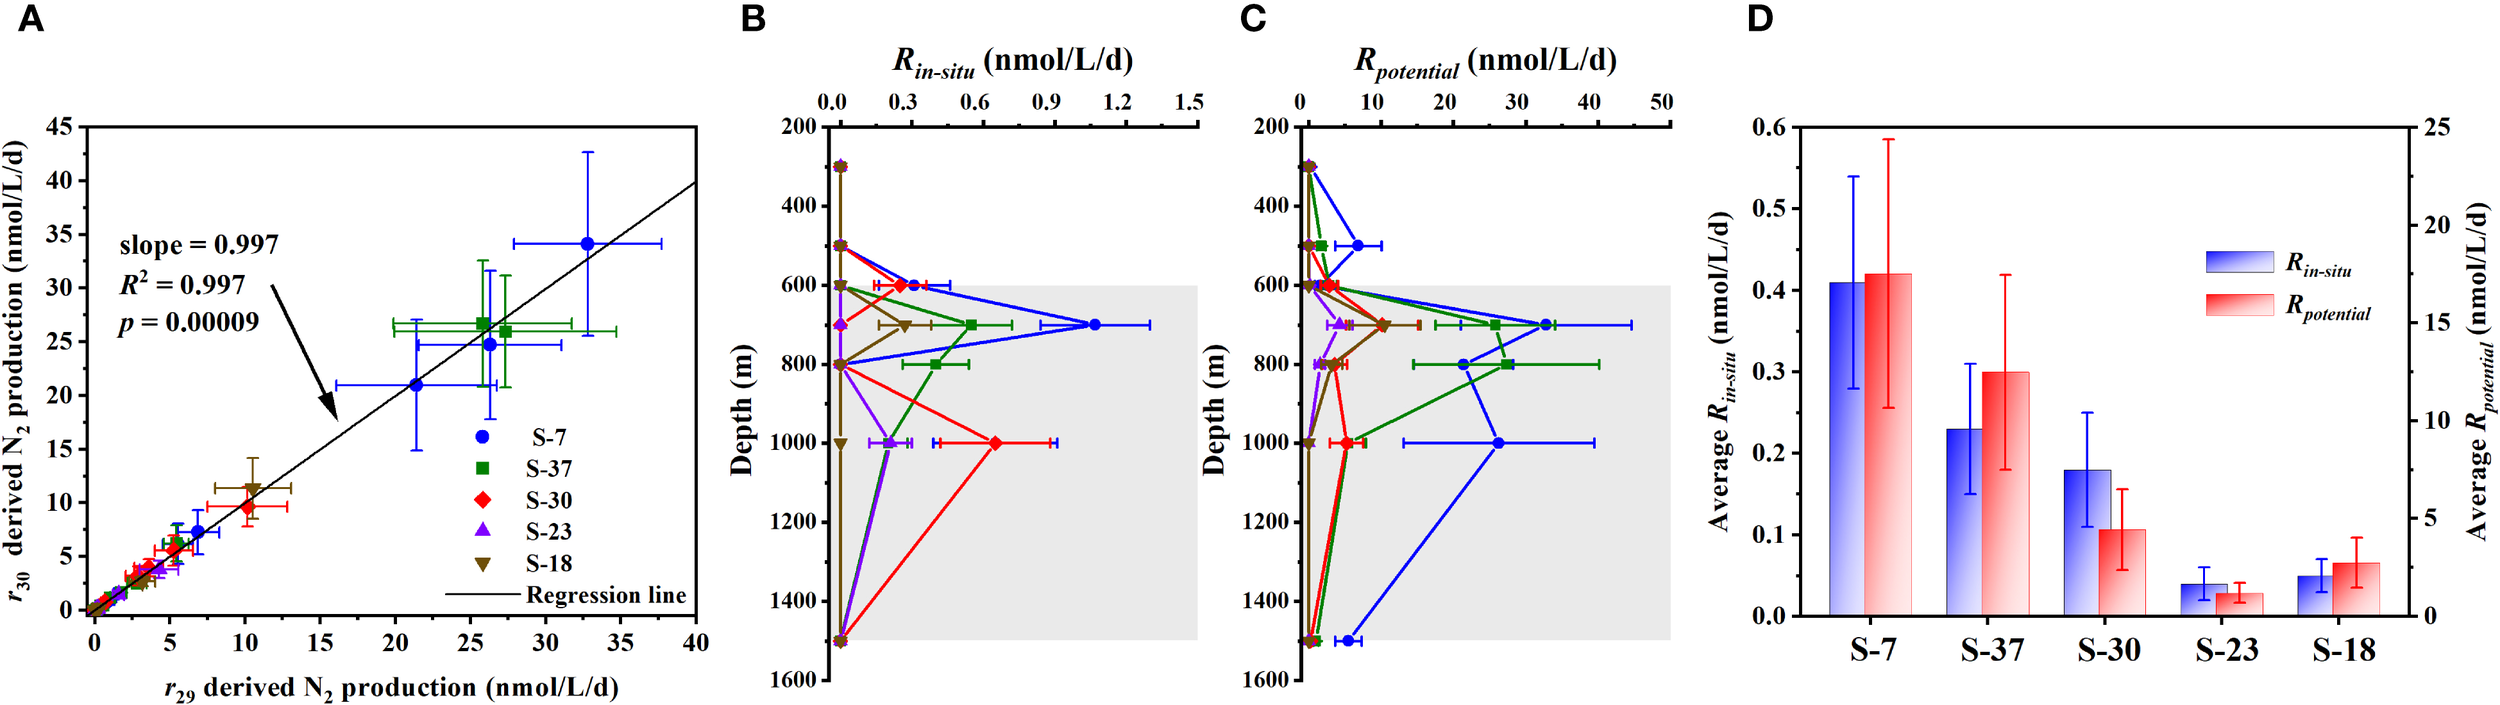
Data validation and spatial pattern of incubated denitrification rates across sampling stations. (A) Linear relationship between 29N2 production (r29) and 30N2 production (r30) considering all incubations during the cruise; (B, C) Vertical distributions of denitrification rates under ambient DO levels (Rin-situ) and deoxygenated conditions (Rpotential) throughout the sampling water column; (D) Comparison of average denitrification rates variation among different stations. Gray areas in (B, C) represent the intermediate water layer.
Under in-situ DO condition of the seawaters, the N2 production above detection limit only accounted for 28.6% of all incubations. The detected rates (referred to as Rin-situ hereafter) ranged from 0.20 ± 0.08 to 1.07 ± 0.23 nmol N2/L/d (Table 2), and all the N2 productions observed were confined in the intermediate layer (Figure 3B). Among stations, the average Rin-situ within 600~1500 m depths differed significantly (ANOVA test, p < 0.05), exhibiting a decreasing trend from north to south (Figure 3D). The highest mean Rin-situ was observed at Sta. S-7 (0.41 ± 0.13 nmol N2/L/d), while the lowest level occurred at Sta. S-23 (0.03 ± 0.01 nmol N2/L/d).
Table 2
| Depth(m) | Incubated denitrification rates (nmol N2/L/d) | |||||||||
|---|---|---|---|---|---|---|---|---|---|---|
| S-7 | S-37 | S-30 | S-23 | S-18 | ||||||
| R in-situ | R potental | R in-situ | R potential | R in-situ | R potential | R in-situ | R potential | R in-situ | R potential | |
| 300 | n.d * | 0.27 ± 0.08 | n.d | n.d | n.d | n.d | n.d | n.d | n.d | n.d |
| 500 | n.d | 6.86 ± 3.22 | n.d | 1.75 ± 0.61 | n.d | n.d | n.d | n.d | n.d | n.d |
| 600 | 0.31 ± 0.15 | 1.59 ± 0.78 | n.d | 2.82 ± 1.04 | 0.25 ± 0.11 | 2.87 ± 1.21 | n.d | 0.16 ± 0.05 | n.d | n.d |
| 700 | 1.07 ± 0.23 | 32.8 ± 11.8 | 0.55 ± 0.17 | 25.8 ± 8.26 | n.d | 10.2 ± 4.98 | n.d | 4.29 ± 1.76 | 0.27 ± 0.11 | 10.5 ± 4.74 |
| 800 | n.d | 21.4 ± 6.85 | 0.40 ± 0.14 | 27.3 ± 12.8 | n.d | 3.59 ± 1.72 | n.d | 1.57 ± 0.72 | n.d | 3.18 ± 1.46 |
| 1000 | 0.65 ± 0.26 | 26.3 ± 13.2 | 0.20 ± 0.08 | 5.43 ± 2.50 | 0.65 ± 0.23 | 5.26 ± 2.31 | 0.21 ± 0.09 | n.d | n.d | n.d |
| 1500 | n.d | 5.53 ± 1.82 | n.d | 1.02 ± 0.32 | n.d | 0.26 ± 0.13 | n.d | n.d | n.d | n.d |
Measurements of denitrification rate in the SCS basin under ambient DO levels and deoxygenated conditions.
*n.d denotes the measurement below detection limit.
In contrast, significant N2 production under deoxygenating amended was much more pervasively observed, accounting for 65.7% of incubations. The measured potential denitrification rates (referred to as Rpotential hereafter) ranged from 0.16 ± 0.07 to 32.8 ± 11.2 nmol N2/L/d, higher by 1~2 orders of magnitude than Rin-situ (Table 2). Except for the 300 m and 500 m at Sta. S-7 and Sta. S-37, detected potential denitrification all occurred in the intermediate waters (Figure 3C). Notably, much higher Rpotential compared to other sampling depths was observed at 700 m and 800 m across all stations, suggesting some favorable conditions for denitrification performance within these two water layers. Similar to the spatial pattern of Rin-situ, the Rpotential showed a marked horizontal variability by decreasing from north to south also (Figure 3D). The mean Rpotential across 600~1500 m depths was highest at Sta. S-7 (17.5 ± 6.7 nmol N2/L/d) and lowest at Sta. S-23 (1.20 ± 0.51 nmol N2/L/d). It implies that specific mechanisms within the basin may sustain microbial denitrification potential.
3.4 Abundances of functional genes narG and nirS
As key functional genes involved in microbial denitrification, both narG and nirS genes were detected through the 300~1500 m depths during our cruise (Figures 4A, B), which provided a biological basis for the prevalent denitrifying potential observed in the SCS waters. The abundance of narG and nirS ranged from 0.55×10⁵ to 12.5×10⁵ copies/L and 0.14×10⁴ to 5.51×10⁴ copies/L, respectively. There is a significant linear correlation between these two genes (Figure 4C), suggesting a synergistic operation of nitrate reduction (narG-mediated) and nitrite reduction (nirS-mediated) in shaping denitrification potential of the basin waters, while nitrate reduction likely plays a dominant role. Vertically, both the genes exhibited depth-dependent variations, with peak abundances focused on 700~1000 m depths across stations (Figures 4A, B). Horizontally, there was also a notable north-south gradient, with Sta. S-7 and Sta. S-37 bearing higher abundance compared to the other three stations (Figure 4D). The spatial distributions of these two functional genes further indicate probable differences in the community structure of denitrifying microorganisms across the study area.
Figure 4
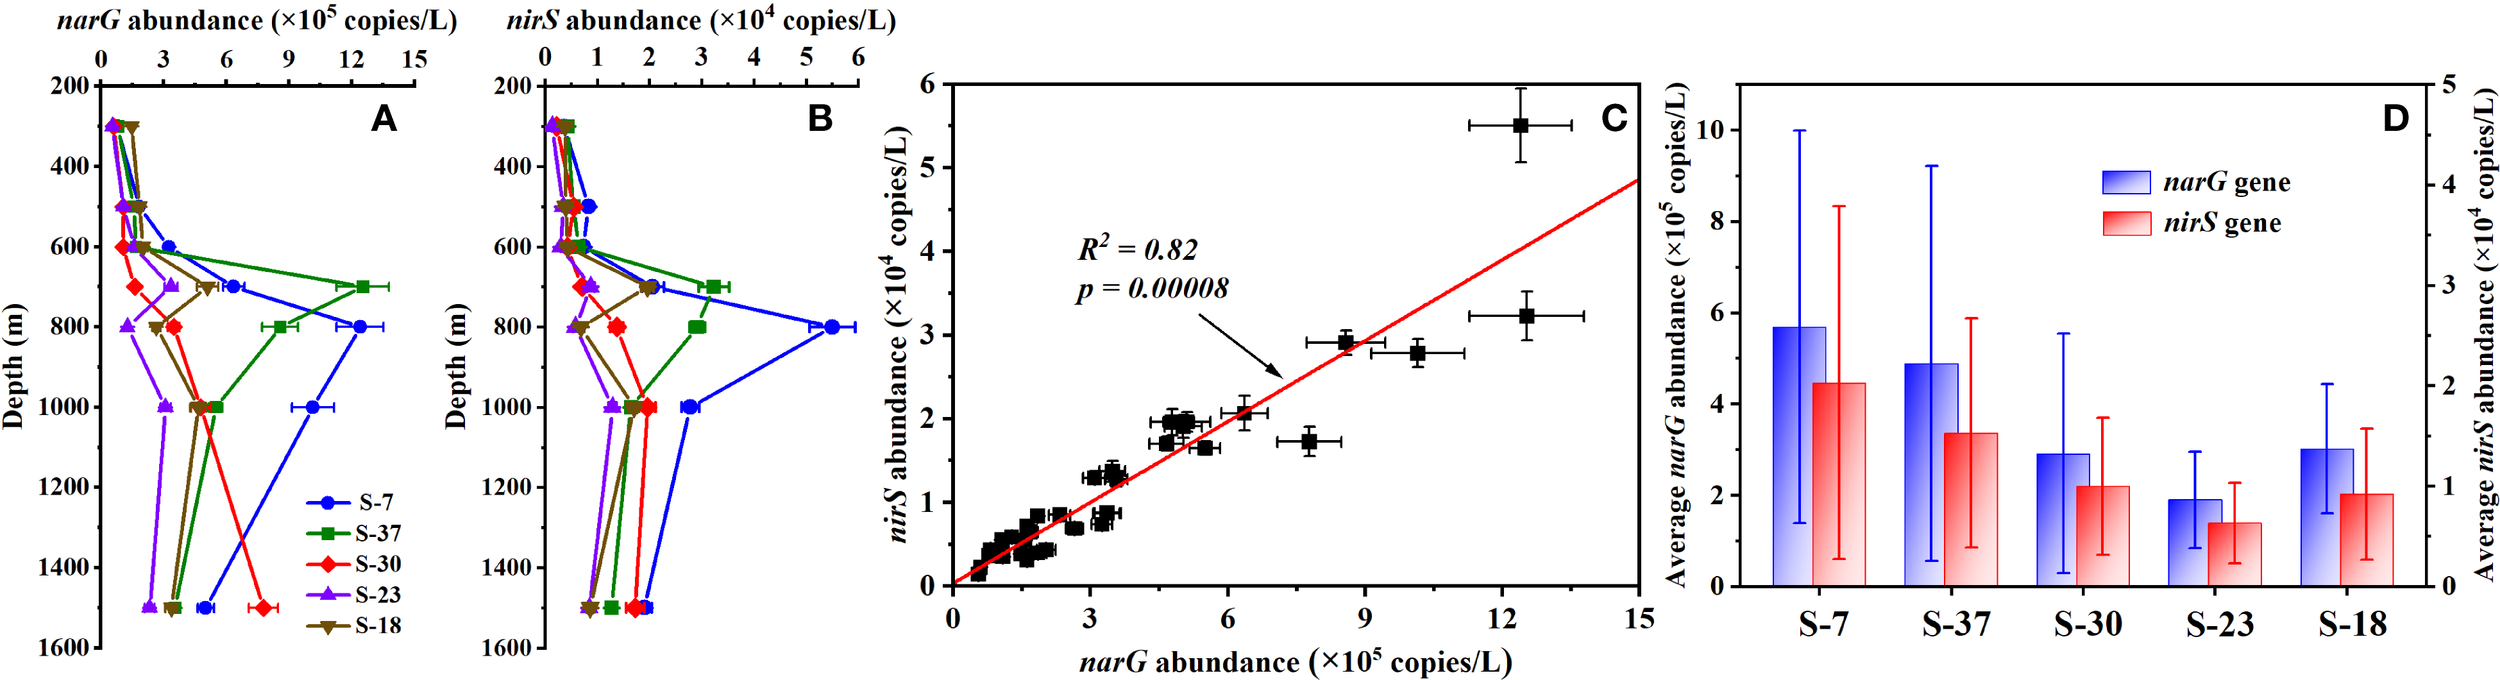
Spatial pattern of functional genes narG and nirS across sampling stations. (A, B) Vertical distributions of narG and nirS genes abundances within 300~1500 m depths; (C) Correlation analysis between narG and nirS abundances; (D) Variation of average two functional genes abundance among different stations.
3.5 Kinetics of NO3-N uptake by potential denitrification
Characterization of NO3-N uptake kinetic experiments revealed a linear increase of 29N2 production rates (r29) against the corresponding K15NO3 in-spike gradients at each targeted sampling depth (Figure 5). According to formula (7) in Section 2.3.5, the apparent first-order kinetic coefficients (k) of denitrifying metabolism for 700 m and 1000 m at Sta. S-7 and Sta. S-30 were calculated (Table 3). The k values at both depths in Sta. S-7 were significantly higher than those at Sta. S-30, indicating spatial variability in the NO3-N utilization capacity of denitrifying microorganisms. If the measured Rpotential in each depth is considered as the NO3-N saturated denitrification rate [i.e., Rmax in formula (7)], then the corresponding half-saturated constants (Km) are derived (Table 3). In contrast to the coefficient k, the Km values varied non-significant (p > 0.05) among four depths, with an average of 2.41 ± 0.19 μmol/L, which suggests a consistent affinity of potential denitrifying metabolism to NO3-N substrate in the basin waters.
Figure 5
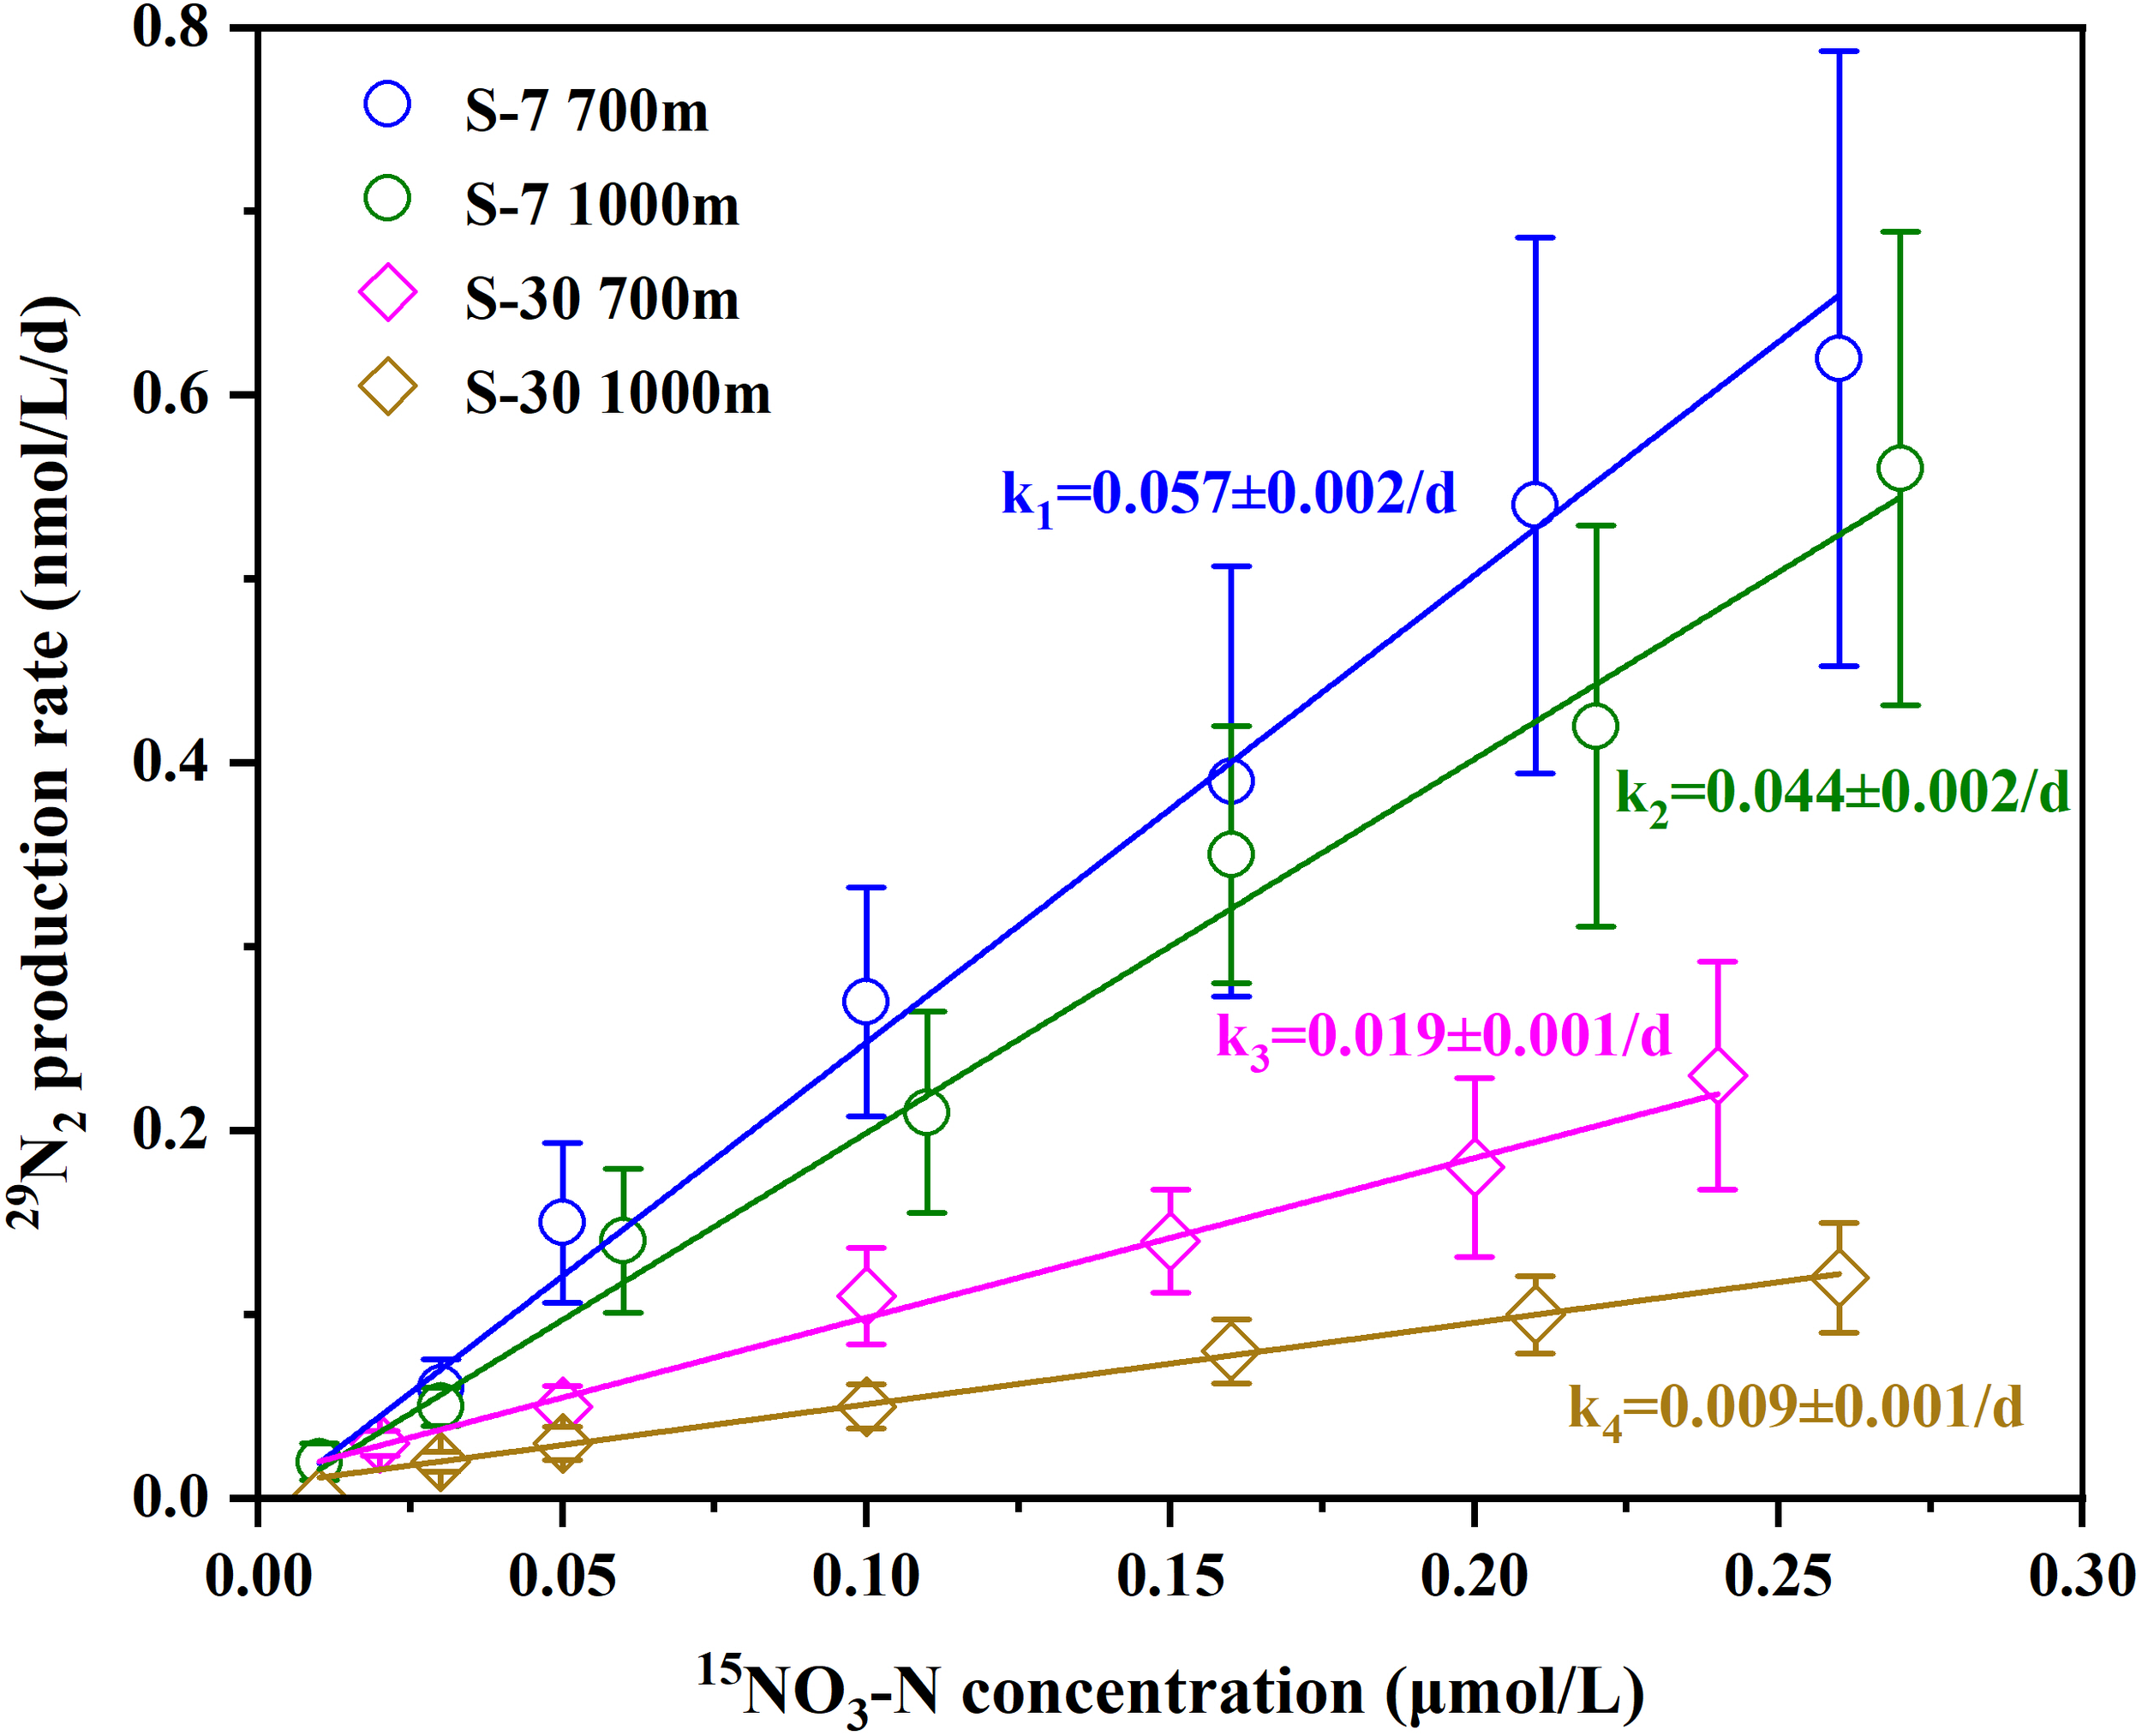
Denitrifying NO3-N uptake characterization with low 15NO3-N gradient in-spike modulating 29N2 production.
Table 3
| Station | Depth (m) | Apparent first-order kinetic coefficient k (d-1) | Half-saturated constant Km(μmol/L) |
|---|---|---|---|
| S-7 | 700 | 0.057 ± 0.002 | 2.32 ± 0.13 |
| 1000 | 0.044 ± 0.002 | 2.38 ± 0.15 | |
| S-30 | 700 | 0.019 ± 0.001 | 2.25 ± 0.09 |
| 1000 | 0.009 ± 0.001 | 2.68 ± 0.21 |
Calculations of kinetic constants of denitrifying NO3-N uptake across the basin waters.
4 Discussion
4.1 Induction of microbial denitrification in the SCS basin waters
During sampling period, detectable microbial denitrifying was pervasively observed in the subsurface and intermediate waters across the SCS basin, which have rarely been reported in previous studies. Although the Rin-situ incubated under ambient DO was relatively weak and the gene abundances were much lower, the denitrification potential rates Rpotential of the basin could reach a high level comparable to those measurements in oxygen-deficient waters (8~200 nmol/L/d; Jensen et al., 2009; Dalsgaard et al., 2013; Chang et al., 2014). Since lack of hypoxic condition in the water column, denitrifying metabolism was considered as negligible (Liu et al., 2002; Yang et al., 2017). That means unrecognized mechanisms remain to be revealed regarding the fixed-N removal within the basin. To better elucidate the inducing factors of observed potential denitrification, statistical analyses are conducted on the distributions and correlations among hydro-chemical parameters, incubation rates, and functional genes. PCA analysis reveals that the environmental factors and denitrification functions in the intermediate waters of northern stations (Sta. S-7 and Sta. S-37) significantly differed from other layers, characterized by low DO, high SPM loading, elevated denitrification rates and high functional gene abundances (Figures 6A, B). RDA and Spearman analyses further indicate marked negative correlations of denitrification rate and gene abundance against DO and its saturation, while denitrification rate correlates positively with both SPM and POC contents (Figures 6C, D). These findings highlight the dominant roles of DO and particulate matter in inducing the activity of denitrifying metabolism in the SCS basin waters.
Figure 6
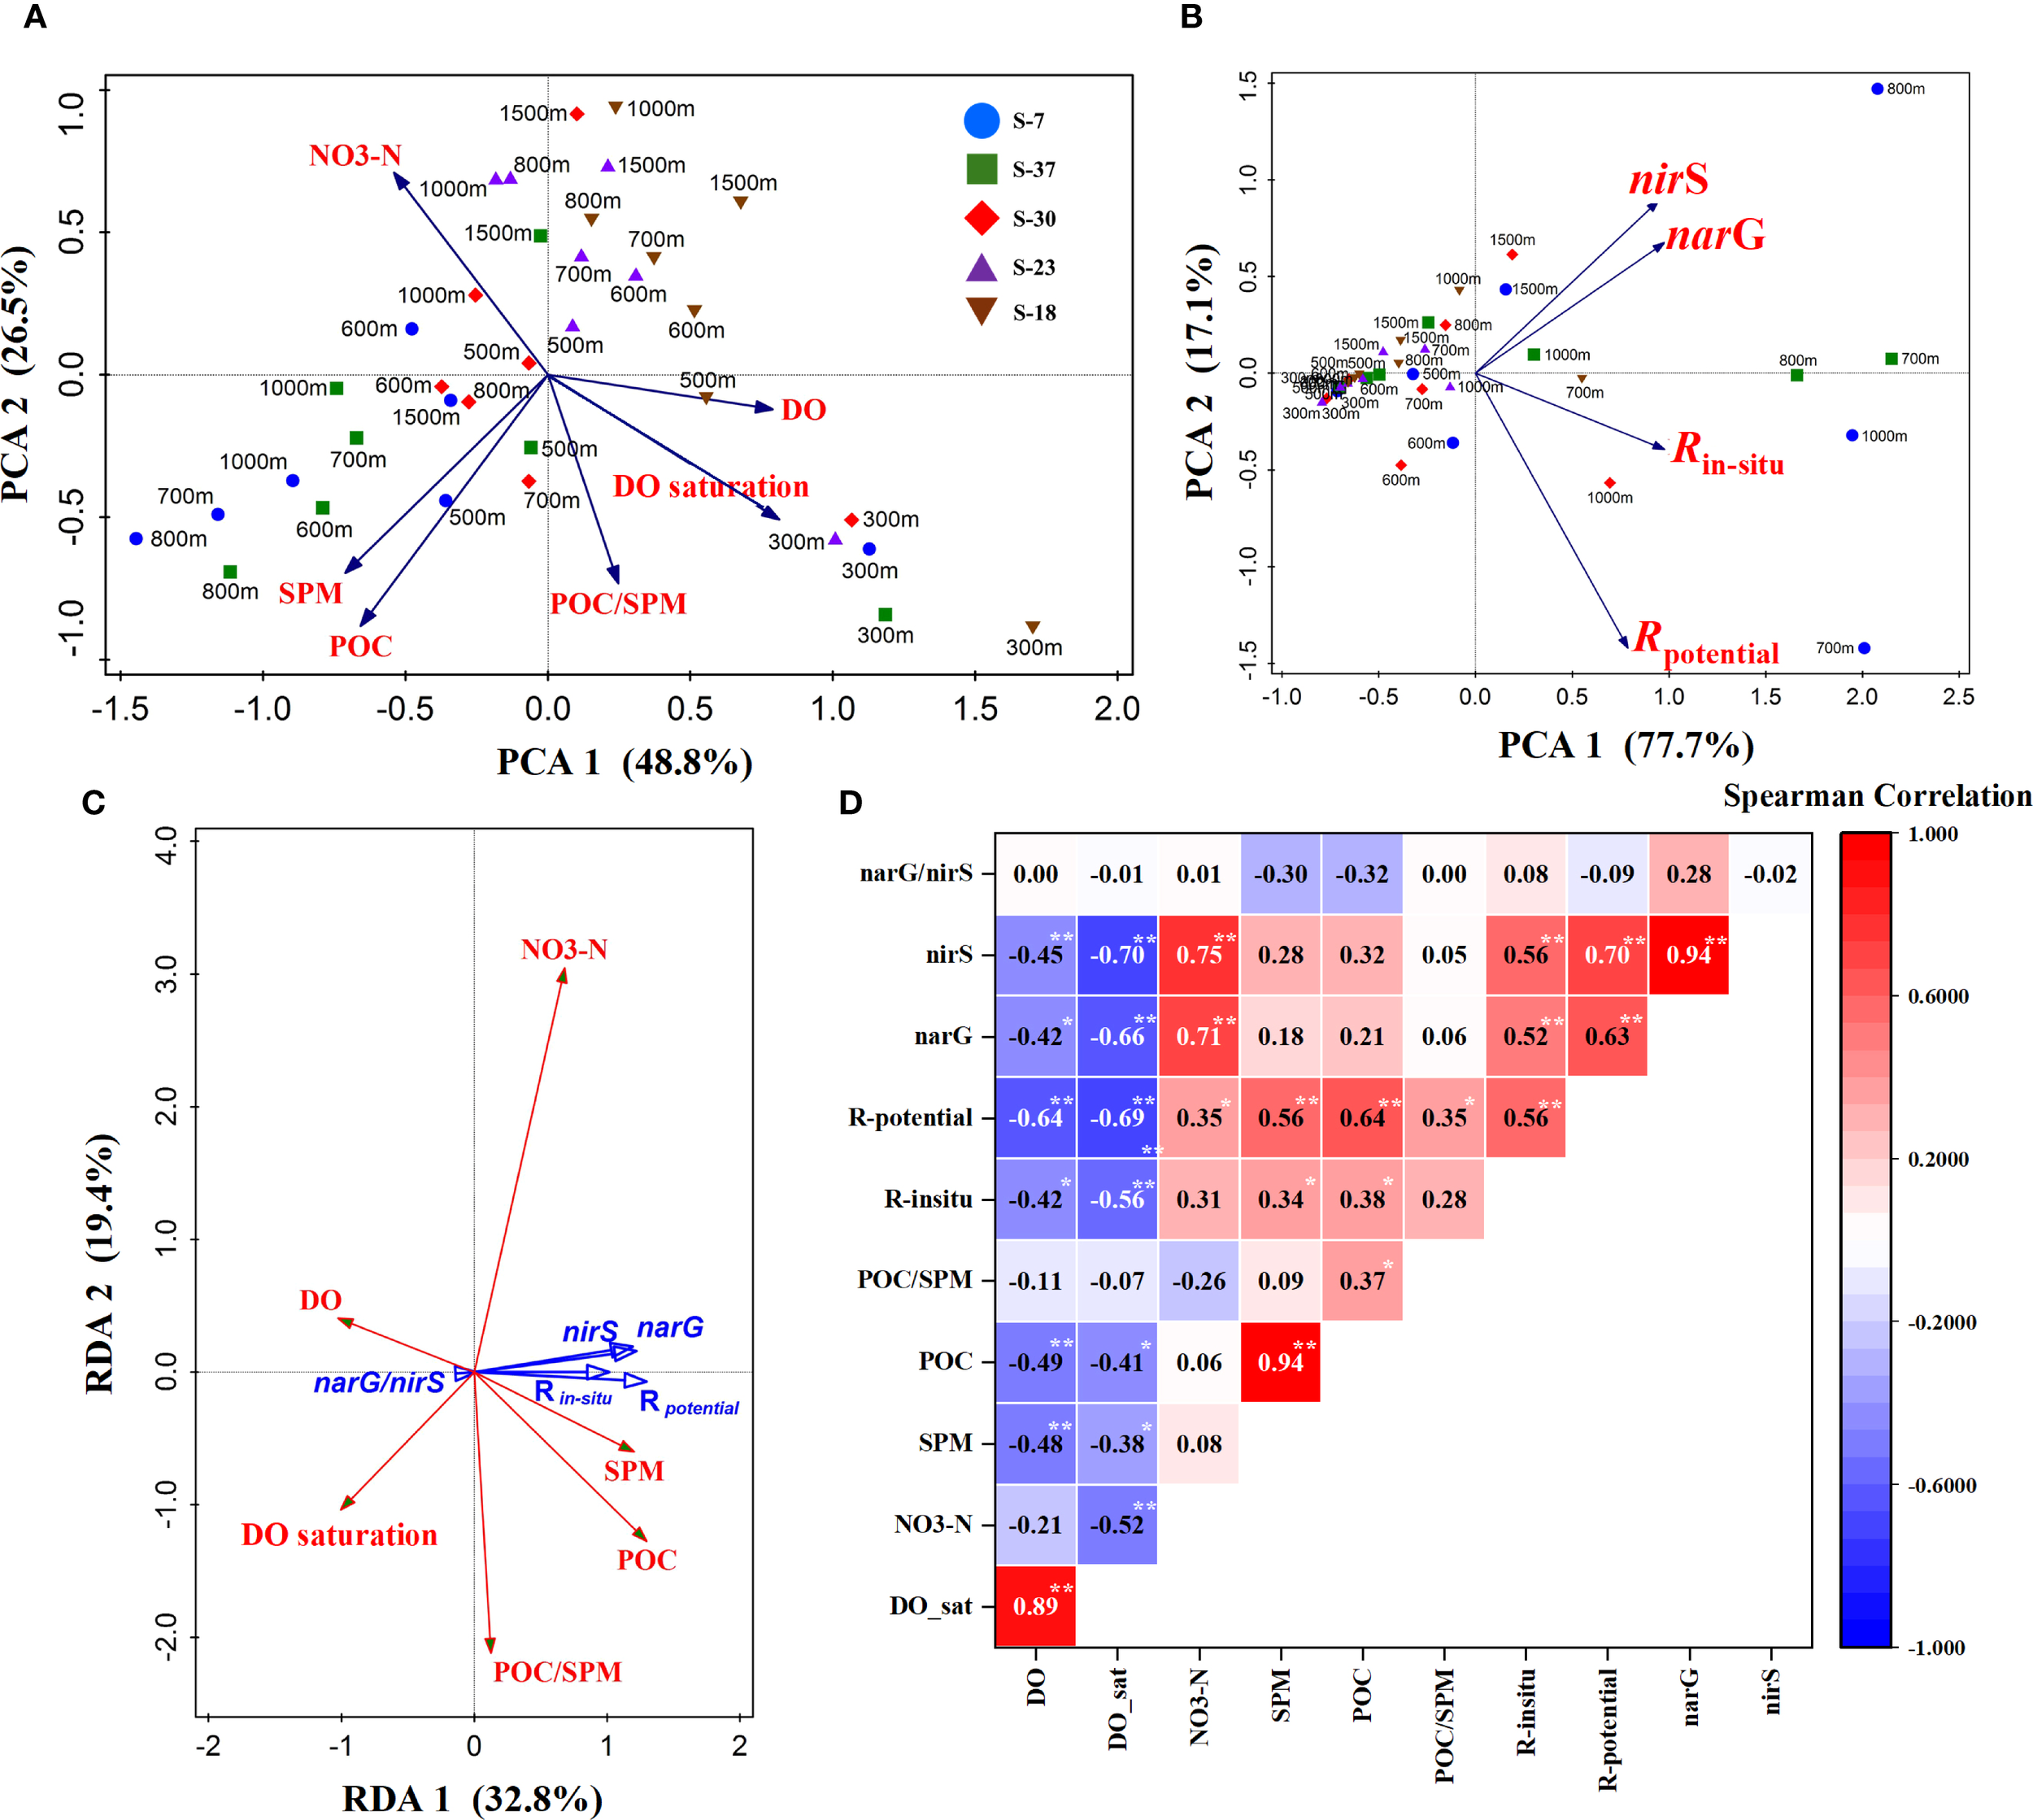
Statistical analysis of hydro-chemical and metabolic factors. (A, B) PCA analysis of environmental and metabolic factors across 300~1500 m depths, respectively; (C) RDA analysis of microbial metabolism and environmental factors; (D) Spearman correlation matrix of hydro-chemical factors, functional genes and metabolic rates (numerical label in diagram denotes the Spearman coefficient; *p < 0.05, **p < 0.01). POC/SPM and narG/nirS in the figure represent the mass fraction of organic carbon in SPM and abundance ratio of two genes, respectively (Spearman correlations data are available in the Supplementary Data Sheet).
Traditionally, microbial denitrification, as an anaerobic metabolic process, was believed to occur only under strictly hypoxic conditions (DO < 2 μmol/L) (Codispoti et al., 2001; Devol, 2008). Therefore, coastal hypoxic waters, pelagic ODZs and marine sediments have been well documented as primary regions for denitrification performance (Lam and Kuypers, 2011; Devol, 2015). However, the ambient DO level at subsurface and intermediate waters of the basin during cruise ranged between 80~120 μmol/L, far above typical hypoxic threshold. And even historical minimum DO records were as high as 65~75 μmol/L (Liu et al., 2011). Then there comes a query, that is whether the Rin-situ detected in this study resulted from oxygen depletion by microbial respiration in the incubation period? In previous report, the heterotrophic bacteria in the intermediate SCS waters were counted at about 2×10⁶ cells/L (Li et al., 2015). Adopting the representative microbial respiratory rate of 0.3 fmol O2/cell/d (Robinson, 2008), a simple arithmetic suggests that bacterial oxygen consumption over the 48-hours incubation would only be < 0.1 μmol/L, which is negligible compared to the ambient DO contents. And in fact, we also selected the 800 m and 1000 m of Sta. S-7 and measured the remaining DO concentrations within aluminum foil bags to be about 68 μmol/L after incubations. This reckoning thus rules out experimental interference from bacterial respiration and indicates the adaptation of denitrification to the oxygenated water environments. Actually, not a few denitrifying bacteria in nature exhibit facultative anaerobic metabolism, capable of tolerating a broad range of DO levels (Zumft, 1997). Earlier laboratory experiments have demonstrated that strains such as Pseudomonas nautica, Pseudomonas stutzeri, and Paracoccus denitrificans could turn to express denitrifying function when DO saturations below 70% (Bonin et al., 1989; Körner and Zumft, 1989). Based on incubations of coastal Namibia and Peru hypoxic waters, Kalvelage et al. (2011) revealed that nitrate reductase activity (mediating the NO3-N → NO2-N step in denitrification) persisted even at about 30 μmol/L oxygen level. In addition, some research also confirmed that in fluctuating redox environments (e.g., tidal zone) the DO tolerance threshold of denitrification could elevate to about 90 μmol/L (Gao et al., 2010). Intriguingly, N-cycling genera, including Halomonas, Idiomarina and Pseudoalteromonas, which have been identified with high denitrification efficiency and aerobic denitrifying potential, were recently isolated from the deep SCS basin (Wang et al., 2019; Chen et al., 2024). These findings provide critical biological evidence supporting the observed denitrification activity within the basin waters.
Apart from the adaptation of denitrifying bacteria to O2 tolerance, SPM in the water column is also one of the important ways to induce denitrification in non-hypoxic environments. Because of its large specific surface area and organic-rich composition, SPM is beneficial for the attachment and growth of aquatic microorganisms (Zhang et al., 2016; Bianchi et al., 2018; Balmonte et al., 2021; Wan et al., 2023). It is easy to generate hypoxic structures inside particles with severe aerobic respiration, thus creating ideal micro-niches for anaerobic metabolism by bacteria such as denitrification (Ploug, 2001; Xia et al., 2021). This phenomenon has been widely documented. For instance, laboratory simulations demonstrated active denitrification within organic polymer aggregates secreted from phytoplankton even under ambient DO levels higher than 100 μmol/L (Klawonn et al., 2015; Stief et al., 2016). Fuchsman et al. (2019) reported that spring phytoplankton blooms in the Black Sea basin triggered vigorous denitrification within the oxygenated subsurface layer (DO in the range of 30~50 μmol/L) due to elevated SPM inputs. Similarly, in the well-oxygenated Beibu Gulf, Zeng et al. (2018) observed pronounced denitrification in the bottom nepheloid layers driven by sediment resuspension. The detected high denitrification potential in our study consistently coincided with elevated SPM loads in sampling depths, which means SPM, as a carrier, might also play a pivotal role in activating denitrification metabolism within the SCS waters.
Obviously, both DO and SPM act as critical factors in inducing denitrifying function of the SCS seawaters. Regarding the incubation measurements, the Spearman correlations and significance levels of these two factors against Rin-situ as well as Rpotential showed no marked difference (Figure 6D), remaining it still difficult to discern the dominance between DO and SPM. While in terms of functional genes, DO exhibited a more significant correlation compared to SPM (Figure 6D). Furthermore, both narG and nirS abundances positively correlated with Rin-situ and Rpotential strongly (Figure 6D). Based on the above analyses, it could be speculated that low DO level likely prior induces the functional genes expression associated with anaerobic denitrifying metabolism in the basin waters. Then SPM further triggers enzymatic activity by providing available metabolic niches, and ultimately performs high denitrification potential. Since there was no pronounced correlation of narG/nirS ratio against either DO or SPM according to Spearman analysis (Figure 6D), the response of denitrifying functional structure to these two environmental factors remains unclear and deeper explorations are still necessary.
4.2 Relationship between SPM and potential denitrification in the basin waters
SPM not only provides favorable micro-environments for microbial N removal under non-hypoxic conditions, but also contributes the carbon source for heterotrophic metabolisms such as denitrification. Therefore, SPM serves as an important link for coupling micro-scale carbon and nitrogen cycles in aquatic ecosystems (Bianchi et al., 2018; Wan et al., 2023). In order to further elucidate the influence of SPM content and its composition on the denitrification function of the SCS basin, the intermediate water body (600~1500 m) with prominent potential denitrifying activity is focused for discussion below.
Linear and exponential fitting regressions were applied to analyze relationships of SPM and POC against to Rin-situ, Rpotential, narG and nirS gene abundances, respectively (Figure 7). The results showed that increased SPM and POC levels significantly enhanced functional genes expression and denitrification potential, consistent with observations across diverse aquatic systems, including rivers, estuaries, coastal zones, and pelagic oceans (Zeng et al., 2018; Fuchsman et al., 2019; Balmonte et al., 2021; Xia et al., 2021; Wan et al., 2023). It reflects a common modulatory role of particulate matter on denitrification and implies that particle-associated denitrifying bacteria may contribute more substantially to denitrification potential than their free-living counterparts within the basin waters (Jia et al., 2016; Zhang et al., 2016; Zeng et al., 2018; Li et al., 2021). Comparing the regressions among several scenarios, it is found that, on the one hand, both SPM and POC fit better with Rpotential and nirS abundance than fittings with Rin-situ and narG abundance (ANOVA test, p < 0.01). Since the interface of particles usually promotes the metabolic activity of microorganisms (Li et al., 2015; Klawonn et al., 2015; Balmonte et al., 2021; Wan et al., 2023), denitrification potential will exhibit stronger dependence on particulate matter and organic carbon under deoxygenated conditions. It suggests that when O2-inhibition relieved, the particulate matters will play a dominant role in modulating spatial pattern of denitrifying process. Thermodynamically, the Gibbs free energy of narG-mediated NO3-N to NO2-N reduction (△G0 = -244 kJ) is greater than that of nirS-mediated NO2-N to NO reduction (△G0 = -371 kJ) (Lam and Kuypers, 2011), which means a more electron donor (carbon source) demand of the latter step and thus explains the observed disparities in gene-specific regressions. On the other hand, exponential fittings in the regression analyses generally show superior goodness compared to linear ones (ANOVA test, p < 0.05), indicating complex nonlinear relationships between particulate matter and denitrification potential as well as functional genes expression. Notably, the influence of particulate matter on the denitrifying function is not solely mediated by its abundance. Previous studies have emphasized that particle size, compositional heterogeneity and organic carbon source collectively influence microbial denitrification activity on particles (Klawonn et al., 2015; Jia et al., 2016; Zeng et al., 2018; Fuchsman et al., 2019).
Figure 7
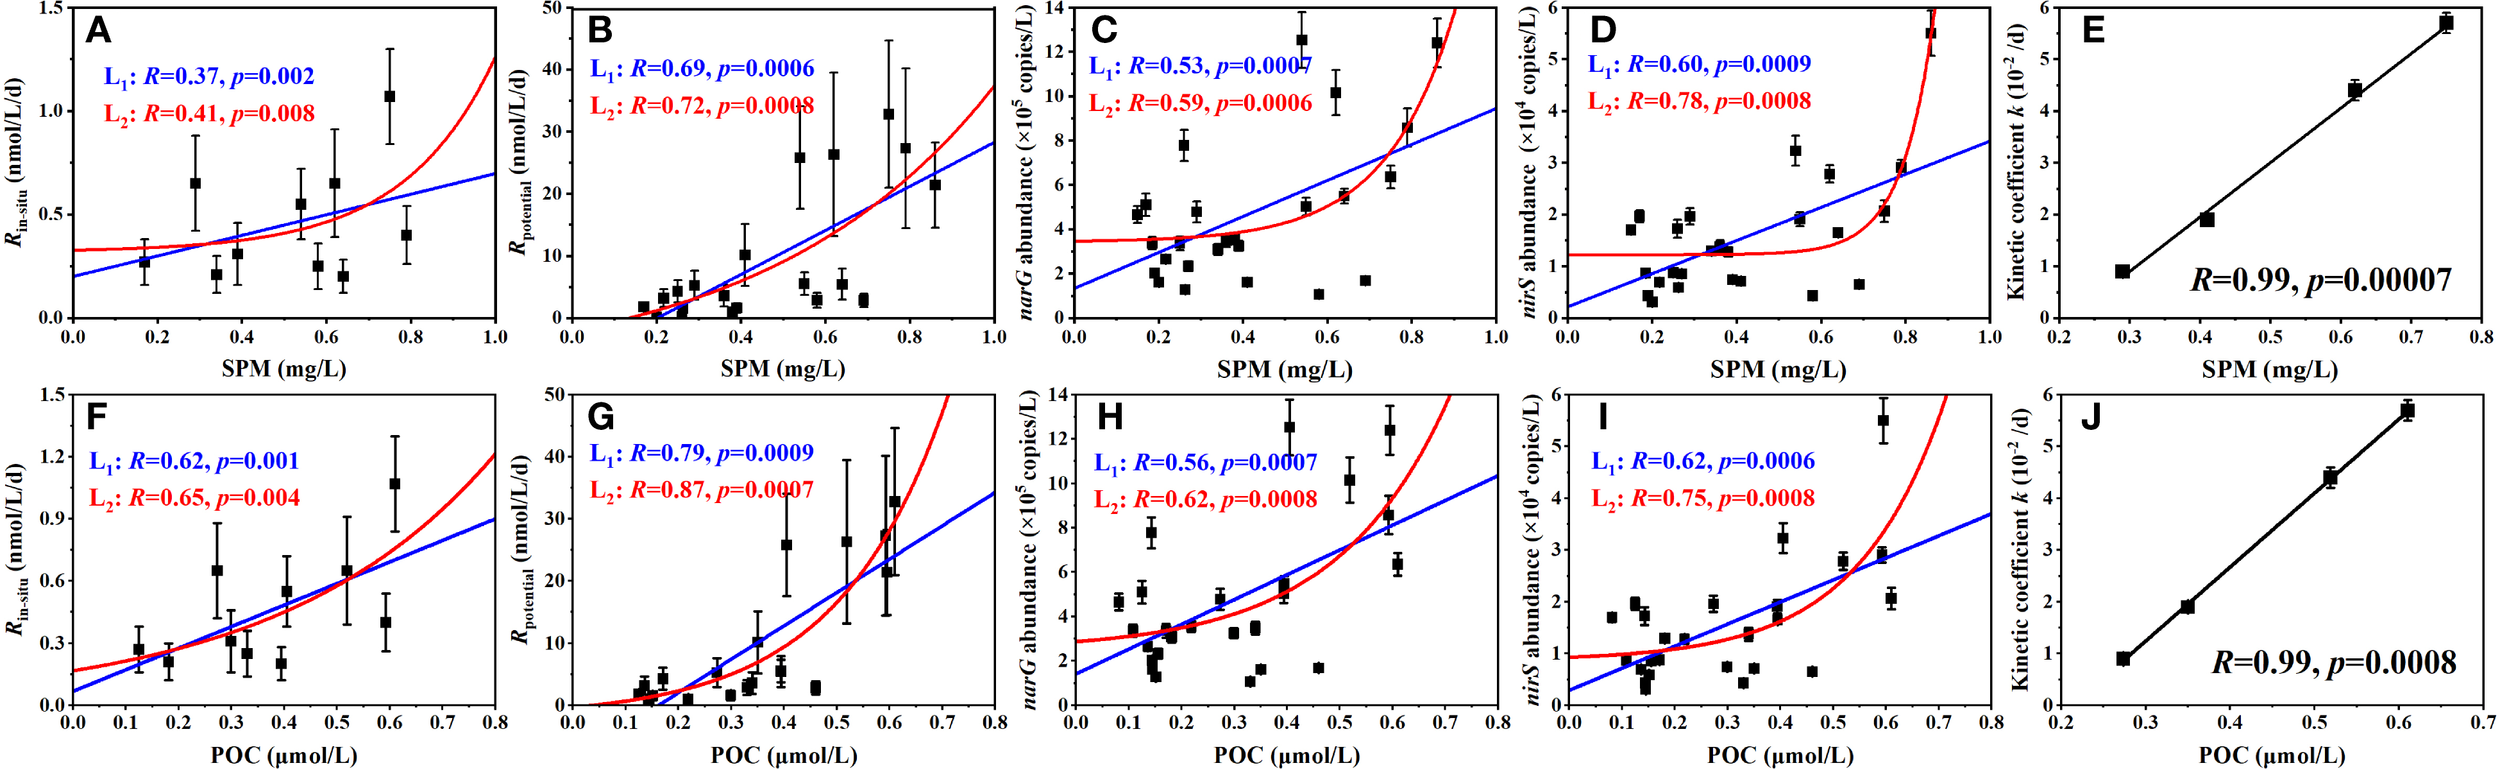
Regression fittings between microbial, metabolic factors and particulate matter content with (A–E) regarding SPM, (F–J) regarding POC. Blue and black lines in graph are regressions based on linear fitting, while red line is based on exponential fitting.
Worth mentioning, the high particulate loading observed in the intermediate waters during cruise was not an accident. According to former estimations, up to 7×10¹⁰ tons of terrigenous sediments annually from Luzon island in the east, mountainous rivers of Taiwan in the northeast, Pearl river runoff in the north, Red river in the northwest, Mekong river in the southwest as well as Malay Peninsula in the south, can be imported into the SCS basin (Liu et al., 2013; Schroeder et al., 2015). Driven by mid-depth circulation, these terrestrial materials are transported and dispersed for a long distance across the basin, resulting in widespread high particulate export features in the middle and deep of SCS waters (Liu et al., 2013; Schroeder et al., 2015; Wei et al., 2017; Ma et al., 2017). Moreover, during the summer southwest monsoon, intensified upwelling systems in the SCS (Chao et al., 1996; Liu et al., 2002) would enhance sediment resuspensions over the shelf and stimulate primary productivity in upper layers (Dippner et al., 2007; Liu et al., 2007). Concurrently, hydrological dynamics such as mesoscale eddies and typhoon events further amplify the vertical and lateral transport of SPM and POC into the deep basin (Wang et al., 2003; Kao et al., 2010). Sediment trap data also corroborated that summer SPM fluxes in the intermediate waters (1000~2000 m) increase prominently, accompanied by 1~2 fold elevations in POC input and organic matter degradability (Lahajnar et al., 2007). It can be inferred that favorable hydrodynamic conditions which sustain particulate and organic matters supply, likely contribute to maintaining the strong denitrification potential in the intermediate of SCS basin.
By comparison, it is found that the spatial trend of Rpotential as well as average functional genes abundances observed in our cruise is in good agreement with the pattern of sinking particle plumes, which were depicted by Schroeder et al. (2015) covering the whole SCS basin (Figure 8A). Synthesizing the above discussions, a preliminary conceptual framework of coupling between denitrification and SPM in the SCS basin is then proposed, as schematically described in Figure 8B. That is, the particulate matters from terrestrial or benthic sediments are priorly imported and dispersed across the basin-wide seawater driven by hydrodynamics, accompanied by the attachment of plentiful microorganisms. When transported to the intermediate waters, low ambient DO stimulates the expression of anaerobic denitrifying function and also facilitates hypoxic micro-niches creation in particles. Finally, the bacterial denitrifying metabolism is fueled with sufficient organic carbon supply. Although needing to be confirmed, the coupling framework provides a novel perspective for unraveling the mechanisms driving microbial N removal in non-hypoxic marginal basins.
Figure 8
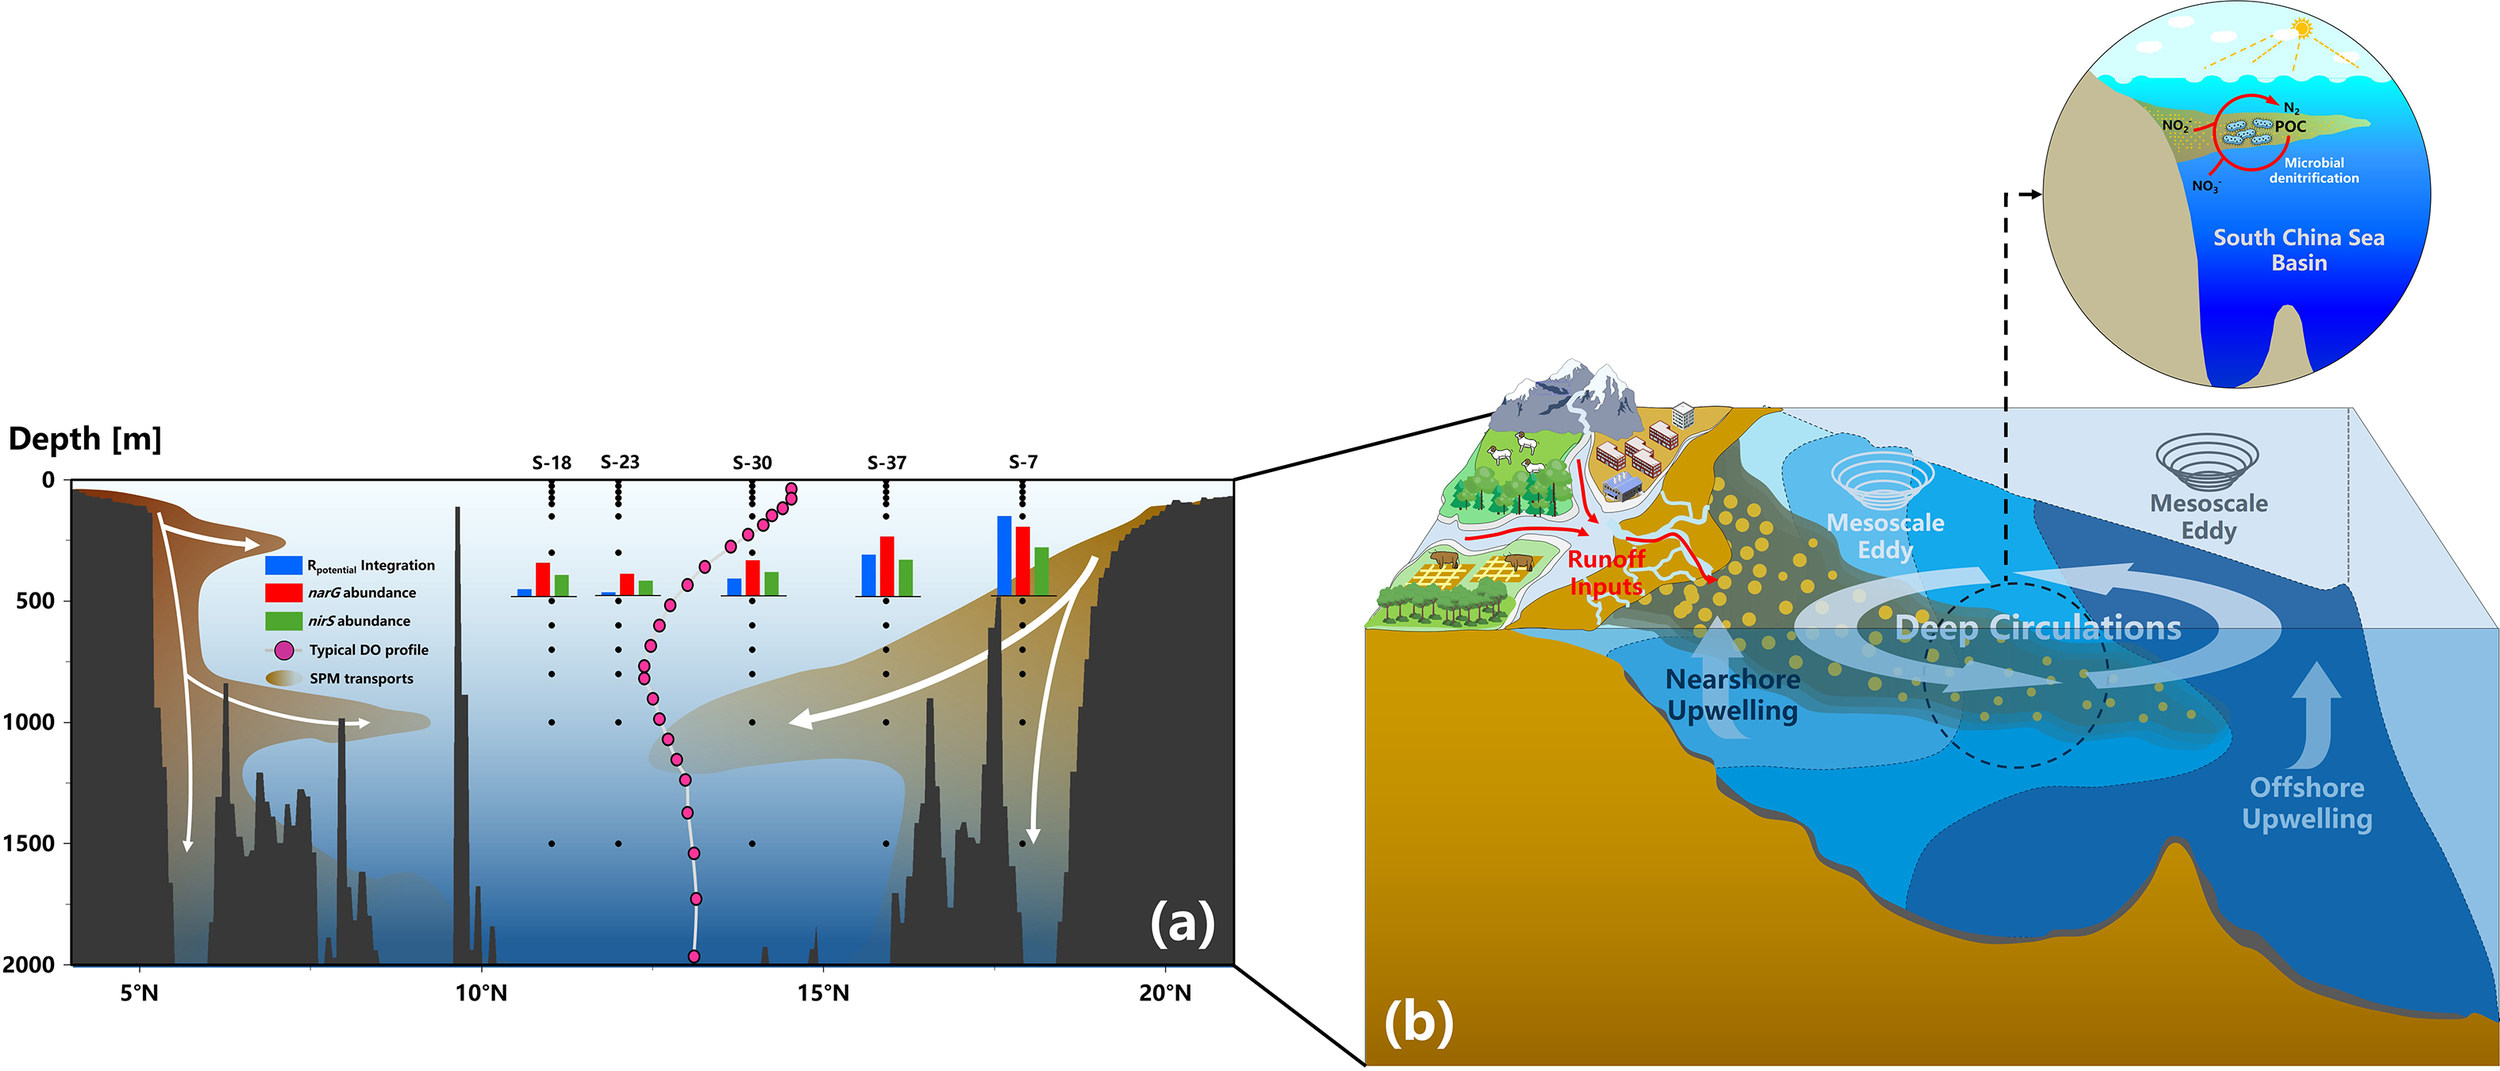
A schematic illustration of the occurrence of potential denitrification process in the non-hypoxic SCS basin waters. (a) A general spatial matching of observed denitrifying function during our cruise with documented particulate matter transport and load patterns across the basin from Schroeder et al. (2015)’s development; (b) A conceptual framework of coupling between microbial N removals and complex particle dynamics in the non-hypoxic marginal basin.
To further assess the importance of this particle-loaded N removal to nutrient cycling in the SCS, we compare measured denitrification with major microbial N-transformations of the basin. When integrating Rin-situ and Rpotential throughout the intermediate water column (600~1500 m) among five sampling stations, average fluxes of 175.1 μmol N/m2/d and 6.39 mmol N/m2/d are obtained, respectively. The depth-integrated Rin-situ is comparable to the import flux from N2 fixation in SCS upper euphotic zone, while the depth-integrated Rpotential is 1~2 orders of magnitude higher (Lu et al., 2019; Liu et al., 2023; Tian et al., 2025). Besides, both Rin-situ and Rpotential detected in our incubation assays are within the range of reported nitrification rates in SCS subsurface layer (0.1~100 nmol/L/d; Xu et al., 2018). It implies that the microbial denitrifying function discovered should be ecologically meaningful, which might have a basin-scale impact on NO3-N budget balance and nutrient cycling patterns of SCS. Given our study relying on only a single cruise, basin-wide investigations covering seasonal and interannual variations remain extremely limited. How the potential denitrification would affect primary productivity in the upper SCS is still unknown, requiring more robust observations and model verification in future research.
4.3 Variability of substrate NO3-N uptake in seawaters
The Km constant (2.25~2.68 μmol/L) of potential denitrification in this study estimated via 15NO3-N gradient incubation is well consistent with literature reports. For example, laboratory-isolated strains such as Paracoccus denitrificans, Pseudomonas chlororaphis, and Pseudomonas aureofaciens exhibited Km values of 5.0 μmol/L, 1.7 μmol/L and 1.8 μmol/L, respectively (Parsonage et al., 1985; Christensen and Tiedje, 1988). Similarly, Jensen et al. (2009) reported a Km of 2.9 μmol/L for denitrification in the hypoxic Denmark Mariager Fjord. While Dalsgaard et al. (2013) measured a value of 2.5 μmol/L in the oxygen-deficient Gotland Basin of Baltic Sea. This result indirectly reflects the potential denitrification observed in the SCS to be typical anaerobic denitrifying metabolism, with nitrate reductase exhibiting strong substrate affinity for NO3-N. Comparing with the NO3-N concentration in the intermediate waters (20~29 μmol/L), it further confirms that substrate availability is sufficient for denitrification performance. This is also consistent with the insignificant correlation between incubated denitrification rates and NO3-N concentration (Figure 6D).
Different from the constant Km, the apparent first-order kinetic coefficient k varied markedly among sampling layers (Table 3). Additionally, there appears strong linear correlations of k with both SPM and POC contents in corresponding layers (Figures 7E, J). As mentioned in the methods, coefficient k in our discussion reflects the apparent activity of nitrate reductase. Although it could not rule out the contribution of change in denitrifying bacterial community composition to the variation of enzymatic activity (Li et al., 2015, Li et al., 2021), the correlations between k and SPM as well as POC verified a dominant role of particulate matter content in mediating the potential denitrification in our study region. Indeed, the “interfacial effect” between particle-water interface favors substrate diffusion and migration more effectively, thereby stimulating higher metabolic activity for particle-attached bacteria compared to those free-living ones (Liu et al., 2013; Zhang et al., 2016; Li et al., 2021).
5 Conclusions
Our study provides the empirical evidence of microbial denitrification occurrence in the intermediate waters of the SCS basin at moderately low DO level (80~100 μmol/L), with incubated potential rates under deoxygenated condition comparable to those measurements documented in typical ODZs. It indicates that the denitrification potential inner SCS basin has been long underestimated. Combined with statistical analyses, it is inferred a synergistic mechanism wherein bacteria adapting to ambient DO levels as well as hypoxic micro-environments provided by particulate matter jointly might induce the activation of denitrification metabolism. Significant correlations were robustly verified with SPM and POC in seawaters against denitrification rates (including Rin-situ and Rpotential), functional gene abundances (narG and nirS) and kinetic coefficient (k), which underscores the dominant roles of particulate matter and organic carbon in modulating enzymatic activity, N removal potential and spatial variability of denitrification in the SCS basin. Supported by multi-year biogeochemical observations, it is hypothesized that the persistent high particle-loading in the intermediate waters might importantly contribute to sustaining the basin-wide denitrification potential and probably have significant impact on nutrient cycling of the SCS basin. Based on these insights, we further propose a preliminary conceptual framework coupling complex particulate dynamics with microbial N removal processes in typical marginal basins, which offers a novel perspective for re-evaluating potential N sinks in non-hypoxic marine environments.
Statements
Data availability statement
The raw data supporting the conclusions of this article will be made available by the authors, without undue reservation.
Author contributions
JZ: Writing – original draft, Conceptualization, Writing – review & editing. BC: Conceptualization, Supervision, Writing – review & editing. GS: Investigation, Data curation, Methodology, Writing – original draft. YG: Validation, Writing – review & editing, Formal analysis, Methodology. ZZ: Formal analysis, Investigation, Writing – review & editing.
Funding
The author(s) declare financial support was received for the research and/or publication of this article. This work was supported by the Nature Science Foundation of Fujian Province (2022J05071), Educational Research Project for Young and Middle-aged Teachers of Fujian Province (Science and Technology Category) (JAT210802) and Xiamen Key Laboratory of Intelligent Fishery (XMKLIF-ZR-202407).
Acknowledgments
We thank the captain and crew of the R/V Tan Kan Kee for their assistance in sampling.
Conflict of interest
The authors declare that the research was conducted in the absence of any commercial or financial relationships that could be construed as a potential conflict of interest.
Generative AI statement
The author(s) declare that no Generative AI was used in the creation of this manuscript.
Any alternative text (alt text) provided alongside figures in this article has been generated by Frontiers with the support of artificial intelligence and reasonable efforts have been made to ensure accuracy, including review by the authors wherever possible. If you identify any issues, please contact us.
Publisher’s note
All claims expressed in this article are solely those of the authors and do not necessarily represent those of their affiliated organizations, or those of the publisher, the editors and the reviewers. Any product that may be evaluated in this article, or claim that may be made by its manufacturer, is not guaranteed or endorsed by the publisher.
Supplementary material
The Supplementary Material for this article can be found online at: https://www.frontiersin.org/articles/10.3389/fmars.2025.1636874/full#supplementary-material
References
1
Balmonte J. P. Simon M. Giebel H.-A. Arnosti C. (2021). A sea change in microbial enzymes: Heterogeneous latitudinal and depth-related gradients in bulk water and particle-associated enzymatic activities from 30°S to 59°N in the Pacific Ocean. Limnology Oceanography66, 3489–3507. doi: 10.1002/lno.11894
2
Bianchi D. Weber T. S. Kiko R. Deutsch C . (2018). Global niche of marine anaerobic metabolisms expanded by particle microenvironments. Nat. Geosci.11, 263–268. doi: 10.1038/s41561-018-0081-0
3
Bonin P. Gilewicz M. Bertrand J. C. (1989). Effects of oxygen on each step of denitrification on Pseudomonas nautica. Can. J. Microbiol.35, 1061–1064. doi: 10.1139/m89-177
4
Bulow S. E. Rich J. J. Naik H. S. Pratihary A. K. Ward B. B . (2010). Denitrification exceeds anammox as a nitrogen loss pathway in the Arabian Sea oxygen minimum zone. Deep Sea Res. Part I57, 384–393. doi: 10.1016/j.dsr.2009.10.014
5
Chang B. X. Rich J. R. Jayakumar A. Naik H. Pratihary A. K. Keil R. G. et al . (2014). The effect of organic carbon on fixed nitrogen loss in the eastern tropical South Pacific and Arabian Sea oxygen deficient zones. Limnology Oceanography59, 1267–1274. doi: 10.4319/lo.2014.59.4.1267
6
Chao S.-Y. Shaw P.-T. Wu S. (1996). Deep water ventilation in the South China Sea. Deep Sea Res. Part I: Oceanographic Research Papers43, 445–466. doi: 10.1016/0967-0637(96)00025-8
7
Chen S. Chen M. Li N. Zou Y. Yuan W . (2024). Bacterial diversity in deep sea water in the South China Sea. Acta Ecologica Sin. (in Chinese)44, 6373–6382. doi: 10.20103/j.stxb.202311172505
8
Chen C. T. A. Wang S. L. Wang B. J. Pai S. C . (2001). Nutrient budgets for the South Chian Sea basin. Mar. Chem.75, 281–300. doi: 10.1016/S0304-4203(01)00041-X
9
Chou W. C. Sheu D. D. Chen C. T. A. Wen L. S. Yang Y. Wei C. L. et al . (2007). Transport of the South China Seas subsurface outflow and its influence on carbon chemistry of Kuroshio waters off southeastern Taiwan. J. Geophysical Res.112, C12008. doi: 10.1029/2007JC004087
10
Christensen S. Tiedje J. M. (1988). Sub-parts-per-billion nitrate method: use of an N2O-producing denitrifier to convert NO3- or 15NO3- to N2O. Appl. Environ. Microbiol.54, 1409–1413. doi: 10.1128/aem.54.6.1409-1413.1988
11
Ciccarese D. Tantawi O. Zhang I. H. Plata D. Babbin A. R . (2023). Microscale dynamics promote segregated denitrification in diatom aggregates sinking slowly in bulk oxygenated seawater. Commun. Earth Environ.4, 275. doi: 10.1038/s43247-023-00935-x
12
Codispoti L. A. (1989). “Phosphorus vs. nitrogen limitation of new and export production,” in Productivity of the ocean: Present and past. Eds. BergerW. H.SmetacekV. S.WeferG. (Wiley, New York), 377–394.
13
Codispoti L. A. Brandes J. A. Christensen J. P. Devol A. H. Naqvi S. W. A. Paerl H. et al . (2001). The oceanic fixed nitrogen and nitrous oxide budgets: Moving targets as we enter the anthropocene? Scientia Marina65, 85–105. doi: 10.3989/scimar.2001.65s285
14
Cram J. A. Hollins A. McCarty A. J. Martinez G. Cui M. Gomes M. L. et al . (2024). Microbial diversity and abundance vary along salinity, oxygen, and particle size gradients in the Chesapeake Bay. Environ. Microbiol.26, e16557. doi: 10.1111/1462-2920.16557
15
Dai M. Cao Z. Guo X. Zhai W. Liu Z. Yin Z. et al . (2013). Why are some marginal seas sources of atmospheric CO2? Geophysical Res. Lett.40, 2154–2158. doi: 10.1002/grl.50390
16
Dalsgaard T. De Brabandere L. Hall P. O. J. (2013). Denitrification in the water column of the central Baltic Sea. Geochimica Cosmochimica Acta106, 247–260. doi: 10.1016/j.gca.2012.12.038
17
Devol A. H. (2008). “Denitrification including anammox,” in Nitrogen in the marine environment, 2nd Edition. Eds. CaponeD. G.BronkD. A.MulhollandM. R.CarpenterE. J. (Academic Press, Burlington), 263–301. doi: 10.1146/annurev-marine-010213-135040
18
Devol (2015). Denitrification, anammox, and N2 production in marine sediments. Annu. Rev. Mar. Sci.7, 403–423.
19
Dippner J. W. Nguyen K. V. Hein H. Ohde T. Loick N . (2007). Monsoon-induced upwelling off the Vietnamese coast. Ocean Dynamics57, 46–62. doi: 10.1007/s10236-006-0091-0
20
Engel A. Kiko R. Dengler M. (2022). Organic matter supply and utilization in oxygen minimum zones. Annu. Rev. Mar. Sci.14, 355–378. doi: 10.1146/annurev-marine-041921-090849
21
Fuchsman C. A. Paul B. Staley J. T. Yakushev E. V. Murray J. W . (2019). Detection of transient denitrification during a high organic matter event in the Black Sea. Global Biogeochemical Cycles33, 143–162. doi: 10.1029/2018GB006032
22
Gao H. Schreiber F. Collins G. Jensen M. M. Kostka J. E. Lavik G. et al . (2010). Aerobic denitrification in permeable Wadden Sea sediments. ISME J.4, 417–426. doi: 10.1038/ismej.2009.127
23
Gong G. C. Liu K. K. Liu C. T. Pai S. C . (1992). The chemical hydrography of the South China Sea west of Luzon and a comparison with the west Philippine Sea. Terrestrial Atmospheric Oceanic Sci.3, 587–602. doi: 10.3319/TAO.1992.3.4.587(O)
24
Gruber N. (2008). “The marine nitrogen cycle: overview and challenges,” in Nitrogen in the marine environment, 2nd Edition. Eds. CaponeD. G.BronkD. A.MulhollandM. R.CarpenterE. J. (Academic Press, Burlington), 1–50.
25
Hamersley M. R. Lavik G. Woebken D. Rattray J. E. Lam P. Hopmans E. C. et al . (2007). Anaerobic ammonium oxidation in the Peruvian oxygen minimum zone. Limnology Oceanography52, 923–933. doi: 10.4319/lo.2007.52.3.0923
26
Hansen H. P. Koroleff F. (1999). “Determination of nutrients,” in Methods of Seawater Analysis, 3rd Edition. Eds. GrasshoffK.KremlingK.EhrhardtM. (Wiley-VCH, Weinheim), 170–193.
27
Hietanen S. Jäntti H. Buizert C. Jürgens K. Labrenz M. Voss M. et al . (2012). Hypoxia and nitrogen processing in the Baltic Sea water column. Limnology Oceanography57, 325–337. doi: 10.4319/lo.2012.57.1.0325
28
Holtappels M. Lavik G. Jensen M. M. Kuypers M. M. M . (2011). 15N-labeling experiments to dissect the contributions of heterotrophic denitrification and anammox to nitrogen removal in the OMZ waters of the ocean. Methods Enzymology486, 223–251. doi: 10.1016/B978-0-12-381294-0.00010-9
29
Jarvis A. Enwall K. Throbäck I. N. Hallin S . (2004). Reassessing PCR primers targeting nirS, nirK and nosZ genes for community surveys of denitrifying bacteria with DGGE. FEMS Microbiol. Ecol.49, 401–417. doi: 10.1016/j.femsec.2004.04.011
30
Jensen M. M. Petersen J. Dalsgaard T. Thamdrup B . (2009). Pathways, rates and regulation of N2 production in the chemocline of an anoxic basin, Mariager Fjord, Denmark. Mar. Chem.113, 102–113. doi: 10.1016/j.marchem.2009.01.002
31
Jia Z. Liu T. Xia X. Xia N . (2016). Effect of particle size and composition of suspended sediment on denitrification in river water. Sci. Total Environ.541, 934–940. doi: 10.1016/j.scitotenv.2015.10.012
32
Kalvelage T. Jensen M. M. Contreras S. Revsbech N. P. Lam P. Günter M. et al . (2011). Oxygen sensitivity of anammox and coupled N-cycle processes in oxygen minimum zones. PLoS One6, e29299. doi: 10.1371/journal.pone.0029299
33
Kao S. J. Dai M. Selvaraj K. Zhai W. Cai P. Chen S. N. et al . (2010). Cyclone-driven deep sea injection of freshwater and heat by hyperpycnal flow in the subtropics. Geophysical Res. Lett.37, L21702. doi: 10.1029/2010GL044893
34
Kirkwood D. S. Aminot A. Carlberg S. R. (1996). The 1994 Quasimeme laboratory performance study: Nutrients in seawater and standard solutions. Mar. pollut. Bull.32, 640–645. doi: 10.1016/0025-326X(96)00076-8
35
Klawonn I. Bonaglia S. Brüchert V. Ploug H . (2015). Aerobic and anaerobic nitrogen transformation processes in N2-fixing cyanobacterial aggregates. ISME J.9, 1456–1466. doi: 10.1038/ismej.2014.232
36
Körner H. Zumft W. G. (1989). Expression of denitrification enzymes in response to the dissolved oxygen level and respiratory substrate in continuous culture of Pseudomonas stutzeri. Appl. Environ. Microbiol.55, 1670–1676. doi: 10.1128/aem.55.7.1670-1676.1989
37
Lόpez-Gutiérrez J. C. Henry S. Hallet S. Martin-Laurent F. Catroux G. Philippot L. et al . (2004). Quantification of a novel group of nitrate-reducing bacteria in the environment by real-time PCR. J. Microbiological Methods57, 399–407. doi: 10.1016/j.mimet.2004.02.009
38
Lahajnar N. Wiesner M. G. Gaye B. (2007). Fluxes of amino acids and hexosamines to the deep South China Sea. Deep Sea Res. Part I54, 2120–2144. doi: 10.1016/j.dsr.2007.08.009
39
Lam P. Kuypers M. M. M. (2011). Microbial nitrogen cycling processes in oxygen minimum zones. Annu. Rev. Mar. Sci.3, 317–345. doi: 10.1146/annurev-marine-120709-142814
40
Li J. Gu L. Bai S. Wang J. Su L. Wei B. et al . (2021). Characterization of particle-associated and free-living bacterial and archaeal communities along the water columns of the South China Sea. Biogeosciences18, 113–133. doi: 10.5194/bg-18-113-2021
41
Li L. Qu T. (2006). Thermohaline circulation in the deep South China Sea basin inferred from oxygen distributions. J. Geophysical Res.111, C05017. doi: 10.1029/2005JC003164
42
Li J. Wei B. Wang J. Liu Y. Dasgupta S. Zhang L. et al . (2015). Variation in abundance and community structure of particle-associated and free-living bacteria in the South China Sea. Deep Sea Res. Part II122, 64–73. doi: 10.1016/j.dsr2.2015.07.006
43
Liu Y. Bao X. Wu D. (2011). Analysis of vertical structure and seasonal variation of the dissolved oxygen in the South China Sea. Periodical Ocean Univ. China41, 25–32. (in Chinese). doi: 10.16441/j.cnki.hdxb.2011.z1.004
44
Liu K. K. Chao S. Y. Shaw P. T. Gong G. C. Chen C. C. Tang T. Y. et al . (2002). Monsoon-forced chlorophyll distribution and primary production in the South China Sea: observations and a numerical study. Deep Sea Res. Part I49, 1387–1412. doi: 10.1016/S0967-0637(02)00035-3
45
Liu K. K. Chen Y. J. Tseng C. M. Lin I. I. Liu H. B. Snidvongs A. et al . (2007). The significance of phytoplankton photo-adaptation and benthic-pelagic coupling to primary production in the South China Sea: Observations and numerical investigations. Deep Sea Res. Part II54, 1546–1574. doi: 10.1016/j.dsr2.2007.05.009
46
Liu X. Wu J. Hong Y. Li Y. Hu Y. Wang L. et al . (2021). Wide distribution of anaerobic ammonium-oxidizing bacteria in the water column of the South China Sea: Implications for their survial strategies. Diversity Distributions27, 1893–1903. doi: 10.1111/ddi.13159
47
Liu J. Xiang R. Chen Z. Chen M. Yan W. Zhang L. et al . (2013). Sources, transport and deposition of surface sediments from the South China Sea. Deep Sea Res. Part I71, 92–102. doi: 10.1016/j.dsr.2012.09.006
48
Liu J. Zhang H. Ding X. Zhou L. Ke Z. Li J. et al . (2023). Nitrogen fixation under the interaction of Kuroshio and upwelling in the northeastern South China Sea. Deep Sea Res. Part I200, 104147. doi: 10.1016/j.dsr.2023.104147
49
Lu Y. Wen Z. Shi D. Lin W. Bonnet S. Dai M. et al . (2019). Biogeography of N2 fixation influenced by the western boundary current intrusion in the South China sea. J. Geophysical Research: Oceans124, 6983–6996. doi: 10.1029/2018JC014781
50
Ma H. Yang W. Zhang L. Zhang R. Chen M. Qiu Y. et al . (2017). Utilizing 210Po deficit to constrain particle dynamics in mesopelagic water, western South China Sea. Geochemistry Geophysics Geosystems18, 1594–1607. doi: 10.1002/2017GC006899
51
Müller B. Meyer J. S. Gächter R. (2022). Denitrification and nitrogen burial in Swiss lakes. Environ. Sci. Technol.56, 2794–2802. doi: 10.1021/acs.est.1c07602
52
Parsonage D. Greenfield A. J. Ferguson S. J. (1985). The high affinity of Paracoccus denitrificans cells for nitrate as an electron acceptor. Biochim. Biophys. Acta (BBA)-Biogenergetics807, 81–95. doi: 10.1016/0005-2728(85)90055-6
53
Ploug H. (2001). Small-scale oxygen fluxes and remineralization in sinking aggregates. Limnology Oceanography46, 1624–1631. doi: 10.4319/lo.2001.46.7.1624
54
Robinson C. (2008). “Heterotrophic bacterial respiration,” in Microbial Ecology of the Oceans, 2nd Edition. Ed. KichmanD. L. (Wiley-Blackwell, New Jersey), 299–334.
55
Schroeder A. Wiesner M. G. Liu Z. (2015). Fluxes of clay minerals in the South China Sea. Earth Planetary Sci. Lett.430, 30–42. doi: 10.1016/j.epsl.2015.08.001
56
Sigman D. M. Boyle E. A. (2000). Glacial/interglacial variations in atmospheric carbon dioxide. Nature407, 859–869. doi: 10.1038/35038000
57
Stief P. Kamp A. Thamdrup B. Glud R. N . (2016). Anaerobic nitrogen turnover by sinking diatom aggregates at varying ambient oxygen levels. Front. Microbiol.7, 98. doi: 10.3389/fmicb.2016.00098
58
Tan S. Zhang J. Li H. Sun L. Wu Z. Wiesner M. G. et al . (2020). Deep ocean particle flux in the northern South China Sea: variability on intra-seasonal to seasonal timescales. Front. Earth Sci.8, 74. doi: 10.3389/feart.2020.00074
59
Thamdrup B. Dalsgaard T. Jensen M. M. Ulloa O. Farías L. Escribano R. et al . (2006). Anaerobic ammonium oxidation in the oxygen-deficient waters off northern Chili. Limnology Oceanography51, 2145–2156. doi: 10.4319/lo.2006.51.5.2145
60
Tian J. Zhang R. Jing H. Ren H. Mao H. Zhou H. et al . (2025). Reshaping of new nitrogen regime by anticyclonic eddies in the northern South China Sea. J. Geophysical Research: Oceans130, e2024JC021684. doi: 10.1029/2024JC021684
61
Wan X. S. Sheng H. Liu L. Shen H. Tang W. Zou W. et al . (2023). Particle-associated denitrification is the primary source of N2O in oxic coastal waters. Nat. Commun.14, 8280. doi: 10.1038/s41467-023-43997-3
62
Wang G. Su J. Chu P. C. (2003). Mesoscale eddies in the South China Sea observed with altimeter data. Geophysical Res. Lett.30, 2121. doi: 10.1029/2003GL018532
63
Wang L. Wang L. Dong C. Li X. Li D. Shao Z. et al . (2019). Deep sea in-situ cultivation and diversity analysis of microorganism involved in nitrogen cycling in the South China Sea. J. Appl. Oceanography38, 1–13. (in Chinese). doi: 10.3969/J.ISSN.2095-4972.2019.01.001
64
Wei C. L. Chia C. Y. Chou W. C. Lee W. H . (2017). Sinking fluxes of 210Pb and 210Po in the deep basin of the northern South China Sea. J. Environ. Radioactivity174, 45–53. doi: 10.1016/j.jenvrad.2016.05.026
65
Wong G. T. F. Tseng C. M. Wen L. S. Chung S. W . (2007). Nutrient dynamics and N-anomaly at the SEATS station. Deep Sea Res. Part II54, 1528–1545. doi: 10.1016/j.dsr2.2007.05.011
66
Xia X. Zhang L. Wang G. Wang J. Zhang L. Zhang S. et al . (2021). Nitrogen loss from a turbid river network based on N2 and N2O fluxes: importance of suspended sediment. Sci. Total Environ.757, 143918. doi: 10.1016/j.scitotenv.2020.143918
67
Xu M. N. Zhang W. Zhu Y. Liu L. Zheng Z. Wan X. S. et al . (2018). Enhanced ammonia oxidation caused by lateral Kuroshio intrusion in the boundary zone of the northern South China Sea. Geophysical Res. Lett.45, 6585–6593. doi: 10.1029/2018GL077896
68
Yang J. Y. T. Kao S. J. Dai M. Yan X. Lin H. L . (2017). Examining N cycling in the northern South China Sea from N isotopic signals in nitrate and particulate phases. J. Geophysical Res.122, 2118–2136. doi: 10.1002/2016JG003618
69
Zeng J. Chen M. Zheng M. Qiu Y . (2014). Accurately quantification of 29N2 concentration in 15N tracer derived marine denitrification rates. Acta Oceanologica Sin. (in Chinese)36, 10–17. doi: CNKI:SUN:SEAC.0.2014-06-002
70
Zeng J. Chen M. Zheng M. Qiu Y. He W. He Y. et al . (2018). Effects of particles on potential denitrification in the coastal waters of the Beibu Gulf in China. Sci. Total Environ.624, 1274–1286. doi: 10.1016/j.scitotenv.2017.12.192
71
Zhang J. Li H. Xuan J. Wu Z. Yang Z. Wiesner M. G. et al . (2019). Enhancement of mesopelagic sinking particle fluxes due to upwelling, aerosol deposition, and monsoonal influences in the northwestern South China Sea. J. Geophysical Res.124, 99–112. doi: 10.1029/2018JC014704
72
Zhang Y. Xiao W. Jiao N. (2016). Linking biochemical properties of particles to particle-attached and free-living bacterial community structure along the particle density gradient from freshwater to open ocean. J. Geophysical Res.121, 2261–2274. doi: 10.1002/2016JG003390
73
Zumft W. G. (1997). Cell biology and molecular basis of denitrification. Microbiol. Mol. Biol. Rev.61, 533–616. doi: 10.1128/mmbr.61.4.533-616.1997
Summary
Keywords
South China Sea basin, intermediate waters, potential denitrification, functional genes, low dissolved oxygen, particulate matters
Citation
Zeng J, Chen B, Shi G, Guan Y and Zhuo Z (2025) High potential microbial denitrification in non-hypoxic intermediate waters of the South China Sea basin. Front. Mar. Sci. 12:1636874. doi: 10.3389/fmars.2025.1636874
Received
28 May 2025
Accepted
01 September 2025
Published
23 September 2025
Volume
12 - 2025
Edited by
Abhishek Srivastava, University of Vienna, Austria
Reviewed by
Wilgince Apollon, National Polytechnic Institute (IPN), Mexico
Yiwen Zhou, Guangdong Academy of Sciences, China
Updates
Copyright
© 2025 Zeng, Chen, Shi, Guan and Zhuo.
This is an open-access article distributed under the terms of the Creative Commons Attribution License (CC BY). The use, distribution or reproduction in other forums is permitted, provided the original author(s) and the copyright owner(s) are credited and that the original publication in this journal is cited, in accordance with accepted academic practice. No use, distribution or reproduction is permitted which does not comply with these terms.
*Correspondence: Jian Zeng, zengjian@xmoc.edu.cn
Disclaimer
All claims expressed in this article are solely those of the authors and do not necessarily represent those of their affiliated organizations, or those of the publisher, the editors and the reviewers. Any product that may be evaluated in this article or claim that may be made by its manufacturer is not guaranteed or endorsed by the publisher.