 Ruitong Guo
 Guangnian Xiao
 Chunqin Zhang
 Qingjun Li3*
- 1School of Economics and Management, Shanghai Maritime University, Shanghai, China
- 2School of Civil Engineering and Architecture, Zhejiang Sci-Tech University, Hangzhou, China
- 3School of Economics & Management, Weifang University, Weifang, China
Port cargo throughput plays a pivotal role in driving national economic growth, facilitating trade activities, and promoting urban development. This study employs a Multi-scale Geographically Weighted Regression (MGWR) model to analyse the influencing factors of port cargo throughput, with regional Gross Domestic Product (GDP), highway construction investment, waterway construction investment, total import and export volume of goods, total retail sales of consumer goods, number of port berths, and urban residents’ consumption expenditure as independent variables. Based on data collected from 43 ports across China, the research reveals the magnitude and spatial distribution characteristics of these variables’ impacts on port cargo throughput. By comparing the fitting results of the global regression model with those of local regression models, the study demonstrates that the MGWR model achieves superior local regression fitting compared to the fixed-bandwidth Geographically Weighted Regression (GWR) model. This research provides theoretical support for understanding the spatial heterogeneity of factors influencing port cargo throughput and offers actionable insights for policy formulation and port planning.
1 Introduction
With the ongoing expansion of global trade and the accelerating pace of urbanization, ports, as the vital link between maritime and land transportation, play an indispensable role in a country’s economy (Li et al., 2023; Xu et al., 2025). The main reason for this is that the majority of all cargo delivered in the world is transported by sea, with maritime transport accounting for 75% of the modal share in 2020 (Taylor and Smith, 2007). Needless to say, industries are strongly dependent on shipping, with ports consequently playing a central role in global supply chains (Martínez-Moya et al., 2025). Port cargo throughput, serving as a critical indicator for assessing port operational activity and regional economic development levels, plays a pivotal role in driving national economic growth, facilitating trade activities, and promoting sustainable urban development (Cong et al., 2020). China boasts the world’s largest port cargo throughput. Major ports like Ningbo-Zhoushan, Tangshan, Shanghai, Qingdao, and Guangzhou handle billions of tons of cargo annually, including raw materials, finished goods, and containers. Over the past decades, China has been vigorously promoting the construction and renovation of port infrastructure (Munim and Schramm, 2018) to meet the growing freight demand (Wagner et al., 2022). China ranks first in global container throughput, with Shanghai, Ningbo-Zhoushan, Shenzhen, and Qingdao ports among the world’s top container ports (Wang et al., 2004) and provides crucial support for China’s foreign trade and economic growth. Efficient port operations (Bichou, 2014) are pivotal to fostering international trade, reducing logistics costs, and enhancing industrial competitiveness, thereby driving regional economic growth and trade expansion (Akyıldız et al., 2025). A thorough investigation into the determinants of port cargo throughput enables optimized management and planning, improved operational efficiency, and sustained economic development (Song and van Geenhuizen, 2014). However, port cargo throughput is influenced by multifaceted factors, including the demographic characteristics of host cities, geographic location, regional economic development levels, transportation networks, and policy frameworks and regulatory mechanisms (Notteboom et al., 2021). Therefore, a systematic analysis of these determinants holds substantial practical significance for evidence-based policy making.
Research on the factors influencing port cargo throughput has made significant progress. At present, many scholars have conducted research on the determinants of port cargo throughput. Based on the relevant research experiences and conclusions of previous scholars, the port hinterland conditions and the conditions of the port itself are selected when constructing the index system. The conditions of the port hinterland mainly include the economic development status of the port hinterland and the capacity level of the collection and distribution system. The conditions of a port itself mainly include port freight rates and port infrastructure construction. Specifically, the derivative variables of literature refer to the economic development status of the port hinterland, the capacity level of the collection and distribution system, port freight rates and port infrastructure construction. However, most existing studies use traditional regression methods, which overlook spatial heterogeneity, leading to insufficient explanations of spatial differences in port cargo throughput. This study accounts for spatial effects and assigns different bandwidths (Bǎdin et al., 2010) to independent variables, thereby filling a gap in the existing research and is also the innovation of the paper.
This research synthesizes existing scholarship on port cargo throughput determinants and Multi-scale Geographically Weighted Regression (MGWR) methodology, conducts a systematic review of domestic and international applications, establishes analytical frameworks through literature-derived variables, and performs empirical analysis using the cleaned datasets with the MGWR model. This paper decides to select 43 ports in mainland China as the research objects, including 19 coastal ports and 24 inland ports. This study aims to incorporate spatial heterogeneity into the model and conduct an analysis of factors influencing port cargo throughput, and then apply the MGWR method to provide a scientific basis and policy recommendations for port management and planning.
2 Literature review
This chapter reviews two strands of literature pertinent to our investigation: determinants of port cargo throughput and research on MGWR model. Section 2.1 synthesizes research on determinants of port cargo throughput, emphasizing macroeconomic factors, international trade dynamics, and infrastructure development. Section 2.2 reviews advancements in the MGWR model, which addresses spatial heterogeneity in spatial data analysis. This model overcomes limitations of traditional regression methods by explicitly incorporating spatial heterogeneity.
2.1 Research on determinants of port cargo throughput
Port cargo throughput is an important indicator for measuring the economic development of ports and regions (Mudronja et al., 2019). Many scholars adopt different methods to study its influencing factors and prediction methods. Macroeconomic variables have a significant impact on the cargo throughput of ports. Studies show that macroeconomic indicators such as the industrialization level and Gross Domestic Product (GDP) of the country or region where the port is located are closely related to the port throughput. Eskafi et al. (2020) pointed out that macroeconomic variables such as GDP can be used for the analysis and prediction of port throughput. In addition, international trade activities also affect port throughput. With the continuous development of global trade, as an important hub connecting international trade, the cargo throughput of ports will also increase accordingly. The promotion of regional economic integration has facilitated trade exchanges and economic cooperation among countries within the region, thereby having a positive impact on the cargo throughput of ports. For instance, under the background of regional economic integration, China’s coastal ports have continuously increased their cargo throughput and enhanced their competitiveness by cooperating with ports in neighboring countries and regions (Morales-Ramírez et al., 2025). The construction and improvement of a port’s infrastructure, such as terminals, waterways, and warehouses, directly affect the port’s cargo handling capacity and service level. Good port infrastructure can enhance the operational efficiency of the port, attract more cargo aggregation, and thereby promote the growth of cargo throughput (Notteboom et al., 2021).
2.2 Research on multi-scale geographically weighted regression models
The MGWR model has received extensive attention in recent years as an important extension of the Geographically Weighted Regression (GWR) model. It can capture spatial non-stationarity and multi-scale processes more meticulously. Fotheringham et al. (2017) proposed the MGWR model in 2017. And it was further refined and improved under the local parameter statistical inference adopted by Yu et al. (2020), thus enabling this method to be widely used in empirical research. The MGWR model is widely used in spatial data analysis (Wang et al., 2022a). Li and Fotheringham (2020) utilized the MGWR model to investigate the relationship between economic growth in various states of the United States and multiple socio-economic factors. They revealed the spatial heterogeneity (Li et al., 2024a) and scale differences of different factors in different regions (Li and Fotheringham, 2020). Cao et al. (2021) utilized the MGWR model to analyse the factors influencing the urban carrying capacity of the Shanghai metropolis based on the MGWR model. Shen et al. (2020) investigated the pricing mechanisms of second-hand housing in Beijing using the MGWR model, concluding that classical geographically weighted regression models may lack robustness while the MGWR model produced more reliable results. Wang et al. (2022b) analyzed the housing transaction data in Chengdu in 2020 through spatial network analysis and MGWR model, revealing how urban road networks influenced housing prices across different spatial scales with distinct variations. This study provided valuable references for government real estate policies, developer site selection strategies, and urban transportation planning. Zhang et al. (2022) applied MGWR to examine spatial heterogeneity and scale patterns in tourism development’s impact on urban-rural income disparities. Their findings indicated that tourism primarily widens income gaps between urban and rural areas, with this effect showing significant spatial heterogeneity.
2.3 Summary
Numerous studies examined factors influencing port cargo throughput, but traditional regression methods frequently ignored spatial heterogeneity, failing to account for geographical location and characteristics in port throughput analysis. This study applies the MGWR model, accounts for spatial effects and assigns different bandwidths to address this limitation and investigate port cargo throughput determinants.
3 Construction of indicators
Section 3.1 defines the research object, selecting 43 Chinese ports using 2022 data to reveal significant geographical disparities. Section 3.2 identifies the variables: port hinterland conditions and the conditions of port itself. Section 3.3 outlines data sources, integrating port statistics, economic indicators, and geospatial datasets. Preprocessing procedures includes data cleaning, unit standardization, and outlier handling, ensure data consistency.
3.1 Selection of the research object
Considering the difficulty of collecting relevant data and the fitting effect of the MGWR model, after comprehensive consideration, this paper decides to select 43 ports in mainland China as the research objects, including 19 coastal ports and 24 inland ports. The model data was collected based on the relevant data of 2022. The cargo throughput of the above ports is shown in Table 1.
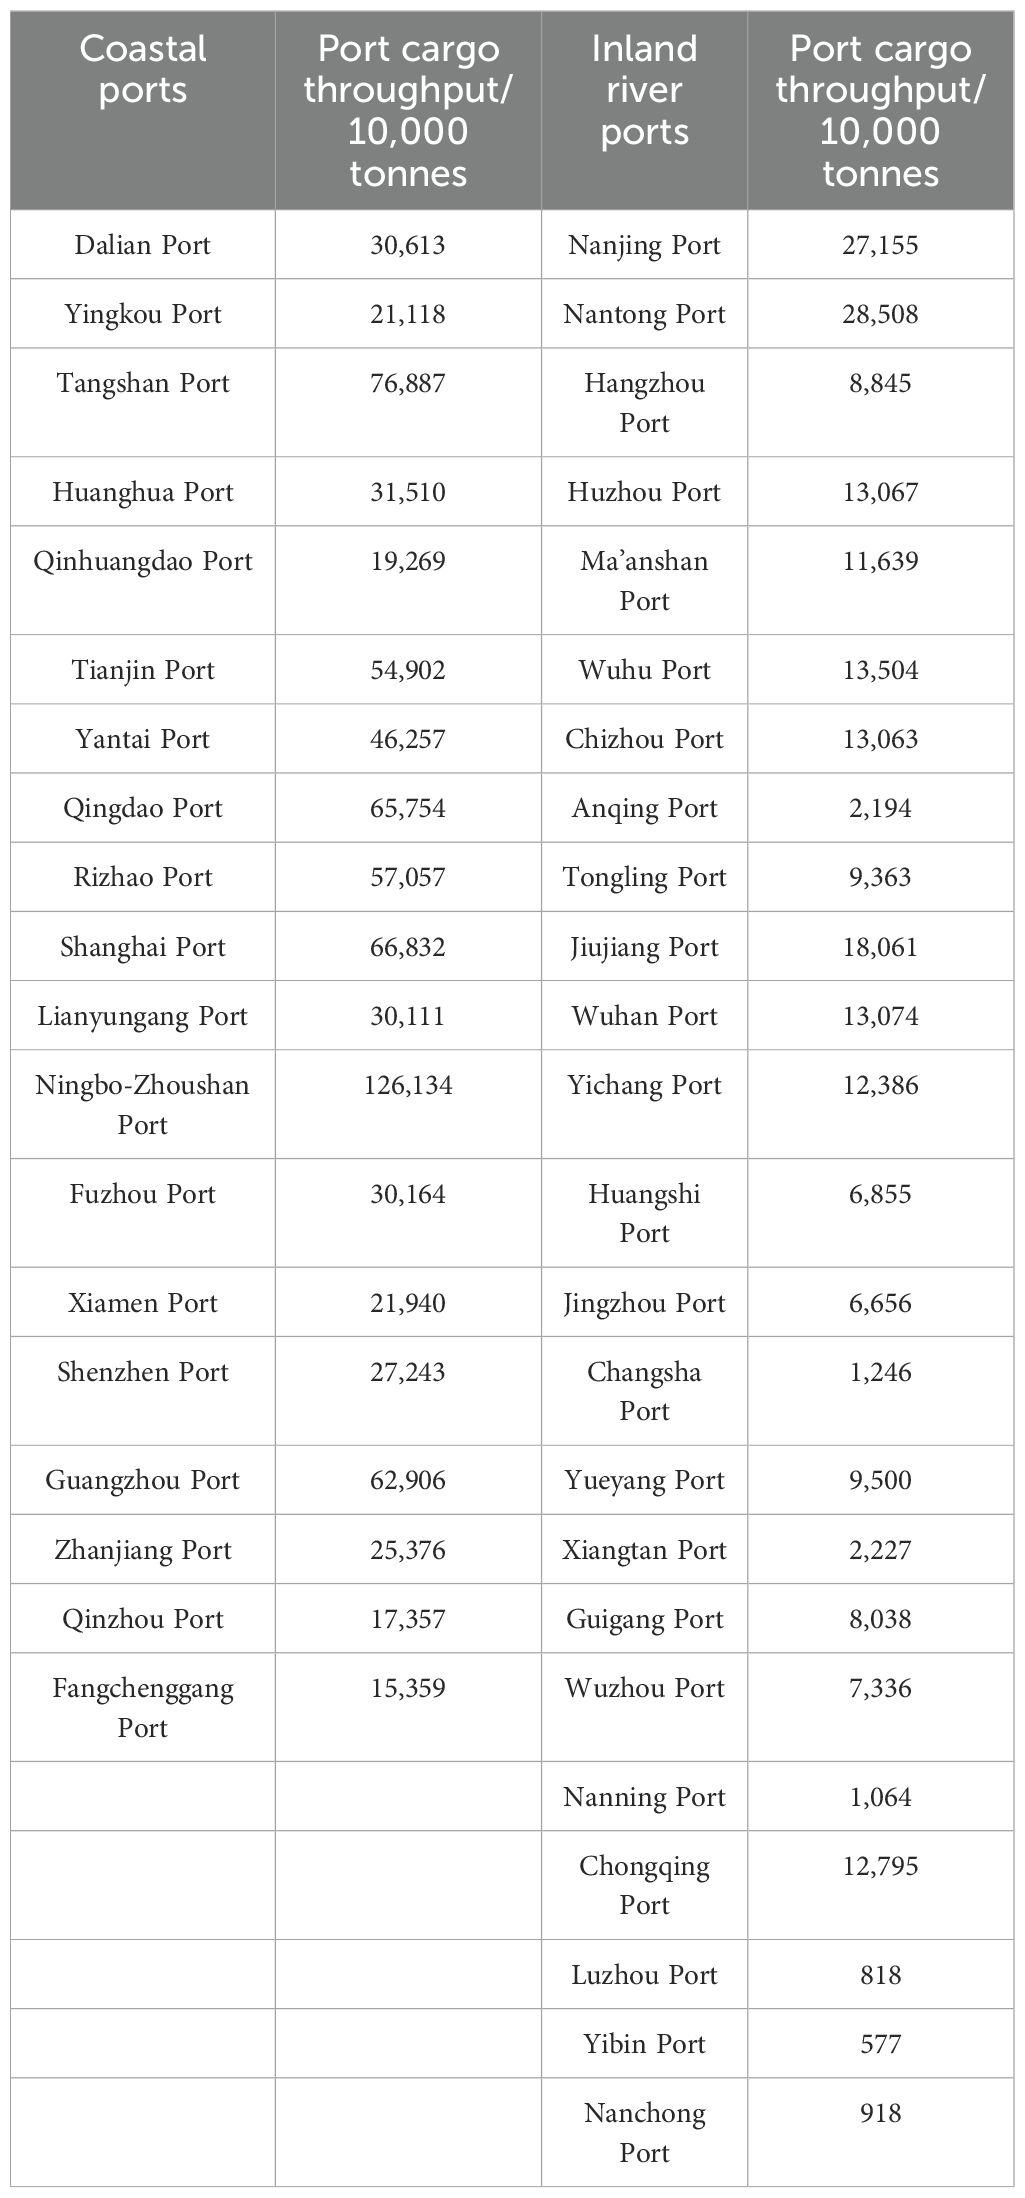
Table 1. Cargo throughput of coastal and inland river ports in mainland China.
From Table 1, it can be seen that coastal ports handle more cargo than inland ports. Among the research objects selected in this paper, the top three ports in terms of cargo throughput are Ningbo-Zhoushan Port, Tangshan Port and Shanghai Port. Among them, Ningbo Port and Zhoushan Port have consistently ranked first in terms of cargo throughput among Chinese ports since their merger into Ningbo-Zhoushan Port, with a cargo throughput of 126,134 million tons, which is in a leading position in terms of faults among coastal ports. The two ports with the smallest cargo throughput are Qinzhou Port and Fangchenggang Port. Among the inland ports, Nanjing Port and Nantong Port in Jiangsu Province rank first and second in terms of cargo throughput. Meanwhile, Luzhou Port, Yibin Port and Nanchong Port are the three ports in Sichuan Province with the lowest cargo throughput. Based on the above analysis, it can be seen that there is a certain connection between the cargo throughput of a port and its geographical location. The cargo throughput of ports located in the developed coastal areas is greater than that of ports in other areas. Therefore, this paper decides to use a MGWR model to study the influencing factors of port cargo throughput.
3.2 Selection of model variables
At present, many scholars have conducted research on the influencing factors of port cargo throughput (Eskafi et al., 2020). Based on the relevant research experiences and conclusions of previous scholars, the port hinterland conditions (Sdoukopoulos and Boile, 2020) and the conditions of the port itself are selected when constructing the index system.
3.2.1 Port hinterland conditions
The conditions of the port hinterland mainly include the economic development status of the port hinterland (Sdoukopoulos and Boile, 2020) and the capacity level of the collection and distribution system.
The development of a port depends on the growth of its hinterland economy (Liu and Park, 2011) and foreign trade industry (Li et al., 2024b). Usually, the status of the hinterland economy (Behdani et al., 2020) is measured by the regional GDP (Delfin-Ortega, 2025), while the total volume of goods imports and exports is an indicator to measure the foreign trade situation. Furthermore, the consumption level in the hinterland of the port also affects the cargo throughput of the port (Mueller et al., 2020), and the consumption level of a region is usually expressed by the total retail sales of consumer goods and per capita consumption expenditure (Mueller et al., 2020). It was decided to select the GDP of the port hinterland area, the total volume of goods import and export, the total retail sales of consumer goods and the per capita consumption expenditure of urban residents as the measurement indicators of the influencing factors of the port’s cargo throughput.
The collection and distribution system refers to a logistics transportation system (Kolesnikov et al., 2020) that gathers, centralizes, distributes and redistributes goods from different regions or geographical locations (Hesse and Rodrigue, 2004). The capacity of the collection and distribution network constitutes the basis for the current cargo transportation at ports. The establishment and improvement of the collection and distribution system can effectively enhance the efficiency of goods transportation, reduce logistics costs, and promote regional economic development and trade exchanges. The capacity of the collection and distribution network can be measured by the investment in road construction (Tsimoshynska et al., 2021) and waterway construction in a region. The investment in road construction reflects the situation of goods transportation between the port and the cargo hinterland through roads, while the investment in waterway construction (Ren et al., 2020) reflects the development status of the waterway transportation industry. This paper selects the investment in highway construction and the investment in waterway construction in the hinterland of the port as the indicators of the port’s cargo throughput (Bernacki and Lis, 2024).
3.2.2 The conditions of the port itself
The conditions of a port itself mainly include two aspects: port freight rates (Ke et al., 2024) and port infrastructure construction (Liu, 2020). The types of charges at general ports include loading and unloading fees (Mor et al., 2020), berthing fees, berth usage fees, container storage fees, warehousing fees, customs clearance and storage fees, ship service fees, health and quarantine fees, etc. The amount of port charges will affect whether shipping companies choose that port as their berthing port, and thus this will also have a certain impact on the cargo throughput of the port. However, the types and standards of charges among ports have somewhat converged due to the existence of mutual competition, and the differences are not significant. Since it does not have a significant impact on the size of the port cargo throughput, this factor is not considered in the selection indicators. Port infrastructure construction includes terminals and berths, container terminals, storage yards and warehousing facilities, ship service facilities, loading and unloading equipment, navigation facilities, port communication facilities, etc. Considering the difficulty of data collection and being limited by my academic level, this paper mainly selects the number of port berths (Tang et al., 2022) as the influencing factor on the cargo throughput of the port. To sum up, the variable descriptions are shown in Table 2.
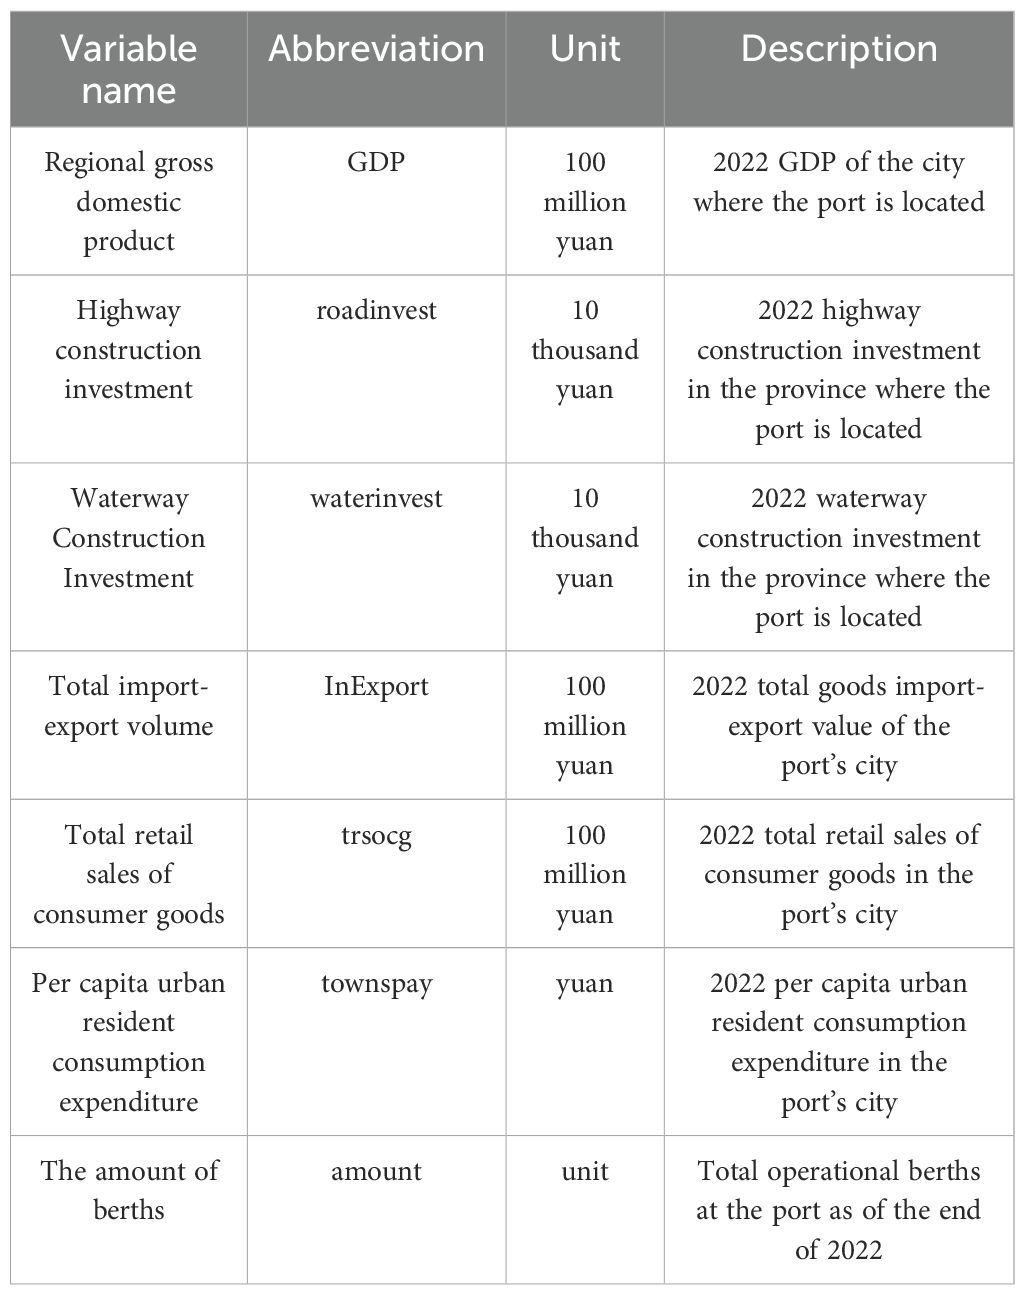
Table 2. Variable descriptions.
3.3 Data sources and types
The data used in this research are from multiple reliable data sources, covering various port hinterland conditions as well as their own conditions. These data mainly include the following aspects:
(1) Basic information data of ports: including the basic situation of each port, such as location, number of berths, cargo throughput, etc. The number of port berths and the volume of cargo throughput mainly come from the “Statistical Yearbook” released by the National Bureau of Statistics and the “Port Yearbook” of the industry. The latitude and longitude coordinates of the port are derived from the coordinate picker function of Baidu Maps.
(2) Economic indicator data of the port hinterland: This includes economic indicators such as the gross domestic product, foreign trade volume, total retail sales of consumer goods and per capita consumption expenditure of the region where the port is located. These data mainly come from the annual statistical data released by the National Bureau of Statistics, the statistics bureaus of various provinces and cities, and local governments.
(3) Transportation network data: This paper mainly collects data on the investment in highway construction and waterway construction in regions related to the capacity of the collection and distribution network. These data mainly come from the traffic network datasets released by the transportation department and related research institutions.
(4) Geographic information data: When conducting visual analysis of the results of the MGWR model using ArcGIS 10.8, the relevant maps were produced based on the standard map with the map review number GS(2024)0650 issued by the National Administration of Surveying, Mapping and Geoinformation.
3.4 Data preprocessing and organization
In this study, various collected data were strictly preprocessed and organized to ensure the accuracy and consistency of the data before data analysis was carried out. The main steps of preprocessing and organization include:
(1) Data cleaning: Clean the original data, handle missing values, outliers and duplicate values to ensure the integrity and consistency of the data. When conducting data statistics on the total volume of regional goods imports and exports, due to the inconsistent measurement units among various provinces and cities, this paper decides to unify it into the RMB. When converting to the US dollar, the exchange rate adopted is the average exchange rate of 2022.
(2) Data integration: Integrate data from different data sources to build a complete data set and provide a unified data source for subsequent analysis. When collecting data, the relevant indicators of the port hinterland economy can be obtained from the statistical yearbooks of each province and city, while the investment in road and waterway construction needs to be obtained from the data of the transportation industry, and the number of berths in the port needs to be obtained from the port statistical yearbook.
(3) Geographic information data processing: Use ArcGIS 10.8 to visualize and quantitatively analyze geographic information data and draw spatial distribution maps.
(4) Unified data format: Unifying the data format and naming conventions ensures the consistency and accuracy of the data, and provides convenience for subsequent data processing and analysis.
(5) Outlier handling: Identify and handle outliers that may affect the analysis results, and use appropriate methods to correct or eliminate them.
Through the above preprocessing and organization steps, the quality and analyzability of the data have been fully guaranteed, providing a solid and reliable basis for the subsequent model construction and in-depth analysis of the data.
4 Model fitting and results
This chapter conducts model fitting and analysis, further performing a comprehensive and detailed study on the factors influencing port cargo throughput.
4.1 Model establishment
Based on the relevant research conclusions and the analysis and evaluation of each index in this paper, the model established in this paper is as follows:
In (Equation 1), represents the cargo throughput of the i port in the study area, represents the regional GDP of the i port, represents the investment in highway construction in the hinterland of the i port, represents the investment in waterway construction in the hinterland of the i port, and represents the total import and export volume of goods in the hinterland of the i port, represents the total retail sales of consumer goods in the hinterland of the i port, represents the per capita consumption expenditure in the hinterland of the i port, and represents the number of berths in the i port. represents the local intercept for port i. is the local regression coefficient for the k-th explanatory variable at port i, varying across space. denotes the spatial coordinates of port i. is the error term for port i, capturing unexplained variation.
4.2 Fitting results of the MGWR model
Traditional regression models are prone to result bias when dealing with data with spatial effects. Therefore, spatial econometric models have attracted much attention in related fields. Spatial econometric models can be divided into global models and local models. The global model holds that the regression coefficient is fixed and independent of whether the observed object changes or not, thereby negating spatial heterogeneity. However, local models such as GWR addresses these limitations by simultaneously incorporating spatial dependency and heterogeneity, improving result accuracy and revealing spatially varying relationships among variables. The GWR model may overly emphasize the local influence between observation points and ignore the overall influence. In contrast, the MGWR model allows for scale variations in spatial relationships between independent and dependent variables by assigning distinct bandwidths to each independent variable. Therefore, it has higher calculation accuracy and better result credibility in terms of model principle. A comprehensive evaluation of these two models is the key to proving the credibility of the results. When running MGWR, an initial value needs to be set. Generally, there are four options for initialization: classical GWR estimation, half-parameter GWR estimation, least squares estimation, and all set to 0. In this paper, classical GWR estimation is chosen as the initial estimation. The convergence criterion adopts the SOC-f criterion, and the convergence value adopts 0.00001.
4.2.1 Global model
The results estimated using the global regression model are shown in Tables 3, 4. The R2 of the global regression model is 0.515, indicating that the model can explain 51.5% of the variation of the dependent variable. In the coefficient estimate item, regional GDP, investment in waterway construction, total import and export of goods, and the number of berths have a positive effect on the port cargo throughput. However, the investment in highway construction, the total retail sales of consumer goods in society and the consumption expenditure of urban residents are inversely correlated with the cargo throughput of ports. For example, the coefficient of regional GDP is 0.952. This data indicates that for every additional 100 million yuan of regional GDP in the region, the cargo throughput of the port will increase by 0.952 million tons. The coefficient of urban residents’ consumption expenditure is -0.138, indicating that for every 1,000 yuan increase in urban residents’ consumption expenditure, the cargo throughput of the port will decrease by 1.38 million tons. Among the selected seven influencing factors, the P-values of regional gross domestic product, investment in highway construction, investment in waterway construction and total retail sales of consumer goods were all less than 0.05. It can be considered that these four influencing factors were all significant. Among them, the largest coefficient estimates were regional GDP and total retail sales of consumer goods.
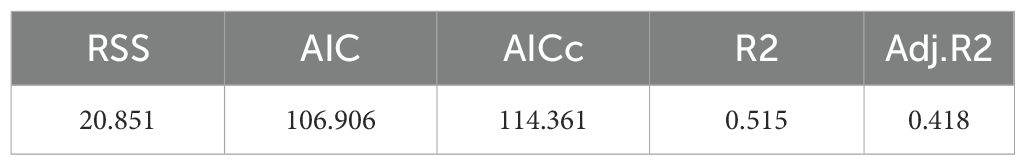
Table 3. Global regression model fitting index.
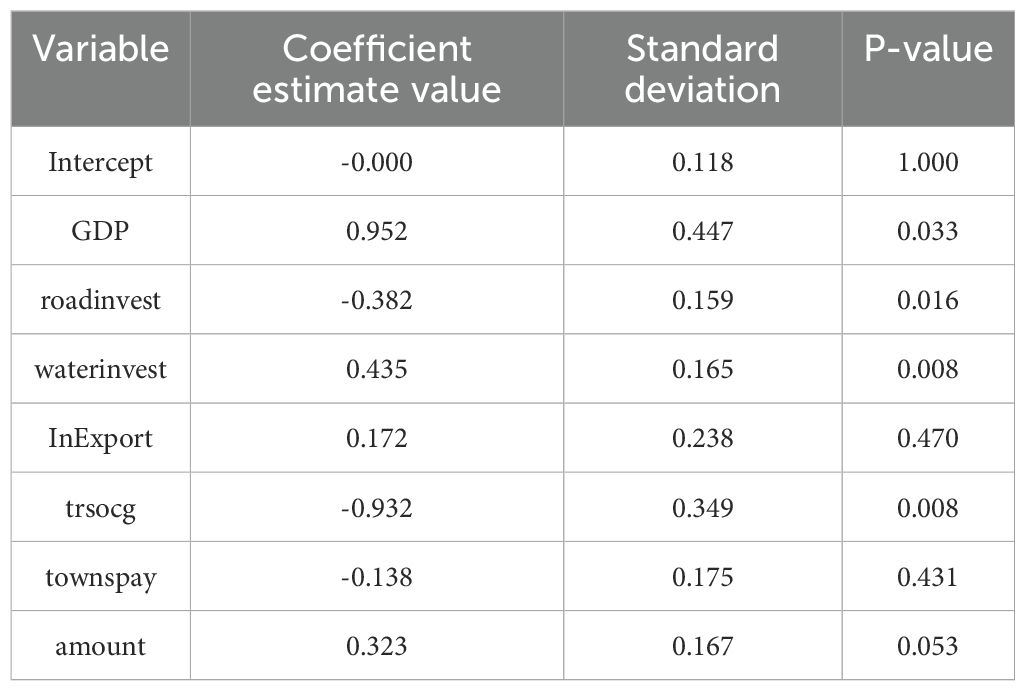
Table 4. Statistical description of coefficients of the global regression model.
It is evident that urban consumer spending and highway construction investments negatively impact port throughput. Regarding urban consumption expenditure, increased spending may lead to more goods being transported directly from production sites to retailers via road networks, thereby reducing the need for port transshipment. This phenomenon is particularly pronounced in coastal regions where well-developed logistics systems and efficient road transport facilitate cargo delivery, decreasing reliance on ports. As for highway construction investments, higher funding might divert some short-haul freight from ports to road networks. This occurs because road transport offers greater flexibility and timeliness in short-distance transportation, better meeting specific cargo demands.
The following are the meanings of each index in Tables 3, 4.
RSS (Residual Sum of Squares): It represents the sum of the squares of the differences between the predicted values of the model and the actual observed values. It is an important indicator in regression models, and its significance lies in measuring the degree of fit of the model to the data. The smaller the residual sum of squares, the better the model fitting effect.
AIC (Red Pool Information Criterion): A model evaluation metric designed to comprehensively consider the goodness of fit and complexity of the model, and is used for comparison among multiple models. The smaller the AIC value is, the better the model fits the data while considering the model complexity. Therefore, models with smaller AIC values are usually regarded as better models.
AICc: A modified form of AIC, specifically designed for model comparison in cases of small sample sizes. AICc takes into account the influence of sample size on AIC and makes corrections for smaller sample sizes. Therefore, it is more accurate when the sample size is smaller.
R2: A commonly used statistical indicator for measuring the degree of difference between the results of a regression model and the observed data. The calculation method is the proportion of the variance explained by the model to the total variance, that is, the ratio of the explained variability to the total variability. The value of R2 is between 0 and 1. The closer it is to 1, the smaller the difference between the model’s operation result and the actual value. The closer it is to 0, the greater the difference, and the poorer the model’s performance.
Adj.R2: Adjusted R2. Due to a problem with R2, that is, when more independent variables are added, R2 tends to increase rather than decrease, even if these independent variables have a negligible explanatory power for the model. Adjust R2 to correct the problem of R2 by considering the degrees of freedom of the model. It penalizes the increase in model complexity caused by adding too many independent variables, and thus is more appropriate when conducting model comparisons.
4.2.2 Local model
(1) Operation results of the GWR model
Tables 5, 6 present the results obtained using the GWR model. It can be seen from this that GWR adopts a fixed bandwidth of 10.24, accounting for 23.81% of the total sample points. After taking the effect of spatial heterogeneity into account in the model, the directions in which each variable acted on the dependent variable did not change. However, the R2 simulated by the GWR model was 0.605, which was larger than that of the global model. The RSS is 17.003 and the AICc value is 112.709, both of which are smaller than the values of the global regression model. Through comprehensive comparison, the fitting effect of GWR is better. In the operation results, there are a large number of significant samples in the four independent variables of regional GDP, investment in highway construction, investment in waterway construction and total retail sales of consumer goods. However, in the independent variables of total import and export volume and urban residents’ consumption expenditure, the regression results are generally not significant.

Table 5. Fitting index of GWR model.
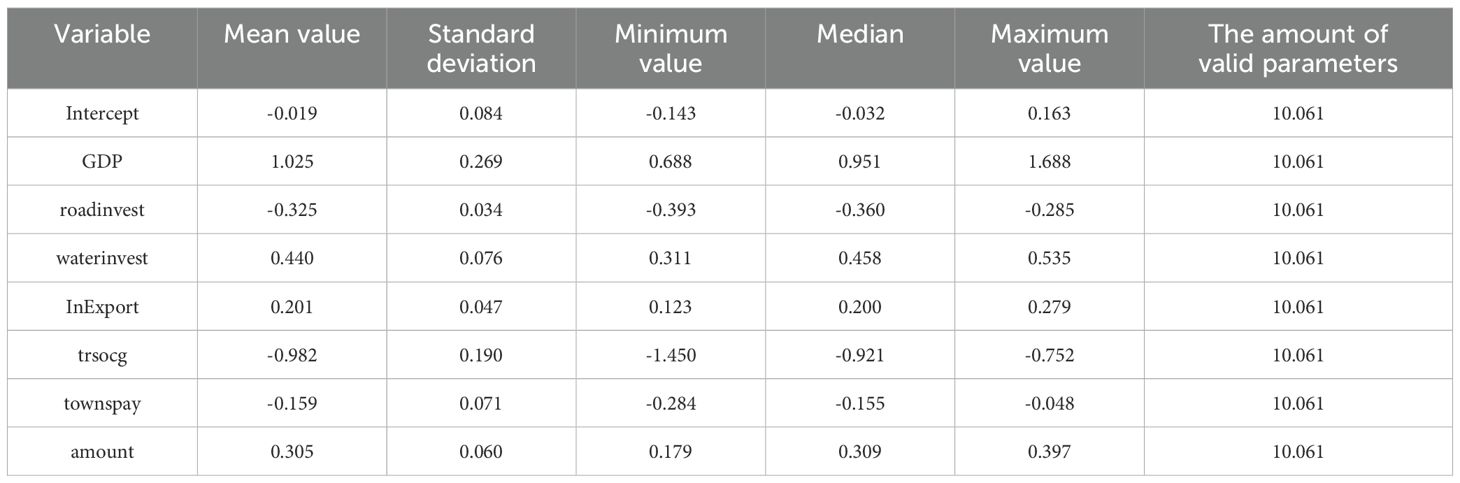
Table 6. Statistical description of GWR model coefficients.
(2) Operation results of the MGWR model
Tables 7, 8 present the results obtained using the MGWR model. Among them, the coefficient of the total regional cargo import and export volume obtained by the MGWR model has changed. It indicates that with the change of port location, the direction of the effect of the total regional cargo import and export volume on the port cargo throughput has changed, thereby reflecting spatial heterogeneity. The value of RSS obtained by the MGWR model is 12.409, and the value of AICc is 108.130. Compared with the global regression model and the GWR model, both have decreased. The value of R2 is 0.665, indicating that the MGWR model can explain 66.5% of the variation in port cargo throughput.
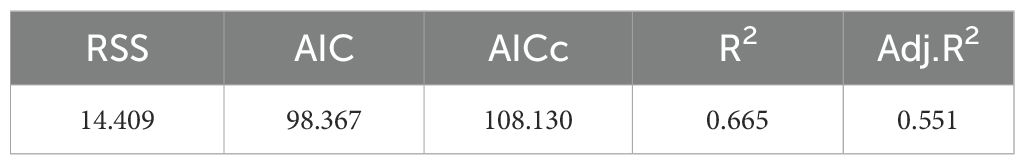
Table 7. Fitting index of MGWR model.
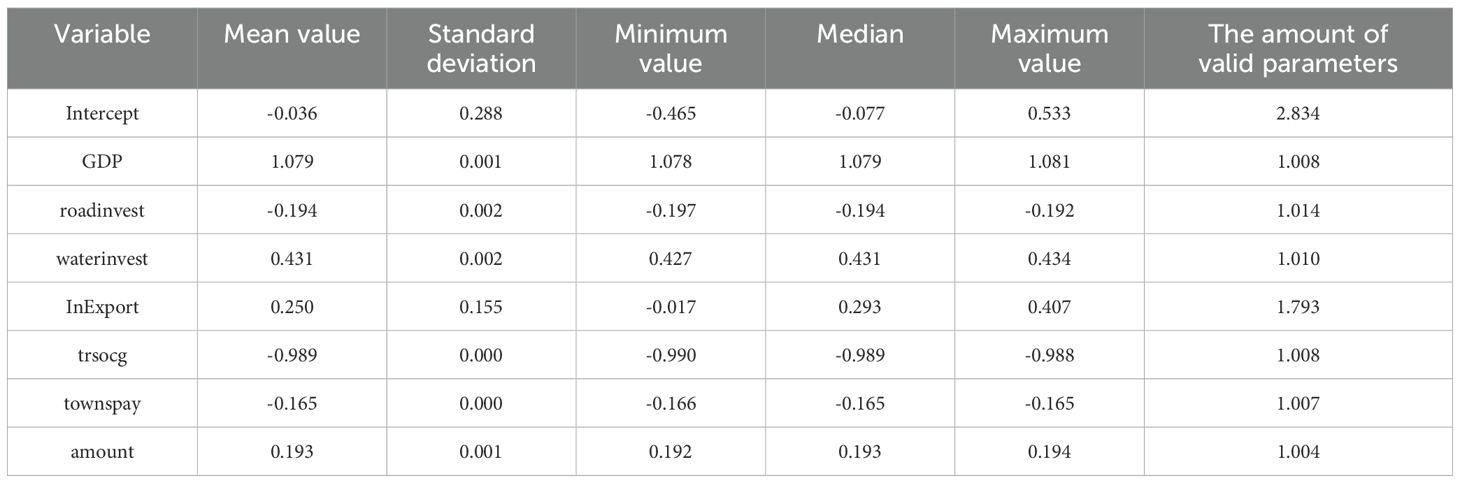
Table 8. Statistical description of MGWR model coefficients.
4.2.3 Model comparison
From Table 9, it can be seen that the goodness of fit R2 of the MGWR model is the highest among the three models, and the values of AICc and RSS are lower than those of the GWR model and the global regression model. Therefore, it can be judged that the fitting result of the MGWR model is the best among the three models. In terms of the number of valid parameters, the MGWR model has fewer valid parameters than the GWR model and has a smaller sum of squared residuals, indicating that it obtains regression results closer to the true values using fewer parameters.
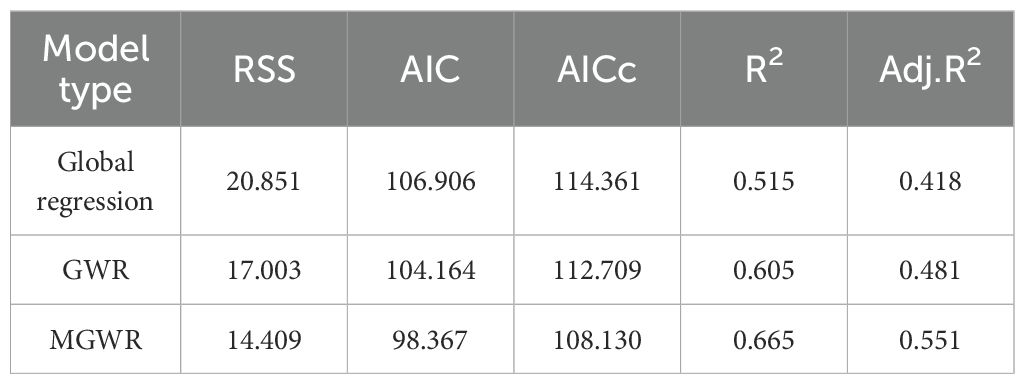
Table 9. Comparison of fitting indicators between the global regression model and the local regression model.
On the other hand, from the perspective of the overall regression coefficients, in the MGWR model, there are three coefficients that are significant overall, namely regional gross domestic product, investment in waterway construction, and total retail sales of consumer goods. However, in the GWR model, there are no variables that are significant overall. This indicates that the GWR model fails to take into account the scale differences among various variables. This leads to a lot of noise and deviation in the regression coefficients, making the fitted regression results not good enough. Summarizing the analysis of this study, it is found that the MGWR model outperforms the GWR model and the global regression model in predicting the cargo throughput of ports.
4.3 Analysis of the spatial influence of each variable on the cargo throughput of the port
The analysis examines the spatial effects of variables on port cargo throughput, investigates the spatial heterogeneity and parameter significance of variable coefficients, and employs ArcGIS 10.8 for visualization, quantitative analysis, and spatial distribution mapping.
4.3.1 Spatial heterogeneity
As shown in Table 10, the MGWR model assigns a bandwidth to each independent variable, which reflects the ability of the MGWR model to reflect the differential scale of action of different variables, while the GWR model only sets a fixed bandwidth, which does not reflect the differential scale of action of the variables. In the GWR model, the bandwidth is 10.42, accounting for 23.81% of the total sample size. However, through the calculation of MGWR, it is found that the action scales of different variables vary significantly. In the regression results of MGWR, the regression coefficients of the three variables, namely regional gross domestic product, investment in waterway construction and total retail sales of consumer goods, are generally significant (Hermoso et al., 2021). However, the regression coefficients of the four variables, namely the investment in highway construction, the total volume of goods import and export, the number of port berths, and the per capita consumption expenditure of urban residents, are not significant. The constant term represents the influence of different zone positions on the cargo throughput of the port when other independent variables are determined.
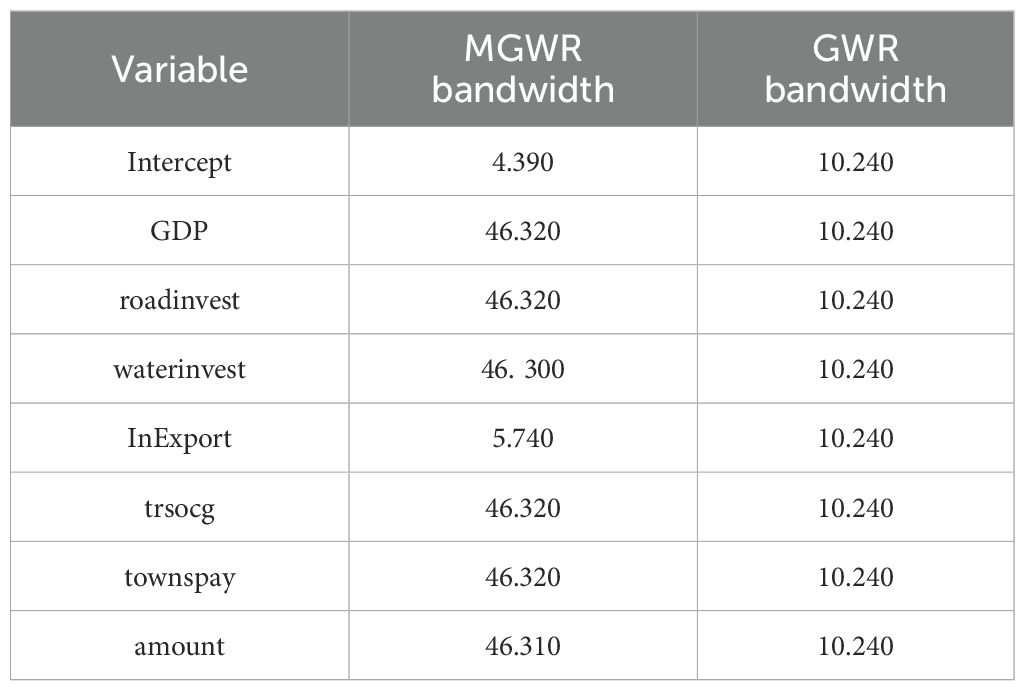
Table 10. Comparison of fitting indicators between the global regression model and the local .
Among them, this paper mainly controls the economic factors in the hinterland of the port. Therefore, the constant term reflects the influence of other location factors such as policies, regulations, and culture in the hinterland of the port on the cargo throughput of the port. Its scale of action is 4.39, accounting for 10.2% of the total sample size, which is much lower than the scales of action of other variables, indicating that the cargo throughput of the port is very sensitive to the changes in location. The effect scale of the total volume of regional goods imports and exports is also relatively small, at 5.74. This indicates that the influence of the total volume of regional goods imports and exports on the cargo throughput of ports varies greatly in space. It affects the cargo throughput of ports within a local range, and there is a strong spatial heterogeneity. The action scale of regional gross domestic product, investment in highway construction (Tsimoshynska et al., 2021), investment in waterway construction, total retail sales of consumer goods, the number of berths and urban residents’ consumption expenditure is 46.3, which belongs to the global scale. It indicates that these variables affect the cargo throughput of the port on a global scale, that is, there is almost no spatial heterogeneity (de Marsily et al., 2005).
4.3.2 Parameter significance
Statistical description of each coefficient of MGWR is shown in Table 8. Among the selected independent variables, the regression coefficients as a whole are significantly the three independent variables of regional GDP, investment in waterway construction and total retail sales of consumer goods. Among them, the regional GDP has a significant positive impact, which is also in line with the research results of most scholars. The spatial distribution of the influence of regional GDP is shown in Figure 1. Its coefficient shows a gradually increasing trend from south to north. The high values are mainly concentrated between the ports in North China and Northeast China. The industrial structure in this region is more inclined towards heavy industrialization. These industries require a large amount of raw materials and intermediate products, and the products they produce often need to be exported through ports or imported from ports. Therefore, it is greatly influenced by the regional GDP. The coefficient of regional GDP ranges from 1.078 to 1.081, with a mean value of 1.079 and a standard deviation of 0.001. It is indicated that for every 100 million yuan increase in regional GDP, the increase in port cargo throughput reaches 10,7,800 to 10,8,100 tons, with an average increase of 10,7,900 tons. The growth rates vary little among different regions. Since regional GDP is a global variable, on the whole, the influence of regional GDP on ports across various regions is not significantly different. According to the absolute value of the coefficient, its influence degree is the most significant among all variables.
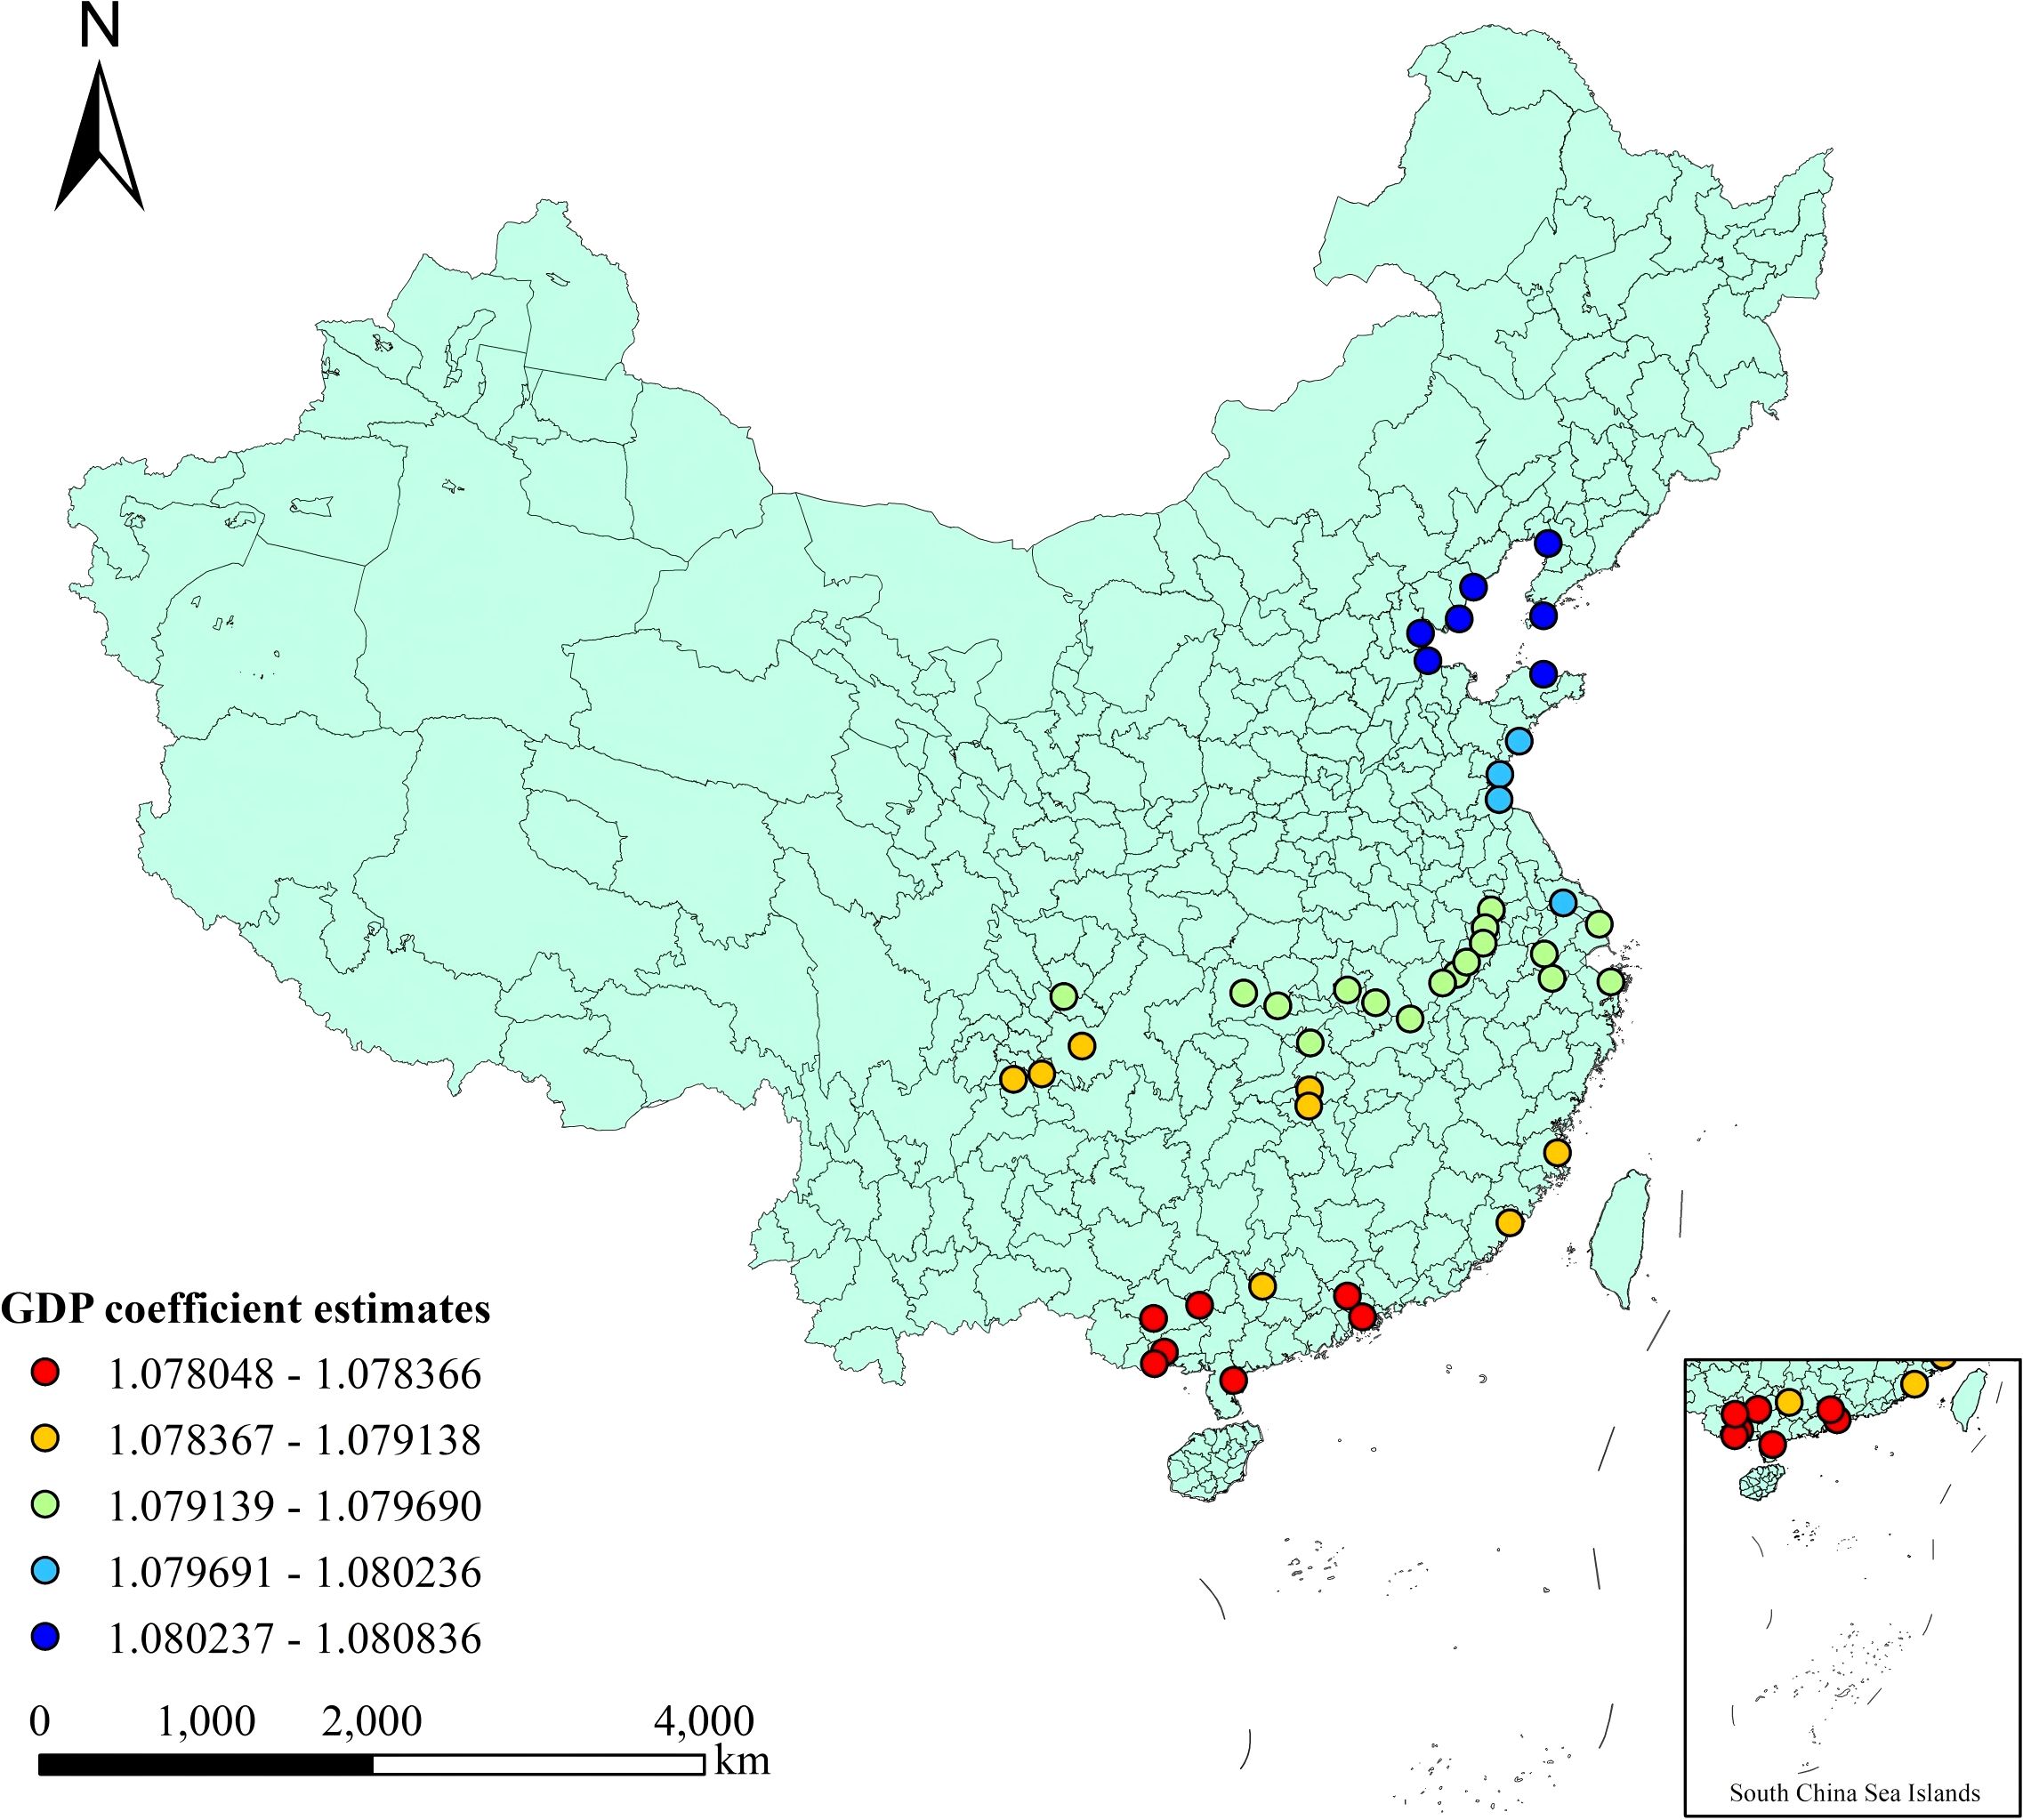
Figure 1. Regional gross domestic product (GDP).
The investment amount factor of waterway construction significantly and positively affects the cargo throughput of ports. The higher the investment amount of waterway construction (Wei, 2013) in the hinterland of the port, the higher the cargo throughput of the port. The spatial distribution of the influence of this factor is shown in Figure 2. Its influence intensity shows a gradually increasing trend from west to east. Among them, the low values are mainly located in the ports between the southwest and South China regions. It indicates that the increase in waterway construction investment in this region does not lead to a significant improvement in the cargo throughput of the port. This further shows that the waterway construction measures in this region are relatively complete compared with those in other regions. The coefficient of the investment amount in waterway construction ranges from 0.427 to 0.434, with an average value of 0.431 and a standard deviation of 0.002. It is indicated that for every 10,000 yuan increase in the investment in waterway construction in the region, the cargo throughput of the port in the region will increase by 0.427 to 0.434 million tons, with an average increase of 0.431 million tons. This coefficient does not change much in different regions. Observed from the absolute value of the coefficient, its influence degree is at a medium level among all variables.
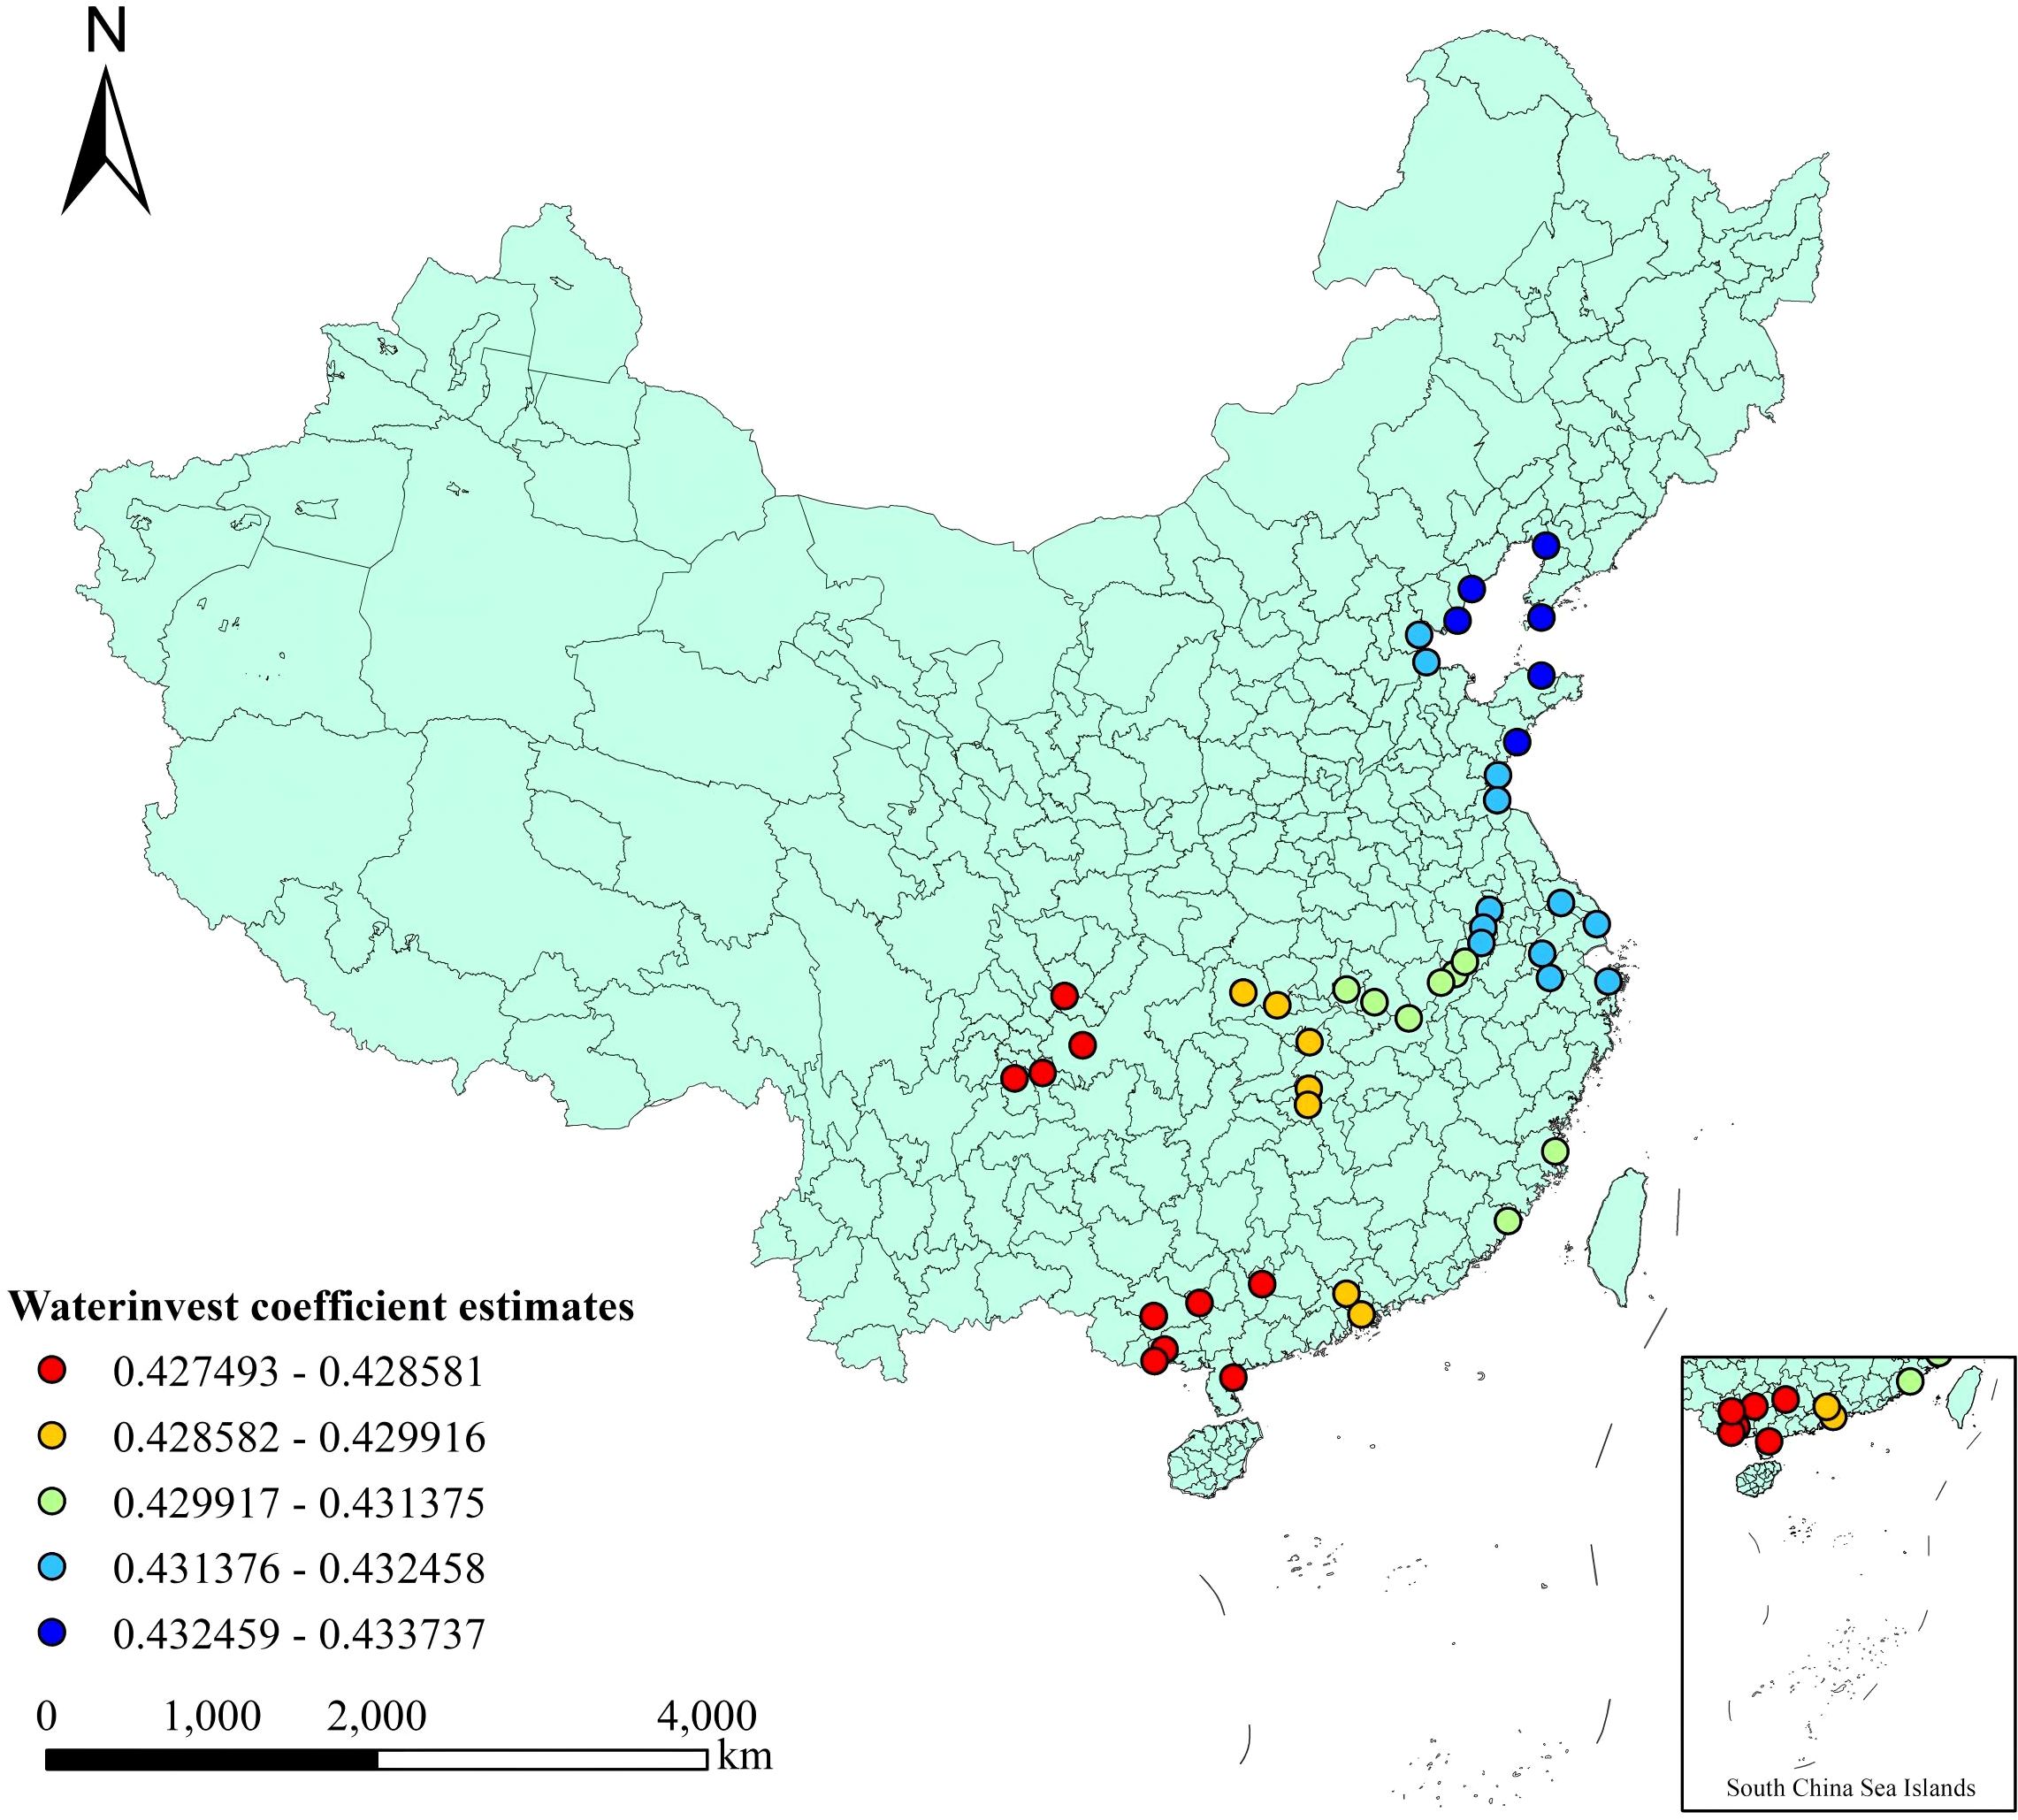
Figure 2. Investment in waterway construction.
What significantly and negatively affects the cargo throughput of ports is the total retail sales of consumer goods in society (Shen and Dong, 2019). The negative impact on total retail sales (trsocg) may be linked to the current logistics and transportation model. As the logistics network continues to improve, more goods are being transported directly from production sites to retailers, reducing the need for port transshipment. This trend is particularly evident in coastal areas, where a well-developed transportation network has further intensified it. Therefore, ports must adapt to these changes by optimizing their logistics layout and enhancing their competitiveness. The spatial distribution of the influence of this factor is shown in Figure 3, and its influence intensity shows an increasing trend from east to west. In terms of the absolute value of the coefficient, the ports located in Sichuan Province and Chongqing Municipality are least affected. The economies of these regions are more diversified, including not only consumer goods manufacturing and retail but also heavy industry. The production of heavy industry usually requires a large amount of raw materials and intermediates, so the demand for port cargo throughput is relatively high and is less affected by the total retail sales of consumer goods in society. The ports located in Shanghai, Zhejiang and Fujian have been most affected. These ports are in coastal areas with developed transportation and more mature logistics networks. Producers will choose road transportation more often and thus have been more affected. The coefficient of the total retail sales of consumer goods ranges from -0.990 to -0.988, with an average value of -0.989. This indicates that for every 100 million yuan increase in the total retail sales of consumer goods, the decrease in the cargo throughput of the port is between 0.988 and 0.990 million tons, with an average decrease of 0.989 million tons. Furthermore, a standard deviation of 0.000 indicates that the volatility of the data is relatively small.
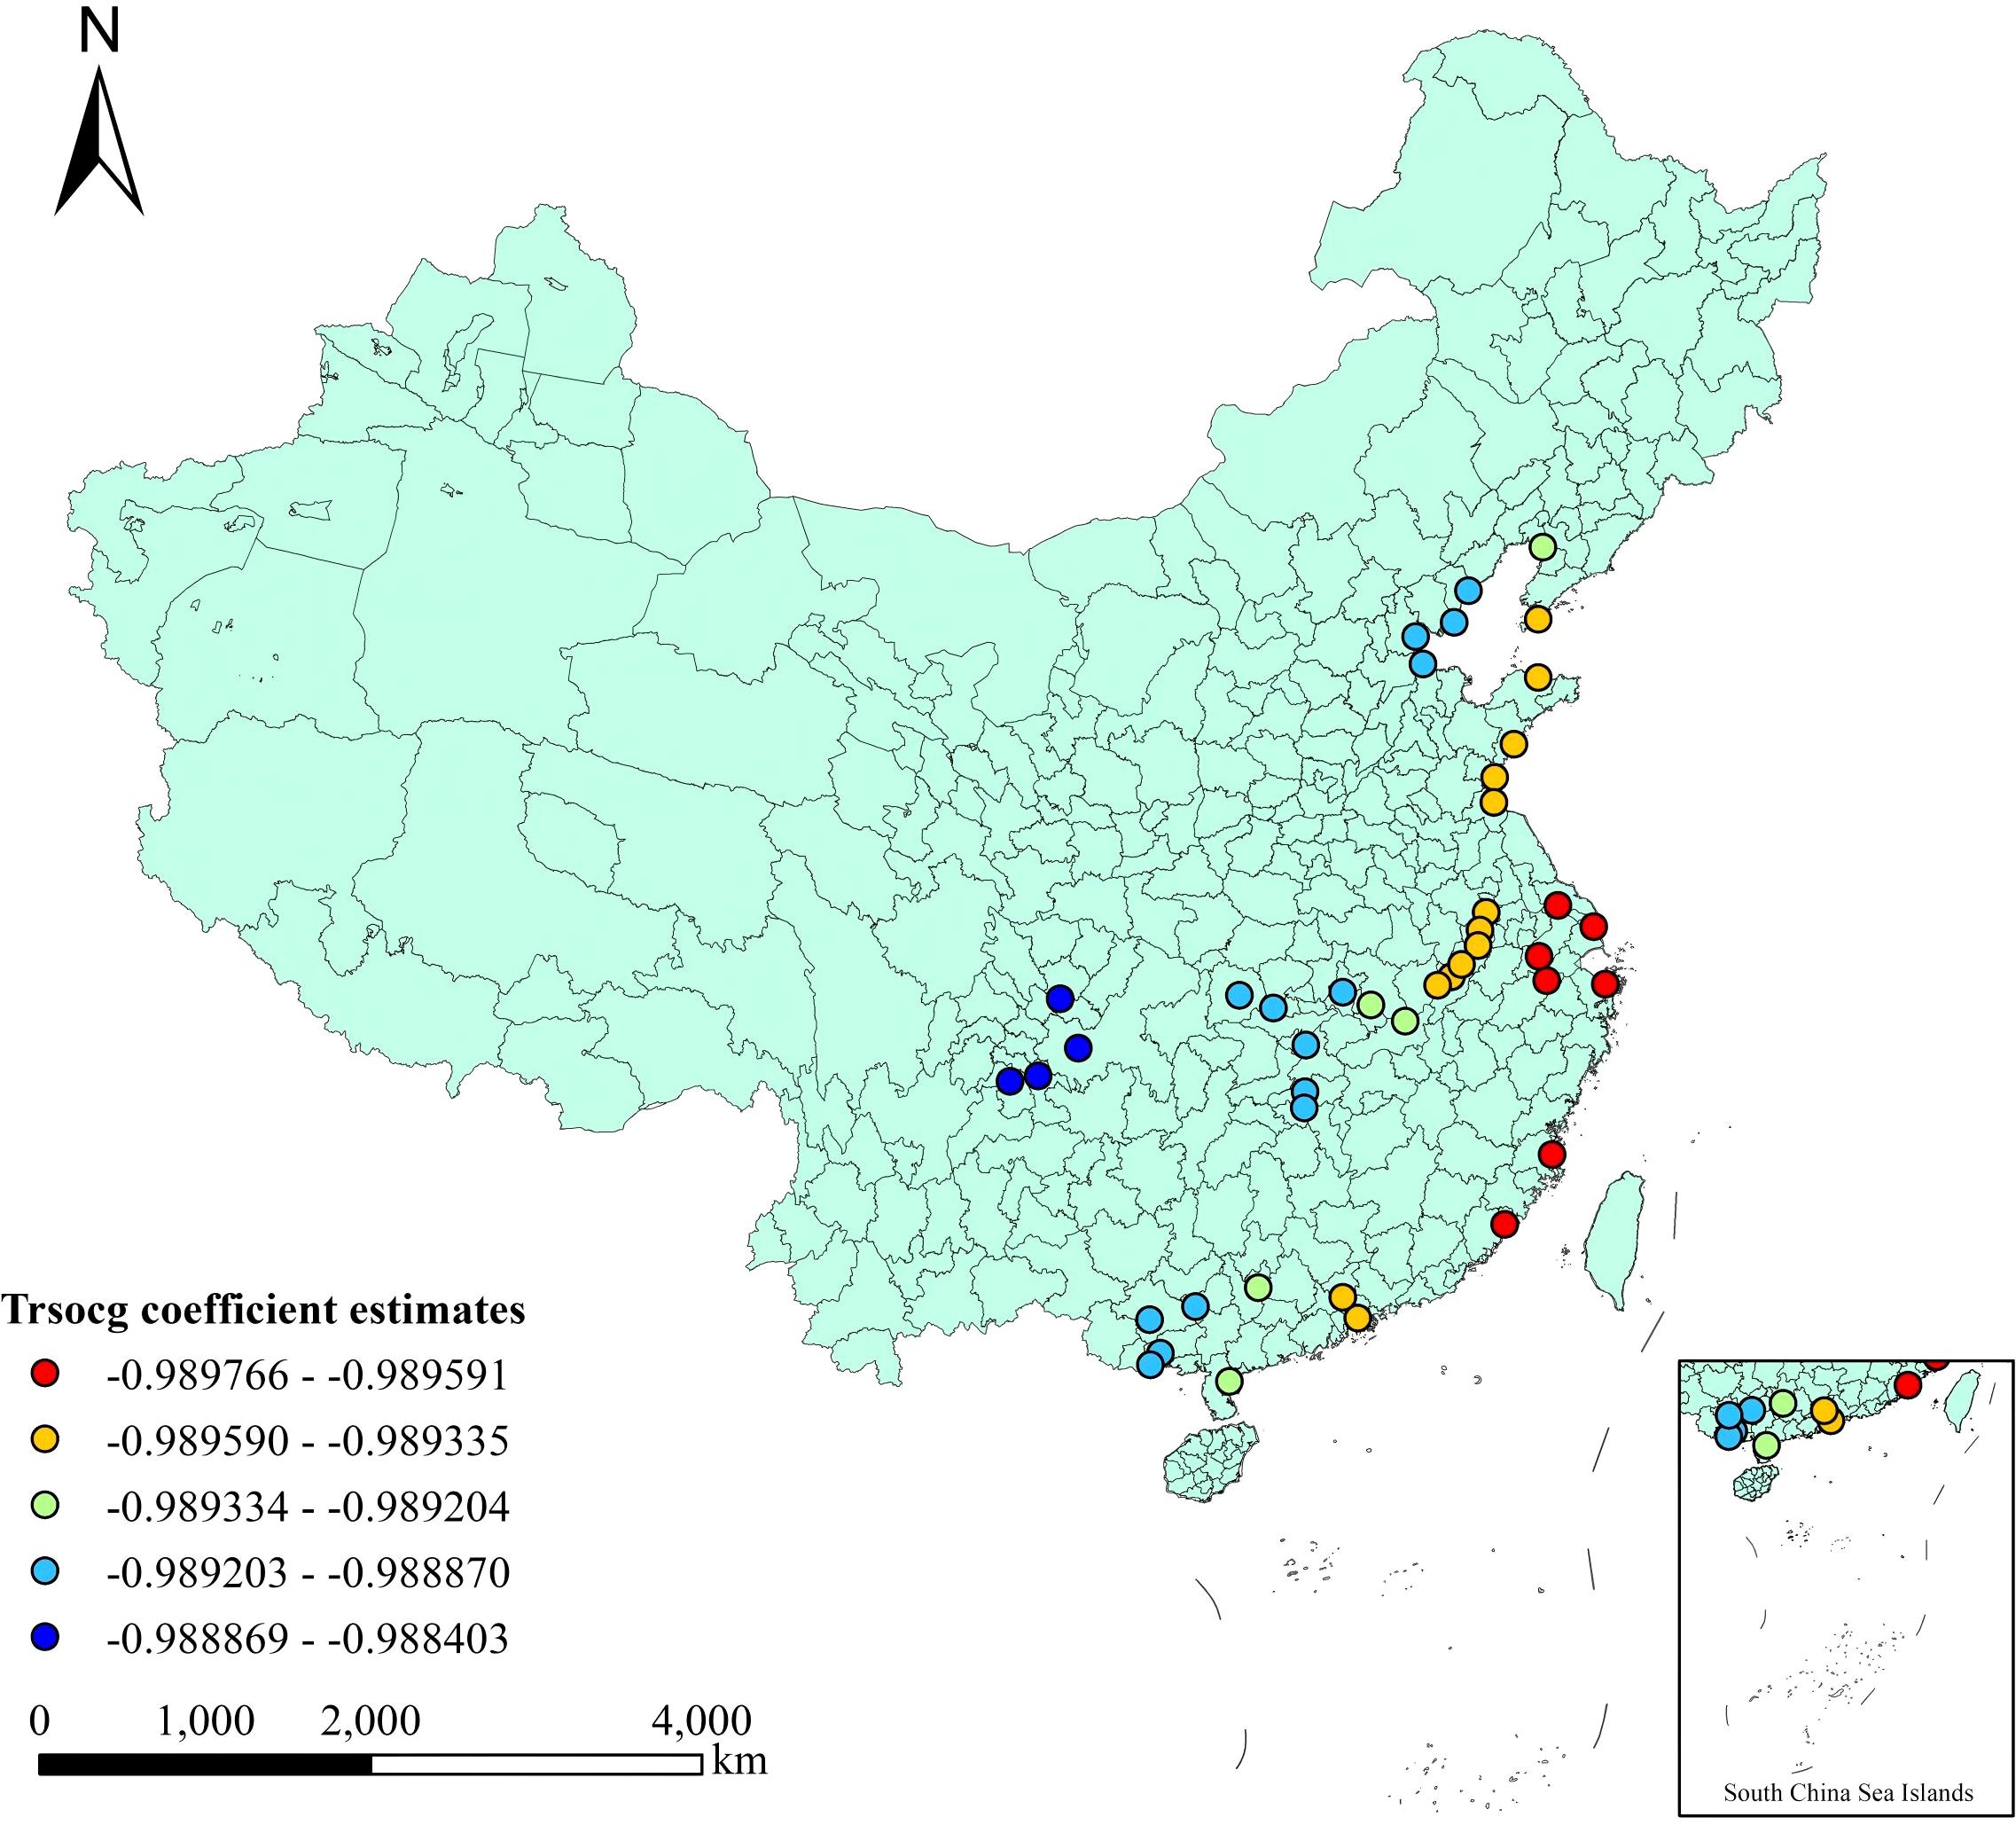
Figure 3. Total retail sales of consumer goods.
Among the non-significant influencing factors, the coefficient of total import and export volume of goods ranges from -0.017 to 0.407, with an average value of 0.250. Its variation range is the largest among the selected seven influencing factors, and the direction of influence on the cargo throughput of the port changes due to the change in the geographical location of the port. The spatial distribution of this influencing factor is shown in Figure 4. Among them, the cargo throughput of the three ports located in Guangxi Province is negatively affected by the total volume of cargo import and export (Branch, 2013). There are more competitive ports around this region, such as those in Hainan and Guangdong Province. These ports provide more convenient services and better facilities, thereby attracting a part of the cargo import and export flow (Jones et al., 2011) in Guangxi Province. The cargo throughput through the ports of Guangxi has been reduced. Other ports, however, have been positively affected, indicating that as the total volume of goods import and export increases, so does the cargo throughput of the ports. Among them, the ports in North China and East China have been most affected. This region is located in the coastal area and has a developed economy with more international trade. The ports to which it belongs are more affected by the total volume of goods import and export.
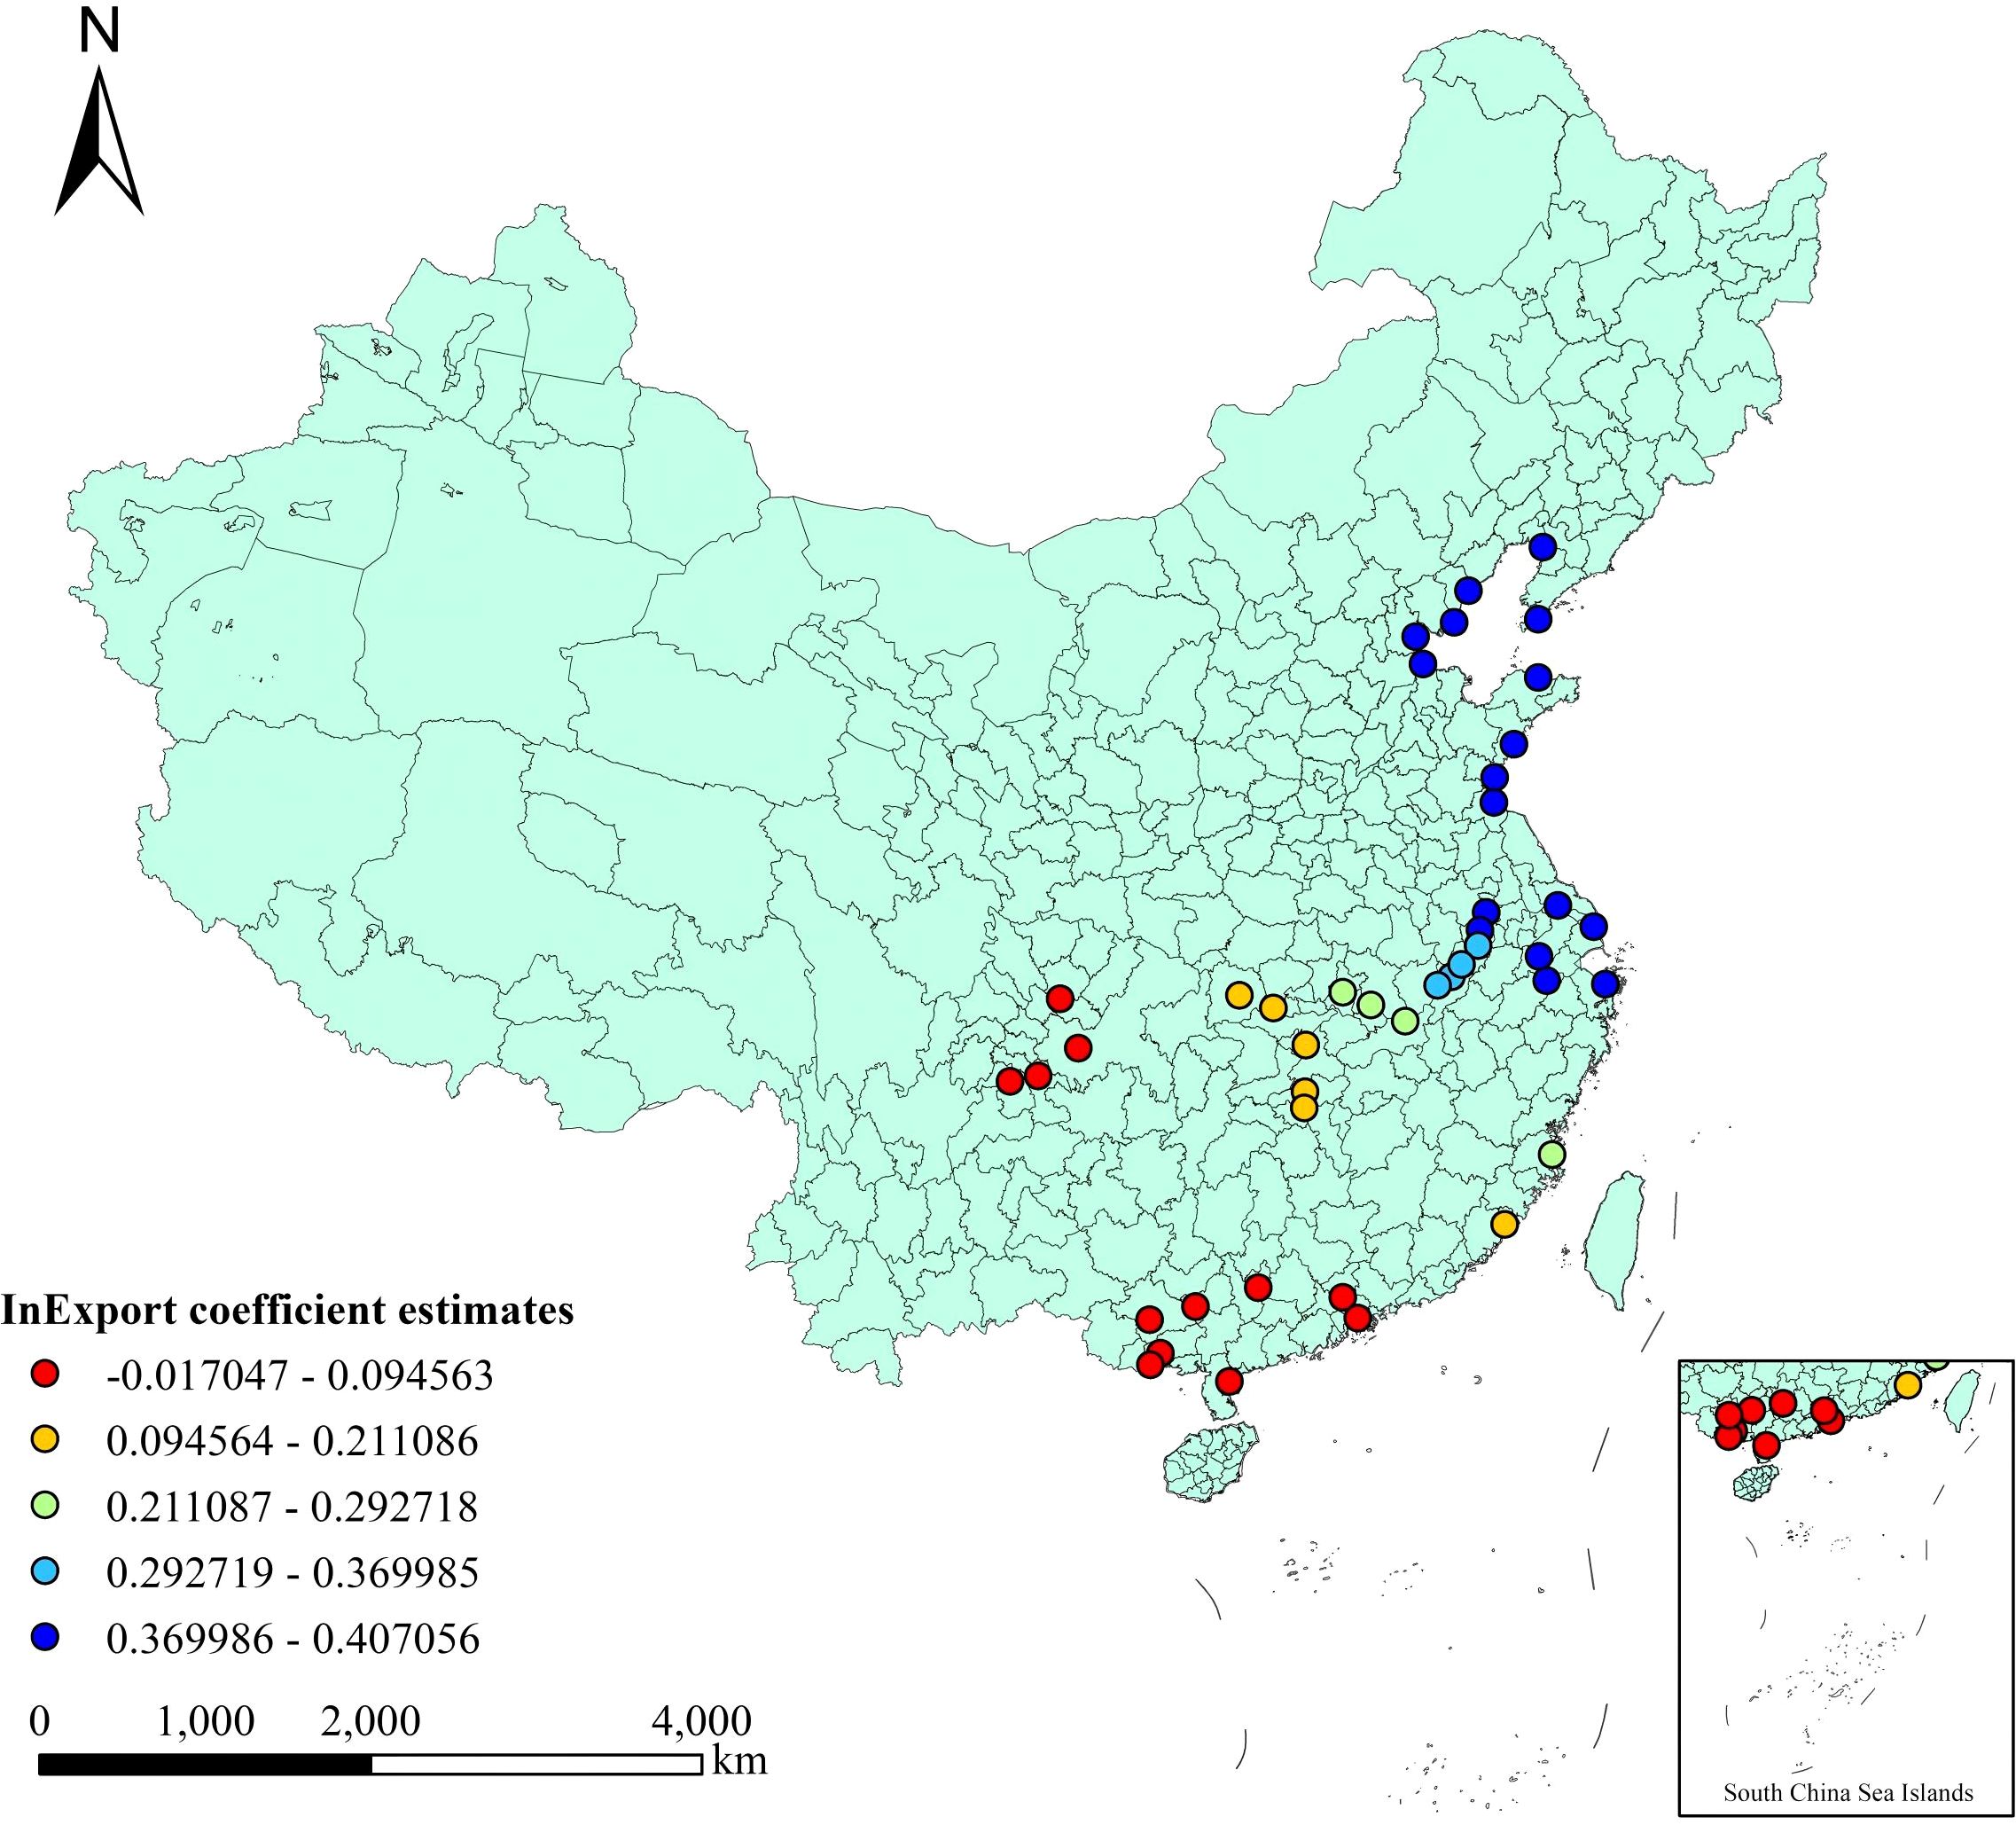
Figure 4. Total volume of goods import and export.
4.4 Local parameter estimation and local R² interpretation
The in-depth analysis of local parameter estimates reveals spatially varying magnitudes of variable impacts on port cargo throughput. Simultaneously, the interpretation of local R² values illustrates the model fit, providing a comprehensive perspective to understand influencing factors and their spatial distribution patterns.
4.4.1 Local parameter estimation
The estimated values and P-values of local parameters are presented in the appendix. Among them, the three variables with overall significant regression coefficients are regional gross domestic product, investment in waterway construction, and total retail sales of consumer goods. The positive and negative values of the intercept term coefficients have changed among different sample points, indicating that different geographical locations have different effects on the cargo throughput of ports. The coefficients of the intercept term are mostly positive in the selected coastal ports, but in the inland river ports, the coefficients of most ports are negative. It indicates that the cargo throughput of a port is relatively greatly affected by its geographical location. The geographical location has a positive impact on the cargo throughput of ports in coastal cities, while it has a negative impact on that of ports in inland cities. Among the coefficients of the total volume of goods import and export, this coefficient is positive for the vast majority of ports, indicating that the total volume of goods import and export has promoted the cargo throughput of the ports. However, in Zhanjiang Port, Qinzhou Port, Fangchenggang Port and Nanning Port, this influencing factor has suppressed the cargo throughput of the ports. The coefficients of regional gross domestic product and total retail sales of consumer goods do not vary much among various ports. However, in the coefficients of investment in waterway construction, it is found that the values of coastal ports are larger than those of inland ports, indicating that when the same investment is invested in waterway construction, the added value of port cargo throughput of coastal ports is greater than that of inland ports. This is because the geographical location of coastal ports is closer to the world’s major shipping routes, resulting in a greater volume of trade.
Except for the intercept term, the influence of geographical location and the total amount of goods import and export, the number of samples selected for the regression of other independent variables is basically 41 to 43, which is close to the global scale. The number of regression samples used in the intercept term is concentrated in 8 to 11 and 15 to 18 respectively, and the number of samples used in the total volume of goods import and export is concentrated in 14 to 15 and 18 to 24 respectively. It can be seen that the spatial heterogeneity of the intercept term is the greatest, followed by the total volume of goods import and export, while other influencing factors are basically at the global scale and have relatively small spatial heterogeneity.
4.4.2 Local R² interpretation
The local R2 values of each port are shown in the appendix. It can be found from the table that the goodness of fit of the vast majority of each port is greater than 60%. Among them, the goodness of fit of Zhanjiang Port, Qinzhou Port, Fangchenggang Port, Guigang Port, Nanning Port, Chongqing Port, Luzhou Port, Yibin Port and Nanchong Port reached 70%, indicating that the model can explain 70% of the variation in the cargo throughput of the ports. The fitting effect of the model is good. The above nine ports all belong to the southwest and South China regions. This also indicates that all the ports in this region can refer to the model established in this paper for the prediction of port cargo throughput and the formulation of related strategies. Furthermore, when comparing coastal ports and inland river ports, it is found that the fitting effect of inland river ports is generally better than that of coastal ports. Thus, it can be concluded that the model fits well in the ports of the southwestern and South China regions, being able to explain 70% of the variation in cargo throughput. This indicates that ports in these regions share similar characteristics in operation and management, and the model can provide valuable insights for their development. However, the model’s fit is relatively weaker in coastal ports, which may be attributed to their complexity. Coastal ports are subject to the combined influences of international trade, policies, and regulations, making it difficult for a single model to fully capture their intricacies.
5 Conclusion and suggestions
Based on the preceding analysis, the following conclusions and recommendations are proposed.
5.1 Conclusion
Based on the attribute of allocating the respective bandwidth to each variable in the MGWR model, this paper explores the scale of action and spatial heterogeneity of the influencing factors of port cargo throughput, and compares the fitting results of the global regression model and the GWR model, obtaining the following conclusions:
(1) Compared with the global regression model and the GWR model (Shabrina et al., 2021), the MGWR model has higher reliability and higher fitting degree (Fotheringham et al., 2017). This is mainly because the MGWR model can allocate different bandwidths to different variables (Fotheringham et al., 2022), thereby avoiding the possibility of selecting sample values with large deviations during regression. By comparing with the global regression model, it is found that considering the spatial scale of influencing factors into the model will have a very significant impact on the results and analysis of the model.
(2) The cargo throughput of ports is highly sensitive to location and shows strong spatial heterogeneity. Generally the cargo throughput of coastal ports is greater than that of inland river ports. The bandwidth of the total import and export volume of goods in the hinterland of the port accounts for 13.3% of the total sample points, and there is also a strong spatial heterogeneity. This indicates that the impact of the total import and export volume of goods in different regions on the cargo throughput of the port in that region varies greatly. The scales of regional gross domestic product, investment in highway construction, investment in waterway construction, total retail sales of consumer goods, consumption expenditure of urban residents and the number of port berths are close to the global scale, and the spatial heterogeneity is very weak.
(3) Regional GDP, investment in waterway construction, total volume of goods import and export, and the number of berths all positively affect the cargo throughput of ports. However, what have a negative impact on the cargo throughput of ports are location, investment in highway construction, total retail sales of consumer goods, and consumption expenditure of urban residents. Among all the influencing factors, the regional GDP is the most significant factor affecting the cargo throughput of ports, followed by the total retail sales of consumer goods and the investment in waterway construction. The investment in highway construction, the total volume of goods import and export, and the number of berths have relatively small influences, while the influence of urban residents’ consumption expenditure is the weakest. Studies have proved that the model results of MGWR have a significant improvement compared with the global regression model and the GWR model considering spatial heterogeneity. At the same time, it is also more applicable to the research on the influencing factors affecting the cargo throughput of ports.
5.2 Suggestions for port management and construction
Based on the above conclusions, some suggestions are put forward for port management and construction.
(1) Promoting regional GDP growth: In this study, it is found that the most important factor affecting port cargo throughput is regional GDP. Therefore, local governments and economic departments can promote regional economic growth by supporting local industrial development and increasing industrial added value, so as to drive the growth of port cargo throughput.
(2) Increase support for waterway construction investment: This study finds that increased investment in waterway infrastructure, including channel dredging and port wharf construction, positively impacts the cargo throughput of ports. Therefore, governments and port managers should consider boosting their investments in waterway infrastructure to enhance the transportation capacity and efficiency of ports.
(3) Further expansion of international trade: The positive impact of total import and export volume on port cargo throughput shows that economic activities and international trade are crucial to port operations. Therefore, it is suggested that customs and trade administration departments pay close attention to regional economic development and trade conditions, and formulate corresponding port development strategies.
(4) Optimizing port layout and expanding berths: The number of berths positively impacts the port’s cargo throughput in this study. Therefore, it is suggested that port authorities should timely expand port berths to improve loading and unloading capacity and service quality. Additionally, a well-planned port layout should be implemented to maximize berth utilization, thereby improving the port’s cargo handling capacity.
(5) Strengthen the management of highway construction investment: This study found that highway construction investment negatively impacts port cargo throughput, suggesting that over-reliance on road transport could adversely affect port cargo flow. Therefore, it is suggested that local governments and transportation departments take measures in traffic planning to balance road and waterway transportation, so as to reduce the over-dependence on expressway construction.
Collectively, these measures can enhance port efficiency, competitiveness, and sustainable growth.
5.3 Deficiencies and prospects
Due to time constraints, this study was limited to 43 ports in mainland China, resulting in a relatively small sample size. Future research could broaden the geographical scope to encompass ports across Asia and incorporate time-series analyses for individual ports, which would enhance the model’s goodness of fit and provide deeper insights into temporal dynamics. During the research process of this paper, the influencing factors of port cargo throughput were selected rather subjectively. Due to the difficulty of data acquisition, only seven influencing factors were selected for modeling and analysis. In the subsequent research, an index system can be constructed from aspects such as the politics, education, laws and regulations of the port hinterland, and the construction of the port itself. Furthermore, although the overall fitting effect of the MGWR analysis adopted in this paper is relatively good, there is still a lack of corresponding correction models to correct the estimation results of port cargo throughput. If the corresponding models can be used to correct the results, the fitting effect of the MGWR model will be better.
Data availability statement
The original contributions presented in the study are included in the article/Supplementary Material. Further inquiries can be directed to the corresponding author.
Author contributions
RG: Writing – original draft. GX: Writing – review & editing. CZ: Writing – original draft. QL: Writing – review & editing.
Funding
The author(s) declare that no financial support was received for the research and/or publication of this article.
Acknowledgments
The authors would like to thank the reviewers for their insightful comments and suggestions that greatly improved this work. We also express our gratitude to the editors for their professional guidance throughout the review process.
Conflict of interest
The authors declare that the research was conducted in the absence of any commercial or financial relationships that could be construed as a potential conflict of interest.
The author(s) declared that they were an editorial board member of Frontiers, at the time of submission. This had no impact on the peer review process and the final decision.
Generative AI statement
The author(s) declare that no Generative AI was used in the creation of this manuscript.
Publisher’s note
All claims expressed in this article are solely those of the authors and do not necessarily represent those of their affiliated organizations, or those of the publisher, the editors and the reviewers. Any product that may be evaluated in this article, or claim that may be made by its manufacturer, is not guaranteed or endorsed by the publisher.
Supplementary material
The Supplementary Material for this article can be found online at: https://www.frontiersin.org/articles/10.3389/fmars.2025.1637660/full#supplementary-material
References
Akyıldız H., Mentes A., and Bayraktarkatal E. (2025). A strategic management perspective and sustainability of smart port facilities in Turkey. Aust. J. Marit. Ocean Aff. 17, 1–20. doi: 10.1080/18366503.2025.2480948
Bǎdin L., Daraio C., and Simar L. (2010). Optimal bandwidth selection for conditional efficiency measures: A data-driven approach. Eur. J. Oper. Res. 201, 633–640. doi: 10.1016/J.EJOR.2009.03.038
Behdani B., Wiegmans B., Roso V., and Haralambides H. (2020). Port-hinterland transport and logistics: emerging trends and frontier research. Marit. Econ. Logist. 22, 1–25. doi: 10.1057/S41278-019-00137-3
Bernacki D. and Lis C. (2024). Sustainable gains from inland waterway investments at port-city interface. Renew. Sustain. Energy Rev. 200, 114584. doi: 10.1016/J.RSER.2024.114584
Cao X. Y., Shi Y. S., Zhou L. L., Tao T. H., and Yang Q. Q. (2021). Analysis of factors influencing the urban carrying capacity of the shanghai metropolis based on a multiscale geographically weighted regression (MGWR) model. Land 10, 578. doi: 10.3390/LAND10060578
Cong L. Z., Zhang D., Wang M. L., Xu H. F., and Li L. (2020). The role of ports in the economic development of port cities: Panel evidence from China. Transp. Policy 90, 13–21. doi: 10.1016/J.TRANPOL.2020.02.003
Delfin-Ortega O. (2025). Maritime logistics and economic growth in the context of APEC: a two-stage data envelopment analysis study. J. Shipp. Trade 10, 2. doi: 10.1186/S41072-024-00191-Y
de Marsily G., Delay F., Gonçalvès J., Renard P., Teles V., and Violette S. (2005). Dealing with spatial heterogeneity. Hydrogeol. J. 13, 161–183. doi: 10.1007/S10040-004-0432-3
Eskafi M., Kowsari M., Dastgheib A., Ulfarsson G. F., Taneja P., and Thorarinsdottir R. I. (2020). Mutual information analysis of the factors influencing port throughput. Marit. Bus. Rev. 6, 129–146. doi: 10.1108/MABR-05-2020-0030
Fotheringham A. S., Yang W., and Kang W. (2017). Multiscale geographically weighted regression (MGWR). Ann. Am. Assoc. Geogr. 107, 1247–1265. doi: 10.1080/24694452.2017.1352480
Fotheringham A. S., Yu H. C., Wolf L. J., Oshan T. M., and Li Z. Q. (2022). On the notion of ‘bandwidth’ in geographically weighted regression models of spatially varying processes. Int. J. Geogr. Inf. Sci. 36, 1485–1502. doi: 10.1080/13658816.2022.2034829
Hermoso J. C. M., Sadang J. M. M., Evangelista N. C. B., and Rosete M. A. L. (2021). The effects of infrastructure investments on services and wholesale/retail productivity: A panel-data evidence from the Philippines. Malaysian J. Soc Sci. Humanit. 6, 233–246. doi: 10.47405/MJSSH.V6I12.1186
Hesse M. and Rodrigue J. P. (2004). The transport geography of logistics and freight distribution. J. Transp. Geogr. 12, 171–184. doi: 10.1016/J.JTRANGEO.2003.12.004
Jones D. A., Farkas J. L., Bernstein O., Davis C. E., Turk A., Turnquist M. A., et al. (2011). U.S. import/export container flow modeling and disruption analysis. Res. Transp. Econ. 32, 3–14. doi: 10.1016/J.RETREC.2011.06.003
Ke L. Q., Liu Q., Ng A. K. Y., and Shi W. M. (2024). Quantitative modelling of shipping freight rates: developments in the past 20 years. Marit. Policy Manage. 51, 442–460. doi: 10.1080/03088839.2022.2138595
Kolesnikov M. V., Lyabakh N. N., Mamaev E. A., and Bakalov M. V. (2020). Efficient and secure logistics transportation system. IOP Conf. Ser. Mater. Sci. Eng. 918, 12031. doi: 10.1088/1757-899X/918/1/012031
Li W. J., Bai X. W., Yang D., and Hou Y. (2023). Maritime connectivity, transport infrastructure expansion and economic growth: A global perspective. Transp. Res. Part A Policy Pract. 170, 103609. doi: 10.1016/J.TRA.2023.103609
Li Z. Q. and Fotheringham A. S. (2020). Computational improvements to multi-scale geographically weighted regression. Int. J. Geogr. Inf. Sci. 34, 1378–1397. doi: 10.1080/13658816.2020.1720692
Li M. H., Yang X. M., Wang Y., Wang Y. H., and Zhu J. F. (2024a). The use of the GWPCA-MGWR model for studying spatial relationships between environmental variables and longline catches of yellowfin tunas. J. Mar. Sci. Eng. 12, 1002. doi: 10.3390/JMSE12061002
Li Y. J., Yin M., and Ge J. W. (2024b). The impact of port green competitiveness on the hinterland economy: A case study of China. PloS One 19, e0311221. doi: 10.1371/JOURNAL.PONE.0311221
Liu M. L. (2020). Research on port infrastructure, port efficiency and urban trade development. J. Coast. Res. 115, 220–222. doi: 10.2112/JCR-SI115-069.1
Liu L. C. and Park G. K. (2011). Empirical analysis of influence factors to container throughput in Korea and China ports. Asian J. Shipp. Logist. 27, 279–303. doi: 10.1016/S2092-5212(11)80013-1
Martínez-Moya J., Vanelslander T., Feo-Valero M., and Debón A. (2025). Transhipment port competitiveness assessment: the importance of port location. WMU J. Marit. Aff. 24, 179–199. doi: 10.1007/s13437-025-00372-x
Mor A., Speranza M. G., and Viegas J. M. (2020). Efficient loading and unloading operations via a booking system. Transp. Res. Part E Logist. Transp. Rev. 141, 102040. doi: 10.1016/J.TRE.2020.102040
Morales-Ramírez D., Gracia M. D., and Mar-Ortiz J. (2025). Forecasting national port cargo throughput movement using autoregressive models. Case Stud. Transp. Policy 19, 101322. doi: 10.1016/J.CSTP.2024.101322
Mudronja G., Jugović A., and Škalamera-Alilović D. (2019). Research and development and economic growth: EU port regions. Proc. Rijeka Fac. Econ. 37, 587–602. doi: 10.18045/ZBEFRI.2019.2.587
Mueller M. A., Wiegmans B., and van Duin J. H. R. (2020). The geography of container port choice: modelling the impact of hinterland changes on port choice. Marit. Econ. Logist. 22, 26–52. doi: 10.1057/S41278-019-00142-6
Munim Z. H. and Schramm H. J. (2018). The impacts of port infrastructure and logistics performance on economic growth: the mediating role of seaborne trade. J. Shipp. Trade 3, 1–19. doi: 10.1186/S41072-018-0027-0
Notteboom T., Pallis A., and Rodrigue J. P. (2021). Port economics, management and policy (London: Routledge).
Ren J. R., Mao G. X., Zhang F., and Wei Y. H. (2020). Research on investment decision-making in waterway engineering based on the hub economic index. Sustainability 12, 1511. doi: 10.3390/SU12041511
Sdoukopoulos E. and Boile M. (2020). Port-hinterland concept evolution: A critical review. J. Transp. Geogr. 86, 102775. doi: 10.1016/J.JTRANGEO.2020.102775
Shabrina Z., Buyuklieva B., and Ng M. K. M. (2021). Short-term rental platform in the urban tourism context: A geographically weighted regression (GWR) and a multiscale GWR (MGWR) approaches. Geogr. Anal. 53, 686–707. doi: 10.1111/gean.12259
Shen S. C. and Dong X. Y. (2019). An empirical analysis of the total retail sales of consumer goods by using time series model. J. Math. Financ. 09, 175–181. doi: 10.4236/JMF.2019.92009
Shen T., Yu H., Zhou L., Gu H., and He H. (2020). The influencing mechanism of second-hand housing prices in Beijing: A study based on the multiscale geographically weighted regression (MGWR) model. Econ. Geogr. 40, 75–83. doi: 10.15957/j.cnki.jjdl.2020.03.009
Song L. L. and van Geenhuizen M. (2014). Port infrastructure investment and regional economic growth in China: Panel evidence in port regions and provinces. Transp. Policy 36, 173–183. doi: 10.1016/J.TRANPOL.2014.08.003
Tang S. X., Jin J. G., and Lu C. X. (2022). Investigation of berth allocation problem in container ports considering the variety of disruption. Comput. Ind. Eng. 172, 108564. doi: 10.1016/J.CIE.2022.108564
Taylor I. and Smith K. (2007). United nations conference on trade and development (UNCTAD) (London: Routledge).
Tsimoshynska O., Koval M., Kryshtal H., Filipishyna L., Arsawan W. E., and Koval V. (2021). Investing in road construction infrastructure projects under public-private partnership in the form of concession. Nauk. Visnyk Natsionalnoho Hirnychoho Universytetu 2), 184–192. doi: 10.33271/NVNGU/2021-2/184
Wagner N., Kotowska I., and Pluciński M. (2022). The impact of improving the quality of the port’s infrastructure on the shippers’ Decisions. Sustainability 14, 6255. doi: 10.3390/SU14106255
Wang Q., Jiang D. Y., Gao Y. F., Zhang Z. J., and Chang Q. R. (2022a). Examining the driving factors of SOM using a multi-scale GWR model augmented by geo-detector and GWPCA analysis. Agronomy 12, 1697. doi: 10.3390/AGRONOMY12071697
Wang J. J., Ng A. K. Y., and Olivier D. (2004). Port governance in China: A review of policies in an era of internationalizing port management practices. Transp. Policy 11, 237–250. doi: 10.1016/J.TRANPOL.2003.11.003
Wang Y., Zhou P., Pan H., and Dai S. (2022b). A study on the multiscale spatial relationship between road network morphology and housing prices: Based on spatial network analysis and MGWR model. Geogr. Geo-Inf. Sci. 38, 103–109. doi: 10.3969/j.issn.1672-0504.2022.01.015
Wei J. (2013). Research on the real options in investment decision of water way infrastructure construction. Adv. Mater. Res. 734-737, 1617–1620. doi: 10.4028/WWW.SCIENTIFIC.NET/AMR.734-737.1617
Xu C. Y., Wang Y. Q., Yao D. L., Qiu S. Y., and Li H. (2025). Research on the coordination of a marine green fuel supply chain considering a cost-sharing contract and a revenue-sharing contract. Front. Mar. Sci. 12. doi: 10.3389/fmars.2025.1552136
Yu H. C., Fotheringham A. S., Li Z. Q., Oshan T., Kang W., and Wolf L. J. (2020). Inference in multiscale geographically weighted regression. Geogr. Anal. 52, 87–106. doi: 10.1111/GEAN.12189
Keywords: port, heterogeneity, throughput, influencing factors, multi-scale geographically weighted regression
Citation: Guo R, Xiao G, Zhang C and Li Q (2025) A study on influencing factors of port cargo throughput based on multi-scale geographically weighted regression. Front. Mar. Sci. 12:1637660. doi: 10.3389/fmars.2025.1637660
Received: 29 May 2025; Accepted: 15 July 2025;
Published: 30 July 2025.
Edited by:
Tomoya Kawasaki, The University of Tokyo, JapanCopyright © 2025 Guo, Xiao, Zhang and Li. This is an open-access article distributed under the terms of the Creative Commons Attribution License (CC BY). The use, distribution or reproduction in other forums is permitted, provided the original author(s) and the copyright owner(s) are credited and that the original publication in this journal is cited, in accordance with accepted academic practice. No use, distribution or reproduction is permitted which does not comply with these terms.
*Correspondence: Qingjun Li, bGlxakB3ZnUuZWR1LmNu