Abstract
Gas hydrates, as an environmentally friendly energy resource, are primarily distributed in marine sediments, with the vast majority occurring in subseafloor fine-grained sediments. However, the formation mechanisms of gas hydrates within fine-grained sediments remain poorly constrained. In addition to the temperature and pressure conditions, variations in sedimentary layer properties resulting from distinct sedimentary processes critically control gas hydrate accumulation. Since the Quaternary, substantial environmental and sedimentary dynamic changes in the northern South China Sea have likely influenced gas hydrate enrichment. This paper investigates the variability of sedimentary processes and its implications for gas hydrate accumulation by integrating analyses of sediment grain-size parameters, clay mineral characteristics, biological data, and geochemical data. The results indicated that the gas hydrate reservoir in the study area was predominantly bearing in fine-grained turbidite sediments. In contrast, the overlying hydrate-free layer is primarily influenced by traction flow dynamics, specifically contour currents. The differences in the sedimentary processes are mainly governed by sea-level fluctuations and climate variations, which modulate the hydrodynamic intensity and sediment provenance. During periods of low sea level and colder climate conditions, gravity flows preferentially develop fine-grained turbidite deposits. Sediments form in such sedimentological and environmental conditions promote gas hydrate accumulation. Conversely, during periods of high sea level and warmer climate conditions, the enhanced contour current intensity and velocity are accompanied by increased illite/smectite mixed-layer content, whose complex internal structure and large specific surface area reduce sediment porosity and permeability, thereby inhibiting gas hydrate formation. These findings not only reveal the coupling between sedimentary processes and gas hydrate enrichment but also elucidate the underlying mechanisms driving this relationship. Moreover, they establish a link between paleoclimate conditions and gas hydrate enrichment by positioning sedimentary processes as an intermediary. This study contributes significantly to the understanding of gas hydrate accumulation theory and its environmental implications.
1 Introduction
Gas hydrates are considered promising clean energy resources (Smith and Fritz, 1989; Collett, 2002; Pohlman et al., 2009). They are ice-like white crystalline solids formed from water and gas molecules under specific temperature and pressure conditions (Kvenvolden, 1993). Gas hydrates have a high energy efficiency and excellent potential for energy storage (Boswell and Collett, 2006; Boswell, 2009; Lei and Hu, 2023). They also significantly affect the environment, particularly due to their high climate sensitivity. Under global warming, they may release large amounts of methane into the oceans and atmosphere (Dickens, 2003; Ruppel and Kessler, 2017; Dyonisius et al., 2020). Owing to these characteristics, in recent years, increasing attention has been directed toward fundamental research on natural gas hydrates. Studies indicate that more than 90% of offshore gas hydrate resources are hosted in fine-grained sediments (Boswell and Collett, 2006; Ren et al., 2020). However, most existing theories on gas hydrate accumulation are derived based on sandy reservoirs, which provide clearer mechanisms for gas hydrate formation and enrichment in coarse-grained sediments (Colwell et al., 2004; Boswell, 2009; Ito et al., 2015; Heeschen et al., 2016). Furthermore, the accumulation patterns of gas hydrates in fine-grained sediments differ significantly from those in coarse-grained sediments, and the underlying mechanism remains poorly understood (Lei and Santamarina, 2018; Ren et al., 2020; Bai et al., 2022).
In recent years, global gas hydrate explorations and scientific ocean drilling programs, including those in the Nankai Trough, Ulleung Basin, and South China Sea (SCS), have identified various sedimentary processes associated with gas hydrate accumulation systems. These include turbidites (Torres et al., 2008; Noguchi et al., 2011; Chun et al., 2022; Lin et al., 2023), mass transport deposits (MTDs) (Riedel et al., 2012), contourites (Hustoft et al., 2009), and sediment waves (Bai et al., 2019).
Numerous studies have demonstrated that there is a strong correlation between turbidite deposition processes and the gas hydrate-bearing layer in both coarse and fine-grained sediments (Torres et al., 2008; Ito et al., 2015; Su et al., 2021). For example, studies of sandy gas hydrate reservoirs in the Nankai Trough indicate that turbidite sediments play a key role in gas hydrate accumulation within coarse-grained sediments (Ito et al., 2018; Kimura et al., 2019). Additionally, turbidite layers promote gas hydrate enrichment in fine-grained sediments, as observed on the northern continental slope of the SCS and the Ulleung Basin (Li et al., 2018, 2019; Su et al., 2021; Chun et al., 2022). Complex sedimentary processes are interbedded within gas hydrate accumulation layers. Geophysical methods, particularly seismic facies interpretation of 2-D and 3-D seismic reflection data, have been commonly employed to identify various sedimentary processes (Chen et al., 2021; Rebesco et al., 2014; Stow and Faugères, 2008). Although seismic facies analysis is effective for identifying sedimentary processes at the macro-scale, its limited resolution hinders the detection of sedimentary process features on the micro-scale. Consequently, detailed analyses of the sedimentary process within gas hydrate reservoirs and adjacent non-gas hydrate layers remain insufficient. Furthermore, the coupling mechanisms between sedimentary processes and gas hydrate accumulation are not yet fully understood.
Fine-grained sediments on the continental slope of the northern SCS host highly saturated gas hydrates. The successful trial productions in 2017 and 2020 demonstrated the region’s significant exploitation potential (Li et al., 2018; Ye et al., 2020). Since the Quaternary, the northern SCS has experienced diverse sedimentary processes and complex environmental changes, which have likely influenced the gas hydrate enrichment (Xu et al., 2017; Wang et al., 2020). Therefore, the northern SCS is an ideal natural laboratory for investigating the relationship between sedimentary processes and gas hydrate accumulation in fine-grained sediments. In this study, we focused on the Shenhu area, which was selected by the Guangzhou Marine Geological Survey (GMGS) as a key site for gas hydrate exploratory drilling expeditions conducted in 2015–2016 (GMGS3 and GMGS4) (Ji et al., 2012; Su et al., 2021). In summary, the aims of this study were (1) to identify the sedimentary processes of gas hydrate-bearing and non-gas hydrate layers through analyses of actual sediment samples; (2) to elucidate the coupling relationship between gas hydrate accumulation and sedimentary processes; and (3) to investigate the underlying mechanisms of this coupling and construct corresponding evolutionary models.
2 Geological setting
The Shenhu area is situated in the central part of the northern continental margin of the SCS, which is characterized by a complex geological structure and numerous submarine canyons along the slope (Figure 1a) (Qiao et al., 2015).
Figure 1
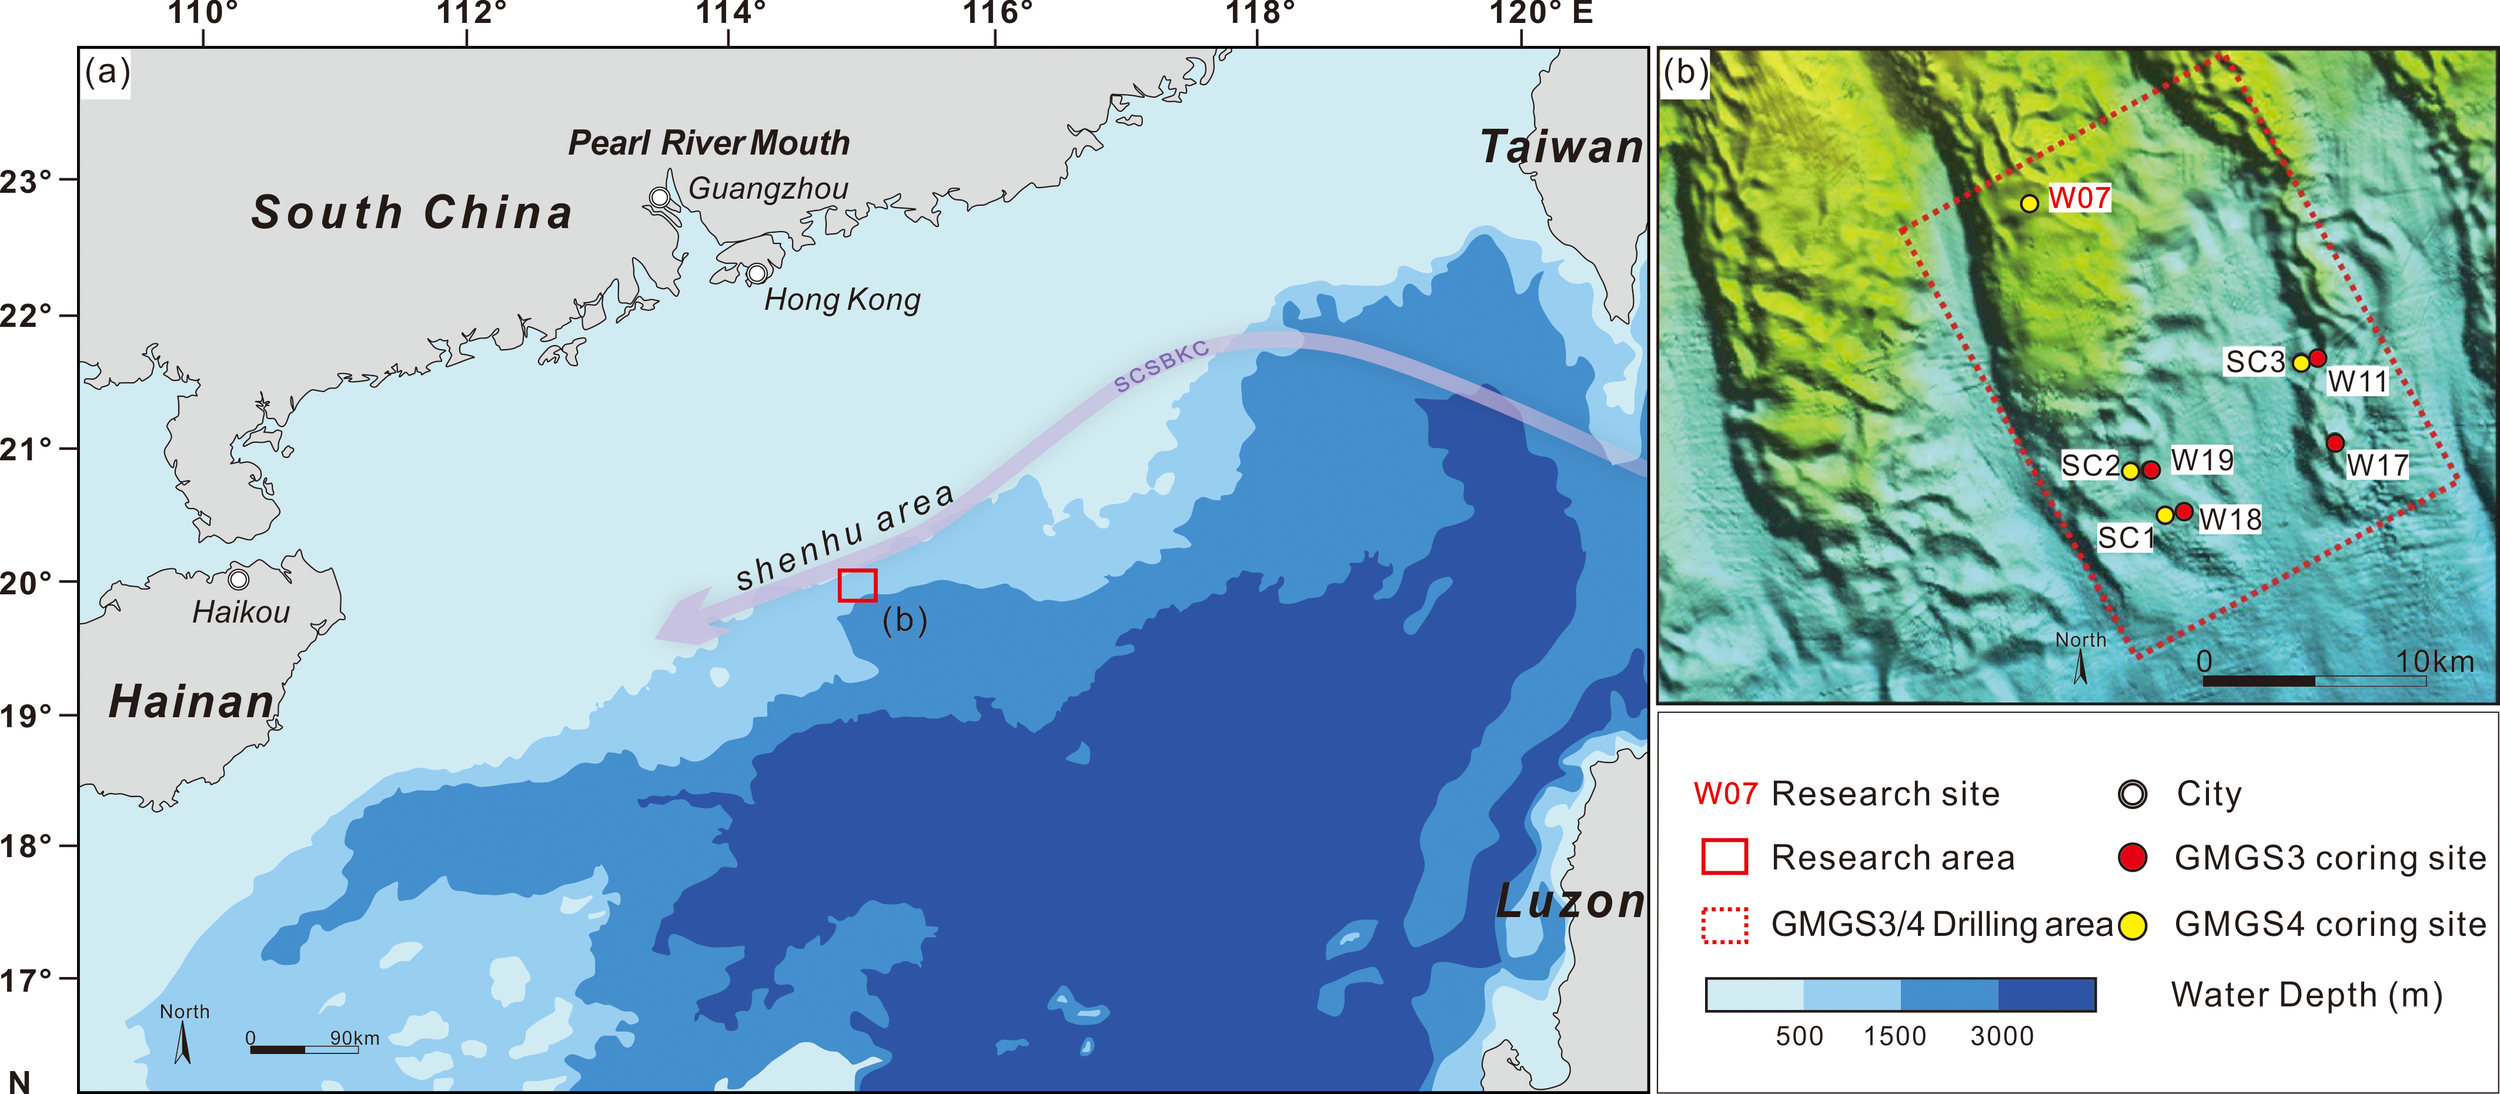
(a) The map of and main contour currents study area, modified from Kuang et al. (2025) and Hu et al. (2021); (b) enlarge the red box in (a), the drilling area of GMGS3 and 4, modified from Zhang et al. (2019).
The Luzon Strait, with a sill depth of approximately 2400 m, is the only deep-water passage connecting the SCS to the western Pacific Ocean (Lan et al., 2013). This strait serves as a major conduit for water masses entering the SCS from the western Pacific. The ocean circulation in this region is influenced by the Kuroshio Current, the primary western boundary current of the North Pacific Ocean. The complex ocean circulation in the SCS significantly affects the deep-water sedimentary processes in the Shenhu area, making them highly dynamic (Liu et al., 2024). Along the slope, the ocean circulation is composed of westward contour currents influenced by the Kuroshio Current (Figure 1), especially the SCS Branch of the Kuroshio Current (Shaw and Chao, 1994; Qiu et al., 2011; Luan et al., 2012; Nan et al., 2015). The SCS has the highest sedimentation rate globally, with sediment thicknesses ranging from 500 m to 10 km (Shao et al., 2007; Zhang et al., 2019).
The study area lies within the Shenhu area at water depths of 500–3000 m and is located opposite the Pearl River Mouth to the northwest and Taiwan to the northeast (Figure 1a) Zhang et al., 2018). In this study, we used drilling data from GMGS4 Site W07 (Figure 1b), which is located atop a structure highly influenced by complex sedimentary processes and has favorable gas hydrate accumulation (Su et al., 2021). The seafloor temperature and geothermal gradients in site W07 are conducive to gas hydrate accumulation, with values of approximately 4.04°C and 56.1°C/km, respectively (Figure 2).The gas sources of the hydrates in the research area comprise both microbial and thermogenic gases, with the dominant thermogenic gas migrating upward from deep formations through faults, mud diapirs, and gas chimneys, and eventually accumulating in the hydrate stability zone to form high-saturation gas hydrates (Zhang et al., 2017, 2019).
Figure 2
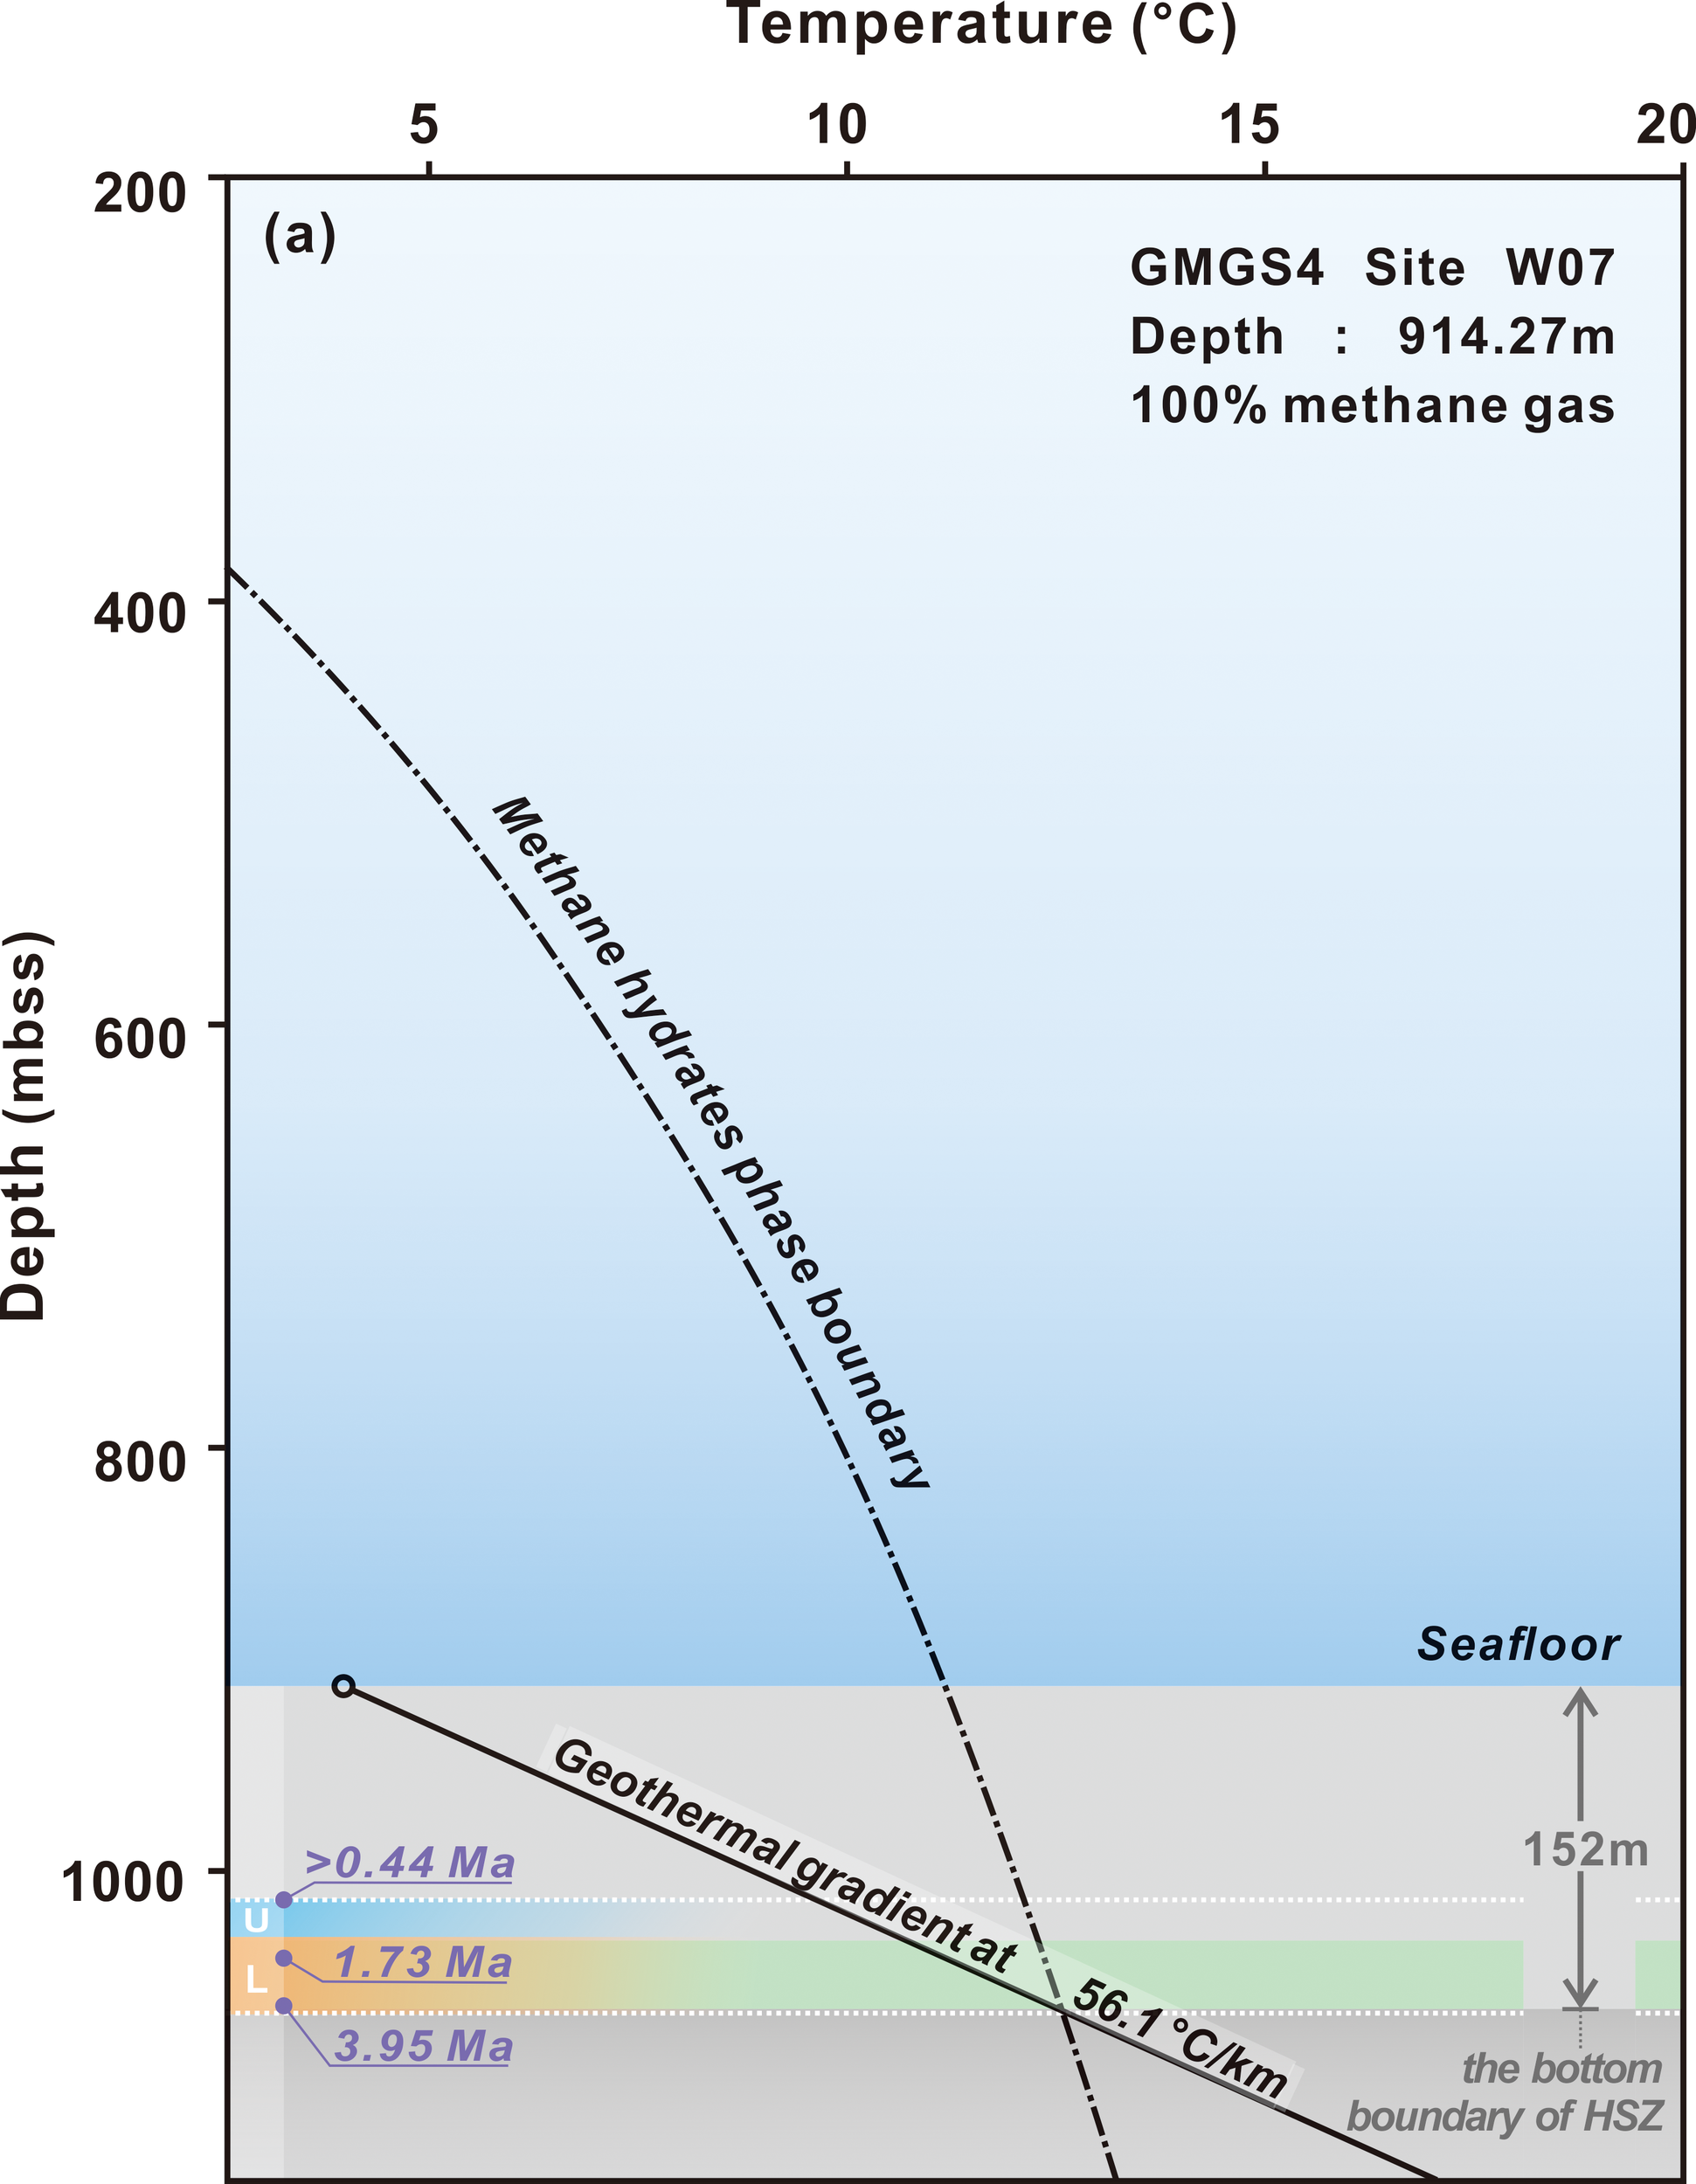
The gas hydrate stability diagram of Site W07. The temperature line (black solid line) intersects the stability curve (black dashed line), and the horizontal line at the intersection is the bottom of the HSZ. The research layer (between the white dashed line), sedimentary subsections (U is for the upper subsection; L is for the lower subsection), and the gas hydrate-bearing layer (green shaded area) are labeled in the diagram.
3 Materials and methods
3.1 Samples
Site W07, the drilling core site used in this study, is located in the uppermost part of the research area, with a water depth of 914.27 m and a borehole depth of 159 m below the seafloor (mbsf). In this study, we focused on the gas hydrate-bearing layers (121–152 mbsf) (Bai et al., 2024) and the continuously cored adjacent sedimentary layers, covering depths of 102–156 mbsf (Figure 3). The gas hydrates in the study site mainly consisted of methane gas and belong to type I gas hydrates (Song et al., 2022), with approximately 152m thickness of the hydrate stable zone (HSZ) (Figure 2). The maximum age of the studied layer is estimated to be 3.95 Ma based on biostratigraphic analysis of calcareous nannofossils from the GMGS4 cruise report (Figure 3). A total of 132 samples were collected for grain-size measurements to reconstruct the deep-water sedimentary processes. A subset of 31 samples was analyzed using X-ray diffraction (XRD) to determine the clay mineral composition and infer the sedimentary provenance. Additionally, the major and trace element concentrations of 39 samples were measured, and the foraminiferal abundances of 37 samples were analyzed.
Figure 3
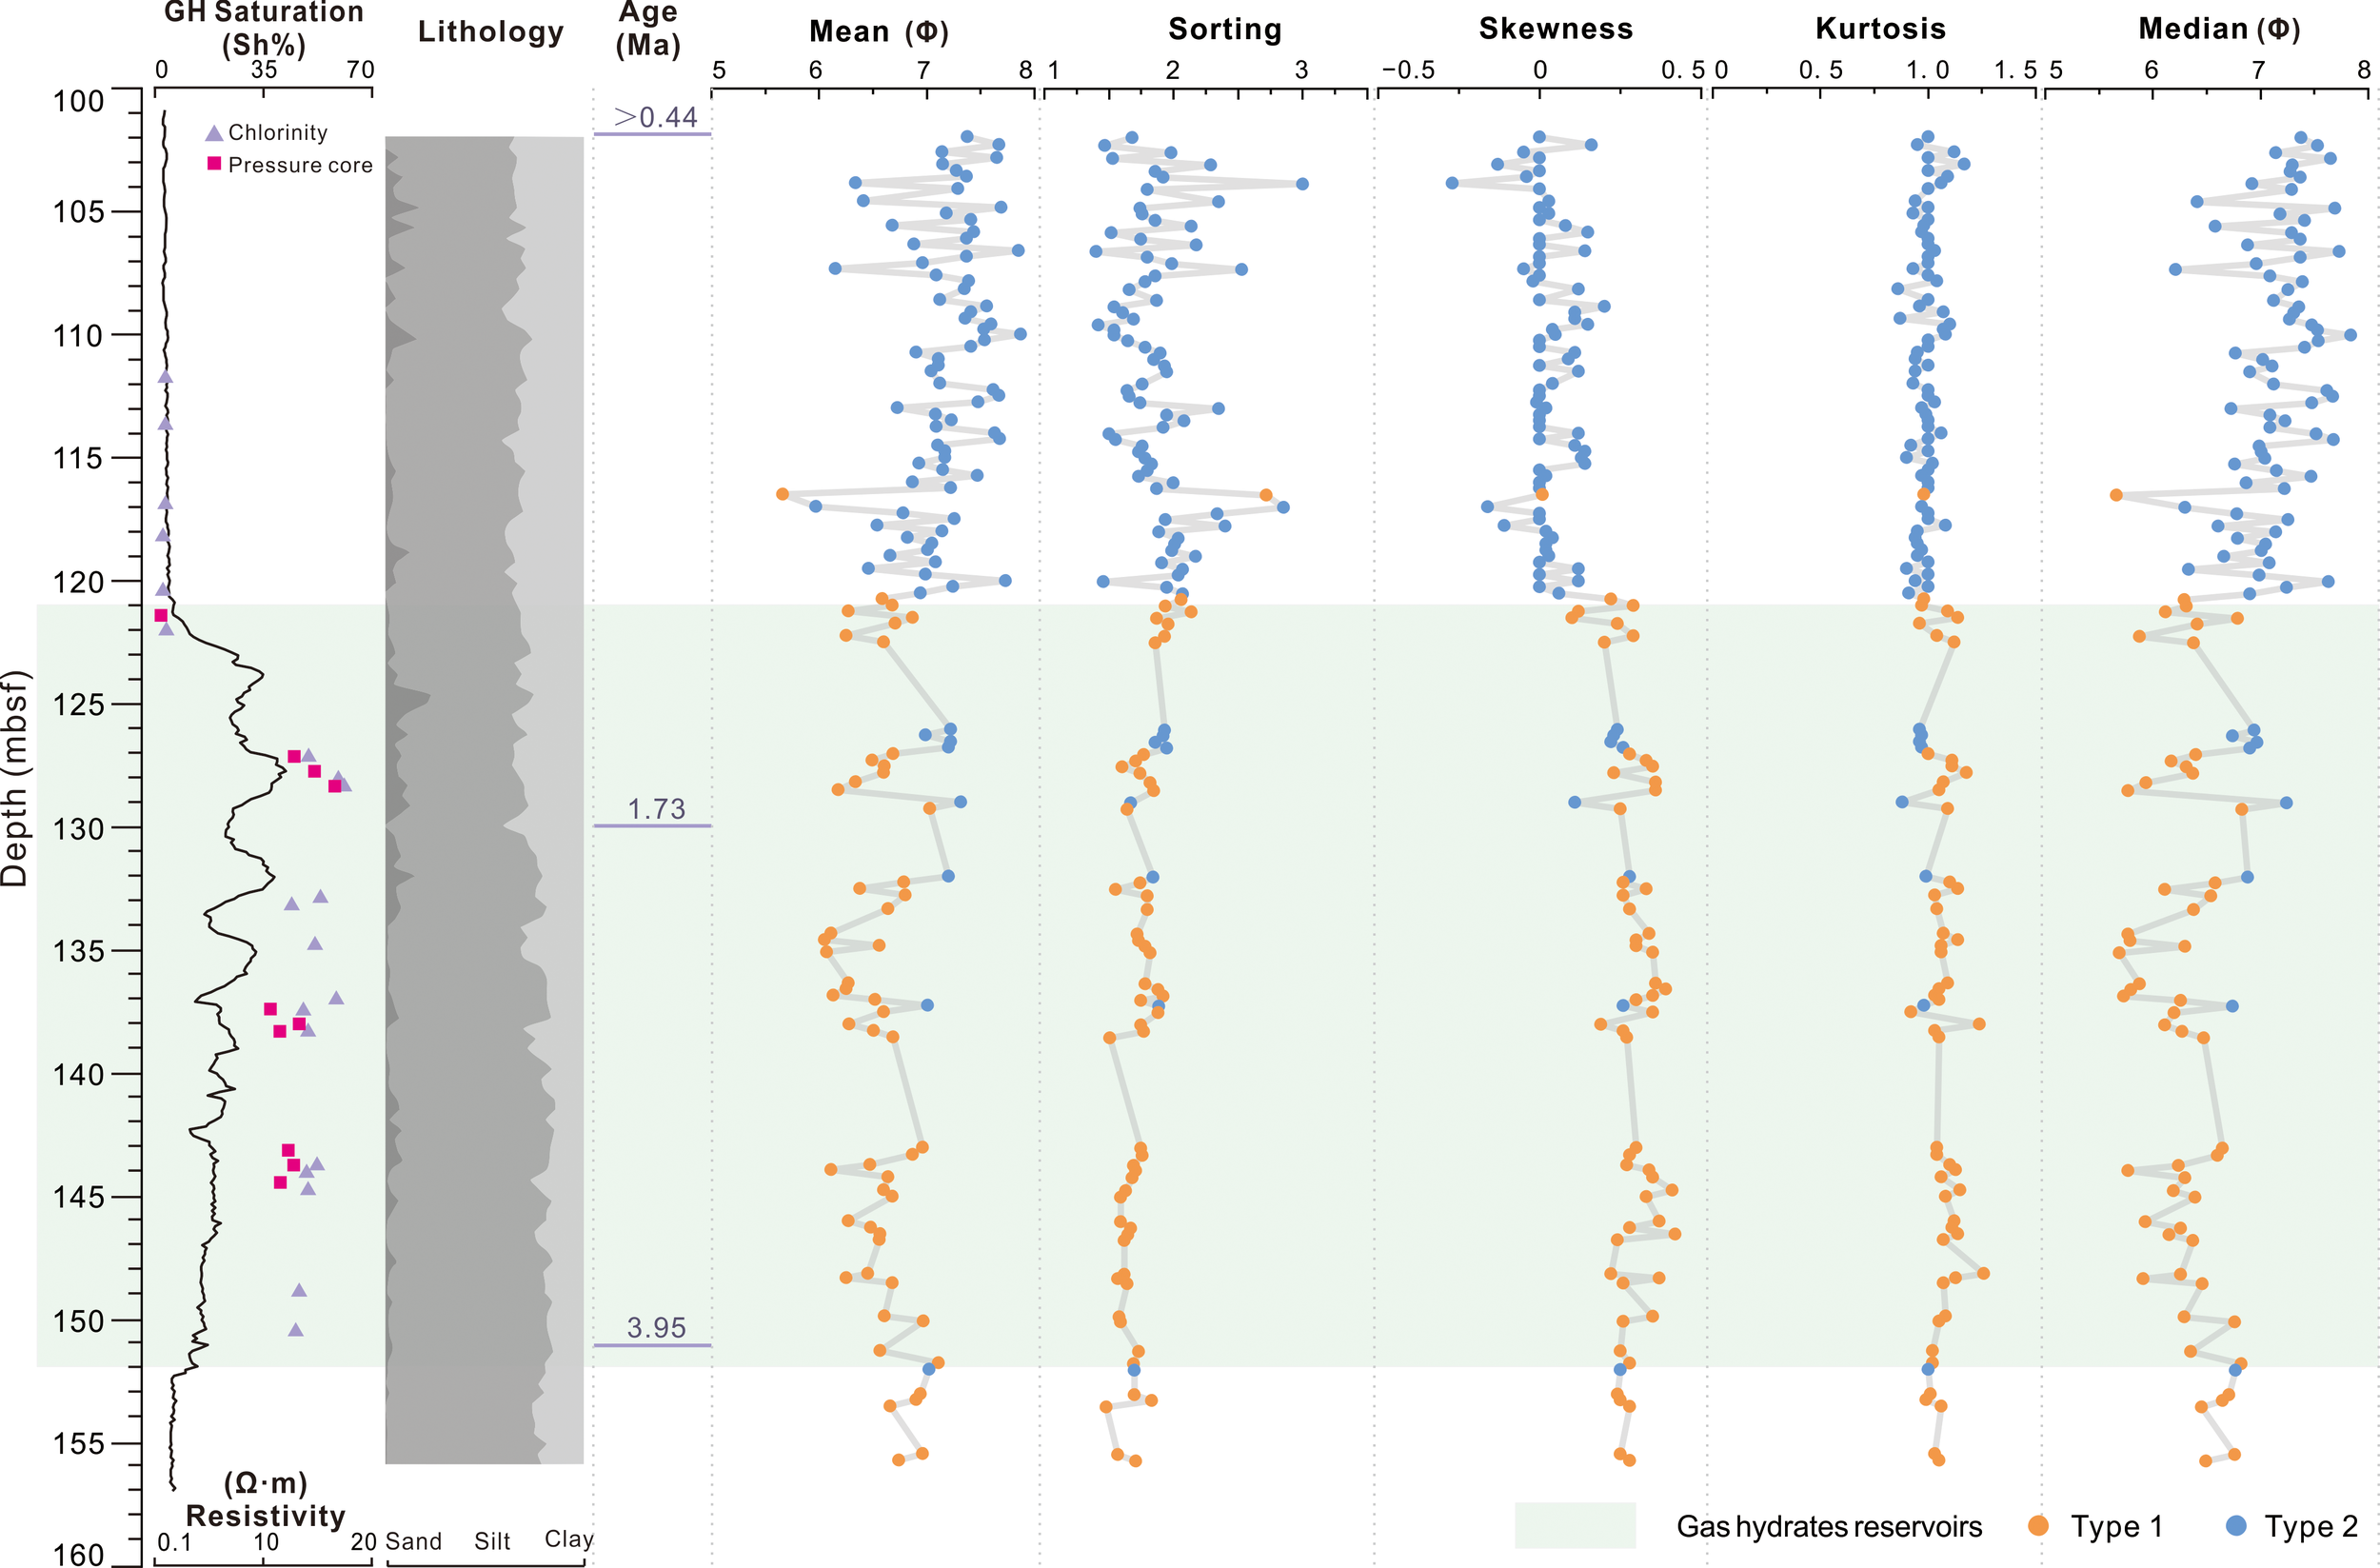
Gas hydrate saturation, resistivity, lithology, ages, and grain size parameters columns for Site W07. The orange and blue points indicate Type 1 and Type 2, respectively. The green shaded area indicates the gas hydrate reservoirs.
3.2 Grain-size measurements
The grain-size parameters of all 132 samples were measured at the GMGS Test Center using a Marvin Mastersizer 2000 laser diffraction size analyzer. The samples were pretreated with deionized water and 0.5 mol/L sodium hexametaphosphate (Na6P6O18) as a dispersant. To prevent fine particle aggregation, the suspension was left to stand for ~24 hours and gently stirred every 8 hours. The grain-size data, including the mean grain size, sorting, kurtosis, and skewness, were analyzed using the logarithmic (original) Folk and Ward (1957) graphical measures. The calculation Equations 1–4 are as follows:
where φ is the phi-scale grain size (φ = −log2d, with d being the grain diameter in μm), which is plotted on the X-axis. The subscripts indicate the specific cumulative percentages on the Y-axis, corresponding to their intersections with the cumulative frequency curve (Wentworth, 1929).
3.3 X-ray diffraction
A D8 Advance instrument (Bruker Corp., Germany) was used to acquire XRD data for the bulk and clay minerals. The methodology adhered to the protocols outlined by Moore and Reynolds (1989), Sakharov et al. (1999), and Hillier (1999). The ClayQuan software was used to process the results (Yang et al., 2024; Zhou et al., 2023). The XRD analysis was conducted collaboratively by the Key Laboratory of Polar Geology and Marine Mineral Resources, Ministry of Education, and the Micro Structure Analytical Laboratory, Peking University.
3.4 Element geochemical analysis
The major and trace elements and rare earth elements (REE) measurements were performed using a PerkinElmer Optima 8300 ICP-OES instrument at the Laboratory of the GMGS.
3.5 Biological analysis
The foraminifera abundance measurements conducted in this study were performed by the Laboratory of the GMGS. The dried sediment samples (approximately 6–20 g) were soaked in distilled water to facilitate effective separation. Subsequently, the samples were wet-sieved using a copper sieve with a 0.063 mm aperture, and the >0.063 mm fraction was dried. Finally, the >0.15 mm fraction was used to quantify the foraminiferal abundance. The benthic and planktonic foraminifera were analysed separately. Additionally, the identification and relative abundance statistics of the calcareous nannofossils were conducted by the Laboratory of the GMGS.
4 Results
4.1 Grain-size parameters
In this study, the sediment grain-size distribution at Site W07 was analyzed using several parameters, including the mean grain size, sorting, skewness, kurtosis, and median grain size.
For the 132 samples, the mean grain size ranged from 5.66 to 7.87 φ (average of 6.91 φ); the sorting values ranged from 1.40 to 3.00 (average of 1.83); the skewness and kurtosis ranges were from −0.27 to 0.42 and from 0.86 to 1.26 (averages of 0.15 and 1.02), respectively; and the median grain size ranged from 5.66 to 7.84 φ (average of 6.78 φ) (Figure 3).
4.2 Bulk and clay mineral components
In the sediment samples, the main minerals included quartz, feldspar, carbonates, and clay minerals (over 95%). The quartz content ranged from 23% to 46% (average of 36.8%), the feldspar content ranged from 8% to 14% (average of 11.0%), the carbonate content ranged from 14% to 42% (average of 28.2%), and the clay mineral content ranged from 11% to 30% (average of 18.2%) (Figures 4a–d).
Figure 4
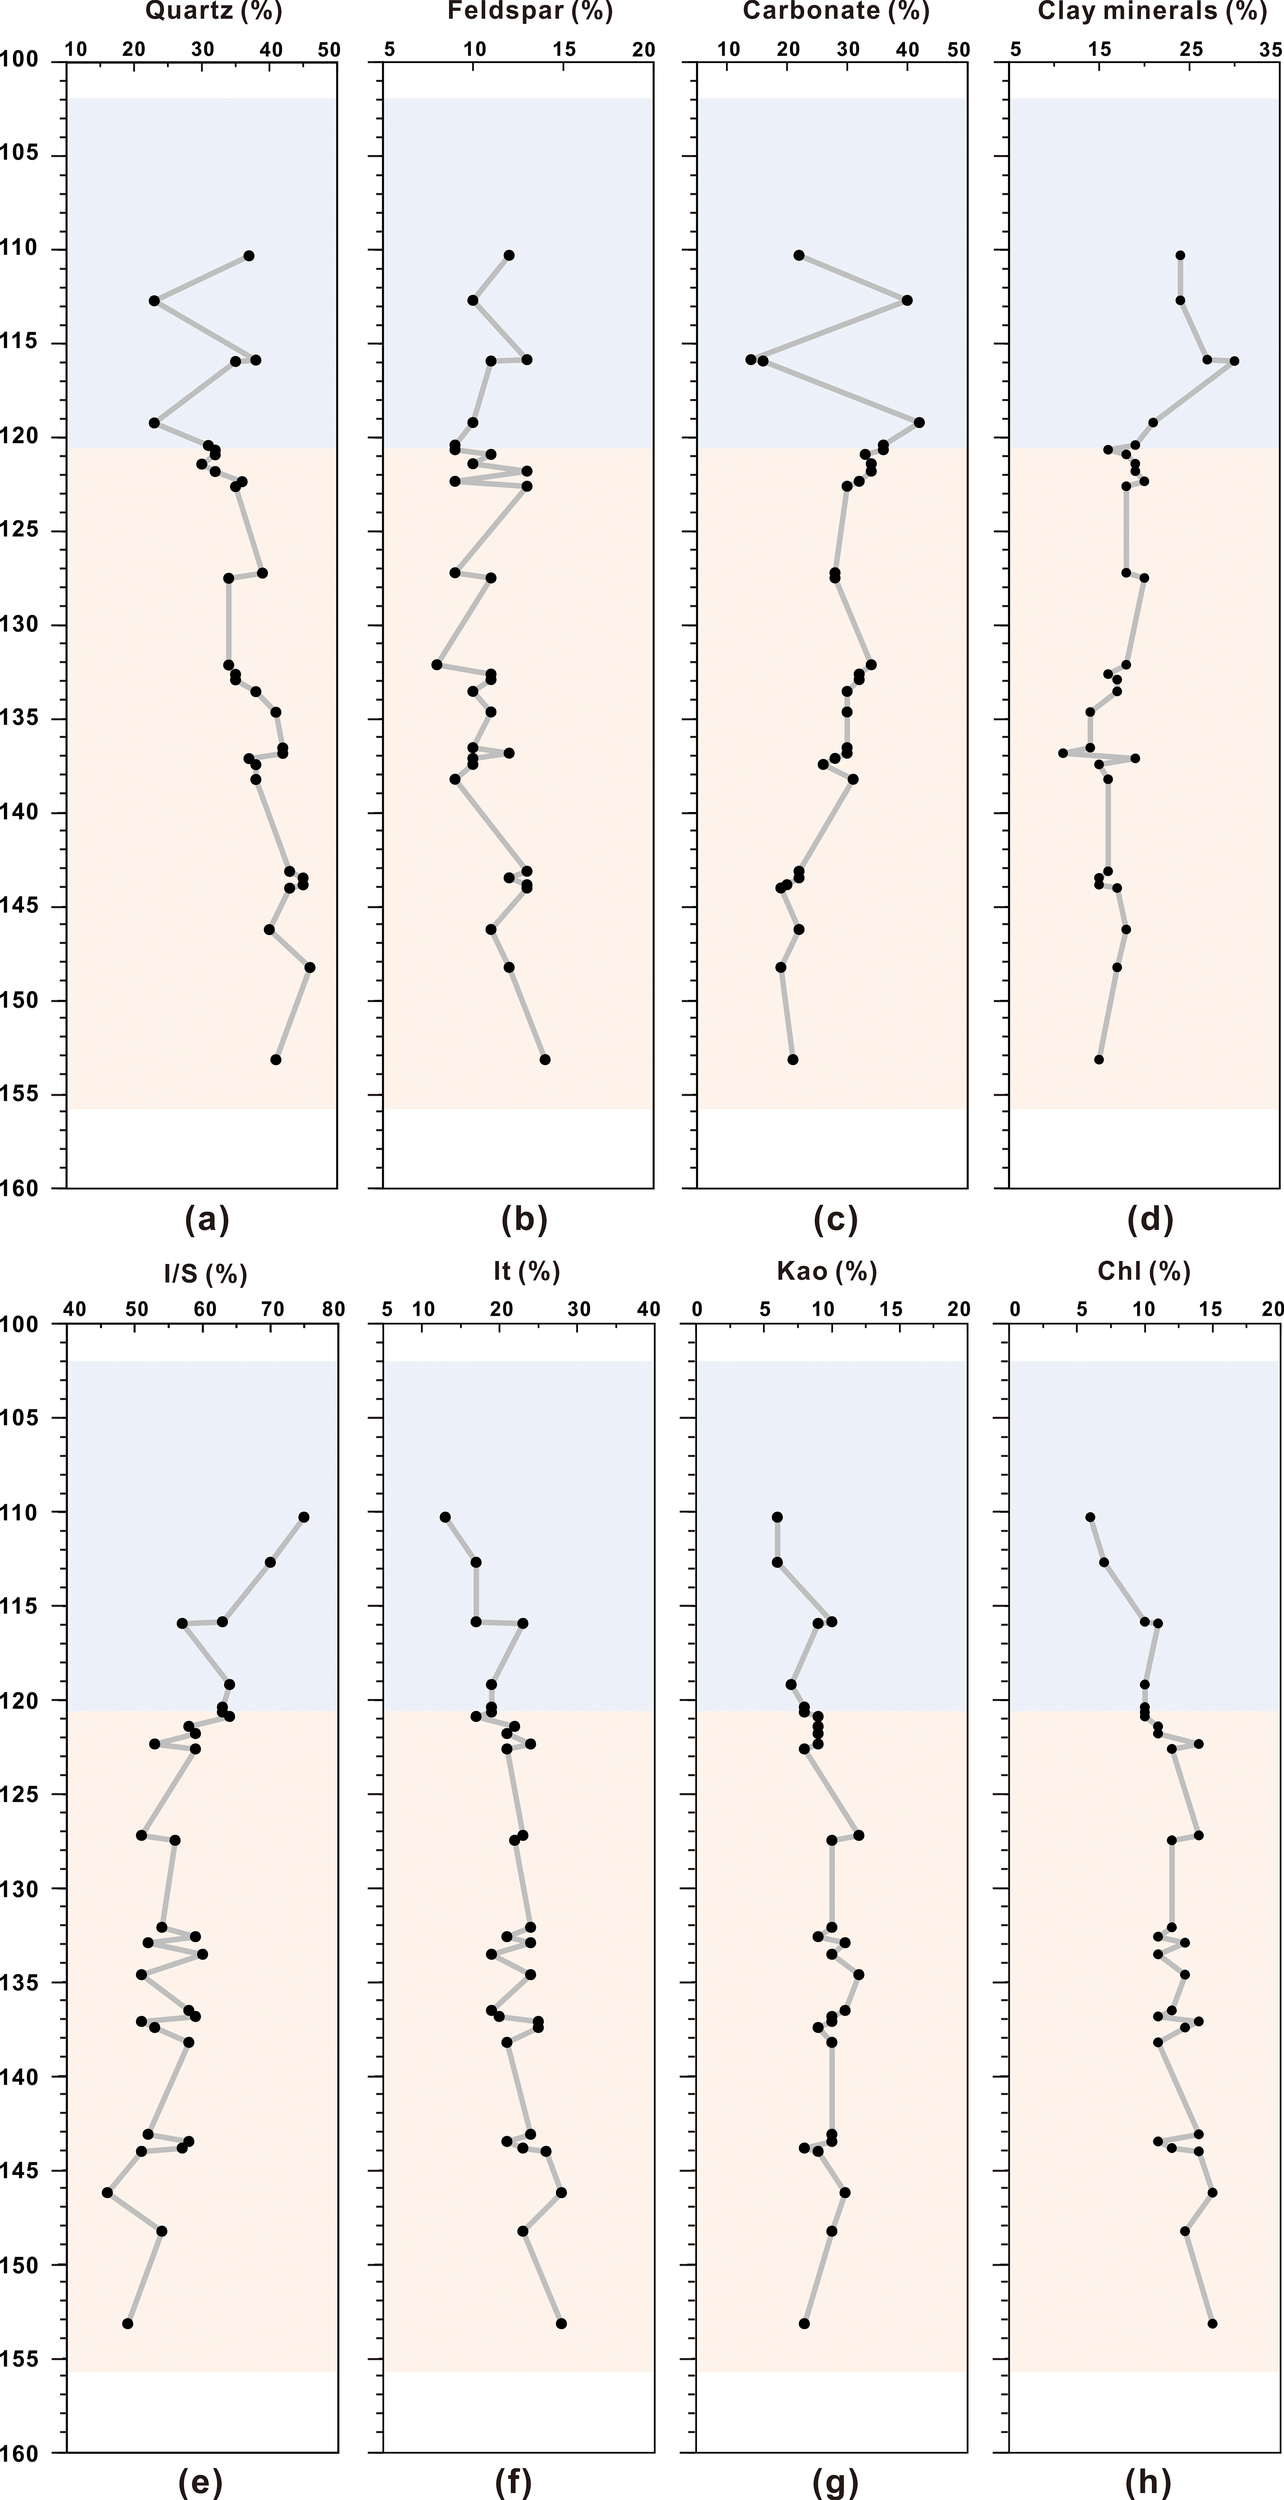
Depth profiles of bulk and clay mineral components. (a) is for quartz contents. (b) is for feldspar contents. (c) It is for carbonate contents. (d) It is for clay minerals contents. (e) is for I/S mixed layer contents. (f) is for illite contents. (g) It is for kaolinite contents. (h) It is for chlorite contents. The blue and orange shaded areas indicate the upper subsection and the lower subsection, respectively.
The XRD analysis of the clay minerals revealed that the principal clay minerals at Site W07 included the illite-smectite (I/S) mixed layer, illite, kaolinite, and chlorite. The I/S mixed layer and illite accounted for 46–75% (average of 57.3%) and 13–28% (average of 21.7%) of the clay minerals, respectively, while the kaolinite and chlorite contents ranged from 6% to 12% (average of 9.3%) and from 6% to15% (average of 11.7%), respectively (Figures 4e–h).
4.3 Geochemical data
We measured the major, trace, and REE contents of the sediment samples from Site W07. Some of the elements were used to calculate indicators such as the P/Al, A/Ti, P/Ti, Sr/Ba, and Zr/Ti ratios, which are vital for sedimentary environment reconstruction. The details are shown in Figure 5. The P/Ti ratios ranged from 0.0924 to 0.1915 (average of 0.1502), the Al/Ti ratios ranged from 13.67 to 19.64 (average of 16.32), and the P/Al ratios ranged from 0.0127 to 0.053 (average of 0.0094). Additionally, the Sr/Ba ratios ranged from 0.430 to 2.147 (average of 1.045). The Zr/Ti ratios ranged from 0.031 to 0.0472 (average of 0.0375).
Figure 5
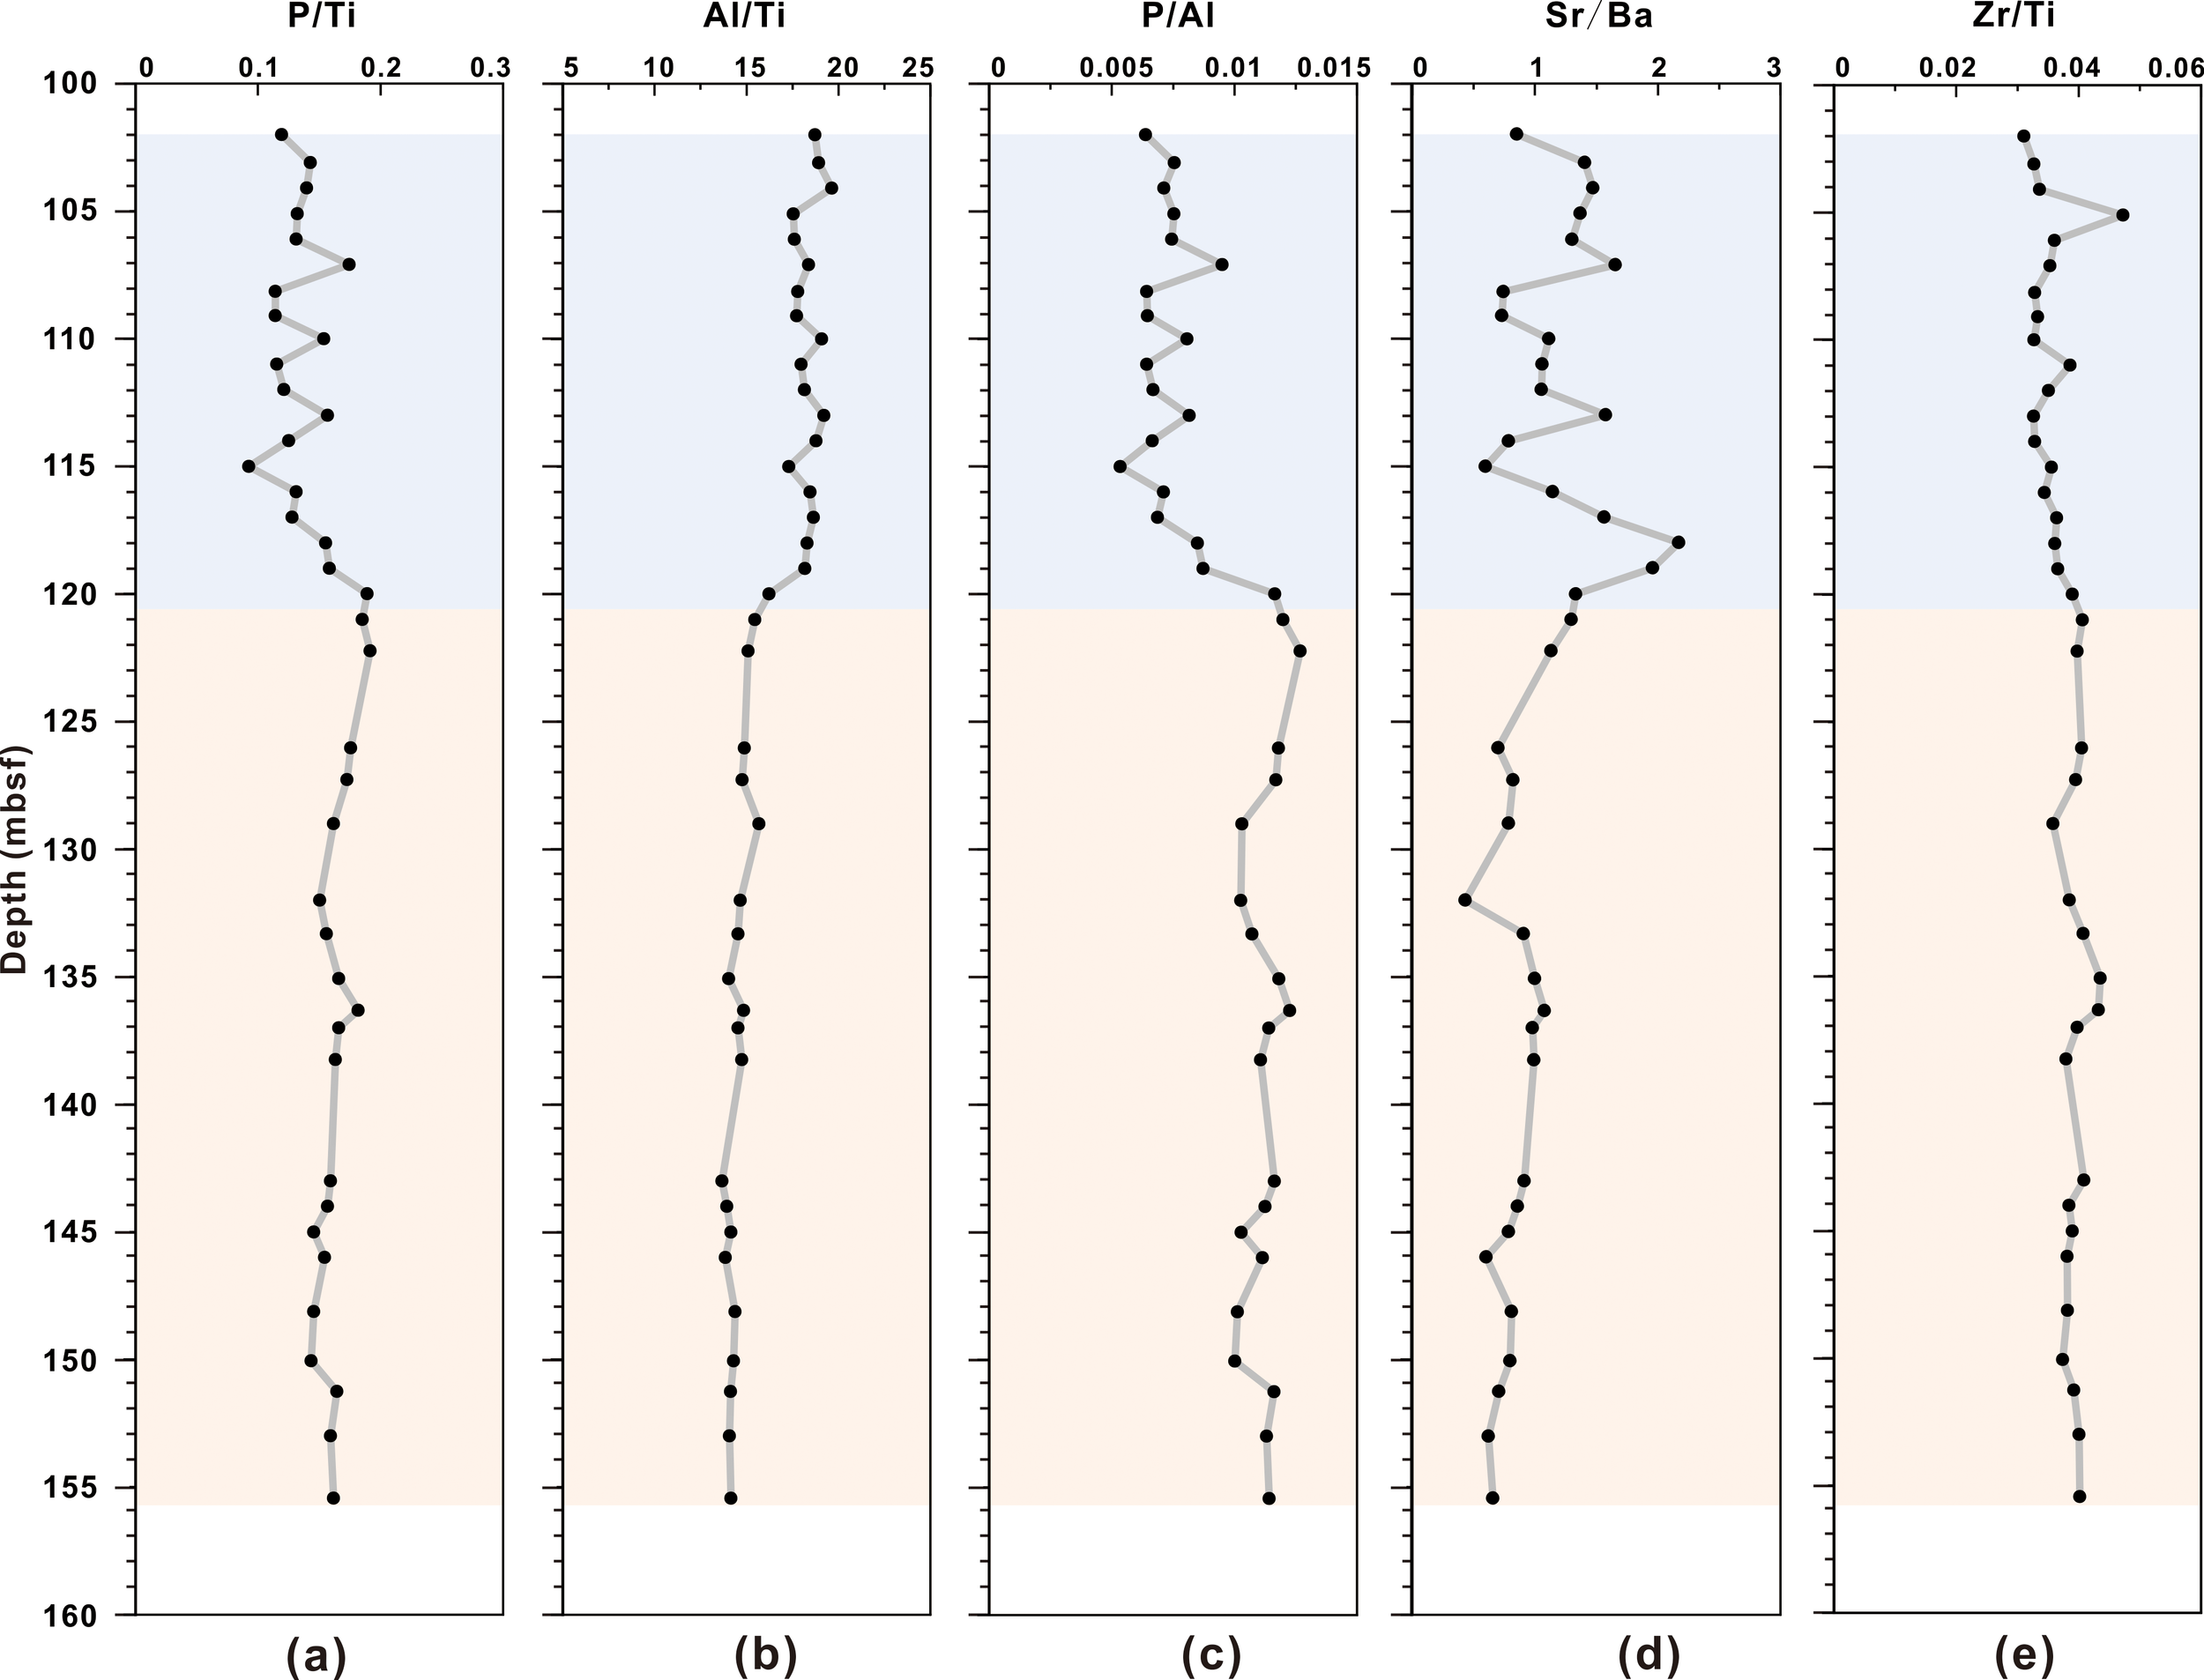
Depth profiles of geochemical data. (a) is for P/Ti ratio. (b) It is for the Al/Ti ratio. (c) if for P/Al ratio. (d) It is for the Sr/Ba ratio. (e) It is for the Zr/Ti ratio. The blue and orange shaded areas indicate the upper subsection and the lower subsection, respectively.
4.4 Biological content
The foraminifera abundance, defined as the number of undistorted, intact foraminifera shells per gram (ind/g), was determined following the method of Azharuddin et al. (2017). For the samples from Site W07, the total foraminifera abundance ranged from 12 to 14,878 ind/g, exhibiting a general trend of decreasing with increasing depth. The planktonic foraminifera abundance ranged from 11 to 14,720 ind/g, whereas the benthic foraminifera abundance ranged from 0.2 to 158.4 ind/g. In addition, the planktic/benthic foraminifera (P/B) ratio increased with depth, ranging from 13 to 423. The relative abundance of the calcareous nannofossils is defined as the number of individuals per field of view (ind/F). For the samples from the research layer, the relative calcareous nannofossil abundance ranged from 57.6 to 292.2 ind/F, exhibiting a general trend of decreasing with increasing depth.
5 Discussion
5.1 Sedimentary process identification
5.1.1 Division of sedimentary layer
The grain-size parameters and lithology of the gas hydrate-bearing sediments and adjacent layers at Site W07 exhibit pronounced heterogeneity (Figure 3). Grain-size parameters provide essential insights into sedimentary hydrodynamic processes. Accordingly, the K-means sediment classification method was employed to classify the grain-size parameter data (Zhou et al., 2023). The results of the grain-size parameter analysis are presented in Figure 3. The results indicated that the sediments at Site W07 can be divided into two categories: Type 1 (orange points in Figure 3) and Type 2 (blue points in Figure 3).
The grain-size distribution curves of the different sediment types at Site W07 exhibited distinct patterns. The Type 1 sediments exhibited sharp unimodal grain-size distribution curves (Figure 6a). For the Type 1 sediments, the grain sizes were predominantly distributed at φ = 6, with kurtosis values ranging from 0.98 to 1.26 (mean of 1.07) (Figure 6a). Nearly all of the grain-size distributions of the Type 1 sediment samples exhibited positive skewness, with values ranging from 0.01 to 0.42 (average of 0.29). In contrast, the Type 2 sediments predominantly exhibited bimodal or broad unimodal grain-size distribution curves (Figure 6b). For the Type 2 sediments, the kurtosis values ranged from 0.86 to 1.17 (mean of 0.99). Additionally, the skewness of the Type 2 sediment samples ranged from −0.27 to 0.28 (average of 0.05), indicating predominantly negative to slight positive distributions (Figure 6b). Within the bimodal distribution of the Type 2 sediments, two prominent grain-size peaks occurred at φ = 2 and φ = 8 (Figure 6b). A comparison of the grain-size distribution curves of the Type 1 and 2 sediments suggested that distinct sedimentary hydrodynamic processes governed their formation. The unimodal distributions of the Type 1 sediments indicated that they were formed by a uniform, continuous, and stable sedimentary process (McManus, 1988; Ordonez et al., 2016; Su et al., 2021). In contrast, the Type 2 sediments were influenced by more complex hydrodynamic modifications than the Type 1 sediments (Ordonez et al., 2016; Stow & Smillie, 2020).
Figure 6
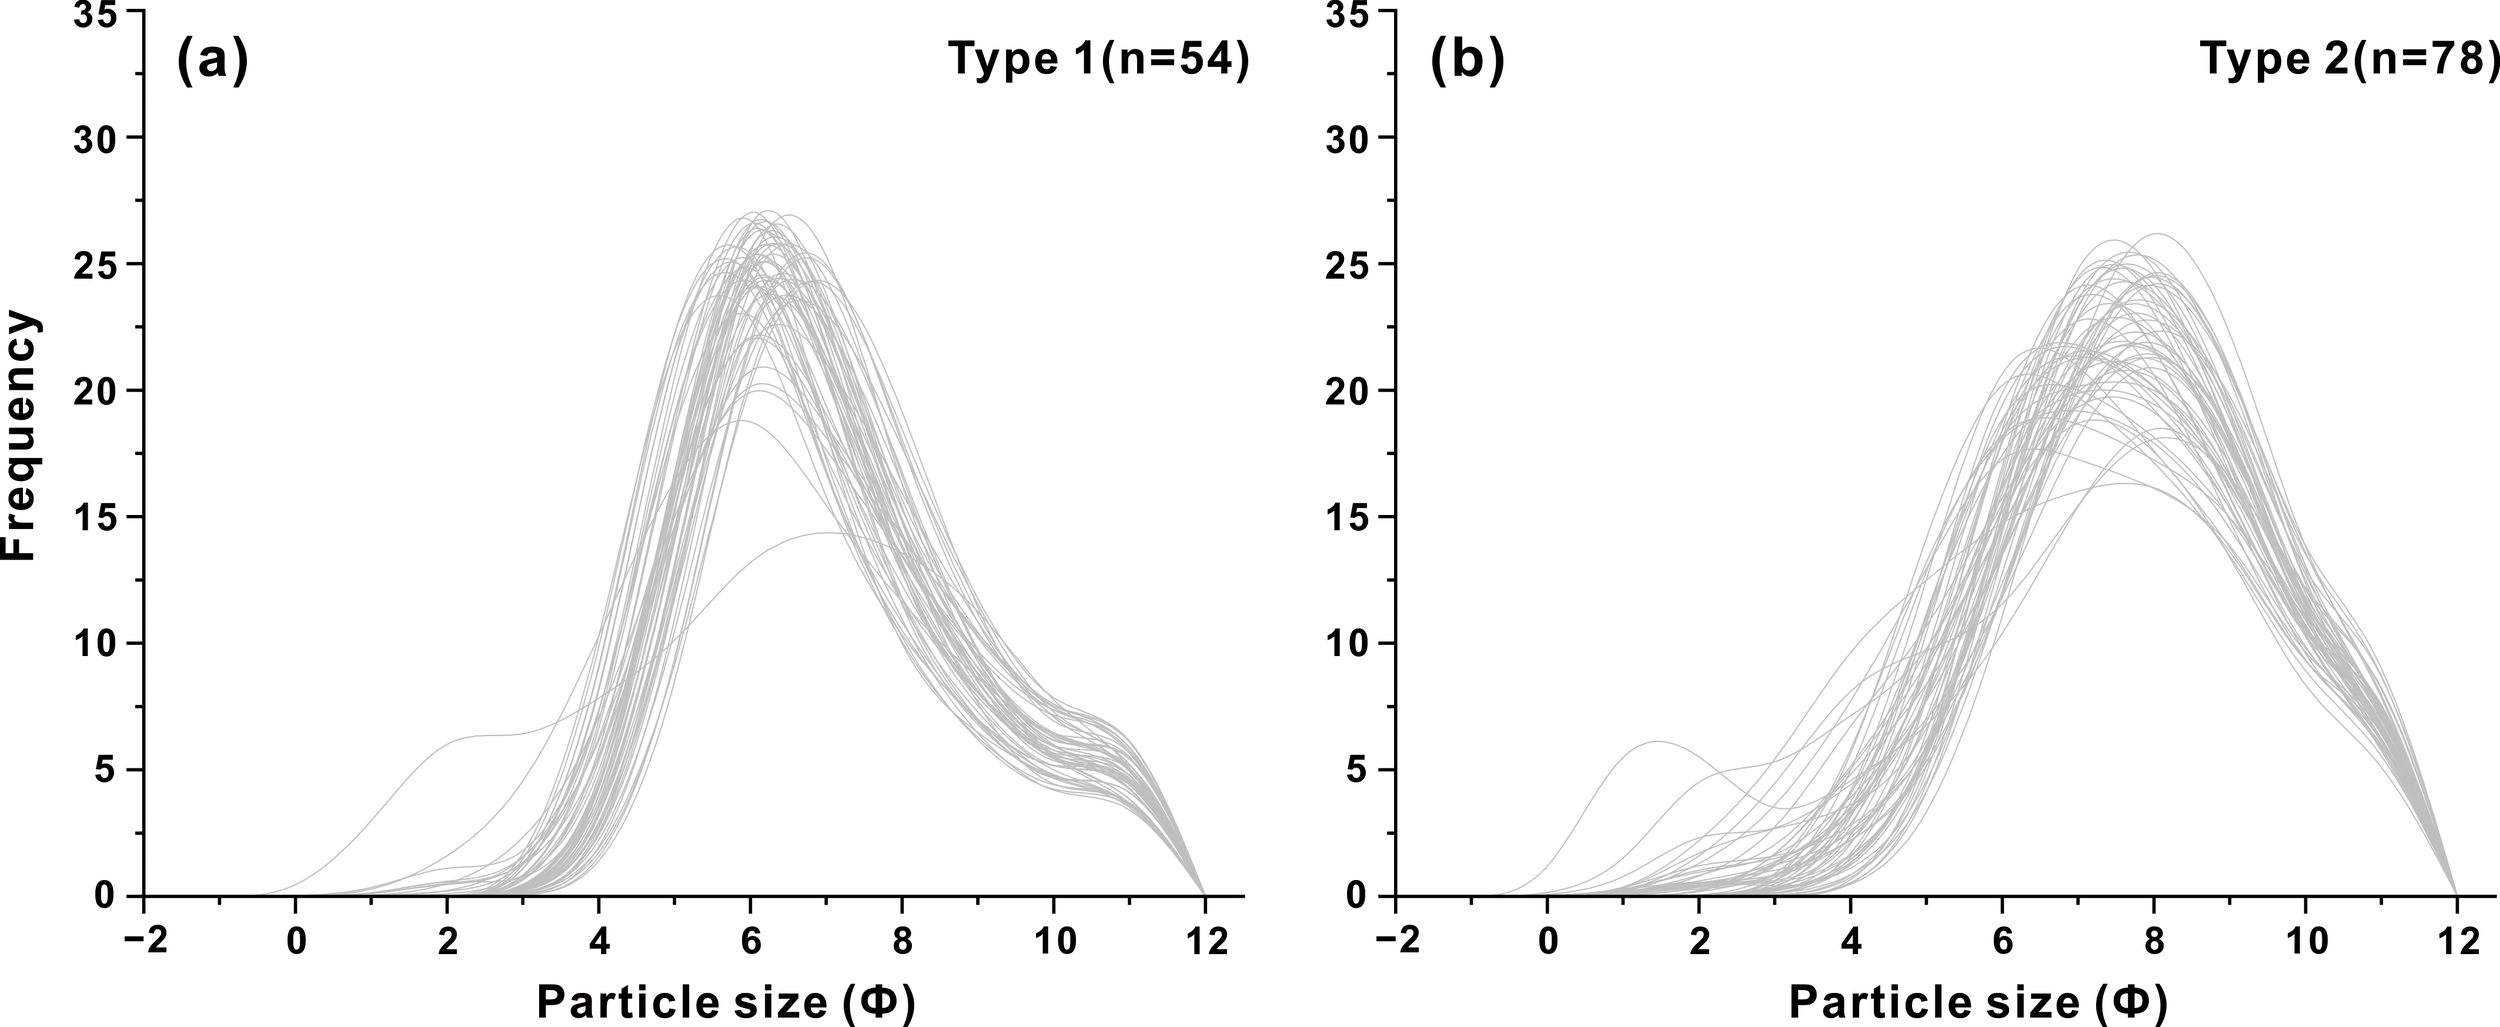
The particle size distribution curve of the (a) Type1 and (b) Type2.
As shown in Figure 3, the majority of the blue points (Type 2) were predominantly plotted in the upper half of the grain-size parameter columns, and only a few scattered orange points were plotted in this area (Type 1), whereas the lower sections exhibited the opposite distribution. At Site W07, the sediments are stratified into upper and lower subsections. The boundary between the distinct sedimentary hydrodynamic processes was identified to occur at a depth of 120.75 mbsf, coinciding with the interface of the gas hydrate reservoir and the non-gas hydrate layer (Bai et al., 2024).
5.1.2 Upper subsection sedimentary process
For the upper sediment subsection at Site W07, the sediment grain-size distribution is predominantly Type 2 (Figure 3). The C-M (one-percentile coarsest grain size (C) versus median grain size (M)) diagram of the grain-size parameters directly reflects the hydrodynamic conditions within the sedimentary layer (Passega, 1964). The trend line of the data points on the C-M diagram for the sediment samples from the upper subsection was oriented obliquely relative to both the C-M baseline and X-axis (Figure 7a). This orientation indicates that the sedimentary dynamics were not governed by gravity flow or deep-water suspension but were primarily influenced by traction flow (Passega, 1964; Stow & Smillie, 2020).
Figure 7
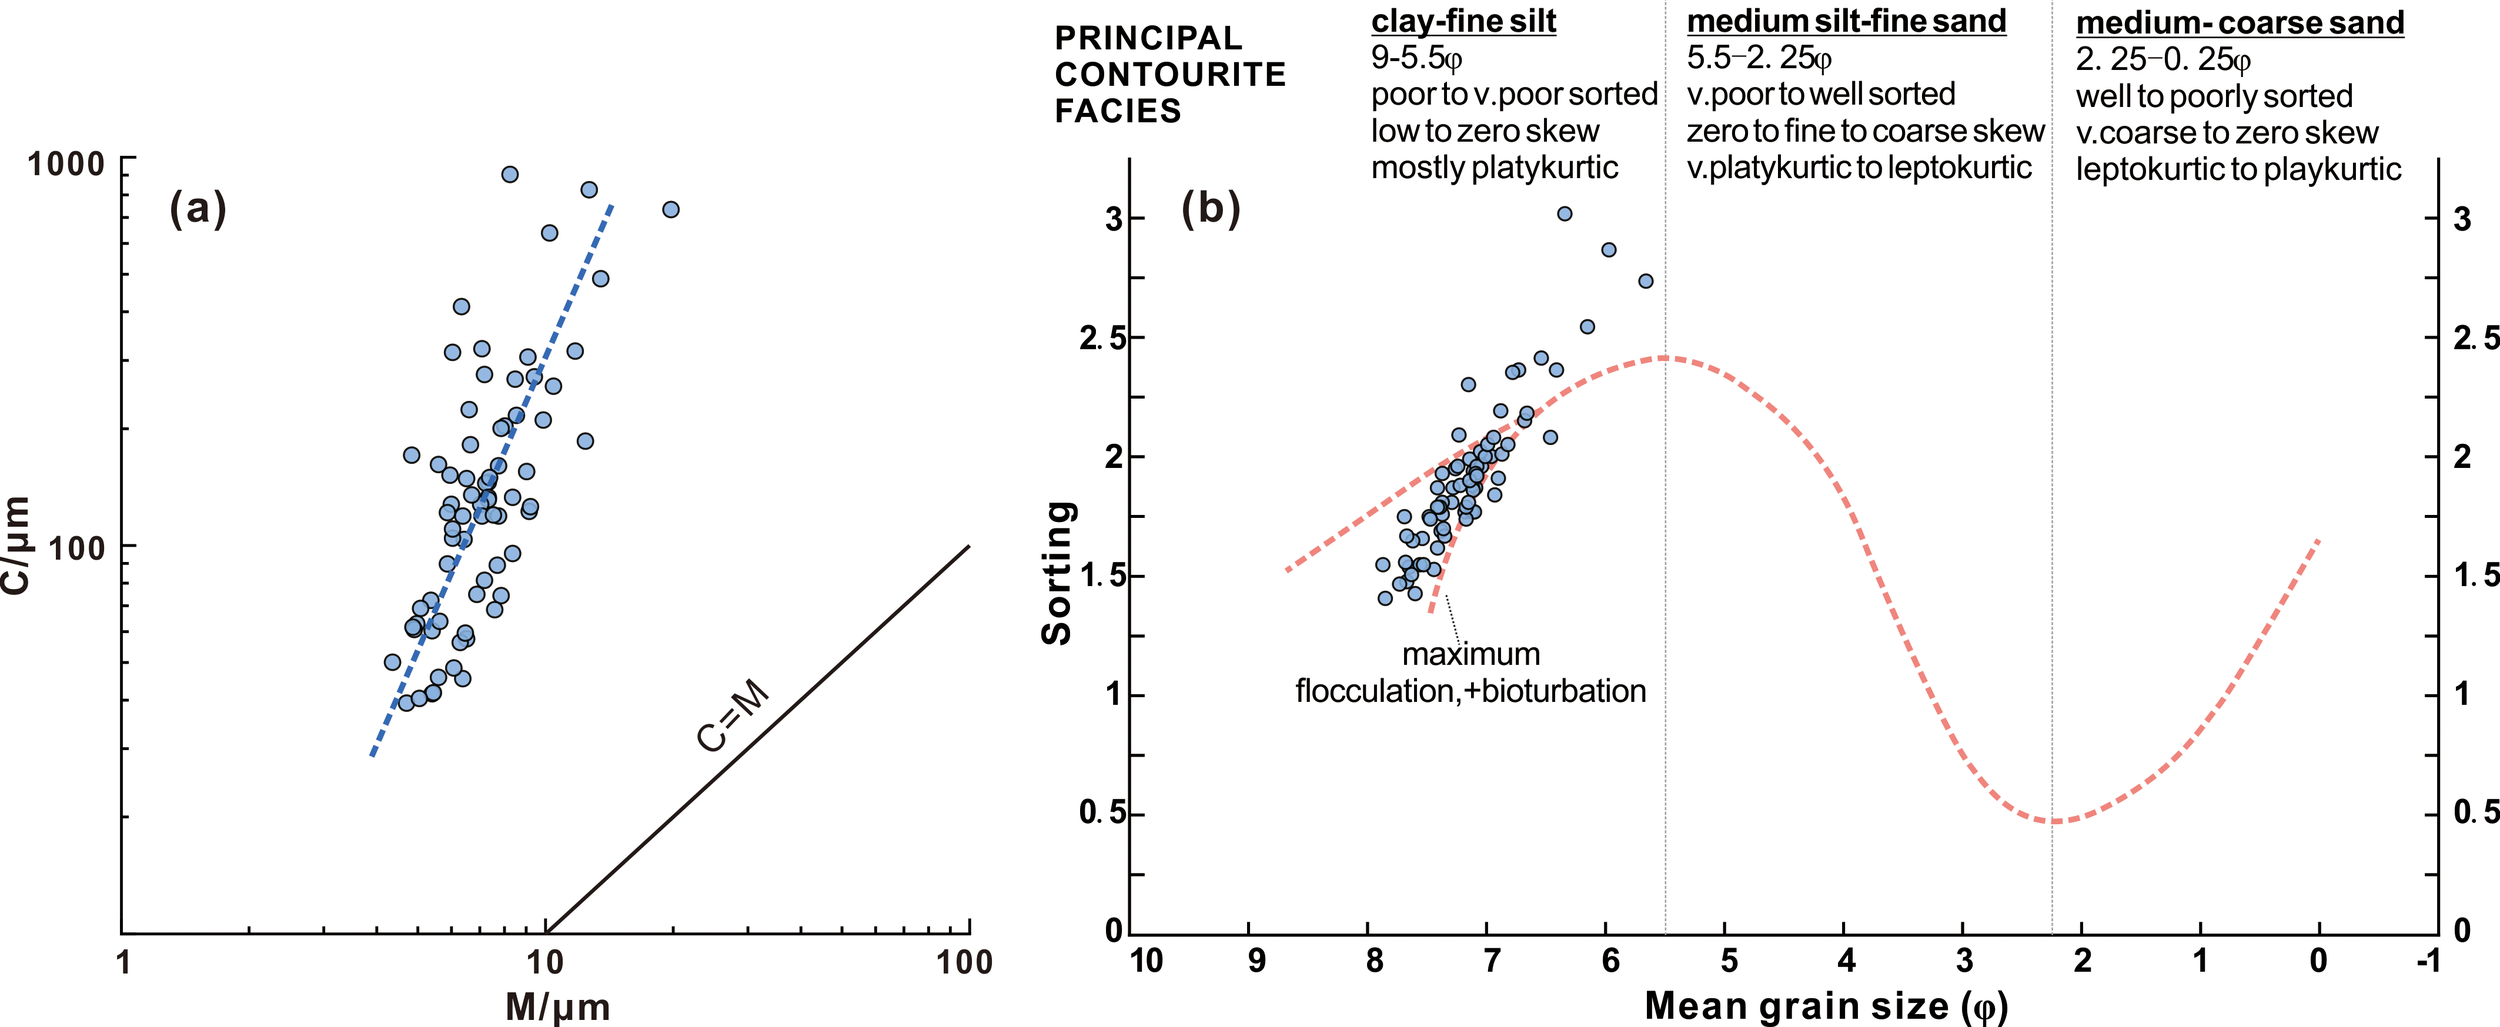
(a)The C-M diagram of sediments at Site W07 upper subsection; (b) the contourite identified diagram of sediments at Site W07 upper subsection, the red line is modified by Yu et al. (2020).
Some recent studies have utilised grain-size data from a large amount of modern contourite sediments to derive identification diagrams for contourite currents (Brackenridge et al., 2018; Yu et al., 2020). This method is capable of quantitatively identifying contourite sedimentary processes based on the grain size parameters of the sediments. It was discovered that the grain-size parameters of the upper subsection of the study layer closely align with the fitting curve associated with the weak bottom current process in a contourite current (Figure 7b). Given the extensive sedimentary records of contour currents in the study area accurately reflecting the input of terrestrial sediments (Gong et al., 2013; Chen et al., 2014; Chen et al., 2021), the upper subsection was primarily formed under the influence of traction flow and was most likely impacted by the along-slope contourite currents.
5.1.3 Lower subsection sedimentary process
For the lower subsection at Site W07, the sediment grain-size distribution is predominantly Type 1 (Figure 3). Unlike the upper subsection, the trend line of the data points of the lower subsection sediment samples was oriented parallel to the C-M baseline (Figure 8a), a hallmark of gravity-flow processes (Passega, 1964). Figure 8b illustrates that the distribution of the data points of the lower subsection samples did not exhibit a measurable correlation with the best-fit trend line used on contourite currents identification diagrams. Based on the features of both diagrams and considering the canyon geomorphology at the study site (Zhang et al., 2020; Wang et al., 2023), we infer that the formation of the lower subsection was primarily driven by a fine-grained turbidite process, which is distinct from the sedimentary dynamics of the upper subsection. The results of the particle size analysis indicated that the lower sedimentary layer is neither the product of stable, uniform sedimentary dynamics nor governed by a simple canyon slump system, and this complexity may significantly influence the gas hydrate accumulation.
Figure 8
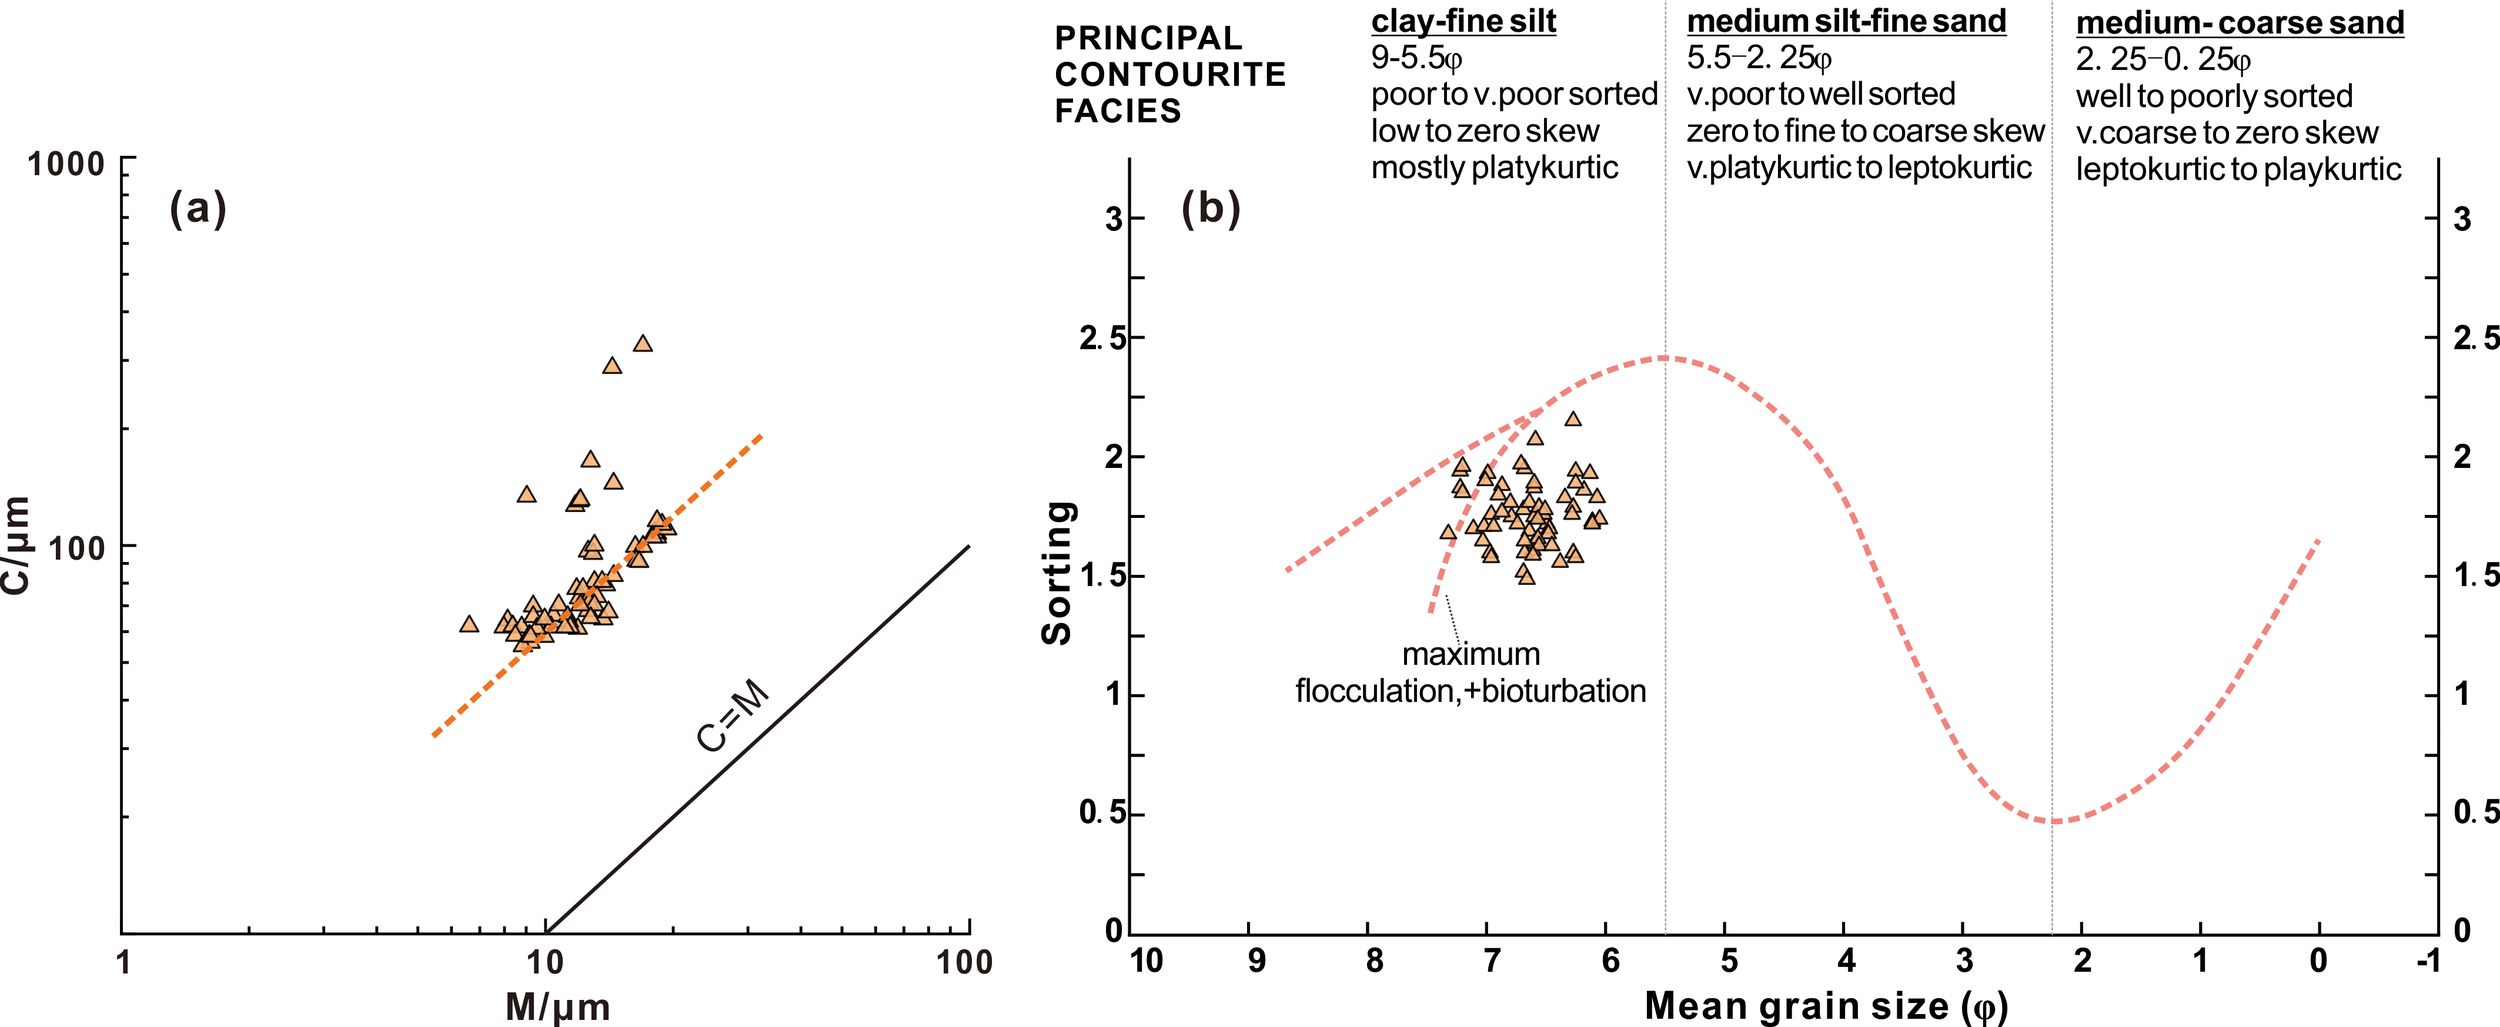
(a) The C-M diagram of sediments at Site W07 lower subsection;(b) the contourite identified diagram of sediments at Site W07 lower subsection, the red line is modified by Yu et al. (2020).
5.2 Sediment provenance
Figures 4e–h illustrates that the trend of the clay mineral component value changed at the transition boundary between the two distinct sedimentary processes. Figure 4 further reveals the occurrence of significant longitudinal differences in the mineral composition within the studied sediment interval, particularly between the upper and lower subsections. The upper subsection has a significantly higher concentration of felsic minerals (quartz and feldspar), whereas the lower subsection has a higher total clay mineral content (Figures 4e, f). Additionally, the clay mineral species in the upper and lower subsections differ markedly. The split violin plot shown in Figure 9 clearly demonstrates the variations in the clay mineral components in the upper and lower subsection sediments. Notably, the variations in the I/S mixed layer, illite, and chlorite contents are the most pronounced. The I/S mixed layer content is higher in the upper subsection (57–75%) and lower in the lower subsection (46–64%). Conversely, the illite content is lower in the upper subsection (13–23%) and higher in the lower subsection (17–28%). The kaolinite and chlorite content variations between the two subsections exhibit features similar to the variations in the illite content. Specifically, the lower subsection contains slightly more kaolinite and chlorite than the upper subsection.
Figure 9
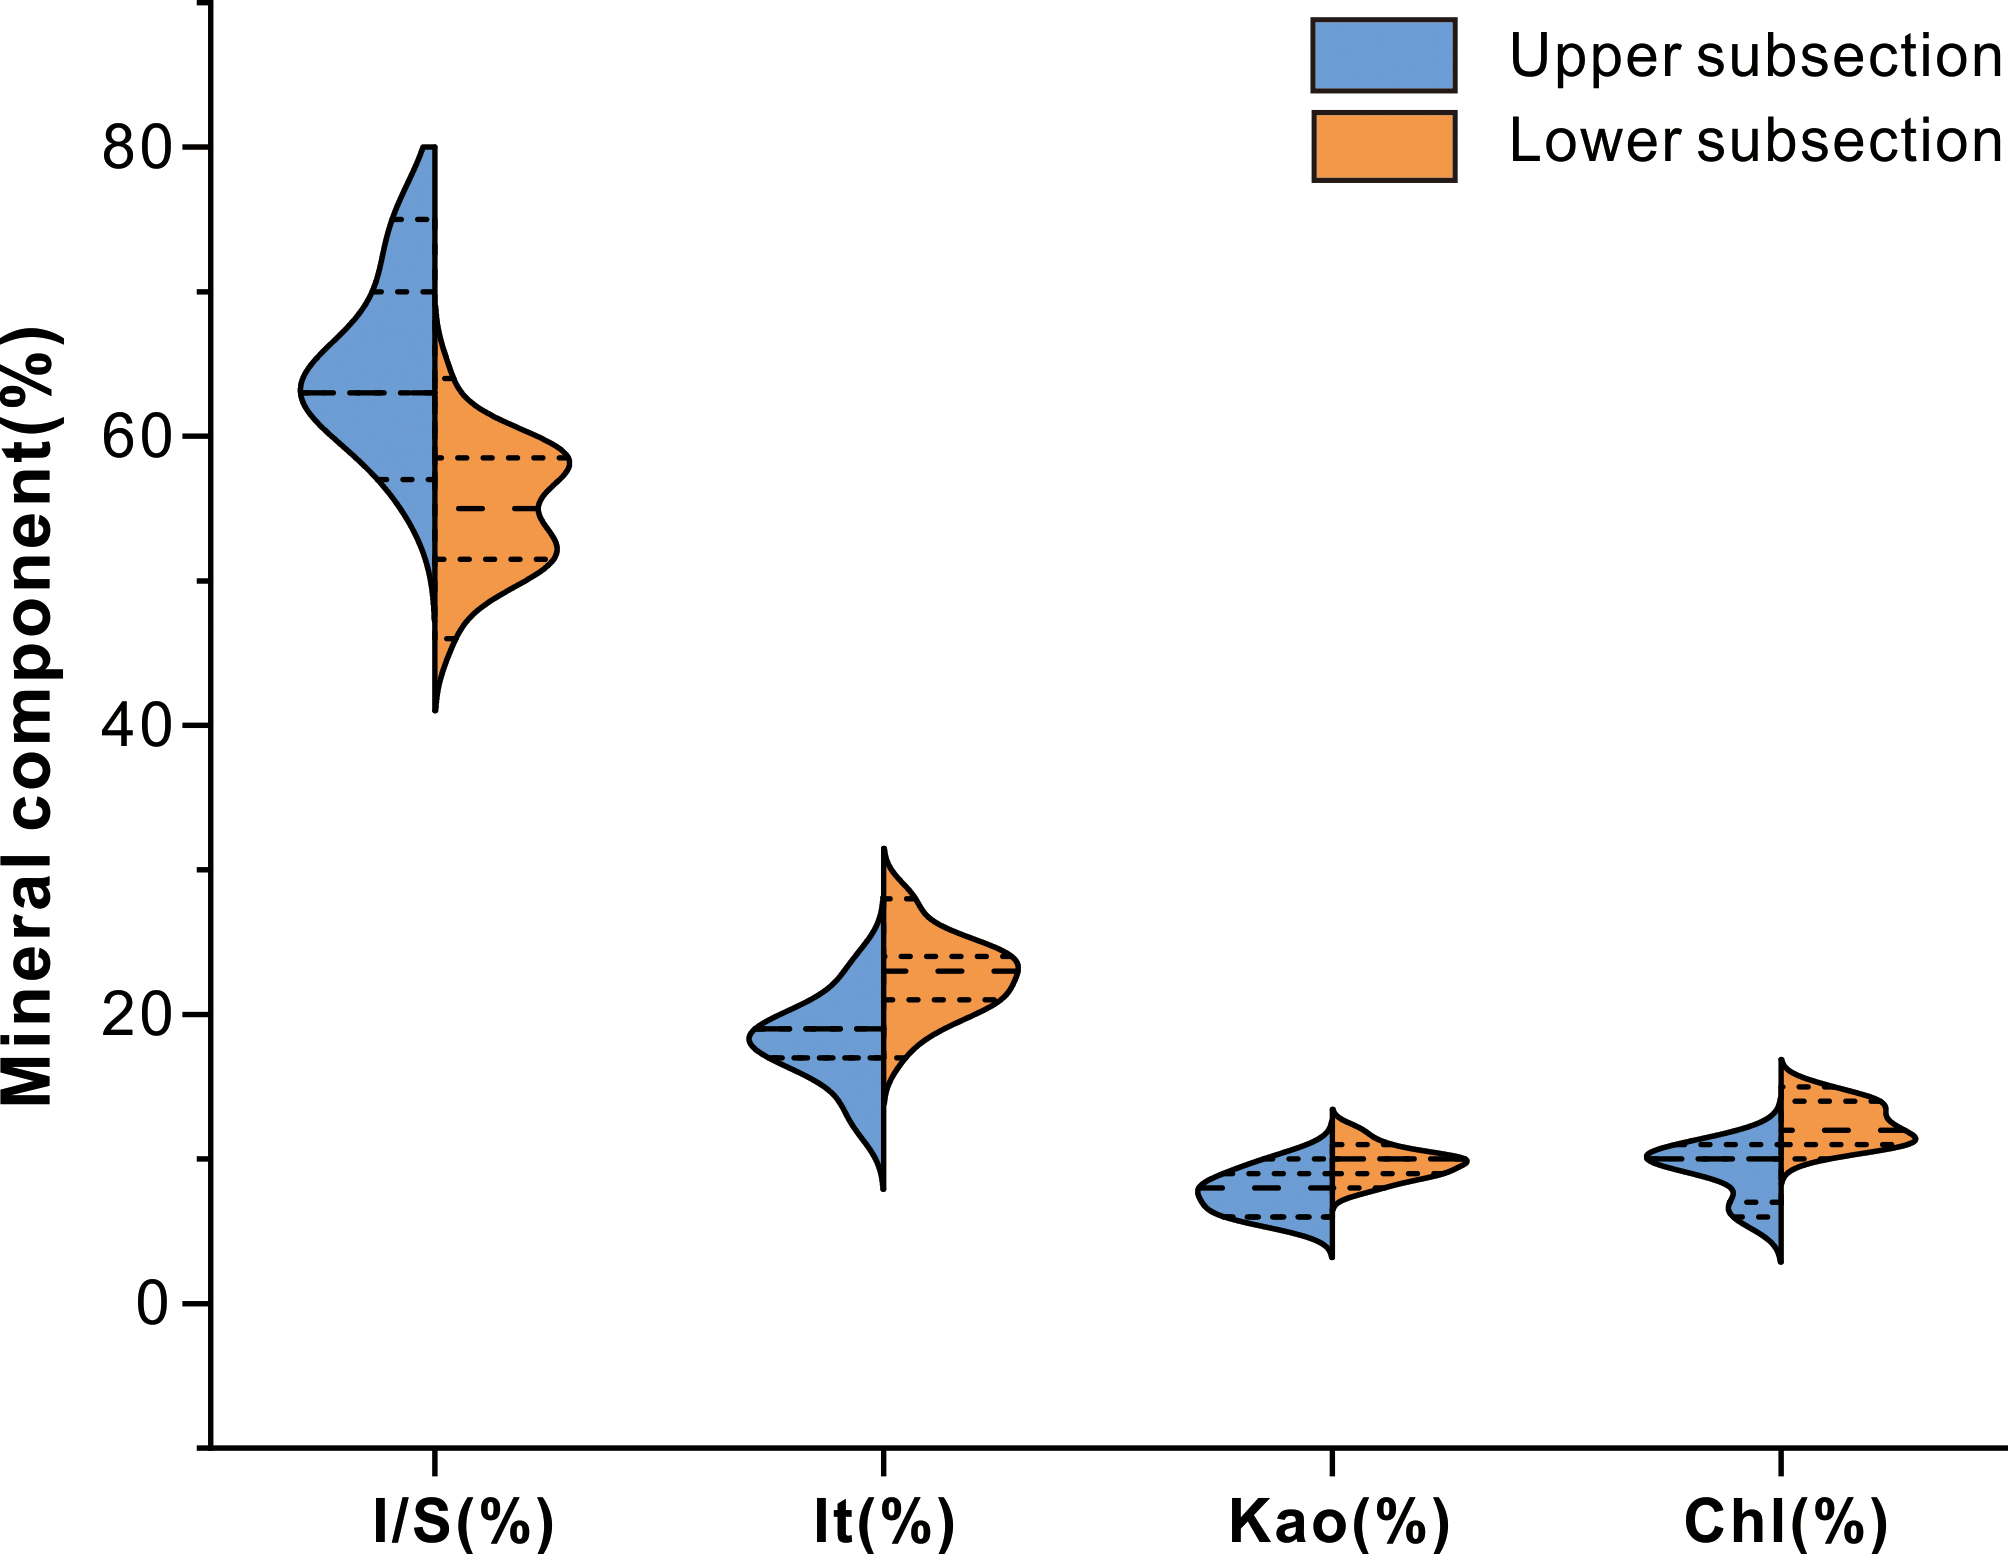
The split violin plot of clay mineral components in the contourite layer (blue) and the turbidite layer(orange).
These differences in the clay minerals between the upper and lower subsections can be attributed to distinct provenance sources. Several studies have investigated the source-to-sink transport processes between seafloor surface sediments in the SCS and adjacent riverbed sediments, based on the similarities of their clay mineral components (Liu et al., 2016; Hu et al., 2021). To determine the provenances of the two subsections, we employed a ternary diagram of the primary clay mineral groups (illite + chlorite, kaolinite, and smectite) to compare the clay mineral contents of the sediment samples from Site W07 (Figure 10a) and the seafloor surface samples (indicated by shaded areas in Figure 10b). Figure 10a indicates that the data points of the samples from studied layer at Site W07 clustered in area A. In contrast, the clay mineral composition of the upper subsection was shifted toward area B. In the northern part of the SCS, three primary sediment sources have been identified: the Pearl River (dominated by kaolinite and illite), Taiwan (dominated by illite and chlorite), and Luzon (dominated by smectite) (Liu et al., 2016). Area A’s clay mineral assemblage was marked by high concentrations of illite and chlorite, along with minor amounts of smectite and kaolinite, reflecting a predominantly Taiwan-sourced signature with an admixture of Luzon-derived smectite. This suggests that the sediments were primarily transported by currents flowing through the Luzon and Taiwan straits, possibly including the SCS Branch of the Kuroshio Current (SCSBKC) (Figure 1a). Moreover, the variations in sea level and current direction and intensity since the Quaternary have likely altered the influence zones of these three provenance areas (Steinke et al., 2008; Liu et al., 2010).
Figure 10
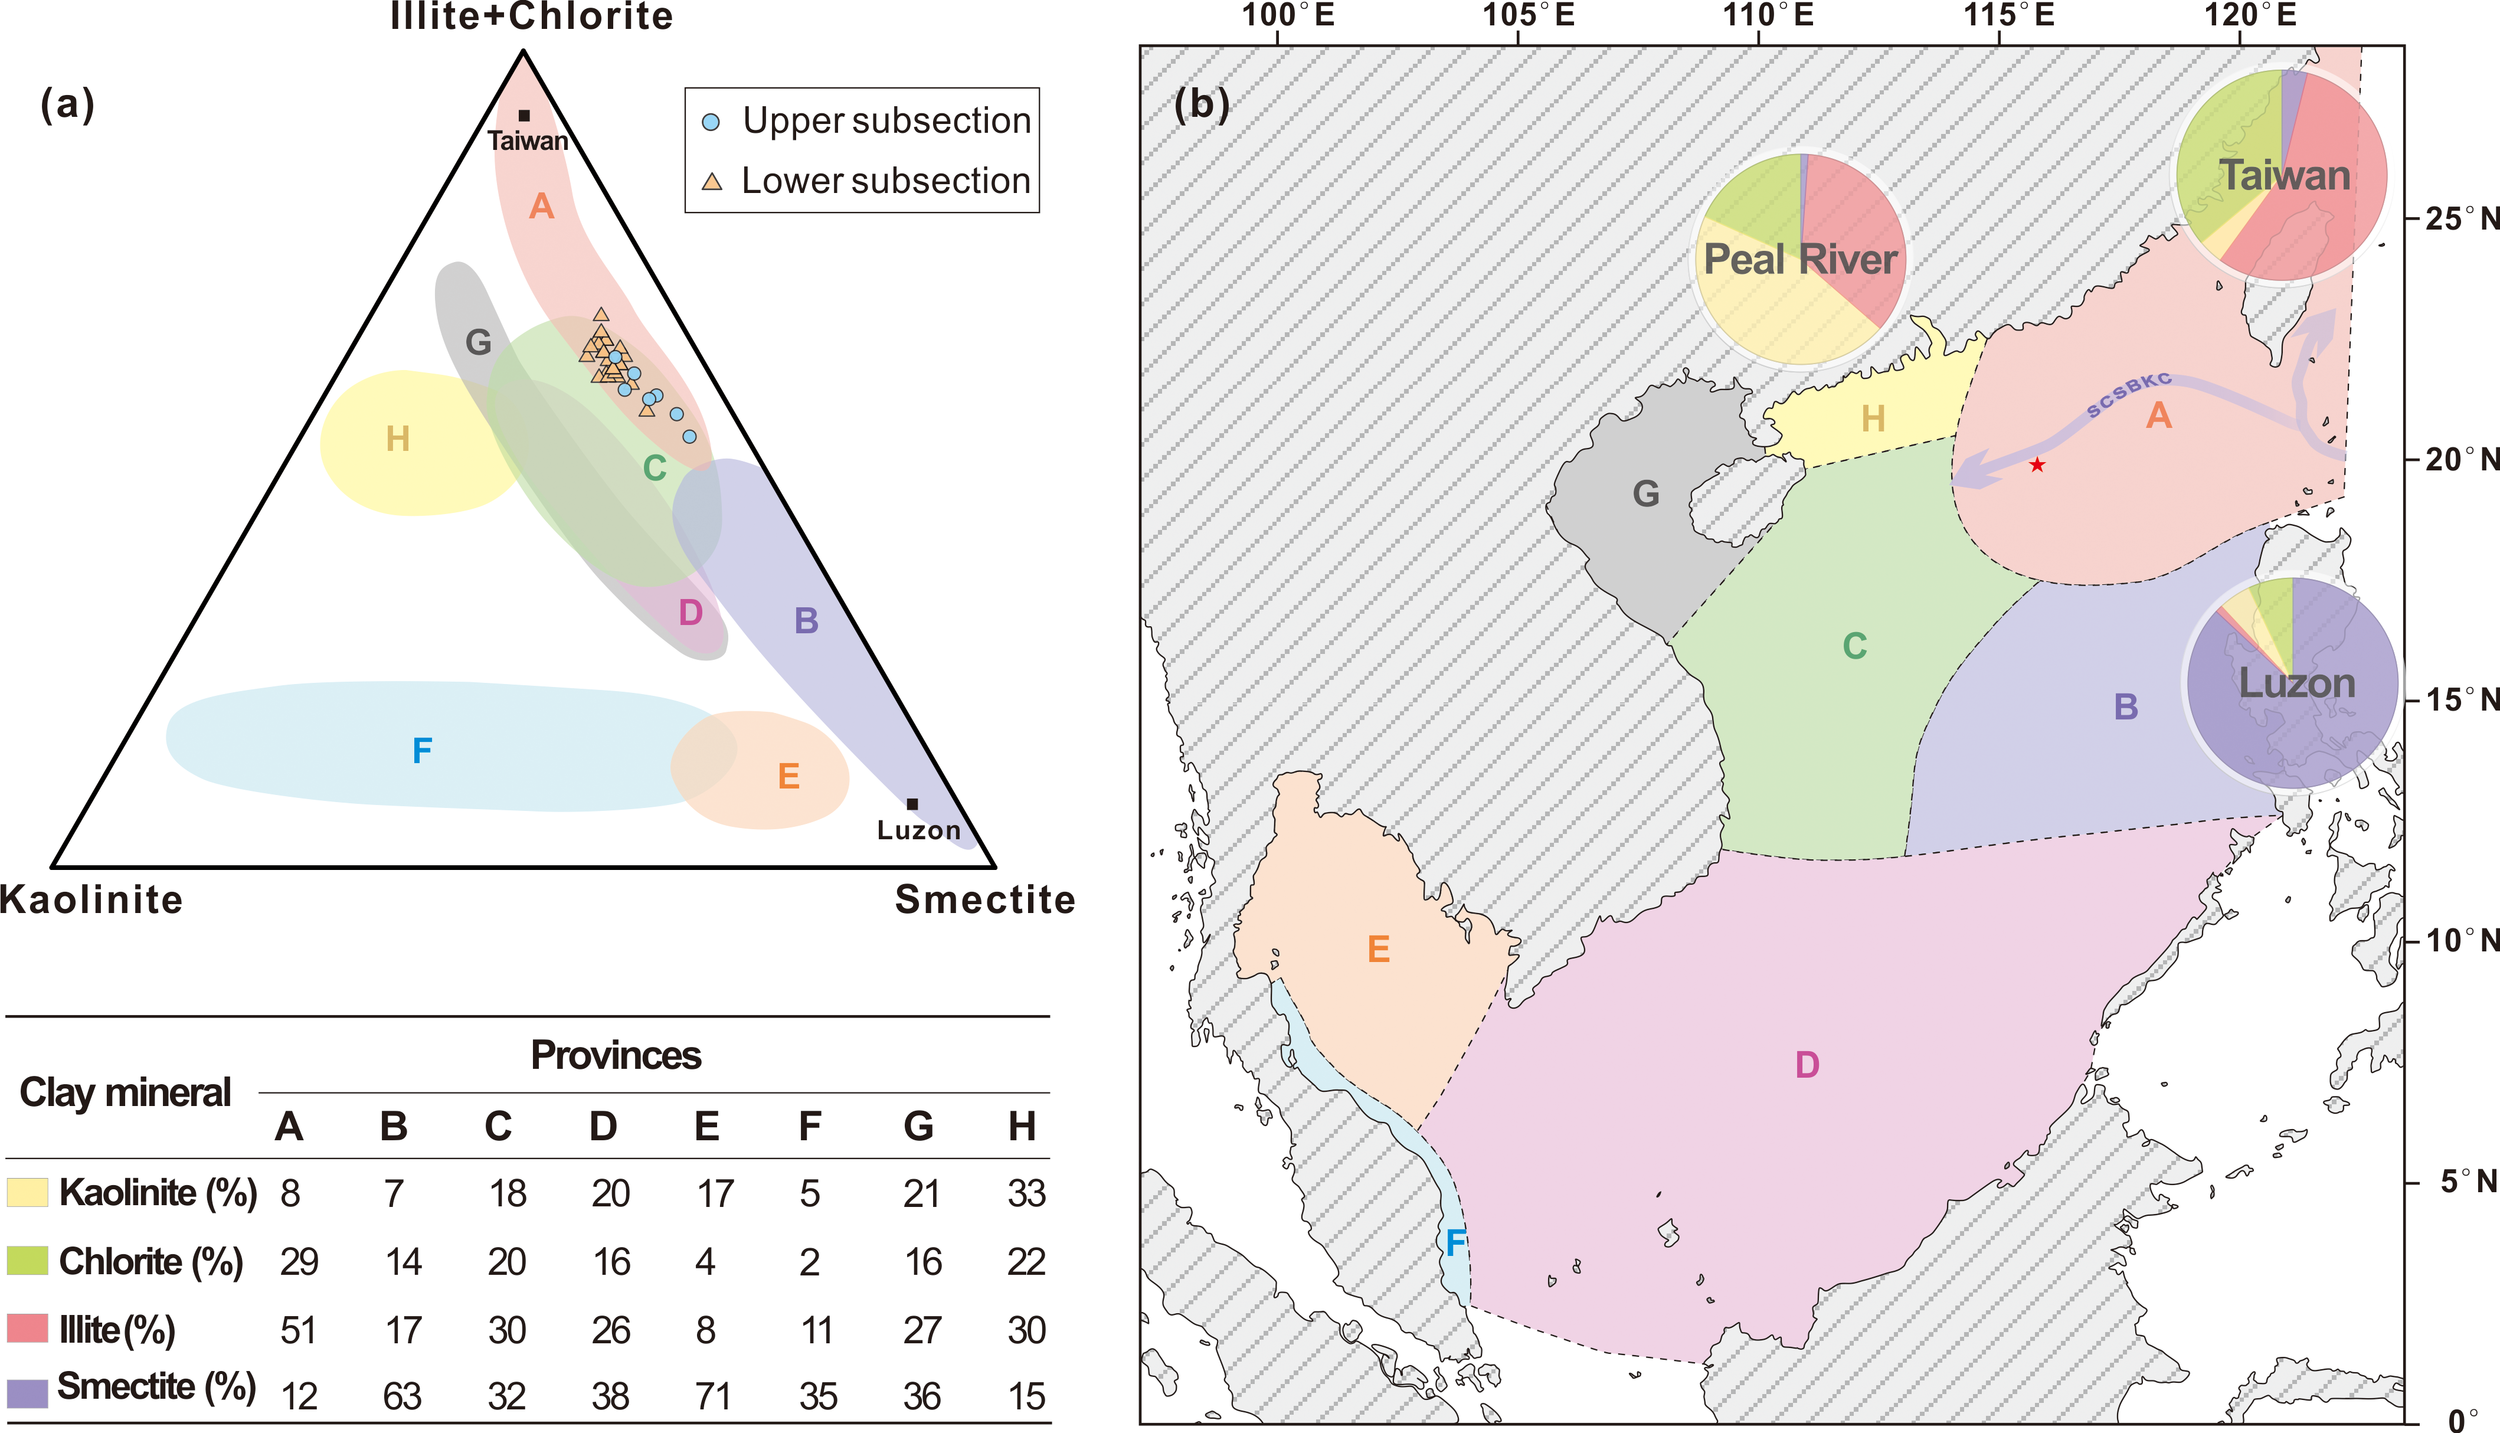
(a) Ternary diagram of the major clay mineral groups: illite + chlorite, kaolinite, and smectite. The eight shaded areas(A-H) of clay mineral assemblages are distributed in surface samples. The distribution of A-H areas modified by (Liu et al., 2016).(b) Distribution of clay mineral assemblage areas (A–H) in seafloor surface sediments of the SCS and average clay mineral assemblages in Peal River, Taiwan and Luzon (represented by pie charts), modified by (Liu et al., 2016). Average contents of clay minerals in areas A-H are indicated.
The distribution trends of the data points of the samples from the two subsections facilitated interpretation of the variations in the sediment provenances. For the lower subsection, the data point distribution resembled that of area A. In contrast, the data points of the upper subsection had higher smectite contents, and the data points clustered near area B, implying a greater contribution from Luzon. The lower subsection had a lower smectite content, which implies a weak contribution from Luzon and a predominant influence from Taiwan. Furthermore, the lower subsection had higher kaolinite and chlorite contents than the upper subsection, indicating some influence from the Pearl River provenance.
5.3 Environmental changes
Differences in sedimentary processes are closely linked to evolving paleoenvironments (Scheffler et al., 2006; Bjørlykke, 2014). The SCS, which includes our study area, is widely recognized as a natural laboratory for deciphering paleoenvironmental changes based on sedimentary records (Xu et al., 2017; Wang et al., 2020). In this study, we employed geochemical and foraminifera evidence from sediments as proxies to reconstruct changes in the sea level, primary productivity, and paleoenvironments in the research area.
Sea level fluctuations significantly influence various sedimentary processes that respond to paleoenvironment changes. The Al/Ti ratio is an effective proxy for tracing sea level changes by accurately reflecting the input of terrestrial sediments (Steinke et al., 2006; Chen et al., 2013). Al and Ti predominantly originate from terrestrial debris material (TDM), which is characterized by stable chemical properties and a high resistance to chemical weathering (Murray & Leinen, 1996). Additionally, the distributions of these elements vary between mineral types: Ti is primarily associated with heavier minerals, whereas Al is more abundant in light minerals. In summary, the Al/Ti ratio tends to be lower during lower sea levels and increases as the sea level rises (Chen et al., 2013). The Sr/Ba ratio is a widely adopted proxy for paleo-salinity and is closely associated with sea level changes (Wei & Algeo, 2020). Sea level fluctuations can modify the mixing ratios of freshwater and seawater, thereby influencing the Sr/Ba ratio. Generally, the Sr/Ba ratio exhibits a proportional increase with increasing water depth.
Potential factors affecting the Al and Ti concentrations must be eliminated to ensure the reliability of the Al/Ti ratio, particularly the potential increase in Ti related to volcanic activity (Smith and Fritz, 1989; Li et al., 2020). Figure 5e shows that within the studied interval, the Zr/Ti ratio remained low and exhibited a relatively smooth trend throughout the interval. Because sedimentary Zr is primarily derived from volcanic activity, the consistently low and stable Zr/Ti ratios in the studied interval may indicate that terrestrial detritus was the predominant source (Boës et al., 2011). The PAAS-normalized REE distribution pattern (Figure 11a) showed that both the upper and lower subsections exhibited essentially identical REE patterns and lacked significant positive Eu anomalies, thus further supporting the absence of active volcanism during the research interval (Green, 2006). Accordingly, the Al/Ti ratio (Figure 5b) is a robust proxy indicator for sea level changes in the study area.
Figure 11
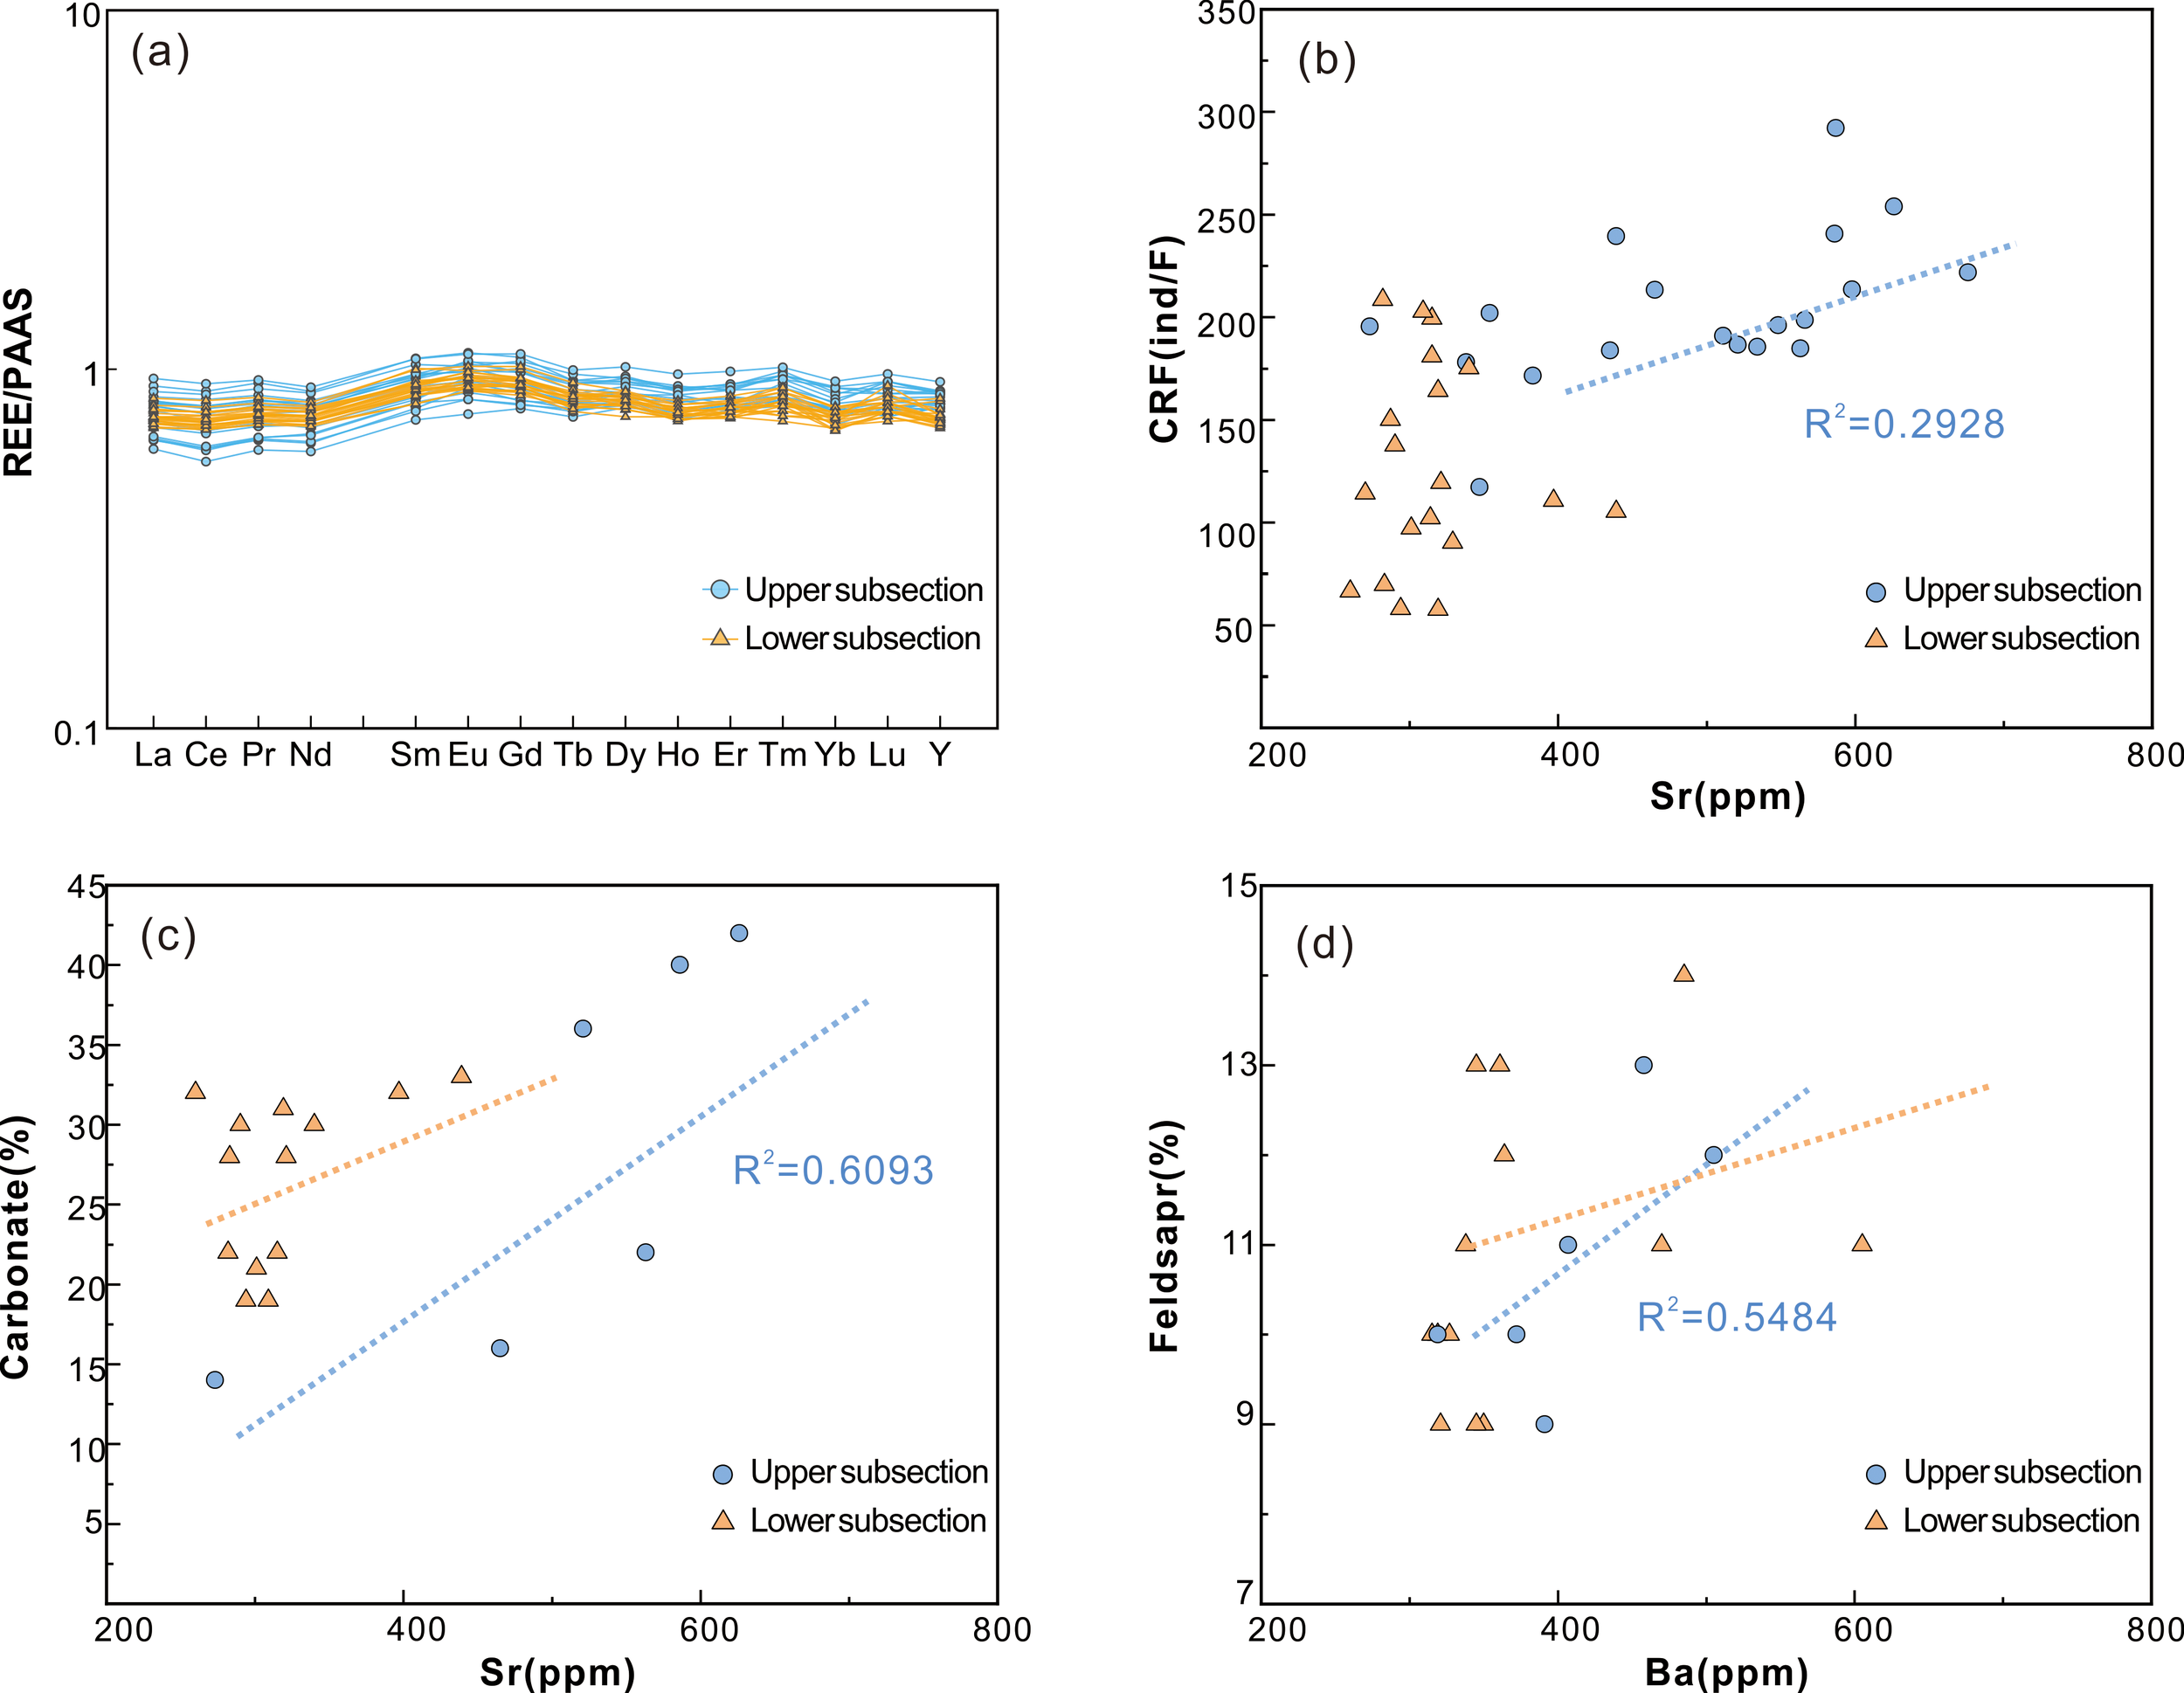
(a) Rare earth elements PAAS normalized distribution map of the upper subsection and the lower subsection. Dispersion diagrams showing the correlation between Sr and calcareous nannofossil relative abundance (b), carbonate mineral (c); the correlation between Ba and feldspar (d).
To use the Sr/Ba ratio as a proxy for paleo-salinity, which reflects sea level changes, it is crucial to eliminate potential interfering factors. Carbonate minerals and calcareous nannofossils, including coccolithophores, primarily affect the Sr concentration. We performed correlation analysis between the Sr concentrations and the calcareous nannofossil abundances and the carbonate mineral contents of the upper and lower subsections. The results are shown in Figure 11b and c. In the upper subsection, the Sr concentration exhibited a weak positive correlation with the calcareous nannofossil abundance (R2 = 0.2928; Figure 11b) and a stronger positive correlation with the carbonate mineral content (R2 = 0.6039; Figure 11c). In contrast, the low subsection did not exhibit significant correlations between the Sr concentration and these two indicators (Figures 11b, c). These results suggest that the Sr/Ba ratio of the upper subsection may not reliably indicate the paleo-salinity. Because the studied sediments are unconsolidated, potential terrestrial influences, especially from feldspar, on the Ba concentration must be excluded. Moreover, there was a weak correlation between the Ba and feldspar contents (Figure 11d) in the upper subsection (R2 = 0.5484), while there was no significant correlation in the lower subsection. Thus, the Ba concentration in the upper subsection may be overestimated due to terrestrial inputs, whereas estimates for the lower subsection are likely more reliable.
Accordingly, the Al/Ti ratio indicated that the sea level was higher when the upper subsection was deposited and lower when the lower subsection was deposited (Figure 5b). The Sr/Ba ratio (Figure 5d) exhibited a trend similar to that of the Al/Ti ratio (Figure 5b), with fluctuations in the upper subsection attributed to the effects of feldspar and carbonate minerals on the Sr and Ba concentrations. However, the Sr/Ba ratio (Figure 5d) was higher in the upper subsection than in the lower subsection.
The P/B ratio, defined as the ratio of planktonic foraminifera abundances to benthic foraminifera abundances, is strongly correlated with paleo-productivity and typically increases as the sea level rises (van der Zwaan et al., 1990; Azharuddin et al., 2017). Tyrrell (1999) proposed that P inputs govern oceanic primary productivity, as P is not regenerated once consumed. To mitigate the influence of the absolute P concentration, we employed the P/Ti and P/Al ratios as geochemical proxies for deciphering the paleo-productivity in the study area. The paleo-productivity is an essential factor in reconstructing paleoenvironments due to its close association with climate change. These parameters can be used to reconstruct the sedimentary environment and reveal longitudinal variations within the studied interval.
In the bottom layer (155–147 mbsf), the overall foraminifera abundance (Figure 12a) decreased with decreasing water depth (i.e., sea level drop). The planktonic foraminifera abundance (Figure 12b) exhibited a similar decreasing trend, while the benthic foraminifera abundance (Figure 12c) remained relatively stable. Notably, the significant decrease in the P/B ratio (Figure 12d) reflected a reduction in the surface primary productivity. Both the P/Al (Figure 5c) and P/Ti (Figure 5a) ratios exhibited decreasing trends, thereby supporting this inference. Furthermore, the Al/Ti (Figure 5b) and Sr/Ba (Figure 5d) ratios suggested that this layer corresponded to a persistently low sea level phase.In the middle-lower layer (147–133 mbsf), the foraminifera abundance (Figure 12a) initially increased, accompanied by increasing P/Al (Figure 5c) and P/Ti (Figure 5a) ratios, which indicates enhanced surface primary productivity. Simultaneously, both the Al/Ti (Figure 5b) and Sr/Ba (Figure 5d) ratios increased, suggesting a rise in sea level and a warmer climate. The unusually high P/B ratio (Figure 12d) may result from the reducing conditions of the marine subsurface environment. Subsequently, both the P/Al (Figure 5c) and the P/Ti (Figure 5a) ratios decreased, demonstrating a cooling climate, falling sea level, and reduced productivity. In the middle-upper layer (133–121 mbsf), the foraminifera abundance (Figure 12a) decreased sharply before gradually recovering. Simultaneously, both the planktonic (Figure 12b) and benthic foraminifera abundances (Figure 12c) increased, leading to a sharp increase in the P/Ti ratio (Figure 5a). Additionally, the P/Al ratio (Figure 5c) increased gradually, while both the Sr/Ba (Figure 5d) and Al/Ti ratios (Figure 5b) increased significantly. These observations indicate a rise in sea level and a warm climate, resulting in enhanced surface primary productivity, as evidenced by the marked increase in the foraminifera abundance (Figure 12a). During the deposition of the top layer (121-102mbsf), a higher sea level and warmer climate prevailed, as indicated by the higher Al/Ti (Figure 5b) and Sr/Ba (Figure 5d) ratios, along with a substantial increase in foraminiferal abundance (>2 orders of magnitude) (Figure 12). Meanwhile, GMGS4 cruise report show that this layer exhibits a marked shift in planktonic foraminiferal assemblage, with G. ruber, a surface-dwelling warm-water species, rapidly becoming dominant, indicating a significant climatic warming event (Wang, 2000; Kubota et al., 2010). The observed decrease in the surface primary productivity, as reflected by the decreases in the P/Al (Figure 5c) and P/Ti (Figure 5a) ratios, may be attributed to nutrient consumption caused by the extensive foraminifera.
Figure 12
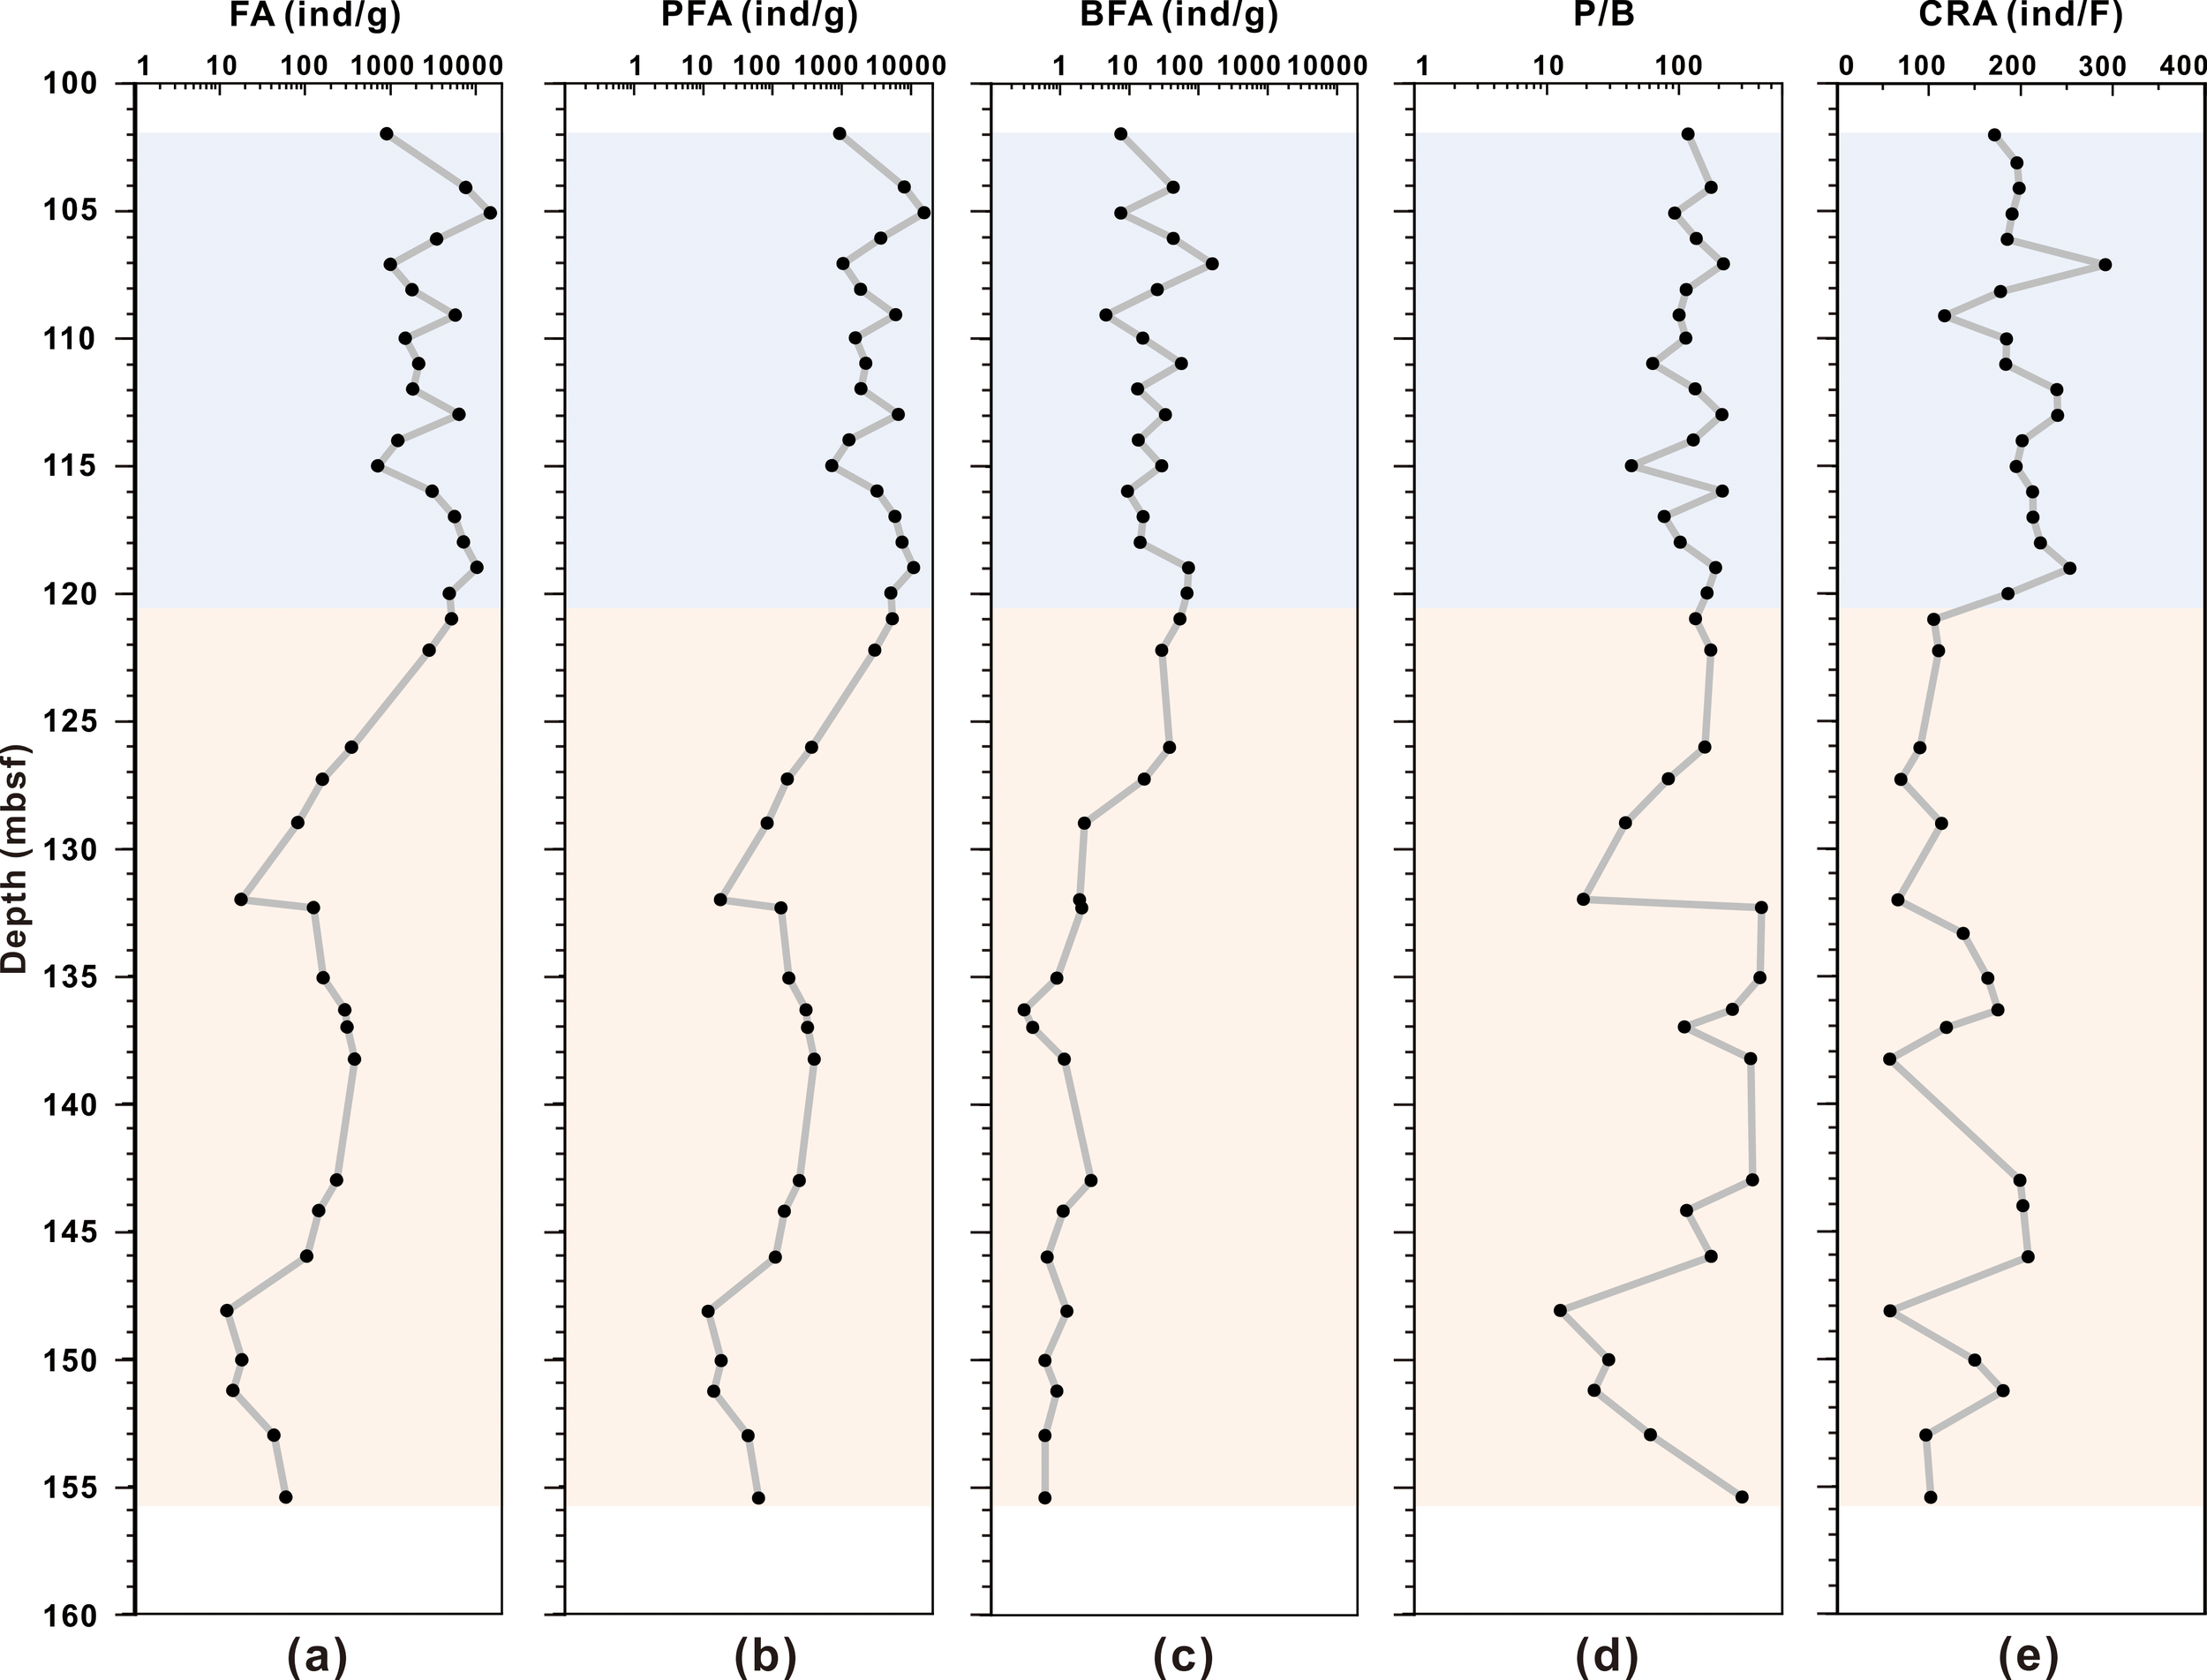
Depth profiles of biological data. (a) is for FA (foraminifera abundance). (b) is for PFA (planktonic foraminifera abundance). (c) if for BFA (benthic foraminifera abundance). (d) is for P/B ratio. (e) It is for CRA (calcareous nannofossil relative abundance). The blue and orange shaded areas indicate the upper subsection and the lower subsection, respectively.
Overall, the studied layer indicated a transition from a glacial period characterized by lower sea levels to an interglacial period characterized by higher sea levels. Moreover, the transitions of the paleoenvironment and paleoclimate coincided with the boundary separating the upper and lower subsections.
5.4 Coupling relationship between the sedimentary processes and gas hydrate accumulation
The sedimentary processes at Site W07 are closely correlated with the distribution of the gas hydrate reservoirs and the non-gas hydrate layers. The lower subsection, dominated by gravity flows, corresponds to the gas hydrate reservoirs, whereas the upper subsection, influenced by traction (contour) currents, corresponds to the non-gas hydrate layers.
Turbidite processes, including both sandy and fine-grained types, are generally considered to be favourable for gas hydrate accumulation because their coarser and heterogeneous grain sizes enhance the pore space and provide migration pathways for gas (Ito et al., 2015; Su et al., 2021). At Site W07, the upper subsection has slightly finer sediment grain sizes than the lower subsection. The mean grain sizes were 5.66–7.87 φ (average of 6.94 φ) in the upper subsection and 6.05–7.32 φ (average of 6.74 φ) in the lower subsection. The median grain sizes were 5.66–7.84 φ (average of 6.90 φ) in the upper subsection and 5.69–7.24 φ (average of 6.49 φ) in the lower subsection. However, the difference in the sorting values between the two subsections was minimal. Some of the samples from the upper subsection even exhibited poorer sorting, possibly due to their higher foraminifera contents. This presents a paradox. Although some studies suggest that a high foraminifera content promotes gas hydrate accumulation due to their coarse grain size and chambered structures (Chen et al., 2013; Zhang et al., 2017; Bai et al., 2022), at Site W07, the non-gas hydrate layers have significantly higher foraminifera contents (Figure 12a) (Jin et al., 2020). This suggests that coarser components do not necessarily promote gas hydrate accumulation. Both the grain size and foraminifera abundance indicated that grain size variations had a limited influence on gas hydrate accumulation in fine-grained sediments.
Furthermore, the data for Site W07 indicated that the varying sedimentary processes led to distinct mineralogical variations. Previous studies have shown that the mineralogy significantly influences gas hydrate formation. Quartz, due to its hydrophilic surface, promotes hydrate nucleation (Yu et al., 2024), whereas clay minerals hinder accumulation due to their high strong-bound water contents and complex structures (Venaruzzo et al., 2002; Zhang et al., 2017; Bai et al., 2022). Among clay minerals, the I/S mixed layer plays a dominant role due to its complex internal structure and large specific surface area, which significantly reduce porosity and permeability, effectively hindering the migration of gases and fluids in sediments and thereby suppressing hydrate formation (Zhang et al., 2022; Bai et al., 2024; Yang et al., 2024). These findings are consistent with the mineralogical variations observed at Site W07 (Figure 4).
Analysis of the sedimentary processes and depositional environments at Site W07 (Stage 1; Figure 13) indicated that the gravity flow-dominated lower subsection formed under cold climatic and low sea level conditions and that the sediments were primarily sourced from Taiwan. Under these conditions, the reduced inflow of the SCSBKC through the Luzon Strait limited the Luzon-derived sediment input, while the lower sea levels enhanced the sediment discharge from the paleo-Pearl River. The study site’s proximity to shelf edges, where slumping events are more frequent, also contributed to the sediment delivery. These conditions led to mineral assemblages enriched in felsic minerals and depleted in the I/S mixed layer, both of which are favourable for gas hydrate accumulation. In Stage 2 (Figure 13), the contour current-dominated upper subsection developed under warmer climatic and higher sea level conditions. The increased inflow of the SCSBKC through the Luzon Strait enhanced the Luzon-derived sediment input, while the rising sea level reduced the influence of the paleo-Pearl River discharge and suppressed gravity flow activity. These changes resulted in mineral assemblages with lower felsic contents and higher I/S mixed layer contents, conditions unfavourable for gas hydrate accumulation. It is worth noting that during periods of relatively intensified contour current activity, the sedimentary environment may become more oxidising, which could hinder the preservation of organic matter by promoting its degradation (Stow and Faugères, 2008; Amsler et al., 2022). This degradation leads to a reduction in the total organic carbon content of the sediments, potentially suppressing the generation of in-situ microbial gas and thereby exerting a negative influence on gas hydrate formation (Zhang et al., 2017, 2019).
Figure 13
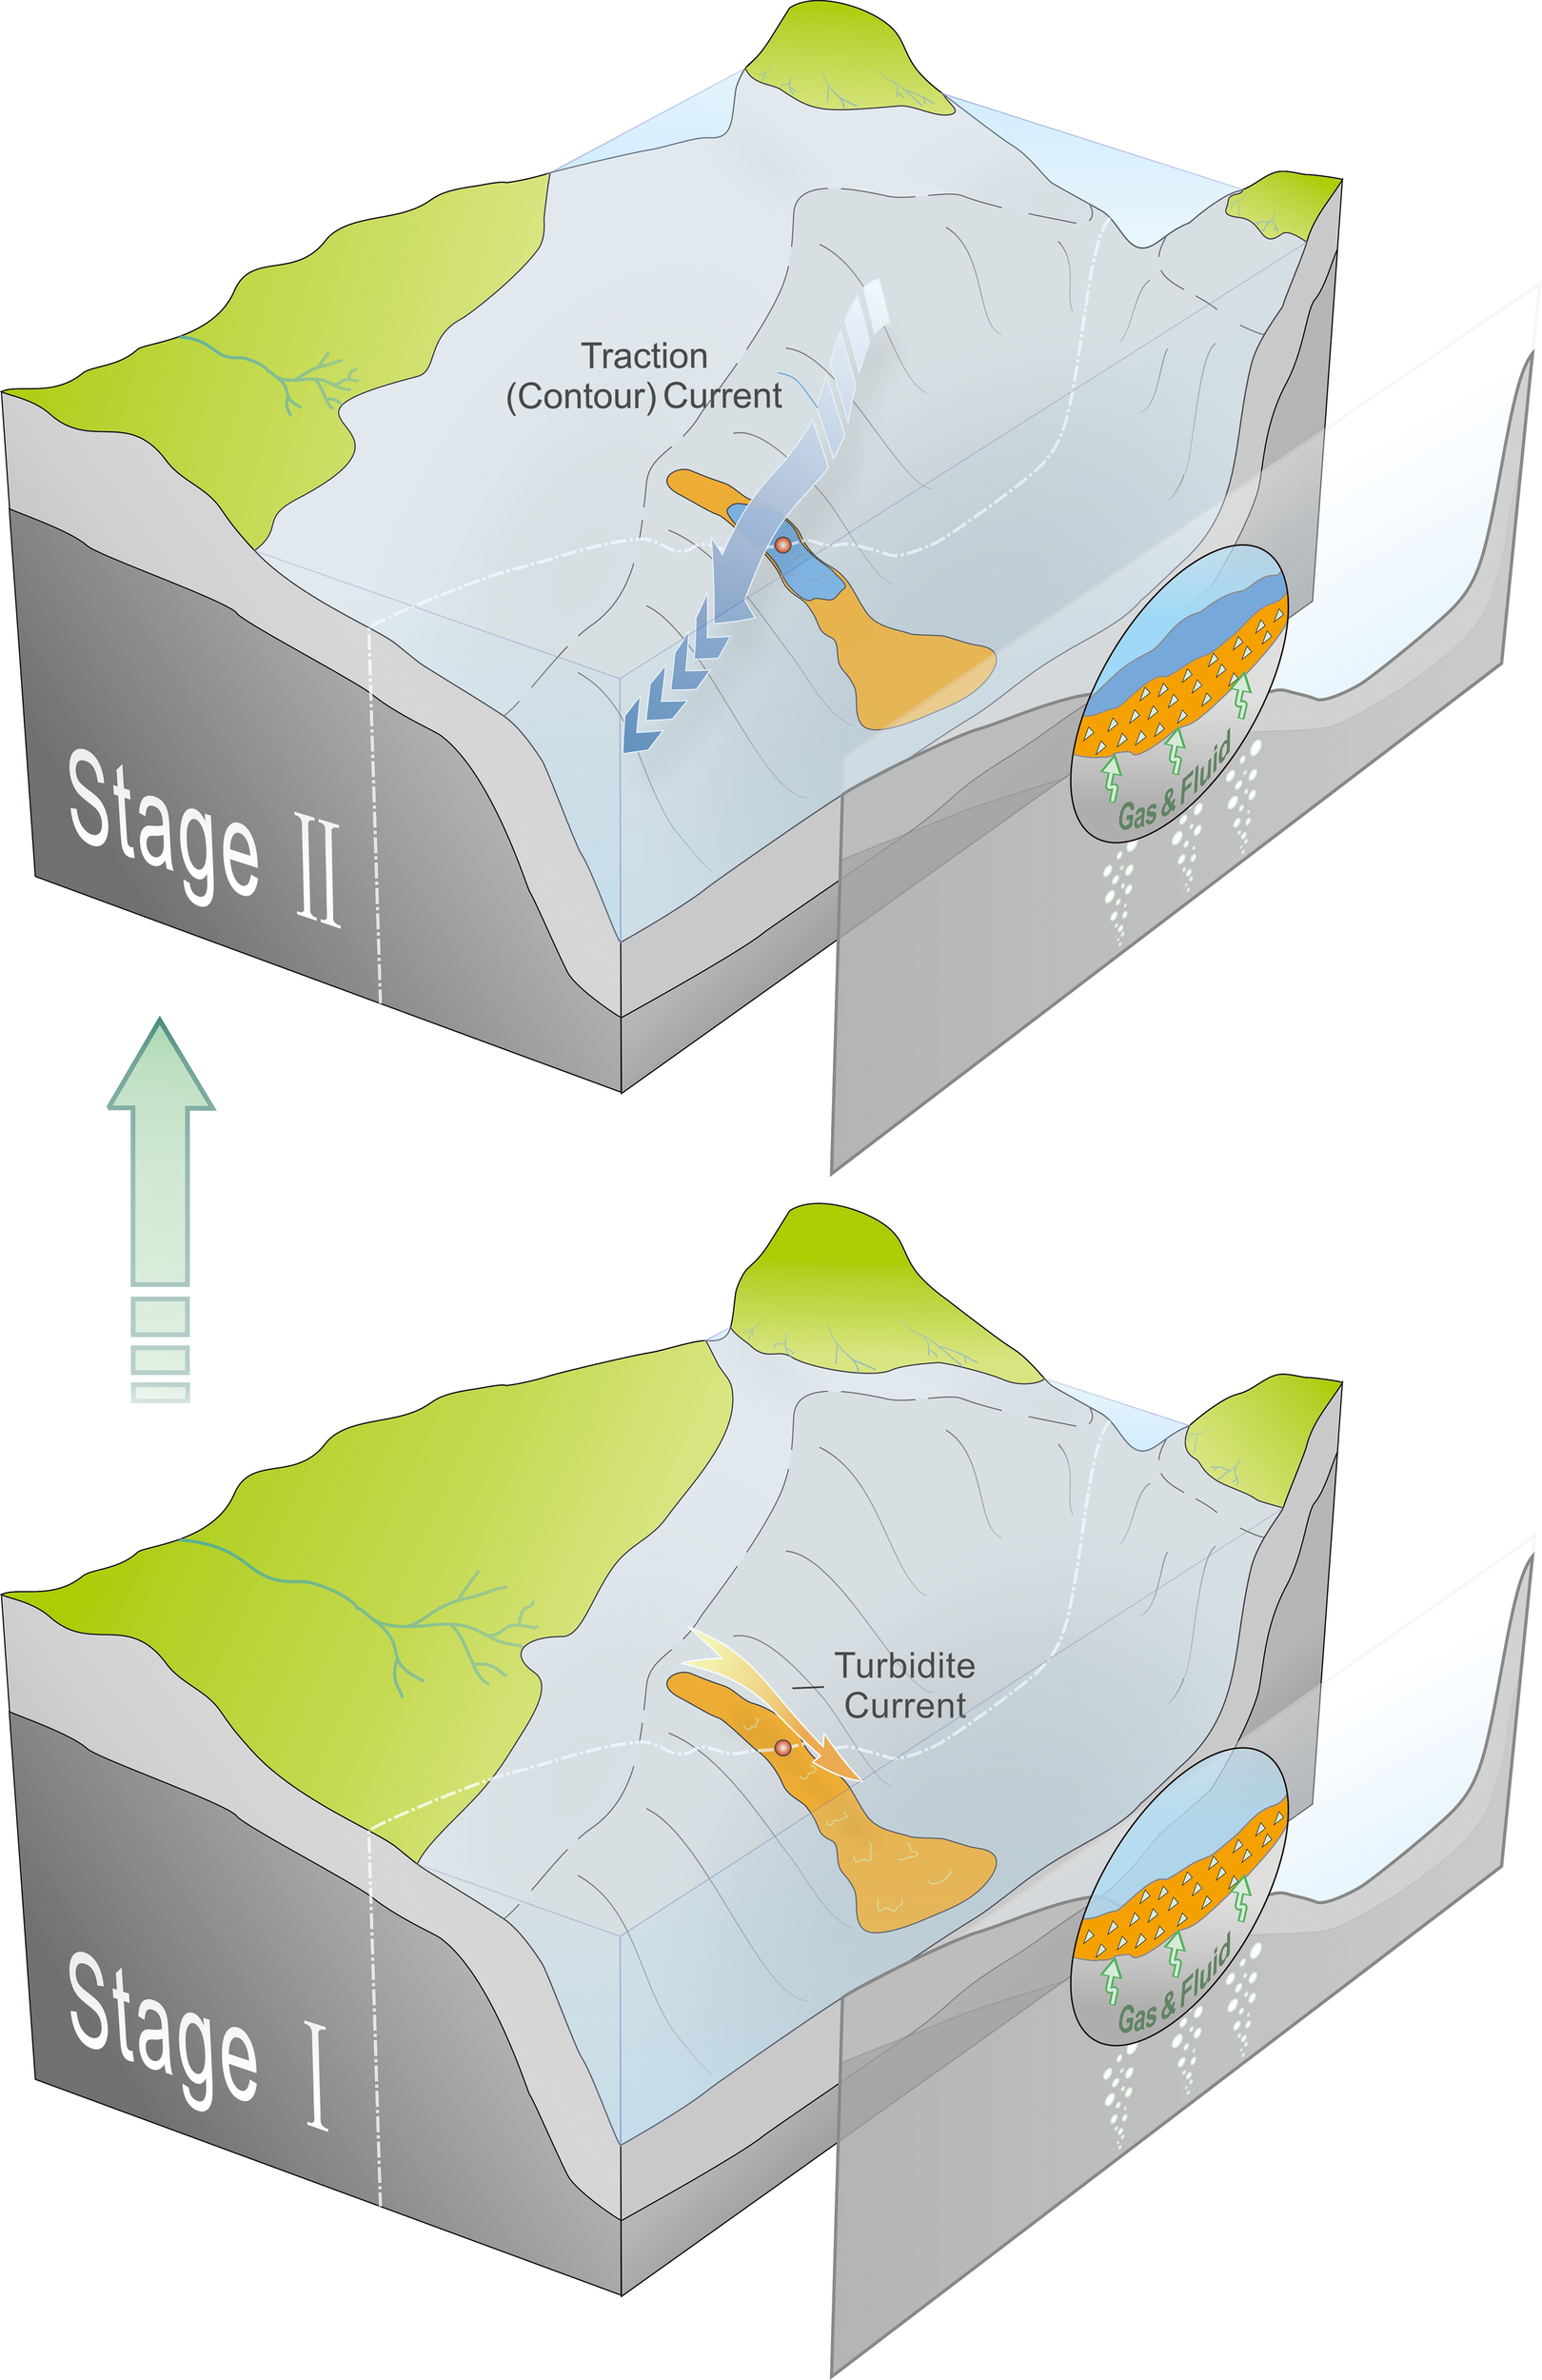
The model of the coupling relationship between the sedimentary process and gas hydrate accumulation.
Due to the high sensitivity of HSZ to environmental factors, such as geothermal gradient and formation pressure, gas hydrate reservoirs may undergo repeated cycles of dissociation and reformation with changes in the thickness of HSZ, making hydrate accumulation a dynamic process. In site W07, the gas hydrates at 121~152 mbsf formed at relatively recent ages, possibly after 0.15 Ma (Song et al., 2022), much later than the sedimentary formation of gas hydrate-bearing layers. Thus, the spatiotemporal linkage between sedimentation and gas hydrate accumulation is clarified. The prior formation of fine-grained turbidites (the lower subsection) and overlying contourite sediments (the upper subsection) provided suitable reservoir space for the upward migration and accumulation of thermogenic gas or gas released from hydrate dissociation in the underlying layers. Given the minor contribution of microbial gas to hydrate formation in the study area, the different enrichment of gas hydrates in the two sedimentary subsections is primarily attributed to variations in their sediment properties.
Therefore, the link between sedimentary processes and gas hydrate reservoirs is governed by two key factors: (1) mineralogical variations driven by different sedimentary processes, and (2) the joint control of depositional environments on both sedimentation and gas hydrate accumulation.
6 Conclusions
1) At Site W07 in the Shenhu area, traction currents (contour currents) primarily governed the sedimentation of the upper sediment subsection, whereas the lower subsection is composed of fine-grained turbidites. Notably, the interface between these distinct sedimentary layers aligns with the distribution of the gas hydrates at this site. Moreover, the fine-grained turbidite deposits were intimately associated with the gas hydrate reservoir.
2) Our reconstruction of the sedimentary processes, supported by geochemical data, clarifies the differences in the sedimentary environments in which the sediments of the gas hydrate reservoirs and non-gas hydrate layers in the Shenhu area of the northern SCS were deposited. The characteristics of the lower subsection reflect a depositional environment dominated by gravity flows. This environment was characterized by cooler conditions, a lower sea level, and a predominant influence from sediment sources originating in Taiwan and the paleo-Pearl River. The upper subsection has high felsic mineral contents and low I/S mixed layer contents, thereby promoting gas hydrate accumulation. In contrast, the deposition of the upper subsection was characterized by traction current (contour current) control, which is associated with warmer climatic and high sea level conditions. In addition to sediment derived from Taiwan, materials from the Luzon source were transported along the SCSBKC pathway, while the influence of the paleo-Pearl River source diminished. Conversely, the lower subsection has low felsic mineral contents and high I/S mixed layer contents, resulting in unfavourable conditions for gas hydrate formation.
3) Paleo-environmental changes regulated both the sedimentary processes and sediment sources, thereby affecting the gas hydrate accumulation. Investigating sedimentary processes provides a novel perspective for linking paleo-environments with gas hydrate enrichment.
Statements
Data availability statement
The datasets presented in this study can be found in online repositories. The names of the repository/repositories and accession number(s) can be found below: https://figshare.com/s/2f7427e1178efe75c4fd.
Author contributions
WC: Investigation, Methodology, Visualization, Writing – original draft, Writing – review & editing, Formal analysis. CB: Supervision, Project administration, Conceptualization, Validation, Investigation, Funding acquisition, Writing – review & editing, Formal analysis, Writing – original draft. HX: Methodology, Investigation, Visualization, Software, Writing – review & editing, Formal analysis. XX: Software, Methodology, Investigation, Writing – review & editing.
Funding
The author(s) declare financial support was received for the research and/or publication of this article. This works was supported by National Key Research and Development Program of China (No. 2024YFC2814702), National Natural Science Foundation of China (No. 42376217), and Fundamental Research Funds for the Central Universities of China (3-7-10-2025-003).
Conflict of interest
The authors declare that the research was conducted in the absence of any commercial or financial relationships that could be construed as a potential conflict of interest.
Generative AI statement
The author(s) declare that no Generative AI was used in the creation of this manuscript.
Publisher’s note
All claims expressed in this article are solely those of the authors and do not necessarily represent those of their affiliated organizations, or those of the publisher, the editors and the reviewers. Any product that may be evaluated in this article, or claim that may be made by its manufacturer, is not guaranteed or endorsed by the publisher.
References
1
Amsler H. E. Thöle L. M. Stimac I. Geibert W. Ikehara M. Kuhn G. et al . (2022). Bottom water oxygenation changes in the southwestern Indian Ocean as an indicator for enhanced respired carbon storage since the last glacial inception. Clim. Past18, 1797–1813. doi: 10.5194/cp-18-1797-2022
2
Azharuddin S. Govil P. Singh A. D. Mishra R. Agrawal S. Tiwari A. K. et al . (2017). Monsoon-influenced variations in productivity and lithogenic flux along offshore Saurashtra, NE Arabian Sea during the Holocene and Younger Dryas: A multi-proxy approach. Palaeogeogr. Palaeoclimatol. Palaeoecol.483, 136–146. doi: 10.1016/j.palaeo.2016.11.018
3
Bai C. Su P. Su X. Cui H. Shang W. Han S. et al . (2022). Characterization of the sediments in a gas hydrate reservoir in the northern South China Sea: Implications for gas hydrate accumulation. Mar. Geol.453, Article 106912. doi: 10.1016/j.margeo.2022.106912
4
Bai C. Su P. Xu X. Zhang Y. Han S. Liang J. (2024). Controlling effect of particle size on gas hydrate enrichment in fine-grained sediments. Earth Space Sci.11. doi: 10.1029/2024ea003594
5
Bai C. Zhang G. Lu J. a. Liang J. Yang Z. Yan W. et al . (2019). Deep-water sediment waves as a special gas hydrate reservoirs in the Northeastern South China Sea. Mar. Petroleum Geol.101, 476–485. doi: 10.1016/j.marpetgeo.2018.12.031
6
Bjørlykke K. (2014). Relationships between depositional environments, burial history and rock properties. Some principal aspects of diagenetic process in sedimentary basins. Sedimentary Geology301, 1–14.
7
Boswell R. (2009). Is gas hydrate energy within reach? Science325, 957–958. doi: 10.1126/science.1175074
8
Boswell R. Collett T. (2006). The gas hydrates resource pyramid. Natural Gas & Oil. 304, 285–4541. Available at: https://www.researchgate.net/profile/T-Collett/publication/240442367_The_Gas_Hydrates_Resource_Pyramid/links/55d5e82808aeb38e8a821df1/The-Gas-Hydrates-Resource-Pyramid.pdf.
9
Brackenridge R. E. Stow D. A. Hernández-Molina F. J. Jones C. Mena A. et al . (2018). Textural characteristics and facies of sand-rich contourite depositional systems. Sedimentology65, 2223–2252.
10
Chen H. Stow D. A. V. Xie X. Ren J. Mao K. Gao Y. et al . (2021). Depositional architecture and evolution of basin-floor fan systems since the Late Miocene in the Northwest Sub-Basin, South China Sea. Mar. Petroleum Geology126, 104803. doi: 10.1016/j.marpetgeo.2020.104803
11
Chen F. Su X. Lu H. Zhou Y. Zhuang C. (2013). Relations between Biogenic Component (Foraminifera) and Highly Saturated Gas Hydrates Distribution from Shenhu Area, Northern South China Sea. Earth Sci.38, 907–915.
12
Chen H.-F. Yeh P.-Y. Song S.-R. Hsu S.-C. Yang T.-N. Wang Y. et al . (2013). The Ti/Al molar ratio as a new proxy for tracing sediment transportation processes and its application in aeolian events and sea level change in East Asia. J. Asian Earth Sci.73, 31–38. doi: 10.1016/j.jseaes.2013.04.017
13
Chen H. Xie X. Van Rooij D. Vandorpe T. Su M. Wang D. (2014). Depositional characteristics and processes of alongslope currents related to a seamount on the northwestern margin of the Northwest Sub-Basin, South China Sea. Marine Geology355, 36–53. doi: 10.1016/j.margeo.2014.05.008
14
Chun J.-H. Bahk J.-J. Um I.-K. (2022). “Ulleung basin gas hydrate drilling expeditions, Korea: lithologic characteristics of gas hydrate-bearing sediments,” in World Atlas of Submarine Gas Hydrates in Continental Margins. Eds. MienertJ.BerndtC.TréhuA. M.CamerlenghiA.LiuC.-S. (Cham: Springer International Publishing), 155–161. doi: 10.1007/978-3-030-81186-0_12
15
Collett T. S. (2002). Energy resource potential of natural gas hydrates. AAPG Bull.86, 1971–1992. doi: 10.1306/61EEDDD2-173E-11D7-8645000102C1865D
16
Colwell F. Matsumoto R. Reed D. (2004). A review of the gas hydrates, geology, and biology of the Nankai Trough. Chem. Geology205, 391–404.
17
Dickens G. R. (2003). A methane trigger for rapid warming? Science299, 1017–1017. doi: 10.1126/science.1080789
18
Dyonisius M. N. Petrenko V. V. Smith A. M. Hua Q. Yang B. Schmitt J. et al . (2020). Old carbon reservoirs were not important in the deglacial methane budget. Science367, 907–910. doi: 10.1126/science.aax0504
19
Folk R. L. Ward W. C. (1957). Brazos River bar [Texas]; a study in the significance of grain size parameters. J. Sediment. Res.27, 3–26. doi: 10.1306/74D70646-2B21-11D7-8648000102C1865D
20
Gong C. Wang Y. Zhu W. Li W. Xu Q. . (2013). Upper Miocene to Quaternary unidirectionally migrating deep-water channels in the Pearl River Mouth Basin, northern South China Sea. Aapg Bulletin972, 285–308. doi: 10.1306/07121211159
21
Green N. L. (2006). Influence of slab thermal structure on basalt source regions and melting conditions: REE and HFSE constraints from the Garibaldi volcanic belt, northern Cascadia subduction system. Lithos87, 23–49.
22
Hillier S. (1999). Quantitative analysis of clay and other minerals in sandstones by X-ray powder diffraction (XRPD). Clay mineral cements sandstones, 213–251.
23
Hu Z. Huang B.-Q. Liu L.-J. Wang N. (2021). Spatiotemporal patterns of sediment deposition on the northern slope of the South China Sea in the last 150,000 years. J. Palaeogeogr.10, 21. doi: 10.1186/s42501-021-00102-3
24
Heeschen K. U. Schicks J. M. Oeltzschner G. (2016). The promoting effect of natural sand on methane hydrate formation: Grain sizes and mineral composition. Fuel. 181, 139–147. doi: 10.1016/j.fuel.2016.04.017
25
Hustoft S. Bünz S. Mienert J. Chand S. (2009). Gas hydrate reservoir and active methane-venting province in sediments on<20 Ma young oceanic crust in the Fram Strait, offshore NW-Svalbard. Earth Planet. Sci. Lett.284, 12–24. doi: 10.1016/j.epsl.2009.03.038
26
Ito T. Komatsu Y. Fujii T. Suzuki K. Egawa K. Nakatsuka Y. et al . (2015). Lithological features of hydrate-bearing sediments and their relationship with gas hydrate saturation in the eastern Nankai Trough, Japan. Mar. Petroleum Geol.66, 368–378. doi: 10.1016/j.marpetgeo.2015.02.022
27
Ito T. Komatsu Y. Fujii T. Suzuki K. Egawa K. Nakatsuka Y. et al . (2018). Lithological features of hydrate-bearing sediments and their relationship with gas hydrate saturation in the eastern Nankai Trough, Japan (vol 66, pg 368, 2015). Mar. Petroleum Geol.91, 661–661. doi: 10.1016/j.marpetgeo.2018.02.023
28
Ji L. Zhang T. Milliken K. L. Qu J. Zhang X. (2012). Experimental investigation of main controls to methane adsorption in clay-rich rocks. Appl. Geochemistry27, 2533–2545. doi: 10.1016/j.apgeochem.2012.08.027
29
Jin J. Wang X. Guo Y. Li J. Li Y. Zhang X. et al . (2020). Geological controls on the occurrence of recently formed highly concentrated gas hydrate accumulations in the Shenhu area, South China Sea. Mar. Petroleum Geol.116, 104294. doi: 10.1016/j.marpetgeo.2020.104294
30
Kimura S. Ito T. Noda S. Kaneko H. Suzuki K. Yasuda H. et al . (2019). Water permeability evolution with faulting for unconsolidated turbidite sand in a gas-hydrate reservoir in the eastern Nankai trough area of Japan. J. Geophys. Rese. Solid Earth124, 13415–13426. doi: 10.1029/2019jb018102
31
Kuang Z. G. Ren J. F. Deng W. Lai H. F. Xie Y. F. (2025). Drilling discoveries and accumulation characteristics of gas hydrate in the Northern Slope of South China Sea. Earth Sci. Front.32, 001–019. doi: 10.13745/j.esf.sf.2024.6.56
32
Kubota Y. Kimoto K. Tada R. Oda H. Yokoyama Y. Matsuzaki H. (2010). Variations of East Asian summer monsoon since the last deglaciation based on Mg/Ca and oxygen isotope of planktic foraminifera in the northern East China Sea. Paleoceanography25. doi: 10.1029/2009PA001891
33
Kvenvolden K. A. (1993). Gas hydrates - geological perspective and global change. Rev. Geophys.31, 173–187. doi: 10.1029/93rg00268
34
Lan J. Zhang N. Wang Y. (2013). On the dynamics of the South China Sea deep circulation. J. Geophys. Res.: Oceans118, 1206–1210. doi: 10.1002/jgrc.20104
35
Lei L. Hu G. (2023). Marine gas hydrate: geological characterization, resource potential, exploration, and development. J. Mar. Sci. Eng.11 (2), 322. doi: 10.3390/jmse11020322
36
Lei L. Santamarina J. C. (2018). Laboratory strategies for hydrate formation in fine-grained sediments. J. Geophys. Rese. Solid Earth123, 2583–2596. doi: 10.1002/2017jb014624
37
Li L. Bai S. Li J. Wang S. Tang L. Dasgupta S. et al . (2020). Volcanic ash inputs enhance the deep-sea seabed metal-biogeochemical cycle: A case study in the Yap Trench, western Pacific Ocean. Mar. Geology430, 106340. doi: 10.1016/j.margeo.2020.106340
38
Li J. Lu J. A. Kang D. J. Ning F. L. Lu H. F. Kuang Z. G. et al . (2019). Lithological characteristics and hydrocarbon gas sources of gas hydrate-bearing sediments in the Shenhu area, South China Sea: Implications from the W01B and W02B sites. Mar. Geol.408, 36–47. doi: 10.1016/j.margeo.2018.10.013
39
Li J.-F. Ye J.-L. Qin X.-W. Qiu H.-J. Wu N.-Y. Lu H.-L. et al . (2018). The first offshore natural gas hydrate production test in South China Sea. China Geol.1, 5–16. doi: 10.31035/cg2018003
40
Lin Z. Su M. Zhuo H. Su P. Liang J. Wang F. et al . (2023). Deposition processes of gas hydrate-bearing sediments in the inter-canyon area of Shenhu Area in the northern South China Sea. J. Oceanol. Limnol.41, 740–756. doi: 10.1007/s00343-022-2084-3
41
Liu S. Chen H. Su M. Luo K. Wu J. Gao Y. et al . (2024). South China Sea records Late Miocene reorganization of western Pacific deep circulation. Nat. Commun.15, Article 10228. doi: 10.1038/s41467-024-54739-4
42
Liu Z. Colin C. Li X. Zhao Y. Tuo S. Chen Z. et al . (2010). Clay mineral distribution in surface sediments of the northeastern South China Sea and surrounding fluvial drainage basins: Source and transport. Mar. Geology277, 48–60.
43
Liu Z. Zhao Y. Colin C. Stattegger K. Wiesner M. G. Huh C.-A. et al . (2016). Source-to-sink transport processes of fluvial sediments in the South China Sea. Earth Sci. Rev.153, 238–273. doi: 10.1016/j.earscirev.2015.08.005
44
Luan X. W. Zhang L. Peng X. C. (2012). Dongsha erosive channel on northern South China Sea Shelf and its induced Kuroshio South China Sea Branch. Sci. China Earth Sci.55, 149–158. doi: 10.1007/s11430-011-4322-y
45
McManus J. (1988). Grain size determination and interpretation. Techniques. sedimentology, 63–85.
46
Moore D. M. Reynolds R. Jr. (1989). X-ray Diffraction and the Identification and Analysis of Clay Minerals.
47
Murray R. Leinen M. (1996). Scavenged excess aluminum and its relationship to bulk titanium in biogenic sediment from the central equatorial Pacific Ocean. Geochimica Et Cosmochimica Acta60, 3869–3878.
48
Nan F. Xue H. J. Yu F. (2015). Kuroshio intrusion into the South China Sea: A review. Prog. Oceanogr.137, 314–333. doi: 10.1016/j.pocean.2014.05.012
49
Noguchi S. Shimoda N. Takano O. Oikawa N. Inamori T. Saeki T. et al . (2011). 3-D internal architecture of methane hydrate-bearing turbidite channels in the eastern Nankai Trough, Japan. Mar. Petroleum Geol.28, 1817–1828. doi: 10.1016/j.marpetgeo.2011.02.004
50
Ordonez C. Ruiz-Barzola O. Sierra C. (2016). Sediment particle size distributions apportionment by means of functional cluster analysis (FCA). Catena137, 31–36. doi: 10.1016/j.catena.2015.09.006
51
Passega R. (1964). Grain size representation by CM patterns as a geologic tool. J. sedimentary Res.34, 830–847.
52
Pohlman J. W. Kaneko M. Heuer V. B. Coffin R. B. Whiticar M. (2009). Methane sources and production in the northern Cascadia margin gas hydrate system. Earth Planet. Sci. Lett.287, 504–512. doi: 10.1016/j.epsl.2009.08.037
53
Qiao S. Su M. Kuang Z. Yang R. Liang J. Wu N. (2015). Canyon-related undulation structures in the Shenhu area, northern South China Sea. Mar. Geophys. Res.36, 243–252. doi: 10.1007/s11001-015-9252-1
54
Qiu Y. Li L. Chen C. T. A. Guo X. G. Jing C. S. (2011). Currents in the Taiwan Strait as observed by surface drifters. J. Oceanogr.67, 395–404. doi: 10.1007/s10872-011-0033-4
55
Rebesco M. Hernández-Molina F. J. Van Rooij D. Wåhlin A. (2014). Contourites and associated sediments controlled by deep-water circulation processes: State-of-the-art and future considerations. Marine Geology. 352, 111–154. doi: 10.1016/j.margeo.2014.03.011
56
Ren X. Guo Z. Ning F. Ma S. (2020). Permeability of hydrate-bearing sediments. Earth Sci. Rev.202, Article 103100. doi: 10.1016/j.earscirev.2020.103100
57
Riedel M. Bahk J. J. Scholz N. A. Ryu B. J. Yoo D. G. Kim W. et al . (2012). Mass-transport deposits and gas hydrate occurrences in the Ulleung Basin, East Sea – Part 2: Gas hydrate content and fracture-induced anisotropy. Mar. Petroleum Geol.35, 75–90. doi: 10.1016/j.marpetgeo.2012.03.005
58
Ruppel C. D. Kessler J. D. (2017). The interaction of climate change and methane hydrates. Rev. Geophys.55, 126–168. doi: 10.1002/2016rg000534
59
Sakharov B. A. Lindgreen H. Salyn A. Drits V. A. (1999). Determination of Illite-Smectite Structures using Multispecimen X-Ray Diffraction Profile Fitting. Clays Clay Minerals47, 555–566. doi: 10.1346/CCMN.1999.0470502
60
Scheffler K. Buehmann D. Schwark L. (2006). Analysis of late Palaeozoic glacial to postglacial sedimentary successions in South Africa by geochemical proxies – Response to climate evolution and sedimentary environment. Palaeogeography Palaeoclimatology Palaeoecol.240, 184–203. doi: 10.1016/j.palaeo.2006.03.059
61
Shao L. Li X. Geng J. Pang X. Lei Y. Qiao P. et al . (2007). Deep water bottom current deposition in the northern South China Sea. Sci. China Ser. D: Earth Sci.50, 1060–1066. doi: 10.1007/s11430-007-0015-y
62
Shaw P.-T. Chao S.-Y. (1994). Surface circulation in the South China Sea. Deep Sea Res. Part I: Oceanogr. Res. Papers41, 1663–1683. doi: 10.1016/0967-0637(94)90067-1
63
Smith G. A. Fritz W. J. (1989). Volcanic influences on terrestrial sedimentation. Geology17, 375–376. doi: 10.1130/0091-7613(1989)017<0375:VIOTS>2.3.CO;2
64
Song Y. Lei Y. Zhang L. Cheng M. Li C. Liu N. (2022). Spatial-temporal evolution of the gas hydrate stability zone and accumulation patterns of double BSRs formation in the shenhu area. Front. Earth Sci.10, 880933. doi: 10.3389/feart.2022.880933
65
Steinke S. Chiu H.-Y. Yu P.-S. Shen C.-C. Erlenkeuser H. Löwemark L. et al . (2006). On the influence of sea level and monsoon climate on the southern South China Sea freshwater budget over the last 22,000 years. Quaternary Sci. Rev.25, 1475–1488.
66
Steinke S. Hanebuth T. J. Vogt C. Stattegger K. (2008). Sea level induced variations in clay mineral composition in the southwestern South China Sea over the past 17,000 yr. Mar. Geology250, 199–210.
67
Stow D. Smillie Z. (2020). Distinguishing between Deep-Water Sediment Facies: Turbidites, Contourites and Hemipelagites. Geosciences10, 68. Available at: https://www.mdpi.com/2076-3263/10/2/68.
68
Stow D. Faugères J.-C. (2008). Contourite facies and the facies model. Dev. Sedimentol.60, 223–256. doi: 10.1016/S0070-4571(08)10013-9
69
Su M. Luo K. Fang Y. Kuang Z. Yang C. Liang J. et al . (2021). Grain-size characteristics of fine-grained sediments and association with gas hydrate saturation in Shenhu Area, northern South China Sea. Ore Geol. Rev.129, Article 103889. doi: 10.1016/j.oregeorev.2020.103889
70
Torres M. E. Tréhu A. M. Cespedes N. Kastner M. Wortmann U. G. Kim J. H. et al . (2008). Methane hydrate formation in turbidite sediments of northern Cascadia, IODP Expedition 311. Earth Planet. Sci. Lett.271, 170–180. doi: 10.1016/j.epsl.2008.03.061
71
Tyrrell T. (1999). The relative influences of nitrogen and phosphorus on oceanic primary production. Nature400, 525–531.
72
van der Zwaan G. J. Jorissen F. J. de Stigter H. C. (1990). The depth dependency of planktonic/benthic foraminiferal ratios: Constraints and applications. Mar. Geology95, 1–16. doi: 10.1016/0025-3227(90)90016-D
73
Venaruzzo J. L. Volzone C. Rueda M. L. Ortiga J. (2002). Modified bentonitic clay minerals as adsorbents of CO, CO2 and SO2 gases. Microporous Mesoporous Materials56, 73–80.
74
Wang X. Kneller B. Sun Q. (2023). Sediment waves control origins of submarine canyons. Geology51, 310–314. doi: 10.1130/g50642.1
75
Wang L. (2000). Isotopic signals in two morphotypes of Globigerinoides ruber (white) from the South China Sea: implications for monsoon climate change during the last glacial cycle. Palaeogeogr. Palaeoclimatol. Palaeoecol.161, 381–394. doi: 10.1016/S0031-0182(00)00094-8
76
Wang B. Lei H. Huang F. Kong Y. Pan F. Cheng W. et al . (2020). Effect of Sea-Level Change on Deep-Sea Sedimentary Records in the Northeastern South China Sea over the past 42 kyr. Geofluids2020, 8814545. doi: 10.1155/2020/8814545
77
Wei W. Algeo T. J. (2020). Elemental proxies for paleosalinity analysis of ancient shales and mudrocks. Geochimica Et Cosmochimica Acta287, 341–366.
78
Wentworth C. K. (1929). Method of computing mechanical composition types in sediments. Bull. Geol. Soc. America40, 771–790. doi: 10.1130/GSAB-40-771
79
Xu F. Hu B. Dou Y. Liu X. Wan S. Xu Z. et al . (2017). Sediment provenance and paleoenvironmental changes in the northwestern shelf mud area of the South China Sea since the mid-Holocene. Continent. Shelf Res.144, 21–30. doi: 10.1016/j.csr.2017.06.013
80
Yang W. Wang T. Wang J. Xie W. Liu B. Ning B. et al . (2024). Gas hydrate accumulation mechanism of the clayey silt reservoir in the Shenhu area, South China Sea. Energy Fuels38, 16258–16271. doi: 10.1021/acs.energyfuels.4c02187
81
Ye J.-L. Qin X.-W. Xie W.-W. Lu H.-L. Ma B.-J. Qiu H.-J. et al . (2020). The second natural gas hydrate production test in the South China Sea. China Geol.3, 197–209. doi: 10.31035/cg2020043
82
Yu X. Stow D. Smillie Z. Esentia I. Brackenridge R. Xie X. et al . (2020). Contourite porosity, grain size and reservoir characteristics. Mar. Petroleum Geol.117, 104392. doi: 10.1016/j.marpetgeo.2020.104392
83
Yu Y. An Y. Chen R. Rao S. Tang D. Deng Y. et al . (2024). Effects of crystal facets of quartz on the formation and dissociation of natural gas hydrates. Surfaces Interfaces55, 105369.
84
Zhang W. Liang J. Lu J. a. Wei J. Su P. Fang Y. et al . (2017). Accumulation features and mechanisms of high saturation natural gas hydrate in Shenhu Area, northern South China Sea. Petroleum Explor. Dev.44, 708–719. doi: 10.1016/S1876-3804(17)30082-4
85
Zhang W. Liang J. Wei J. Su P. Lin L. Huang W. (2019). Origin of natural gases and associated gas hydrates in the Shenhu area, northern South China Sea: Results from the China gas hydrate drilling expeditions. J. Asian Earth Sci.183, 103953. doi: 10.1016/j.jseaes.2019.103953
86
Zhang Z. Liu L. Ning F. Liu Z. Sun J. Li X. et al . (2022). Effect of stress on permeability of clay silty cores recovered from the Shenhu hydrate area of the South China Sea. J. Natural Gas Sci. Eng.99, 104421. doi: 10.1016/j.jngse.2022.104421
87
Zhang W. Liang J. Wan Z. Su P. Huang W. Wang L. et al . (2020). Dynamic accumulation of gas hydrates associated with the channel-levee system in the Shenhu area, northern South China Sea. Mar. Petroleum Geology117, 104354. doi: 10.1016/j.marpetgeo.2020.104354
88
Zhang B. Zhou L. Liu C. Zhang Q. Wu Q. Wu Q. et al . (2018). Influence of sediment media with different particle sizes on the nucleation of gas hydrate5, 6, 652–659.
89
Zhou Q. Li X. Liu L. Wang J. Zhang L. Liu B. (2023). Classification of marine sediment in the northern slope of the South China Sea based on improved U-Net and K-means clustering analysis. Remote Sens.15, 3576.
90
Zhou K. Sun J. Yang M. Zhang S. Wang W. Gao R. et al . (2023). Geochemical Characteristics of the Middle Jurassic Coal-Bearing Mudstones in the Dameigou Area (Qaidam Basin, NW China): Implications for Paleoclimate, Paleoenvironment, and Organic Matter Accumulation. ACS Omega8, 47540–47559. doi: 10.1021/acsomega.3c05433
Summary
Keywords
gas hydrates, sedimentary processes, sediment provenance, paleoenvironment, South China Sea
Citation
Chen W, Bai C, Xu H and Xu X (2025) Sedimentary processes controlling gas hydrate accumulation in the Shenhu area of the northern South China Sea. Front. Mar. Sci. 12:1637686. doi: 10.3389/fmars.2025.1637686
Received
29 May 2025
Accepted
21 July 2025
Published
14 August 2025
Volume
12 - 2025
Edited by
Wei Zhang, Guangzhou Marine Geological Survey, China
Reviewed by
Jiliang Wang, Chinese Academy of Sciences (CAS), China
Jinxiu Yang, China University of Petroleum (East China), China
Jinan Guan, Chinese Academy of Sciences (CAS), China
Jiapeng Jin, Qingdao National Laboratory for Marine Science and Technology, China
Updates
Copyright
© 2025 Chen, Bai, Xu and Xu.
This is an open-access article distributed under the terms of the Creative Commons Attribution License (CC BY). The use, distribution or reproduction in other forums is permitted, provided the original author(s) and the copyright owner(s) are credited and that the original publication in this journal is cited, in accordance with accepted academic practice. No use, distribution or reproduction is permitted which does not comply with these terms.
*Correspondence: Chenyang Bai, baicy@cugb.edu.cn
Disclaimer
All claims expressed in this article are solely those of the authors and do not necessarily represent those of their affiliated organizations, or those of the publisher, the editors and the reviewers. Any product that may be evaluated in this article or claim that may be made by its manufacturer is not guaranteed or endorsed by the publisher.