- 1Institute of Marine Environment and Ecology, National Taiwan Ocean University, Keelung, Taiwan
- 2Doctoral Degree Program in Ocean Resource and Environmental Changes, National Taiwan Ocean University, Keelung, Taiwan
- 3Center of Excellence for the Oceans, National Taiwan Ocean University, Keelung, Taiwan
- 4Department of Life Science, National Taiwan Normal University, Taipei, Taiwan
- 5College of Marine Sciences, National Dong Hwa University, Hualien, Taiwan
- 6Institute of Oceanography, National Taiwan University, Taipei, Taiwan
Mesoscale eddies are recognized as an important driver of environmental and microbial dynamics in the Pacific Ocean. However, their specific impact on microbial community vertical distribution remains underexplored. In contrast with the surrounding waters, a cyclonic cold eddy can provide nutrients to the photic zone, increasing primary production and altering microbial communities. A field investigation was conducted in the West Pacific Ocean during cyclonic cold eddy propagation to determine the impact of cold eddies on bacteria and picophytoplankton. Within the cold eddy region, dissolved inorganic nitrate concentrations were higher than those in adjacent water at 100-m depth. Flow cytometric analyses were used to estimate the abundances of picoplankton populations (heterotrophic bacteria and picophytoplankton) in seawater samples collected from the surface to 1,000 m. In this study, Prochlorococcus was the dominant component of abundance at depths above 100 m (62% to 95%). Interestingly, when compared to outside of eddy stations, cyclonic eddy-affected regions had the lowest maximum value of Synechococcus and Prochlorococcus. In contrast to Synechococcus and Prochlorococcus, the distribution pattern of picoeukaryotes abundance showed maxima values (>0.4 × 10³ cells mL−1) at 100–200-m depth within cyclonic eddy-affected regions. Overall, the abundance of bacteria was approximately 2 × 10⁵ cells mL−1 at the surface and increased to >4 × 10⁵ cells mL−1 at 200-m depth at stations outside the eddy. However, peaks in bacterial abundance were observed at 50-m depth, and abundance decreased with increasing depth in the cyclonic eddy-affected regions. In the oligotrophic open ocean, our findings contribute to a better understanding of the biological response of mesoscale eddies.
1 Introduction
There is no doubt that mesoscale eddies are prevalent nearly everywhere in the world’s oceans (Chelton et al., 2011; Chelton et al., 2007). Biogeochemical variables and processes are strongly influenced by mesoscale eddies (McGillicuddy et al., 1999; Patel et al., 2020). There is generally an increase in primary production in cyclonic cold eddies and a decrease in primary production in anticyclonic warm eddies (He et al., 2019; Xiu and Chai, 2011). Cyclonic eddies are characterized by enhanced nutrients, which is a key mechanism for transporting nutrients into the euphotic zone (Klein and Lapeyre, 2009). According to some previous studies, cyclonic cold eddies play a significant role in altering the vertical flux of nutrients by shifting pycnoclines (Mahaffey et al., 2008), and approximately 20%–40% of marine ecosystem nutrients are provided by cyclonic cold eddies (McGillicuddy et al., 2003). As a result, during the formation of cyclonic eddy systems, chlorophyll a (chl a) concentrations increase (Retnamma et al., 2015) along with new production (Levy et al., 2018; McGillicuddy et al., 2007). This process also impacts the composition and activity of different microbial communities, particularly phytoplankton communities (Baltar et al., 2010; Bibby et al., 2008; Paterson et al., 2013; Rii et al., 2008; Rodríguez et al., 2003).
In marine ecosystems, picoplankton populations are microbial components of plankton communities that include picophytoplankton and heterotrophic bacteria (HB). They are also crucial to the biogeochemistry and dynamics of the marine food web (Azam and Malfatti, 2007). Picophytoplankton communities [Synechococcus spp. (SYNE), Prochlorococcus spp. (PRO), and picoeukaryotes (PE)] contribute substantially to the total phytoplankton biomass in marine ecosystems, usually contributing 50%–90% of the total chl a in oligotrophic waters (Agawin et al., 2000). Much attention has recently been paid to the impact of mesoscale eddies on phytoplankton communities (McGillicuddy, 2016; McGillicuddy et al., 2007). It has been shown that cold eddies during the developmental phase frequently showed higher chl a, a higher proportion of PRO, and a decrease in SYNE (McGillicuddy et al., 2007) as a result of eddy-driven upwelling, which may provide significant amounts of nutrients to support primary productivity in the subtropical oceans. Additionally, picophytoplankton maintained its dominance regardless of cold or warm eddies in tropical and subtropical open waters, where PRO was responsible for up to 82% of phytoplankton primary productivity (Casey et al., 2007). In addition to picoplankton, HB is a major consumer of dissolved organic matter (DOM) and plays a significant role in both nutrient and carbon cycling (Ducklow, 1999). Although the primary productivity and chl a within these mesoscale features are relatively high, little information is available regarding how HB responds to mesoscale eddies. The HB response caused by eddy-induced upwelling is complex and not fully understood. In some studies, bacterial abundance is higher in cold-core eddies of the NE Atlantic (Harris et al., 1997; Thyssen et al., 2005), while others have found no difference between bacterial biomass inside and outside cyclonic eddies (González-Benítez et al., 2001; Tarran et al., 2001). In addition, there are limited studies on the associated bacterial production (BP) response to eddy-induced phytoplankton blooms. Bode et al. (2001) found higher BP near the Canary Islands in a cold-core eddy area than in the surrounding waters. The present study compares the environmental dynamics across a cold eddy and those of the microbial community. In particular, we examine the vertical distribution patterns of autotrophic (PRO, SYNE, and PE) and heterotrophic (HB) picoplankton populations from the surface to deeper waters (1,000-m depth) across a cold eddy. The study presents a comprehensive picture of biological responses to mesoscale eddies. The paper emphasizes the importance of integrating biological, physical, and chemical factors into explanations of how mesoscale eddies affect oceanic biogeochemistry. Our hypothesis is that the upward advection of deep and relatively cold nutrient-rich water within cyclonic cold eddies results in an increase in PE abundance and HB abundance.
2 Materials and methods
2.1 Sampling
The present investigation was conducted during a research cruise aboard the New Ocean Research I in March and April 2024. In this cruise, a calibrated conductivity–temperature–depth (CTD) profiler (Seabird SBE 911plus CTD) was used to measure the temperature, salinity, and chl a fluorescence profiles at each station (Figure 1). Moreover, the transect (which included six stations from A0 to A5) was the area that covered one cold eddy (CE) and where the biological variables (microbial communities) were determined (Figure 1). Hydrographic measurements were obtained using a Seabird model SBE 911plus CTD system. CTD-mounted rosette samplers with 10-L Niskin bottles were used to collect samples at 12 different depths ranging from surface water to 1,000-m depth.
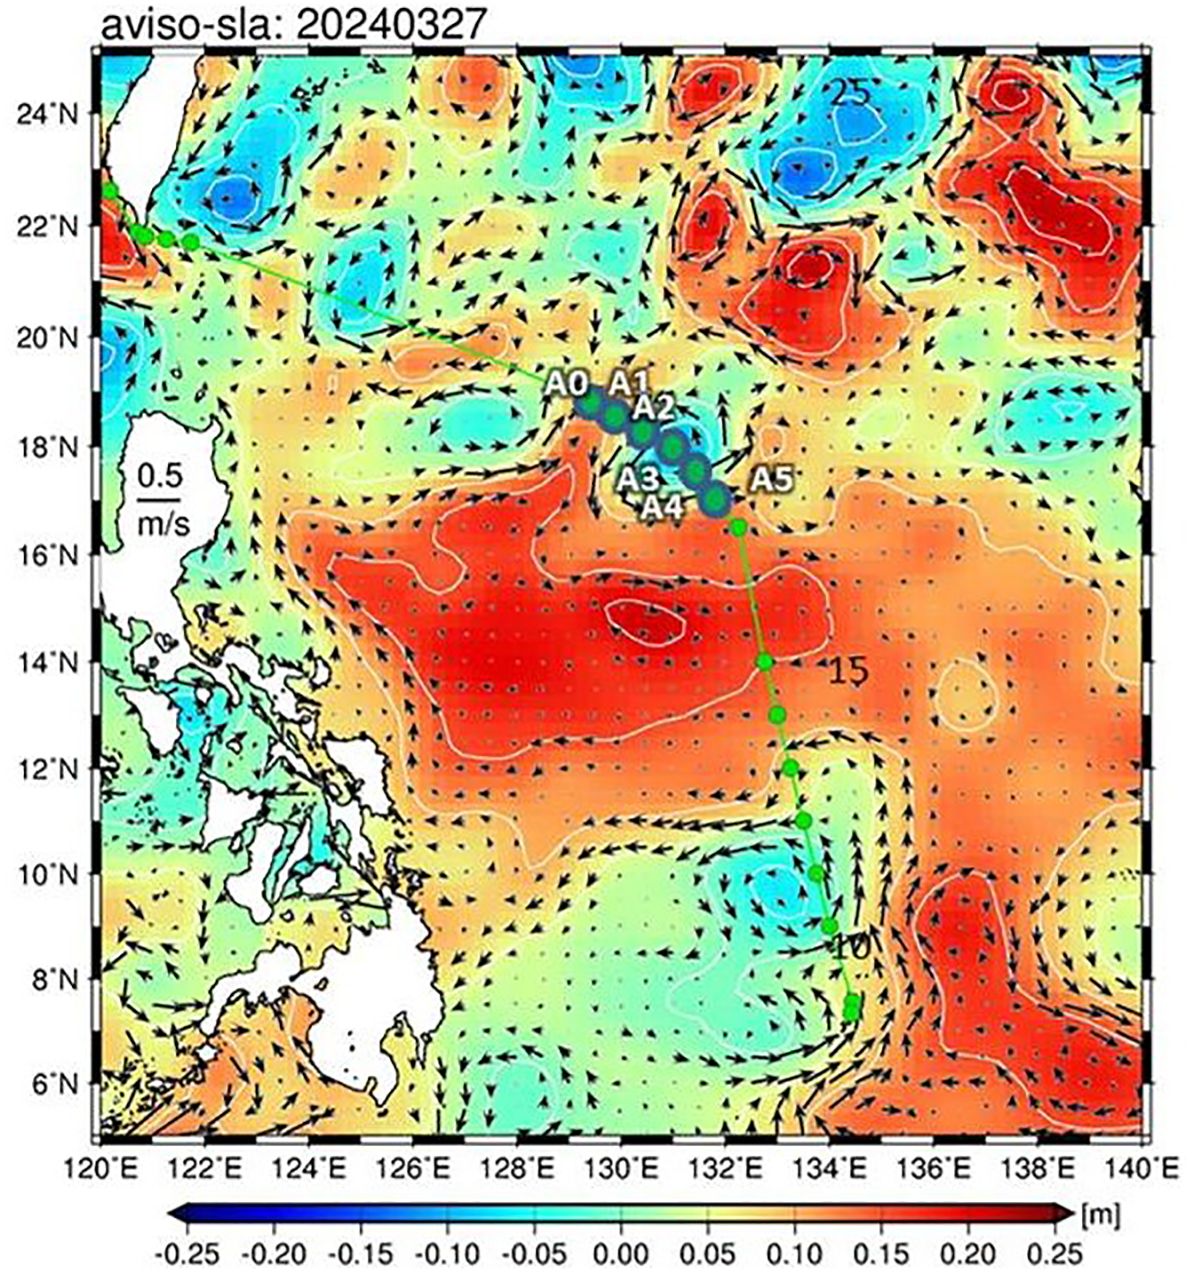
Figure 1. A map of sea level anomaly (m) and sampling stations in the study area. The background is the sea surface height (SSH; m, colored) based on satellite oceanographic sea level anomaly (SLA) data from AVISO (http://www.aviso.altimetry.fr) during the study period. The arrows indicate the sea surface current. The green underlines indicate the six sites (A0–A5) where measurements of the microbial community were conducted during the cruise.
2.2 Analysis of physical, chemical, and biological parameters
A calibrated CTD profiler (Seabird SBE 911plus CTD) was used to measure the temperature, salinity, and chl a fluorescence profiles at each station. Flow cytometry (FCM) and nutrient and chl a concentration measurements were conducted on water column samples collected at each depth. The biochemical variables were measured in three replicated samples to ensure data quality. The nutrients in seawater samples were measured as previously described by Gong et al. (1995). Chl a analysis of water samples was carried out after extraction and filtration (25 mm GF/F) using an in vitro fluorometer (Turner Design 10-AU-005) (Parsons et al., 1984).
2.3 Flow cytometric analyses
To enumerate HB, PRO, SYNE, and PE, seawater samples were collected from each treatment, preserved in paraformaldehyde (0.5% final concentration), and flash-frozen. The samples were analyzed in the laboratory using a Beckman Coulter CytoFLEX S flow cytometer (Indianapolis, IN, USA) equipped with a 488 nm air-cooled argon-ion laser as well as a standard 525-nm filter and a SYBR signal detection system. TE buffer staining with SYBR Green I was used as blank controls to detect and eliminate buffer noise. Fluorescent microspheres (Molecular Probes Inc.) with a diameter of 1 μm were used as an internal standard. As described by Hammes and Egli (2010), HB samples were stained with SYBR Green I (1:10,000 final concentration) for 15 minutes in the dark before being processed using FCM. Picophytoplankton was divided into three groups (SYNE, PRO, and PPE) based on flow cytometric analysis, where red fluorescence is caused by chl a (>650 nm) and orange fluorescence is caused by phycoerythrin (578 nm), and light scatter signals (SSC) are according to Calvo-Díaz and Morán (2006).
Afterward, cell abundance (cells L−1) of picoplankton was then converted to biomass (ngC L−1) using constant conversion factors based on the literature on oligotrophic systems similar to our study region, i.e., 20, 56, and 112 fgC cell−1 for HB, PRO, and SYNE, respectively (DuRand et al., 2001; Lee and Fuhrman, 1987). In addition, a value for the carbon-content-per-cell of PE has been taken from the literature, which is 1,010 fgC cell−1 of PE (Garrison et al., 2000).
3 Results
3.1 Distribution of environmental variables
As presented in Figure 2, there was a clear difference in hydrography across the cold eddy. Both isothermal and isopycnal gradients are clearly raised in the center of the cold eddy to the surface water, which may cause a difference in salinity and temperature between the center and the surrounding water (Figures 2A, B). Based on the vertical distribution of temperature and salinity along the transect, a dome structure was observed at the center of the eddy (Figure 2). At station A3, the temperature ranged from 18.1°C to 26.9°C, and salinity was between 34.73 and 34.83 psu in the upper 200-m depth (Figures 2A, B). Comparing the vertical profiles of environmental parameters at the six stations, the shallow waters of the cold eddy (station A3) displayed lower temperatures and higher salinities (Figure 2).
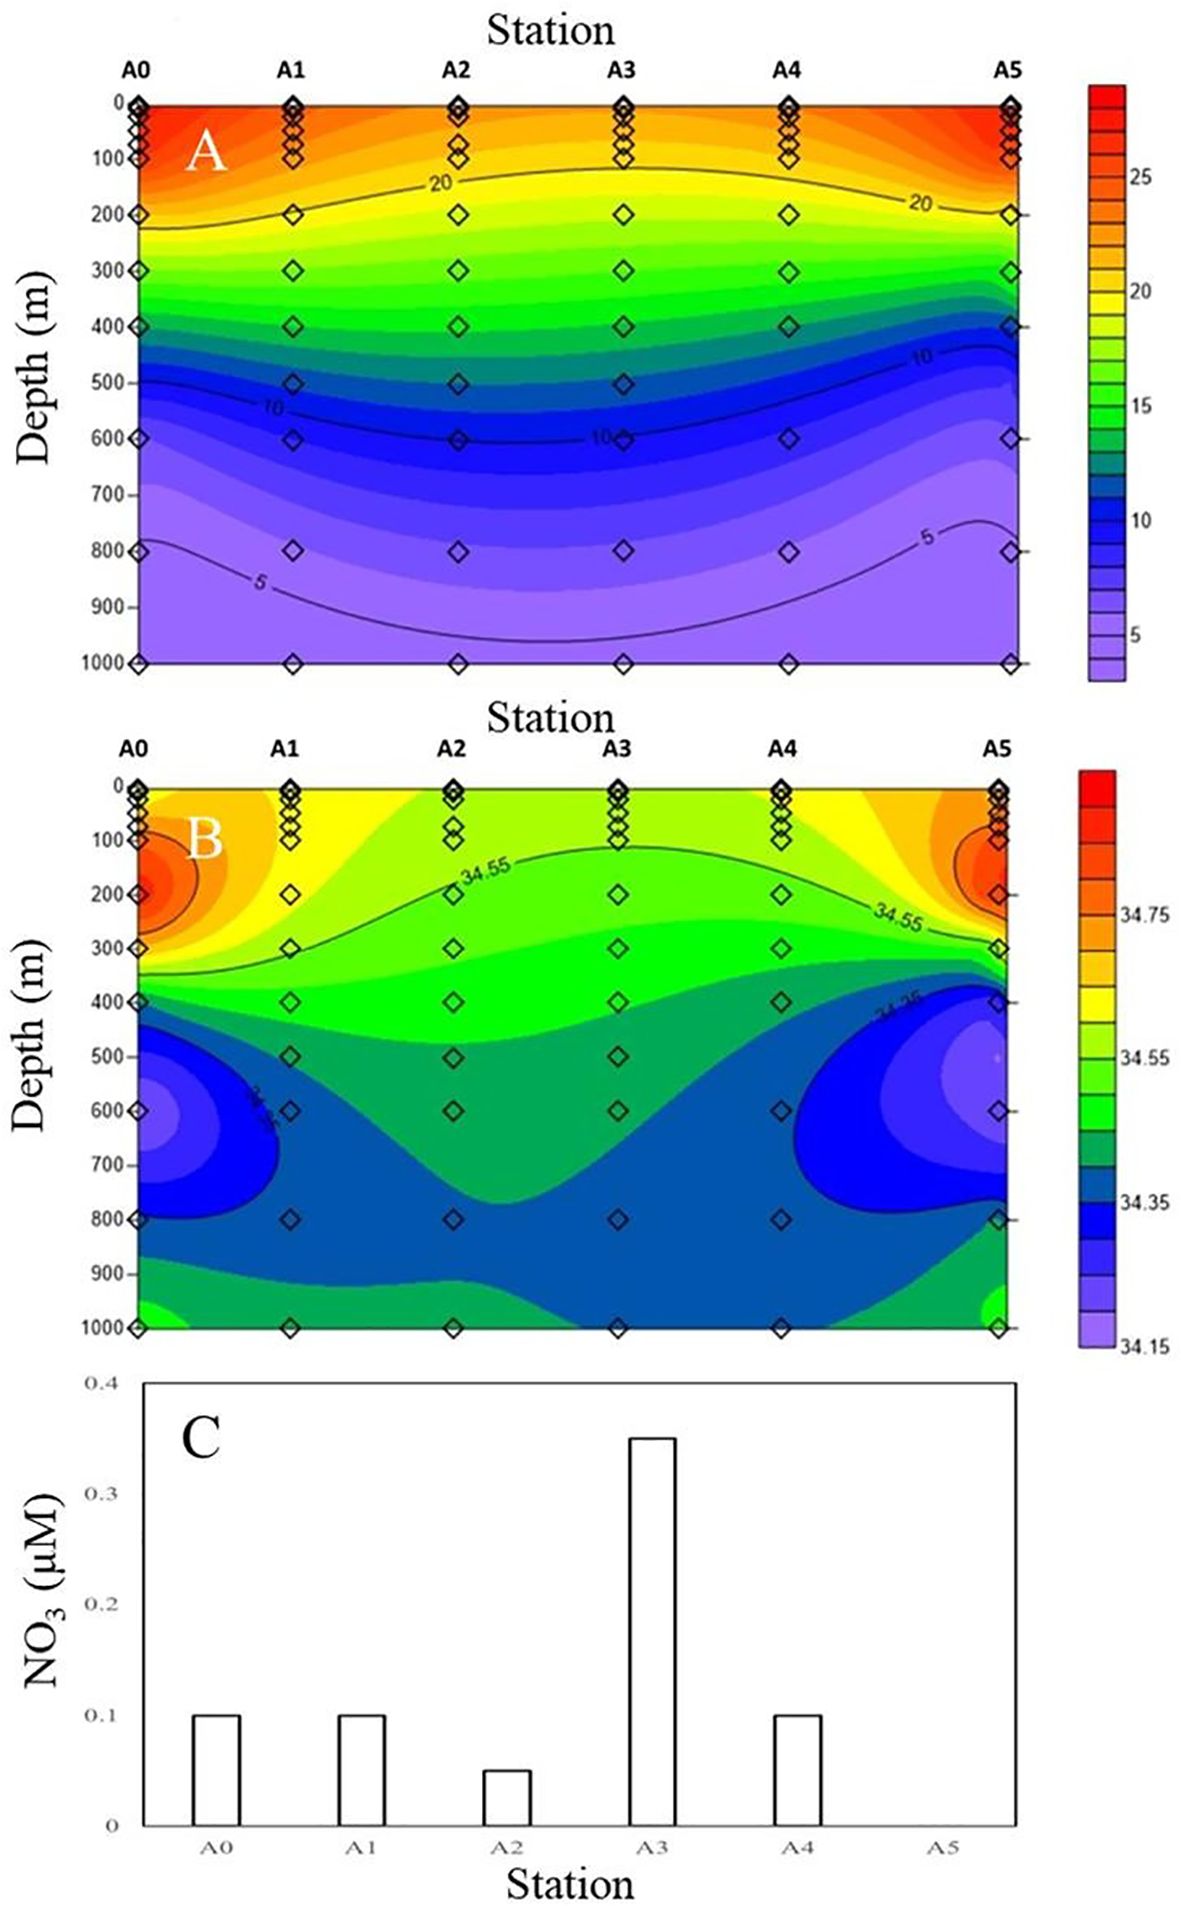
Figure 2. Vertical variations of (A) temperature (°C), (B) salinity (psu), and (C) NO3 concentrations at 100-m depth during the cruise. Stations are indicated at the top of each panel.
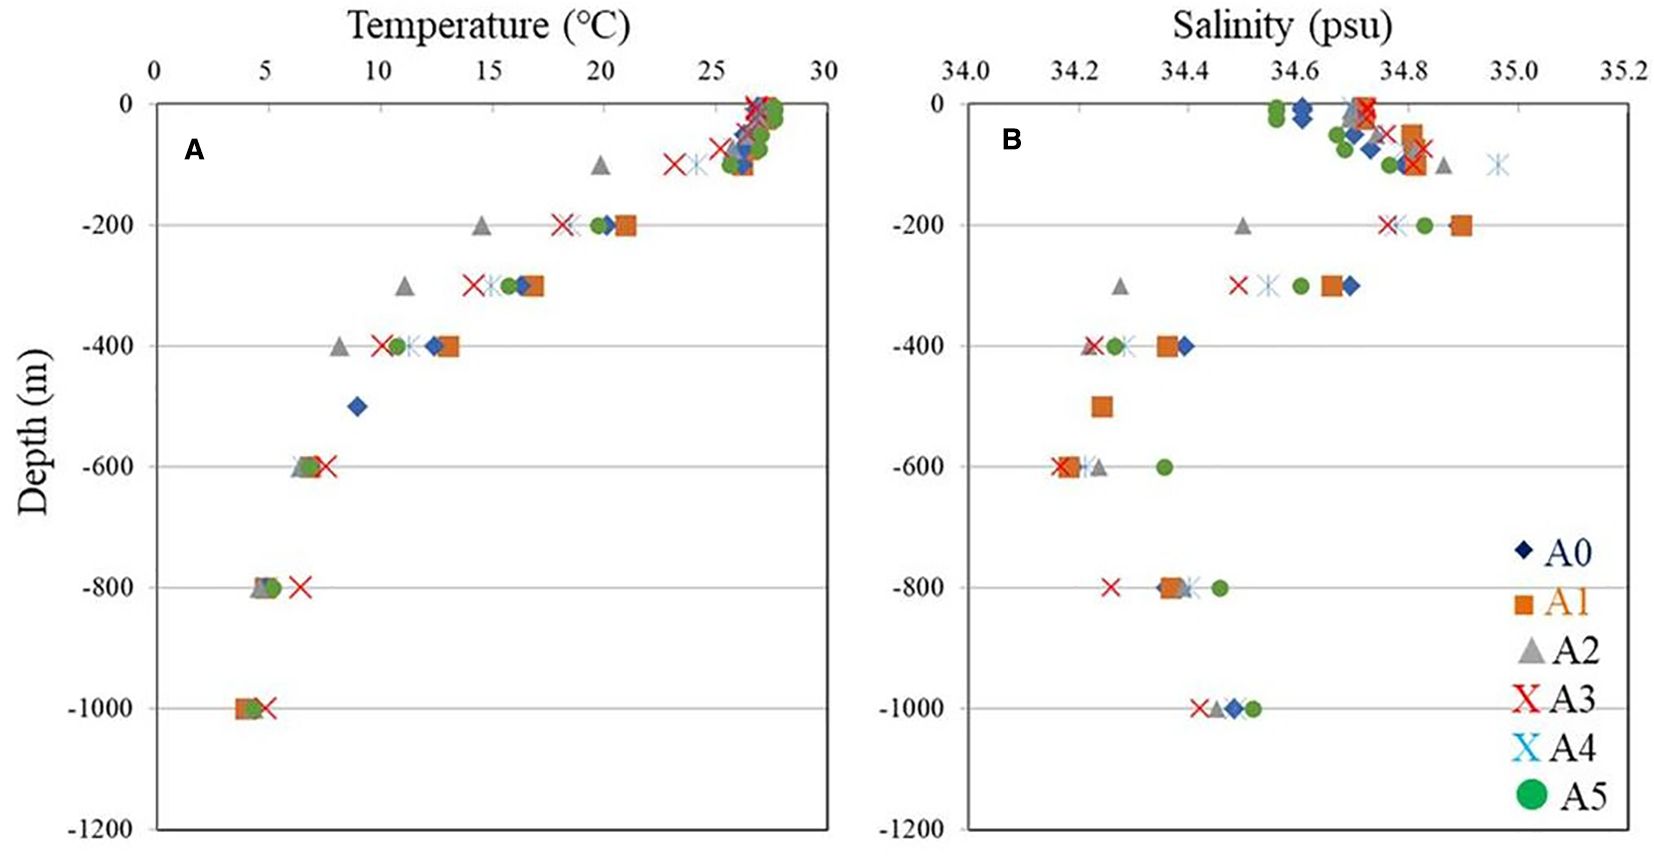
Above 100 m, Figures 3A, B show very similar temperatures and salinities, with warm waters mixed down to 100 m and the thermocline located between 100 and 600 m (Figure 3A). A cold eddy can potentially affect variations in nutrients in the upper 100-m layer. The concentrations of NO3 distribution (Figure 2C) present low values (<0.1 μM) at 100 m at all stations, except in the core of the cyclonic eddy (station A3) (0.35 μM), where the uplifting of cold deep waters brings nutrients to the upper 100 m.
3.2 Vertical distribution of picophytoplankton
A comparison of the vertical distributions of SYNE and PRO is shown in Figure 4 to determine whether the cold eddy impacts picophytoplankton abundance. The abundance of PRO was the highest across the cold eddy, while the abundance of SYNE was generally an order of magnitude lower at depths above 100 m (Figure 4). At all stations, however, SYNE abundance was higher than PRO abundance below 200 to 1,000 m (Figure 3). Overall, the abundances of SYNE and PRO were high within 100-m depth, declining with depth and becoming extremely low at all stations (Figure 3). The maximum abundances of SYNE and PRO were observed in shallow waters (≤100 m) at all sampling stations (Figure 4). Interestingly, when compared to other stations, cyclonic eddy-affected regions (stations A3 and A4) had the lowest maximum values of SYNE and PRO. As can be seen in Figure 5, there were significant differences in the depth at which the maximum abundances of SYNE and PRO were observed in the center and outside of the cold eddy. Additionally, vertical distribution patterns of PE within the euphotic zone were found to be highly influenced by the cold eddy and the variability in hydrographic parameters. In contrast to SYNE and PRO, the distribution pattern of PE abundance showed maxima values (>0.4 × 10³ cells mL−1) at 100–200-m depth within cyclonic eddy-affected regions (stations A2, A3, and A4) (Figure 6) during the study period. The highest values were observed at stations A2, A3, and A4, which were four to seven times higher compared to those at adjacent stations (Figure 6). Among only picophytoplankton populations, PRO accounted for 62% to 95% of the total autotrophic abundance above 100-m depth across the cold eddy (Figure 7). A similar pattern was observed between the percentage of PRO abundance and depth, where the peak value was reached at 100 m and then declined with depth (Figure 7). In particular, stations A2, A3, and A4 at 300–400 m, where the cold eddy influenced the region, also showed a secondary peak and had an S type on the vertical patterns of the percentage of PRO abundance (Figure 7).
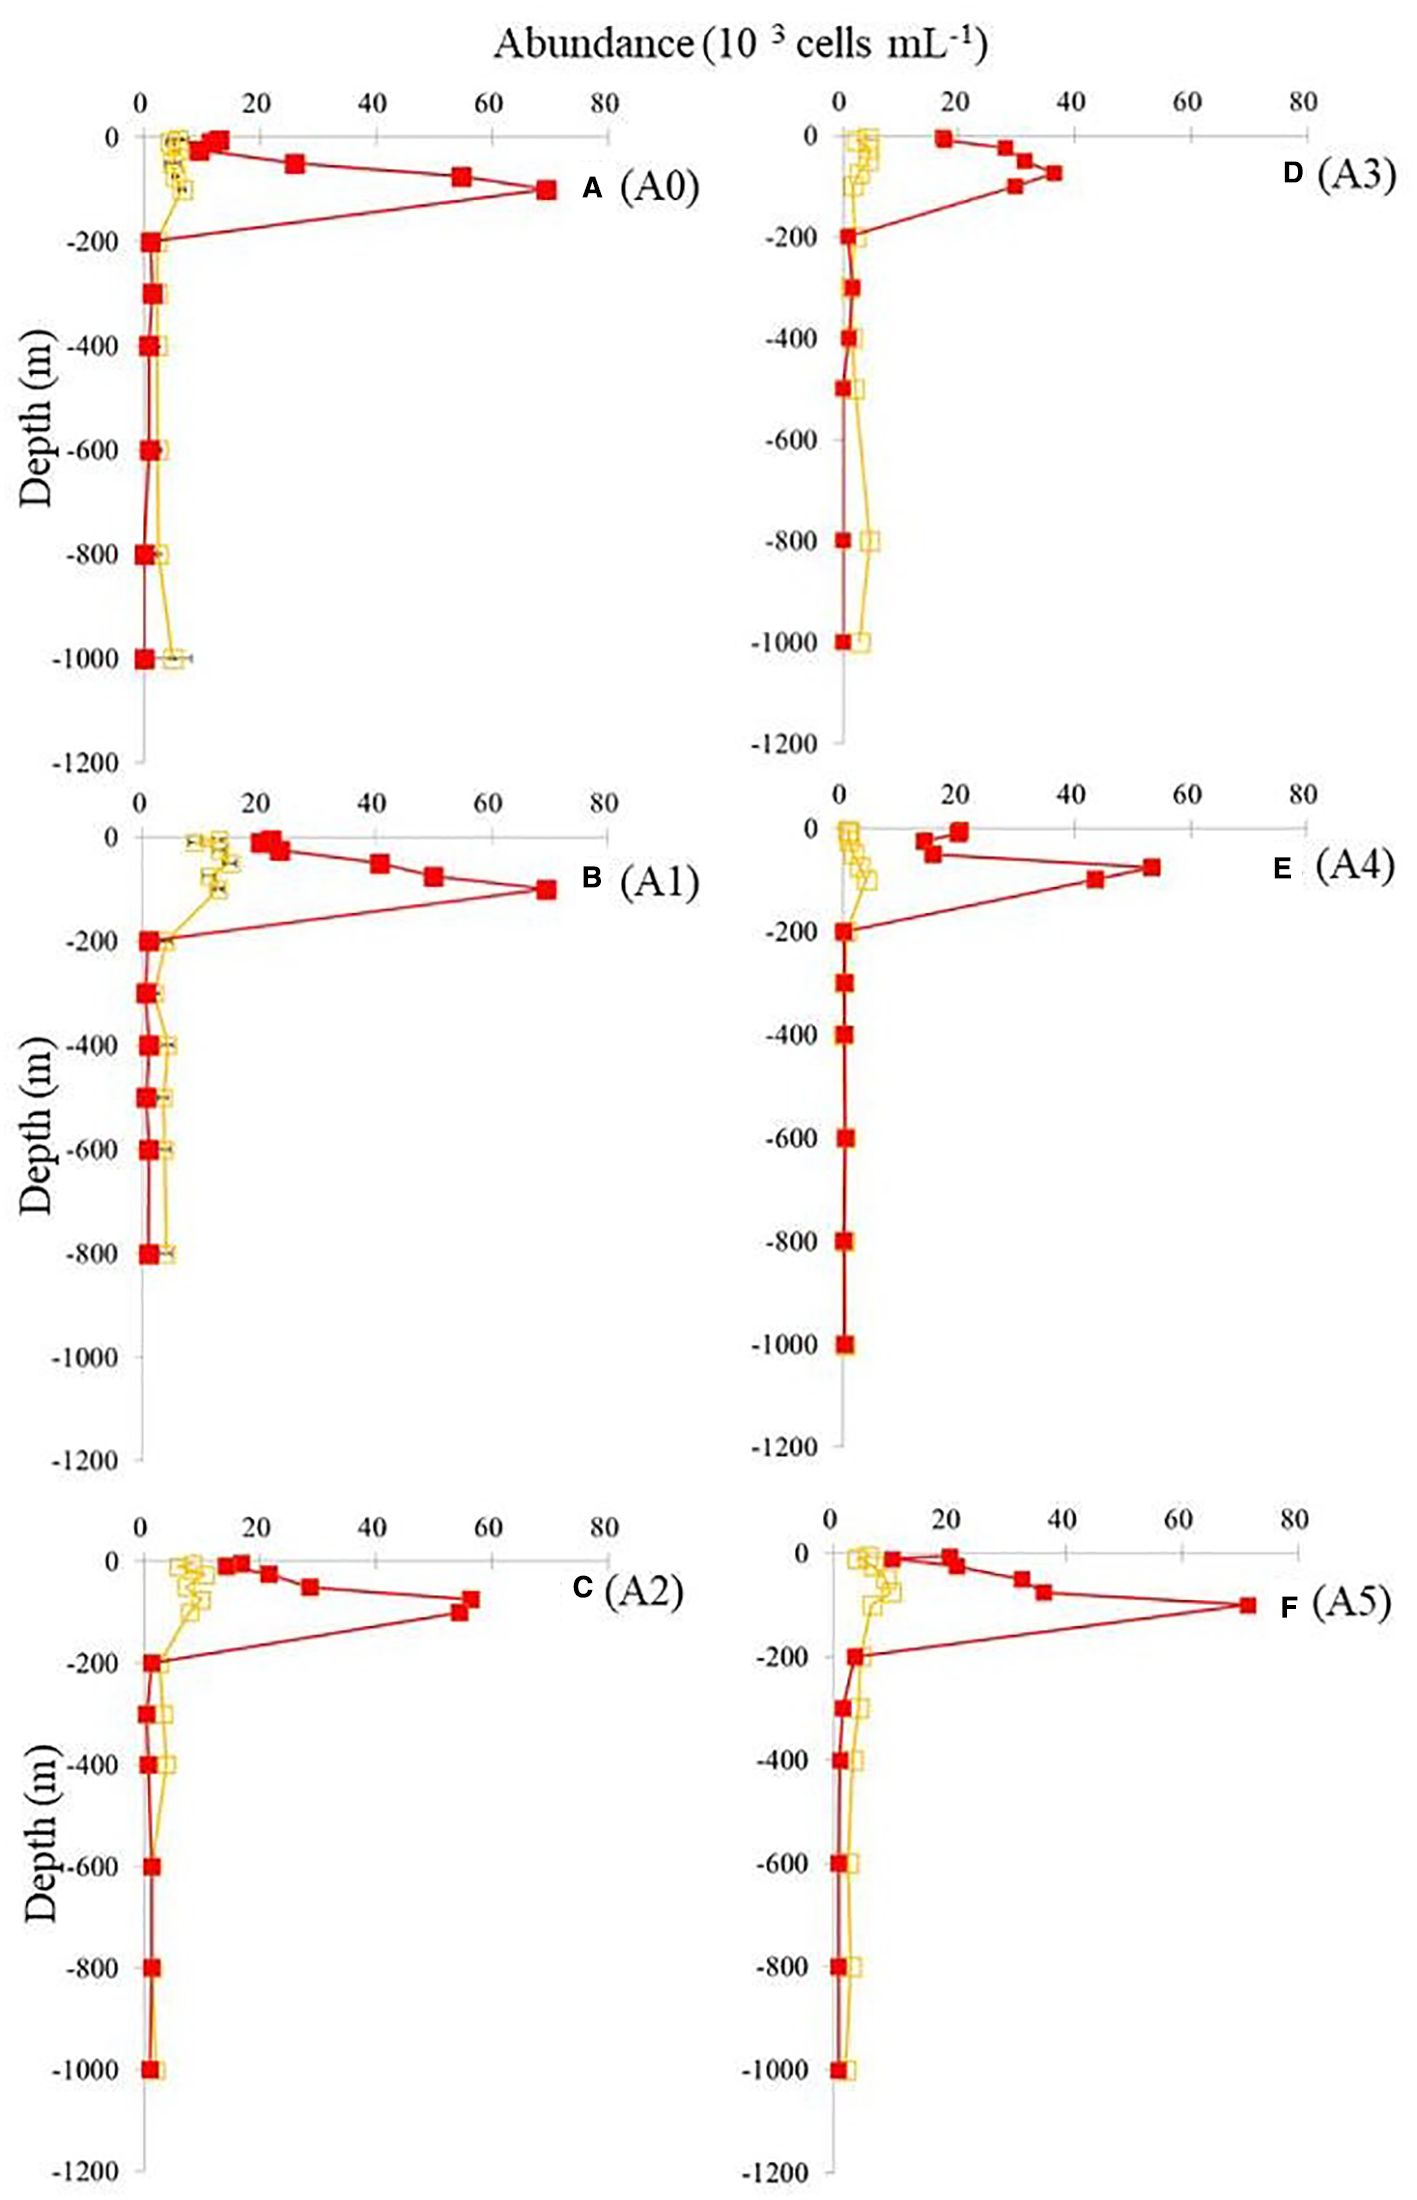
Figure 4. Vertical distributions of SYNE (orange) and PRO (red) at different stations. Values shown are means ± SD. Station labels are indicated at the top of each panel. SYNE, Synechococcus spp.; PRO, Prochlorococcus spp. Panels labeled (A–F) show results from stations A0 to A5, as marked on the right.
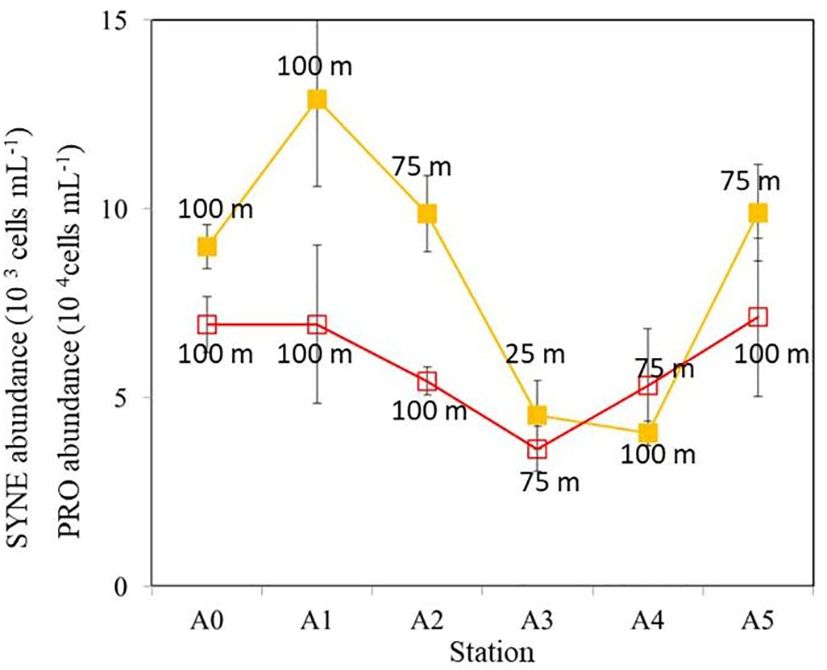
Figure 5. A comparison of the peak values of SYNE (orange) and PRO (red) throughout the water column. The abundance scales for PRO and SYNE are different. The depth measurements on each value indicate the depth where highest SYNE or PRO abundance was recorded. Error bars represent standard deviations of three replicated samples. SYNE, Synechococcus spp.; PRO, Prochlorococcus spp.
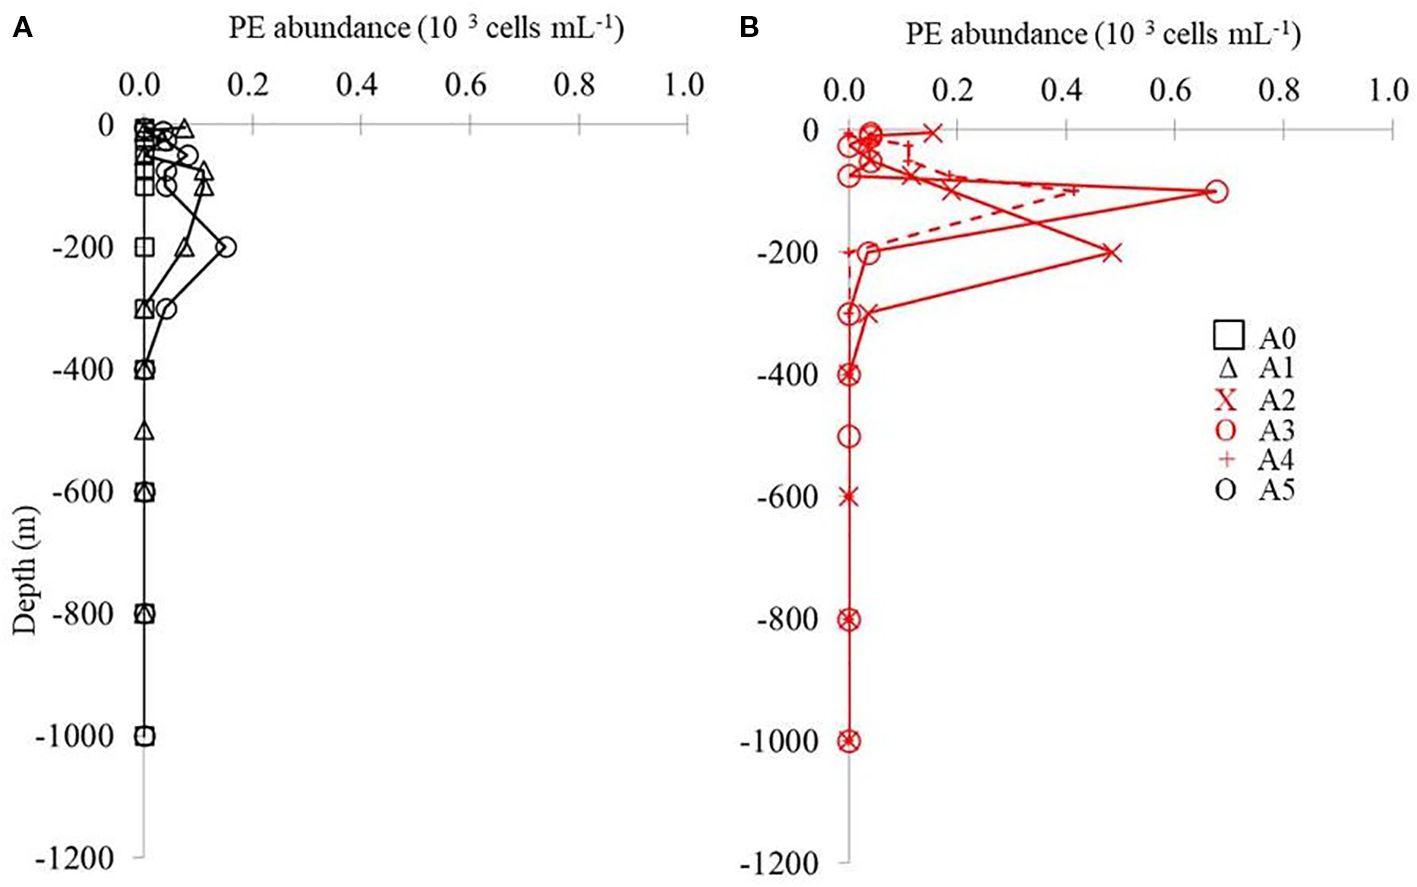
Figure 6. Vertical distribution of PE from surface to 1,000 m at different stations. The black lines indicate stations A0, A1, and A5, where lower values appear in the euphotic zone (A). The red lines indicate stations A2, A3, and A4, where higher values appear in the euphotic zone (B). PE, picoeukaryotes.
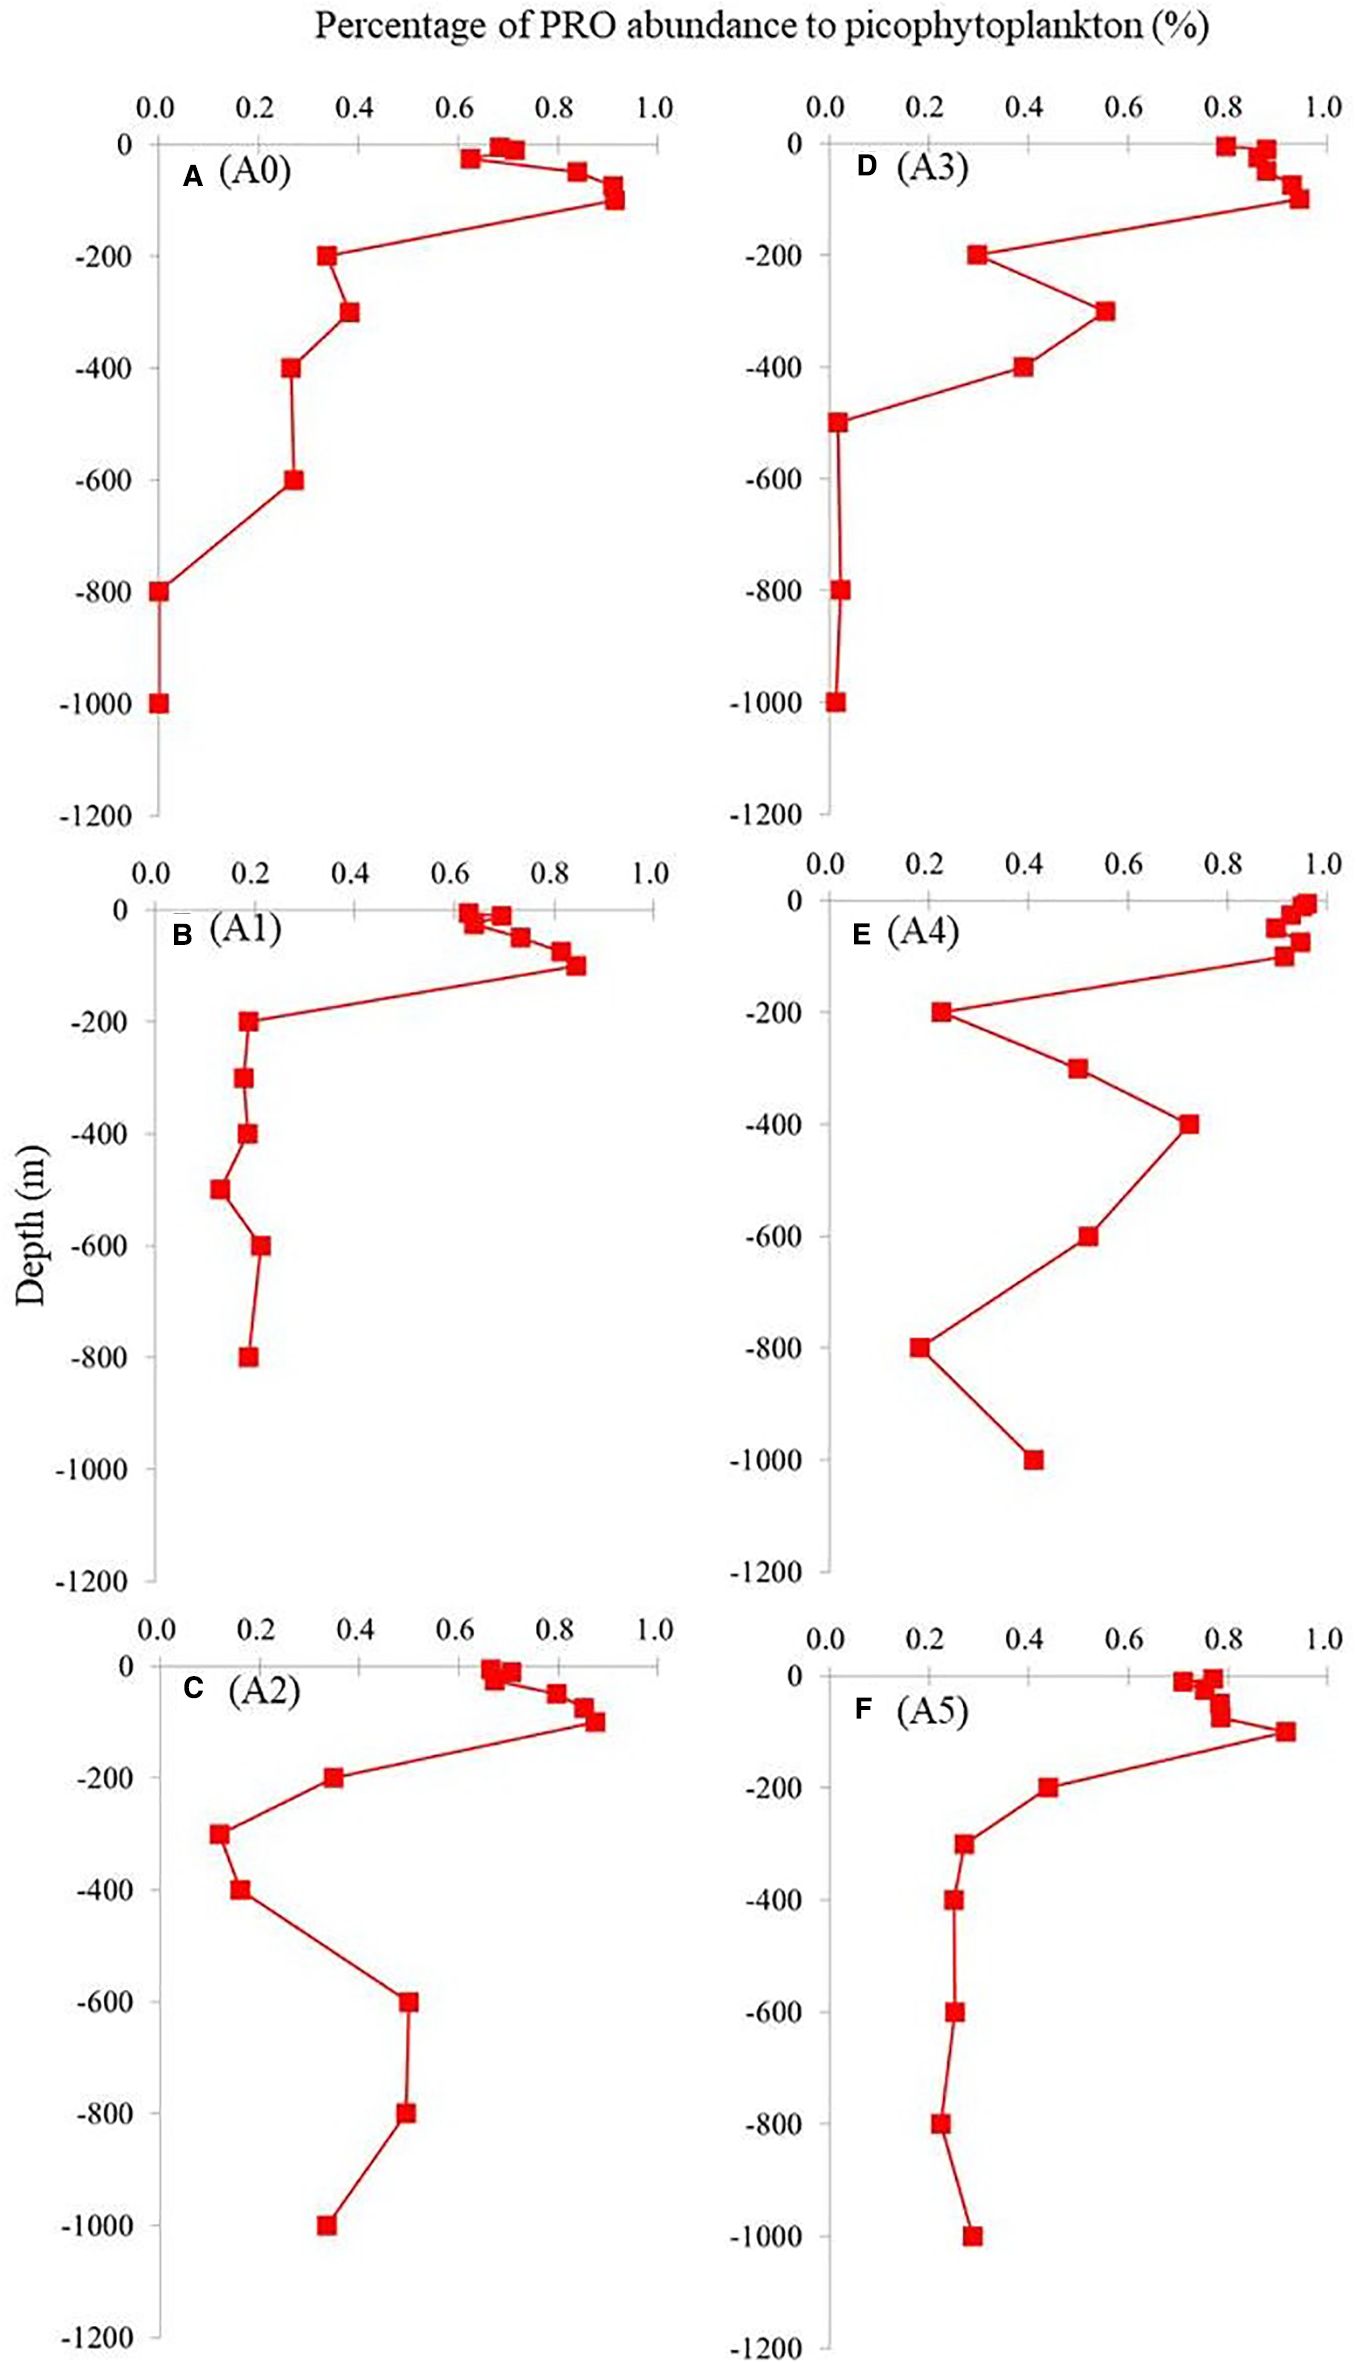
Figure 7. Vertical profiles of percentage of PRO abundance compared to total picophytoplankton (SYNE+PRO+PE) at all stations. SYNE, Synechococcus spp.; PRO, Prochlorococcus spp.; PE, picoeukaryotes. Panels labeled (A–F) show results from stations A0 to A5, as marked on the right.
3.3 Vertical distribution of bacterial abundance
As for vertical variations, all stations reported high variability in the upper 200 m of the HB abundance assessment (Figure 8). Overall, the abundance of HB was approximately 2 × 10⁵ cells mL−1 at the surface and increased to >4 × 10⁵ cells mL−1 at 200-m depth at stations A0, A1, A4, and A5 (Figure 8). However, peaks in HB abundance were seen at 50-m depth at A2 and A3 (Figures 8C, D).
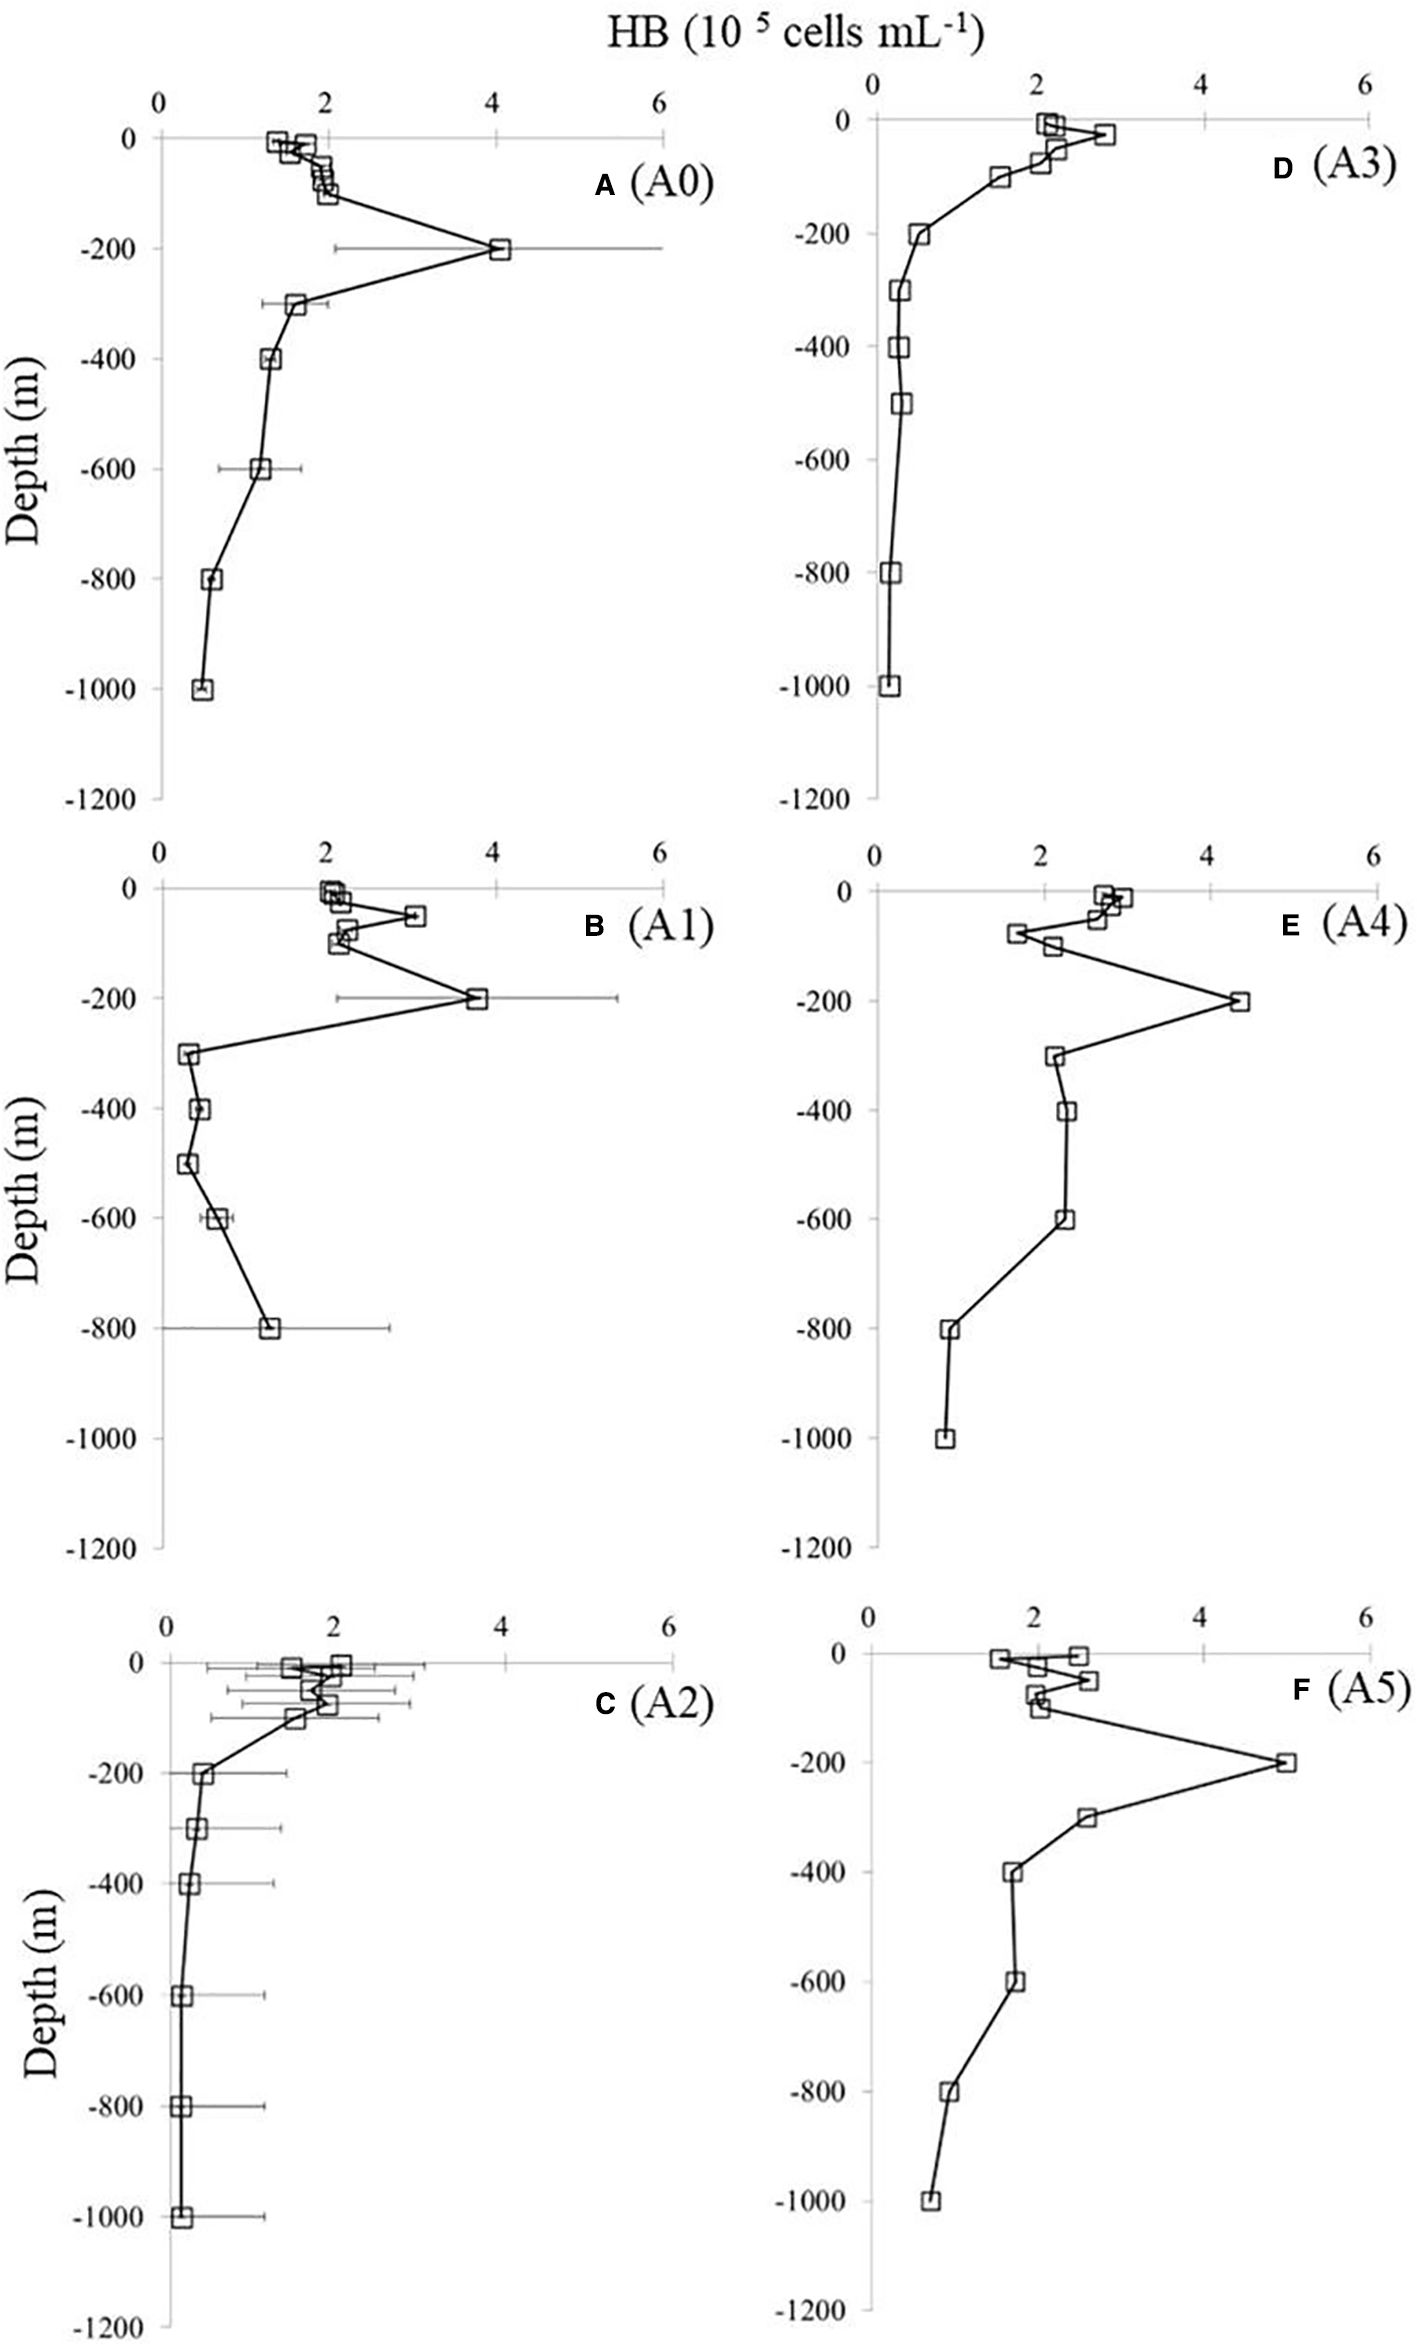
Figure 8. Vertical distributions of bacterial abundance (HB) at different stations. Values shown are means ± SD. Station labels are indicated at the top of each panel. HB, heterotrophic bacteria. Panels labeled (A–F) show results from stations A0 to A5, as marked on the right.
We calculated carbon biomass estimates based on the abundance of cells and the conversion factors at various depths and stations. As shown in Figure 9, the biomass of HB was positively correlated with the biomass of picophytoplankton at all stations when picophytoplankton biomass was less than 2,000 ngC L−1 (p < 0.05). We observed a similar trend in HB biomass at all stations, which did not increase as picophytoplankton biomass increased above 2,000 ngC L−1 (Figure 9). Moreover, we also found that HB was positively correlated with temperature at each station (Figure 10). Nevertheless, we found maximum biomass of HB (7,000–9,500 ngC L−1) at stations A0, A1, A4, and A5, where picophytoplankton biomass was low and temperature was approximately 20 °C at 200-m depth.
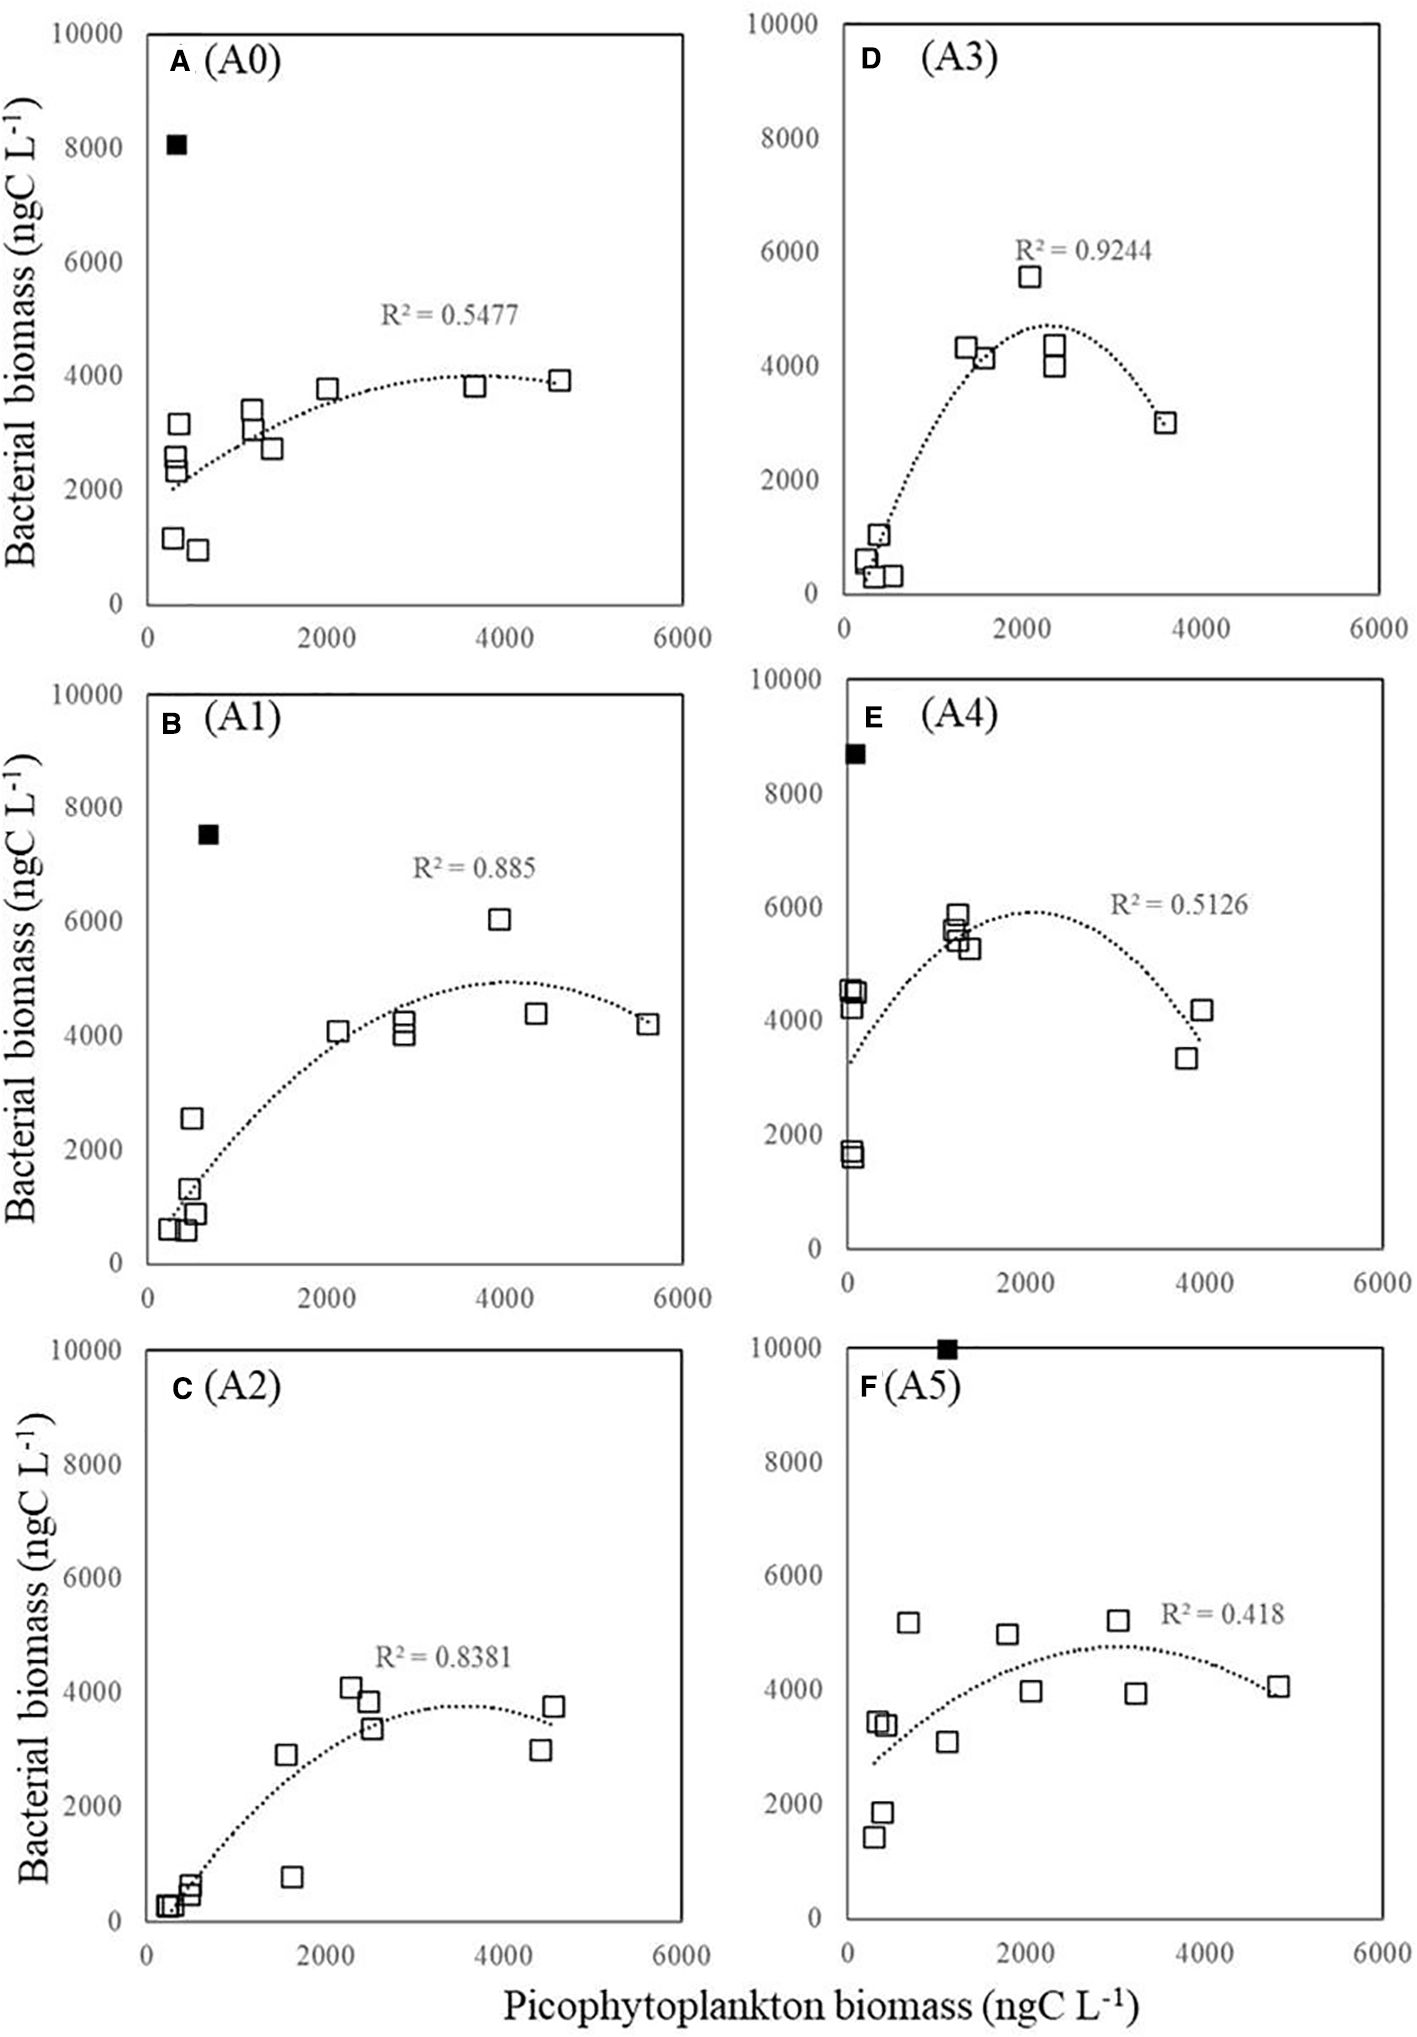
Figure 9. Relationship between total picophytoplankton and HB carbon biomass (ngC L−1). Logarithmic regression is statistically significant at p < 0.05. Symbols in black squares do not fit the regression. HB, heterotrophic bacteria. Panels labeled (A–F) show results from stations A0 to A5, as marked on the right.
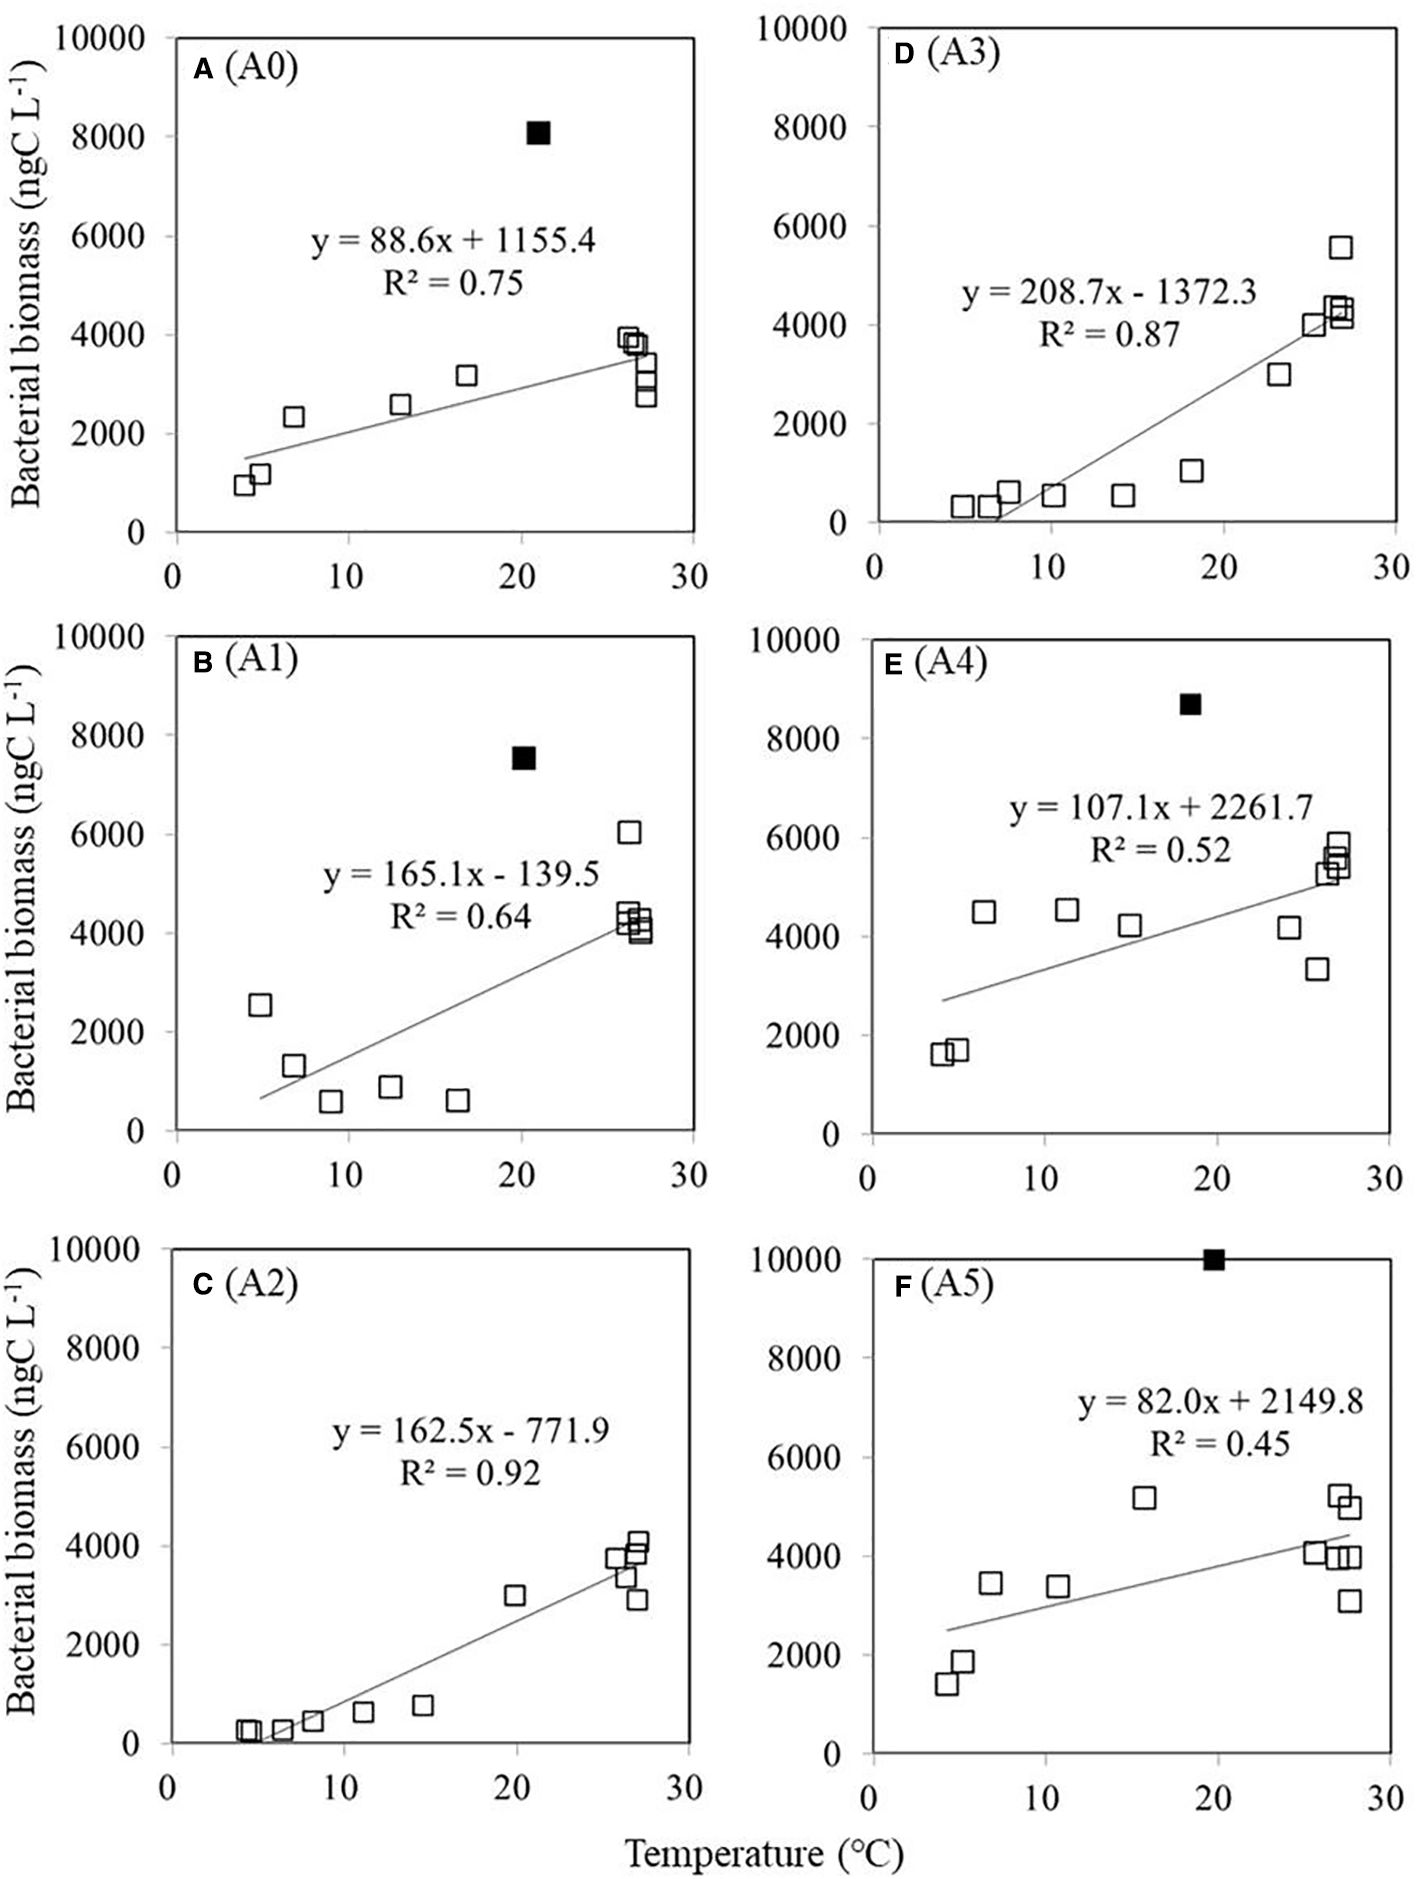
Figure 10. Relationship between temperature and HB carbon biomass (ngC L−1). Line regression is statistically significant at p < 0.05. Symbols in black squares do not fit the regression. HB, heterotrophic bacteria. Panels labeled (A–F) show results from stations A0 to A5, as marked on the right.
4 Discussion
Understanding how oceanic physical processes influence phytoplankton and microbial communities is key to understanding physical–biological interactions. An important component of ocean circulation energy is produced by mesoscale eddies, which directly influence nutrients and phytoplankton distribution. Traditional nutrient supply mechanisms, such as winter mixing, cannot provide enough nutrients to the euphotic zone to compensate for production estimates in the oligotrophic zone (Jenkins and Goldman, 1985). Nutrient supply to the surface of the open sea is believed to be facilitated by eddy pumping. Over the past decades, numerous studies have shown that mesoscale eddies play an important role in ocean biogeochemistry by modulating the efficiency of the biological pump (Keppler et al., 2024; Siegel et al., 1999). It is well known that cyclonic cold eddies tend to enhance the biological pump by increasing nutrient supply, thereby enhancing primary production (Garçon et al., 2001; McGillicuddy et al., 2007) and favoring larger phytoplankton cells (Vaillancourt et al., 2003).
In deep waters, where picoplankton and environmental variables cannot be detected by satellites, it remains unclear how perturbations of complex physical processes affect the plankton community structure and function of the microbial food web. To explore the potential impacts of mesoscale eddies on biological ecosystems (mainly viruses, bacteria, and picophytoplankton), we investigated environmental and biological variables along a transect in the West Pacific Ocean. As previously reported, picophytoplankton predominated during anticyclonic eddies when nitrate supply was insufficient. This was because picophytoplankton requires fewer nutrients than microphytoplankton. As a result of cyclonic eddies, large phytoplankton species may accumulate in oligotrophic waters (Vaillancourt et al., 2003). There is, however, evidence that in tropical and subtropical oligotrophic waters, picophytoplankton is always dominant regardless of the presence of cyclonic or anticyclonic eddies (Casey et al., 2007; Chen et al., 2007).
4.1 Response of picophytoplankton to cold eddy
There are generally two or three orders of magnitude more PRO than SYNE in the nutrient-depleted surface waters of open oceans (Partensky et al., 1999). Even though the two genera often co-occur, they have very different geographical distributions. In warm, oligotrophic oceans, PRO is dominant, while SYNE is more prevalent in coastal areas and mesotrophic, temperate oceans (Partensky et al., 1999). In the present study, PRO was abundant above 100 m, with a contribution exceeding 60% (60%–95%) of picophytoplankton abundance, while SYNE abundance was higher than PRO below 200 m in deep waters over the cold eddy. In nutrient-limited waters, PRO and SYNE were highly competitive (Tsiola et al., 2016), and PRO had an advantage over SYNE when heterotrophic bacteria existed (Calfee et al., 2022). This may explain the dominance of PRO in the oligotrophic waters in our study. In addition to nutrients, other factors (such as light and temperature) can also be affected by mesoscale eddies. PRO mainly occurs from the surface of oligotrophic oceans to a depth of 150 m (Kettler et al., 2007), and it has specific temperature requirements (Johnson et al., 2006). It has also been suggested previously that PRO is highly sensitive to temperature and that PRO cannot tolerate low temperatures; the low boundary of temperature for PRO to exist is approximately 15°C–20°C (Flombaum et al., 2013; Sohm et al., 2015). The optimal growth temperature for PRO in laboratory cultures is between 24°C and 28°C (Chen et al., 2014. We observed that the temperature was approximately 25°C within 100 m of depth, which is an area where PRO is more abundant in this study (Figure 4). SYNE, however, is associated with surface mesotrophic regions and has a broader geographic distribution (Flombaum et al., 2013). It has also been suggested that the predominance of PRO in nutrient-depleted surface waters of subtropical oceans is linked to a preference for recycled or organic nutrients and a high rate of urea utilization (Fawcett et al., 2011; Painter et al., 2008; Zubkov et al., 2003). The results of our study support the theory that PRO makes up a substantial part of microbial communities in open ocean ecosystems, likely having a significant effect on the carbon cycle in oligotrophic areas.
A number of ocean studies have reported that eddies significantly affect phytoplankton community composition (Brown et al., 2008; Chen et al., 2007; Rii et al., 2008; Wang et al., 2016; Yun et al., 2015). A cyclonic cold eddy, for example, can increase phytoplankton abundance in a numerically picoplankton-dominated environment (Vaillancourt et al., 2003). In the South China Sea, both diatoms and picoplankton thrive in the cold eddy (Chen et al., 2007). In tropical and subtropical waters, picophytoplankton dominates regardless of cold or warm eddy states, where PRO can represent up to 83% of total phytoplankton primary productivity (Casey et al., 2007). In the present study, across the cold eddy above 100-m depth, PRO contributed 60% to 90% of the abundance, which is consistent with previous studies (Casey et al., 2007). However, there was a significant decrease in SYNE and PRO abundances in the cyclonic eddy area (stations A3 and A4) compared with other stations at 100-m depth (Figure 4). It is well known that PRO subgroups are physiologically and genetically specified as either high light-adapted (HL) or low light-adapted (LL) ecotypes (Bemal et al., 2018). In most cases, HL ecotypes are found in nutrient-depleted surface waters, while LL ecotypes mainly inhabit the deep euphotic zone near or at the nutricline (Moore et al., 2002). According to previous research (Moore et al., 2002), several HL strains of PRO cannot utilize nitrates and nitrites as nitrogen sources, as they lack the required assimilation genes. As a result, they thrive in stable oligotrophic conditions (Bouman et al., 2011) by utilizing ammonium from surface waters (Rocap et al., 2003). In this study, under the influence of the cold eddy, deeper waters were pushed upward, bringing up nutrient-rich waters (higher nitrate and nitrite) that are less supportive of HL-PRO growth. There is a possibility that the lack of utilizable nutrients for HL-PRO resulted in a decrease in PRO abundance at the eddy center (station A3) (Figure 5). As an explanation for PRO dominance, we believe that its environment adaptability and differentiation of PRO ecotypes reflect its continuous adaptation to the changing marine environment (Yan et al., 2020). However, we found that stations A2, A3, and A4 at 300–400 m, where the cold eddy influenced the region, also showed a secondary peak and had an S type on the vertical patterns of the percentage of PRO abundance (Figure 6). It is possible that the LL-PRO ecotype was increased during this period while deeper waters were being pushed upward, which may explain these patterns. Some PRO biomass maxima were found in deeper layers and are likely governed by physiologic responses to light and nutrients (Johnson et al., 2006; Zinser et al., 2007).
In the present study, a difference was also observed in the vertical distribution and abundance of PE among the stations. The availability of nutrients, temperature, and light affects phytoplankton growth (Gerhard et al., 2019). An eddy of cyclonic current lifts the nitracline, increasing both light intensity and nutrient availability (Kahru et al., 2007). Compared to outside the eddy, PE was more abundant inside or around the edge of the eddy (stations A2, A3, and A4) (Figure 6) and was found in the relatively high nutrient subsurface waters at 100-m depth (NO3 > 0.3 µM; Figure 2C). The result of our study supports the hypothesis that the advection of cold and relatively deep water within cyclonic cold eddies results in an increase in PE abundance, as it shows that PE was four- to sevenfold more abundant in cyclonic cold eddies than outside them in the tropical North Pacific. There were similar results also found in the cyclonic eddy region, in which PE abundance was maximal at 145 m outside and 100 m within the edge of the cyclonic eddy (Kang et al., 2022). An explanation for these effects can be found in the case of a cyclonic eddy that is dominated by its isopycnals and nutricline (Ning et al., 2008). There is a common pattern in which picophytoplankton communities are influenced by eddies, which is different from other water systems.
4.2 Response of bacteria to cold eddy
It is also important to note that ocean physical processes affect HB abundance and activity. In marine ecosystems, physical processes, such as mesoscale eddies, upwelling, and coastal jets, may alter the chemical properties of the water, which may affect the function of HB communities (Zhang et al., 2011). The influence of mesoscale eddy on HB is not well understood. It has been reported that the abundance of HB in NE Atlantic cold-core eddies has increased (Harris et al., 1997; Thyssen et al., 2005), while others report no difference in the depth-integrated HB biomass inside or outside cyclonic eddies (Tarran et al., 2001). The results of our study did not show significant differences (ANOVA, p > 0.05) in the abundance of HB at surface waters across stations. Furthermore, HB abundance is relatively high outside or at the edge of the cyclonic cold eddy at 200-m depth (Figure 8). However, peaks in HB abundance were seen at 50-m depth in the stations (stations A2 and A3) influenced by the eddy (Figures 8C, D). A possible explanation is that deeper waters were pushed upward by the cold eddy, resulting in the changed depth of peak HB values between stations inside and outside the cold eddy (Figure 8). There was a similar situation with picophytoplankton. A cold eddy pushed the maximum values of SYNE and PRO at station A3 upward to 25 and 75 m, respectively (Figure 5). Furthermore, cyclonic eddies display distinct HB community compositions, which greatly affect community structure (Baltar et al., 2010). It is important for future research to consider the coupling between the HB and physical processes (Galand et al., 2010) to understand the diversity and function of marine HB.
In general, three major types of control have been identified as being responsible for HB biomass and activity variability worldwide: temperature, resource availability (i.e., bottom-up control), and losses to predators and viruses (i.e., top-down control) (Morán et al., 2017). According to the present study, the HB–picophytoplankton biomass is strongly related (Figure 9), as was observed in oligotrophic oceanic northern Gulf of Mexico waters (Liu et al., 2004). In surface waters with low nitrate+nitrite concentrations, results by Linacre et al. (2015) revealed that bacteria from surface to 1,000 m were generally controlled by available dissolved organic matter, which is consistent with other studies in the meso- and bathypelagic zones (Meador et al., 2010; Santinelli et al., 2010). In addition to resource availability controlling HB abundance, temperature also played a role in this study (Figure 10). Abiotic factors such as temperature vary considerably in many natural systems, which may affect the relative importance of bottom-up versus top-down processes (Hoekman, 2010). Additionally, our results (Figure 9) showed that the HB biomass at all stations did not significantly increase as picophytoplankton biomass increased above 2,000 ngC L−1, which was observed within the mixed layer (<100 m). It is likely that top-down control, such as viral lysis or grazing by nanoflagellates, limits HB abundance, especially in the upper layer of this study. This layer has sufficient nutrients from the upwelling effect, indicating higher microbial biomass and activity. Supporting this, Cho et al. (2000) reported that bacterial ingestion rates by heterotrophic nanoflagellates in the mesopelagic layer are as high as those in the euphotic layer, suggesting strong top-down regulation of bacteria. Similarly, a study by Weissenbach et al. (2024) in the North Pacific Subtropical Gyre showed higher viral production rates in the cyclonic eddy (cold eddy) compared to the anticyclonic eddy (warm eddy), where they estimate that the mortality from viral lysis ranged from 37% to 171% of bacterial standing stock per day in the cyclonic eddy. This highlights how eddy physical effects can modulate microbial and viral dynamics.
5 Conclusion
As a result of our sampling, we gain a deeper understanding of the impact of cold eddy features on oceanic environmental factors (temperature, salinity, and nutrients) and picoplankton communities. Cold eddy has a significant impact on the distribution of hydrological and nutrient profiles and is associated with differential responses between communities of picoplankton. We found that PRO was abundant above 100 m, with a contribution exceeding 60% (60%–95%), while SYNE abundance was higher than PRO below 200 m to deep waters within the cold eddy. However, there was a significant decrease in SYNE and PRO abundances in the cyclonic eddy area compared with other stations at 100-m depth. On the contrary, PE was more abundant inside or around the edge of the eddy compared to outside the eddy. Furthermore, HB abundance is relatively high outside or at the edge of the cyclonic cold eddy at 200-m depth. However, peaks in HB abundance were observed at 50-m depth in the stations influenced by the eddy. As demonstrated in this study, cold eddy systems play a crucial role in transporting microbial populations and highlight that mesoscale eddies have distinct functions in the distribution of picoplankton in the ocean.
Data availability statement
The raw data supporting the conclusions of this article will be made available by the authors, without undue reservation.
Author contributions
PC: Formal analysis, Writing – original draft, Investigation, Methodology. MO: Methodology, Formal analysis, Writing – original draft, Investigation. CC: Writing – original draft. GG: Writing – original draft, Resources. C-CC: Writing – original draft, Resources. SJ: Resources, Writing – original draft. CA: Investigation, Writing – original draft. AT: Data curation, Writing – review & editing, Funding acquisition, Investigation, Resources, Conceptualization, Validation, Methodology, Writing – original draft, Formal analysis.
Funding
The author(s) declare financial support was received for the research and/or publication of this article. This study was supported by a grant (MOST 111-2119-M-019-002) from the Ministry of Science and Technology, ROC.
Acknowledgments
We appreciate the language editing and helpful comments from Choice Language Service Co., Ltd., on this manuscript.
Conflict of interest
The authors declare that the research was conducted in the absence of any commercial or financial relationships that could be construed as a potential conflict of interest.
Generative AI statement
The author(s) declare that no Generative AI was used in the creation of this manuscript.
Any alternative text (alt text) provided alongside figures in this article has been generated by Frontiers with the support of artificial intelligence and reasonable efforts have been made to ensure accuracy, including review by the authors wherever possible. If you identify any issues, please contact us.
Publisher’s note
All claims expressed in this article are solely those of the authors and do not necessarily represent those of their affiliated organizations, or those of the publisher, the editors and the reviewers. Any product that may be evaluated in this article, or claim that may be made by its manufacturer, is not guaranteed or endorsed by the publisher.
References
Agawin N. S., Duarte C., and Agustí S. (2000). Nutrient and temperature control of the contribution of picoplankton to phytoplankton biomass and production (Errata). Limnol. Oceanogr. 45, 591–600. doi: 10.2307/2670836
Azam F. and Malfatti F. (2007). Microbial structuring of marine ecosystems. Nat. Rev. Microbiol. 5, 782–791. doi: 10.1038/nrmicro1747
Baltar F., Arístegui J., Gasol J. M., Lekunberri I., and Herndl G. J. (2010). Mesoscale eddies: hotspots of prokaryotic activity and differential community structure in the ocean. ISME. J. 4, 975–988. doi: 10.1038/ismej.2010.33
Bemal S., Anil A. C., Shankar D., Remya R., and Roy R. (2018). Picophytoplankton variability: Influence of winter convective mixing and advection in the northeastern Arabian Sea. J. Mar. Syst. 180, 37–48. doi: 10.1016/j.jmarsys.2017.12.007
Bibby T., Gorbunov M., Wyman K., and Falkowski P. (2008). Photosynthetic responses to upwelling in mesoscale eddies in the subtropical North Atlantic and Pacific Oceans. Deep. Sea. Res. Part II.: Topical. Stud. Oceanogr. 55, 1310–1320. doi: 10.1016/j.dsr2.2008.01.014
Bode A., Barquero S., Cardoso M., Braun J. G., and Armas D. (2001). Pelagic bacteria and phytoplankton in oceanic waters near the Canary Islands in summer. Mar. Ecol. Prog. Ser. 209, 1–17. doi: 10.3354/meps209001
Bouman H. A., Ulloa O., Barlow R., Li W. K. W., Platt T., Zwirglmaier K., et al. (2011). Water-column stratification governs the community structure of subtropical marine picophytoplankton. Environ. Microbiol. Rep. 3, 473–482. doi: 10.1111/j.1758-2229.2011.00241.x
Brown S. L., Landry M. R., Selph K. E., Jin Yang E., Rii Y. M., and Bidigare R. R. (2008). Diatoms in the desert: Plankton community response to a mesoscale eddy in the subtropical North Pacific. Deep. Sea. Res. Part II.: Topical. Stud. Oceanogr. 55, 1321–1333. doi: 10.1016/j.dsr2.2008.02.012
Calfee B. C., Glasgo L. D., and Zinser E. R. (2022). Prochlorococcus exudate stimulates heterotrophic bacterial competition with rival phytoplankton for available nitrogen. mBio 13, e0257121. doi: 10.1128/mbio.02571-21
Calvo-Díaz A. and Morán X. A. (2006). Seasonal dynamics of picoplankton in shelf waters of the southern Bay of Biscay. Aquat. Microbial. Ecol. 42, 159–174. doi: 10.3354/ame042159
Casey J., Lomas M., Mandecki J., and Walker D. (2007). Prochlorococcus contributes to new poduction in the Sargasso Sea deep chlorophyll maximum. Geophys. Res. Lett. 34, L10604. doi: 10.1029/2006GL028725
Chelton D. B., Schlax M. G., and Samelson R. M. (2011). Global observations of nonlinear mesoscale eddies. Prog. Oceanogr. 91, 167–216. doi: 10.1016/j.pocean.2011.01.002
Chelton D. B., Schlax M. G., Samelson R. M., and de Szoeke R. A. (2007). Global observations of large oceanic eddies. Geophys. Res. Lett. 34. doi: 10.1029/2007GL030812
Chen Y. L., Chen H. Y., Lin I. I., Lee M. A., and Chang J. (2007). Effects of cold eddy on Phytoplankton production and assemblages in Luzon Strait bordering the South China Sea. J. Oceanogr. 63, 671–683. doi: 10.1007/s10872-007-0059-9
Chen B., Liu H., Huang B., and Wang J. (2014). Temperature effects on the growth rate of marine picoplankton. Mar. Ecol. Prog. Ser. 505, 37–47. doi: 10.3354/meps10773
Cho B., Na S., and Choi D. H. (2000). Active ingestion of fluorescently labeled bacteria by mesopelagic heterotrophic nanoflagellates in the East Sea, Korea. Mar. Ecology-prog. Ser. 206, 23–32. doi: 10.3354/meps206023
Ducklow H. (1999). The bacterial component of the oceanic euphotic zone. FEMS Microbiol. Ecol. 30, 1–10. doi: 10.1111/j.1574-6941.1999.tb00630.x
DuRand M. D., Olson R. J., and Chisholm S. W. (2001). Phytoplankton population dynamics at the Bermuda Atlantic Time-series station in the Sargasso Sea. Deep. Sea. Res. Part II.: Topical. Stud. Oceanogr. 48, 1983–2003. doi: 10.1016/S0967-0645(00)00166-1
Fawcett S., Lomas M., Casey J., Ward B., and Sigman D. (2011). Assimilation of upwelled nitrate by small eukaryotes in the Sargasso Sea. Nat. Geosci. 4. doi: 10.1038/NGEO1265
Flombaum P., Gallegos J., Gordillo R., Rincón J., Zabala L., Jiao N., et al. (2013). Present and future global distributions of the marine Cyanobacteria Prochlorococcus and Synechococcus. Proc. Natl. Acad. Sci. 110. doi: 10.1073/pnas.1307701110
Galand P., Potvin M., Casamayor E., and Lovejoy C. (2010). Hydrography shapes bacterial biogeography of the deep Artic Ocean. ISME. J. 4, 564–576. doi: 10.1038/ismej.2009.134
Garçon V. C., Oschlies A., Doney S. C., McGillicuddy D., and Waniek J. (2001). The role of mesoscale variability on plankton dynamics in the North Atlantic. Deep. Sea. Res. Part II.: Topical. Stud. Oceanogr. 48, 2199–2226. doi: 10.1016/S0967-0645(00)00183-1
Garrison D. L., Gowing M. M., Hughes M. P., Campbell L., Caron D. A., Dennett M. R., et al. (2000). Microbial food web structure in the Arabian Sea: a US JGOFS study. Deep. Sea. Res. Part II.: Topical. Stud. Oceanogr. 47, 1387–1422. doi: 10.1016/S0967-0645(99)00148-4
Gerhard M., Koussoroplis A. M., Hillebrand H., and Striebel M. (2019). Phytoplankton community responses to temperature fluctuations under different nutrient concentrations and stoichiometry. Ecology 100, e02834. doi: 10.1002/ecy.2834
Gong G. C., Liu K. K., and Pai S. C. (1995). Prediction of nitrate concentration from two end member mixing in the southern East China Sea. Continent. Shelf. Res. 15, 827–842. doi: 10.1016/0278-4343(94)00039-P
González-Benítez N., Anadón R., Mourino B., Fernández E., Sinha B., Escanez J., et al. (2001). The metabolic balance of the planktonic community in the N. Atlantic Subtropical Gyre: The role of mesoscale instabilities. Limnol. Oceanogr. 46, 946. doi: 10.4319/lo.2001.46.4.0946
Hammes F. and Egli T. (2010). Cytometric methods for measuring bacteria in water: advantages, pitfalls and applications. Anal. Bioanal. Chem. 397, 1083–1095. doi: 10.1007/s00216-010-3646-3
Harris R. P., Boyd P., Harbour D. S., Head R. N., Pingree R. D., Escanez J., et al. (1997). Physical, chemical and biological features of a cyclonic eddy in the region of 61°10’N 19°50’W in the North Atlantic. Deep. Sea. Res. Part I.: Oceanogr. Res. Papers. 44, 1815–1839. doi: 10.1016/S0967-0637(97)00053-8
He Q., Zhan H., Xu J., Zhan W., Zhou L., and Zha G. (2019). Eddy-induced chlorophyll anomalies in the western south China sea. J. Geophys. Res.: Oceans. 124, 9487–9506. doi: 10.1029/2019JC015371
Hoekman D. (2010). Turning up the heat: Temperature influences the relative importance of top-down and bottom-up effects. Ecology 91, 2819–2825. doi: 10.1890/10-0260.1
Jenkins W. J. and Goldman J. C. (1985). Seasonal oxygen cycling and primary production in the Sargasso Sea. J. Mar. Res. 43, 465–491. doi: 10.1357/002224085788438687
Johnson Z., Zinser E., Coe A., McNulty N., Woodward E., and Chisholm S. (2006). Niche partitioning among Prochlorococcus ecotypes along ocean-scale environmental gradients. Science 311, 1737–1740. doi: 10.1126/science.1118052
Kahru M., Mitchell B., Gille S., Hewes C., and Holm-Hansen O. (2007). Eddies enhance biological production in the Weddell-Scotia Confluence of the Southern Ocean. Geophys. Res. Lett. 34. doi: 10.1029/2007GL030430
Kang J., Wang Y., Huang S., Pei L., and Luo Z. (2022). Impacts of mesoscale eddies on biogeochemical variables in the northwest pacific. J. Mar. Sci Eng. 10, 1451. doi: 10.3390/jmse10101451
Keppler L., Eddebbar Y. A., Gille S. T., Guisewhite N., Mazloff M. R., Tamsitt V., et al. (2024). Effects of mesoscale eddies on southern ocean biogeochemistry. AGU. Adv. 5, e2024AV001355. doi: 10.1029/2024AV001355
Kettler G. C., Martiny A. C., Huang K., Zucker J., Coleman M. L., Rodrigue S., et al. (2007). Patterns and implications of gene gain and loss in the evolution of Prochlorococcus. PloS Genet. 3, e231. doi: 10.1371/journal.pgen.0030231
Klein P. and Lapeyre G. (2009). The oceanic vertical pump induced by mesoscale and submesoscale turbulence. Annu. Rev. Mar. Sci 1, 351–375. doi: 10.1146/annurev.marine.010908.163704
Lee S. and Fuhrman J. A. (1987). Relationships between biovolume and biomass of naturally derived marine bacterioplankton. Appl. Environ. Microbiol. 53, 1298–1303. doi: 10.1128/aem.53.6.1298-1303.1987
Levy M., Franks P., and Smith K. (2018). The role of submesoscale currents in structuring marine ecosystems. Nat. Commun. 9. doi: 10.1038/s41467-018-07059-3
Linacre L., Lara-Lara R., Camacho-Ibar V., Herguera J., Bazán-Guzmán C., and Ferreira V. (2015). Distribution pattern of picoplankton carbon biomass linked to mesoscale dynamics in the southern gulf of Mexico during winter conditions. Deep. Sea. Res. Part I. Oceanogr. Res. Papers. 106, 55–67. doi: 10.1016/j.dsr.2015.09.009
Liu H., Dagg M., Campbell L., and Urban-Rich J. (2004). Picophytoplankton and bacterioplankton in the mississippi river plume and its adjacent waters. Estuaries 27, 147–156. doi: 10.1007/BF02803568
Mahaffey C., Benitez-Nelson C. R., Bidigare R. R., Rii Y., and Karl D. M. (2008). Nitrogen dynamics within a wind-driven eddy. Deep. Sea. Res. Part II.: Topical. Stud. Oceanogr. 55, 1398–1411. doi: 10.1016/j.dsr2.2008.02.004
McGillicuddy D. (2016). Mechanisms of physical-biological-biogeochemical interaction at the oceanic mesoscale. Annu. Rev. Mar. Sci 8, 125–159. doi: 10.1146/annurev-marine-010814-015606
McGillicuddy D., Anderson L., Bates N., Bibby T., Buesseler K., Carlson C., et al. (2007). Eddy/wind interactions stimulate extraordinary mid-ocean plankton blooms. Sci (New York N.Y.). 316, 1021–1026. doi: 10.1126/science.1136256
McGillicuddy D., Anderson L., Doney S. C., and Maltrud M. E. (2003). Eddy-driven sources and sinks of nutrients in the upper ocean: Results from a 0.1° resolution model of the North Atlantic. Global Biogeochem. Cycles. 17. doi: 10.1029/2002GB001987
McGillicuddy D., Johnson R., Siegel D., Michaels A., Bates N., and Knap A. (1999). Mesoscale variations of biogeochemical properties in the Sargasso Sea. J. Geophys. Res. 104, 13381–13394. doi: 10.1029/1999JC900021
Meador T., Gogou A., Spyres G., Herndl G., Krasakopoulou E., Psarra S., et al. (2010). Biogeochemical relationships between ultrafiltered dissolved organic matter and picoplankton activity in the Eastern Mediterranean Sea. Deep. Sea. Res. Part II.: Topical. Stud. Oceanogr. 57, 1460–1477. doi: 10.1016/j.dsr2.2010.02.015
Moore L. R., Post A. F., Rocap G., and Chisholm S. W. (2002). Utilization of different nitrogen sources by the marine cyanobacteria Prochlorococcus and Synechococcus. Limnol. Oceanogr. 47, 989–996. doi: 10.4319/lo.2002.47.4.0989
Morán X. A. G., Gasol J. M., Pernice M. C., Mangot J. F., Massana R., Lara E., et al. (2017). Temperature regulation of marine heterotrophic prokaryotes increases latitudinally as a breach between bottom-up and top-down controls. Glob. Chang. Biol. 23, 3956–3964. doi: 10.1111/gcb.13730
Ning X., Peng X., Le F., Hao Q., Sun J., and Cai Y. (2008). Nutrient limitation of phytoplankton in anticyclonic eddies of the northern South China Sea. Biogeosci. Discuss. 5. doi: 10.5194/bgd-5-4591-2008
Painter S., Sanders R., Waldron H., Lucas M., and Torres-Valdés S. (2008). Urea distribution and uptake in the Atlantic Ocean between 50°N and 50°S. Mar. Ecology-prog. Ser. - Mar. ECOL-PROGR. Ser. 368, 53–63. doi: 10.3354/meps07586
Parsons T. R., Maita Y., and Lalli C. M. (1984). A manual of chemical and biological methods for seawater analysis. Oxford, UK.
Partensky F., Blanchot J., and Vaulot D. (1999). Differential distribution and ecology of Prochlorococcus and Synechococcus in oceanic waters: a review. Bull. l’Inst. Océanograph. - Special. Issue.: Mar. Cyanobacteria. 19, 457–476. doi:daniel-vaulot.fr/publication/1999_chapter_partensky/
Patel R. S., Llort J., Strutton P. G., Phillips H. E., Moreau S., Conde Pardo P., et al. (2020). The biogeochemical structure of southern ocean mesoscale eddies. J. Geophys. Res.: Oceans. 125, e2020JC016115. doi: 10.1029/2020JC016115
Paterson J., Nayar S., Mitchell J., and Seuront L. (2013). Population-specific shifts in viral and microbial abundance within a cryptic upwelling. J. Mar. Syst. 113-114, 52–61. doi: 10.1016/j.jmarsys.2012.12.009
Retnamma J., Jyothibabu P., Vinayachandran P. N., Madhu N. V., Robin R. S., Chinnadurai K., et al. (2015). Phytoplankton size structure in the southern Bay of Bengal modified by the Summer Monsoon Current and associated eddies: Implications on the vertical biogenic flux. J. Mar. Syst. 143, 98–119. doi: 10.1016/j.jmarsys.2014.10.018
Rii Y. M., Brown S. L., Nencioli F., Kuwahara V., Dickey T., Karl D. M., et al. (2008). The transient oasis: Nutrient-phytoplankton dynamics and particle export in Hawaiian lee cyclones. Deep. Sea. Res. Part II.: Topical. Stud. Oceanogr. 55, 1275–1290. doi: 10.1016/j.dsr2.2008.01.013
Rocap G., Larimer F. W., Lamerdin J., Malfatti S., Chain P., Ahlgren N. A., et al. (2003). Genome divergence in two Prochlorococcus ecotypes reflects oceanic niche differentiation. Nature 424, 1042–1047. doi: 10.1038/nature01947
Rodríguez F., Varela M., Fernández E., and Zapata M. (2003). Phytoplankton and pigment distributions in an anticyclonic slope water oceanic eddy (SWODDY) in the southern Bay of Biscay. Mar. Biol. 143, 995–1011. doi: 10.1007/s00227-003-1129-1
Santinelli C., Nannicini L., and Seritti A. (2010). DOC dynamics in the meso and bathypelagic layers of the Mediterranean Sea. Deep. Sea. Res. Part II.: Topical. Stud. Oceanogr. 57, 1446–1459. doi: 10.1016/j.dsr2.2010.02.014
Siegel D. A., McGillicuddy D. J., and Fields E. (1999). Mesoscale eddies, satellite altimetry, and new production in the sargasso sea. J. Geophys. Res. 104, 13359–13379. doi: 10.1029/1999JC900051
Sohm J., Ahlgren N., Thomson Z., Williams C., Moffett J., Saito M., et al. (2015). Co-occurring Synechococcus ecotypes occupy four major oceanic regimes defined by temperature, macronutrients and iron. ISME J. 10. doi: 10.1038/ismej.2015.115
Tarran G. A., Zubkov M. V., Sleigh M. A., Burkill P. H., and Yallop M. (2001). Microbial community structure and standing stocks in the NE Atlantic in June and July of 1996. Deep. Sea. Res. Part II.: Topical. Stud. Oceanogr. 48, 963–985. doi: 10.1016/S0967-0645(00)00104-1
Thyssen M., Lefèvre D., Caniaux G., Ras J., Fernández I C., Denis M., et al. (2005). Correction to “Spatial distribution of heterotrophic bacteria in the northeast Atlantic (POMME study area) during spring 2001. J. Geophys. Res.: Oceans. 110. doi: 10.1029/2005JC003201
Tsiola A., Pitta P., Fodelianakis S., Pete R., Magiopoulos I., Mara P., et al. (2016). Nutrient limitation in surface waters of the oligotrophic eastern mediterranean sea: an enrichment microcosm experiment. Microbial. Ecol. 71, 575–588. doi: 10.1007/s00248-015-0713-5
Vaillancourt R., Marra J., Seki M., Parsons M., and Bidigare R. (2003). Impact of a cyclonic eddy on phytoplankton community structure and photosynthetic competency in the subtropical North Pacific Ocean. Deep. Sea. Res. Part I.: Oceanogr. Res. Papers. 50, 829–847. doi: 10.1016/S0967-0637(03)00059-1
Wang L., Huang B., Chiang K. P., Liu X., Chen B., Xie Y., et al. (2016). Physical-biological coupling in the western south China sea: the response of phytoplankton community to a mesoscale cyclonic eddy. PloS One 11, e0153735. doi: 10.1371/journal.pone.0153735
Weissenbach J., Goldin S., Hulata Y., and Lindell D. (2024). Differences in cyanophage and virioplankton production dynamics in eddies of opposite polarity in the North Pacific Subtropical Gyre. Front. Mar. Sci 11. doi: 10.3389/fmars.2024.1442290
Xiu P. and Chai F. (2011). Modeled biogeochemical responses to mesoscale eddies in the South China Sea. J. Geophys. Res.: Oceans. 116. doi: 10.1029/2010JC006800
Yan W., Feng X., Zhang W., Zhang R., and Jiao N. (2020). Research advances on ecotype and sub-ecotype differentiation of Prochlorococcus and its environmental adaptability. Sci China Earth Sci. 63. doi: 10.1007/s11430-020-9651-0
Yun M. S., Kim B. K., Joo H. T., Yang E. J., Nishino S., Chung K. H., et al. (2015). Regional productivity of phytoplankton in the Western Arctic Ocean during summer in 2010. Deep. Sea. Res. Part II.: Topical. Stud. Oceanogr. 120, 61–71. doi: 10.1016/j.dsr2.2014.11.023
Zhang Y., Jiao N., Sun Z., Hu A., and Zheng Q. (2011). Phylogenetic diversity of bacterial communities in South China Sea mesoscale cyclonic eddy perturbations. Res. Microbiol. 162, 320–329. doi: 10.1016/j.resmic.2010.12.006
Zinser E., Johnson Z., Coe A., Karaca E., Veneziano D., and Chisholm S. (2007). Influence of light and temperature on prochlorococcus ecotype distributions in the atlantic ocean. Limnol. Oceanogr. 52, 2205–2220. doi: 10.2307/4502370
Keywords: cold eddy, vertical variation, picophytoplankton, bacteria, flow cytometer
Citation: Chen PWY, Olivia M, Chang CM, Gong GC, Chen C-C, Jan S, Annabel CN and Tsai AY (2025) Vertical distribution of picoplankton across a cold eddy in the West Pacific Ocean. Front. Mar. Sci. 12:1637923. doi: 10.3389/fmars.2025.1637923
Received: 30 May 2025; Accepted: 23 September 2025;
Published: 15 October 2025.
Edited by:
Marco Casu, University of Sassari, ItalyReviewed by:
Rajani Kanta Mishra, Ministry of Earth Sciences, IndiaShavonna Bent, Woods Hole Oceanographic Institution, United States
Copyright © 2025 Chen, Olivia, Chang, Gong, Chen, Jan, Annabel and Tsai. This is an open-access article distributed under the terms of the Creative Commons Attribution License (CC BY). The use, distribution or reproduction in other forums is permitted, provided the original author(s) and the copyright owner(s) are credited and that the original publication in this journal is cited, in accordance with accepted academic practice. No use, distribution or reproduction is permitted which does not comply with these terms.
*Correspondence: An Yi Tsai, YW55aXRzYWlAbnRvdS5lZHUudHc=
 Patrichka Wei Yi Chen
 Madeline Olivia
 Chia Mei Chang1
 Chung-Chi Chen
 Sen Jan