 Nadia Solovieva
 Dunya Medhat3
 Fatin Samara
 Maria Saburova
- 1General Studies Division, Higher Colleges of Technology, Sharjah, United Arab Emirates
- 2Department of Geography, Environmental Change Research Centre (ECRC), University College London, London, United Kingdom
- 3Department of Biology, Chemistry and Environmental Sciences, College of Arts and Sciences, American University of Sharjah, Sharjah, United Arab Emirates
- 4Energy, Water and Sustainable Environment Research Center (EWSERC), American University of Sharjah, Sharjah, United Arab Emirates
- 5Coastal and Marine Resources Program, Environment and Life Sciences Center, Kuwait Institute for Scientific Research, Salmiya, Kuwait
Phytoplankton are key indicators of marine ecosystem health and drivers of biogeochemical processes, yet their seasonal patterns in the southern Arabian Gulf are insufficiently understood. This study investigates inter-seasonal variability in phytoplankton composition and abundance along the coast of the United Arab Emirates (UAE), focusing on waters surrounding the region’s largest oyster beds. Surface samples were collected at nine sites during four seasons between 2020 and 2022. Phytoplankton dynamics were analyzed together with water chemistry parameters using multivariate techniques, i.e. Detrended Correspondence Analysis (DCA) and Canonical Correspondence Analysis (CCA). A non-parametric Bray-Curtis dissimilarity analysis with PERMANOVA was also used to analyze seasonal differences in the phytoplankton abundance and composition and it confirmed DCA findings on clear community changes between January and June. Results revealed distinct seasonal assemblages: cyanobacteria prevailed during warmer months (May–June), while diatoms and cryptophytes dominated in cooler periods (November–January). Spatial differences in composition were evident, even between nearby locations, and likely reflect the influence of localized anthropogenic pressures and environmental gradients. Temperature, dissolved oxygen, chemical oxygen demand (COD), and oxidation-reduction potential (ORP) were identified as the principal environmental drivers, jointly explaining about 30% of phytoplankton variation. The unexplained variance in the phytoplankton data may be attributed to the impact of unmeasured water chemistry variables such as Si and toxic pollutant influx together with ecological variables, e.g. zooplankton grazing. Several potentially harmful taxa including dinoflagellates Scrippsiella spp., Heterocapsa spp., and Blixaea quinquecornis, were detected albeit at low abundances. At the same time, a potentially toxic diatom group Pseudo-nitzschia spp. occurred between November and May at considerably higher concentrations, which are comparable with the European bloom threshold levels although no actual harmful algal blooms (HABs) were observed. This study contributes to understanding phytoplankton ecology in the Gulf coastal waters and highlights the need for long-term monitoring supporting sustainable marine resource management under growing environmental and climatic stressors.
1 Introduction
In the ocean and climate systems, phytoplankton plays a crucial role by forming a base of the food chain and providing organic matter for marine life (King, 2012), supporting biogeochemical cycles including recycling CO2(Allen et al., 2005; Watson et al., 1991) and reducing possible ocean acidification (d’Ovidio et al., 2010).
Marine phytoplankton comprises several groups of unicellular photosynthetic microscopic algae, of which the prokaryotic cyanobacteria and eukaryotic diatoms, dinoflagellates, and phytoflagellates are the most abundant (Falkowski, 2012). The distribution and abundance of phytoplankton groups in the ocean largely depends on the biogenic elements, which become available to microalgae through ocean currents and water circulation, mixing processes, and human impact (Bonachela et al., 2011; Zeitzschel, 1978). Climate is one of the factors that strongly influences the oceanic hydrological processes, and therefore also controls seasonal changes in phytoplankton cycles, e.g. timing and duration of phytoplankton blooms (Demarcq et al., 2012; Longhurst, 1993, Longhurst, 1995; Nezlin et al., 2010).
In recent years, seasonal phytoplankton dynamics data were often derived through remote sensing (Demarcq et al., 2012; Longhurst, 1995; Nezlin et al., 2010; Polikarpov et al., 2019). However, these are usually large-scale data which often lack regional-scale information, in particular, regarding tropical oceans (e.g., Demarcq et al., 2012).
In this study, we analyzed seasonal phytoplankton dynamics in the coastal area of the Arabian Gulf and referred to hereafter as ‘the Gulf’. The Gulf is a shallow semi-open marginal sea of the northern Indian Ocean with extremely high levels of conductivity, salinity and temperature and UV exposure, which makes it especially vulnerable to climate and anthropogenic changes (e.g., Al-Yamani et al., 2024; Samara et al., 2023; Sheppard et al., 2010). Rapid economic development in the recent decades has put additional pressure on some coastal ecosystems in the Gulf (e.g., Al-Yamani et al., 2021; El Gammal et al., 2017; Naser, 2013; Subba Rao et al., 1999; Wabnitz et al., 2018).
Global climate change, anthropogenically driven nutrient enrichment, and aeolian influence were some of the factors behind frequent red tide events off the Kuwaiti coast (Nezlin et al., 2010; Polikarpov et al., 2020, Polikarpov et al., 2021; Subba Rao et al., 1999). Recently, a wide range of harmful dinoflagellates, flagellates, and toxic diatoms Pseudo-nitzschia spp. were found in Kuwait’s coastal area (Al-Yamani et al., 2012; Al-Yamani and Saburova, 2019a; Al-Yamani and Saburova, 2019b; Polikarpov et al., 2020; Saburova et al., 2022).
It appears that the north-western Gulf experiences higher levels of nutrient enrichment, primarily attributable to the influence of the Shatt Al-Arab River discharge in comparison to the UAE coast (e.g., Al-Yamani et al., 2021; Polikarpov et al., 2016). The only well-documented red-tide event in the UAE took place in 2008–2009 caused by toxic dinoflagellate Margalefidinium (syn. Cochlodinium) polykrikoides, when about 1200 km of coastline was affected and fish and mammal death occurred in the Gulf and the Sea of Oman (e.g., Richlen et al., 2010; Rajan et al., 2021; Zhao and Ghedira, 2014). Recently, high-biomass blooms of the dinoflagellate Blixaea quinquecornis (syn. Protoperidinium quinquecorne) have been observed in association with water discoloration and oxygen depletion in Dubai coastal waters (Murugesan et al., 2021a). As in the case of the Kuwaiti coastal algal blooms, these red-tide events were linked to the nutrient enrichment from the human sources and global climate change (e.g., Polikarpov et al., 2020; Subba Rao et al., 1999).
However, recently the UAE phytoplankton assemblages appear to be more influenced by the algal blooms from the more productive waters and from the northern Arabian Sea (off the coast of Oman and India). There, planktonic diatoms are increasingly being replaced with large dinoflagellate Noctiluca scintillans, which causes winter hypoxic conditions in subsurface waters (Gomes et al., 2014). Noctiluca scintillans bloom was also reported in the Red Sea off the Saudi Arabia coast (Mohamed and Mesaad, 2007) and in January 2017 it bloomed in the coastal waters off Dubai (Murugesan et al., 2017). It is likely that it will continue to spread in the Arabian Gulf in the future and may negatively affect coastal ecosystems, especially the north-eastern part of the UAE coast, which is geographically close to the Sea of Oman. In November-December 2023, fluorescent Noctiluca scintillans was recorded in the Kalba coast, which is adjacent to the Omani border in the north of the UAE by Environment and Protected Areas Authority in Sharjah (pers. comm). In addition, the occurrence of a toxic diatom Pseudo-nitzschia sp. was reported recently in Yas Bay, Abu Dhabi (Rajan et al., 2022) implying that there is an increasing danger of red tides in the UAE coast.
Recently, abundance and distribution of phytoplankton in response to the changes in water quality parameters was studied in the Saudi Arabian coastal area by El Gammal et al. (2017). Diversity and distribution of winter phytoplankton in the Gulf and the adjacent Sea of Oman were investigated by Polikarpov et al. (2016) and along the UAE coast by Samara et al. (2023). The seasonal variation in phytoplankton diversity, composition and abundance in response to various environment parameters was studied in Dubai Creek (Murugesan et al., 2021b). The general productivity trends were investigated using remote sensing tools across the Arabian Gulf and the Sea of Oman (e.g., Abuelgasim and Alhosani, 2014; Al-Azri et al., 2010; Nezlin et al., 2010; Piontkovski et al., 2011; Sarma et al., 2012; Zhao and Ghedira, 2014).
This study contributed to a larger project focused on the ecological assessment of one of the largest oyster banks in the Gulf, as reported by Samara et al. (2023), and built upon recent findings on the significant decline of oyster habitats due to coastal urbanization in northern UAE (Selvan et al., 2025). The current study is one of only a few recent phytoplankton studies in the Gulf, and the first investigation of the northern UAE coast that focuses on the inter-seasonal phytoplankton change, which is an important ecological indicator that complements remote sensing-based habitat assessments.
In this study, the phytoplankton composition and inter-seasonal phytoplankton dynamics were analyzed together with a range of water chemistry parameters in the coastal areas of Sharjah, Ajman and Umm al Quwain to assess the impact of potential nearby pollution sources on phytoplankton abundance and composition and the influence of the red-tide species and potentially harmful taxa from the Gulf of Oman (e.g., Noctiluca scintillans) in this part of the UAE coast.
2 Materials and methods
2.1 Study area and sampling sites
The Gulf is a shallow, semi-open marginal sea with high evaporation rates and poor flushing conditions. It is known for its natural extreme conditions (e.g., in temperature and salinity) to which wildlife is adapted yet leaving near physiological limits (Hume et al., 2015; Riegl et al., 2012; Sheppard et al., 2010). Sampling was conducted at nine locations situated around the largest oyster bank in the UAE (Samara et al., 2023), in the vicinity of the Hamriyah port and in the waters of Sharjah, Ajman and Umm al Quwain (Figure 1). Table 1 shows summary characteristics of the sampling sites.
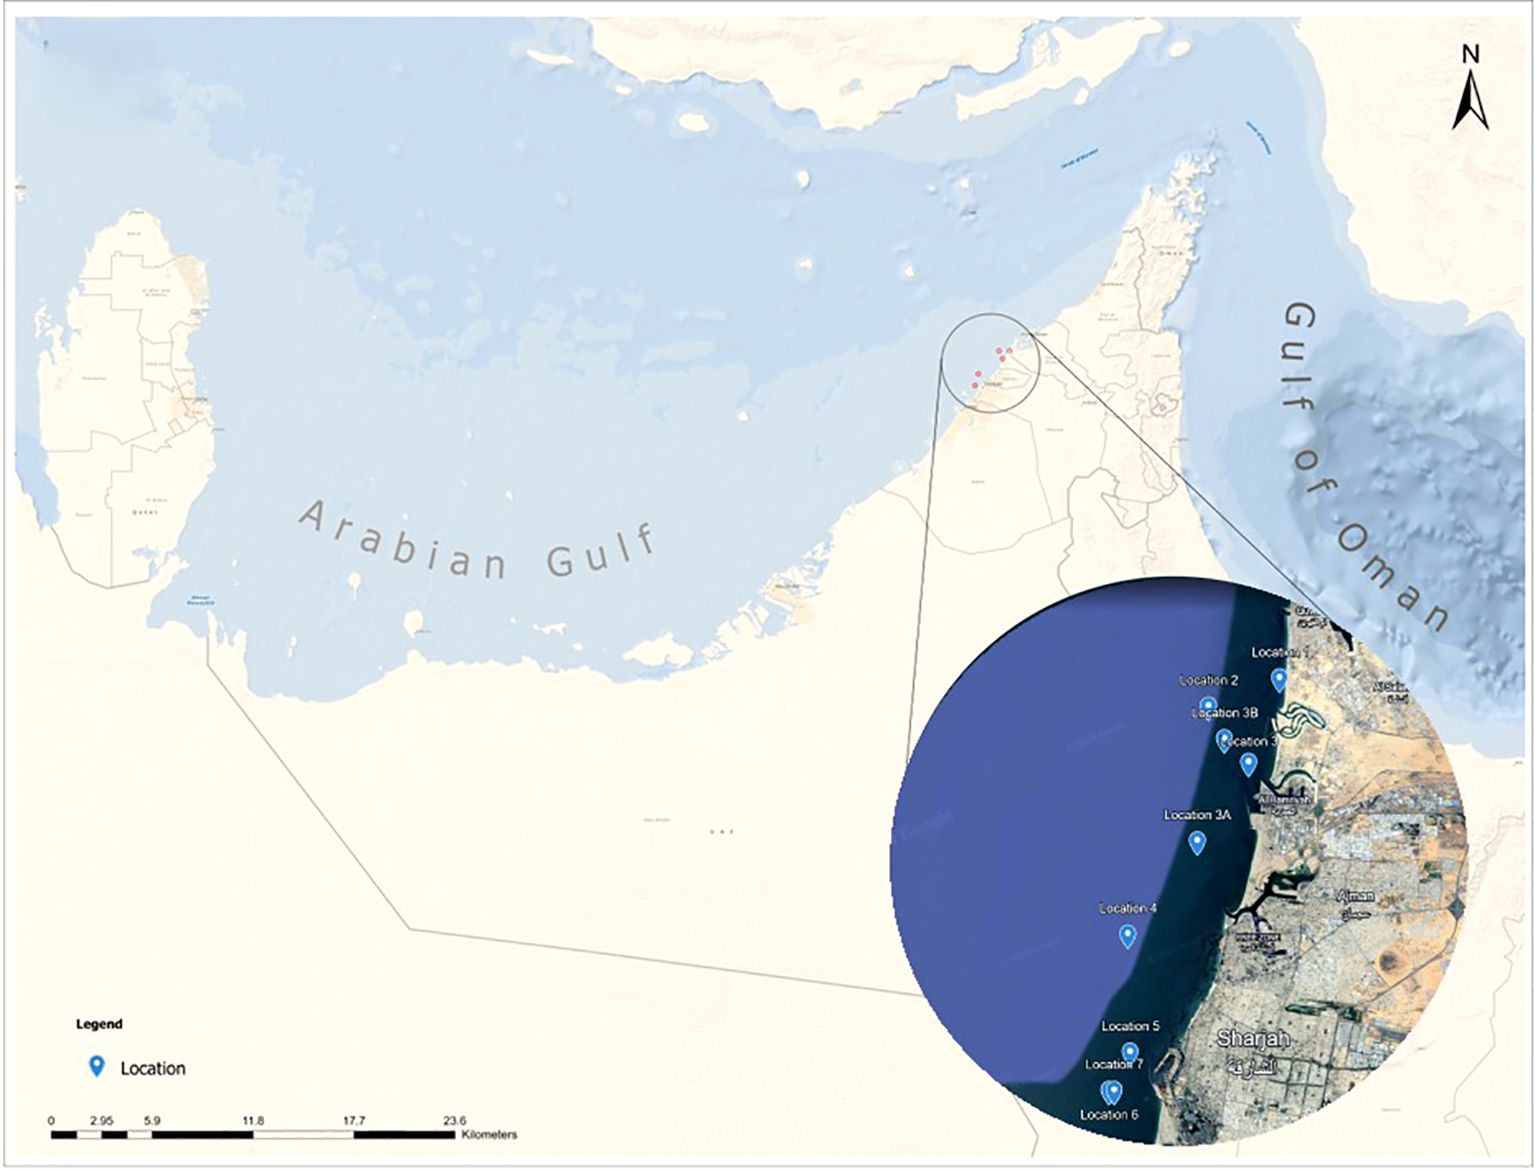
Figure 1. Map of the study area and sampling locations.
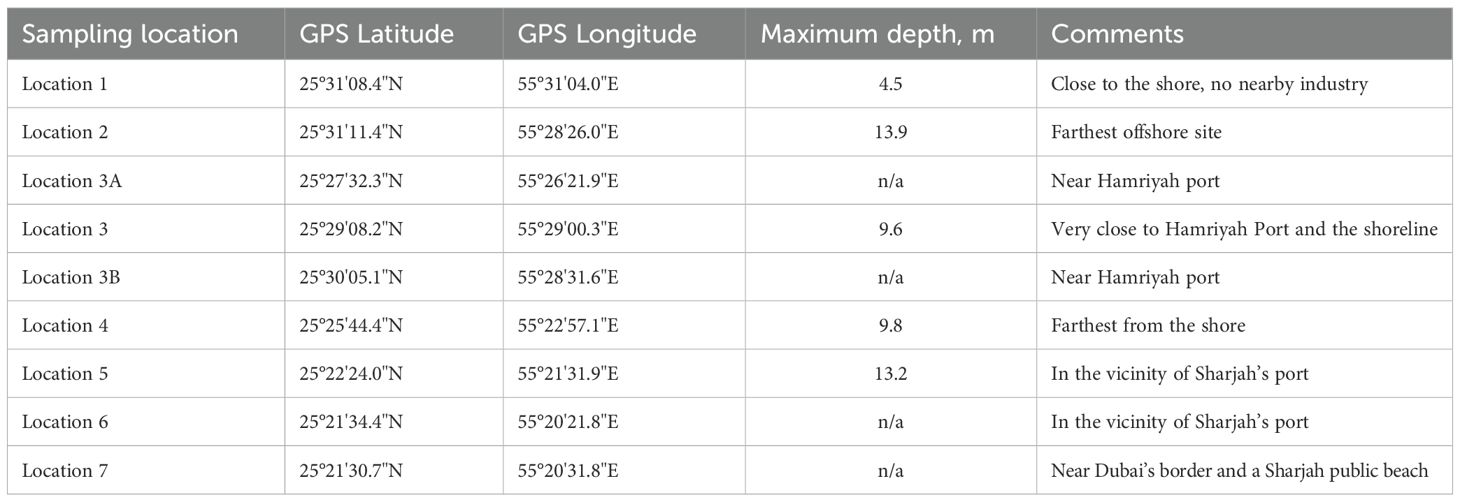
Table 1. Summary characteristics of the sampling locations.
2.2 Sample collection and preservation
Surface water samples were collected from nine oyster bed locations (Figure 1; Table 1) during four sampling collection trips: in January 2020, in May and November 2021, and in June 2022. Water samples were collected using a 5-liter PVC Niskin water sampler at about 1-meter depth from the surface.
Water samples for chemical analysis were collected in clean, high-density polypropylene bottles, stored on ice immediately after sampling, and transported to the laboratory within the same day. Upon arrival, samples were refrigerated at 4°C and analyzed within 24–48 hours based on the recommended holding times. Quality assurance and quality control (QA/QC) procedures followed APHA and USEPA protocols (APHA, 2017; USEPA, 1993a, USEPA, 1993b). These included daily instrument calibration with certified standards, use of procedural blanks, duplicate sample runs, and spike recovery tests during digestion procedures for total nitrogen and phosphorus. All reagents were of analytical grade, and all glassware used in the chemical analysis was acid-washed and rinsed with deionized water to minimize contamination.
Water samples for phytoplankton analysis were preserved with acidified Lugol’s solution (4% final concentration) on site. All samples were stored on polypropylene bottles and on ice until transported to the laboratory for further analysis.
2.3 Water chemistry analysis
The on-site water quality analysis was conducted using a waterproof portable logging multiparameter meter HI 9829 (Hanna Instruments, Singapore) to measure temperature, pH, salinity, turbidity, total dissolved solids (TDS), and oxidation-reduction potential (ORP) at the selected sampling locations during the period of January 2021-June 2022. These parameters were measured in accordance with APHA Standard Methods 2510 (Conductivity), 4500-H+ (pH), 2130 (Turbidity), and 2540C (TDS) (APHA, 2017). Additionally, at each location water samples were collected in polypropylene bottles on site and transported to the laboratory for further analysis. Chemical oxygen demand (COD) was tested using HI 83399 multiparameter photometer (Hanna Instruments, Singapore) with HI 93754C-25 HR high range COD reagent vials (0 to 15000 mg l-1 on a COD reactor and test tube heater HI 839800 preheated to 150 °C. This follows the USEPA Method 410.4 and APHA 5220 D (Closed Reflux, Colorimetric Method) (USEPA, 1993a). Total phosphorus (dissolved and particulate) was tested following the APHA 4500-P E (Ascorbic Acid Method, following digestion). A diluted sample of water in DI water was tested using HI 83399 multiparameter photometer (Hanna Instruments, Singapore) using HI 93758V phosphorus reagent vials (0.0 to 32.6 mg l-1), HI 93758C total phosphorus reagent C and HI93763B-0 total phosphorous high range reagent B (Hanna Instruments, Singapore). Similarly, total nitrogen was measured using the Hanna TN (total nitrogen) Analysis System (Hanna Instruments, Singapore) on a HI 83399 multiparameter photometer (Hanna Instruments, Singapore) with HI 9376767B (box 1) total nitrogen high-range digestion vials for 0 to 150 mg l-1 and HI 93766V (box 2) second reagent vials. This method is based on APHA 4500-N C (Persulfate Digestion Method) (APHA, 2017) or USEPA Method 351.2 (Colorimetric, Autoanalyzer or Manual) (USEPA, 1993b).
2.4 Phytoplankton identification, nomenclature and taxonomic protocols
Phytoplankton identification followed the regional guidebooks Al-Yamani and Saburova (2019a), Al-Yamani and Saburova (2019b). Taxonomy and nomenclature were based on AlgaeBase (Guiry and Guiry, 2025).
Species-level identification was done when possible; for small-sized (<10µm) or low-abundance taxa, identifications were recorded at the genus or group level. In particular, Prorocentrum spp. included three species: P. micans, P. triestinum, and P. gracile. Gyrodinium spp. comprised G. dominans, G. fusiforme, G. maculatum, and unidentified Gyrodinium sp. The Scrippsiella group included Scrippsiella trochoidea and several other unidentified Scrippsiella taxa. The Guinardia group included G. flaccida, G. delicatula, G. striata, and unidentified Guinardia sp. The Rhizosolenia group included Pseudosolenia calcar-avis, Rhizosolenia bergonii and unidentified Rhizosolenia sp.
To quantitatively analyze the phytoplankton abundance and species distribution, a 50 ml sub-sample was settled in Utermöhl sedimentation chamber (Utermöhl, 1958) for a minimum of 24 hours and later examined at x400 magnification using Leica DMIL inverted microscope (Leica Microsystems GmbH). Each sample was counted until about 400 counting units were reached (Lund et al., 1958). Cyanobacteria colonies were counted as one counting unit. Abundance of each taxon was calculated as the number of cells per liter.
2.5 Numerical and multivariate statistical analyses
All numerical analyses were conducted using CANOCO 5 ver. 1.2 (Šmilauer and Lepš, 2014). Only taxa with the occurrence at least at three locations at abundance >2% were included in the analysis. Overall, 31 sampling locations during four seasons and 27 major phytoplankton taxa were included in the analyses below.
Detrended Component Analysis (DCA) with detrending by segments was applied to estimate overall compositional change in the phytoplankton data alongside spatial and temporal gradients. As the gradient length of the phytoplankton data was 2.8 SD units, the unimodal analysis was chosen. The phytoplankton data were log-transformed and rare species were down-weighted. Phytoplankton diversity was measured using Simpsons’ diversity index (D) (Simpson, 1949). Phytoplankton species richness E(S) was calculated at a constant sample count (Birks and Line, 1992).
Canonical correspondence analysis (CCA) was used to examine the effect of environmental variables (water chemistry and water temperature) on the variation in the phytoplankton data. To assess the statistical significance of the first two canonical axes in the CCA, a Monte Carlo permutation test with 999 permutations was performed. Both CCA axis 1 and axis 2 were statistically significant, with p-values of 0.01 and 0.02, respectively (p < 0.05).
Phytoplankton composition at different sampling locations during different seasons was plotted using the program C2 ver. 1.4.3 (Juggins, 2005).
To assess differences in phytoplankton composition and abundance among four seasons (November, January, May and June), a non-parametric multivariate analysis was conducted using Bray-Curtis dissimilarity and permutational multivariate analysis of variance (PERMANOVA). The data were square-root transformed prior to analysis to reduce the influence of dominant taxa (taxa occurring at ≥ 2% abundance in at least 3 samples) and to stabilize variances. Bray-Curtis dissimilarity was calculated between all pairs of seasonal samples using the pdist function (SciPy v1.11), which quantifies compositional differences based on abundance data. Seasonal differences in phytoplankton composition and abundance between January and June were significant at p < 0.05 as determined by the PERMANOVA analysis.
The resulting dissimilarity matrix was visualized as a heatmap using Seaborn to illustrate seasonal contrasts in overall community composition.
To statistically test for significant seasonal variation in phytoplankton composition and abundance, PERMANOVA was performed using the permanova function from the scikit-bio library (v0.5.8). The analysis was conducted on the Bray-Curtis dissimilarity matrix with 999 permutations to assess the effect of season as a grouping variable. A significance threshold of α = 0.05 was used to determine whether seasonal differences in community composition were statistically significant. All analyses were performed in Python (v3.10) within a Google Colab environment to ensure reproducibility and computational efficiency.
3 Results
3.1 Water chemistry
The results of the water quality parameters measured on-site including temperature, pH, turbidity, oxidation-reduction potential (ORP), dissolved oxygen (DO), and salinity, as well as the parameters measured in the laboratory including COD, nitrates and phosphates are shown in Table 2. Seasonally, the average water temperature was found to range from 21.73°C in January to 33.52°C in June. Salinity was lower (37.61) in the autumn-winter period (November and January) than in spring and summer months, reaching a maximum of 40.49 in June. Maximum values of turbidity, nutrients, and COD were observed in November (Table 2). The measured average water quality parameters during the sampling period were within the regional standards for pH, temperature, DO, turbidity and salinity.
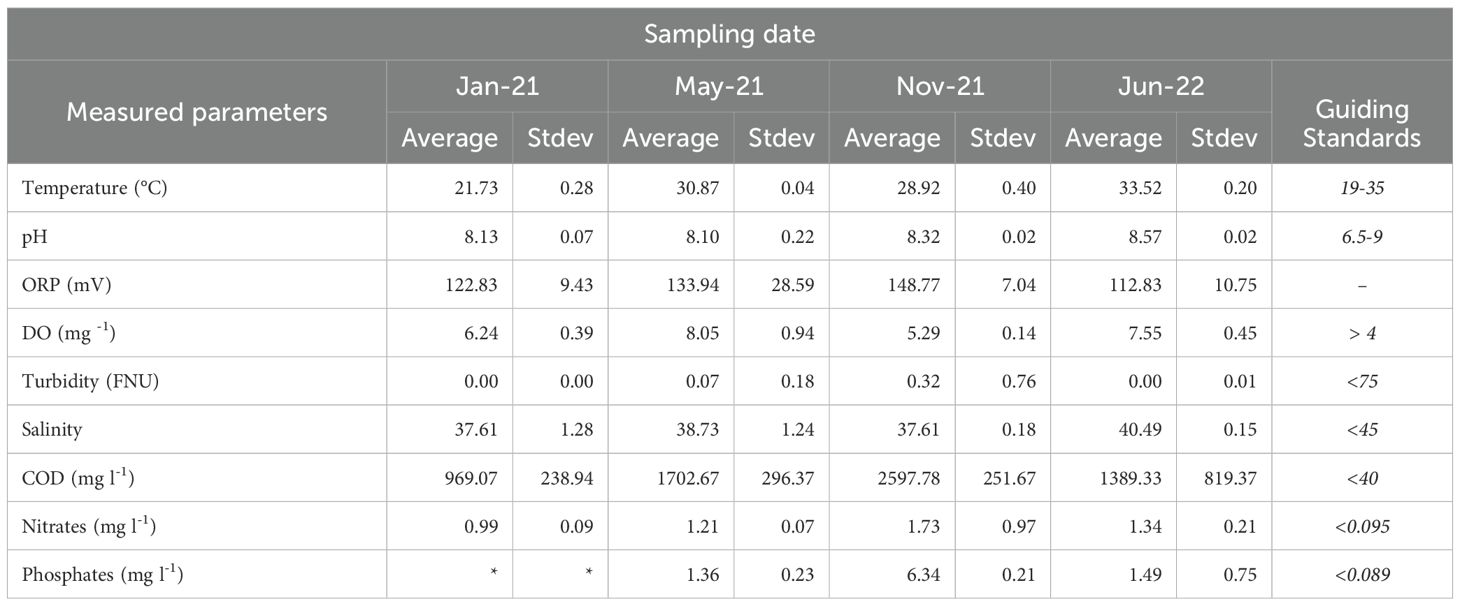
Table 2. Selected water chemistry parameters measured during the study period.
3.2 Inter-seasonal dynamics of phytoplankton abundance and composition
In the study area, the phytoplankton assemblages were dominated by diatoms, dinoflagellates, cyanobacteria and small cryptophytes, which in total comprised about 90% of phytoplankton abundance (Figure 2).
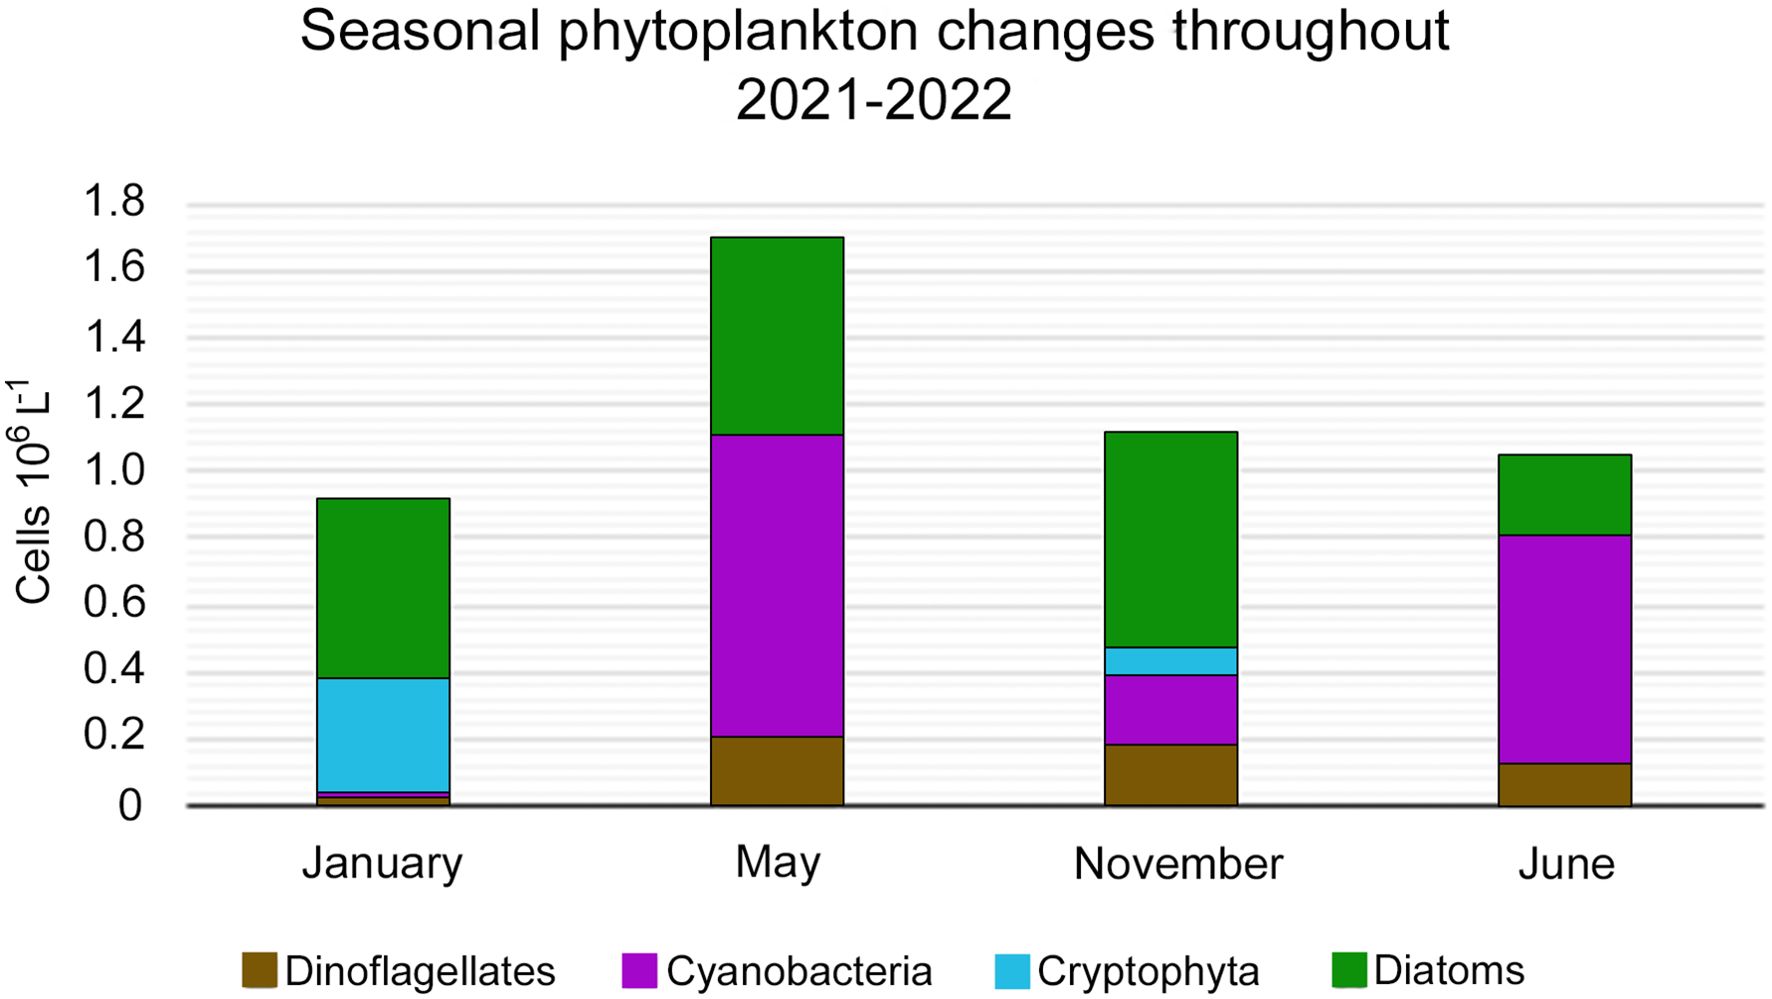
Figure 2. Average abundance (cells×106 l-1) of major phytoplankton groups diatoms, Cryptophyta, dinoflagellates, and cyanobacteria) during sampling season 2021-2022.
Overall, phytoplankton composition and abundance varied considerably between different seasons. During 2021, the total average abundance varied between the highest (1.69 ×10⁶ cells l-1) in May and the lowest in January (0.90×10⁶ cells l-1). Total average phytoplankton abundance was characterized by similar values in June and November (1.04 and 1.11×10⁶ cells l-1, respectively). Cyanobacteria (mainly Planktolyngbya sp.) prevailed in the phytoplankton assemblages in May and June (0.90 and 0.67×10⁶ cells l-1, respectively), whereas their abundance gradually decreased during colder months in November (0.21×10⁶ cells l-1) and in January (0.013×10⁶ cells l-1).
Variations in the diatom abundance were less pronounced compared to cyanobacteria, with the highest abundance occurring in November (0.63×10⁶ cells l-1) followed by January (0.51×10⁶ cells l-1) and May (0.59×10⁶ cells l-1). The lowest diatom abundance occurred in June (0.24×10⁶ cells l-1).
Dinoflagellates occurred at similar abundance in May, June, and November (0.13-0.20×10⁶ cells l-1). In January, the lowest abundance of this group (0.023×10⁶ cells l-1) was observed. Cryptophytes occurred only during the cooler months, in November (0.09×10⁶ cells l-1) and, at a higher abundance, in January (0.35×10⁶ cells l-1).
Figure 3 illustrates the inter-seasonal phytoplankton compositional dynamics and largely confirms the findings from Figure 2. For example, species diversity and species richness were considerably higher during the cooler season (November and January) compared to the warmer season (May and June). Higher diversity and richness in November and January were based on the higher diatom diversity and the presence of Cryptophyte taxa during this period (Figure 3).
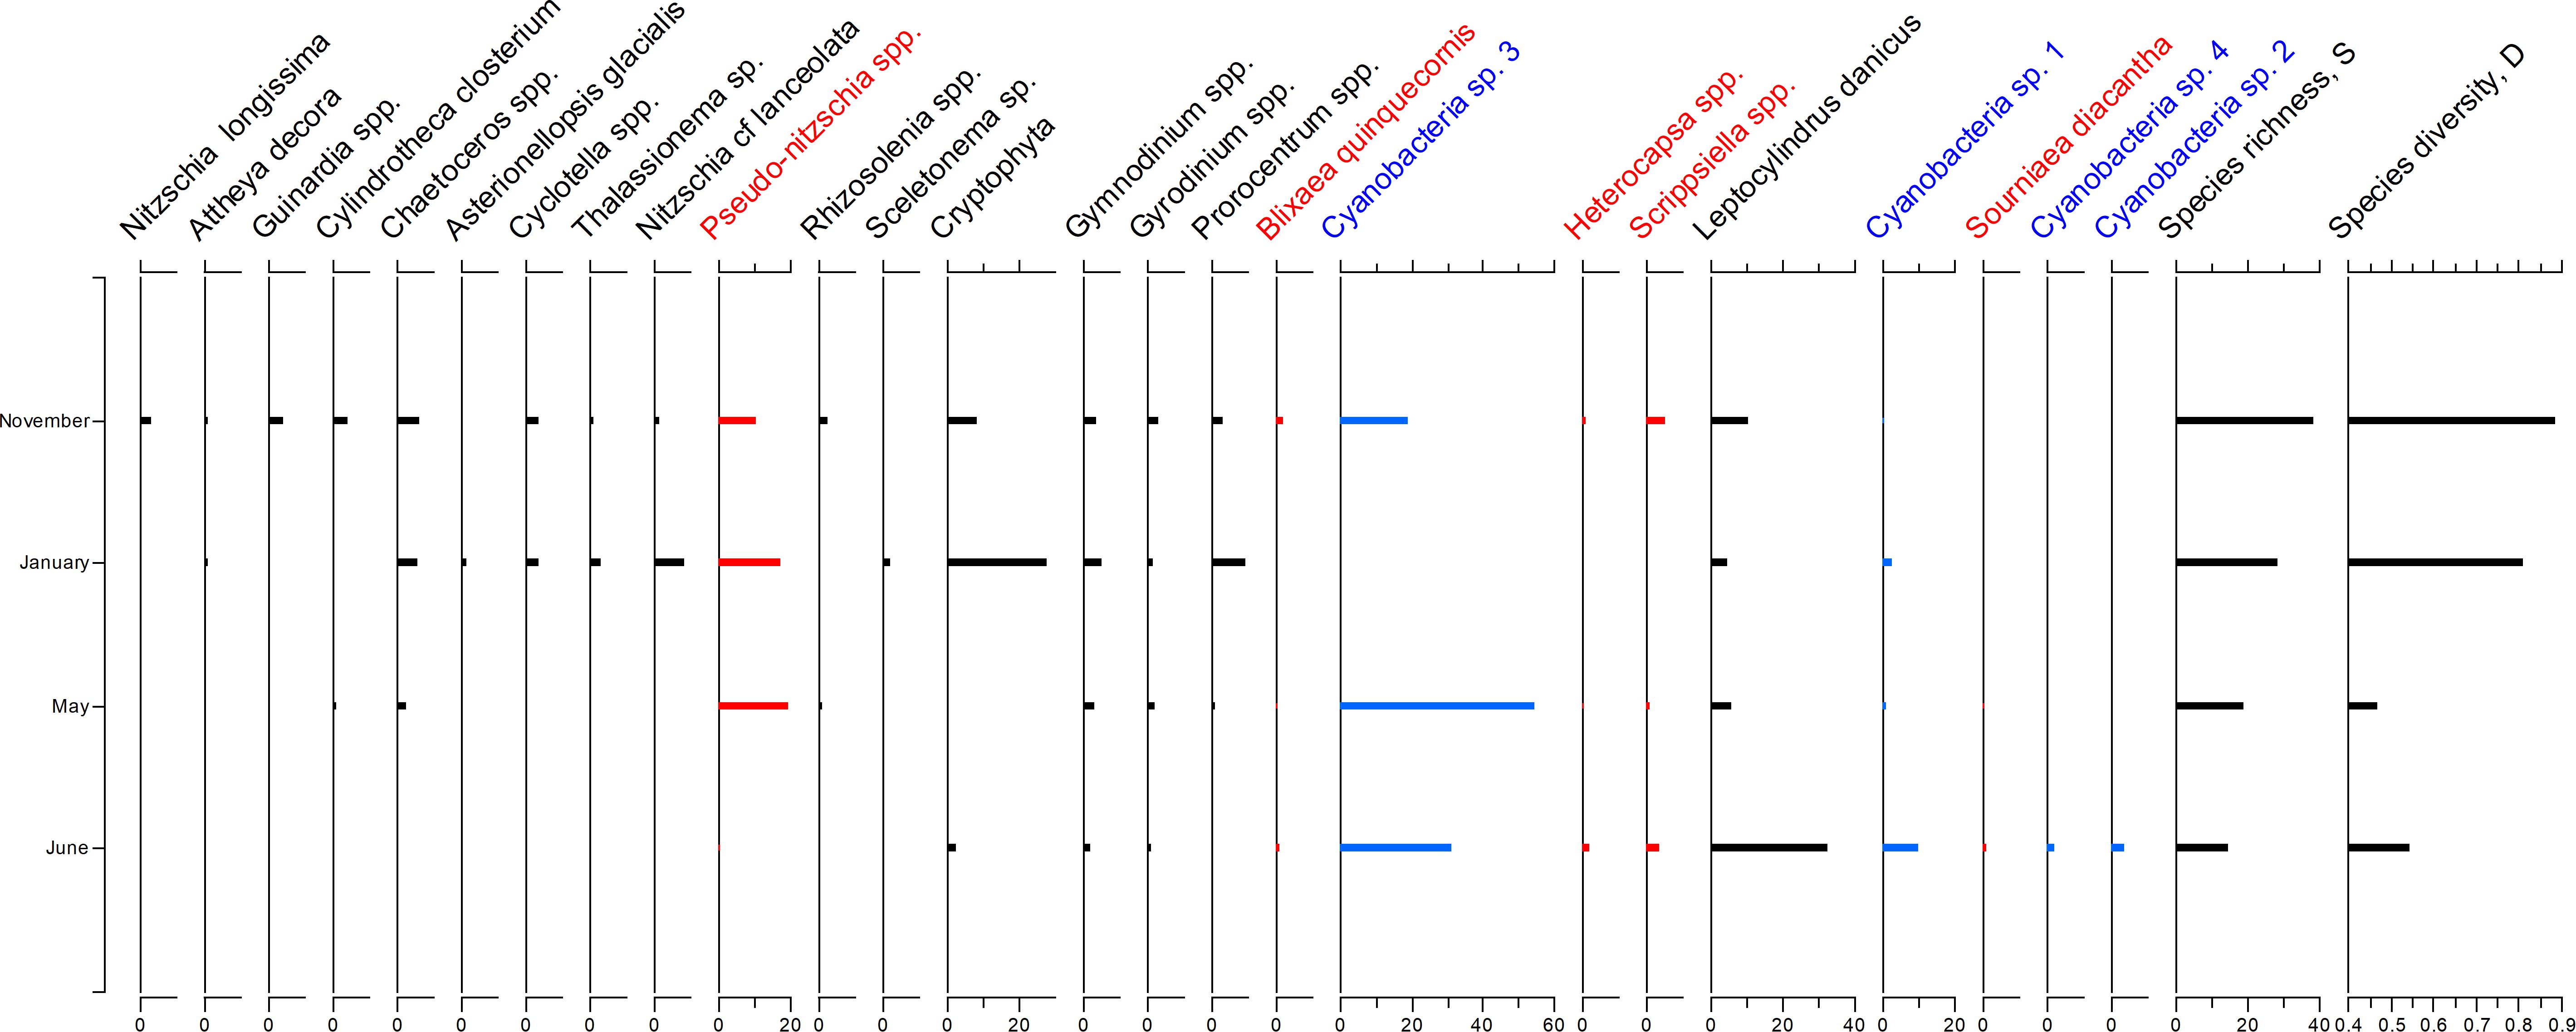
Figure 3. Relative abundance of selected phytoplankton species and groups during November, January, May and June. The species were arranged along the weighted averaging gradient to highlight the compositional differences between sampling locations. Potentially harmful dinoflagellates and diatoms were highlighted in red, cyanobacteria were shown in blue.
At the same time, cyanobacteria prevailed during warmer months, becoming a dominant group in June. Potentially toxic Pseudo-nitzschia taxa occurred at a relatively high abundance throughout all sampled months except for June (up to 20% in January and May and at c. 8 % in November). Potentially bloom-forming dinoflagellates (e.g., Heterocapsa spp., Scrippsiella spp. and Sourniaea diacantha) showed slightly elevated abundance in November and June (up to 3%), with Blixaea quinquecornis occurring only in November. However, the abundance of other dinoflagellate taxa (e.g., Gymnodinium., Gyrodinium, and Prorocentrum) exhibited no clear seasonality.
3.3 Inter-spatial and inter-seasonal variations in the phytoplankton composition and abundance
Surprisingly, the variations in phytoplankton composition and abundance were quite significant between different sampling locations (Figure 4). In summer months (May 2021 and June 2022), cyanobacteria prevailed at most locations, which implies nutrient-enriched water. In January, the highest phytoplankton abundance occurred at locations 1 and 2, and it decreased considerably at locations 3, 4 and 5. A similar trend of lower abundance in locations 4 to 5–7 is seen in summer phytoplankton in June (Figure 4D). The phytoplankton abundance varied considerably even within a very short distance between locations (e.g., see phytoplankton abundance at locations 3 and 3b in June 2022, Figure 4D). Locations 5 and 7 also showed lower phytoplankton abundance in May 2021 (Figure 4B). In November 2021 (Figure 4C), most locations showed similar phytoplankton concentrations, except for considerably lower values at location 2 (0.3×10⁶ cells l-1) and higher values at location 4 (2.2×10⁶ cells l-1).
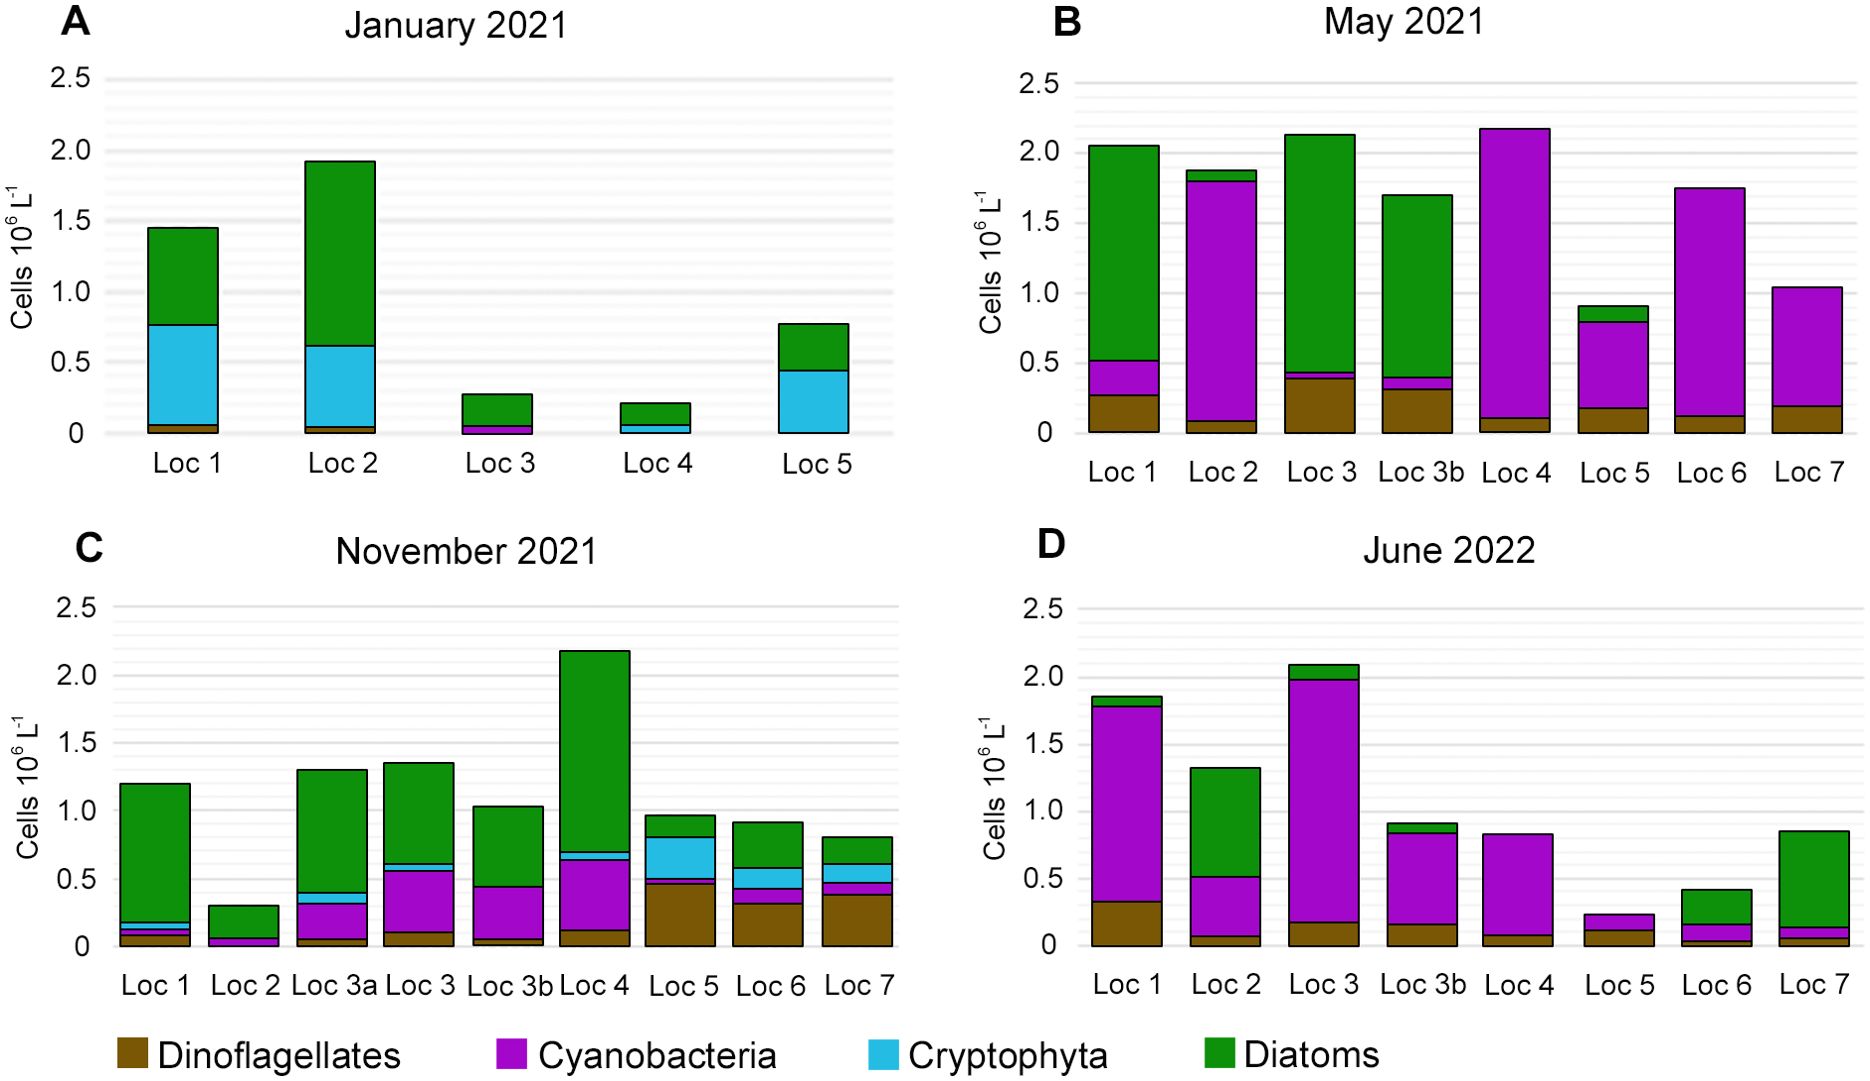
Figure 4. Abundance (×106 cells l-1) of major phytoplankton groups at all sampling locations in January 2021 (A); May 2021 (B); November 2021 (C) and June 2022 (D).
Species composition also varied quite considerably between different locations during four seasons, especially during warmer seasons in May 2021 and June 2022. Several locations were completely dominated by cyanobacteria (locations 2, 4–7 in May 2021 and locations 1, 3, 3b and 4 in June 2022).
Overall, November and January phytoplankton had a higher share of diatoms, which occurred at all locations. Cryptophycean taxa occurred at four out of five locations in January, comprising up to a third of all phytoplankton taxa for this season (Figure 4A).
Figure 5 illustrates the distribution of selected phytoplankton species and groups in November. During this month, the species diversity (D) and species richness (S) were the highest and we used the November phytoplankton relative abundance to highlight the variability of phytoplankton between different sampling locations.
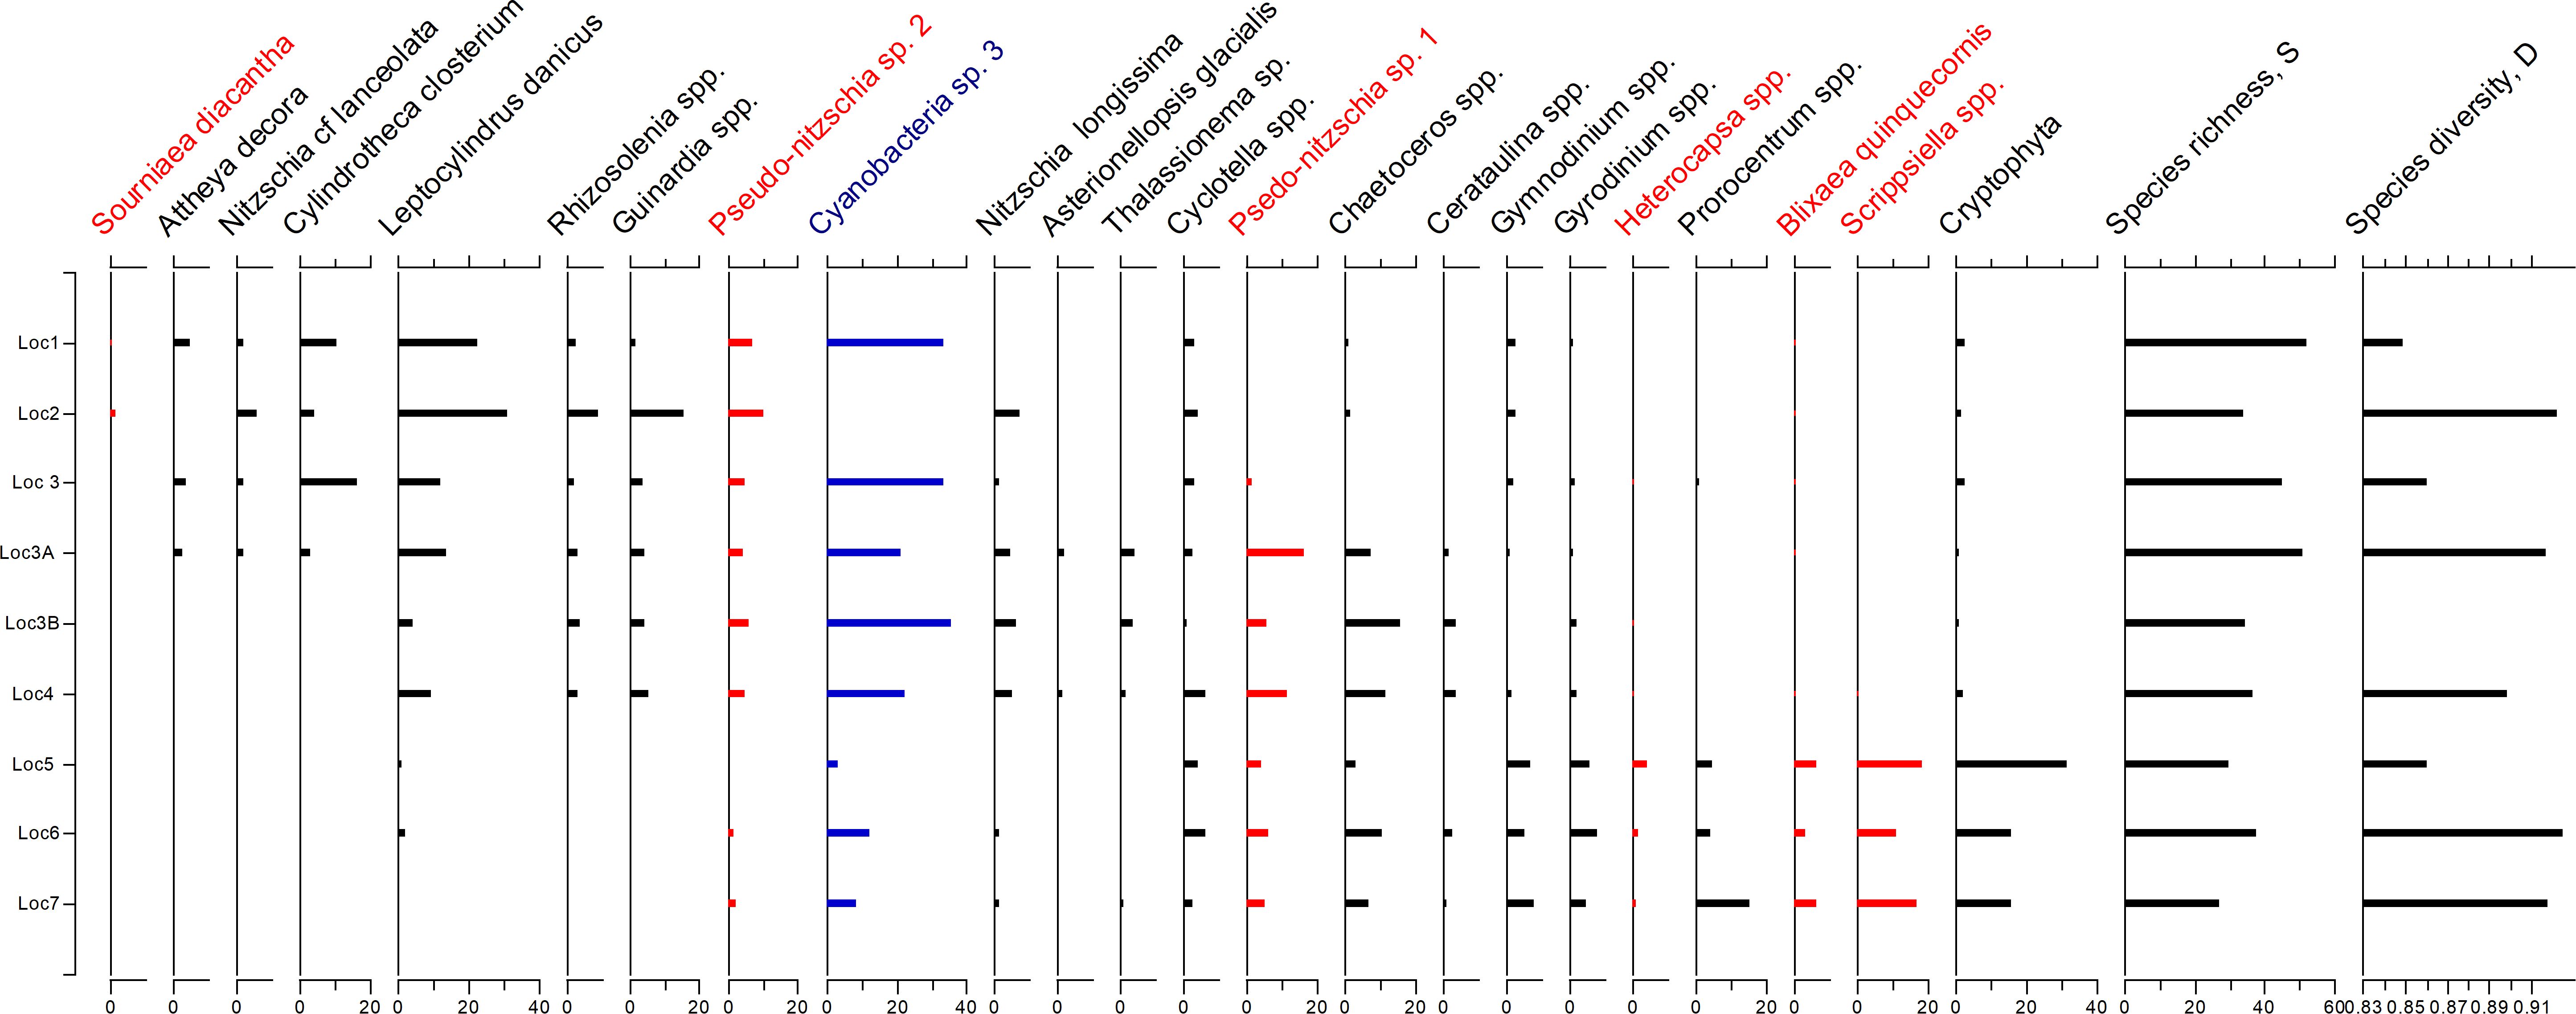
Figure 5. Relative abundance of selected phytoplankton species and groups at all sampling locations in November 2021. The species were arranged along the weighted averaging gradient to highlight the compositional differences between sampling locations. Potentially harmful dinoflagellates and diatoms were highlighted in red, cyanobacteria group was shown in blue.
In November, the species composition at locations 1–4 was quite different from the phytoplankton composition at locations 5-7, with a range of diatom species (e.g., Attheya decora, Cylindrotheca closterium, Leptocylindrus danicus) together with Cyanobacteria sp. 3 prevailing in locations 1–4 and dinoflagellate taxa (Gymnodinium spp., Gyrodinium spp., Heterocapsa spp., Scrippsiella spp.) dominating phytoplankton assemblages in locations 5-7. Potentially toxic Pseudo-nitzschia taxa were present at all stations (Figure 5). Three dinoflagellate taxa that potentially can cause harmful algal blooms (HABs) were present at locations 5-7. Heterocapsa spp. occurred at 1.1–4.46 %, Blixaea quinquecornis at 3–6%, and Scrippsiella spp. at 11–18% of the total phytoplankton abundance, while they were absent from locations 1-4. Sourniaea diacantha is the only potentially bloom-forming dinoflagellate which was present at locations 1 and 2 albeit at a low abundance.
Figures 6A (samples are shown) and 6B (species are shown) display the results of the DCA with the phytoplankton data centered by samples (see Table 3 for the summary statistics of the DCA). DCA axes 1 and 2 together explain 36.78% variance in the phytoplankton data (Table 3). DCA clearly separates all samples into three groups (Figure 6). Group I comprises most of May and June samples, which were dominated by several cyanobacterial taxa (e.g., Trichodesmium erythraeum; Figure 7A), and had lower diversity compared to autumn and winter phytoplankton (Figures 3, 6B). Group II unites some of November and all of January samples. Group II has the highest diversity and abundance of diatoms (e.g., diatom Thalassiosira hendeyi, Figures 7J, K and potentially toxic Pseudo-nitzschia sp., Figures 7L, M) and cryptophytes. One summer sample, L4 Jun, is also a part of group II; this is an outlier sample with a relatively high abundance of several potentially harmful dinoflagellates: Heterocapsa sp., Scrippsiella sp. (Figure 7F) and Blixaea quinquecornis (Figure 7E); which were absent from the spring-summer samples in group I (Figure 6B).
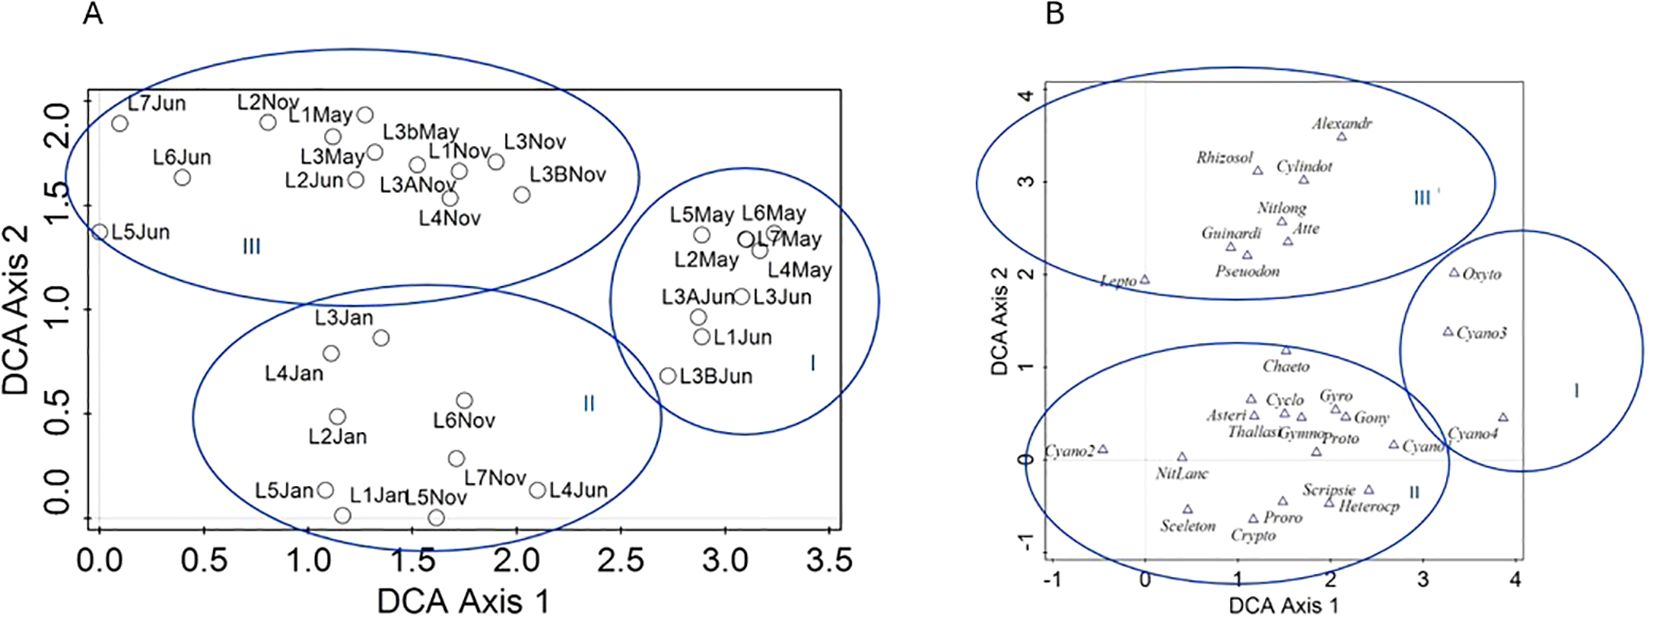
Figure 6. Detrended Correspondence Analysis (DCA) biplot (DCA axes 1 and 2) showing the variance in species composition centered on sampling locations (L); sampling locations are shown as small black circles in panel (A) and corresponding species are shown in panel (B) as blue triangles. Blue circles highlight DCA-based groups I, II and III. Full species names are given in Appendix 1.
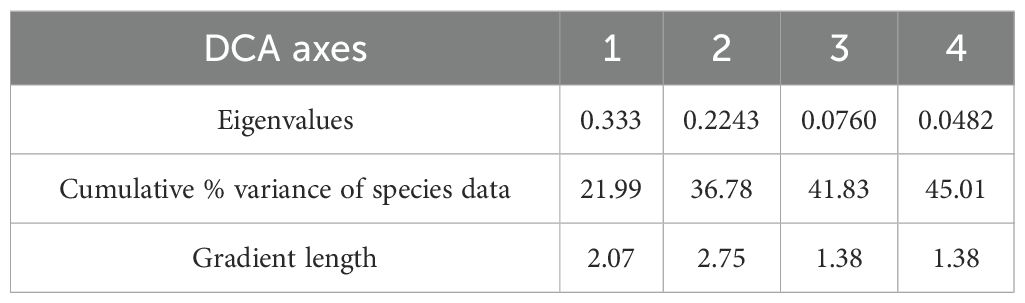
Table 3. The summary statistics of DCA with phytoplankton data.
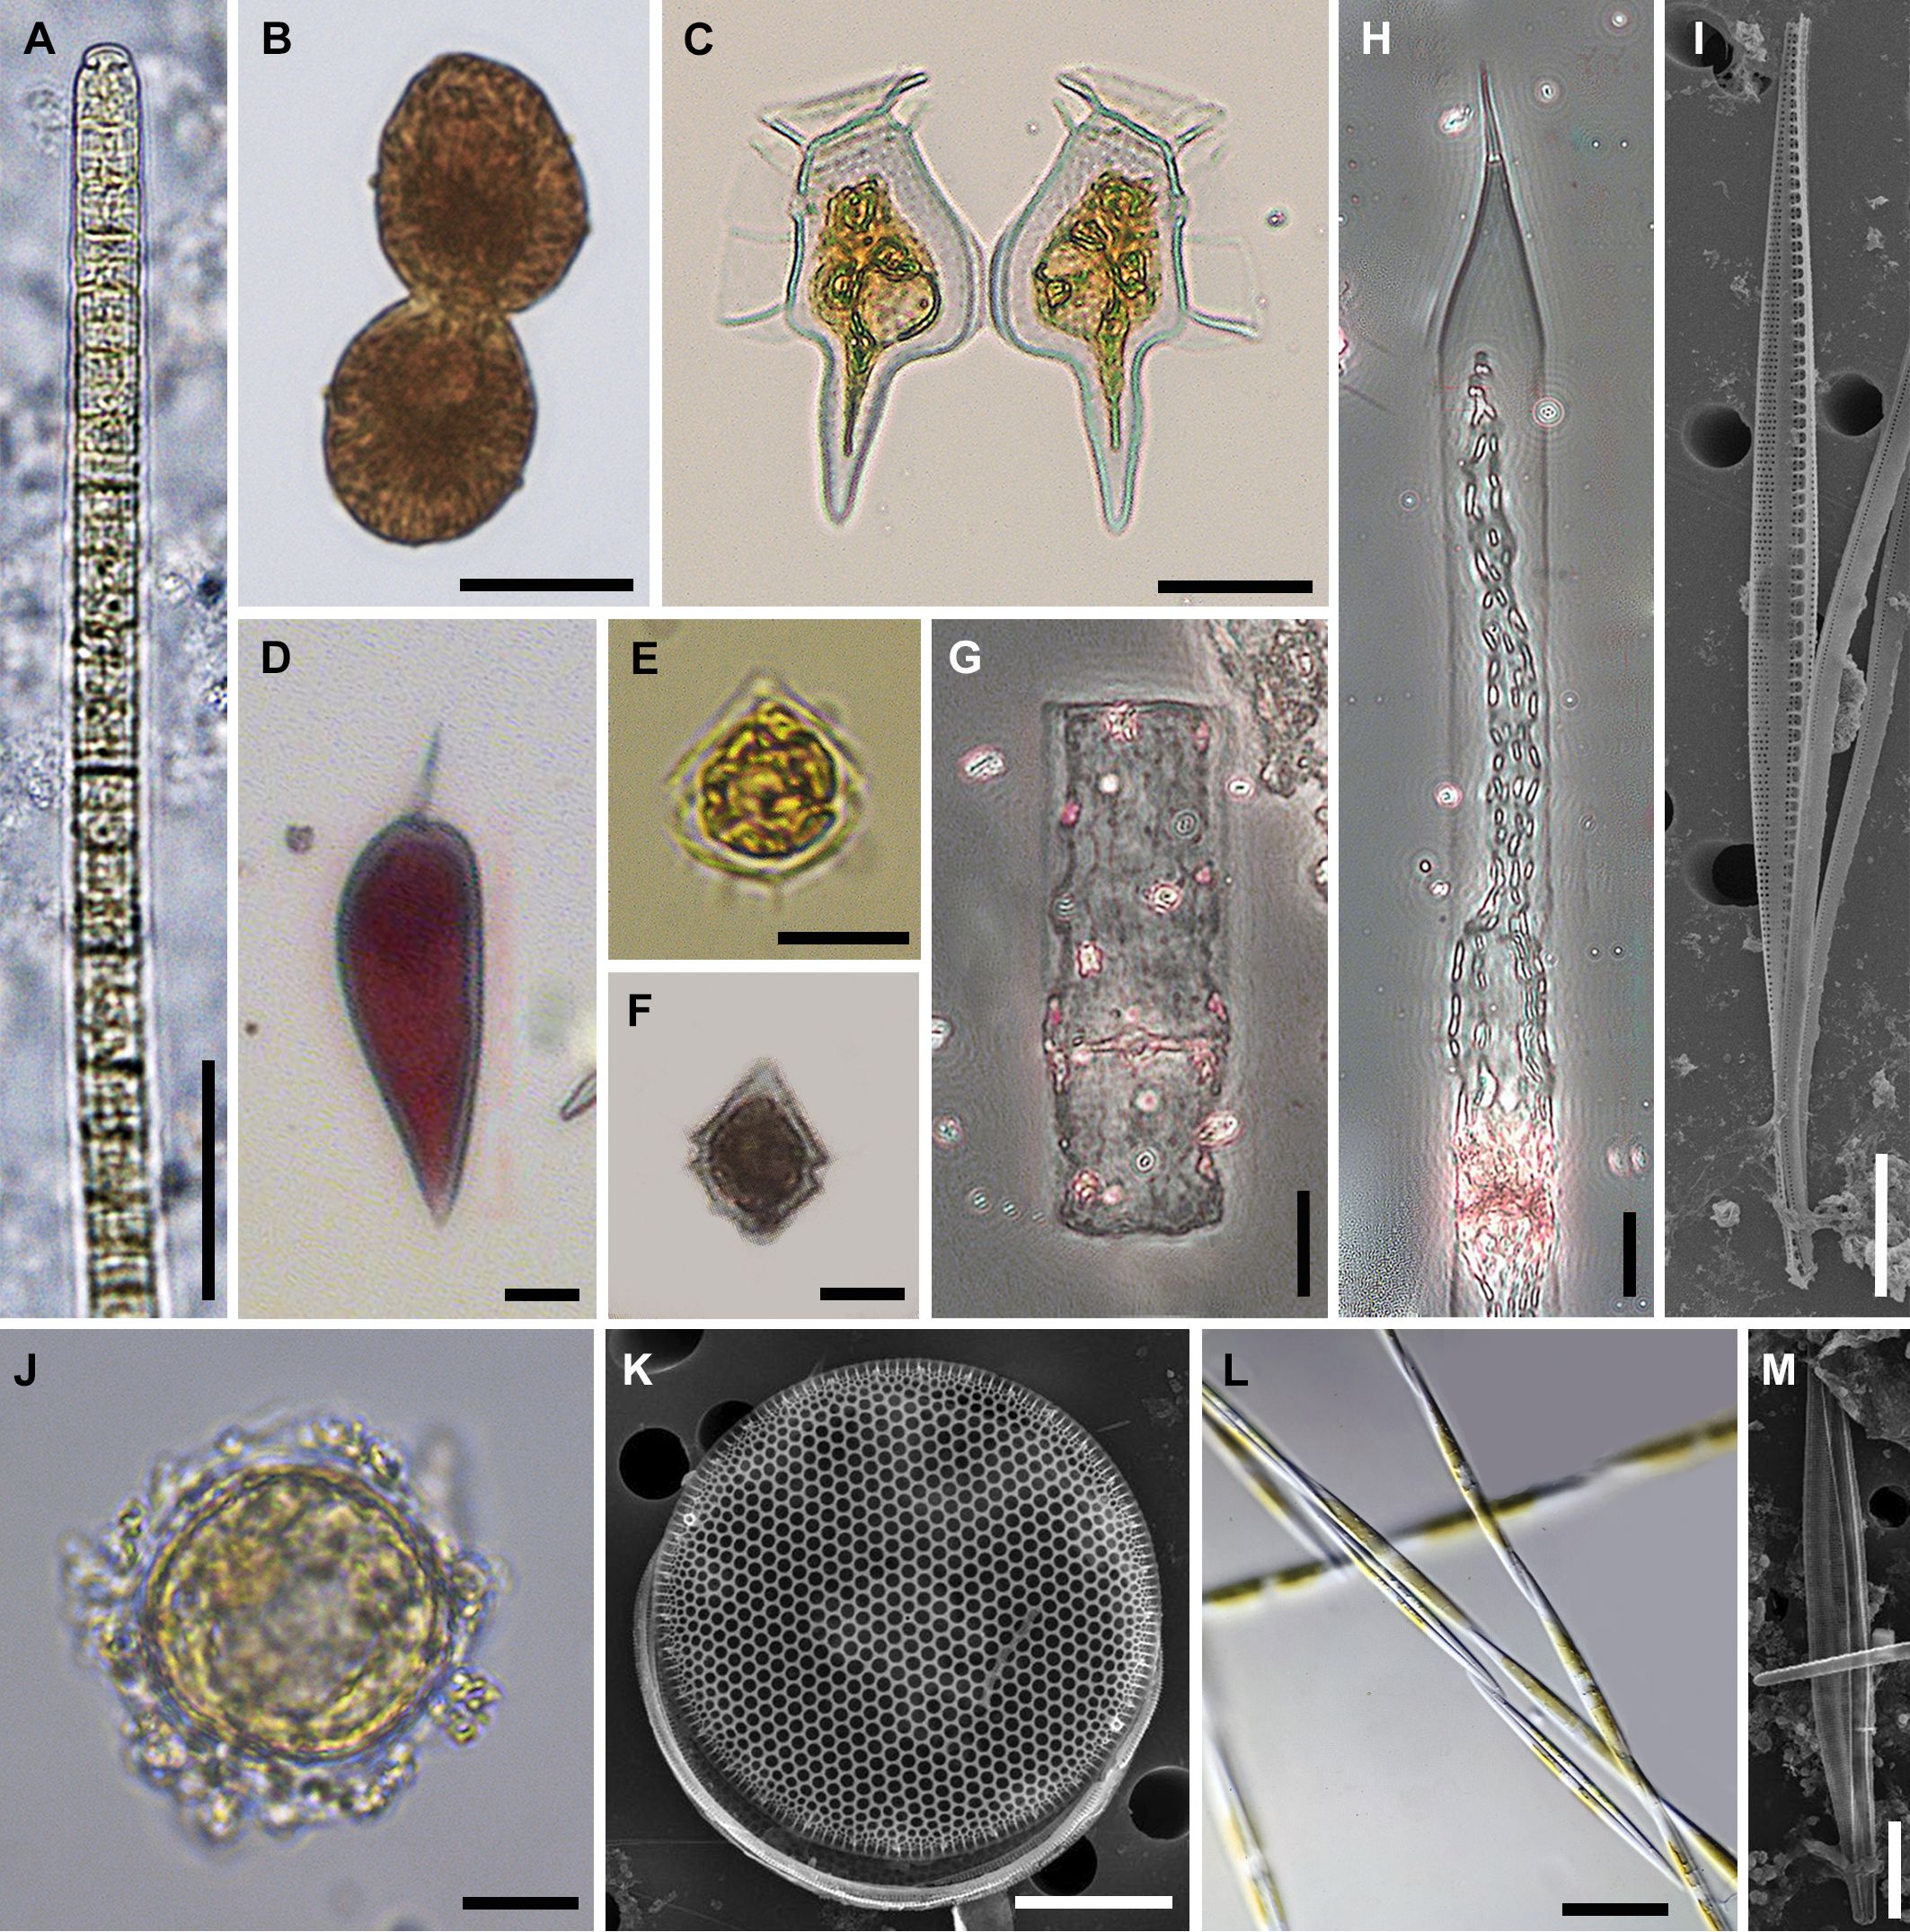
Figure 7. Common phytoplankton species encountered in the study area between 2021 and 2022. (A) cyanobacterium Trichodesmium erythraeum; (B) potentially harmful dinoflagellate Margalefidinium polykrikoides; (C) potentially harmful dinoflagellate Dinophysis caudata from November samples; (D) dinoflagellate Prorocentrum gracile; (E) potentially harmful dinoflagellate Blixaea quinquecornis from November samples; (F) potentially harmful dinoflagellate Scrippsiella sp. from November samples; (G) diatom Guinardia flaccida; (H) diatom Pseudosolenia calcar-avis; (I) diatom Nitzschia incurva; (J, K) diatom Thalassiosira hendeyi; (L, M) potentially toxic diatom Pseudo-nitzschia sp. from January samples; scale bars: (A-F, I-K, M), 10 µm; (G, H, L) 20 µm.
Group III is the most heterogeneous, encompassing several November, May and June samples. Group III unites samples by their location, e.g. all May and November samples from L1 and L3 are placed in group III. These locations were characterized by a high abundance of chain-forming quite silicified diatom taxa, e.g., Leptocylindrus danicus and Guinardia flaccida (Figure 7G).
Dissimilarity matrix visualized as a heatmap in Figure 8 broadly confirms the findings of DCA. The greatest dissimilarity in species abundance and composition, which was also statistically significant is between is between January and June samples, as illustrated by differences in DCA groups I and II in Figure 6.
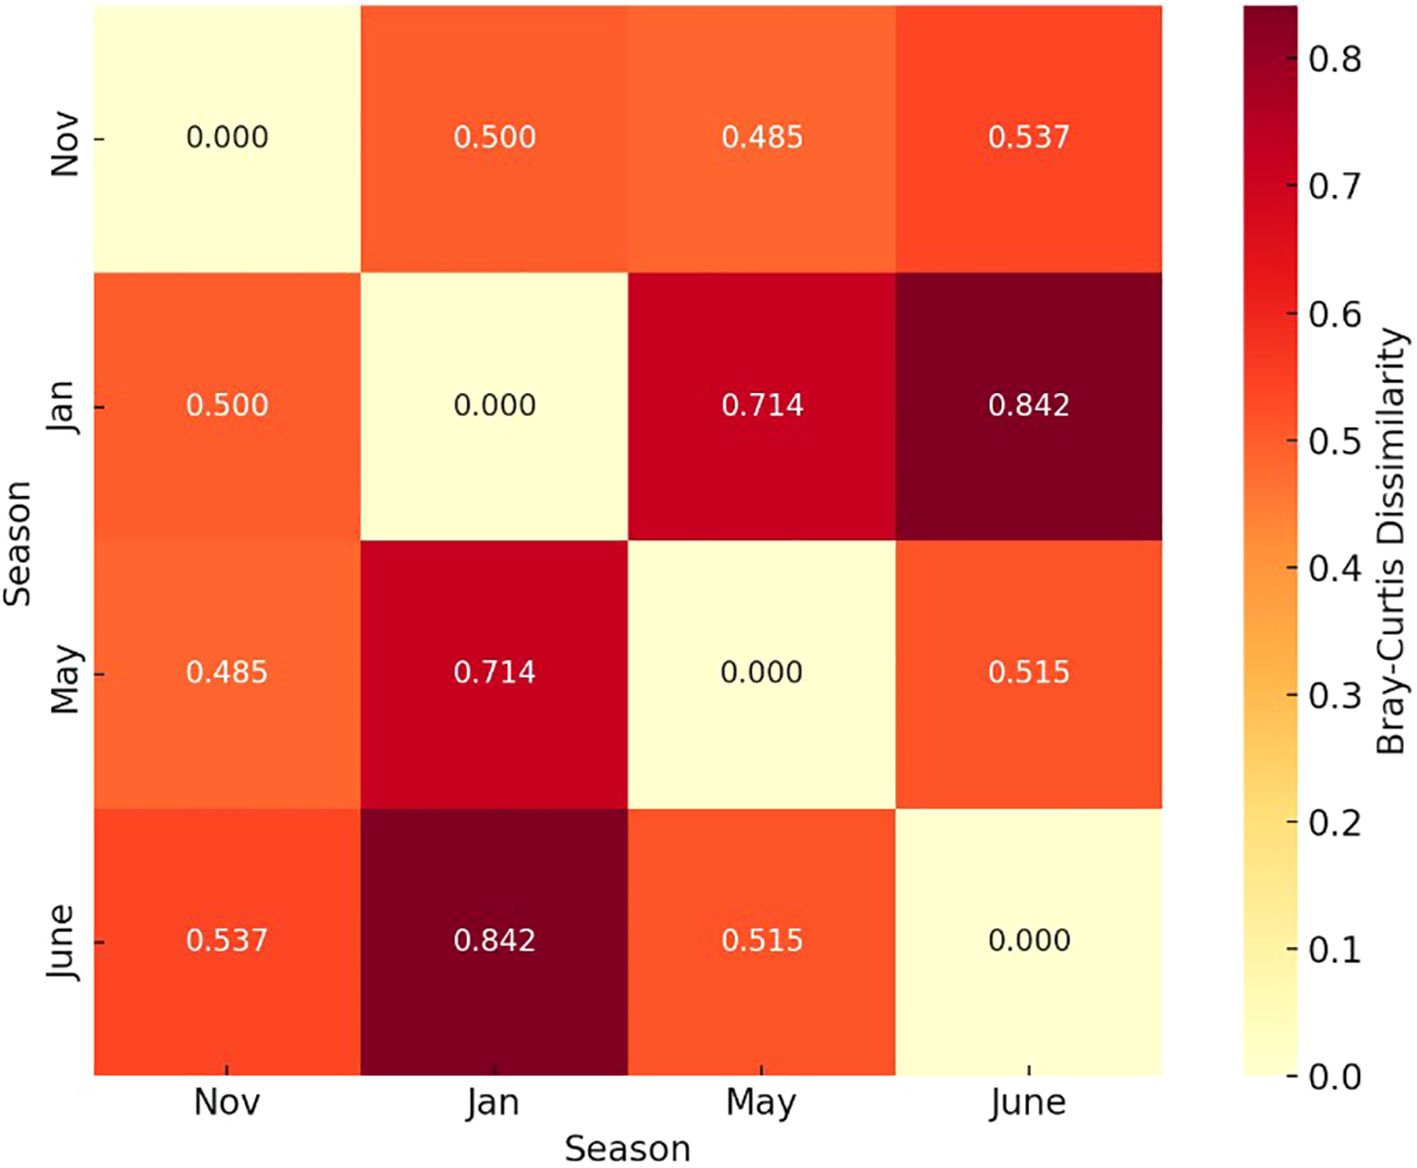
Figure 8. Dissimilarity matrix based on Bray-Curtis dissimilarity distances visualized as a heatmap to highlight seasonal contrasts in species composition and relative abundance. Seasonal differences in phytoplankton composition and abundance between January and June were significant at p < 0.05 as determined by the PERMANOVA analysis.
3.4 Phytoplankton and water chemistry
We attempted to analyze the relationship between phytoplankton composition changes and the measured water chemistry parameters using Canonical Correspondence analysis (CCA), Figure 9. The summary statistics of CCA is given in Table 4.
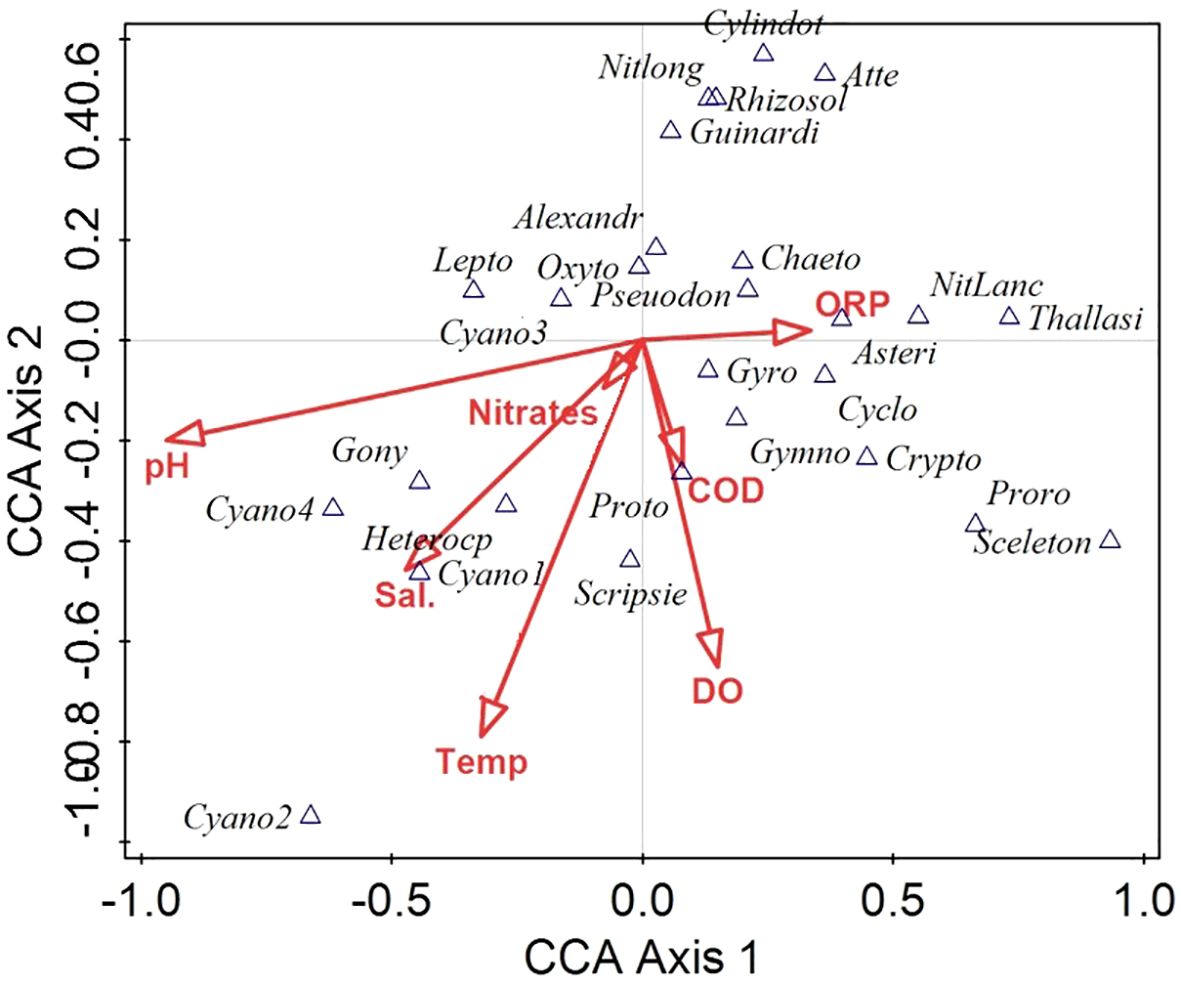
Figure 9. Canonical correspondence analysis (CCA) biplot (CCA axes 1 and 2) showing the influence of water chemistry variables (represented by red arrows) on the variation in phytoplankton data. Selected species shown as triangles; complete species names are provided in Appendix 1. Sal., salinity; Temp., temperature.
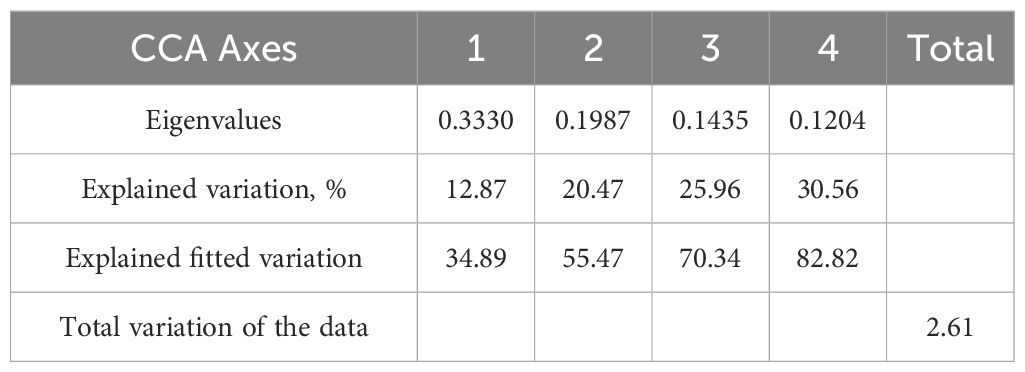
Table 4. The summary statistics of CCA of phytoplankton and water chemistry variables.
The CCA revealed distinct relationships between phytoplankton species composition and water chemistry variables across the sampling locations. The first four canonical axes accounted for 30.56% of the total variation in species data, with the first two axes (Axis 1 and Axis 2) explaining 12.87% and 7.60%, respectively. When considering only the fitted variation, Axis 1 explained 34.89%, and Axis 2 explained 20.58%, cumulatively accounting for 55.47% of the constrained species–environment relationship.
The CCA biplot (Figure 9) based on axes 1 and 2 demonstrated that temperature (Temp), dissolved oxygen (DO), chemical oxygen demand (COD), and oxidation-reduction potential (ORP) are the dominant environmental gradients influencing phytoplankton distribution, with long vector lengths indicating strong correlations. Changes in temperature, DO and salinity were associated with several cyanobacterial taxa (Cyano 1 and 2 types), and some potentially harmful dinoflagellates (e.g., Blixaea quinquecornis, Heterocapsa spp., and Scrippsiella spp.), which were most common for November and January (see Figure 3) and mostly characteristic of November-January phytoplankton DCA group II (Figure 6).
In contrast, pH acted in opposition to the other major environmental gradients, indicating that phytoplankton taxa like Cyanobacteria type 4 and Sourniaea diacantha may be more prevalent under lower pH conditions. ORP influences the distribution of several diatom taxa (e.g., Nizschia cf lanceolata, Skeletonema sp., Thalassiosira sp., and Asterionellopsis glacialis) together with dinoflagellates Prorocentrum spp., Gymnodinium spp., and Gyrodinium spp. Several species, such as diatoms Cylindrotheca sp., Rhizosolenia spp., and Guinardia spp. appeared in the upper-left quadrant, relatively distant from strong environmental vectors, implying that their distributions may have been influenced by unmeasured water chemistry variables (e.g. Si) or more complex ecological factors.
Cyanobacteria sp. 2 was distinctly isolated along the negative end of Axis 1 and Axis 2, suggesting unique ecological tolerances possibly associated with low salinity, low temperature, or other limiting conditions. In summary, the CCA results indicated that temperature, dissolved oxygen, and oxidative conditions were key drivers of phytoplankton community structure, with additional influence from pH, salinity, and nutrient availability.
4 Discussion
4.1 Water chemistry
The water chemistry results indicated that all of these parameters were above the acceptable parameters for marine waters reported by the UAE Ministry of Climate Change and Environment (MOCCAE) guidelines (MOCCAE, 2020).
When comparing water chemistry parameters from different sites (Appendix 2) it is clear that the discrepancies among the sites were not significant. The results also depicted that as temperature increases, salinity increases as well. In marine ecosystems, temperature and salinity are interconnected and jointly influence seawater density, ocean currents, and the overall structure of the marine environment (Doney et al., 2012).
When comparing the water temperatures obtained in this study to those found by Al-Khayat and Al-Ansi (2008) in Qatari waters of the Arabian Gulf, their results ranged between 27.95°C and 29.90°C in November, which was similar to the temperatures recorded in all sampling sites reported in this study during the month of November ranging from 28.15–29.38°C. The same study reported an average pH measurement of 8.4, which is comparable to the average of 7.89–8.34 measured by this study. Furthermore, DO concentration ranged between 4.28–4.61 mg l-1, which is slightly lower than the range of DO (4.97–5.42 mg l-1) obtained in this study during the same month. Salinity values in Qatari waters ranged between 39.50 and 41.15, compared to which is higher than the salinity recorded in this study. Overall, the variation in the values of the water quality parameters may be attributed to the difference in location, proximity to coastal activity, and the seasons during which the sampling took place. Similarly, the study conducted by Samara et al. (2020) at Umm al Quwain mangroves, UAE during the month of April, found very similar surface water quality parameters as reported in this study during the month of May. The average pH, temperature and salinity measured for that region of the Arabian Gulf were 7.94, 30.36°C, and 37.68, respectively. The values are comparable to those measured in this study of 8.12, 30.87°C, and 38.82, respectively. In summary, in both studies very similar water quality parameter values were recorded, with little variation that is to be expected due to the proximity of their sampling locations to the ones used for this study.
It is well established that in marine ecosystems, temperature and dissolved oxygen (DO) levels are typically inversely related due to the reduced solubility of oxygen in warmer water (Song et al., 2019). However, in this study, we observed an unexpected positive correlation between temperature and DO, with higher DO concentrations recorded during the warmer months (Appendix 2). This anomaly may be explained by enhanced biological activity—specifically, increased photosynthetic rates by cyanobacteria and phytoplankton during periods of elevated temperature in late spring and summer. Under optimal conditions, photosynthesis can lead to localized oxygen supersaturation during daylight hours, offsetting the physical solubility decline (Mai et al., 2021). Furthermore, Hutchings et al. (2024) noted that in productive or eutrophic systems, oxygen dynamics are often governed more by biological processes than by temperature alone. Therefore, it is plausible that in our study area—characterized by seasonally elevated productivity and nutrient availability—the biological oxygen production during phytoplankton blooms may have overridden the typical thermal suppression of DO, resulting in the observed trend.
4.2 Phytoplankton
4.2.1 Seasonal dynamics of phytoplankton
The seasonal variations in phytoplankton abundance and composition observed in this study reflect the strong influence of temperature and associated water chemistry parameters in the Gulf’s coastal waters. Several cyanobacteria taxa, particularly Planktolyngbya and Trichodesmium erythraeum, dominated during the spring and summer months, coinciding with elevated temperatures, salinity, and nutrient concentrations. This agrees with other studies in the region and the Arabian Sea, where warm, nutrient-rich waters promote cyanobacterial blooms (Gomes et al., 2014; Polikarpov et al., 2020).
By contrast, diatoms were more abundant and diverse in the cooler months of January and November, suggesting their preference for lower temperatures and higher oxidative conditions. The dominance of Thalassiosira sp., Leptocylindrus danicus and Guinardia spp. during these months is consistent with seasonal phytoplankton cycles observed in adjacent waters (El Gammal et al., 2017; Polikarpov et al., 2016). Cryptophytes were also abundant during winter, indicating that cooler, more oxygenated water supports more diverse phytoplankton communities. In general, Simpson’s species diversity and species richness were considerably higher during the cooler season in November and January (Figure 3). Interestingly, that while there were clear seasonal differences in abundance and composition of diatoms, cyanobacteria and cryptophytes, dinoflagellates occurred at a relatively low numbers throughout all seasons only showing slight increase in June (Figures 2, 3). Unlike the evidence from Korean coastal waters (Lee et al., 2021), Gyrodinium spp. exhibited no clear seasonality or preference for warmer season. However, some potentially harmful bloom-forming dinoflagellates (e.g., Scrippsiella and Heterocapsa) showed slightly increased abundance in June. The observed seasonal succession pattern—from diatoms and cryptophytes in winter to cyanobacteria in summer—reflects known phytoplankton dynamics in stratified, nutrient-variable coastal systems (e.g., Demarcq et al., 2012; Longhurst, 1993). Transient silicon limitation may also play a role in the dominance of cyanobacteria in summer (Rocha et al., 2002). In winter, high levels of nitrogen and phosphorus support diverse phytoplankton dominated by diatoms and this leads to the decrease in silicate, which in turn leads to the decrease in diatoms and the increase in cyanobacteria. However, since Si was not measured in this study, its influence on the phytoplankton succession remains unconfirmed.
4.2.2 Spatial heterogeneity and anthropogenic pressure
Phytoplankton abundance and composition showed pronounced spatial variability, even across relatively short distances, reflecting the influence of localized environmental gradients and anthropogenic stressors. Locations adjacent to industrial and urbanized zones such as Locations 3, 3b, 5, and 7 consistently exhibited lower phytoplankton abundance and species richness. These areas are near Hamriyah and Sharjah ports, active dredging sites, and land reclamation zones, which are known to contribute to increased turbidity, altered hydrodynamics, nutrient runoff, and pollutant inputs (Selvan et al., 2025; Naser, 2013). Quantitatively, spatial differences were evident even at small to moderate scales. For example, Locations 3 and 3b, only 1.9 km apart, differed markedly in abundance during June 2022, with the latter showing significantly lower levels (see Appendix 3; Figure 10). Similarly, Locations 4 and 5 (6.6 km apart) differed in species richness and dominance. These contrasts may be driven by local changes in water circulation, oxygen dynamics (e.g., low DO and high COD at impacted sites), and light availability, all of which can suppress phytoplankton growth. These patterns are further illustrated in Figure 10, which maps phytoplankton abundance across the study area and highlights zones of anthropogenic influence such as port operations, dredging activity, and coastal development.
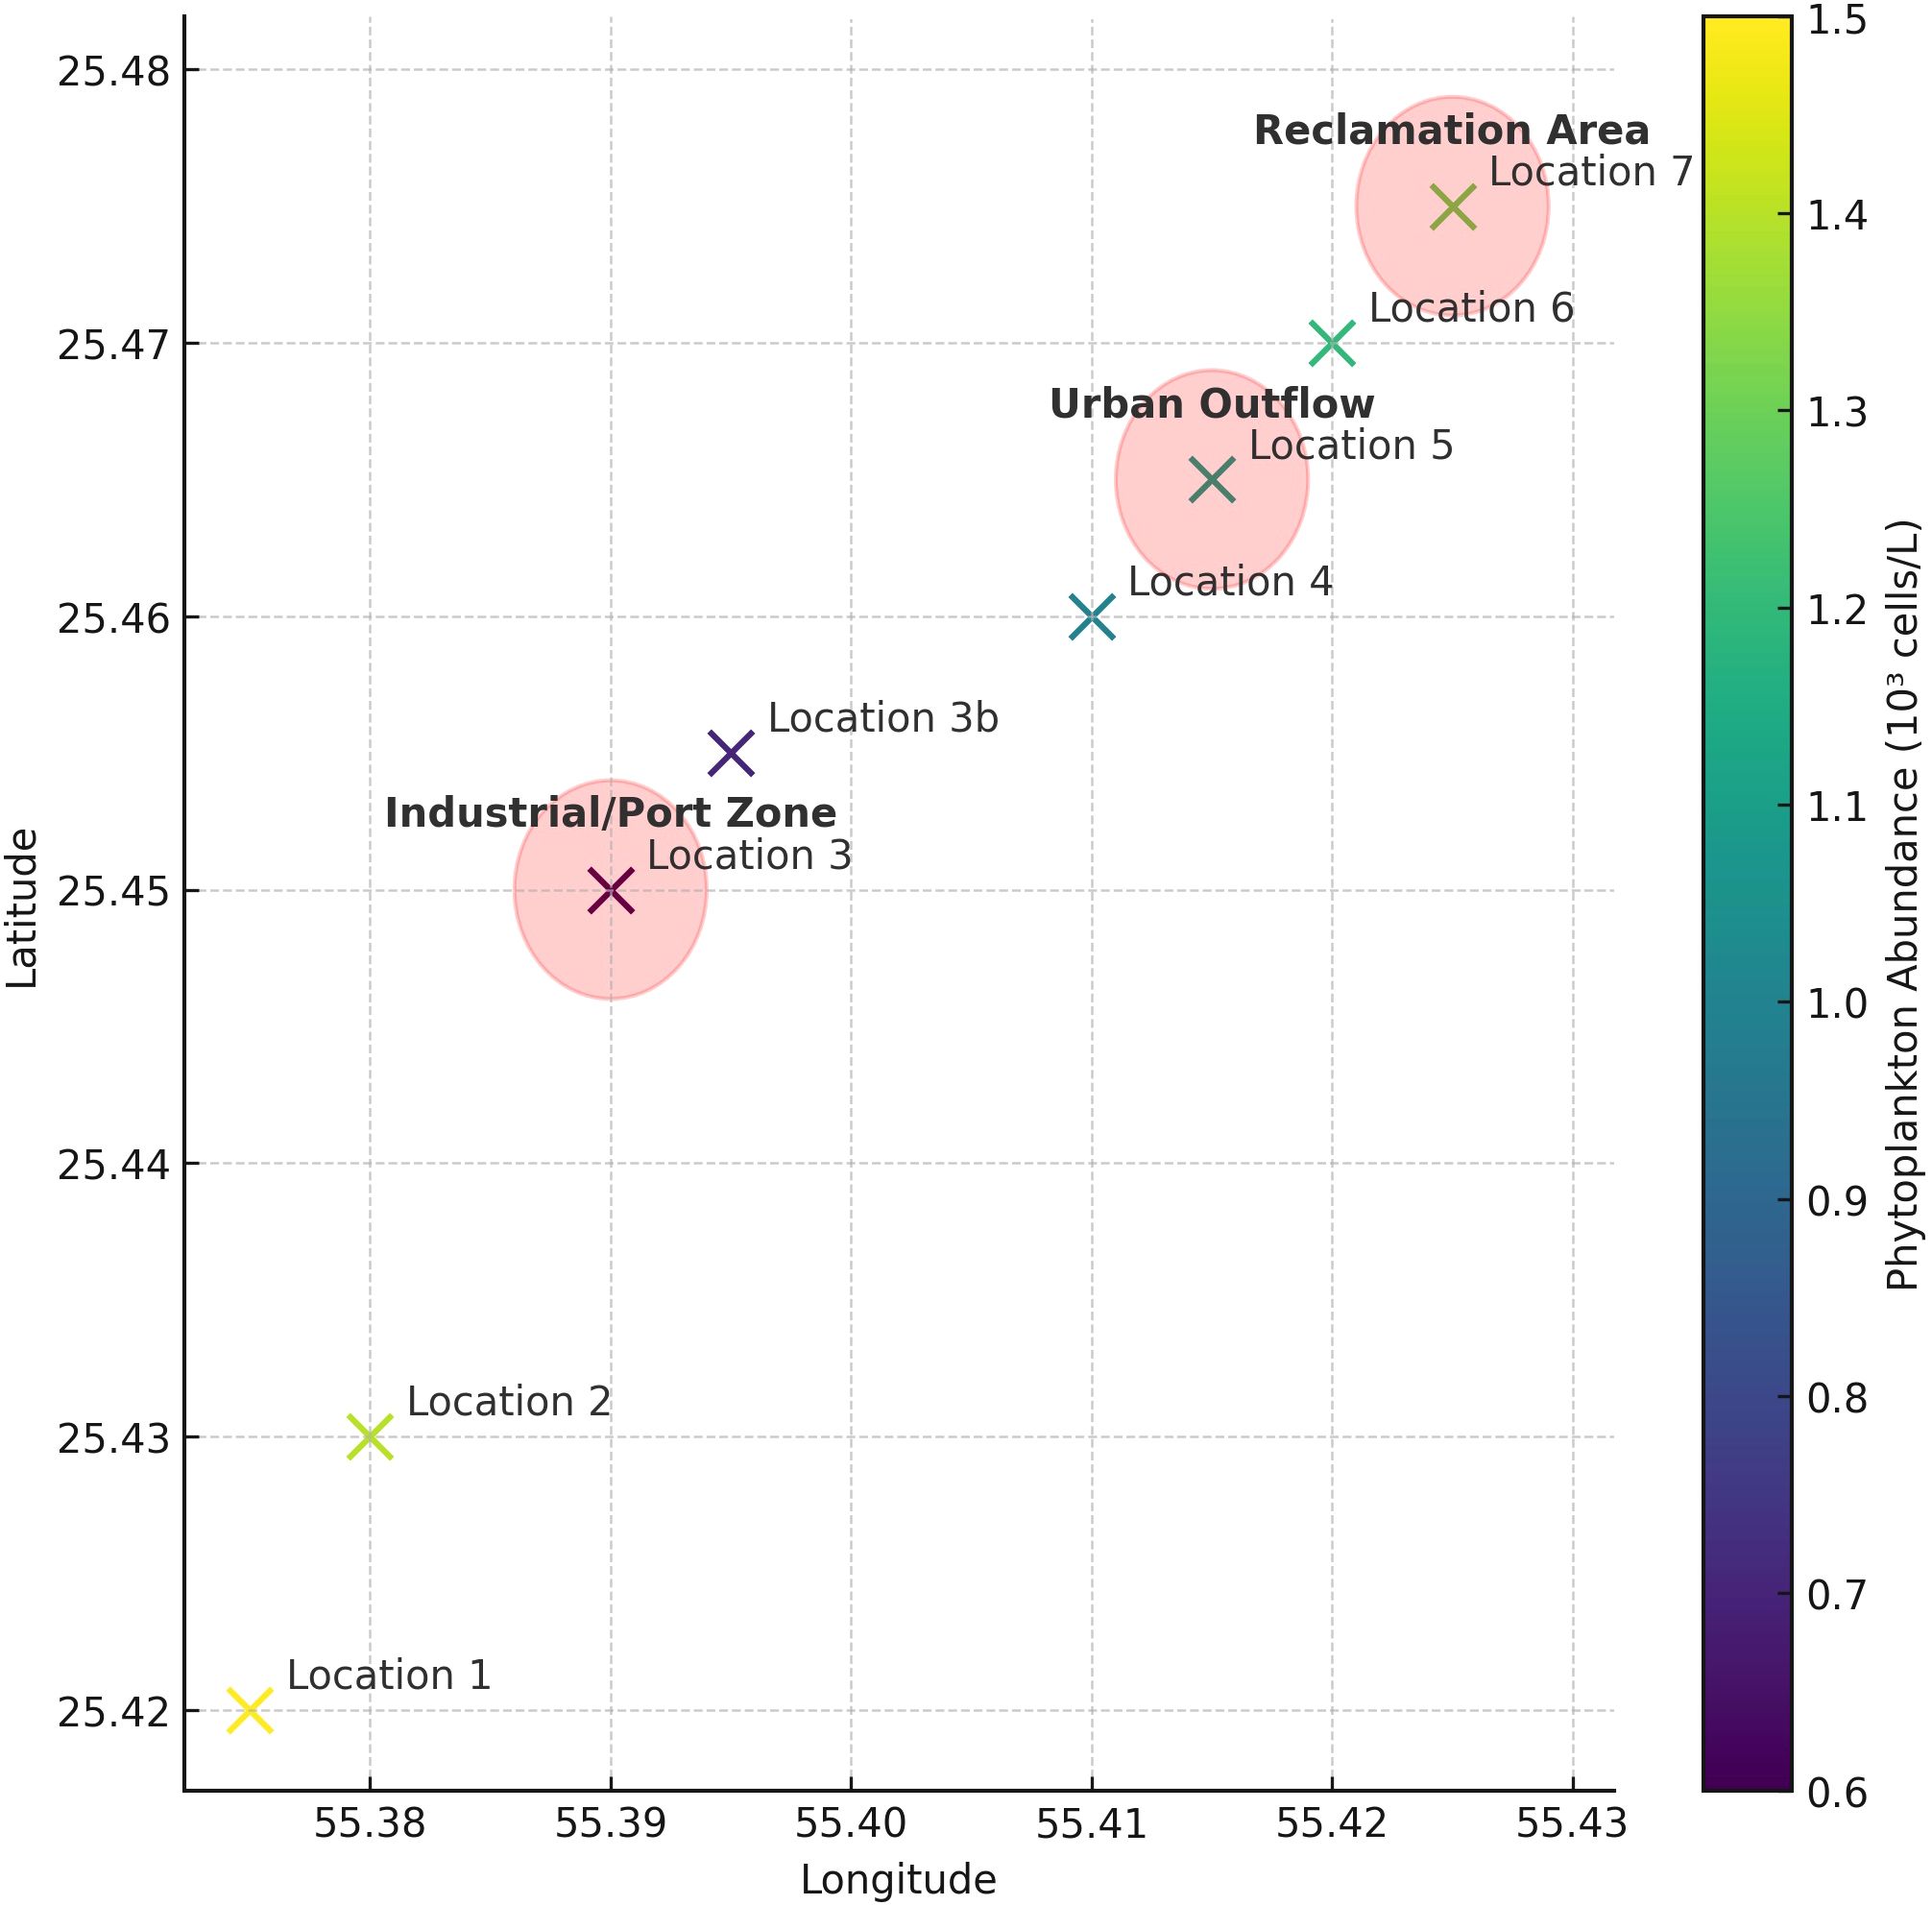
Figure 10. Spatial distribution of phytoplankton abundance and anthropogenic influence zones. Sampling locations are plotted with color-coded abundance data (106 cells l-1). Red shaded circles represent approximate zones of anthropogenic influence: • Industrial/Port Zone near Locations 3 and 3b (Hamriyah Port) • Urban Outflow Zone near Location 5 (Sharjah Port vicinity) • Land Reclamation Area near Location 7 (adjacent to Dubai coast and beach development) This spatial visualization supports the observed patterns in phytoplankton variation and reinforces the role of localized human activity, as discussed in Section 4.2.3.
In contrast, offshore stations (Locations 1 and 2), situated 4–22 km away from heavily developed areas, consistently showed higher abundance and diversity, especially during cooler months. Their distance from coastal infrastructure likely affords more stable conditions and reduced anthropogenic disturbance. The spatial distribution of phytoplankton observed here aligns with broader Gulf-wide patterns linking urbanization and port activity to ecological degradation and reduced primary productivity (Al-Yamani et al., 2021). While pollutant levels were not directly measured, the observed biological patterns serve as useful proxies. Future work integrating land-use mapping, contaminant analysis, and hydrodynamic modeling will be essential to further quantify and validate these linkages.
4.2.3 Ecological significance of harmful and invasive taxa
In this study, a range of potentially harmful phytoplankton taxa were identified including known bloom forming cyanobacteria and dinoflagellates (Trichodesmium erythraeum, Scrippsiella spp., Blixaea quinquecornis, and Sourniaea diacantha), ichthyotoxic dinoflagellates (Margalefidinium polykrikoides and Heterocapsa spp.), together with the toxin-producing dinoflagellate Dinophysis caudata and diatoms Pseudo-nitzschia spp. (e.g., Al-Yamani and Saburova, 2019a; Glibert, 2007; Hallegraeff, 1993; Lassus et al., 2016; Polikarpov et al., 2020; Richlen et al., 2010; Saburova et al., 2022). Dinoflagellate Dinophysis caudata and the diatom Pseudo-nitzschia group are of particular concern within this complex, as these are known toxin-producing species. Some Dinophysis caudata strains have been confirmed to produce okadaic acid and its analogues, which can cause diarrhetic shellfish poisoning (DSP) in humans (e.g., Hallegraeff et al., 2003; Lassus et al., 2016) at elevated cell concentrations.
While the above microalgae are known to have an adverse impact on the marine environment when they bloom, all of them, except for the Pseudo-nitzschia group, were detected at low abundances in this study, with concentrations of about 102 cells l-1, far below the bloom threshold (about 105–106 cells l-1). However, the confirmed presence of these potentially harmful species in the phytoplankton highlights the risks of the future environmental hazards and emphasizes the necessity of proactive monitoring and management strategies.
On the other hand, the Pseudo-nitzschia group was present at a high abundance in the study area, between November and May (e.g. Figure 2). For example, in January 2021, the abundance of Pseudo-nitzschia group varied from 5.98×10⁴ to 3.44×10⁵ cells l−1, which is comparable to the European bloom warning threshold of 50,000–200,000 cells l−1 for a shellfish harvesting ban (EURLMB, 2019). Pseudo-nitzschia species (e.g., Pseudo-nitzschia calliantha, P. pungens, and P. multiseries) can produce domoic acid, a neurotoxin that accumulates in shellfish and affects marine mammals, birds, and humans, causing amnesic shellfish poisoning (ASP) (e.g., Larsen and Nguyen, 2004; Lassus et al., 2016; Throndsen et al., 2007).
Although species-level identification remains uncertain (Figures 7L, M), it is quite possible that toxic Pseudo-nitzschia taxa were present in the study area, as they commonly occur in the Kuwaiti waters of the northern Gulf (Al-Yamani et al., 2012; Al-Yamani and Saburova, 2019b) and in the winter phytoplankton across the Gulf and the Sea of Oman (Polikarpov et al., 2016). Recently, amnesic shellfish toxin (domoic acid) attributed to the toxic Pseudo-nitzschia strains was detected in the Qatari waters (Al Muftah et al., 2016) and in Yas Bay, Abu Dhabi, UAE where several beaches were closed for the public (Rajan et al, 2022).
Given ongoing projected temperature increases and intensifying coastal development on the northern UAE coast, we expect an increase in the abundance of potentially harmful bloom forming phytoplankton species (e.g. Trichodesmium erythraeum, Scrippsiella spp., Blixaea quinquecornis, and Sourniaea diacantha), together with ichthyotoxic dinoflagellates (e.g. Margalefidinium polykrikoides and toxin-producing Dinophysis caudata and Pseudo-nitzschia spp. especially in the sites closer to the coast, as these are the most affected (see section 4.2.3). These phytoplankton taxa are likely to reach their bloom-forming thresholds especially in the sites nearer the shore.
4.2.4 Drivers of phytoplankton composition: multivariate analysis
The CCA results provided clear evidence that temperature, dissolved oxygen, COD, and ORP were the primary environmental drivers shaping phytoplankton assemblages (Figure 9). In particular, temperature and DO accounted for a significant portion of variation in the data (approximately 80% of explained variation) and were strongly associated with cyanobacterial dominance in warmer months. This agrees with the findings from Daya Bay in China (Zhao et al., 2025) where DCA identified DO, temperature and salinity as the most important environmental variables influencing phytoplankton distribution. The influence of ORP on diatoms and dinoflagellates aligns with known ecological tolerances, as oxidative conditions can favor silica-utilizing taxa like diatoms (Falkowski, 2012). The inverse relationship between pH and dominant environmental vectors suggests that localized acidification events or shifts in buffering capacity may selectively impact species like dinoflagellate Sourniaea diacantha and certain cyanobacteria.
Interestingly, some diatom taxa such as Guinardia, Rhizosolenia, and Cylindrotheca appeared unaffected by the measured parameters, suggesting that additional factors—such as micro-nutrient availability, grazing pressure, or water column stability—may influence their distributions.
Since the first two CCA axes only explained about 30% of the variation in the phytoplankton data, it is clear that other, unmeasured environmental and ecological variables were influencing the phytoplankton assemblages (Cloern, 1996; Paerl and Paul, 2012).
Ecological variables, like zooplankton grazing, were among unmeasured impacts in this study, and these could also drive differences in phytoplankton community structure between different sampling locations. Clearly, a larger scale ecosystem-based study with continuous monitoring of a wider range of anthropogenic, environmental and ecological variables is required to account for all variation in phytoplankton data.
4.2.5 Implications for monitoring and coastal management
This study presents one of the first inter-seasonal phytoplankton assessments along the UAE’s Gulf coast and highlights the complex interplay between environmental variability and phytoplankton dynamics. The findings reinforce the need for regular, fine-scale monitoring to detect early signs of eutrophication, shifts in community structure, or emerging HAB risks. Given the ecological and economic importance of the oyster banks and the increasing frequency of HABs in the wider Gulf region, integrating phytoplankton data into environmental impact assessments and marine spatial planning will be essential. Additionally, the identification of HAB-prone taxa underlines the importance of early warning systems and the development of region-specific threshold levels for nutrient loads and water quality indicators.
5 Conclusions
This study presents the first detailed assessment of inter-seasonal phytoplankton dynamics in the northern coastal waters of the United Arab Emirates, with a focus on one of the Gulf’s most ecologically significant oyster banks. The phytoplankton assemblages composition and abundance exhibited clear seasonal and spatial variability, primarily driven by changes in water temperature, DO, salinity, and oxidative conditions. The summer and spring months were characterized by cyanobacterial dominance, whereas autumn and winter assemblages were more diverse, with higher relative abundances of diatoms and cryptophycean flagellates.
Numerical analyses, such as DCA and CCA, provided valuable insights into the ecological gradients influencing phytoplankton composition with non-parametric Bray-Curtis dissimilarity analysis, combined with PERMANOVA, supporting some of the findings from the ordination analyses. For example, both multivariate approaches detected clear seasonal differences between the June and January assemblages. Temperature, COD, and DO were identified as the most influential environmental drivers, collectively explaining 30% of the total variation in the species data, while unmeasured water chemistry variables such as Si and toxic pollutant influx together with ecological variables, e.g. zooplankton grazing, may account for the unexplained variance in the phytoplankton data.
Although no harmful algal blooms (HABs) were observed during the study period, the presence of several potentially harmful bloom-forming dinoflagellates, such as Blixaea quinquecornis, Scrippsiella spp., and ichthyotoxic Heterocapsa taxa, even at low abundances, highlights the need for continued phytoplankton monitoring in the northern coastal waters of the UAE. In addition, the detection of the potentially toxic diatom Pseudo-nitzschia between November and May at concentrations comparable to European HAB threshold levels may indicate a future risk of toxic blooms—particularly in light of recent reports of Pseudo-nitzschia in Abu Dhabi. With the continuing coastal development and predicted rise in temperatures, an increase in the abundance of potentially harmful bloom forming phytoplankton taxa is expected, which may lead to future HAB events along the northern coast of the UAE.
Given the ecological and economic importance of oyster beds and the increasing anthropogenic pressures in the region, regular and spatially resolved monitoring of phytoplankton communities should be integrated into national coastal management frameworks. This is particularly critical in the context of projected climate-driven changes in water quality and nutrient dynamics in the Gulf.
Overall, this study provides a foundational dataset for phytoplankton ecology in the region and supports the development of ecosystem-based management strategies to address emerging environmental challenges in the Gulf.
Data availability statement
The original contributions presented in the study are included in the article/Supplementary Material/s, further inquiries can be directed to the corresponding author.
Author contributions
NS: Investigation, Conceptualization, Methodology, Formal Analysis, Supervision, Writing – original draft, Data curation, Software, Writing – review & editing. DM: Formal Analysis, Writing – review & editing, Data curation, Investigation. FS: Writing – original draft, Resources, Formal Analysis, Project administration, Methodology, Investigation, Writing – review & editing, Funding acquisition, Conceptualization, Supervision. MS: Investigation, Methodology, Writing – review & editing.
Funding
The author(s) declare financial support was received for the research and/or publication of this article. This research was funded under Faculty Research Grant FRG19-L-S51 (AS1703). This publication was partially funded by the Open Access Program at the American University of Sharjah through (OPFY25-3152-OC2519).
Acknowledgments
The authors would like to acknowledge the support of the Ajman Municipality and Planning, Sharjah Environment and Protected Areas Authority (EPAA) and Emirates Nature-WWF for providing critical information to carry on this study. Thanks to Dr. Daniel Mateos (Emirate Nature-WWF), Dr. Ivonne Bejarano, Mr. Yanick Pages, Mr. Fadi Yaghmour (Sharjah Environmental and Protected Areas Authority), Ms. Thouraya Ghalayini and Dr. Mohamed Abouleish for their help in sample collection and site assessment and to Mr. Vadim Ialyshev and Mr. Waqas Ahmad for their technical support.
Conflict of interest
The authors declare that the research was conducted in the absence of any commercial or financial relationships that could be construed as a potential conflict of interest.
The author(s) declared that they were an editorial board member of Frontiers, at the time of submission. This had no impact on the peer review process and the final decision.
Generative AI statement
The author(s) declare that Generative AI was used in the creation of this manuscript. The author(s) verify and take full responsibility for the use of generative AI in the preparation of this manuscript, noting that ChatGPT was used solely for rewording and summarizing information without altering the scientific content.
Publisher’s note
All claims expressed in this article are solely those of the authors and do not necessarily represent those of their affiliated organizations, or those of the publisher, the editors and the reviewers. Any product that may be evaluated in this article, or claim that may be made by its manufacturer, is not guaranteed or endorsed by the publisher.
Supplementary material
The Supplementary Material for this article can be found online at: https://www.frontiersin.org/articles/10.3389/fmars.2025.1638235/full#supplementary-material
References
Abuelgasim A. A. and Alhosani T. M. (2014). Monitoring chlorophyll-a in the Arabian Gulf and Gulf of Oman using MODIS Aqua data. Int. J. Remote Sens. 35, 4466–4480.
Al-Azri A. R., Piontkovski S. A., Al-Hashmi K. A., Goes J. I., and Gomes H. do R. (2010). Chlorophyll a as a measure of seasonal coupling between phytoplankton and the monsoon periods in the Gulf of Oman. Aquat. Ecol. 44, 449–461. doi: 10.1007/s10452-009-9303-2
Al-Khayat J. and Al-Ansi M. A. (2008). Ecological features of oyster beds distribution in Qatari waters, Arabian Gulf. Asian J. Sci. Res. 1, 544–561. doi: 10.3923/ajsr.2008.544.561
Allen J. T., Brown L., Sanders R., Moore C. M., Mustard A., Fielding S., et al. (2005). Diatom carbon export enhanced by silicate upwelling in the Northeast Atlantic. Nature 437, 728–732. doi: 10.1038/nature03948
Al Muftah A., Selwood A. I., Foss A. J., Al-Jabri H. M. S. J., Potts M., and Yilmaz M. (2016). Algal toxins and producers in the marine waters of Qatar, Arabian Gulf. Toxicon 122, 54–66. doi: 10.1016/j.toxicon.2016.09.016
Al-Yamani F. Y., Burt J. A., Goes J. I., Jones B., Nagappa R., Murty V. S. N., et al. (2024). “Physical and biogeochemical characteristics of the Indian ocean marginal seas,” in The Indian ocean and its role in the global climate system. Eds. Ummenhofer C. C. and Hood R. R. (Elsevier, Amsterdam), 365–391. doi: 10.1016/B978-0-12-822698-8.00008-1
Al-Yamani F., Polikarpov I., and Saburova M. (2021). “Northern gulf marine biodiversity in relevance to the river discharge,” in Southern Iraq's marshes. Ed. Jawad L. A. (Coastal Research Library 37 Springer, Cham), 467–488. doi: 10.1007/978-3-030-66238-7_20
Al-Yamani F. and Saburova M. (2019a). “Marine phytoplankton of Kuwait’s waters,” Volume I. Cyanobacteria, dinoflagellates, flagellates (Kuwait Institute for Scientific Research, Kuwait).
Al-Yamani F. and Saburova M. (2019b). “Marine phytoplankton of Kuwait’s waters,” in Volume II. Diatoms (Kuwait Institute for Scientific Research, Kuwait).
Al-Yamani F., Saburova M., and Polikarpov I. (2012). A preliminary assessment of harmful algal blooms in Kuwait's marine environment. Aquat. Ecosyst. Health Manage. 15, 64–72. doi: 10.1080/14634988.2012.679450
APHA (2017). Standard methods for the examination of water and wastewater. 23rd Edition (Washington DC, U.S.A.: American Public Health Association, American Water Works Association, Water Environment Federation).
Birks H. J. B. and Line J. M. (1992). The use of rarefaction analysis for estimating palynological richness from Quaternary pollen-analytical data. Holocene 2, 1–10. doi: 10.1177/095968369200200101
Bonachela J. A., Raghib M., and Levin S. A. (2011). Dynamic model of flexible phytoplankton nutrient uptake. Proc. Natl. Acad. Sci. U.S.A. 108, 20633–20638. doi: 10.1073/pnas.1118012108
Cloern J. E. (1996). Phytoplankton bloom dynamics in coastal ecosystems’: a review with some general lessons from sustained investigation of San Francisco Bay, California. Rev. Geophys. 34, 127–168. doi: 10.1029/96RG00986
d’Ovidio F., De Monte S., Alvain S., Dandonneau Y., and Lévy M. (2010). Fluid dynamical niches of phytoplankton types. Proc. Natl. Acad. Sci. U.S.A. 107, 18366–18370. doi: 10.1073/pnas.1004620107
Demarcq H., Reygondeau G., Alvain S., and Vantrepotte V. (2012). Monitoring marine phytoplankton seasonality from space. Remote Sens. Environ. 117, 211–222. doi: 10.1016/j.rse.2011.09.019
Doney S. C., Ruckelshaus M., Duffy J. E., Barry J. P., Chan F., English C., et al. (2012). Climate change impacts on marine ecosystems. Ann. Rev. Mar. Sci. 4, 11–37. doi: 10.1146/annurev-marine-041911-111611
El Gammal M. A. M., Nageeb M., and Al-Sabeb S. (2017). Phytoplankton abundance in relation to the quality of the coastal water – Arabian Gulf, Saudi Arabia. Egypt. J. Aquat. Res. 43, 275–282. doi: 10.1016/j.ejar.2017.10.004
EURLMB (2019). “Monitoring of toxin-producing phytoplankton in bivalve mollusc harvesting areas,” in Guide to good practice: technical application. EU working group on toxin-producing phytoplankton monitoring in bivalve mollusc harvesting areas. (Vigo, Spain). Available online at: https://www.aesan.gob.es/CRLMB/Phyto_Monitoring_Guide_DEC_2021.pdf.
Falkowski P. G. (2012). Ocean science: The power of plankton. Nature 483, S17–S20. doi: 10.1038/483S17a
Glibert P. (2007). Eutrophication and harmful blooms: a complex global issue, examples from the Arabian Sea including Kuwait Bay, and an introduction to the global ecology and oceanography of harmful algal blooms (GEOHAB) programme. Int. J. Oceans Oceanography 2, 157–169.
Gomes H. R., Goes J. I., Matondkar S. G. P., Buskey E. J., Basu S., Parab S., et al. (2014). Massive outbreaks of Noctiluca scintillans blooms in the Arabian Sea due to spread of hypoxia. Nat. Commun. 5, 4862. doi: 10.1038/ncomms5862
Guiry M. D. and Guiry G. M. (2025). “AlgaeBase,” in World-wide electronic publication (National University of Ireland, Galway). Available online at: http://www.algaebase.org (Accessed May 24, 2025).
Hallegraeff G. M. (1993). A review of harmful algal blooms and their apparent global increase. Phycologia 32, 79–99. doi: 10.2216/i0031-8884-32-2-79.1
Hallegraeff G. M., Anderson D. M., and Cembella A. D. (2003). “Manual on harmful marine microalgae,” in Monographs on oceanographic methodology, vol. 11. (UNESCO Publishing, Paris).
Hume B., D’Angelo C., Smith E. G., Stevens J. R., Burt J., and Wiedenmann J. (2015). Symbiodinium thermophilum sp. nov., a thermotolerant symbiotic alga prevalent in corals of the world’s hottest sea, the Persian/Arabian Gulf. Sci. Rep. 5, 8562. doi: 10.1038/srep08562
Hutchings A. M., de Vries C. S., Hayes N. R., and Orr H. G. (2024). Temperature and dissolved oxygen trends in English estuaries over the past 30 years. Estuar. Coast. Shelf Sci. 306, 108892. doi: 10.1016/j.ecss.2024.108892
Juggins S. (2005). Software for ecological and palaeoecological data analysis and visualisation (Newcastle upon Tyne: Newcastle University).
King M. (2012). Fisheries biology, assessment and management. 2nd ed (Chichester: John Wiley & Sons).
Larsen J. and Nguyen N. L. (Eds.) (2004). Potentially toxic microalgae of Vietnamese waters. Opera Botanica 140, 1–216.
Lassus P., Chomérat N., Hess P., and Nézan E. (2016). “Toxic and Harmful Microalgae of the World Ocean /Micro-Algues Toxiques et Nuisibles de L’océan Mondial,” in Denmark: IOC manuals and guides (Denmark: International Society for the Study of Harmful Algae/Intergovernmental Oceanographic Commission of UNESCO), 68.
Lee S. Y., Jeong H. J., Kang H. C., Ok J. H., You J. H., Park S. A., et al. (2021). Comparison of the spatial-temporal distributions of the heterotrophic dinoflagellates Gyrodinium dominans, G. jinhaense, and G. moestrupii in Korean coastal waters. Algae 36, 37–50. doi: 10.4490/algae.2021.36.3.4
Longhurst A. (1993). Seasonal cooling and blooming in tropical oceans. Deep-Sea Res. I: Oceanogr. Res. Pap. 40, 2145–2165. doi: 10.1016/0967-0637(93)90095-K
Longhurst A. (1995). Seasonal cycles of pelagic production and consumption. Prog. Oceanogr. 36, 77–167. doi: 10.1016/0079-6611(95)00015-1
Lund J. W. G., Kipling C., and Le Cren E. D. (1958). The inverted microscope method of estimating algal numbers and the statistical basis of estimations by counting. Hydrobiologia 11, 143–170. doi: 10.1007/BF00007865
Mai G., Liu J., Xia X., Pang X., Li B., Yu L., et al. (2021). Acutely rising temperature reduces photosynthetic capacity of phytoplankton assemblages in tropical oceans: A large-scale investigation. Front. Mar. Sci. 8. doi: 10.3389/fmars.2021.710697
MOCCAE (Ministry of Climate Change and Environment) (2020). Guiding standards for marine water properties in the United Arab Emirates (Dubai: MOCCAE).
Mohamed Z. A. and Mesaad I. (2007). First report on Noctiluca scintillans blooms in the Red Sea off the coasts of Saudi Arabia: Consequences of eutrophication. Oceanologia 49, 337–351. Available online at: http://www.iopan.gda.pl/oceanologia/338 (Accessed May 27, 2025).
Murugesan K., Juma I. M. I. A., and Hokal N. M. (2021a). First record of Protoperidinium quinquecorne (Dinoflagellates) bloom in Dubai coastal waters at Al Mamzar Corniche. Res. J. Mar. Sci. 9, 1–7. doi: 10.35248/2572-3103.22.10.256
Murugesan K., Juma I. M. I. A., and Hokal N. M. (2021b). Seasonal influence of water quality on the assemblage and diversity of phytoplankton along Dubai Creek, Arabian Gulf. Reg. Stud. Mar. Sci. 47, 101928. doi: 10.1016/j.rsma.2021.101928
Murugesan K., Juma I. M. I. A., and Khan S. A. (2017). Blooms of Noctiluca scintillans and its association with Thalia sp. (Salps) along Dubai Coastal Waters. Res. J. Environ. Sci. 11, 101–107. 101928. doi: 10.3923/rjes.2017.101.107
Naser H.A. (2013). Assessment and management of heavy metal pollution in the marine environment of the Arabian Gulf: a review. Mar. Pollut. Bull. 72, 6–13. doi: 10.1016/j.marpolbul.2013.04.030
Nezlin N. P., Polikarpov I. G., Al-Yamani F. Y., Rao D. V. S., and Ignatov A. M. (2010). Satellite monitoring of climatic factors regulating phytoplankton variability in the Arabian (Persian) Gulf. J. Mar. Syst. 82, 47–60. doi: 10.1016/j.jmarsys.2010.03.003
Paerl H. W. and Paul V. J. (2012). Climate change: Links to global expansion of harmful cyanobacteria. Water Res. 46, 1349–1363. doi: 10.1016/j.watres.2011.08.002
Piontkovski S. A., Al-Azri A. R., and Al-Hashmi K. (2011). Seasonal and interannual variability of chlorophyll a in the Gulf of Oman compared to the open Arabian Sea regions. Int. J. Remote Sens. 32, 7703–7715. doi: 10.1080/01431161.2010.527393
Polikarpov I., Al-Yamani F., Petrov P., Saburova M., Mikhalkov V., and Al-Enezi A. (2021). Phytoplankton bloom detection during the COVID-19 lockdown with remote sensing data: Using Copernicus Sentinel-3 for northwestern Arabian/Persian Gulf case study. Mar. pollut. Bull. 171, 112734. doi: 10.1016/j.marpolbul.2021.112734
Polikarpov I., Saburova M., and Al-Yamani F. (2016). Diversity and distribution of winter phytoplankton in the Arabian Gulf and the Sea of Oman. Cont. Shelf Res. 119, 85–99. doi: 10.1016/j.csr.2016.03.009
Polikarpov I., Saburova M., and Al-Yamani F. (2019). “Remote sensing of phytoplankton variability in the Arabian/Persian Gulf,” in Remote sensing of the asian seas. Eds. Barale V. and Gade M. (Springer, Cham), 485–504. doi: 10.1007/978-3-319-94065-6
Polikarpov I., Saburova M., and Al-Yamani F. (2020). Decadal changes in diversity and occurrence of microalgal blooms in the NW Arabian/Persian Gulf. Deep-Sea Res. II: Top. Stud. Oceanogr. 179, 104810. doi: 10.1016/j.dsr2.2020.104810
Rajan A., Morton S., Thankamony R., Raisi A., and Hosani S. (2022). Detection and monitoring of algal toxins and causative harmful algae in Abu Dhabi waters – A pilot study. Int. J. Ecol. Environ. Sci. 4, 25–30.
Rajan A., Thankamony R., Othman Y., Khan S. A., and Jamali E. A. (2021). Massive bloom of Cochlodinium polykrikoides and its impacts in the United Arab Emirates’ waters. Int. J. Ecol. Environ. Sci. 3, 341–347.
Richlen M. L., Morton S. L., Jamali E. A., Rajan A., and Anderson D. M. (2010). The catastrophic 2008–2009 red tide in the Arabian Gulf region, with observations on the identification and phylogeny of the fish-killing dinoflagellate Cochlodinium polykrikoides. Harmful Algae 9, 163–172. doi: 10.1016/j.hal.2009.08.013
Riegl B. M., Purkis S. J., Al-Cibahy A. S., Al-Harthi S., Grandcourt E. M., Al-Sulaiti K., et al. (2012). “Coral bleaching and mortality thresholds in the SE Gulf: highest in the world,” in Coral reefs of the gulf. Adaptation to climatic extremes. Eds. Riegl B. M. and Purkis S. J. (Springer, Dordrecht Heidelberg New York London), 95–106. doi: 10.1007/978-94-007-3008-3_1
Rocha C., Galvão H., and Barbosa A. (2002). Role of transient silicon limitation in the development of cyanobacteria blooms in the Guadiana estuary, south-western Iberia. Mar. Ecol. Prog. Ser. 228, 35–45. doi: 10.3354/meps228035
Saburova M., Al-Kandari M., Polikarpov I., Akbar A., Hussain S., Rahmeh R., et al. (2022). Alien toxic dinoflagellate Heterocapsa circularisquama from the western Pacific in Kuwait, NW Indian Ocean. Deep-Sea Res. II: Top. Stud. 196, 105027. doi: 10.1016/j.dsr2.2022.105027
Samara F., Bejarano I., Mateos-Molina D., Abouleish M., Solovieva N., Yaghmour F., et al. (2023). Environmental assessment of oyster beds in the northern Arabian Gulf coast of the United Arab Emirates. Mar. Pollut. Bull. 195, 115442. doi: 10.1016/j.marpolbul.2023.115442
Samara F., Solovieva N., Ghalayini T., Nasrallah Z. A., and Saburova M. (2020). Assessment of the environmental status of the mangrove ecosystem in the United Arab Emirates. Water 12, 1623. doi: 10.3390/w12061623
Sarma Y. V. B., Al-Azri A., and Smith S. L. (2012). Inter-annual variability of chlorophyll-a in the Arabian Sea and its gulfs. Int. J. Mar. Sci. .2, 1–11. doi: 10.5376/ijms.2012.02.0001
Selvan P. P., Mohan M., Dutta Roy A., Ali T., Watt M. S., and Samara F. (2025). Advancing oyster habitat mapping: Integrating satellite remote sensing to assess coastal development impacts in northern United Arab Emirates. Mar. pollut. Bull. 215, 117861. doi: 10.1016/J.MARPOLBUL.2025.117861
Sheppard C., Al-Husiani M., Al-Jamali F., Al-Yamani F., Baldwin R., Bishop J., et al. (2010). The Gulf: A young sea in decline. Mar. Pollut. Bull. 60, 13–38. doi: 10.1016/j.marpolbul.2009.10.017
Šmilauer P. and Lepš J. (2014). Multivariate analysis of ecological data using CANOCO. 2nd ed (Cambridge: Cambridge University Press), 5.
Song H., Wignall P. B., Song H., Dai X., and Chu D. (2019). Seawater temperature and dissolved oxygen over the past 500 million years. J. Earth Sci. 30, 236–243. doi: 10.1007/s12583-018-1002-2
Subba Rao D. V., Al-Yamani F., Lennox A., Pan Y., and Al-Said T. F. O. (1999). Biomass and production characteristics of the first red tide noticed in Kuwait Bay, Arabian Gulf. J. Plankton Res. 21, 805–810. doi: 10.1093/plankt/21.4.805
Throndsen J., Hassle G. R., and Tangen K. (2007). Phytoplankton of Norwegian coastal waters (Oslo: Almater ForlasAs).
USEPA (1993a). Method 410.4: the determination of chemical oxygen demand by semi-automated colorimetry (Cincinnati, Ohio, U.S.A.: U.S. Environmental Protection Agency).
USEPA (1993b). Method 351.2: determination of total kjeldahl nitrogen by semi-automated colorimetry (Cincinnati, Ohio, U.S.A.: U.S. Environmental Protection Agency).
Utermöhl H. (1958). Zur Vervollkommnung der quantitativen Phytoplankton Methodik. Mitt. Int. Ver. Theor. Angew. Limnol. 9, 1–38. doi: 10.1080/05384680.1958.11904091
Wabnitz C. C. C., Lam V. W. Y., Reygondeau G., The L. C. L., Al-Abdulrazzak D., Khalfallah M., et al. (2018). Climate change impacts on marine biodiversity, fisheries and society in the Arabian Gulf. PloS One 13, e0194537. doi: 10.1371/journal.pone.0194537
Watson A. J., Robinson C., Robinson J. E., Williams P. G., le B., and Fasham M. J. R. (1991). Spatial variability in the sink for atmospheric carbon dioxide in the North Atlantic. Nature 350, 50–53. doi: 10.1038/350050a0
Zeitzschel B. (1978). “Why study phytoplankton,” in Phytoplankton manual. Ed. Sournia A. (UNESCO, Paris), 1–5.
Zhao J. and Ghedira H. (2014). Monitoring red tide with satellite imagery and numerical models: A case study in the Arabian Gulf. Mar. Pollut. Bull. 79, 305–313. doi: 10.1016/j.marpolbul.2013.10.057
Keywords: HABs, multivariate analysis, diatoms, dinoflagellates, sustainable coastal development
Citation: Solovieva N, Medhat D, Samara F and Saburova M (2025) Inter-seasonal phytoplankton dynamics in the UAE coastal waters. Front. Mar. Sci. 12:1638235. doi: 10.3389/fmars.2025.1638235
Received: 30 May 2025; Accepted: 22 July 2025;
Published: 12 August 2025.
Edited by:
Agustin Sanchez-Arcilla, Universitat Politecnica de Catalunya, SpainReviewed by:
Peng Zhang, Guangdong Ocean University, ChinaKarankumar Kishorkumar Ramteke, Central Institute of Fisheries Education (ICAR), India
Copyright © 2025 Solovieva, Medhat, Samara and Saburova. This is an open-access article distributed under the terms of the Creative Commons Attribution License (CC BY). The use, distribution or reproduction in other forums is permitted, provided the original author(s) and the copyright owner(s) are credited and that the original publication in this journal is cited, in accordance with accepted academic practice. No use, distribution or reproduction is permitted which does not comply with these terms.
*Correspondence: Nadia Solovieva, YnJpdGFydGRpcmVjdG9yeUBnbWFpbC5jb20=