 Sebastian Silva-Solar
 Marit R. van Erk
 Gilad Antler
 Katrin Knittel1
 Subhayit Basu
 Dirk de Beer
- 1Max-Plank-Institute for Marine Microbiology, Department of Microbial Ecology, Bremen, Germany
- 2Department of Earth and Environmental Sciences, Ben Gurion University, Beer Sheva, Israel
Marine microbial ecology aims to link microbial communities to the geochemical processes they drive. Molecular techniques have provided a view of the huge complexity of microbial communities and their metabolic potential, however, the information these approaches give about the geochemical processes is limited. Here, we combined geochemical and 16S rRNA amplicon sequencing analyses to spatially link dominant microbial taxa with geochemical processes in deep-sea sediments of the Gulf of Aqaba. The fine-grained aeolian sediments are diffusion controlled, allowing precise localization of the stratified geochemical processes in well-defined zones by transport-reaction modeling. Geochemical depth profiles and fluxes showed aerobic heterotrophy, nitrification, aerobic Mn-oxidation, denitrification, and anaerobic Fe oxidation to occur in sequence from upper to deeper sediment layers. Although chemoautotrophic processes were significant, 90% of the redox processing was driven by heterotrophy on organic carbon input. The microbial community composition also showed a clear stratification. The oxic zone was dominated by typical aerobes, while anaerobes were largely absent, as expected. Remarkably, the anoxic zone was inhabited by many aerobic bacteria, in addition to the anaerobic community. A narrow brown band enriched in solid-phase Mn-oxide was observed at 2-3 cm depth, where downward diffusing O2 and upward diffusing Mn2+ overlapped. Here, members of the family Ca. Scalinduaceae peaked, suggesting involvement in Mn oxidation or -reduction. Dominant families above the band were Woeseiaceae, Nitrospiraceae, and Nitrosococcaceae, whereas below the band Desulfosarcinaceae, Desulfatiglandaceae, Methylomirabilaceae, and Anaerolineaceae dominated. While Ca. Scalinduaceae peaked in the Mn-oxide band, none of the other dominant families were exclusively linked to zones with specific geochemical processes. Our approach did not resolve relations between the geochemical processes and the dominant members of the community unambiguously, but characterized a unique habitat and leads to the formulation of new hypotheses, including the occurrence of cryptic cycling.
1 Introduction
1.1 General question
Microbial ecology, the study of microbial communities and their interactions with the natural environment, relies on analyzing community composition, diversity, and abundance. Ideally, these analyses should be coupled with what is known about the metabolisms and physiological activities of the dominant taxonomic groups, to better understand the relationships of the microorganisms with each other and with the environment. Enormous progress has been made with molecular and -omics techniques to characterize microbial communities, especially of the non-cultivated fraction. However, the information these methods can give about the actual geochemical processes happening in the environment is rather indirect. Detected species, families or higher taxonomic groups might not be active, metabolisms inferred from DNA sequences require translation steps and even the presence of certain enzymes requires knowledge of their kinetics as well as data on the substrate availability to asses if a process really happens. These methods should therefore be complemented by more direct process analyses. Approaches to link microbiota to geochemical processes include to combine microscopy and measured physiology of enrichments (Schulz et al., 1996; Schulz and Schulz, 2005; Boetius et al., 2000; Otte et al., 1999), combine hyperspectral analysis and microsensing (Klatt et al., 2015a, 2015; Merz et al., 2021) or to compare, in well stabilized sediments or microbial mats, the communities and main biogeochemical conversions with high spatial resolution (Ramsing et al., 1993; Teske et al., 1998; Santegoeds et al., 1998; Schramm et al., 1996). These studies were all done in habitats with high activities and unique geochemistry.
1.2 Sample location
The sea floor of the Gulf of Aqaba in the Red Sea may offer a natural laboratory. This habitat is characterized geochemically by only a few studies. These Mn- and Fe-rich sediments showed deep oxygen penetration and low sulfate reduction rates (Blonder et al., 2017; Boyko et al., 2018). The Red Sea is highly oligotrophic and its sea bottom has little organic input, hence chemoautotrophy may be relatively important (Middelburg, 2011). From deeper sediments NH4+, Mn2+ and Fe2+ diffuse upwards, fueling chemoautotrophic processes (Boyko et al., 2019, 2018; Blonder et al., 2017; Steiner et al., 2019). The sediments are aeolian and have a low sedimentation rate of 0.4-0.7 mm per year (Blonder et al., 2017). Bioturbation, inferred from isotope distributions (Steiner et al., 2016), is limited. The bioturbation coefficients at the surface were estimated to be in the order of 10-12 (m2s-1), 3 orders of magnitude lower than the diffusion coefficients of the solutes in the porewater, and rapidly decreasing with depth (Steiner et al., 2016). Therefore, the sediments are considered vertically stratified. Advection in these very fine-grained sediments can be ignored, allowing rates to be calculated from porewater profiles using diffusion-reaction modeling. These physico-chemical characteristics make these sediments a useful system to assess the reflection of the biogeochemical profiles on the community structure.
1.3 Aims and hypotheses
In this contribution, we provide a detailed description of the geochemistry and microbial community composition of sediments from a deep site in the Gulf of Aqaba. We hypothesize that the microbial community is as stratified as the biogeochemical profile, which would allow us to infer which taxa are responsible for the main geochemical conversions: oxidation of Mn2+, Fe2+ and NH4+. We used a combination of centimeter resolution 16S rRNA gene community analysis, geochemical depth profile analyses and flux calculations to comprehensively describe these sediments.
NH4+ oxidation is relatively well confined to described microbial taxa (Beman et al., 2011; De Boer and Kowalchuk, 2001; Martinez-Garcia et al., 2008). Mn2+ and Fe2+ oxidation is much less defined. Chemical Fe2+ oxidation by O2 occurs under pH neutral conditions very fast, thus most biological processing is anaerobic, driven by light (Widdel et al., 1993), Mn-oxides (Jørgensen and Nelson, 2004) or NO3- (Wang et al., 2020). Mn2+ oxidation is thought to be mainly biological by a wide group of microorganisms (Hansel, 2017). Mn-oxide reduction can be both biological and chemical driven by many reduced species such as Fe2+, sulfide and NH4+ (Johnson et al., 2016). The active oxidation and reduction processes can drive rapid Mn cycling in sediments. An important complication of Fe and Mn oxidation is their potential to generate reactive oxygen species (ROS) (Hansel, 2017; Luther, 2010; Dixon and Stockwell, 2014; Koppenol, 1993). These develop upon single electron transfer leading to reduction of O2 to superoxide (O2-.) (Luther, 2010). This radical can be degraded by superoxide dismutase to form the less reactive peroxide H2O2, that subsequently is converted by catalase to O2 and water. ROS species can be highly destructive for life (e.g. the hydroxyl radical OH.) or less toxic (e.g. O2- and H2O2). Although ROS are short-living, their presence in sediments was demonstrated and shown to significantly influence microbial degradation rates (Van Erk et al., 2023). Consequently, Mn and Fe oxidation could have lethal side-effects for microbes without effective ROS defense. The ROS presence was investigated by H2O2 microsensors and porewater analysis by a chemiluminescent method.
In summary, the aim of this study was to link the various spatially separated geochemical processes, inferred from vertical porewater profiles and solid phase chemistry, to the microbial community analyzed by 16S rRNA amplicon sequencing on horizontally sliced sediment cores.
2 Materials and methods
2.1 Study site and sampling
Sampling was conducted in March 2022 and June 2023 in the Gulf of Aqaba, northern Red Sea, aboard the R/V Sam Rothberg. The sampling site was located at 29°28’28.8”N, 34°55’20.2”E, at a water depth of approximately 700 m (Figure 1). A detailed overview of the site and its sediments is described previously (Boyko et al., 2022). Sediments were collected using a multicorer from the ship (MC-400 Hedrick/Marrs Multi-Corer, Ocean Instruments), the coreliners were scrubbed and rinsed with freshwater before each use. Bottom water temperature was ~21 °C—comparable to ambient conditions in the on-site laboratory where all sample processing was conducted. NH4+, dissolved Mn, solid-phase Mn, TOC, O2, pH and H2O2 profiles were determined on sediments sampled in March 2022. Dissolved Fe2+ and microbial analyses were conducted on sediments sampled in June 2023. Because the fixed microbial samples from 2022 had leaked during transport to Bremen, the DNA quality was unsatisfactory and sampling for microbiology was repeated in 2023.
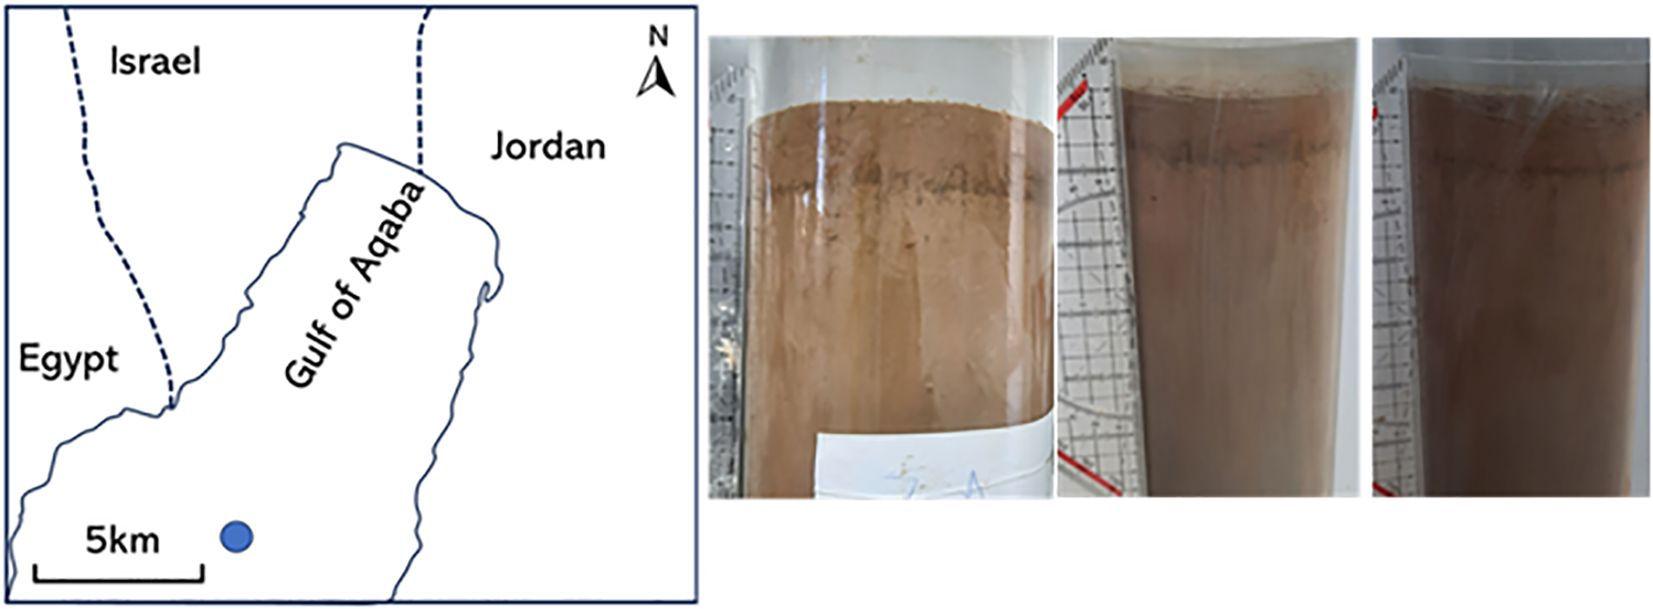
Figure 1. Sample location and sediment characteristics. The sampling station of the sediments, located at 29°28’28.8”N 34°55’20.2”E in the Gulf of Aqaba (left) and several cores showing a clear brown manganese oxide band at 2 cm bsf.
2.2 Sediment and porewater analyses
Sediment cores were collected using liners pre-drilled with holes for porewater extraction using Rhizons (Rhizosphere Research Products, The Netherlands). These were used for microsensor-based and chemiluminescent H2O2 analyses, as well as for Fe²+, Mn2+, NO3−, NH4+, dissolved inorganic carbon (DIC), total organic carbon (TOC). For pore water extraction Rhizons were used at a depth resolution of 1–2 cm, and another core was sliced and centrifuged for solid phase and pore water analysis at depth resolution of 0.5 cm. Porewater was filtered (0.22 µm) and immediately collected into prepared tubes for the respective analyses. O2, and pH profiles were measured using microsensors. O2 and H2O2 microprofiles were obtained using home-built microsensors as described previously (Van Erk et al., 2023; Revsbech, 1989). pH microprofiles were measured using a glass microelectrode (MI-413, Microelectrodes Inc., USA) on the same setup.
For dissolved and solid-phase Mn analyses, three sediment cores were sliced at 0.5 cm intervals from 0 to 5 cm depth. The sediment slices were transferred into 50 mL centrifuge tubes, flushed with N2 (99.999%) and centrifuged for 10 minutes at 9000 rpm (Soto et al., 2023). The resulting supernatant was filtered through a 0.22 µm syringe filter. For dissolved Mn analysis, 100 µL of the supernatant was mixed with 5 mL of 0.1 N HNO3. Following centrifugation, sediments were stored at -20°C.
For solid-phase Mn, sediment was dried at 80°C, ground, combusted at 450°C, and digested in 6 M HCl (100x dilution). Pore water and solid phase Mn concentrations were measured by microwave plasma atomic emission spectrometry (MP-AES, Agilent).
For two of the cores, supernatant for NH4+ analysis and NO3- analyses was stored at -20°C and later transported to the Max Planck Institute in Bremen, where analyses were carried out following previously described protocols (Billerbeck et al., 2006a).
For Fe2+ measurements, porewater was directly extracted through Rhizons (Rhizosphere Research Products) and mixed directly with an equal volume of Ferrozine reagent (0.29 g Ferrozine in 2 mL Milli-Q water) that was pre-filled in the syringes. Samples were stored at 4°C until spectrophotometric measurement at a wavelength of 562 nm.
A separate core was used for analyzing methane (CH4) profiles with 1 cm resolution in porewater as described previously (Sivan et al., 2014). The limit of detection was 4 nM.
For chemoluminescent H2O2 analyses, porewater was extracted through pre-drilled holes in eight sediment cores using Rhizons (Rhizosphere Research Products, The Netherlands). Directly after collection, 100 µL porewater was transferred to a 2 mL tube pre-filled with 100 µL Ferrozine solution (0.29 g Ferrozine in 2 mL mQ water). Subsequently, chemoluminescent H2O2 detection was performed with a home-build system, as described earlier (Van Erk et al., 2023). Daily calibrations of the chemiluminescent H2O2 detection method were performed using a standard range, and catalase was added to selected subsamples to confirm signal specificity to H2O2.
For total organic carbon (TOC), two additional sediment cores were sliced at 1 cm intervals (0–10 cm). The 0–1 cm and 5–10 cm slices were stored frozen and analyzed at MPI Bremen following previously established protocols (Billerbeck et al., 2006b). DIC samples were fixed (5 µL saturated HgCl2 per ml), brought to the MPI Bremen in glass vials with septum (Exetainer, Labco, UK) and analyzed as described previously (Billerbeck et al., 2006b).
The chemicals for these analyses were analytical grade and obtained from Sigma-Aldrich, H2O2 (3% Beyvers GmbH, Berlin) was obtained from a pharmacy.
2.3 H2O2 degradation
H2O2 was added experimentally to high concentrations (100 µM - 1 mM) in the water column, from where it diffused into the sediment, and O2 and H2O2 concentrations were measured using microsensors. This was done on (1) intact sediments to study the effects on sediments above the brown band, (2) with the oxic sediment removed to expose the brown band, and (3) with also the brown band removed to study the effects of H2O2 additions on the anoxic sediment below the brown band.
2.4 Flux and rate calculations
Local fluxes were calculated from the porewater profiles using Fick’s law of diffusion: J = Ds × dC/dx with Ds the diffusion coefficient of the solutes corrected for salinity, temperature and porosity (Van Stroe-Biezen et al., 1993; Li and Gregory, 1974; De Beer et al., 2006), C the concentration and x the depth. The values for Ds used were (in m2s-1): Fe2+ 2.63 ×10⁻⁹, Mn2+ 2.6 × 10⁻⁹, NO3- 7.3 × 10⁻⁹, O2 9.5 × 10⁻¹⁰, NH4+ 7.6 × 10⁻⁹, H2O2 5.9 × 10⁻¹⁰. Conversion rates at specific sediment depths were calculated from the profiles as previously described (Gieseke and De Beer, 2004).
2.5 Microscopy and cell counts
Three sediment cores were sliced at 2 cm intervals, and each sediment layer was preserved in 50% ethanol. To detach bacteria from sediment grains, samples were sonicated on ice with a Sonopuls GM Mini20 probe equipped with a microtip MS 2.5 (Bandelin, Berlin, Germany). Samples were sonicated for 30 s, at an amplitude of 86% and pulse of 0.2 s, sediment was removed using a table centrifuge with 2 ml eppendorf tubes and the supernatant was subsequently diluted 1:100. After dilution, cells were filtered on polycarbonate filters pre-stained with Irgalan Black. Filters were stained with 2 mL of acridine orange, rinsed with sterile-filtered citric acid buffer, and mounted onto glass slides with Cargille immersion oil. Additional staining attempts using DAPI, SYBR Green, and SYBR Gold were unsuccessful due to excessive background fluorescence, which prevented cell identification. Cells were counted using an epifluorescence microscope.
2.6 16S rRNA gene sequencing and community composition analysis
Three sediment cores were collected and sectioned at 1 cm intervals from the surface downward. Each sediment slice (3 mL of sediment) was preserved in 12 mL of LifeGuard® solution to stabilize nucleic acids. One DNA extraction per sample was done using the PowerSoil® Kit (QIAGEN, Hilden, Germany), following the manufacturer’s protocol. PCR amplification was performed for 34 cycles using the primers Bac-341F (CCTACGGGNGGCWGCAG) and Bac-805R (GACTACHVGGGTATCTAATCC) (Herlemann et al., 2011), and purified using AMPure XP beads (Beckman Coulter, California, USA). Sequencing was conducted on an Illumina NextSeq 2000 platform, generating 2 × 300 bp paired-end reads at the Max Planck Genome Center Cologne. All samples were sequenced in the same run.
Raw sequences were demultiplexed with Cutadapt v1.15 and processed using DADA2 v1.3 (Callahan et al., 2016) for quality filtering, denoising, and amplicon sequence variant (ASV) inference. Raw sequences were filtered based on length (reads shorter than <200 base pairs were removed) and maximum number of expected errors (2 for forward reads, and 3 for reverse reads). Taxonomic assignment was done using the SILVA database (silva_nr99_v138.1_train_set.fa.gz). Before any analysis, sequences classified as chloroplasts and mitochondria were removed, and only bacterial reads classified at the phylum level were kept. ASVs were filtered by length (>396 and <430 bp), and those that were observed in only one sample were removed, regardless of their abundance. We suspect those sequences to be largely PCR artifacts and preferred to have a rather conservative analysis when it comes to community composition and diversity. The proportion of ASV retained after each step is shown in Supplementary Table 1. Once the dataset was filtered, diversity analyses were done at the ASV level using the iNEXT package (Hsieh et al., 2016), standardizing for 99% sample coverage, which was the achieved coverage for most samples (for rarefaction curves, see Supplementary Figure 6S). Community composition was remarkably similar between cores with most sequences not being classified at the genus level. Therefore, the community composition analysis was done at the family level over the average community between the three cores (community composition at the genus level for each core is shown in Supplementary Figure 7S). Since our objectives regarding community analysis were mostly descriptive and exploratory, no statistical tests were applied. Instead, data is presented to show trends of the microbial community across depth.
3 Results
3.1 Geochemistry data
The sediments consisted of very fine light colored clay with a porosity of 0.7 and a grain size of 45 µm (Rasheed et al., 2003). No faunal activity or worm burrows were observed in any of the cores. Due to the fine grainsize the transport of porewater solutes was purely diffusional (Wilson et al., 2008; Shepherd, 1989). In all sampled cores a characteristic brown band was observed at 2 cm below the surface (Figure 1). This coincides with the Mn solid phase maximum (Figure 2).
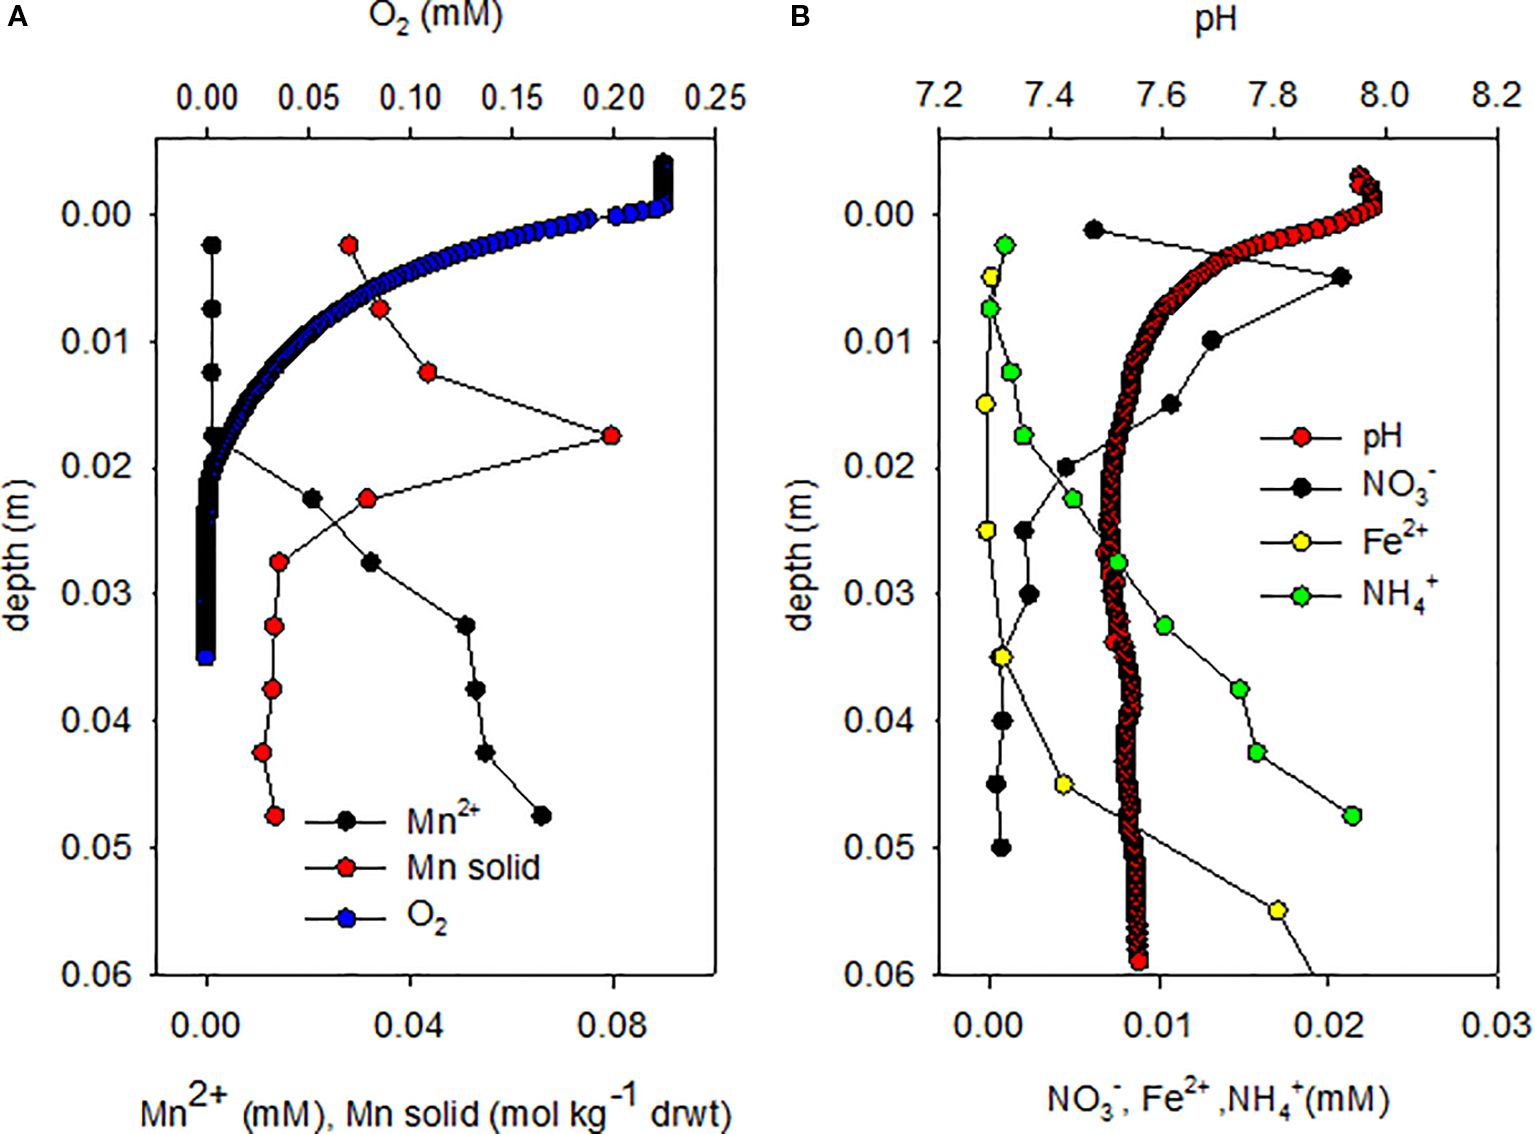
Figure 2. Geochemical profiles. Geochemistry data showing (A) solid Mn, dissolved Mn and O2 profiles, and (B) porewater profiles of pH, NO3-, Fe2+ and NH4+.
Porewater depth profiles (Figure 2) and fluxes derived from these porewater profiles (Table 1) show occurrence of various aerobic and anaerobic microbial processes. O2 diffuses from the water column downwards. From larger depths NH4+, Mn2+ and Fe2+ diffuse upwards and are oxidized at slightly different depths. NH4+ diffusing upwards from the anoxic zone penetrates 1 cm into the oxic zone. Mn2+ disappears in the brown band where also the maximum in solid phase Mn is found. Fe2+ diffusing upwards disappears 1–2 cm below the brown band, in the anoxic zone.
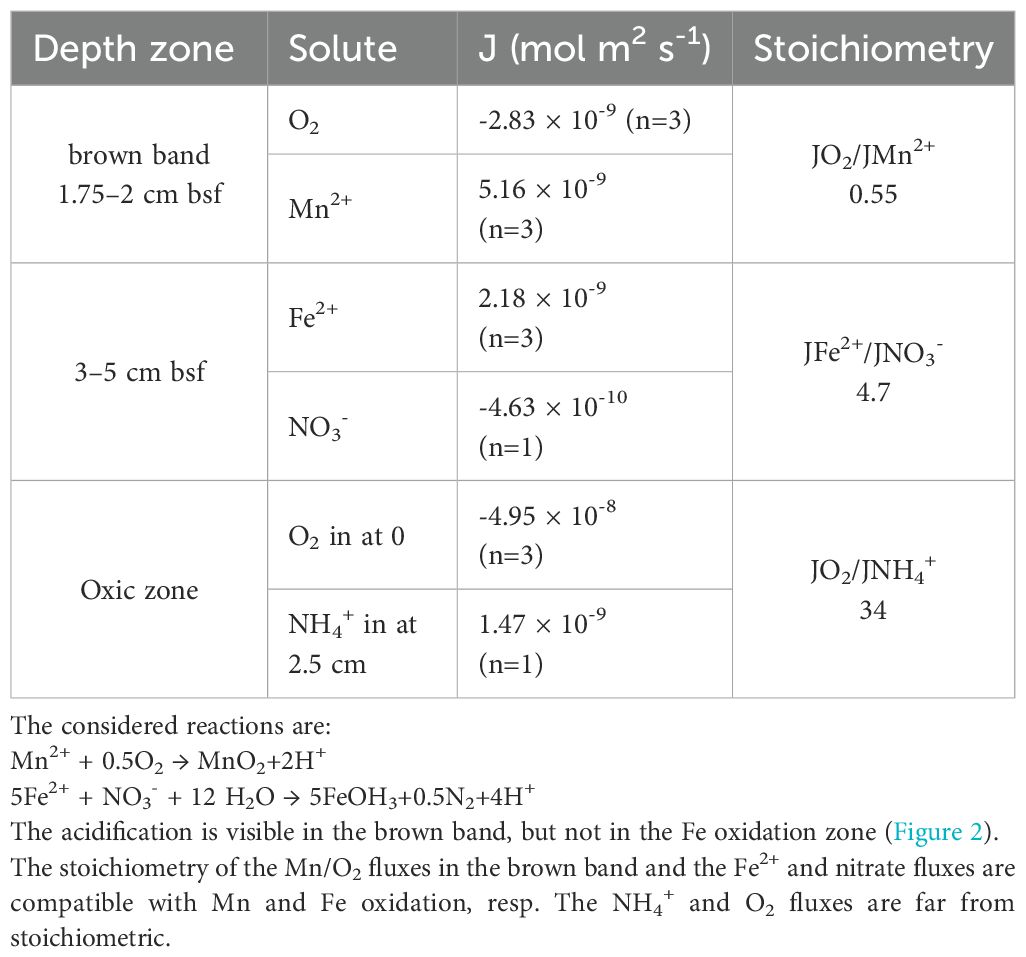
Table 1. Fluxes of Mn2+ and O2, and Fe2+ and NO3-, resp. into their overlapping zones.
The brown band was colored by Mn-oxides, as exactly at that depth the solid Mn content showed a maximum (Figures 2A; Supplementary Figure 2S). O2 diffusing downwards meets Mn2+ diffusing upwards (Figures 2A; Supplementary Figure 2S) in the brown band, driving aerobic Mn2+ oxidation. Porewater solute fluxes were calculated using Fick’s law of diffusion (Table 1). The O2 flux into the band was half of the Mn2+ influx into this zone, close to the stoichiometry of aerobic Mn2+ oxidation (Mn2+ + 0.5O2→MnO2 + 2H+). Thus, the brown band is the location where all upwards diffusing Mn2+ is oxidized aerobically.
The curvature of the oxygen profile indicates a homogeneously distributed oxygen consumption in the oxic zone above the Mn2+ containing zone, by both NH4+ diffusing upwards from the anoxic zone (Figure 2B) and organic matter deposited from the water column. The O2 flux from the sediment surface downward is approximately 30x higher than the upward NH4+ flux into the oxic zone (Table 1). This is far above the stoichiometry of nitrification (NH4+ + 2O2→ NO3- + H2O + 2H+). Hence all NH4+ diffusing into the oxic zone can be oxidized by nitrification. Nitrification in the oxic zone results in elevated NO3-, with a maximum just below the sediment surface. From its maximum NO3- diffuses partially downwards into the anoxic zone below the brown band, and partially upwards into the water column. Besides NH4+, additional e-donor is needed to explain the O2 consumption in the oxic zone, which is probably organic matter. Indeed TOC (Supplementary Figure 1S) decreases linearly with depth, indicating gradual degradation. The DIC profile mirrors the TOC profile, except at the highest point at 1 cm below the seafloor (bsf), likely due to out-diffusion into the water column.
The Fe2+ diffusing upwards disappears in the anoxic zone just below the Mn-enriched brown band. This could be due to anaerobic oxidation with NO3- as e-acceptor. The flux of Fe2+ is approximately 5x the flux of NO3- into their overlapping zone (Table 1), close to the stoichiometry of Fe oxidation via NO3- (5Fe2+ + NO3- + 12 H2O → 5Fe(OH)3 + 0.5N2 + 9H+). The slight pH minimum at 4–5 cm bsf supports the possibility of this process.
CH4 concentrations showed no trend with depth in the upper 25 cm. They were on average 2.3 nM, all values were below the detection limit (data not shown).
No other processes can be inferred from our geochemical data. Although NO3- and NH4+ overlap, the profiles do not indicate the presence of ANAMMOX, the anaerobic oxidation of NH4+ by NO2-, as the NH4+ profile does not show depletion or a curvature in this zone. No net NH4+ oxidation occurs in the anoxic zone, as there the profile is linear.
The oxidation of metals, like Mn2+ and Fe2+, can result in the formation of reactive oxygen species (ROS) (Luther, 2010; Jomova et al., 2012). ROS was shown to significantly decrease organic matter mineralization rates (Van Erk et al., 2023). Therefore, we expanded the study to H2O2 and its cycling. H2O2, measured both by chemiluminescence analysis on extracted porewater and by microsensors, was low but significantly present in the porewater, also in the anoxic zone below 2 cm (Supplementary Figure 3S). The concentrations measured by both methods were approximately 1 µM. The H2O2 microsensors became erroneous below the brown band, possibly by an interference. Porewater H2O2 measurements using chemiluminescence resulted in similar concentrations of H2O2 throughout most of the sediment (Supplementary Figure 3S). Addition of catalase to a selection of extracted porewater samples reduced the signal to zero, confirming that measured signals were indeed H2O2. Porewater samples were directly mixed with a Ferrozine solution (an Fe2+ scavenger) during porewater extraction, inside the syringe used for extraction. Thus Fe2+ interferences could be excluded.
H2O2 addition experiments showed H2O2 degradation under simultaneous O2 evolution, indicating a catalase-like process: 2H2O2→2H2O + O2. This process could be observed in sediments above the brown band and in the brown band, but not in the sediments below the brown band (Supplementary Figure 4S).
From the profiles the kinetic parameters of H2O2 degradation were estimated using diffusion-reaction modeling (Gieseke and De Beer, 2004). Each profile represents a range of concentrations and local degradation rates. The rates were linearly proportional to the concentration, as occurs under first order kinetics (Supplementary Figure 5S). The first order reaction rate constant C was 0.00206 (s-1) above the brown band and 0.00288 (s-1) within the band. The rates in the zone above the bands showed larger variations than in the band due to variable MnO2 content.
3.2 Microbial community analysis
The cell numbers decreased from 2 × 10⁹ cells mL−¹ at the sediment surface to approximately half of this value at 8–9 cm depth (Figure 3A). Notably, a local minimum was observed at the brown band in all 3 cores, below which cell numbers increased again.
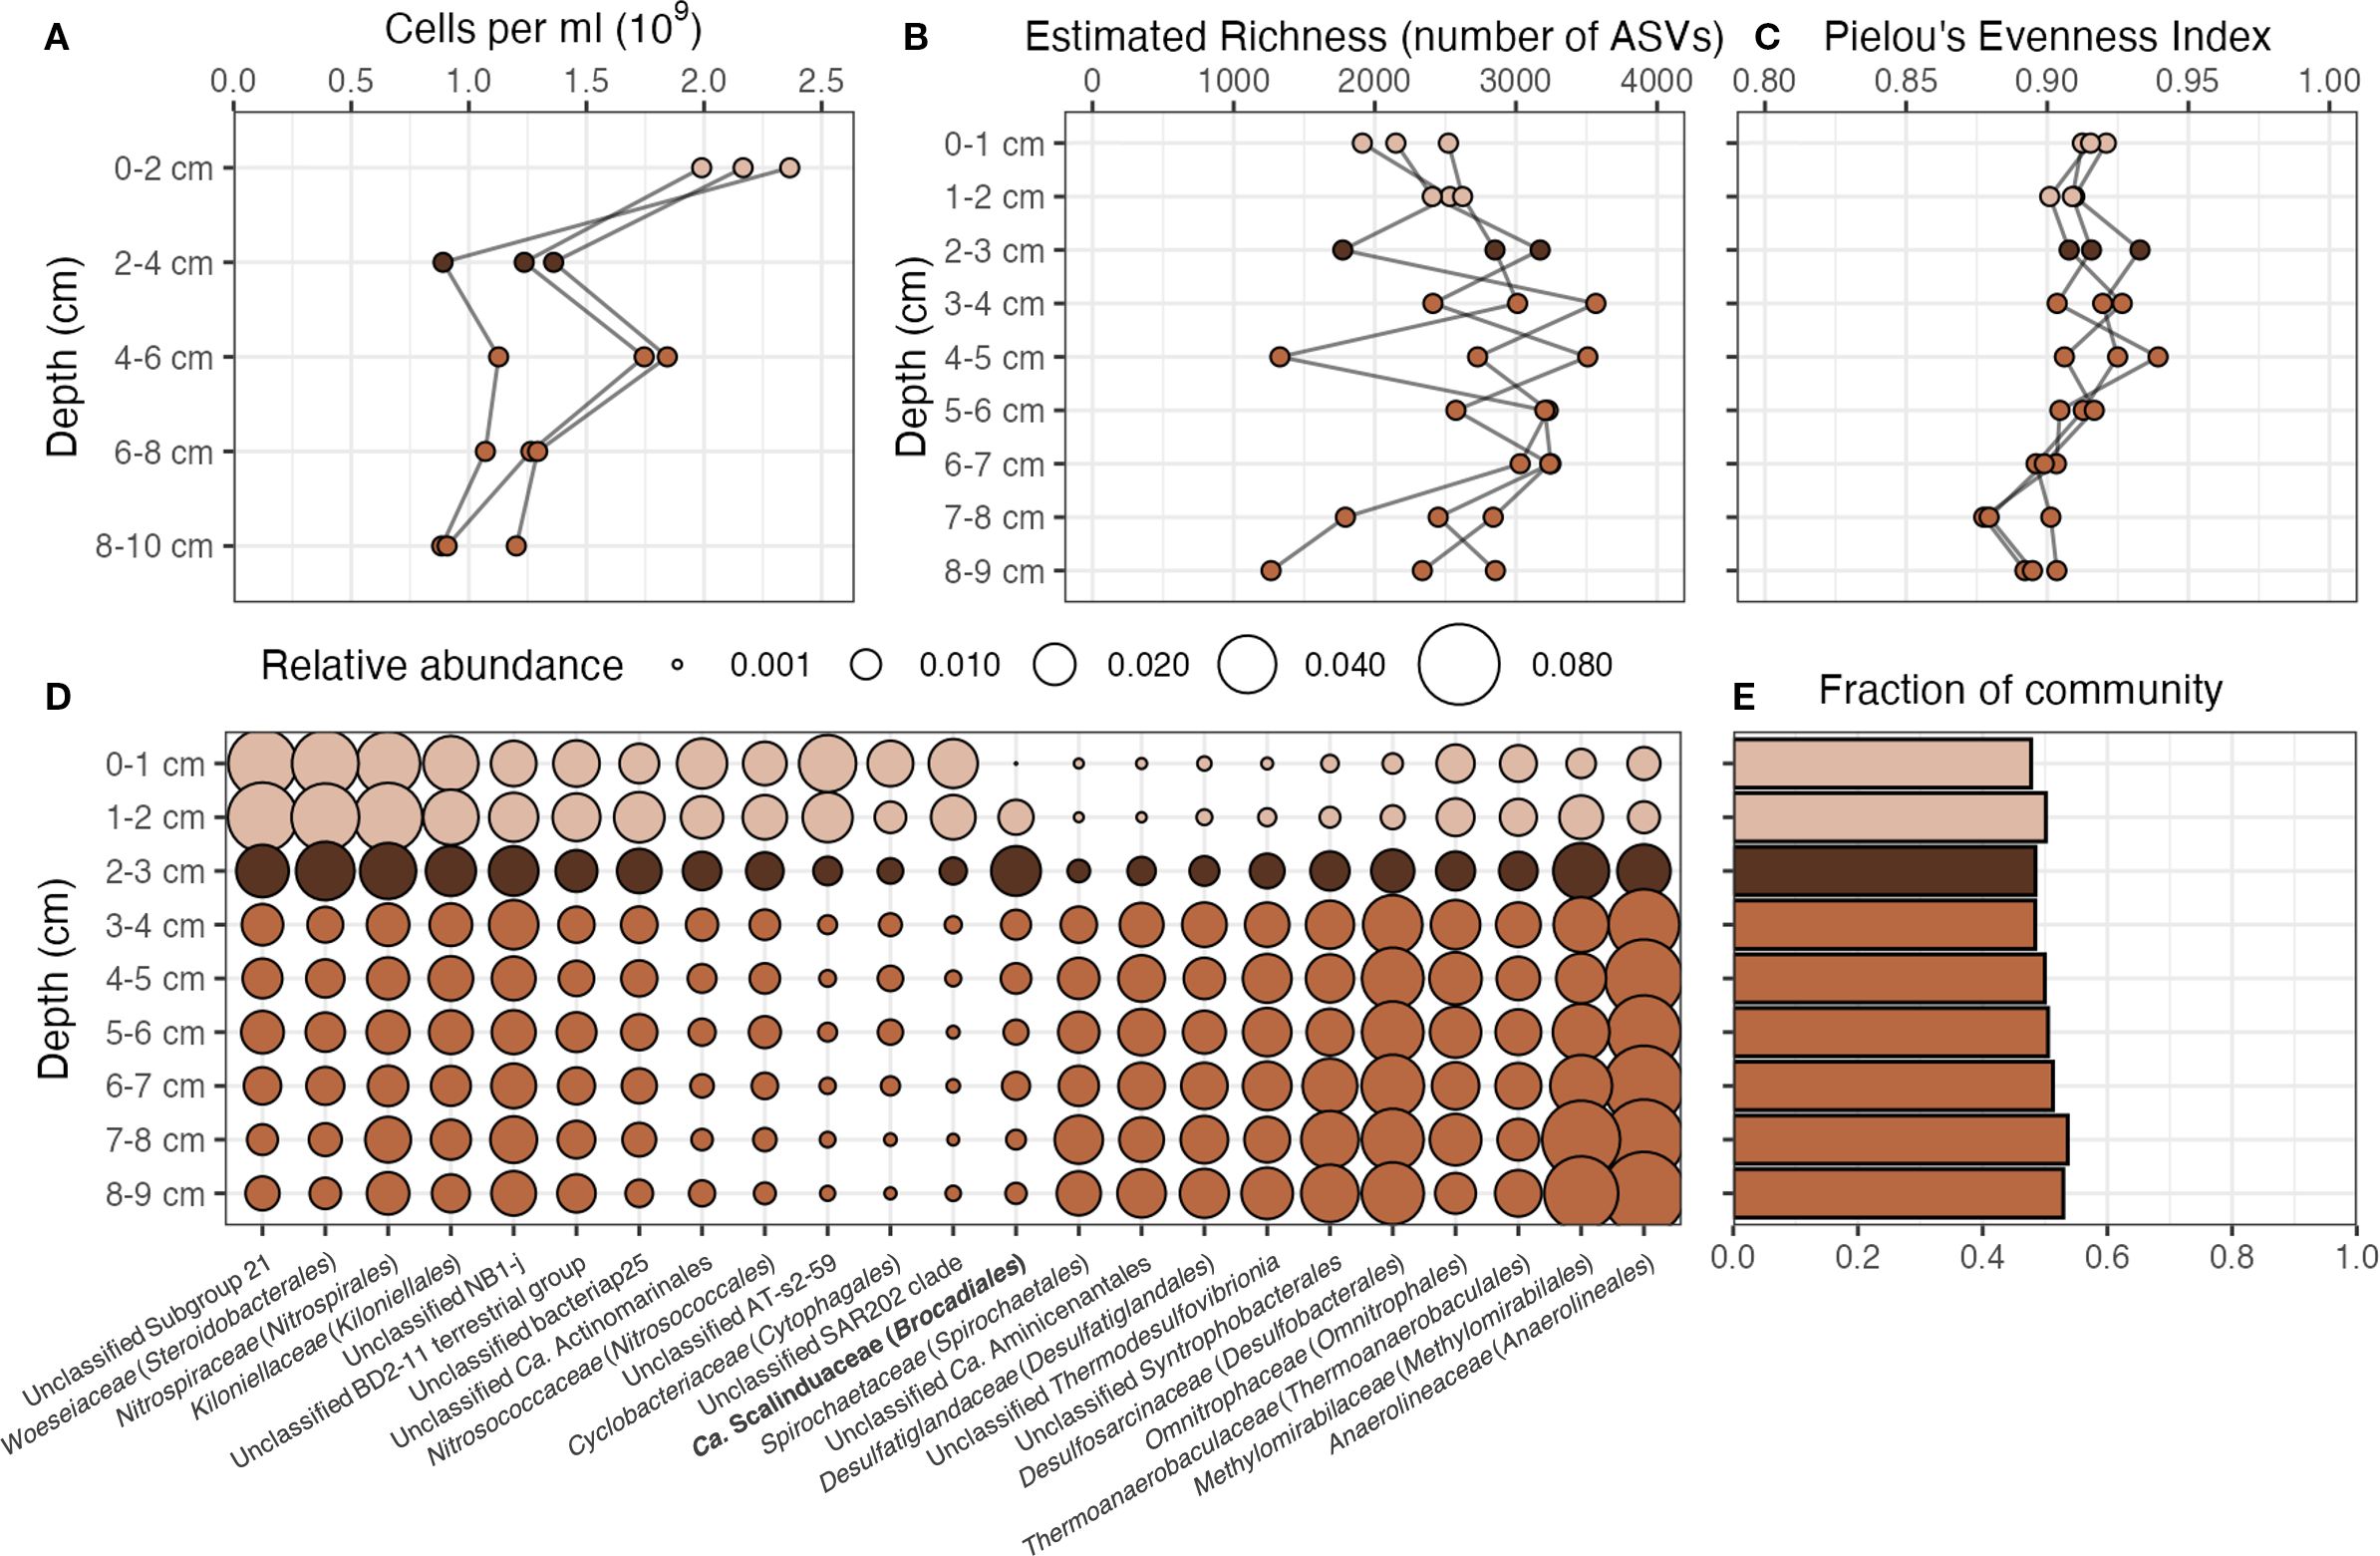
Figure 3. Microbial community analysis: abundance, richness, evenness and composition. (A) Cell counts across depth for each core. Cell numbers decreased with depth, with a local minimum at the brown band. (B) Estimated Richness (number of ASVs) at 99% community coverage for each core across depth. (C) Pielou’s evenness index for each core across depth. (D) Average relative abundance of the most abundant families across cores. The bar plot (E) shows the sum of the relative abundances of the families in the bubble plot. The light brown color indicates the slices of the cores that were above the manganese brown band, the dark brown color indicates the brown band, and the middle brown color indicates the slices of the cores that were below the brown band. Scalinduaceae, the only group that peaked at the brown band, is shown in bold.
Estimated richness, defined as the number of ASVs at 99% community coverage, was between 1264-3566 (Figure 3B), and exhibited a slight increase below the brown band. Evenness, estimated by Pielou’s evenness index, was exceptionally high and constant across depth with a mean value of 0.91 and a standard deviation of 0.014, with a slight decrease towards the deepest layers. It indicates a balanced community distribution and no dominant single taxonomic group at any depth.
All three cores were remarkably similar, and the community composition showed clear changes with depth (Figure 3D, see Supplementary Figure 8S for MDS plot on Jensen-Shannon distances between communities). Together, 13 families and 10 groups not classified at the family level showed more than 2% in at least one sample, and in total, they accounted for about 50% of the community at any given depth (Figure 3E). All of these groups were present at all depths, with some of them showing clear changes in their relative abundances with depth, while others remained more constant (Supplementary Figure 9S). Woeseiaceae, Nitrospiraceae, Nitrosococcaceae, and Cyclobacteriaceae, together with unclassified groups from Ca. Actinomarinales, ‘Subgroup 21’, ‘AT-s2-59’, and ‘SAR202 clade’ were more abundant above the brown band than below, while Spirochaetaceae, Desulfatiglandaceae, Desulfosarcinaceae, Methylomirabilaceae, and Anaerolineaceae, together with unclassified groups from Aminicenantales, Thermodesulfovibrionia, and Syntrophobacterales, were more abundant below the band than above. Sequences belonging to archaeal Nitrosopumilus were also found above the brown band, but were not included in the analysis (see Methods). Ca. Scalanduaceae was the only group that peaked at the brown band. Kiloniellaceae, Omnitrophaceae, Thermoanaerobaculaceae, together with unclassified groups from “NB1-j”, “BD2–11 terrestrial group”, and “bacteriap25” showed fairly stable relative abundances, with little variation across depth.
4 Discussion
The biogeochemistry of the Gulf of Aqaba sediments pore water shows a well-defined stratification, consistent with the fine-grained clay deposits where solute transport is mainly driven by diffusion (Boudreau, 1996). This allows a one-dimensional interpretation of the geochemical data, as the stratification is homogeneous with depth (summarized in Figure 4). Oxygen penetration reaches 2 cm, NH4+ oxidation occurs in the oxic zone, Mn2+ oxidation occurs in the brown band, at 2–3 cm bsf, and Fe2+ oxidation by NO3- takes place between 3–5 cm bsf. Organic matter degradation is slow and occurs gradually across both oxic and anoxic zones. This biogeochemistry is reflected in the community structure, where major families change in relative abundance and distribution with depth.
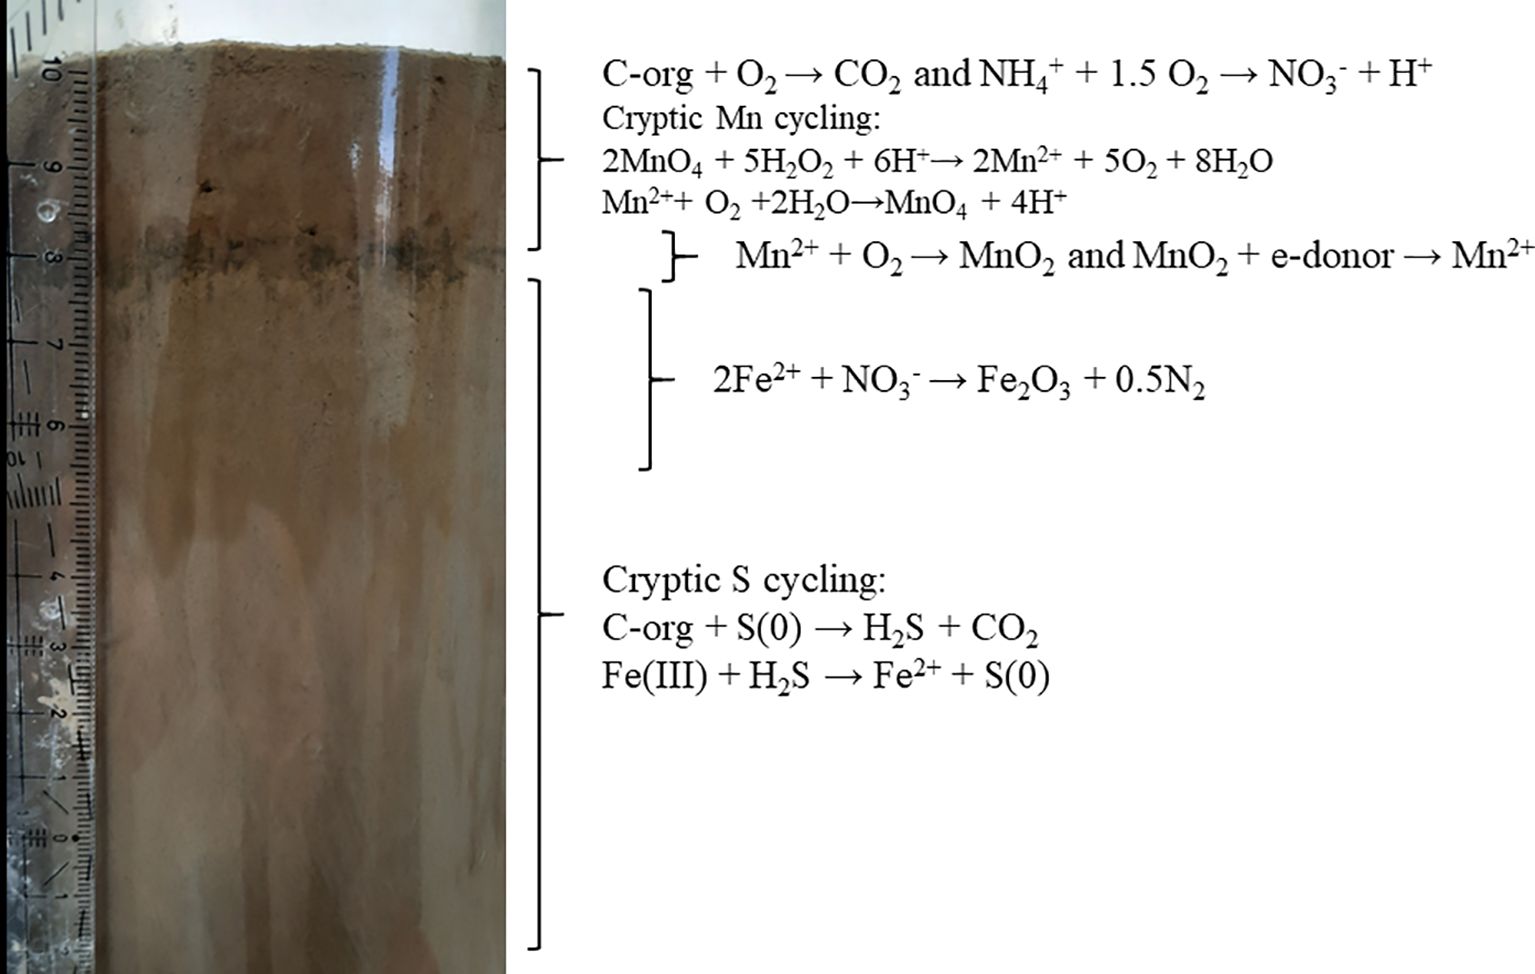
Figure 4. A summary of the distribution of the measured and inferred processes. The cryptic S cycling was documented previously (Blonder et al., 2017; Boyko et al., 2022).
From the calculated fluxes (Table 1) we assessed the importance of autotrophy versus heterotrophy by assuming that O2 is used directly or indirectly to oxidize the input of all reductants. We conclude that while Mn oxidation is indeed the most important autotrophic process, the O2 influx is primarily used for the oxidation of organic input. Identified autotrophic substrates are Mn2+, Fe2+ and NH4+. Although Fe oxidation occurs via NO3- reduction, the NO3- is produced aerobically, hence also in the end is driven by O2. It was documented that the sulfur cycle is cryptic and occurs below the oxic zone (Blonder et al., 2017; Boyko et al., 2022), hence requires no net input of O2. The stoichiometries of the Mn2+, Fe2+ and NH4+ oxidation processes are respectively 0.5, 0.25 and 2 for O2 according to the reactions:
Multiplying the upward fluxes of the reductants with the O2 stoichiometry results in their ultimate O2 consumption. The most important autotrophic process for the sedimentary O2 consumption is Mn oxidation, amounting to 2.6 × 10⁻⁹ (mol m-2s-1), followed by NH4+ oxidation, 7.4 × 10⁻¹⁰ (mol m-2s-1) and Fe oxidation, 5.4 × 10⁻¹⁰ (mol m-2s-1). The sum of these autotrophic processes is approximately 10% of the total O2 flux into the sediment (Table 1). Thus 90% of the O2 consumption must be heterotrophic, coupled to the oxidation of organic matter. Autotrophy was lower than expected, considering the highly oligotrophic nature of the Red Sea (Berninger and Wickham, 2005). However, the contribution of autotrophy to total O2 respiration is higher than in the open ocean where the autotrophic contribution is on average 2% (Middelburg, 2011). In absence of external input of reduced substances, for example by seepage, chemoautotrophy depends on the supply of NH4+, Fe2+ and Mn2+ from anaerobic heterotrophic degradation processes. These clearly continue in the anoxic zone, as it is a net supplier of these reductants. Chemoautotrophy may also occur as cryptic processes in the oxic zone, where most of the heterotrophic processing occurs.
A notable feature of the sediment is the brown band, where most Mn2+ oxidation occurs. Mn oxidation is thought to lead to enhanced ROS formation (Hansel, 2017; Jofré et al., 2021), via the biological reaction.
while O2- can subsequently rapidly decompose to H2O2 (Hansel, 2017). However, accumulation of H2O2 in the band was not observed. We did detect ROS in minute but significant quantities, even in the anoxic zone (Supplementary Figure 3S). A peak was observed near the sediment surface, probably as by product of aerobic respiration. The pool is highly ephemeral, subjected to local production and consumption processes. We determined the H2O2 consumption kinetics which appeared first order, thus allows to calculate the H2O2 turnover from the measured concentrations. Under first order kinetics, rates can be calculated by multiplying the concentration by the rate constant C [R= C × [H2O2] (Lehninger, 1970)]. The average concentration above the band was 0.74 × 10⁻³ (mol m-3), the corresponding degradation rate was 1.5 × 10⁻⁶ (mol m-3 s-1), resulting in a residence time of 485 (s) or approximately 8 minutes. This is much shorter than the reported turnover time in seawater, where concentrations are mostly 0.3 × 10⁻³ (mol m-3) or less, and half-lives are in the order of hours to days (Morris et al., 2022). The short residence time indicates catalysis with a significant volumetric activity. The H2O2 consumption rate was half of the volumetric O2 respiration rate of 2.86 × 10⁻⁶ (mol m-3 s-1). The volumetric O2 respiration rate was calculated from the influx (Table 1) divided by the penetration depth (2 cm). It should be noted that the electron flow per molecule of H2O2 is half that of O2, thus the H2O2 turnover is approximately 25% of the O2 turnover, expressed per electron transfer. The H2O2 degradation by catalase and MnO2 produces again O2, hence forms a closed cycle. Remarkably, below the brown band H2O2 was not degraded, and thus, it is a stable porewater component, at low concentrations.
The H2O2 degradation occurred only in and above the brown band. This could indicate that the microorganisms do not produce catalase below the brown band. However, also below the brown band approximately 1 µM H2O2 was measured. Alternatively, the H2O2 degradation occurs by MnO2, a well-documented chemical process (Do et al., 2009):
Both catalase and MnO2 degrade H2O2 in an identical first-order process, producing O2. The H2O2 degradation rates link very well with the solid phase Mn distribution. Below the brown band there was no catalase-like activity, the highest rates were in the brown band, while above the brown band the rates were lower and more variable. Thus, some of the H2O2 degradation may well be catalyzed by the MnO2. This process produces Mn2+, that is instantly re-oxidized to below detection in the oxic zone. This implies a cryptic Mn cycle above the brown band.
The fixed microbial samples from 2022 had leaked during transport to Bremen, thus the DNA quality was unsatisfactory and sampling for microbiology was repeated in 2023. The cores taken in the different years were visually the same, were taken from the same location and in the same season, the sediment accumulation is ca 0.7 mm/year (much less than the spatial resolution of our slicing). The porewater Mn2+ profiles, measured in 2023 in cores parallel to those for microbial analyses (Supplementary Figure 2S), showed similar concentrations and also depletion in the upper 2 cm. Therefore, we assume good comparability between the geochemical data from 2022 and microbial data from 2023.
The microbial community is also well-stratified, be it less clear than the net geochemistry. The brown band exhibits relatively low cell numbers, despite their potential for enhanced primary production driven by aerobic Mn oxidation. The reduced number of cells does not appear to be caused by elevated ROS, at least not by H2O2, as no elevated H2O2 was detected. Instead, another inhibitor might be the reason, e.g., the intermediate of Mn oxidation Mn3+, which is a strongly oxidizing compound (Morgan Chan et al., 2018; Hansel, 2017). The notable maximum of Ca. Scalanduaceae suggests that ANAMMOX (Van De Vossenberg et al., 2013; Woebken et al., 2008; Lodha et al., 2021) occurs at the brown band, as it is a well-characterized metabolism of this taxonomic group. Furthermore, it can be predicted that nitrifiers (e.g., Nitrospiraceae) and Ca. Scalanduaceae would compete for NO2- in the sub-oxic layer. If this is the case, ANAMMOX would not be confined to the MnO2 brown band and in principle could happen below the band as well, which is also reflected in the relative abundance of Scalinduaceae. The reduction of MnO2 might be coupled to the oxidation of NH4+ by ‘mangananammox’ (Avendaño et al., 2024; Cheng et al., 2022; Javanaud et al., 2011). Under this scenario, we suggest that Ca. Scalanduaceae would reduce MnO2, possibly with NH4+ and produce N2 or NO2-, which would be oxidized to NO3- by Nitrospiraceae (Kuypers et al., 2018). Previously, close association between Mn-oxides and Ca. Scalanduaceae was observed in marine sediments (Shulga et al., 2022). Indeed, an enrichment of Ca. Scalanduaceae was shown to couple the reduction of MnO2 to the oxidation of NH4+ (Yu et al., 2021). It thus seems that in this sediment Ca. Scalanduaceae is more likely to consume MnO2 instead of producing it. The Mn reduction on NH4+ must be slow, as the profiles do not show a conspicuous NH4+ consumption at the brown band.
It should be emphasized that the MnO2 pool in the brown band is not permanent, but in a steady state subjected to continuous oxidation and reduction processes (Johnson et al., 2016). The reduction processes cause the solid phase of Mn (e.g., MnO2) to decrease below the brown band, while the oxidation processes cause the depletion of the soluble state of Mn (e.g., Mn2+) above the brown band. With gradual sedimentation (approximately 0.7 mm per year), the brown band moves upwards in par with the rising sediment surface, resulting in an equal amount of MnO2 and Mn2+ produced at the brown band and below the brown band, respectively. Obviously, the oxidation process in the brown band is so efficient that it prevents breakthrough of dissolved Mn into the oxic zone. The oxidation of Mn2+ must be biotically driven, as chemical oxidation is very slow (Morgan et al., 2021). Mn2+ oxidation can be performed by a very wide diversity of bacteria and eukaryotes (Wang et al., 2022; Zhou and Fu, 2020; Tebo et al., 2005). As mentioned above, the Ca. Scalanduaceae are thought to perform NH4+ oxidation by MnO2, thus driving the Mn-reduction. No other family of bacteria is associated with the brown band besides Ca. Scalanduaceae, thus we have no clear evidence which organisms drive the Mn oxidation in this sediment. As no other group was found in abundance in the brown band, it is tempting to propose that Ca. Scalanduaceae might do both, reduce MnO2 and oxidize Mn2+. Reversal of metabolic pathways have been shown before, e.g. sulfate reducers were shown to also be able to oxidize sulfide (while also producing ATP) (Cypionka, 2000) and anaerobic CH4 oxidizers can also produce CH4 (Lloyd et al., 2011). Of course, it is well possible that other families are involved in the Mn-oxidation. Further studies focusing on rigorous physiological analysis, either on isolates and enrichments or using -omics data should be done in order to assign these metabolic pathways to specific members of the community.
Above the brown band, where high concentrations of O2 and NO3- are detected, Woeseiaceae, Nitrospiraceae, Nitrosococcaceae, Cyclobacteriaceae, and others groups of unclassified bacteria dominate. Woeseiaceae typically comprise aerobic chemoheterotrophic bacteria (Wiese et al., 2020) and are usually found in oxic sediment layers. Nitrospiraceae, a well-known group of nitrifiers (Kuypers et al., 2018), are thought to be producing the NO3- maximum right below the surface, which then diffuses to the water column and downwards in the sediment where denitrification should occur. The Nitrosococcaceae and Nitrosopumilaceae are thought to drive the aerobic oxidation of NH4+ (Kuypers et al., 2018) in the oxic layers. Cyclobacteriaceae was comprised mostly by unclassified sequences at the genus level, which challenges any inference on their metabolism. Same is the case for those groups not classified at the family (or order) level. This study, like many other surveys of remote habitats, highlights the need to improve microbial taxonomy and shows how much we still have to learn about the functions of microorganisms in the environment.
Below the brown band, where O2 and NO3- are exhausted, and sediments are at least several decennia old, the microbial community changes completely. At this depth, cell numbers are half of those found at the surface, and groups characterized as strict anaerobes dominate. Desulfosarcinaceae and Desulfatiglandaceae, show a dramatic increase in their relative abundances, despite sulfate reduction rates being below detection limits (Boyko et al., 2022). Anaerolineaceae, whose relative abundance is the highest in the anoxic layers, along with Spirochaetaceae and Thermoanaerobaculaceae, are typically described as strictly anaerobic chemoheterotrophic bacteria and fermenters (Yamada and Sekiguchi), and it is therefore not surprising that they are found in higher relative abundances below the band (where oxygen is depleted). Groups whose relative abundance seem constant across depth (Kiloniellaceae, Omnitrophaceae, Thermoanaerobaculaceae, ‘bacteriap25’, ‘NB1-j’, and ‘BD2-11’) have been documented before in marine sediments, however, no specific metabolic characteristics have been described, and thus their ecological role remains elusive. Omnitrophaceae, has been proposed to reduce NO3- (Williams et al., 2021). Omnitrophaceae have magnetosomes (Kolinko et al., 2016) which is typical for motile cells, which explains their presence in the oxic zone. At deeper layers, the sediment does not show measurable biogeochemical activities, although cryptic sulfur and iron cycling are thought to occur (Boyko et al., 2022). A candidate for Fe oxidation is not evident from our data. Fe2+ can be oxidized by MnO2 but it clearly occurred far below the MnO2 band. Fe2+ and NO3- overlap at 3–5 cm bsf, where both are consumed. NO3- driven Fe oxidation requires microbial catalysis (Straub et al., 1996) but in the relevant zone between 3 and 5 cm bsf no especially abundant community was observed. The increased abundance at 8 cm bsf of Methylomirabilaceae is puzzling. The only characterized metabolism of this family is from Methylomirabilis oxyfera which can couple the oxidation of CH4 with NO3- reduction (Wu et al., 2011). NO3- was certainly absent at that depth. CH4 was below the limit of detection (>4 nM) and can be considered absent. Even when accepting concentrations as low as 2 nM, CH4 fluxes and thus metabolic CH4 conversions will be effectively absent and cannot maintain a significant CH4 cycling community. This indicates that the Methylomirabilaceae in this sediment harbor alternative metabolic activities, or that these bacteria grew during a CH4 event in the past and are highly resilient.
Remarkably, most of the groups present in the oxic layer still show relative abundances between 2-3% below the band, where oxygen is not detected. The opposite, however, is rarely the case (with the notable exception of the motile Omnitrophaceae): families that dominate the anoxic zone are rarely found in the oxic layers. This observation cannot be explained by the reported bioturbation (Steiner et al., 2016). Infauna may mix sediments near the surface, but bioturbation attenuates rapidly with depth. This results in an upward redistribution of sediment signatures or any geological marker, which is the opposite of what we observed: we see more aerobic microbes in the anoxic zone than anaerobes in the oxic zone. Using the equations proposed by Steiner (Steiner et al., 2016) sediment reworking decreases about 10 fold per 2 cm depth. The attenuation of the effects of fauna is even faster as bioturbation in anoxia, below the brown band, is unlikely. The observed absence of anaerobes in the oxic zone and presence of aerobes in the anoxic zone may be rather explained by the history of the upward moving anoxic zone during ongoing sedimentation: the anoxic sediments have an aerobic history during which an aerobic community established and they could apparently maintain for decennia after becoming anoxic. The oxic zone has never been anoxic, thus anaerobic microorganisms had no chance to establish there. At deep layers, diversity will not only reflect living and active communities, but also those that can simply survive at extremely low metabolic rates or are dormant (Bradley et al., 2019). Hence, translation of a community description to a functional analysis must be done with care.
5 Conclusion
The progress in taxonomic knowledge has surpassed the understanding of the metabolisms in natural habitats, but without knowing their associated functions taxonomic data have limited informative value. Our work aimed for a comprehensive in situ description of the microbial community from a biogeochemical and taxonomic perspective. However not straightforward, our approach allowed us to infer connections between the two. Clear patterns in the geochemical profiles and microbial community composition were identified above, in, and below the manganese-rich brown band. Even under such special physico-chemical conditions, complicating factors have to be taken into account: sediment mixing, motility of bacteria, unexpected metabolic flexibility, resilience and others. It must also be recognized that not all significant processes are easily detectable. Cryptic element cycling is virtually invisible by most geochemical analyses, but will drive local metabolic activities and development of communities. Examples of cryptic cycling are the reported S cycle in the anoxic zone (Boyko et al., 2022), and the H2O2-driven Mn cycling in the oxic zone. The history of the sediment layers should also be taken into consideration, as in deeper zones microbes might be buried, are dormant and no longer active, while still show up in a DNA analysis. We could define zones of specific activities, but not associate these with local microbial communities. Still, rather than giving unambiguous descriptions on the role of specific microbes in the environment, our approach serves a solid ground for new questions and hypotheses, and adds to the characterization of remote and unexplored habitats.
Data availability statement
The original contributions presented in the study are included in the article/Supplementary Material. Further inquiries can be directed to the corresponding author. Sequences were deposited in the European Nucleotide Archive (ENA) under accession numbers PRJEB89874.
Author contributions
SS-S: Conceptualization, Data curation, Investigation, Methodology, Validation, Visualization, Writing – original draft, Writing – review & editing. MvE: Formal analysis, Investigation, Methodology, Writing – original draft, Writing – review & editing. GA: Data curation, Formal analysis, Methodology, Visualization, Writing – original draft, Writing – review & editing. KK: Data curation, Formal analysis, Methodology, Supervision, Writing – review & editing. SB: Formal analysis, Methodology, Writing – review & editing. DdB: Conceptualization, Formal analysis, Funding acquisition, Investigation, Methodology, Project administration, Resources, Supervision, Visualization, Writing – original draft, Writing – review & editing.
Funding
The author(s) declare financial support was received for the research and/or publication of this article. Part of the work was funded by the Israeli Science Foundation (grant #2010/24). MvE obtained a Minerva short-term research grant from the Max Planck Society.
Acknowledgments
We are grateful for the hospitality of the staff of the Interuniversity Institute in Eilat, for their help with the sediment sampling and we thank Murielle Dray for assistance with the shipping of the equipment. We thank Sivan Orit (Ben Gurion University, Beer Sheva) for help with the CH4 analyses. We would like to thank the members of the NEGEV Lab, Raoul Saar, Neta Soto, and Avinesh Kumar, for their assistance in the field and analysis. We thank Kathrin Büttner, Mirja Meiners, Gaby Eickert, Ines Schroeder and Karin Hohmann of the MPI-MM for various analyses and microsensor manufacturing.
Conflict of interest
The authors declare that the research was conducted in the absence of any commercial or financial relationships that could be construed as a potential conflict of interest.
The author(s) declared that they were an editorial board member of Frontiers, at the time of submission. This had no impact on the peer review process and the final decision.
Generative AI statement
The author(s) declare that no Generative AI was used in the creation of this manuscript.
Any alternative text (alt text) provided alongside figures in this article has been generated by Frontiers with the support of artificial intelligence and reasonable efforts have been made to ensure accuracy, including review by the authors wherever possible. If you identify any issues, please contact us.
Publisher’s note
All claims expressed in this article are solely those of the authors and do not necessarily represent those of their affiliated organizations, or those of the publisher, the editors and the reviewers. Any product that may be evaluated in this article, or claim that may be made by its manufacturer, is not guaranteed or endorsed by the publisher.
Supplementary material
The Supplementary Material for this article can be found online at: https://www.frontiersin.org/articles/10.3389/fmars.2025.1639181/full#supplementary-material.
References
Avendaño K. A., Ponce-Jahen S. J., Valenzuela E. I., Pajares S., Samperio-Ramos G., Camacho-Ibar V. F., et al. (2024). Nitrogen loss in coastal sediments driven by anaerobic ammonium oxidation coupled to microbial reduction of Mn(IV)-oxide. Sci Total Environ. 923, 171368. doi: 10.1016/j.scitotenv.2024.171368
Beman J. M., Chow C., King A. L., Feng Y., Fuhrman J. B., Andersson A., et al. (2011). Global declines in oceanic nitrification rates as a consequence of ocean acidification. PNAS 108, 208–213. doi: 10.1073/pnas.1011053108
Berninger U.-G. and Wickham S. A. (2005). Response of the microbial food web to manipulation of nutrients and grazers in the oligotrophic Gulf of Aqaba and northern Red Sea. Mar. Biol. 147, 1017–1032. doi: 10.1007/s00227-005-1565-1
Billerbeck M., Werner U., Bosselman K., Walpersdorf E., and Huettel M. (2006a). Nutrient release from an exposed intertidal sand flat. Mar. Ecol. Prog. Ser. 316, 35–51. doi: 10.3354/meps316035
Billerbeck M., Werner U., Polerecky L., Walpersdorf E., De Beer D., and Huettel M. (2006b). Surficial and deep pore water circulation governs spatial and temporal scales of nutrient recycling in intertidal sand flat sediment. Mar. Ecology-Progress Ser. 326, 61–76. doi: 10.3354/meps326061
Blonder B., Boyko V., Turchyn A. V., Antler G., Sinichkin U., Knossow N., et al. (2017). Impact of aeolian dry deposition of reactive iron minerals on sulfur cycling in sediments of the gulf of aqaba. Front. Microbiol. 8, 1131. doi: 10.3389/fmicb.2017.01131
Boetius A., Ravenschlag K., Schubert C., Rickert D., Widdel F., Gieseke A., et al. (2000). A marine microbial consortium apparently mediating anaerobic oxidation of methane. Nature 407, 623–626. doi: 10.1038/35036572
Boudreau B. P. (1996). The diffusive tortuosity of fine-grained unlithified sediments. Geochim et Cosmochim Acta 60, 3139–3142. doi: 10.1016/0016-7037(96)00158-5
Boyko V., Blonder B., and Kamyshny A. (2019). Sources and transformations of iron in the sediments of the Gulf of Aqaba (Red Sea). Mar. Chem. 216, 103691. doi: 10.1016/j.marchem.2019.103691
Boyko V., Pätzold J., and Kamyshny A. (2022). Iron and sulfur speciation and cycling in the sediments of marine systems located in arid environments: the northern Red Sea. J. Geological Soc. 179, jgs2021–027. doi: 10.1144/jgs2021-027
Boyko V., Torfstein A., and Kamyshny A. (2018). Oxygen consumption in permeable and cohesive sediments of the gulf of aqaba. Aquat. Geochemistry 24, 165–193. doi: 10.1007/s10498-018-9338-x
Bradley J. A., Amend J. P., and Larowe D. E. (2019). Survival of the fewest: Microbial dormancy and maintenance in marine sediments through deep time. Geobiology 17, 43–59. doi: 10.1111/gbi.12313
Callahan B. J., Mcmurdie P. J., Rosen M. J., Han A. W., Johnson A. J. A., and Holmes S. P. (2016). DADA2: High-resolution sample inference from Illumina amplicon data. Nat. Methods 13, 581–583. doi: 10.1038/nmeth.3869
Cheng C., He Q., Zhang J., Chai H., Yang Y., Pavlostathis S. G., et al. (2022). New insight into ammonium oxidation processes and mechanisms mediated by manganese oxide in constructed wetlands. Water Res. 215, 118251. doi: 10.1016/j.watres.2022.118251
Cypionka H. (2000). Oxygen respiration by desulfovibrio species. Ann. Rev. Microbiol. 54, 827–848. doi: 10.1146/annurev.micro.54.1.827
De Beer D., Sauter E., Niemann H., Kaul N., Foucher J. P., Witte U., et al. (2006). In situ fluxes and zonation of microbial activity in surface sediments of the Håkon Mosby Mud Volcano. Limnol. Oceanogr. 51, 1315–1331. doi: 10.4319/lo.2006.51.3.1315
De Boer W. and Kowalchuk G. A. (2001). Nitrification in acid soils: Micro-organisms and mechanisms. Soil Biol. Biochem. 33, 853–866. doi: 10.1016/S0038-0717(00)00247-9
Dixon S. J. and Stockwell B. R. (2014). The role of iron and reactive oxygen species in cell death. Nat. Chem. Biol. 10, 9–17. doi: 10.1038/nchembio.1416
Do S.-H., Batchelor B., Lee H.-K., and Kong S.-H. (2009). Hydrogen peroxide decomposition on manganese oxide (pyrolusite): Kinetics, intermediates, and mechanism. Chemosphere 75, 8–12. doi: 10.1016/j.chemosphere.2008.11.075
Gieseke A. and De Beer D. (2004). “Use of microelectrodes to measure in situ microbial activities in biofilms, sediments, and microbial mats,” in Molecular microbial ecology manual, 2 ed. Eds. Akkermans A. D. L. and Van Elsas D. (Kluwer, Dordrecht (Nl).
Hansel C. M. (2017). “Chapter two - manganese in marine microbiology,” in Advances in microbial physiology. Ed. Poole R. K. (Cambridge, MA, USA: Academic Press).
Herlemann D. P. R., Labrenz M., Jürgens K., Bertilsson S., Waniek J. J., and Andersson A. F. (2011). Transitions in bacterial communities along the 2000 km salinity gradient of the Baltic Sea. ISME J. 5, 1571–1579. doi: 10.1038/ismej.2011.41
Hsieh T. C., Ma K. H., and Chao A. (2016). iNEXT: an R package for rarefaction and extrapolation of species diversity (Hill numbers). Methods Ecol. Evol. 7, 1451–1456. doi: 10.1111/2041-210X.12613
Javanaud C., Michotey V., Guasco S., Garcia N., Anschutz P., Canton M., et al. (2011). Anaerobic ammonium oxidation mediated by Mn-oxides: from sediment to strain level. Res. Microbiol. 162, 848–857. doi: 10.1016/j.resmic.2011.01.011
Jofré I., Matus F., Mendoza D., Nájera F., and Merino C. (2021). Manganese-oxidizing Antarctic bacteria (Mn-Oxb) release reactive oxygen species (ROS) as secondary Mn (II) oxidation mechanisms to avoid toxicity. Biology 10, 1004. doi: 10.3390/biology10101004
Johnson J. E., Savalia P., Davis R., Kocar B. D., Webb S. M., Nealson K. H., et al. (2016). Real-time manganese phase dynamics during biological and abiotic manganese oxide reduction. Environ. Sci Technol. 50, 4248–4258. doi: 10.1021/acs.est.5b04834
Jomova K., Baros S., and Valko M. (2012). Redox active metal-induced oxidative stress in biological systems. Transition Metal Chem. 37, 127–134. doi: 10.1007/s11243-012-9583-6
Jørgensen B. B. and Nelson D. C. (2004). Sulfide oxidation in marine sediments: geochemistry meets microbiology. Geological Soc. America 379, 63–81. doi: 10.1130/0-8137-2379-5.63
Klatt J. M., Al-Najjar M., Yilmaz P., Lavik G., De Beer D., and Polerecky L. (2015a). Anoxygenic photosynthesis controls oxygenic photosynthesis in a cyanobacterium from a sulfidic spring. Appl. Environ. Microbiol. 81, 2025–2031. doi: 10.1128/AEM.03579-14
Klatt J. M., Meyer S., Häusler S., Macalady J. L., De Beer D., and Polerecky L. (2015b). Structure and function of natural sulphide-oxidizing microbial mats under dynamic input of light and chemical energy. ISME J. 10, 921. doi: 10.1038/ismej.2015.167
Kolinko S., Richter M., Glöckner F. O., Brachmann A., and Schüler D. (2016). Single-cell genomics of uncultivated deep-branching magnetotactic bacteria reveals a conserved set of magnetosome genes. Environ. Microbiol. 18, 21–37. doi: 10.1111/1462-2920.12907
Koppenol W. H. (1993). The centennial of the Fenton reaction. Free Radical Biol. Med. 15, 645–651. doi: 10.1016/0891-5849(93)90168-T
Kuypers M. M., Marchant H. K., and Kartal B. (2018). The microbial nitrogen-cycling network. Nat. Rev. Microbiol. 16, 263–276. doi: 10.1038/nrmicro.2018.9
Li Y.-H. and Gregory S. (1974). Diffusion of ions in sea water and deep-sea sediments. Geochim. Cosmochim. Acta 38, 703–714. doi: 10.1016/0016-7037(74)90145-8
Lloyd K. G., Alperin M. J., and Teske A. (2011). Environmental evidence for net methane production and oxidation in putative ANaerobic MEthanotrophic (ANME) archaea. Environ. Microbiol. 13, 2548–2564. doi: 10.1111/j.1462-2920.2011.02526.x
Lodha T., Narvekar S., and Karodi P. (2021). Classification of uncultivated anammox bacteria and Candidatus Uabimicrobium into new classes and provisional nomenclature as Candidatus Brocadiia classis nov. and Candidatus Uabimicrobiia classis nov. of the phylum Planctomycetes and novel family Candidatus Scalinduaceae fam. nov to accommodate the genus Candidatus Scalindua. Systematic Appl. Microbiol. 44, 126272. doi: 10.1016/j.syapm.2021.126272
Luther G. W. III (2010). The role of one- and two-electron transfer reactions in forming thermodynamically unstable intermediates as barriers in multi-electron redox reactions. Aquat. Geochem. 16, 395–420. doi: 10.1007/s10498-009-9082-3
Martinez-Garcia M., Stief P., Diaz-Valdes M., Wanner G., Ramos-Espla A., Dubilier N., et al. (2008). Ammonia-oxidizing Crenarchaeota and nitrification inside the tissue of a colonial ascidian. Environ. Microbiol. 10, 2991–3001. doi: 10.1111/j.1462-2920.2008.01761.x
Merz E., Dick G. J., De Beer D., Grim S., Hübener T., Littmann S., et al. (2021). Nitrate respiration and diel migration patterns of diatoms are linked in sediments underneath a microbial mat. Environ. Microbiol. 23, 1422–1435. doi: 10.1111/1462-2920.15345
Middelburg J. J. (2011). Chemoautotrophy in the ocean. Geophysical Res. Lett. 38, L24604. doi: 10.1029/2011GL049725
Morgan J. J., Schlautman M. A., and Bilinski H. (2021). Rates of Abiotic MnII Oxidation by O2: Influence of Various Multidentate Ligands at High pH. Environ. Sci Technol. 55, 14426–14435. doi: 10.1021/acs.est.1c01795
Morgan Chan Z., Kitchaev D. A., Nelson Weker J., Schnedermann C., Lim K., Ceder G., et al. (2018). Electrochemical trapping of metastable Mn3+ ions for activation of MnO2 oxygen evolution catalysts. Proc. Natl. Acad. Sci. 115, E5261–E5268. doi: 10.1073/pnas.1722235115
Morris J. J., Rose A. L., and Lu Z. (2022). Reactive oxygen species in the world ocean and their impacts on marine ecosystems. Redox Biol. 52, 102285. doi: 10.1016/j.redox.2022.102285
Otte S., Kuenen J. G., Nielsen L. P., Paerl H. W., Zopfi J., Schulz H. N., et al. (1999). Nitrogen, carbon, and sulfur metabolism in natural Thioploca samples. Appl. Environ. Microbiol. 65, 3148–3157. doi: 10.1128/AEM.65.7.3148-3157.1999
Ramsing N. B., Kühl M., and Jørgensen B. B. (1993). Distribution of sulfate-reducing bacteria, O2, and H2S in photosynthetic biofilms determined by oligonucleotide probes and microelectrodes. Appl. Environ. Microbiol. 59, 3840–3849. doi: 10.1128/aem.59.11.3840-3849.1993
Rasheed M., Badran M. I., and Huettel M. (2003). Influence of sediment permeability and mineral composition on organic matter degradation in three sediments from the Gulf of Aqaba, Red Sea. Estuarine Coast. Shelf Sci 57, 369–384. doi: 10.1016/S0272-7714(02)00362-1
Revsbech N. P. (1989). An oxygen microelectrode with a guard cathode. Limnol. Oceanogr. 55, 1907–1910. doi: 10.4319/lo.1989.34.2.0474
Santegoeds C. M., Ferdelman T. G., Muyzer G., and De Beer D. (1998). Structural and functional dynamics of sulfate-reducing populations in bacterial biofilms. Appl. Environm. Microbiol. 64, 3731–3739. doi: 10.1128/AEM.64.10.3731-3739.1998
Schramm A., Larsen L. H., Revsbech N. P., Ramsing N. B., Amann R., and Schleifer K. H. (1996). Structure and function of a nitrifying biofilm as determined by in situ hybridization and the use of microelectrodes. Appl. Environm. Microbiol. 62, 4641–4647. doi: 10.1128/aem.62.12.4641-4647.1996
Schulz H. N., Jørgensen B. B., Fossing H. A., and Ramsing N. B. (1996). Community structure of filamentous, sheat-building sulfur bacteria, Thioploca spp., off the coast of Chile. Appl. Environm. Microbiol. 62, 1855–1862. doi: 10.1128/aem.62.6.1855-1862.1996
Schulz H. N. and Schulz H. D. (2005). Large sulfur bacteria and the formation of phosphorite. Science 307, 416–418. doi: 10.1126/science.1103096
Shepherd R. G. (1989). Correlations of permeability and grain size. Groundwater 27, 633–638. doi: 10.1111/j.1745-6584.1989.tb00476.x
Shulga N., Abramov S., Klyukina A., Ryazantsev K., and Gavrilov S. (2022). Fast-growing Arctic Fe–Mn deposits from the Kara Sea as the refuges for cosmopolitan marine microorganisms. Sci. Rep. 12, 21967. doi: 10.1038/s41598-022-23449-6
Sivan O., Antler G., Turchyn A. V., Marlow J. J., and Orphan V. J. (2014). Iron oxides stimulate sulfate-driven anaerobic methane oxidation in seeps. Proc. Natl. Acad. Sci. 111, E4139–E4147. doi: 10.1073/pnas.1412269111
Soto N., Winters G., and Antler G. (2023). The effect of anaerobic remineralization of the seagrass Halophila stipulacea on porewater biogeochemistry in the Gulf of Aqaba. Front. Mar. Sci 10. doi: 10.3389/fmars.2023.1250931
Steiner Z., Lazar B., Levi S., Tsroya S., Pelled O., Bookman R., et al. (2016). The effect of bioturbation in pelagic sediments: Lessons from radioactive tracers and planktonic foraminifera in the Gulf of Aqaba, Red Sea. Geochimica Cosmochimica Acta 194, 139–152. doi: 10.1016/j.gca.2016.08.037
Steiner Z., Lazar B., Reimers C. E., and Erez J. (2019). Carbonates dissolution and precipitation in hemipelagic sediments overlaid by supersaturated bottom-waters – Gulf of Aqaba, Red Sea. Geochimica Cosmochimica Acta 246, 565–580. doi: 10.1016/j.gca.2018.12.007
Straub K. L., Benz M., Schink B., and Widdel F. (1996). Anaerobic, nitrate-dependent microbial oxidation of ferrous iron. Appl. Environ. Microbiol. 62, 1458–1460. doi: 10.1128/aem.62.4.1458-1460.1996
Tebo B. M., Johnson H. A., Mccarthy J. K., and Templeton A. S. (2005). Geomicrobiology of manganese(II) oxidation. Trends Microbiol. 13, 421–428. doi: 10.1016/j.tim.2005.07.009
Teske A., Ramsing N. B., Habicht K., Fukui M., Kuever J., Jørgensen B. B., et al. (1998). Sulfate reducing bacteria and their activities in Cyanobacterial mats of Solar Lake (Sinai, Egypt). Appl. Environm. Microbiol. 64, 2943–2951. doi: 10.1128/AEM.64.8.2943-2951.1998
Van De Vossenberg J., Woebken D., Maalcke W. J., Wessels H. J. C. T., Dutilh B. E., Kartal B., et al. (2013). The metagenome of the marine anammox bacterium ‘Candidatus Scalindua profunda’ illustrates the versatility of this globally important nitrogen cycle bacterium. Environ. Microbiol. 15, 1275–1289. doi: 10.1111/j.1462-2920.2012.02774.x
Van Erk M. R., Bourceau O. M., Moncada C., Basu S., Hansel C. M., and De Beer D. (2023). Reactive oxygen species affect the potential for mineralization processes in permeable intertidal flats. Nat. Commun. 14, 938. doi: 10.1038/s41467-023-35818-4
Van Stroe-Biezen S., Everaerts F. M., Janssen L. J. J., and Tacken R. A. (1993). Diffusion coefficients of oxygen, hydrogen peroxide and glucose in a hydrogel. Analytica Chimica Acta 273, 553–560. doi: 10.1016/0003-2670(93)80202-V
Wang X., Xie G.-J., Tian N., Dang C.-C., Cai C., Ding J., et al. (2022). Anaerobic microbial manganese oxidation and reduction: A critical review. Sci Total Environ. 822, 153513. doi: 10.1016/j.scitotenv.2022.153513
Wang R., Xu S.-Y., Zhang M., Ghulam A., Dai C.-L., and Zheng P. (2020). Iron as electron donor for denitrification: The efficiency, toxicity and mechanism. Ecotoxicology Environ. Saf. 194, 110343. doi: 10.1016/j.ecoenv.2020.110343
Widdel F., Schnell S., Heising S., Ehrenreich E., Assmus B., and Schink B. (1993). Ferrous iron oxidation by anoxygenic phototrophic bacteria. Nature 362, 834–836. doi: 10.1038/362834a0
Wiese J., Imhoff J. F., Horn H., Borchert E., Kyrpides N. C., Göker M., et al. (2020). Genome analysis of the marine bacterium Kiloniella laminariae and first insights into comparative genomics with related Kiloniella species. Arch. Microbiol. 202, 815–824. doi: 10.1007/s00203-019-01791-0
Williams T. J., Allen M. A., Berengut J. F., and Cavicchioli R. (2021). Shedding light on microbial “dark matter”: insights into novel Cloacimonadota and Omnitrophota from an Antarctic Lake. Front. Microbiol. 12, 741077. doi: 10.3389/fmicb.2021.741077
Wilson A. M., Huettel M., and Klein S. (2008). Grain size and depositional environment as predictors of permeability in coastal marine sands. Estuarine Coast. Shelf Sci 80, 193–199. doi: 10.1016/j.ecss.2008.06.011
Woebken D., Lam P., Kuypers M. M. M., Naqvi S. W. A., Kartal B., Strous M., et al. (2008). A microdiversity study of anammox bacteria reveals a novel Candidatus Scalindua phylotype in marine oxygen minimum zones. Environ. Microbiol. 10, 3106–3119. doi: 10.1111/j.1462-2920.2008.01640.x
Wu M. L., Ettwig K. F., Jetten M. S., Strous M., Keltjens J. T., and Niftrik L. V. (2011). A new intra-aerobic metabolism in the nitrite-dependent anaerobic methane-oxidizing bacterium Candidatus ‘Methylomirabilis oxyfera’. Biochem. Soc. Trans. 39, 243–248. doi: 10.1042/BST0390243
Yamada T. and Sekiguchi Y. (2018) “Anaerolineaceae,” in Bergey’s manual of systematics of archaea and bacteria. p1–5 (Hoboken, NJ, USA: Wileys).
Yu H., Chen X., Li R., Wang J., and Li J. (2021). Marine anammox bacteria-driven nitrogen removal from saline wastewater under different vanadium (v) doses: Evaluation on performance and kinetics. J. Water Process Eng. 39, 101728. doi: 10.1016/j.jwpe.2020.101728
Keywords: autotrophy/heterotrophy, Mn oxidation, geochemistry, microbial community diversity, ROS, cryptic cycles, spatial resolution, deep sea sediment
Citation: Silva-Solar S, van Erk MR, Antler G, Knittel K, Basu S and de Beer D (2025) Microbial diversity, autotrophic- and heterotrophic processes in Mn-rich marine sediments. Front. Mar. Sci. 12:1639181. doi: 10.3389/fmars.2025.1639181
Received: 01 June 2025; Accepted: 03 September 2025;
Published: 25 September 2025.
Edited by:
Gordon T. Taylor, Stony Brook University, United StatesReviewed by:
Cui-Yun Zhang, Chinese Academy of Geological Sciences, ChinaAina Astorch-Cardona, Swiss Federal Institute of Technology Lausanne, Switzerland
Copyright © 2025 Silva-Solar, van Erk, Antler, Knittel, Basu and de Beer. This is an open-access article distributed under the terms of the Creative Commons Attribution License (CC BY). The use, distribution or reproduction in other forums is permitted, provided the original author(s) and the copyright owner(s) are credited and that the original publication in this journal is cited, in accordance with accepted academic practice. No use, distribution or reproduction is permitted which does not comply with these terms.
*Correspondence: Dirk de Beer, ZGJlZXJAbXBpLWJyZW1lbi5kZQ==
†Present address: Marit R. van Erk, Department of Microbiology, Radboud Institute for Biological and Environmental Sciences, Radboud University, Nijmegen, NetherlandsGilad Antler, The Interuniversity Institute for Marine Sciences, Eilat, Israel