 Lis Bittencourt1,2*
 Rafael R. Carvalho1
 Karina Pereira1Elitieri B. Santos-Neto1
 Jose Lailson-Brito Jr.1
 Tatiana L. Bisi1,2
 Alexandre F. Azevedo1,2
- 1Laboratório de Mamíferos Aquáticos e Bioindicadores “Profa. Izabel M. G. do N. Gurgel” (MAQUA), Faculdade de Oceanografia, Universidade do Estado do Rio de Janeiro – UERJ, Rio de Janeiro, Brazil
- 2Programa de Pós-graduação em Oceanografia, Faculdade de Oceanografia, Universidade do Estado do Rio de Janeiro – UERJ, Rio de Janeiro, Brazil
Franciscana dolphins are small odontocetes that produce narrow-band high-frequency echolocation clicks. Autonomous acoustic monitoring and field survey acoustic sampling were used to record franciscana dolphins in Ilha Grande Bay, Brazil. Clicking sequences were automatically detected and analyzed, and then manually classified into different types; acoustic parameters from individual clicks were extracted. A total of 12505 clicks were detected, 152 clicking sequences were analyzed, of which 43 were click trains and 109 were click packets. Considering all clicks, they occurred from 88.7 kHz to 250 kHz, with a mean peak frequency of 132.4 ± 6.8 kHz. Click trains were longer than click packets, with larger inter-click intervals and mean peak frequencies of 123.6 ± 16.4 kHz and 119.9 ± 15.0 kHz, respectively. Franciscana dolphins emitted different types of clicking sequences. The use of patterned clicks by franciscana dolphins may be an important communication feature at very high frequencies.
Introduction
Franciscana dolphins (Pontoporia blainvillei) are small odontocetes that inhabit coastal areas (Secchi et al., 2021). This species is listed as “vulnerable” on the IUCN Red List (Zerbini et al., 2017) and as critically endangered in the Red Book of Brazilian Threatened Fauna (ICMBio, 2018). The acoustic behavior of this species has only recently been systematically investigated. Like all odontocetes, franciscana dolphins produce pulsed signals commonly known as echolocation clicks. However, they fall within a category of clicks known as narrow-band high-frequency (NBHF) clicks (Melcón et al., 2012), produced by a few species (Morisaka and Connor, 2007). Studies show that they can also produce burst-pulses and whistles (Cremer et al., 2017; Tellechea and Norbis, 2014), but the high frequency nature of franciscana dolphin acoustic signals poses a technological challenge. Sampling rates below 192 kHz miss most of their signal frequency range (Cremer et al., 2017), which peaks above 120 kHz (Melcón et al., 2012; Barcellos and Santos, 2021). Autonomous acoustic monitoring with sufficiently high sample rates has enabled the recording of franciscana dolphin groups in different areas, providing new insights into their acoustic behavior (Barcellos and Santos, 2021; Paitach et al., 2021). This study aimed to describe the characteristics of the echolocation clicks produced by franciscana dolphins in Ilha Grande Bay, as well as the emission patterns of these acoustic signals, which were recorded using multiple techniques with sampling rates higher than 288 kHz.
Methods
Study area
Ilha Grande Bay (22°50’–23°20’S, 44°00’–44°45’W; Supplementary Figure 1) represents the northwest limit of the Laje dos Santos-Ilha Grande Important Marine Mammal Area (IMMA), which is an area with records of more than 30 cetacean species (IUCN-MMPATF, 2023). Most of the Ilha Grande Bay area was previously considered a hiatus in the occurrence of franciscana dolphins, but recent research has consistently demonstrated the presence of the species in the region (Lailson-Brito et al., 2020). Currently, this area can be considered part of one of four Franciscana Management Areas (FMA) in Brazil: FMA IIa, which comprises the population that occurs from the southern Rio de Janeiro to the northern São Paulo coastal areas (Cunha et al., 2014).
Acoustic recordings
Data recording was conducted between November 2023 and November 2024 (Supplementary Figure 1). One approach involved short deployments of an autonomous acoustic recorders model DSG-ST (0.05–30 kHz, mean sensitivity of 200.0 dB/V re 1 µPa), recording at a 288 kHz sampling rate and a gain of 33 dB. The equipment was deployed from small boats and placed approximately 4 m below the surface, where it remained for 24 hours. No visual observations occurred during deployments. Three recording sessions of this type occurred, providing 72h of sampling time. It is important to note that the distinct characteristics of the detected signals confirm that they originate from the target species. The franciscana dolphin is the only narrow-band high-frequency species in the study area (Lailson-Brito et al., 2020).
The other approach involved manual recording during field surveys using a digital recorder model SMBat-FS, operating at a sampling rate of 500 kHz and a gain of 12 dB, coupled to a hydrophone model HTI-99-UHF (0.002–200 kHz, mean sensitivity of -173.0 dB/V re 1 µPa). The hydrophone was placed at approximately 4 m below the surface and recording started alongside visual observation after franciscana dolphins were sighted. Six recording sessions of this type were conducted, providing a total of one hour of sampling time. During the recordings, animals visible on the surface were observed from the boat and video recordings were taken from aerial footage to help us monitor the animals’ movements. Group size varied from three to twelve individuals during these sampling surveys, with only one group comprising both adults and calves.
Analyses
All recordings went through a high-pass filter to reduce the influence of background noise below 70 kHz. Then, the clicking rate was estimated through a MatLab (MathWorks Inc.) custom-written click detector based on the scripts available at Zimmer (2011). Only clicks with a Signal-to-Noise Ratio (SNR) above 10 dB were detected, and only detected clicks were considered for further analysis.
Recordings with detected clicks were manually observed through the Raven Pro 1.6 software (Cornell Lab of Ornithology, 2023), where Spectrograms were generated with a 1024 Hann window, 50% overlap and a time frame of 0.5s. Clicking sequences were considered as a group of clicks recognizable as being emitted with a visible time interval between them, which could either be variable or appear to follow a specific pattern. They were manually selected to investigate temporal patterns. Only sequences where all clicks were detected and the first and last clicks were clearly distinguished were considered. Sequences that overlapped other sequences or sounds were excluded.
Nine acoustic parameters were extracted from each sequence. From the detection output, we calculated duration (time from the end of the last click minus the time of the beginning of the first click), number of clicks, mean interclick interval (ICI – calculated as the mean time difference between the beginning times of each click in the sequence), minimum ICI in the sequence (the minimum time difference between the beginning times of clicks in the sequence) and maximum ICI in the sequence (the maximum time difference between the beginning times of clicks in the sequence). From the Raven software, the following variables were extracted considering the entire sequence: minimum and maximum frequency (these parameters were quantified because the click packages differed and were visually measured in the spectrogram), center and peak frequency (both obtained through the automatic measurement tool in the software).
Clicking sequences were classified into two major categories: click trains (Figure 1a) and click packets (Figures 1b–d), based on the method used for rough-toothed dolphins (Rankin et al., 2015) and adapted for franciscana dolphins. Click trains were sequences in which an indefinite number of clicks occurred with an apparently longer ICI that could vary throughout the sequence. Click packets were sequences containing from two to 20 individual clicks bundled closely together with short ICIs that varied from 2.21 to 35.15 ms, showing an interval between them on the spectrogram. Many click packets appeared to exhibit repetitive time patterns, with the same number of clicks and a consistent organization of time intervals between them. So, additionally, click packets were also classified into smaller categories (Figures 1B-D): variable packets (VPackets), in which no clear time pattern could be visually distinguishable and the measured ICI varied within the sequence; and patterned packets (PPackets), in which the individual clicks occurred in a visually distinguishable time pattern, similar to what is known for sperm whale codas (Watkins and Schevill, 1977). All PPackets then had their pattern annotated as a combination of the number of clicks with repeated time intervals. For example, packets with four clicks in which three were grouped together and the third had a longer interval were classified as “3c+1”. However, packets with four clicks in which the ICI remained regular throughout the sequence were classified as “4c”.
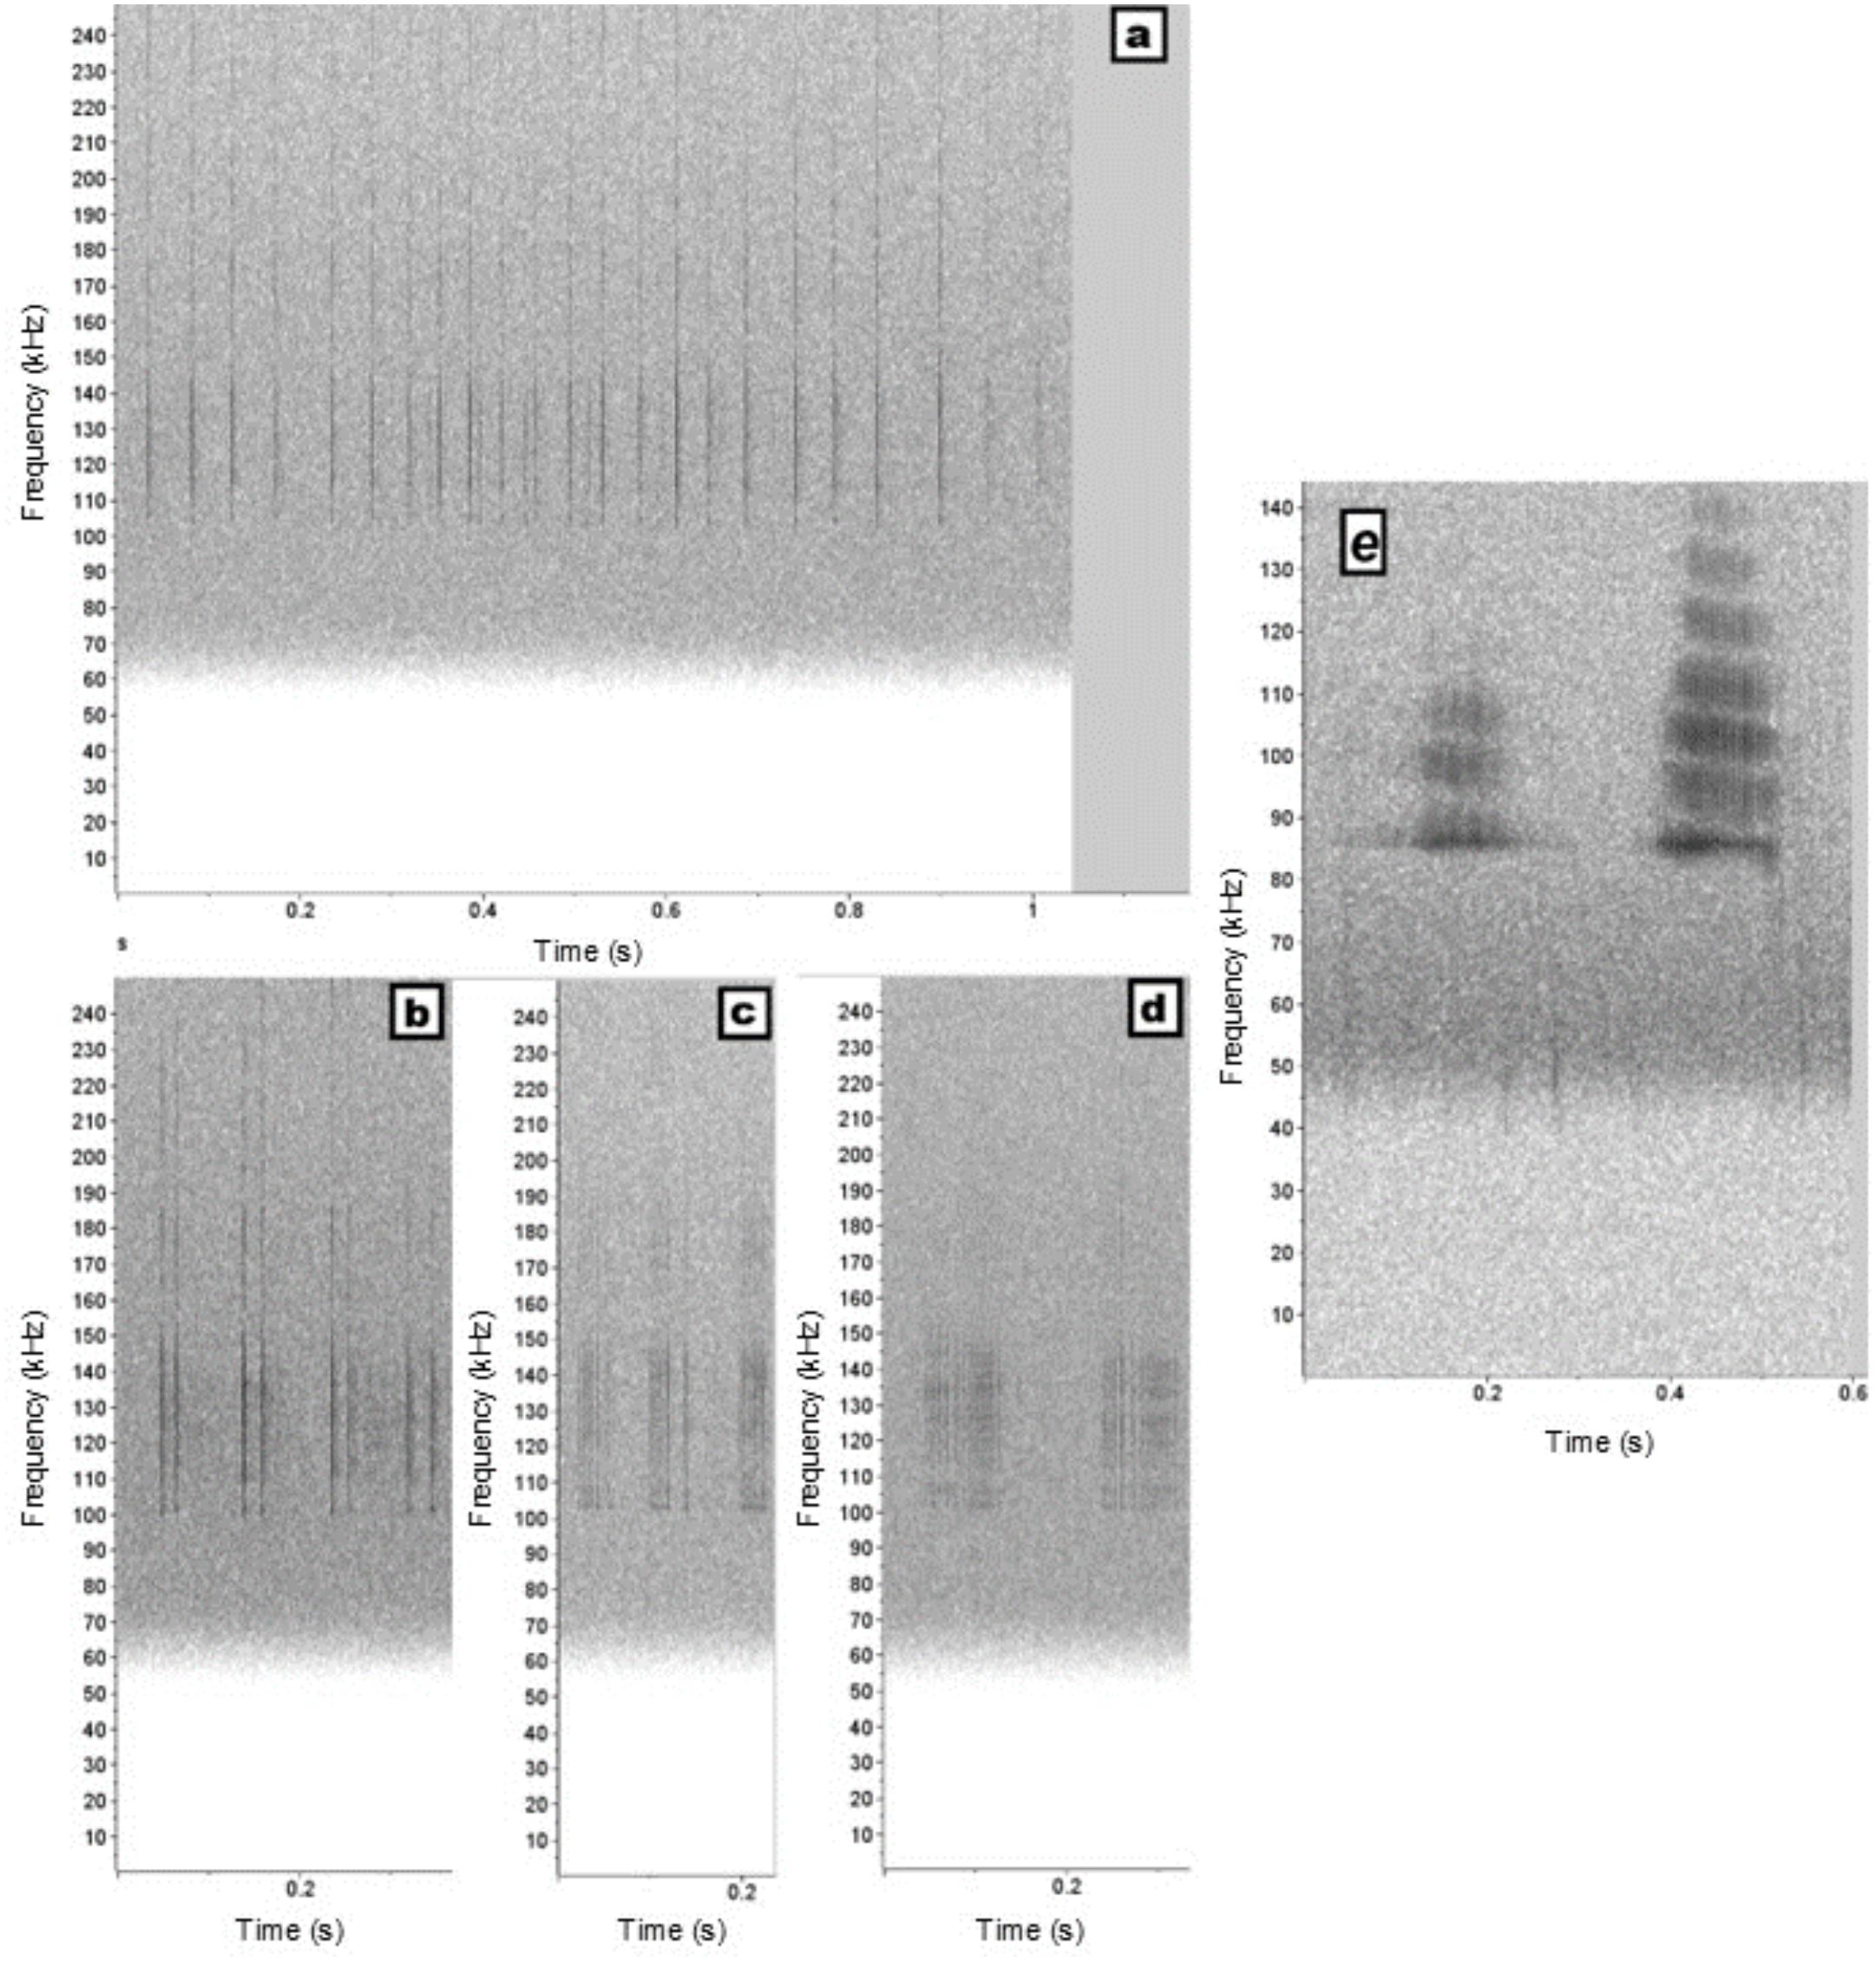
Figure 1. Examples of clicking sequences produced by franciscana dolphins in Ilha Grande Bay, southeastern Brazil. (a) click trains, (b) patterned click packet “2c”, (c) patterned click packet “4c+1”, (d) variable click packet, (e) burst-pulsed sounds. Spectrograms were generated with a 1024-Hann window, 50% overlap, and a 2s window.
Individual click parameters were also measured from the highest energy clicks of the analyzed clicking sequences, but only if there were no distortions in the oscillogram or spectrogram caused by echoes or surface and bottom reflections. Since only one hydrophone was available, it was not possible to ensure that only on-axis clicks were selected. However, steps were taken to minimize the effect of off-axis recording. The selected clicks were extracted from the detection output in MatLab, transformed into short sound clips and had their spectral characteristics analyzed with a 512-point FFT on a Hannning window around the peak of the click envelope, which we obtained through a Hilbert transformation of each signal (Zimmer, 2011). Only recordings with the highest sampling rate (500 kHz) were used for these analyses; therefore, the frequency resolution of this step was 0.98 kHz. We extracted peak frequency (center frequency of the band with the highest amplitude of the spectrum), 10 dB bandwidth (the frequency bandwidth 10 dB below the peak frequency), and click duration (measured as the 95% of the energy of the click envelope); these measurements were made through the MatLab custom written scripts based on the routines available from Zimmer (2011) and calculations from Madsen and Wahlberg (2007). From the spectrogram in Raven, we measured the visible minimum and maximum frequencies.
Burst-pulsed sounds, defined as trains of pulses with very short intervals between clicks (Au and Hastings, 2008; Figure 1E), were observed and counted, but most of them overlapped with clicking sequences or had lower energy. Burst-pulses were analyzed in the Raven software if they were not overlapped with other sounds and had an SNR higher than 10 dB. The following parameters were extracted: peak frequency, center frequency, visible minimum and maximum frequency, and duration.
The data did not exhibit a normal distribution (Shapiro-Wilk test, p<0.05). The Mann-Whitney U Test was applied to compare acoustic parameters between trains and packets, as well as between variable and patterned click packets. The significance level was set at p < 0.01. A principal components analysis based on correlations (PCA) was employed to explore the variation of clicking sequences beyond our visual classification, using the variables: duration, number of clicks, meanICI and peak frequency. These four were chosen since they were the most influential variables. The two components with eigenvalues that cumulatively accounted for more than 70% were considered responsible for most of the data variation and were chosen to represent the signal distributions and grouping. Variables with a correlation higher than 0.5 (either positive or negative) were considered to be driving variation within each component.
Results
Sound emissions
A total of 12,505 clicks were detected. Estimating clicking rate from detections, clicking emission varied from 8 to 955 clicks/min, with an average of 264 clicks/min. A total of 152 clicking sequences were analyzed, of which 43 were click trains and 109 were click packets. There were 28 bursts-pulses in the recordings, of which 17 were analyzed. Acoustic parameters are given in Table 1.
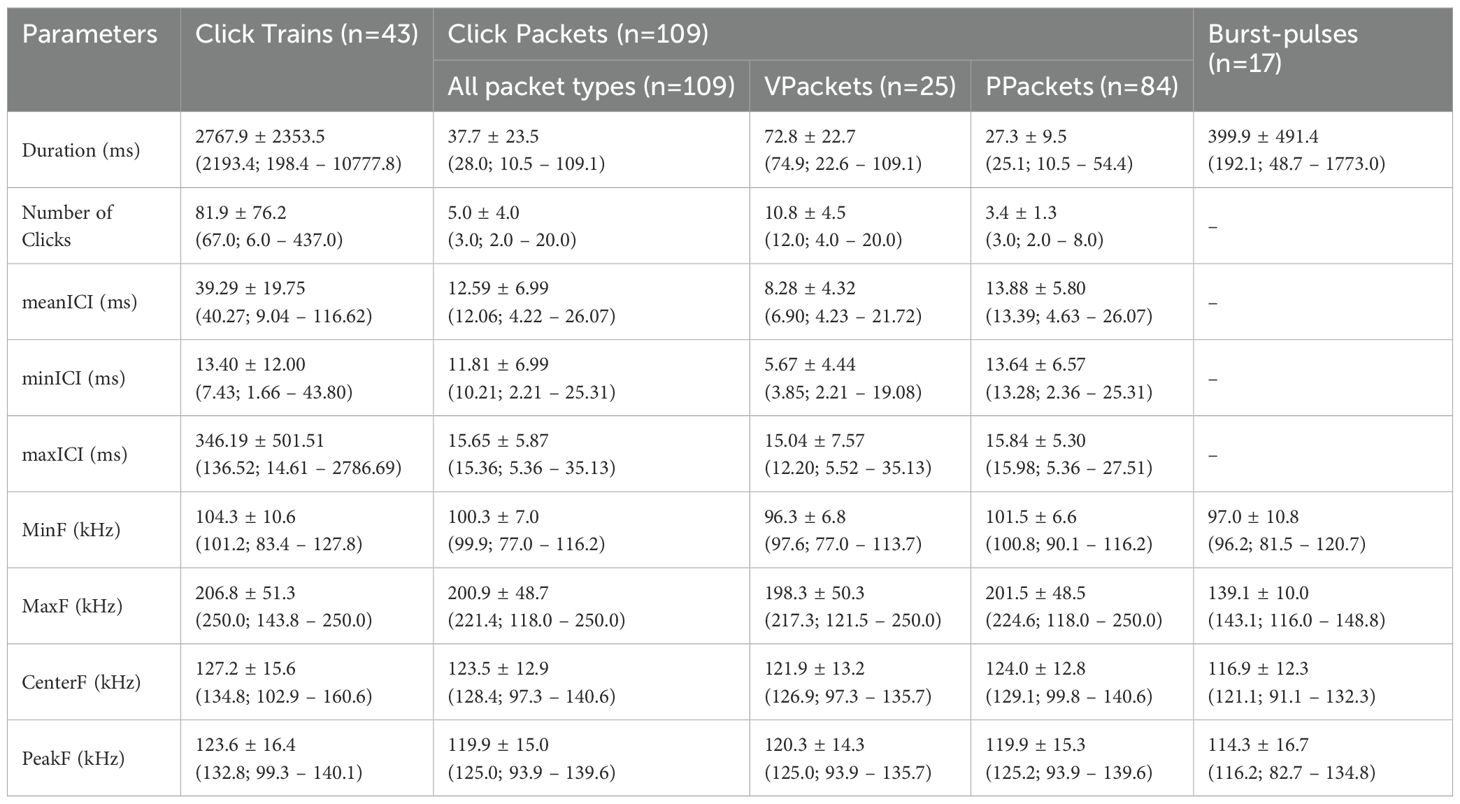
Table 1. Mean ± standard deviation (median; minimum – maximum values) of click emission categories produced by franciscana dolphins in Ilha Grande Bay, southeastern Brazil.
Click trains had more clicks (MW, Ntrains=43, Npackets=109, U=61.0, p<0.01) and longer durations than click packets (MW, Ntrains=43, Npackets=109, U=143.0, p<0.01). They also showed larger mean ICI (MW, Ntrains=43, Npackets=109, U=299.0, p<0.01) and higher central frequency (MW, Ntrains=43, Npackets=109, U=1624.0, p<0.01) (Supplementary Figure 2). The PCA provided further insight into how clicking sequences tend to group and corroborated our visual classification (Figure 2). The cumulative sum of eigenvalues from Factors 1 and 2 explained 80.4% of data variation, in which factor 1 was influenced mostly by duration, number of clicks and meanICI and factor 2 was influenced by the peak frequency. Click trains presented more variation in all parameters, while click packets varied very little within temporal characteristics and showed great variation in peak frequency.
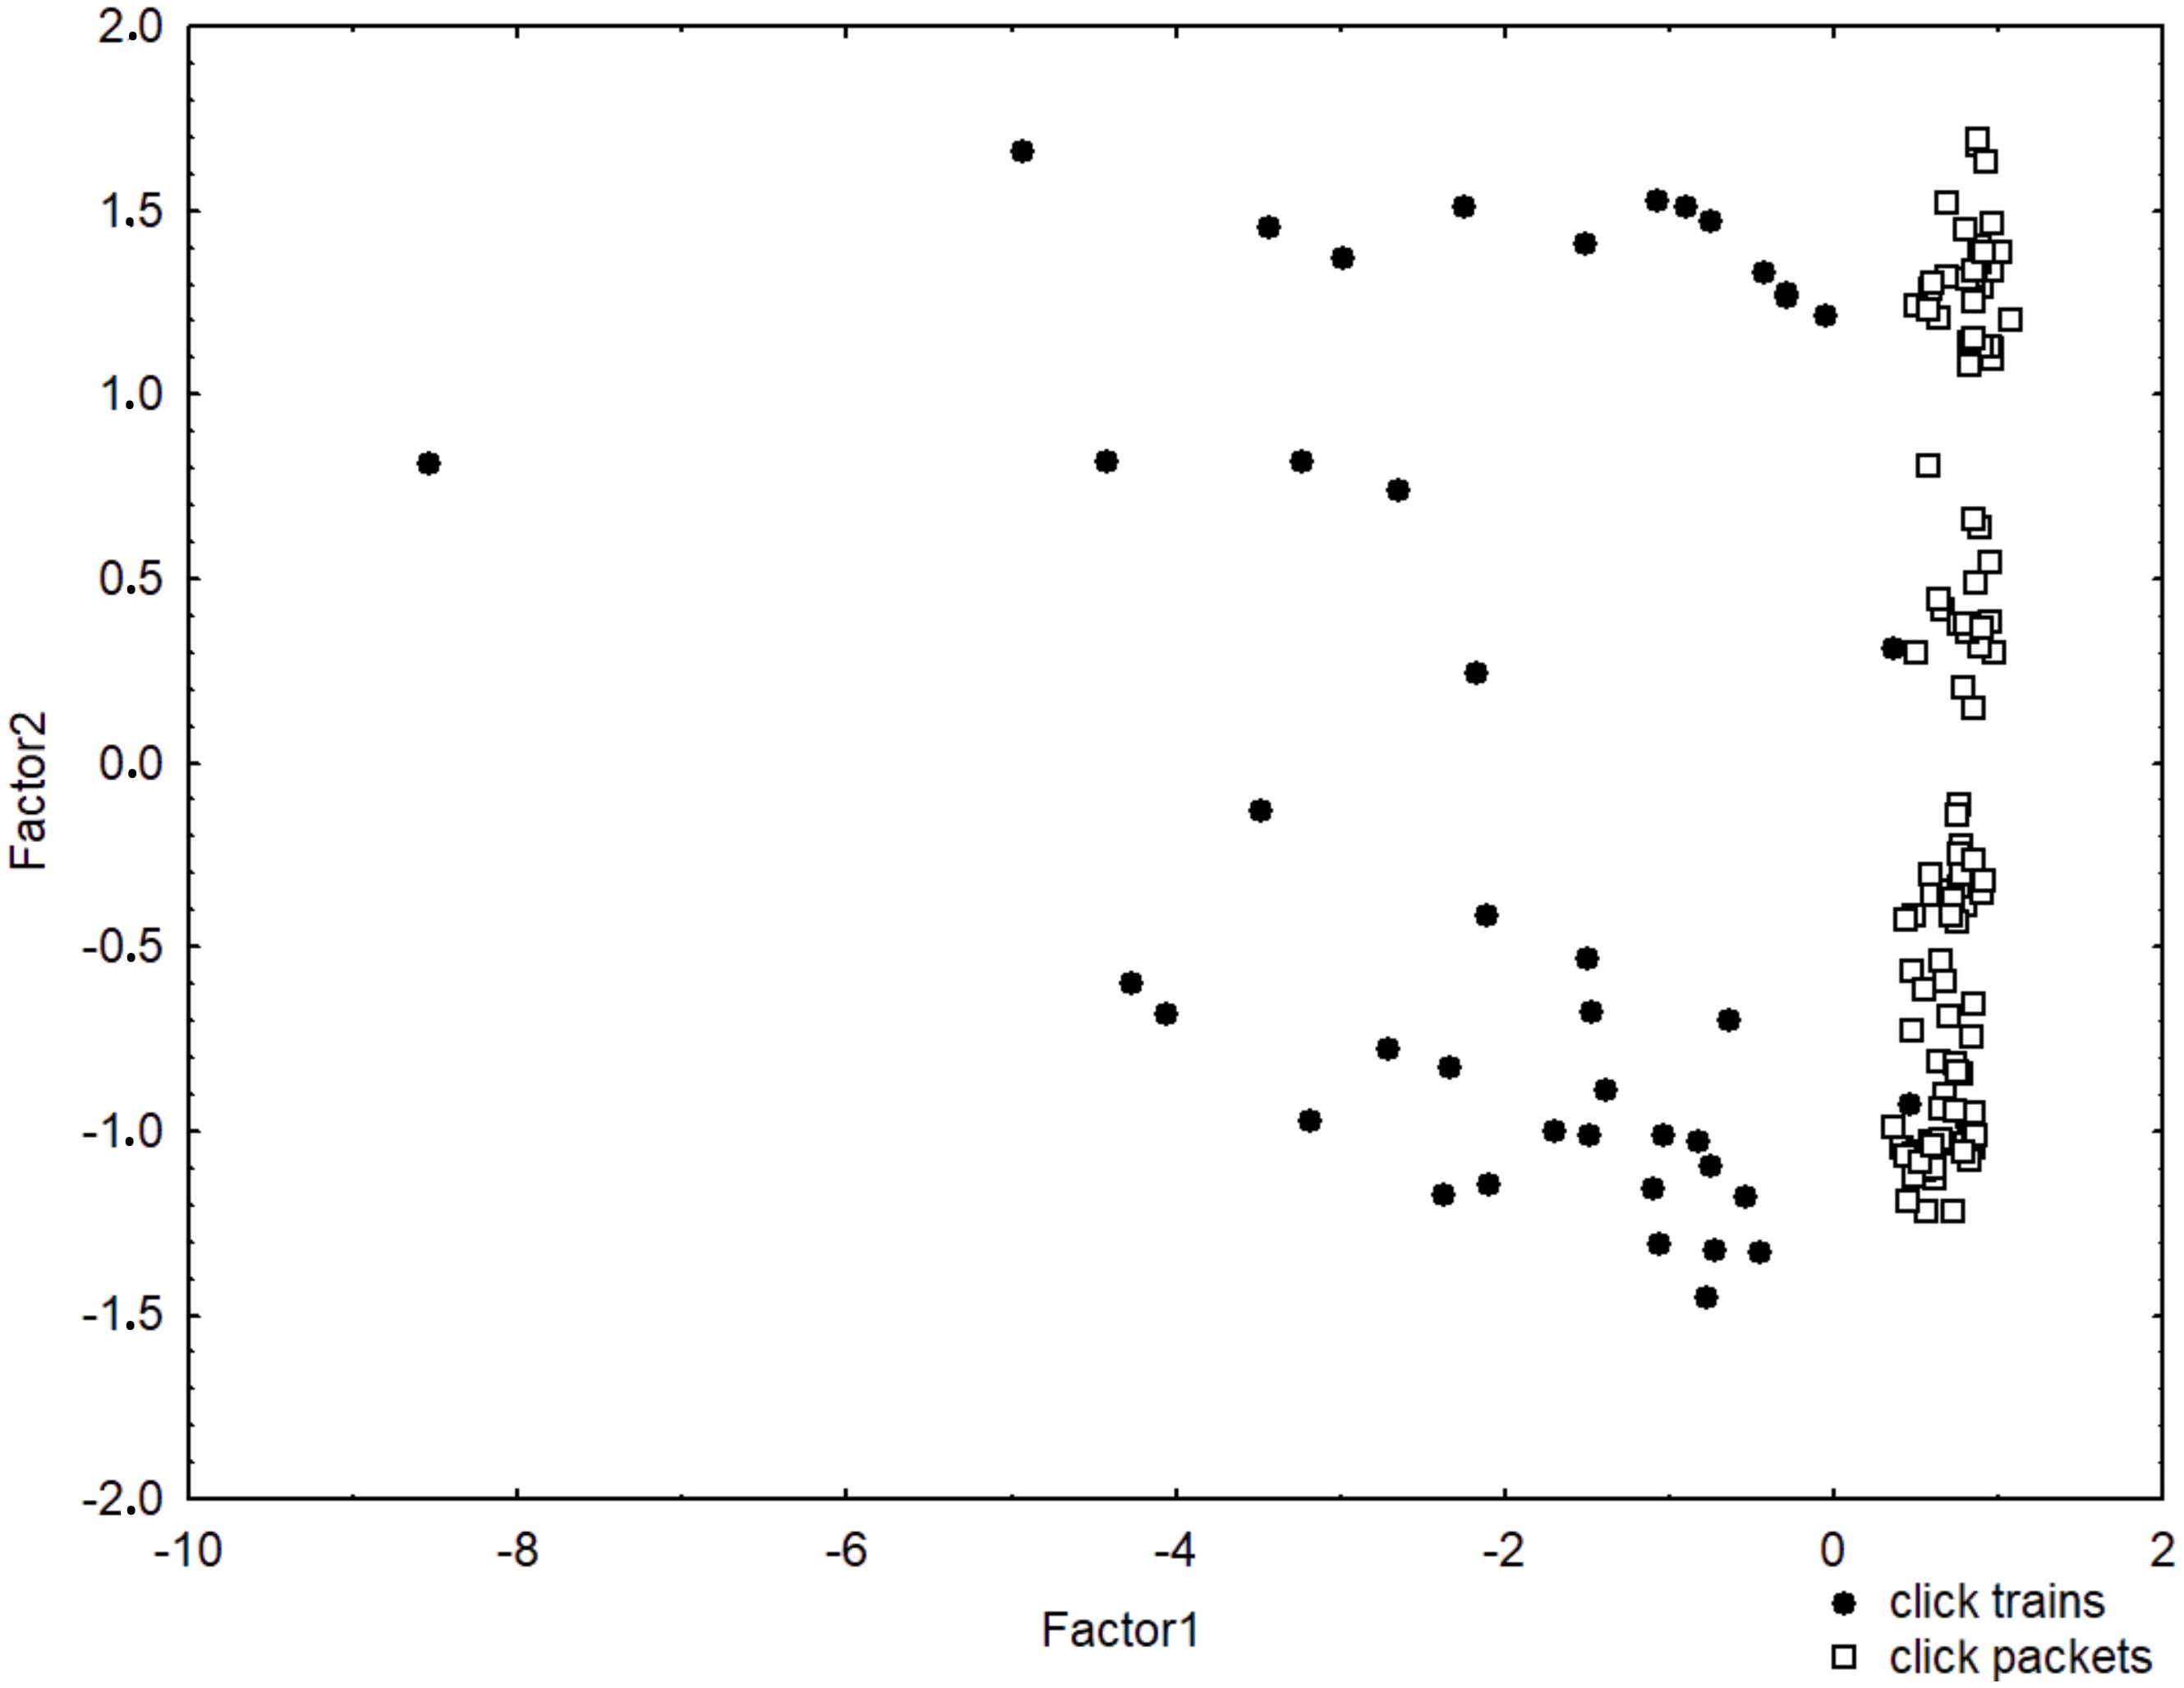
Figure 2. Principal components analysis of clicking sequences produced by franciscana dolphins, Pontoporia blainvillei, in Ilha Grande Bay, southeastern Brazil.
Click packets
VPackets presented four to twenty clicks in a packet, while PPackets had two to seven clicks, with six patterns occurring more than three times. Temporal structure appeared to be the most important feature in differentiating groups. VPackets had more clicks (MW, NVP=25, NPP=84, U=97.5, p<0.01) and were longer than PPackets (MW, NVP=25, NPP=84, U=114.5, p<0.01), they also showed shorter mean ICI (MW, NVP=25, NPP=84, U=433.0, p<0.01) and lower minimum frequency (MW, NVP=25, NPP=84, U=617.0, p<0.01) (Supplementary Figure 3). Other frequency parameters do not vary significantly, as shown in Table 1. The four more common patterns were: 2c (n=30), 2c+1 (n=15), 3c (n=11) and 3c+1 (n=11). Among variable packets, packets with twelve to fifteen clicks were the most common, occurring three to four times each.
Both types commonly occurred in sequence, mixed, or with repetition. There were several occasions in which sequences overlapped (e.g., a high SNR 3c pattern right above a weak variable longer pattern), which made it difficult to register the possibility of patterned sequences. However, the most common patterns could usually be seen together.
Individual click parameters
Clicks occurred from 88.7 kHz and 250 kHz, with a mean peak frequency of 132.4 ± 6.8 kHz. When comparing clicks from trains and packets, some parameters varied between them (Table 2; Supplementary Figure 4), but peak and maximum frequencies remained consistent.
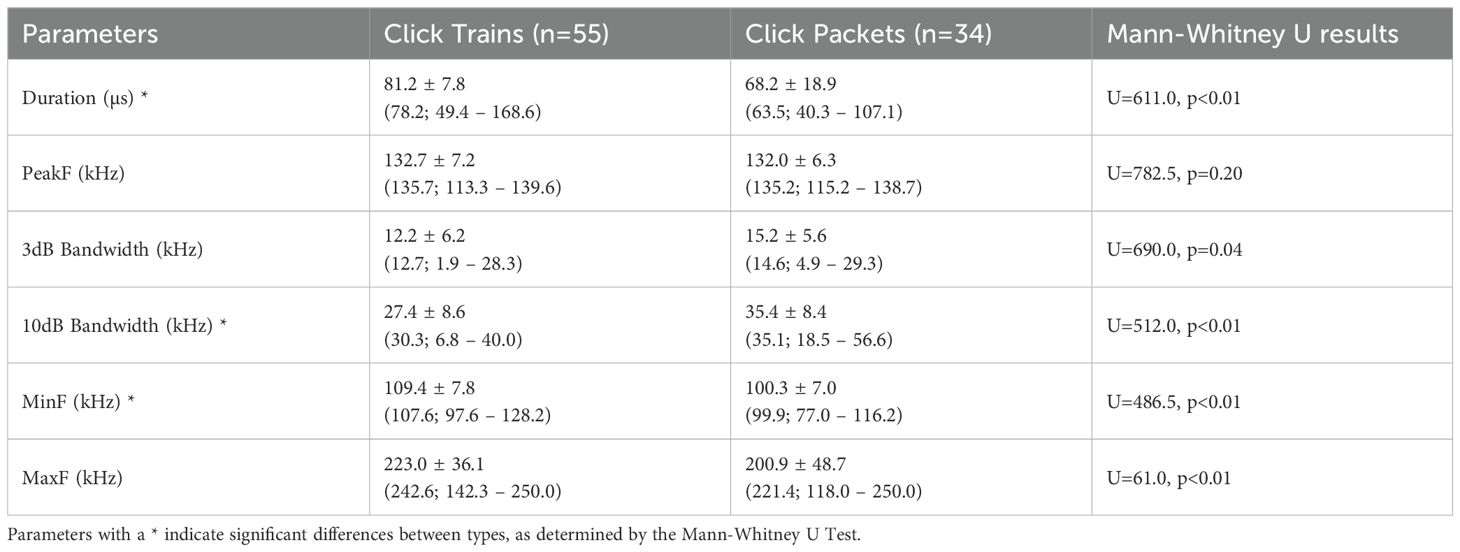
Table 2. Mean ± standard deviation (median; minimum – maximum values) of clicks from two types of emission produced by franciscana dolphins in Ilha Grande Bay, southeastern Brazil.
Discussion
Franciscana dolphins from Ilha Grande Bay showed a varied range of NBHF clicking sequences, providing further evidence that this species does not employ echolocation sparingly in favor of passive listening, as previously suggested (Tellechea et al., 2017). However, other signal types were absent or rare. Although Cremer et al. (2017) recorded whistles by captured franciscana dolphins, no whistles were recorded in the present study, indicating that this species doesn’t commonly use tonal signals in communication. While burst-pulses occurred in this study, they were rare. This was also observed in Babitonga Bay, where burst-pulsed were recorded during franciscana dolphin capture for tagging (Cremer et al., 2017).
The frequency range observed in this study corroborated that a 288 kHz sampling rate is useful for registering species occurrence through passive acoustic monitoring, but higher sampling rates are necessary to characterize franciscana dolphins’ sound emissions. On the Brazilian south coast, franciscana dolphin clicks registered with a CPOD occurred from 117 to 139 kHz at Babitonga Bay, and from 121 to 136 kHz at Itaperubá Beach (Paitach et al., 2021). On the northern coast of São Paulo State, their clicks were recorded at a sampling rate of 288 kHz and occurred from 83.9 to 144 kHz, with a mean peak frequency of 104.1 kHz (Barcellos and Santos, 2021). In contrast, two studies in Argentina investigated franciscana dolphin clicks with higher sampling rates. In the Northeast Patagonia, their echolocation clicks were recorded at a 500 kHz sampling rate, reaching frequencies up to 250 kHz, with a mean peak frequency of 139 kHz (Melcón et al., 2012). Further up north in the Claromecó region, where a 576 kHz sampling rate was used, the mean peak frequency was 134.4 kHz (Giardino et al., 2024). Interestingly, while the whole frequency range of franciscana dolphins from Ilha Grande Bay appears to be similar to those from Argentina, the peak frequency observed here is lower than in the two Argentinian locations. Additionally, it is important to note that the differences observed in relation to other populations may be attributed to behavioral contexts, environmental noise characteristics, or other factors that influence click characteristics.
A significant finding from this study is the occurrence of different types of clicking sequences, which seem to influence the acoustic parameters of these different click types. Giardino et al. (2024) also described clicking bouts of varied duration and frequency in rehabilitating young individuals and wild groups of franciscana dolphins; they show spectrograms where these bouts appear to be similar to our click packets. The most famous example of patterned click emission is sperm whale codas (Watkins and Schevill, 1977), which are known to contain individual and group identification cues (Gero et al., 2016; Rendell and Whitehead, 2003). Our findings, therefore, indicate that, in addition to producing NBHF clicks, franciscana dolphins may have clicking patterns for communication purposes.
Recording on-axis pulsed sounds is a common challenge in odontocete acoustic studies (Madsen and Wahlberg, 2007), with the distortion of off-axis signals being well documented (Au et al., 2012; Branstetter et al., 2012). The swimming behavior of franciscana dolphins adds to this challenge. Field observations and drone footage taken during surveys show they commonly move their heads from one side to the other or up and down, while swimming in a seemingly straight direction. This, coupled with the use of a single hydrophone, limited our capacity to isolate on-axis clicks. Our methods sought to diminish off-axis variations, and it remains important to describe different sound types and their emission patterns under varied conditions, since free-ranging animals are not always ideally positioned on-axis with their conspecifics. Other NBHF clicking species have been previously characterized with single hydrophones (Reyes Reyes et al., 2015), including other franciscana dolphin populations (Melcón et al., 2012; Barcellos and Santos, 2021; Giardino et al., 2024).
Our findings reinforce the use of NBHF clicks as the main sound emission of franciscana dolphins and confirm that these signals reach frequencies higher than 250 kHz. The use of patterned clicking by franciscana dolphins may be an important feature of communication at very high frequencies, and understanding this acoustic behavior is a vital step towards enhancing our ability to monitor the species and, consequently, directing effective conservation efforts. Also, we recommend that further studies focus on acoustic signals associated with behavioral contexts and environmental adaptations to enhance our understanding of the functions of NBHF clicks.
Data availability statement
The datasets presented in this article are not readily available because this data is still part of ongoing research by multiple projects of Rio de Janeiro State University. Upon reasonable request, however, the authors may be authorized to share part of the data obtained for this study. Requests to access the datasets should be directed to Prof. Alexandre Azevedo, YWxleGFuZHJlLm1hcXVhQGdtYWlsLmNvbQ==.
Ethics statement
The manuscript presents research on animals that do not require ethical approval for their study. It was undertaken under environmental permit 10579-17 by the Chico Mendes Institute for Biodiversity Conservation (Instituto Chico Mendes de Conservação da Biodiversidade – ICMBio), which is part of the Brazilian Ministry of the Environment (Ministério do Meio Ambiente/MMA).
Author contributions
LB: Data curation, Formal Analysis, Methodology, Writing – original draft, Writing – review & editing. RRC: Data curation, Investigation, Methodology, Validation, Writing – review & editing. KP: Investigation, Methodology, Resources, Visualization, Writing – review & editing. EBS-N: Data curation, Investigation, Project administration, Resources, Visualization, Writing – review & editing. JL-B: Conceptualization, Data curation, Funding acquisition, Investigation, Project administration, Resources, Validation, Writing – review & editing. TLB: Funding acquisition, Project administration, Resources, Validation, Writing – review & editing. AFA: Conceptualization, Data curation, Funding acquisition, Investigation, Methodology, Project administration, Resources, Supervision, Validation, Visualization, Writing – review & editing.
Funding
The author(s) declare financial support was received for the research and/or publication of this article. LB has a post-doctoral scholarship from FAPERJ (E-26/200.224/2024). Fundação Carlos Chagas Filho de Amparo à Pesquisa do Estado do Rio de Janeiro (FAPERJ) and Conselho Nacional de Desenvolvimento Científico e Tecnológico (CNPq) have supported research developed by MAQUA. AFA has three research grants (CNPq/PQ-1B 307458/2022-9, FAPERJ/CNE E-26/200.397/2023 and UERJ/Prociencia), TLB has four research grants (FAPERJ/JCNE E-26/201.318/2022, FAPERJ E-26/210.931/2021, CNPq-PQ-2 308879/2023-6 and UERJ/Prociencia), and JL-B has two research grants (CNPq/PQ-1D 315.276/2021-5 and UERJ/Prociencia). The Brazilian National Institute of Science and Technology- INCT Biodiversidade da Amazônia Azul (CNPq proc. 405999/2022-4) also contributed to this study.
Acknowledgments
We thank the MAQUA team for support during field campaigns. Tamoios Ecological Station (ICMBio/MMA) has collaborated in this study.
Conflict of interest
The authors declare that the research was conducted in the absence of any commercial or financial relationships that could be construed as a potential conflict of interest.
Generative AI statement
The author(s) declare that no Generative AI was used in the creation of this manuscript.
Any alternative text (alt text) provided alongside figures in this article has been generated by Frontiers with the support of artificial intelligence and reasonable efforts have been made to ensure accuracy, including review by the authors wherever possible. If you identify any issues, please contact us.
Publisher’s note
All claims expressed in this article are solely those of the authors and do not necessarily represent those of their affiliated organizations, or those of the publisher, the editors and the reviewers. Any product that may be evaluated in this article, or claim that may be made by its manufacturer, is not guaranteed or endorsed by the publisher.
Supplementary material
The Supplementary Material for this article can be found online at: https://www.frontiersin.org/articles/10.3389/fmars.2025.1641888/full#supplementary-material
References
Au W. W. L., Branstetter B., Moore P. W., and Finneran J. J. (2012). Dolphin biosonar signals measured at extreme off-axis angles: insights to sound propagation in the head. J. Acoust. Soc Am. 132, 1199–1206. doi: 10.1121/1.4730901
Au W. W. L. and Hastings M. C. (2008). Principles of Marine Bioacoustics Vol. 2010 (New York: Springer), 679.
Barcellos D. D. and Santos M.C.d. O. (2021). Echolocation characteristics of franciscana dolphins (Pontoporia blainvillei). Mar. Mammal Sci. 37, 1–11. doi: 10.1111/mms.12796
Branstetter B. K., Moore P. W., Finneran J. J., Tormey M. N., and Aihara H. (2012). Directional properties of bottlenose dolphin (Tursiops truncatus) clicks, burst-pulse, and whistle sounds. J. Acoust. Soc Am. 131, 1613–1621. doi: 10.1121/1.3676694
Cremer M. J., Holz A. C., Bordino P., Wells R. S., and Simões-Lopes P. C. (2017). Social sounds produced by franciscana dolphins, Pontoporia blainvillei (Cetartiodactyla, Pontoporiidae). J. Acoust. Soc Am. 141, 2047–2054. doi: 10.1121/1.4978437
Cunha H. A., Medeiros B. V., Barbosa L. A., Cremer M. J., Marigo J., Lailson-Brito J., et al. (2014). Population structure of the endangered Franciscana dolphin (Pontoporia blainvillei): Reassessing management units. PloS One 9, e85633. doi: 10.1371/journal.pone.0085633
Gero S., Whitehead H., and Rendell L. (2016). Individual, unit and vocal clan level identity cues in sperm whale codas. R. Soc Open Sci. 3, 150372. doi: 10.1098/rsos.150372
Giardino V. G., Cosentino M., Macchi A. C., Loureiro J. P., Heredia S. R., Alvarez K. C., et al. (2024). Detailed comparison of acoustic signals from rehabilitated and wild franciscanas (Pontoporia blainvillei) dolphins. Animals 14, 2436. doi: 10.3390/ani14162436
ICMBio (2018). Livro Vermelho da Fauna Brasileira Ameaçada de Extinção: Volume II - Mamíferos (Brasília, DF: Instituto Chico Mendes de Conservação da Biodiversidade).
IUCN-MMPATF (2023). Laje de Santos – Ilha Grande IMMA. Available online at: https://www.marinemammalhabitat.org/imma-eatlas/ (Accessed March 4, 2025).
Lailson-Brito J., Azevedo A. F., Santos-Neto E. B., and Bisi T. L. (2020). Botos cinza: e outros cetáceos das baías da Ilha Grande e de Sepetiba. 1 Edição (São Paulo: DBA Editora).
Madsen P. T. and Wahlberg M. (2007). Recording and quantification of ultrasonic echolocation clicks from free-ranging toothed whales. Deep. Res. Part I Oceanogr. Res. Pap. 54, 1421–1444. doi: 10.1016/j.dsr.2007.04.020
Melcón M. L., Failla M., and Iñíguez M. a. (2012). Echolocation behavior of franciscana dolphins (Pontoporia blainvillei) in the wild. J. Acoust. Soc Am. 131, EL448. doi: 10.1121/1.4710837
Morisaka T. and Connor R. C. (2007). Predation by killer whales (Orcinus orca) and the evolution of whistle loss and narrow-band high frequency clicks in odontocetes. J. Evol. Biol. 20, 1439–1458. doi: 10.1111/j.1420-9101.2007.01336.x
Paitach R. L., Amundin M., Teixeira G., and Cremer M. J. (2021). Echolocation variability of franciscana dolphins (Pontoporia blainvillei) between estuarine and open-sea habitats, with insights into foraging patterns. J. Acoust. Soc Am. 150, 3987–3998. doi: 10.1121/10.0007277
Rankin S., Oswald J. N., Simonis A. E., and Barlow J. (2015). Vocalizations of the rough-toothed dolphin, Steno bredanensis, in the Pacific Ocean. Mar. Mammal Sci. 31, 1538–1548. doi: 10.1111/mms.12226
Rendell L. E. and Whitehead H. (2003). Vocal clans in sperm whales (Physeter macrocephalus). Proc. R. Soc London B 270, 225–231. doi: 10.1098/rspb.2002.2239
Reyes Reyes M. V., Iñiguez M. A., Hevia M., Hildebrand J. A., and Melcón M. L. (2015). Description and clustering of echolocation signals of Commerson’s dolphins (Cephalorhynchus commersonii) in, Argentina in Bahía San Julián, Argentina. J. Accoustical Soc Am. 134, 2046–2053. doi: 10.1121/1.4929899
Secchi E. R., Cremer M. J., Danilewicz D., and Lailson-Brito J. (2021). A synthesis of the ecology, human-related threats and conservation perspectives for the endangered franciscana dolphin. Front. Mar. Sci. 8. doi: 10.3389/fmars.2021.617956
Tellechea J. S. and Norbis W. (2014). Sound characteristics of two neonatal franciscana dolphins (Pontoporia blainvillei). Mar. Mammal Sci. 30, 1573–1580. doi: 10.1111/mms.12122
Tellechea J. S., Perez W., Olsson D., Lima M., and Norbis W. (2017). Feeding habits of franciscana dolphins (Pontoporia blainvillei): Echolocation or passive listening? Aquat. Mamm. 43, 430–438. doi: 10.1578/AM.43.4.2017.430
Watkins W. A. and Schevill W. E. (1977). Sperm whale codas. J. Acoust. Soc Am. 62, 1485–1490. doi: 10.1121/1.381678
Zerbini A. N., Secchi E., Crespo E., Danilewicz D., and Reeves R. (2017). Pontoporia blainvillei (errata version published in 2018). IUCN Red List Threat. Species e.T17978A123792204. doi: 10.2305/IUCN.UK.2017-3.RLTS.T17978A50371075.en
Keywords: narrow-band high-frequency, echolocation clicks, cetacean, bioacustic, Ilha Grande Bay
Citation: Bittencourt L, Carvalho RR, Pereira K, Santos-Neto EB, Lailson-Brito Jr. J, Bisi TL and Azevedo AF (2025) Acoustic parameter variation and emission patterns in franciscana dolphin (Pontoporia blainvillei) clicking behavior at high frequency. Front. Mar. Sci. 12:1641888. doi: 10.3389/fmars.2025.1641888
Received: 05 June 2025; Accepted: 15 September 2025;
Published: 24 September 2025.
Edited by:
Todd Atwood, U.S. Geological Survey, United StatesCopyright © 2025 Bittencourt, Carvalho, Pereira, Santos-Neto, Lailson-Brito, Bisi and Azevedo. This is an open-access article distributed under the terms of the Creative Commons Attribution License (CC BY). The use, distribution or reproduction in other forums is permitted, provided the original author(s) and the copyright owner(s) are credited and that the original publication in this journal is cited, in accordance with accepted academic practice. No use, distribution or reproduction is permitted which does not comply with these terms.
*Correspondence: Lis Bittencourt, bGlzLmJpdHRAZ21haWwuY29t