Abstract
Plumes and pockmarks are formed when shallow gas breaches the seabed and infiltrates into ocean currents, disrupting the original ecological environment and affecting biological habitats and migration behaviors. An independently developed experimental system was employed in this study to investigate the effects of gas source pressure, burial depth, and number of release orifices on plume morphology and pockmark characteristics, aiming to evaluate their impacts on seabed ecological functions. Experimental results show that the maximum fountain height and plume diameter increase no-linearly with the increase in pressure and orifice number but decrease with increasing burial depth. The plume angle is positively correlated with pressure and negatively correlated with burial depth, showing no correlation with orifice number. Pockmark depth, diameter, and volume exhibit similar variation trends, with pressure being the dominant factor. Analysis of variance reveals that pockmark volume is most sensitive to pressure, while diameter has the least influence. Soil strength measurements after gas release demonstrate distinct patterns: strength increases in the pockmark center and external areas due to compaction, whereas it decreases in the waistline and edge regions due to shear failure. These changes may regulate benthic community distribution by altering sediment stability and pore water chemistry. The findings provide experimental insights into how gas release parameters influence submarine geomorphology and sedimentary environments, contributing to risk assessment of marine ecological disturbances associated with shallow gas activities.
1 Introduction
With the rapid advancement of urbanization and industrialization, global energy consumption has entered a phase of accelerated depletion (Khan et al., 2022; Wang et al., 2025). As onshore energy resources approach their development limits, submarine energy reserves have increasingly drawn attention (Cai et al., 2024). China, with its vast marine areas, harbors abundant coastal resources, particularly offshore oil, natural gas, and gas hydrates (Wang et al., 2022; Su et al., 2022). However, the exploitation of subsea resources inevitably induces shallow gas leakage, as these resources are typically located at significant depths (Zhang and Zhai, 2015; Vielstaedte et al., 2017). Submarine shallow gas release, a pervasive geological process, has garnered growing attention due to its dual role in shaping seafloor topography and disrupting marine ecosystems (Kunath et al., 2022). When shallow gas breaches sediment and interacts with ocean currents, it forms plumes that entrain surrounding sediments, leading to the development of pockmarks. This not only compromises the bearing capacity of offshore infrastructure but also exacerbates seafloor instability under seismic or wave loads, potentially triggering submarine landslides, foundation settlement, and platform overturning (Li et al., 2023; Singhroha et al., 2023). Moreover, it alters sediment stability, pore water chemistry, and nutrient cycling, influencing benthic habitat and migration behaviors (Wallace et al., 2017; Ashford et al., 2021). Additionally, CH4 and H2S, which are abundant in shallow gas, may leak into the atmosphere and potentially cause fireball and vapor cloud explosions (Dando and Hovland, 1992; Ruppel and Kessler, 2017; Leifer and Judd, 2015; Dissanayake et al., 2023), directly threatening avian species. Thus, investigating pockmark development and plume morphology provides intuitive insights into the impact scope of shallow gas leakage.
Shallow gas, rich in CH4, H2S, and CO2, forms plumes through entrainment effects during ascent due to density differences. Sufficient gas source pressure drives gas upward to breach the water surface, manifesting as fountains. Plume morphology is linked to gas release intensity and diffusion rates in water. To understand plume formation and evaluation methods, researchers have conducted experimental and simulation studies. Experimentally, Geng et al. (2021) investigated underwater gas diffusion behaviors, discussing the effects of leakage pressure, water depth, and burial depth on plume dynamics, providing references for gas release research and consequence assessment. Wang et al. (2022) reviewed progress in oil-gas leakage plume studies, highlighting droplet observation and plume dynamics as key to marine oil spill risk assessment. Ren et al. (2022) proposed a multi-beam water column point cloud model for plume extraction, validating its effectiveness in gas hydrate-rich areas of the Gulf of Mexico via density clustering (DBSCAN) and feature matching (FPFH). Wang et al. (2024) further revealed the positive correlation between fountain effects and leakage pressure/aperture size, analyzing plume dynamic equilibrium based on Froude (Fr) and Reynolds (Re) numbers to offer new methods for marine environmental impact assessment. Numerically, Sun et al. (2020) simulated using a 3D Eulerian-Lagrangian coupled model, analyzing the effects of leakage rate, flow velocity, and water depth on plume formation. Li et al. (2020) developed an Eulerian-Lagrangian model to capture jet-to-plume transition and entrainment. For complex scenarios like submarine cold seep plumes, Duan et al. (2020) designed seismic scattering models, finding strong scattering energy and directional seismic wavefields in cold seep plume areas. Although some studies focus on other fluids (e.g., liquid hydrogen), their methods are transferable—for example, Pu et al. (2019) revealed three-stage diffusion characteristics (heavy gas, ascent, passive phases) in liquid hydrogen leakage, providing generalizable insights into buoyancy-driven diffusion.
Plumes entrain sediments during formation, and continuous gas eruption leads to pockmarks centered at the gas breakthrough site. To understand pockmark formation and assess sediment strength changes, studies based on integral models, simulations, and experiments have been conducted. Hovland and Judd (1988) through seabed sediment acoustic data and ROV observations in the North Sea, revealed the genetic link between pockmark development and natural gas leakage, and proposed a “fluid escape-sediment erosion” dynamic formation model. Cathles et al. (2010) established a “piston-water drive” model to reveal the process where rapid gas release following capillary seal failure forms gas chimneys, which in turn triggers sediment liquefaction leading to pockmark formation, emphasizing that complete seal failure is the key mechanism. Mazzini et al. (2017) linked the formation of Norwegian Sea pockmark clusters to gas hydrate dissociation 10 ka ago, indicating alternating cementation-disintegration in pit sediments during depressurization. Sun et al. (2019) analyzed mechanical properties around two large pockmarks near the Zhongjie Mountain Islands in the East China Sea, clarifying causes of sediment strength variations. Jordan et al. (2019) combined vibrocore analysis and geochemical testing in Bantry Bay, Ireland, finding that microbial anaerobic methane oxidation (AOM) reduces pore water sulfate, weakening soil cementation and decreasing compressive strength by ~28%. Pape et al. (2020) quantified the impact of gas hydrate dissociation on pockmark dynamics through pressure coring and geochemical analysis in Nigerian deepwater pockmark A. Wu et al. (2023) proposed a “gas explosion pockmarking” model, explaining similar depth-radius ratios between pockmarks and volcanic craters worldwide. Vaknin et al. (2024) analyzed shear strength in sand-clay bilayer media experiments, identifying dome rupture, brittle faulting, and bubble ascent as gas breakthrough mechanisms in sealing layers.
While single-orifice leakage models have been well-studied, research on two-orifice models remains insufficient. It remains unclear whether plume and pockmark formation processes interact in two-orifice leakage or if diffusion characteristics converge with single-orifice models. To deepen understanding of gas leakage mechanisms and accurately evaluate diffusion characteristics during shallow gas release, this study used customized experimental systems to conduct single and two orifice gas leakage tests. Variations in plume and pockmark parameters under different gas source pressures and burial depths were investigated, and correlations between sediment strength, pressure, and distance from pockmark centers were discussed. The findings provide experimental insights into how gas release parameters influence submarine geomorphology and sedimentary environments, contributing to risk assessment of marine ecological disturbances associated with shallow gas activities.
2 Experimental equipment and methods
An experimental physical model was established to simulate shallow gas release and its ecological impacts, modified based on sediment-biology interactions. The experiment was conducted in a flume measuring 50 m in length and 1 m in width (Figure 1). To minimize soil usage, a transparent acrylic box measuring 40 cm by 30 cm by 30 cm was placed within the flume, filled with a sand-clay mixture at a 9:1 ratio and with a dry density of 1.65 to 1.80 g/cm³, simulating typical marine sediments. A compressed air system (0–700 kPa capacity) was used to simulate gas release, with pressures set at 100, 200, 300, 400, and 500 kPa. Release configurations included a single orifice (5 mm diameter) and two orifices (5 cm spacing), while burial depths were 10, 15, and 20 cm. CO2 gas was used to represent shallow gas in the test, as it is easy to prepare and has high safety.
Figure 1
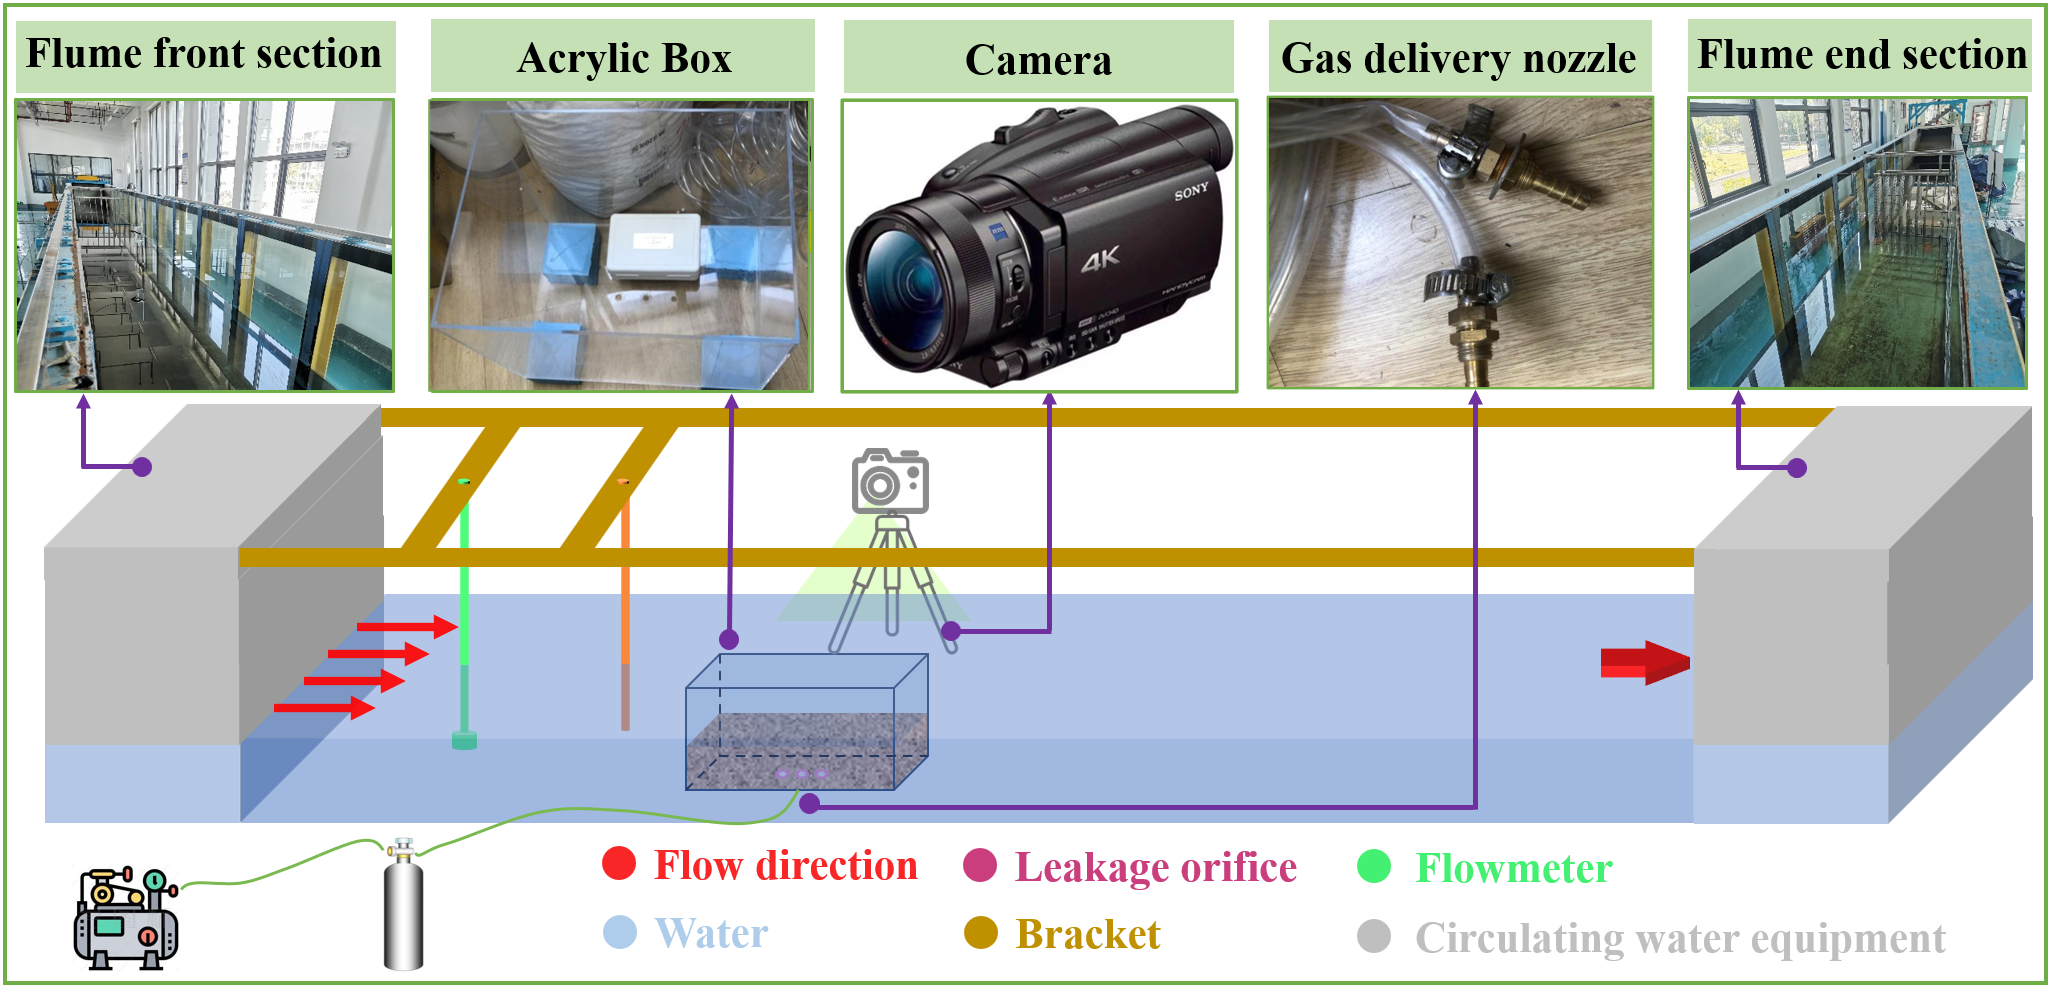
Experimental equipment and arrangement.
Hydrodynamic processes were recorded using a high-speed camera (200 fps) to measure fountain height, plume diameter, and cone angle. Post-experimentally, pockmark depth and diameter were measured with a stainless steel ruler, and volume was calculated via integration. Sediment strength was assessed using a WXGR-3.0 micro penetrometer (17–130 kPa range) in four zones: pockmark center, waistline, edge, and external area (2 cm from the edge), targeting sediment stability indices critical for benthic colonization. Coefficients of variance were calculated to evaluate parameter sensitivity, linking physical disturbances to potential ecological impacts. Each test was repeated three times for reproducibility, and analysis of variance was used to determine the significant effects of pressure, depth, and orifice number on the plume-pockmark-sediment system.
3 Analysis of results
3.1 Plume dynamic characteristics analysis
Four distinct plume stages were observed in single-orifice gas release: bubble expansion, pressure jetting, buoyancy jetting, and continuous jetting (Spring gushing) (Figure 2). During the initial stage, gas rapidly accumulated at the orifice, forming a cavity of bubble accumulation on the sediment surface due to gradually expanding pressure difference. When pressure exceeded the sediment strength threshold, bubbles surged toward the water surface driven by pressure difference and buoyancy. Bubbles entrained surrounding water during ascent, causing intense energy exchange at the gas-liquid interface, which expanded the gas mass volume and formed an inverted cone. As bubbles rose, pressure difference kinetic energy was insufficient to maintain rapid movement due to fluid resistance, and buoyancy became the dominant driving force, stabilizing the ascent velocity. Collisions between bubbles of varying velocities intensified turbulent pulsation, with bubble coalescence and breakage becoming prominent. The plume expanded laterally from the gas source center, and continuous gas flow stabilized into a wide gas mass that broke through the water surface, forming a fountain. The plume eventually took the shape of an inverted cone with a stable apex angle (Figure 3a).
Figure 2
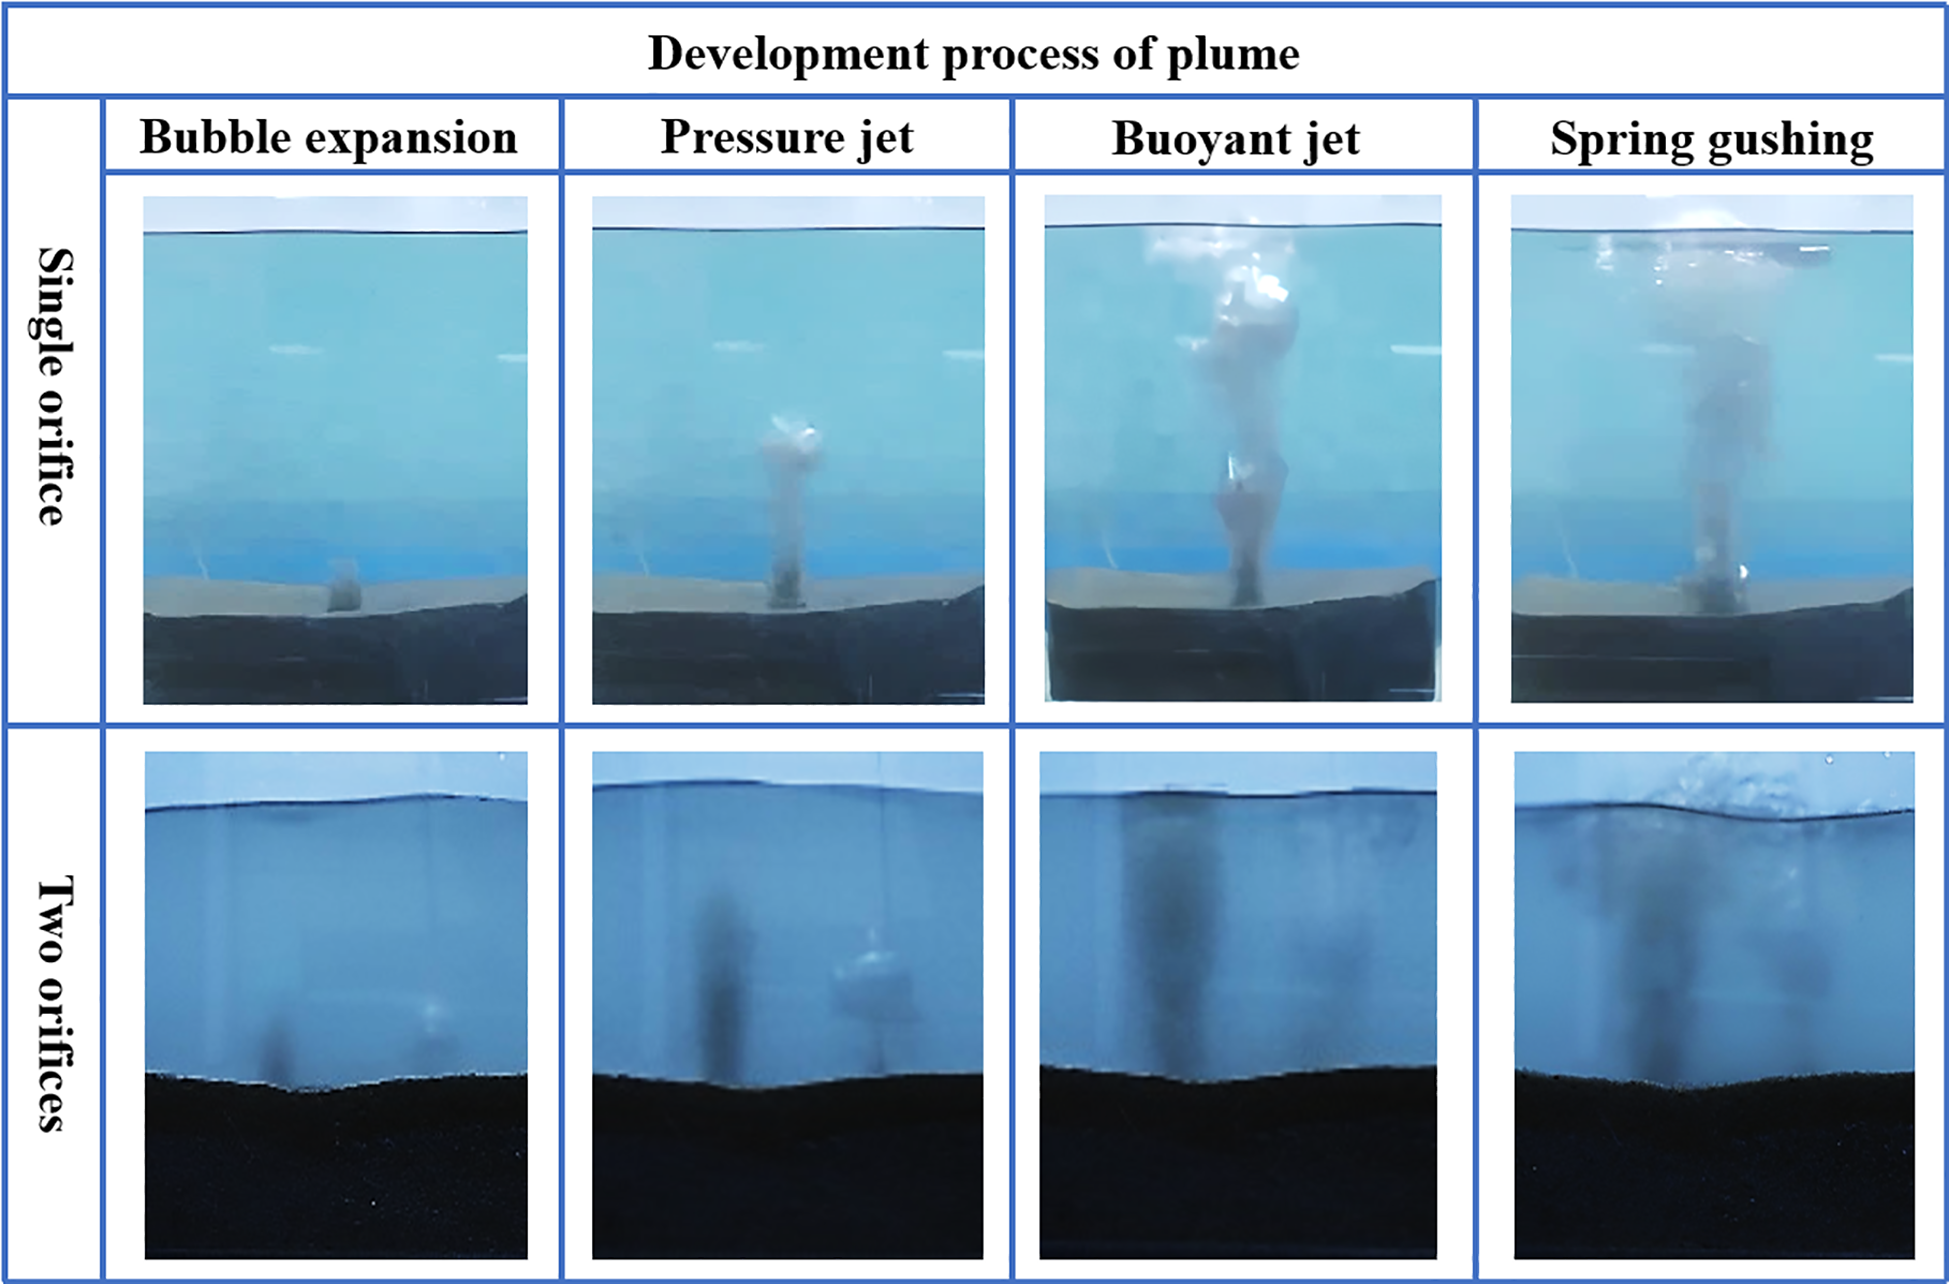
Development process of plumes in single and two orifice releases.
Figure 3
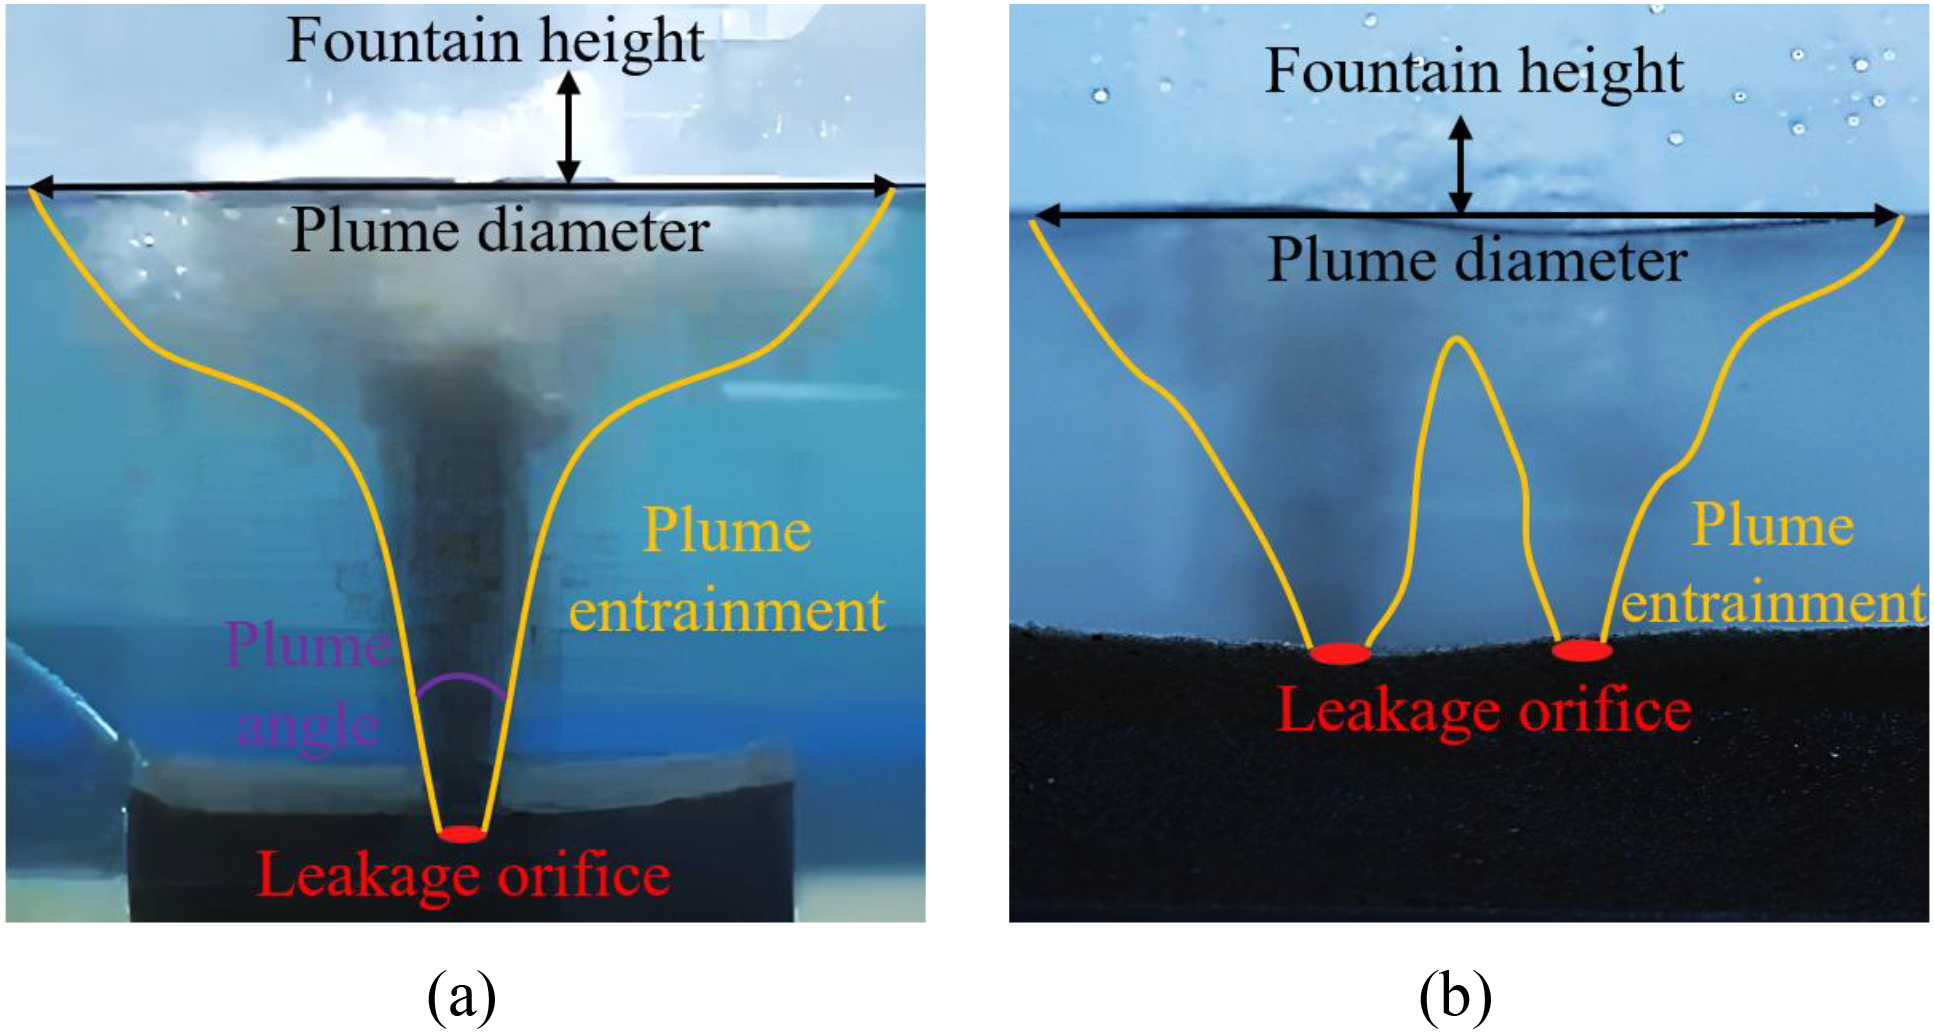
Plume morphology at steady state: (a) single orifice; (b) two orifices.
Due to the entrainment effect between plumes, bubbles exhibit significant differences during the ascent phase in two-orifice release. During this phase, bubbles are influenced not only by the combined action of pressure difference kinetic energy and buoyancy but also by horizontal entrainment between plumes. With sustained entrainment, the lateral expansion velocity of plumes becomes faster compared to single-orifice release, leading gas masses to attract and converge with each other. Meanwhile, bubble coalescence and breakage effects are more pronounced, and the expansion of velocity differences intensifies the lateral expansion of bubbles. During the buoyancy jetting phase of single-orifice release, plumes from two-orifice release show a trend of fusing into a single entity. The plumes ultimately take on a W-shaped morphology (see Figure 3b). After fusion, the dual plumes exhibit enhanced capacity to entrain water and particles, resulting in more turbid water and a broader fountain range.
Comparisons of plume diameter, angle, and fountain height under different pressures and burial depths are shown in Figure 4 to visualize morphological variations. (Figure 4a) indicates that maximum plume diameter increased with gas pressure, differing significantly between single and two orifices, while burial depth had a weak effect. At 10 cm burial depth, plume diameter increased by 20.4% (two orifices) and 24.2% (single orifice) as pressure rose from 100 to 500 kPa. Higher pressure provided greater kinetic energy for bubble ascent, intensifying collisions and altering flow field pulsation, which drove lateral expansion. At 500 kPa, plume diameter decreased by only 0.6%–1.2% as burial depth increased from 10 to 20 cm. Deeper burial prolonged gas migration path in sediment, consuming more kinetic energy for breakthrough. Changing from single to two orifices at 10 cm depth increased maximum plume diameter by 15.5%, 13.5%, 12.8%, 11.6%, and 12.0% across pressure, demonstrating enhanced lateral diffusion due to inter-plume entrainment.
Figure 4
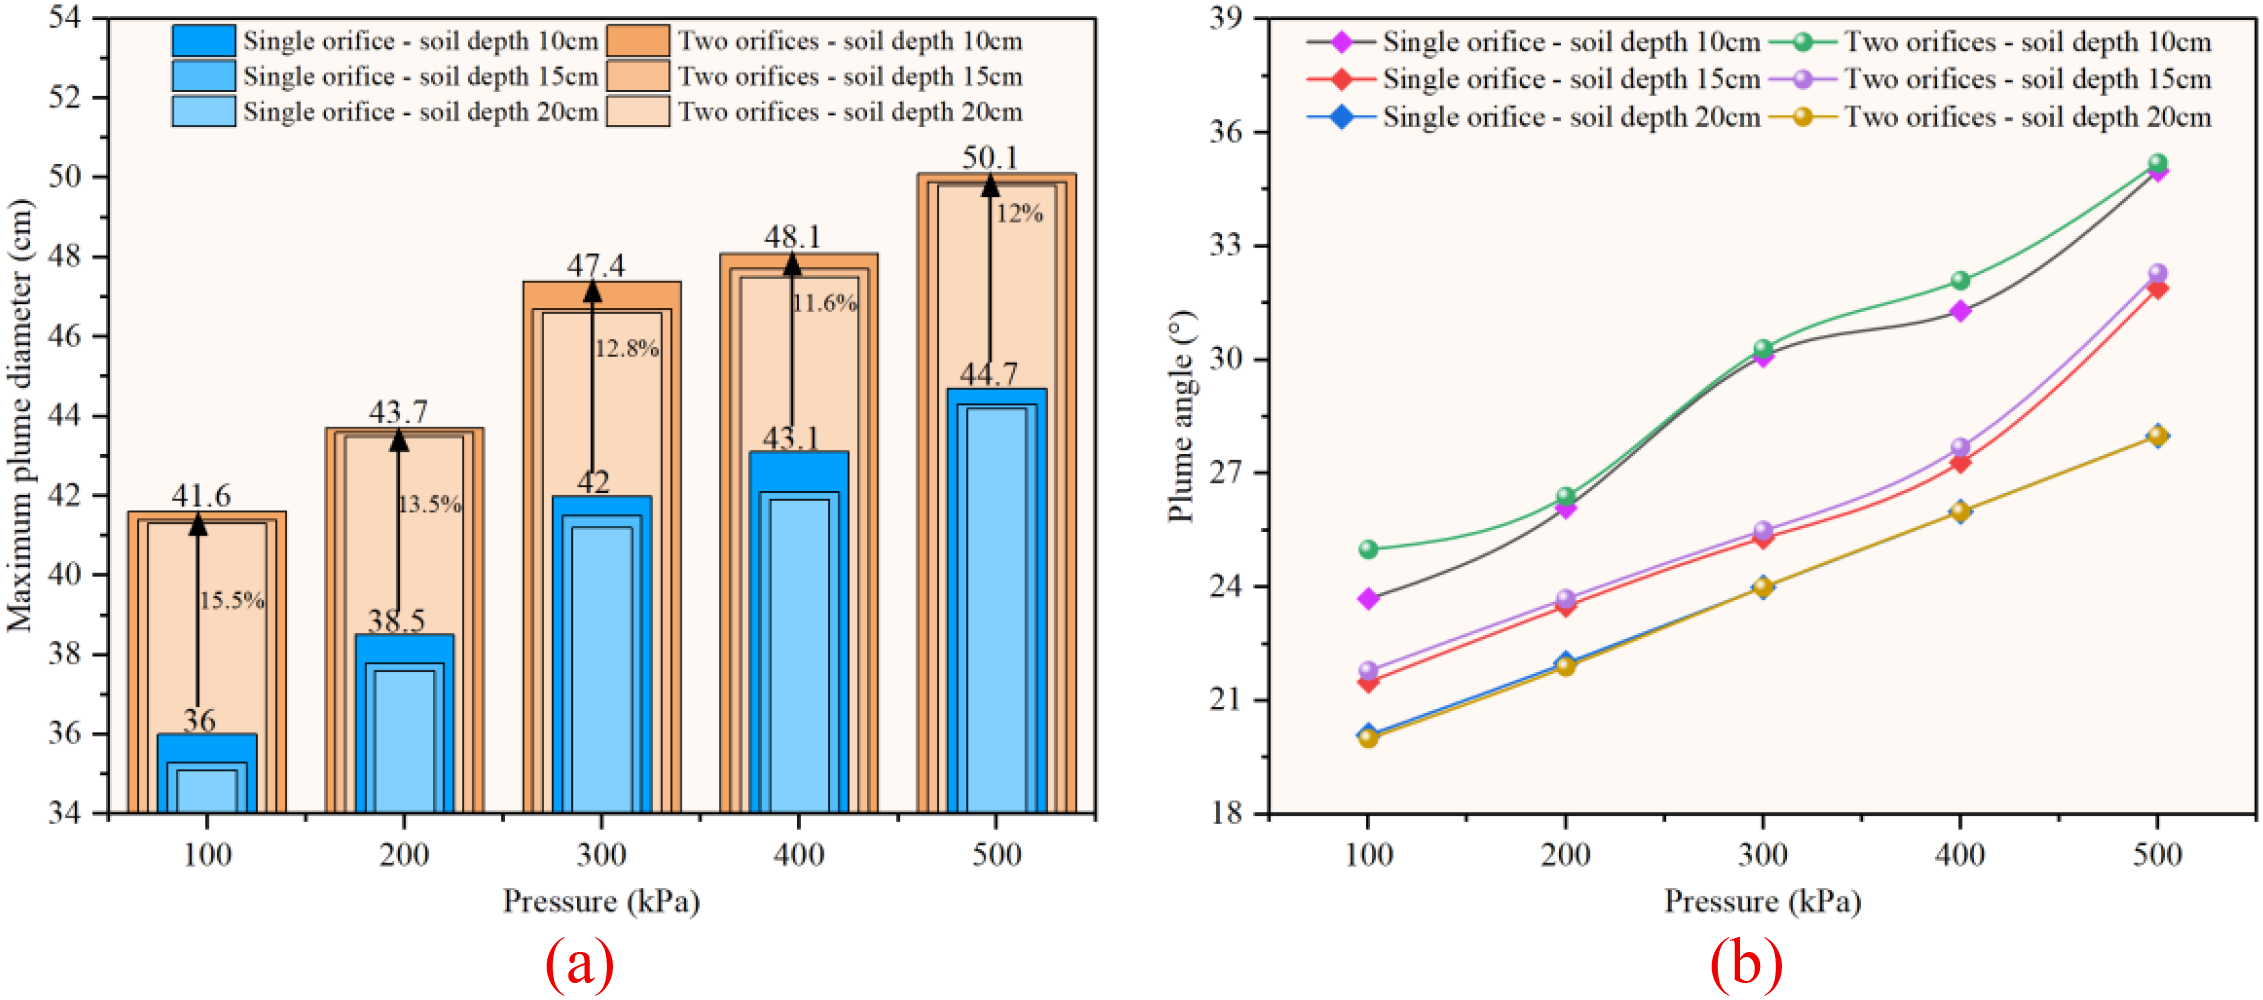
Parameter comparisons under different conditions: (a) maximum plume diameter; (b) plume angle.
(Figure 4b) shows that plume cone angle expanded with increasing pressure and decreased with burial depth, with negligible effect from orifice number. Higher pressure enhanced gas egress kinetic energy, promoting entrainment between plume and surrounding water, which increased radial expansion. At 10 cm depth, cone angle increased by 47.7% (two orifices) and 40.8% (single orifice) from 100 to 500 kPa. Increasing burial depth from 10 to 20 cm at 500 kPa reduced cone angle by 20.0% (two orifices) and 20.4% (single orifice), indicating a more pronounced effect on cone angle than diameter. Notably, cone angles were nearly identical for single and two orifices releases.
Fountain height, a critical factor for offshore structure stability, is plotted in (Figure 5a). Fountain height increased nonlinearly with gas pressure and decreased with burial depth. Gas pressure converted to kinetic energy at the surface, determining vertical ascent height: higher pressure increased jet velocity, converting more kinetic energy to gravitational potential energy. Deeper burial imposed greater frictional resistance and compaction, attenuating initial egress velocity. Single-orifice flow exhibited “concentrated jetting” with minimal energy loss along the central axis, while two-orifice flows interfered near the surface, forming turbulent dissipation that reduced ascent kinetic energy. The height difference between configurations showed a pattern of “single-orifice dominance at low pressure, two-orifice reversal at high pressure”.
Figure 5
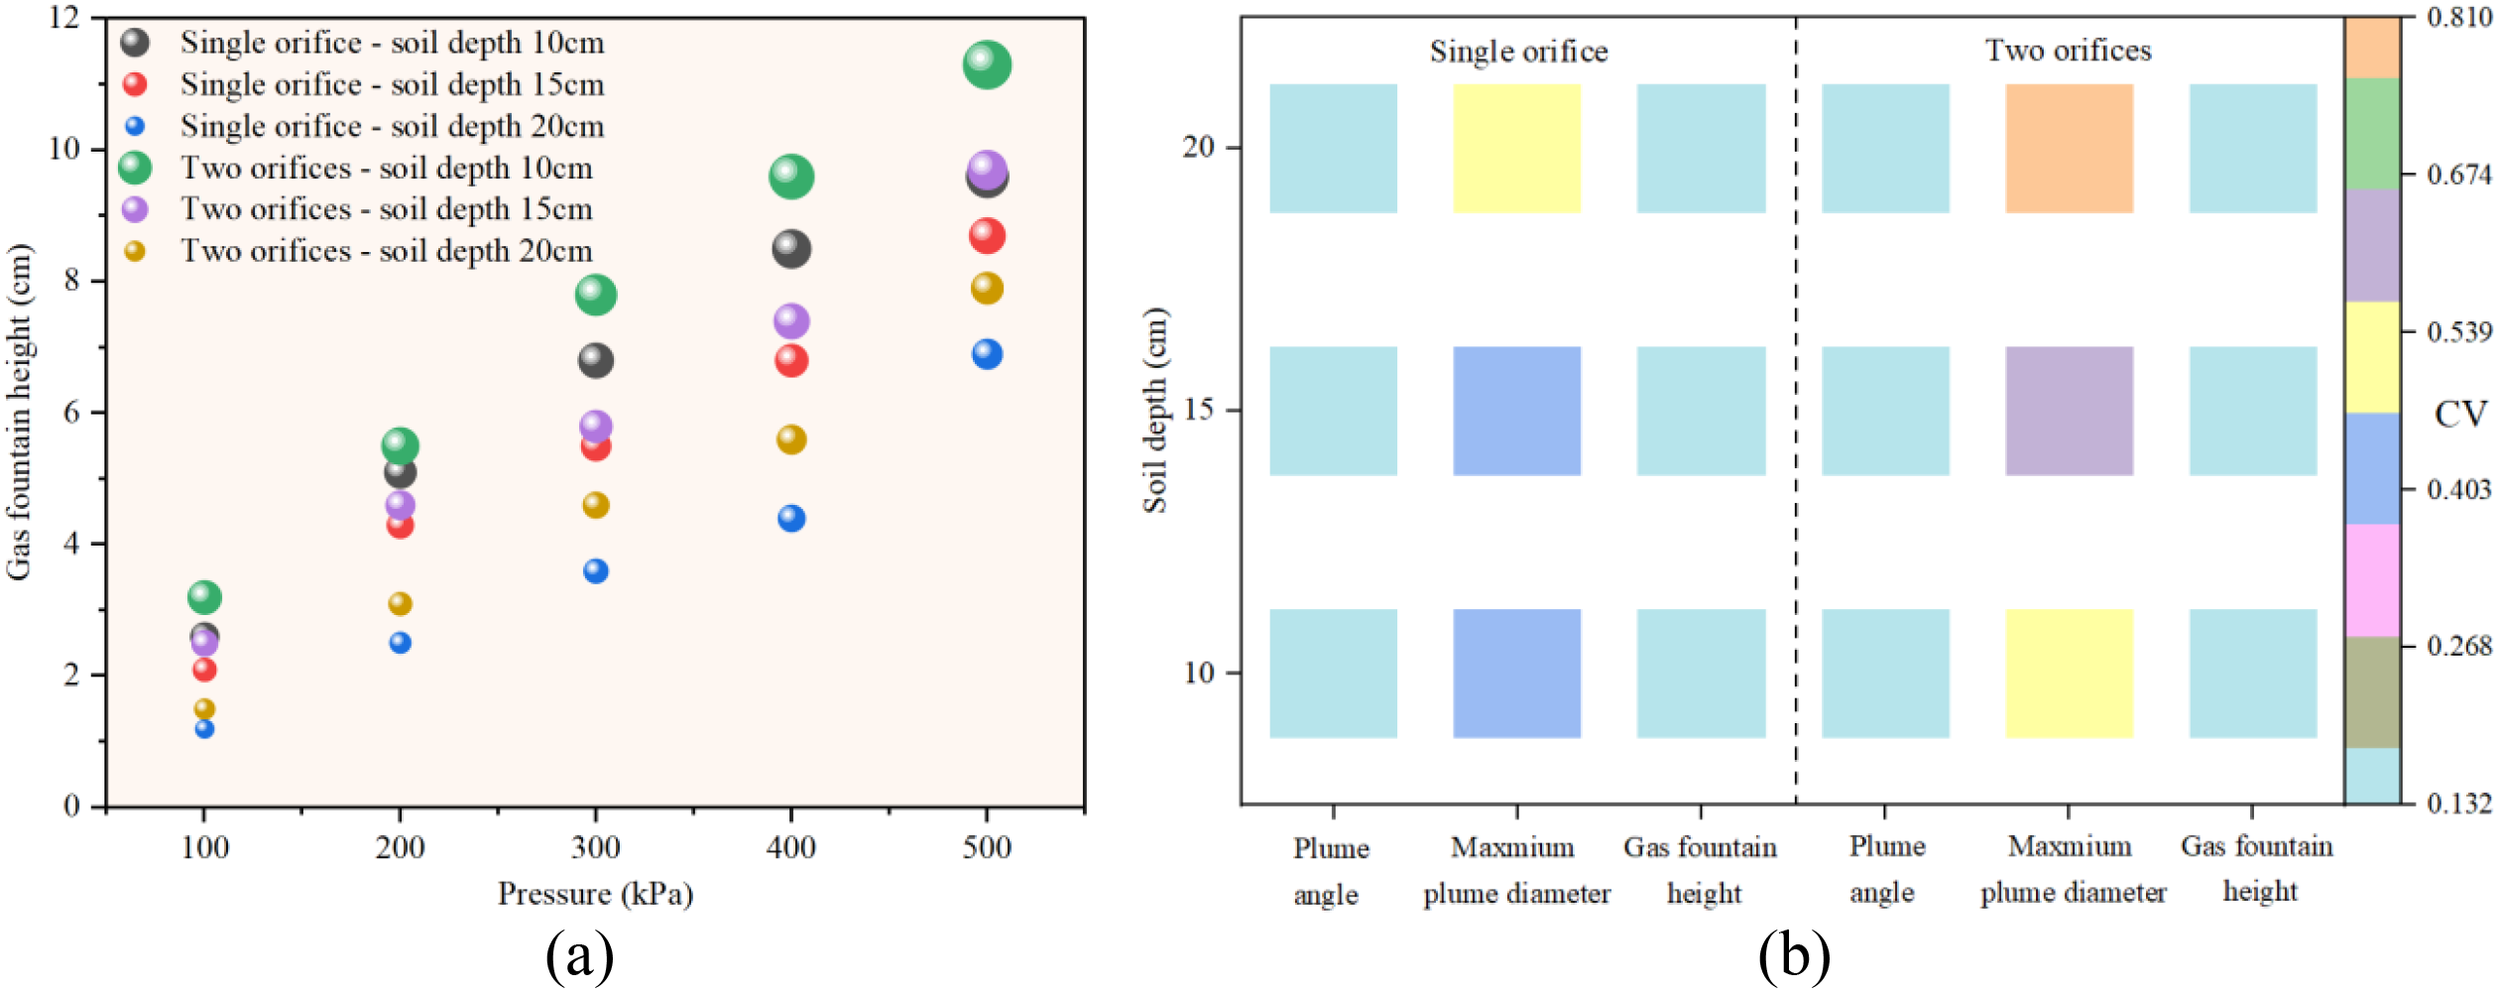
Parameter comparisons under different conditions: (a) fountain height; (b) coefficient of variation.
The coefficient of variation (CV), defined as the ratio of the standard deviation to the mean of the data, was used to reveal the relativity and individual differences in the stability of these parameters (Zhang et al., 2024). A high CV indicates that parameters are most sensitive to pressure fluctuations, causing severe disturbances to epibenthic organisms. In contrast, a low CV suggests stable lateral dispersion, affecting the uniformity of benthic habitats (Bejar et al., 2020). To evaluate the priority of influencing factors, CVs of plume cone angle, maximum plume diameter, and fountain height were compared for single and two orifices at different burial depths. As shown in (Figure 5b), CVs under all conditions exhibited an increasing trend with rising gas pressure. For single-orifice release, CVs of plume cone angle, maximum plume diameter, and fountain height increased from 2.6, 2.1, and 1.2 at 100 kPa to 9.6, 8.7, and 6.9 at 500 kPa, representing increases of 269%, 314%, and 475%, respectively. Two-orifice release generally showed higher CV increases at the same pressure, indicating more unstable gas leakage dynamics and significantly increased parameter dispersion under high-pressure and multi-orifice conditions.
Notable differences in CVs among parameters were observed: fountain height CV consistently exceeded those of plume diameter and cone angle, attributed to its dynamic measurement as an instantaneous jet extreme, which was more affected by gas pulse effects and soil resistance fluctuations. The spatial averaging characteristics of plume diameter and cone angle mitigated instantaneous fluctuations. The phenomenon of two-orifice CV exceeding single-orifice CV was more pronounced in high-pressure regions, resulting from the complexity of inter-orifice airflow interference, “orifice interference effects” caused by spacing uncertainty, and unequal flow distribution. Physically, increased Reynolds number at high pressure enhanced turbulence intensity, aggravating instantaneous fluctuations in the plume boundary layer. Meanwhile, high-speed jetting reduced the temporal resolution of optical measurements, and the influence of soil medium heterogeneity on gas migration increased with burial depth, collectively leading to rising CVs.
3.2 Pockmark development characteristics analysis
During the process of gas breakthrough through the soil mass and its upward migration toward the water surface, soil particles are entrained and transported by the gas flow. As a result of the entrainment effect, the soil particles are deposited both inside and around the pockmarks. Under the continuous action of gas, the soil mass surrounding the leakage orifice gradually diminishes, eventually forming pockmarks with various shapes (Yu et al., 2023). The pockmarks formed after the gas release experiment completely stabilized are shown in Figures 6a, b, whose shape approximates a semi-ellipsoidal form.
Figure 6
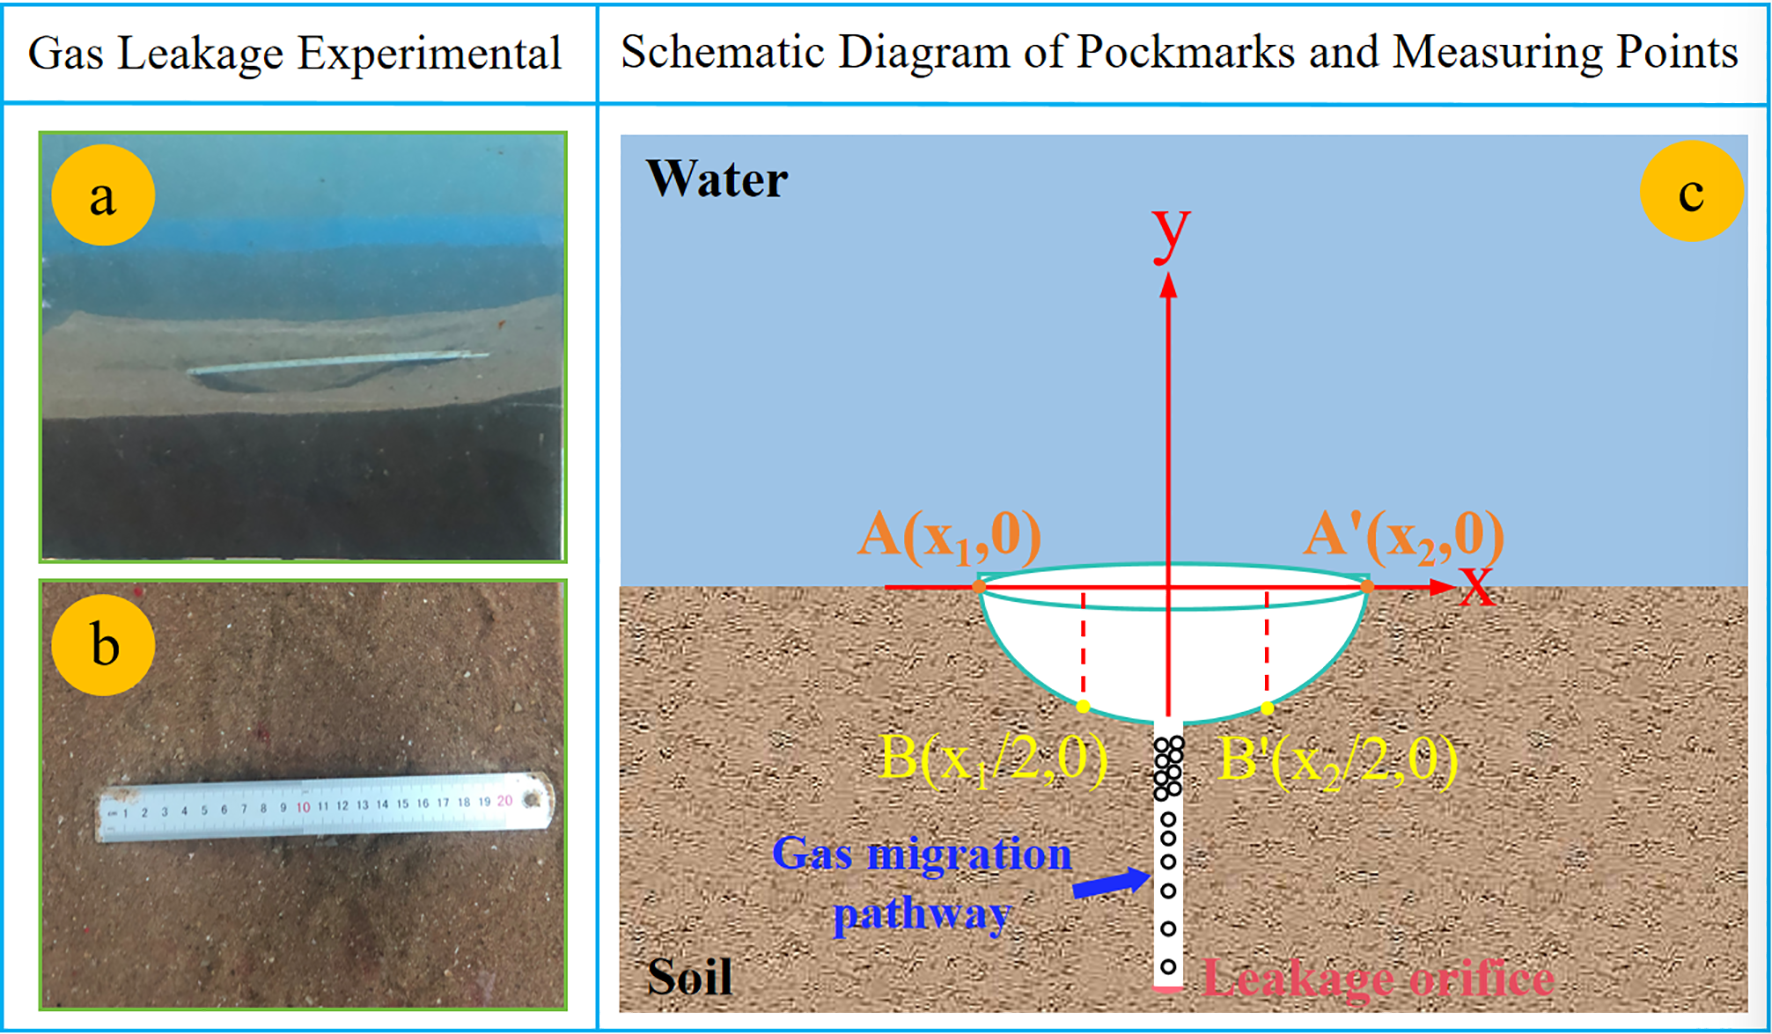
(a, b) Pockmark views during gas leakage experiments; (c) Schematic of pockmark and data sampling points.
The most intuitive parameters for evaluating pockmark impact scope are diameter and depth, measured with a stainless steel ruler in the experiment. Pockmark volume under different conditions was calculated via integration using the measurement points shown in Figure 6c. By measuring x1, x2, y1, y2, and ensuring AO = A’O, the pockmark was confirmed as circular; ensuring BO = B’O and identifying the maximum depth on the y-axis confirmed parabolic sides. The pockmark volume, generated by rotating the parabola around the y-axis, was calculated using:
where a and b are the maximum and minimum abscissas (cm), and f(x)is the parabolic equation of the pockmark side.
As shown in Figure 7, pockmark diameter and depth increased with rising pressure, decreased with increasing burial depth, and increased with the number of leakage orifices. Both single and two orifice releases showed the most pronounced response to gas pressure at a burial depth of 10 cm. When pressure increased from 100 to 500 kPa, the pockmark depth for two orifices at 10 cm depth increased from 2.2 to 4.0 cm, an 81.8% increase (Figure 7b). While the single orifice depth increased from 2.4 to 4.2 cm, a 75% increase, indicating that high-pressure gas significantly enhanced soil vibration (Figure 7a). Deeper burial increased frictional resistance and compaction during gas migration, reducing soil vibration. Conversely, more orifices formed interfering pressure fields in sediments, aggravating particle loosening and reducing compaction.
Figure 7
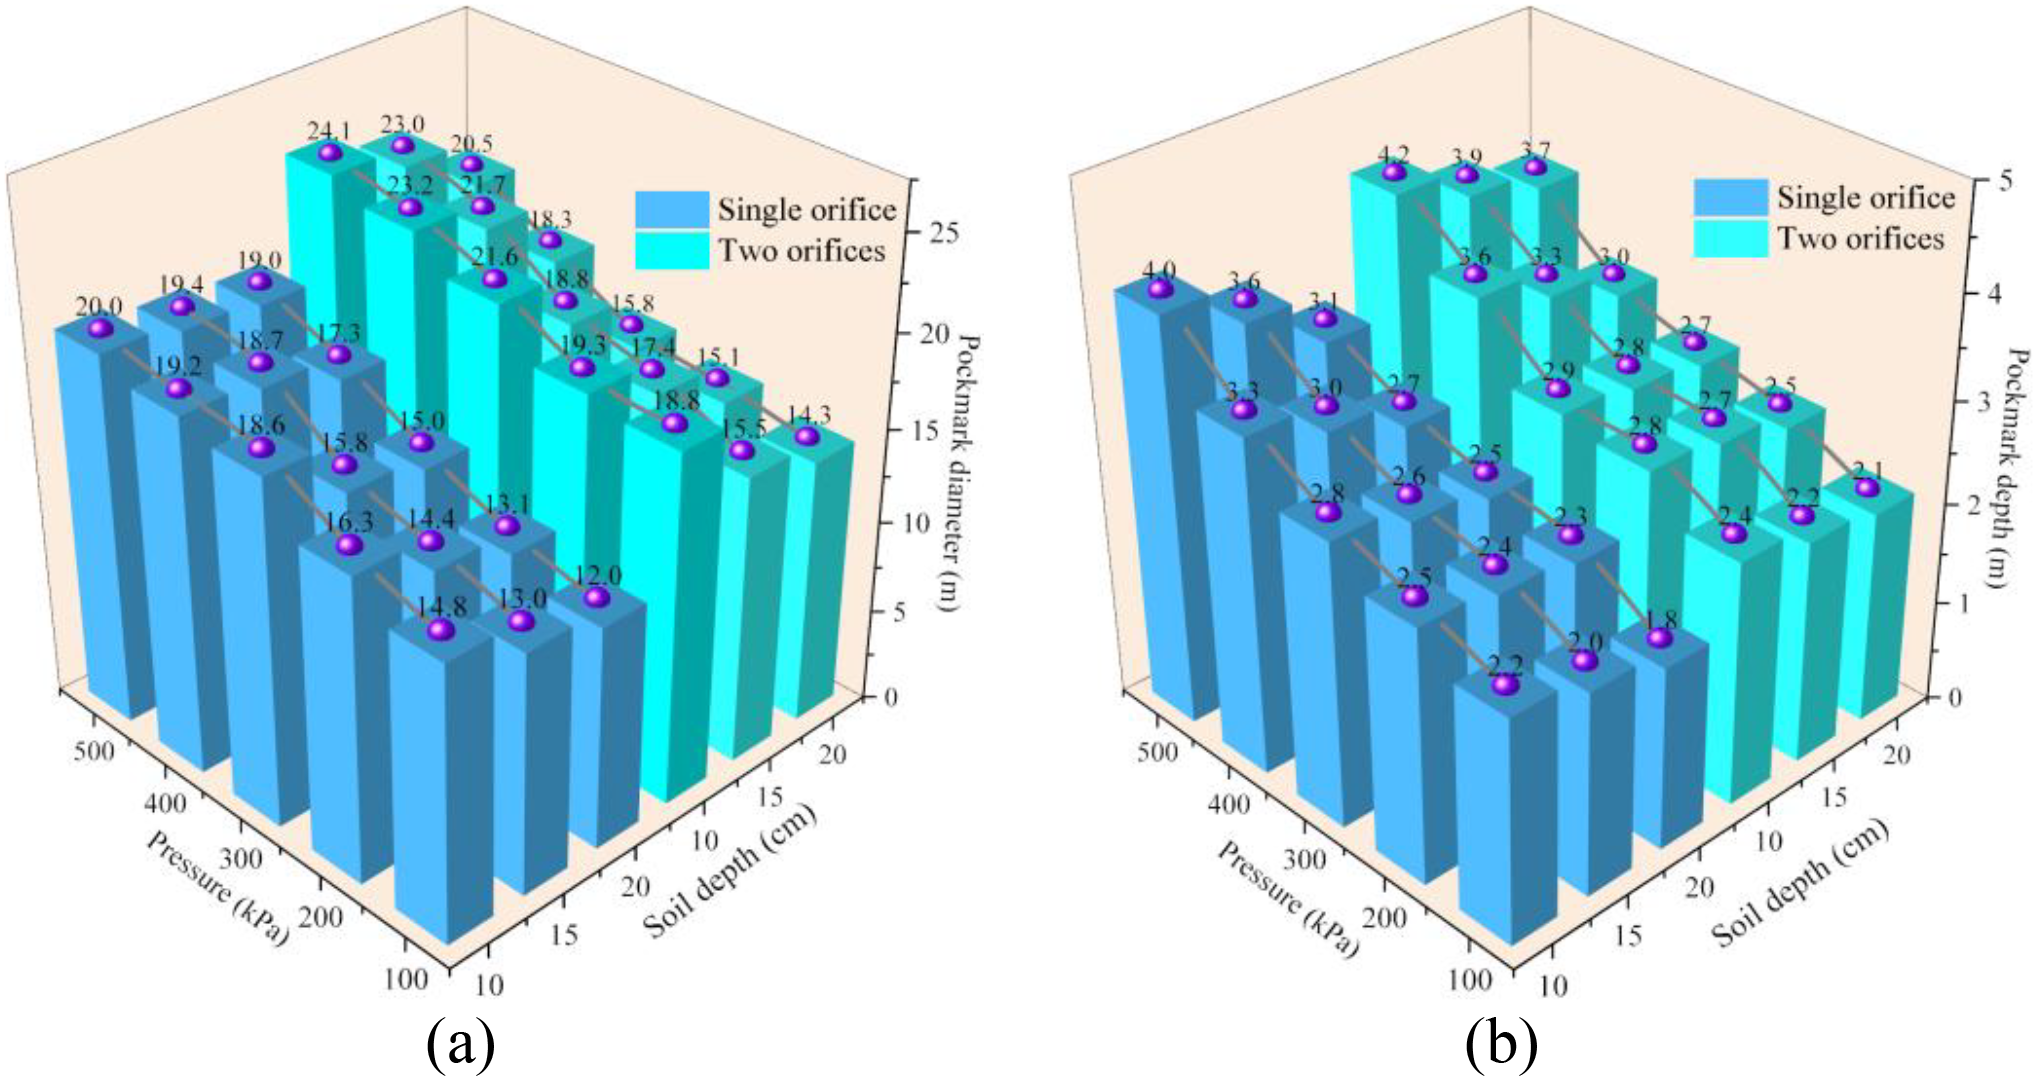
Parameter comparisons under different conditions: (a) pockmark depth; (b) pockmark diameter.
Pockmark volume, an intuitive indicator of habitat destruction, is shown in (Figure 8a) to be positively correlated with gas pressure and orifice number, and negatively correlated with burial depth. Gas release displaces sediments out of the model box via the plume, with higher pressure expanding the gas passage and driving more sediment movement. Two orifices increased gas flux and kinetic energy, expanding the breakthrough area and plume range to entrain more sediments. Deeper burial prolonged gas migration paths, consuming kinetic energy and reducing sediment entrainment capacity. (Figure 8b) shows higher coefficient of variation (CV) for pockmark diameter and volume than depth, with two orifice release causing more significant variations at greater depths. Affected by coupled parameters (depth and diameter), pockmark volume exhibited higher dispersion, influenced by gas pulse effects and soil resistance fluctuations
Figure 8
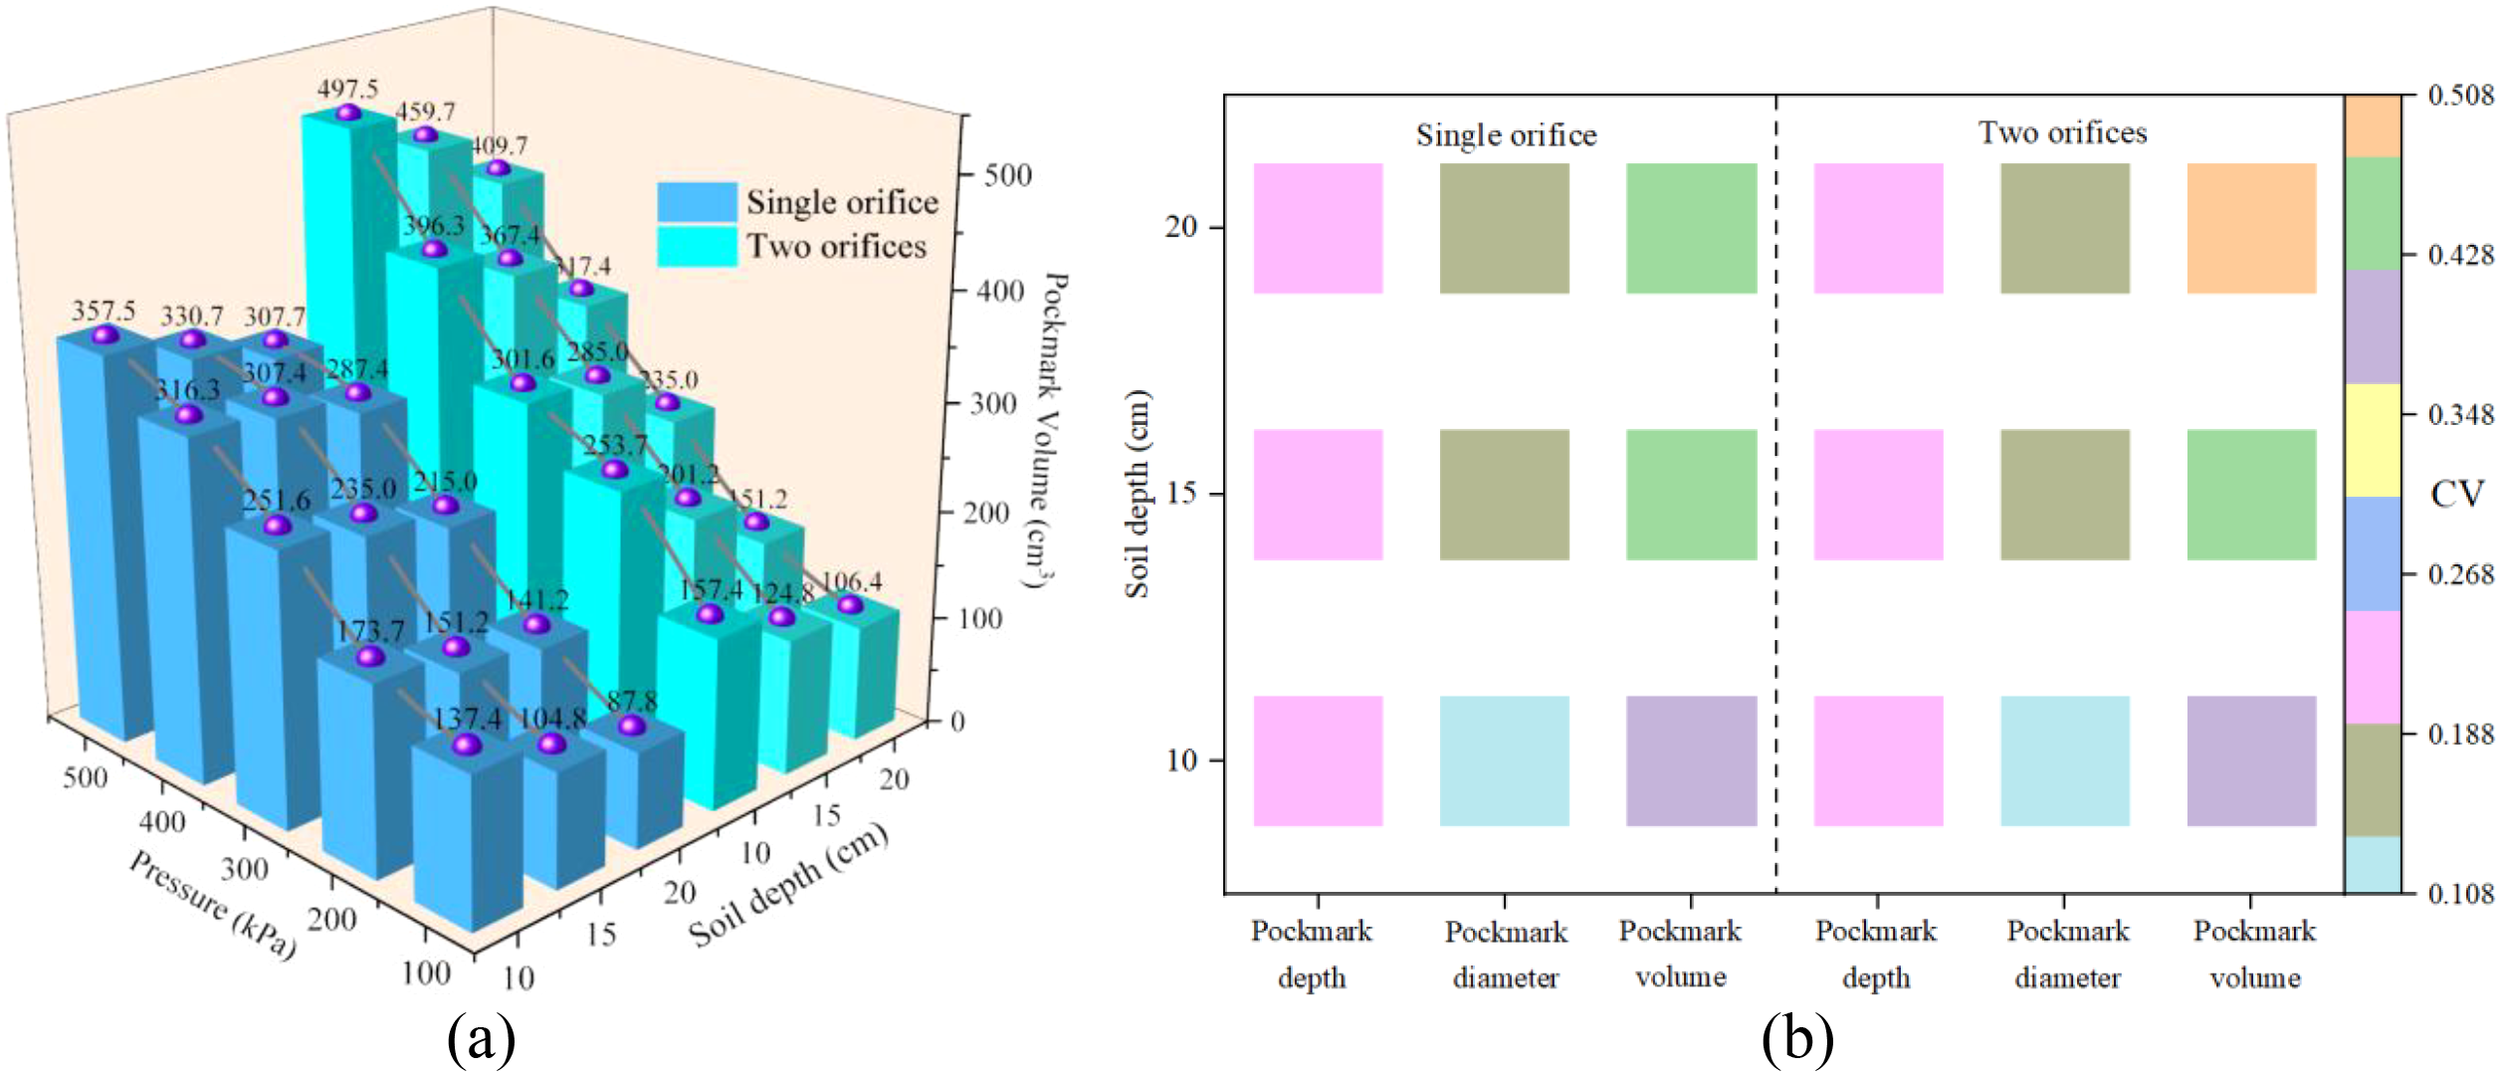
Parameter comparisons under different conditions: (a) pockmark volume; (b) coefficient of variation,.
Experimental results on pockmark development align mechanistically with Cathles et al.’s (2010) fluid-driven sediment disruption model, yet differ notably in scale, driving mechanisms, and multi-source interference. Cathles’ model posits pockmarks initiate when gas chimneys reach a critical equilibrium depth (hw≈0.52(h+d), based on geological-scale gas column and burial depth equilibrium, where buoyancy-driven water flow attains critical velocity to liquefy sediments. This aligns with the observed reduction in shear strength at pockmark waistlines, both highlighting fluid disturbance as the key trigger for sediment shear failure. However, Cathles’ model applies to hundreds-of-meters-deep geological gas reservoirs and focuses on water-dominated fluidization, whereas the centimeter-scale laboratory experiments involve shallow burial (10–20cm) and high-pressure gas sources, with sediments rapidly ejected via direct gas venting. This gas-dominated erosion shortens pockmark formation timelines and accentuates gas-driven characteristics. Despite numerical discrepancies from scale differences, the core mechanism—”fluid disturbance triggering shear failure”—remains universal. Additionally, the experiments reveal that two-orifice gas releases expand disturbance via multi-source pressure interference, with plume merging at close spacings.
4 Discussion
Soil entrained by gas and plume entrainment alters the shear strength of sediments inside and around pockmarks (Zhang et al., 2022). To analyze the disturbance caused by uncontrolled shallow gas release, soil regions have been classified by previous studies into intense disturbance zones, severe disturbance zones, slight disturbance zones, and gas-bearing compaction zones (Figure 9a). Based on the compaction principle, compaction occurs when sediments are subjected to external forces with frequencies close to their natural frequencies. This resonance expels pore water between particles, reducing voids and increasing sediment density. To assess sediment compactness, pockmarks were divided into center, waistline, edge, and external regions according to their morphology (Figure 9b).
Figure 9
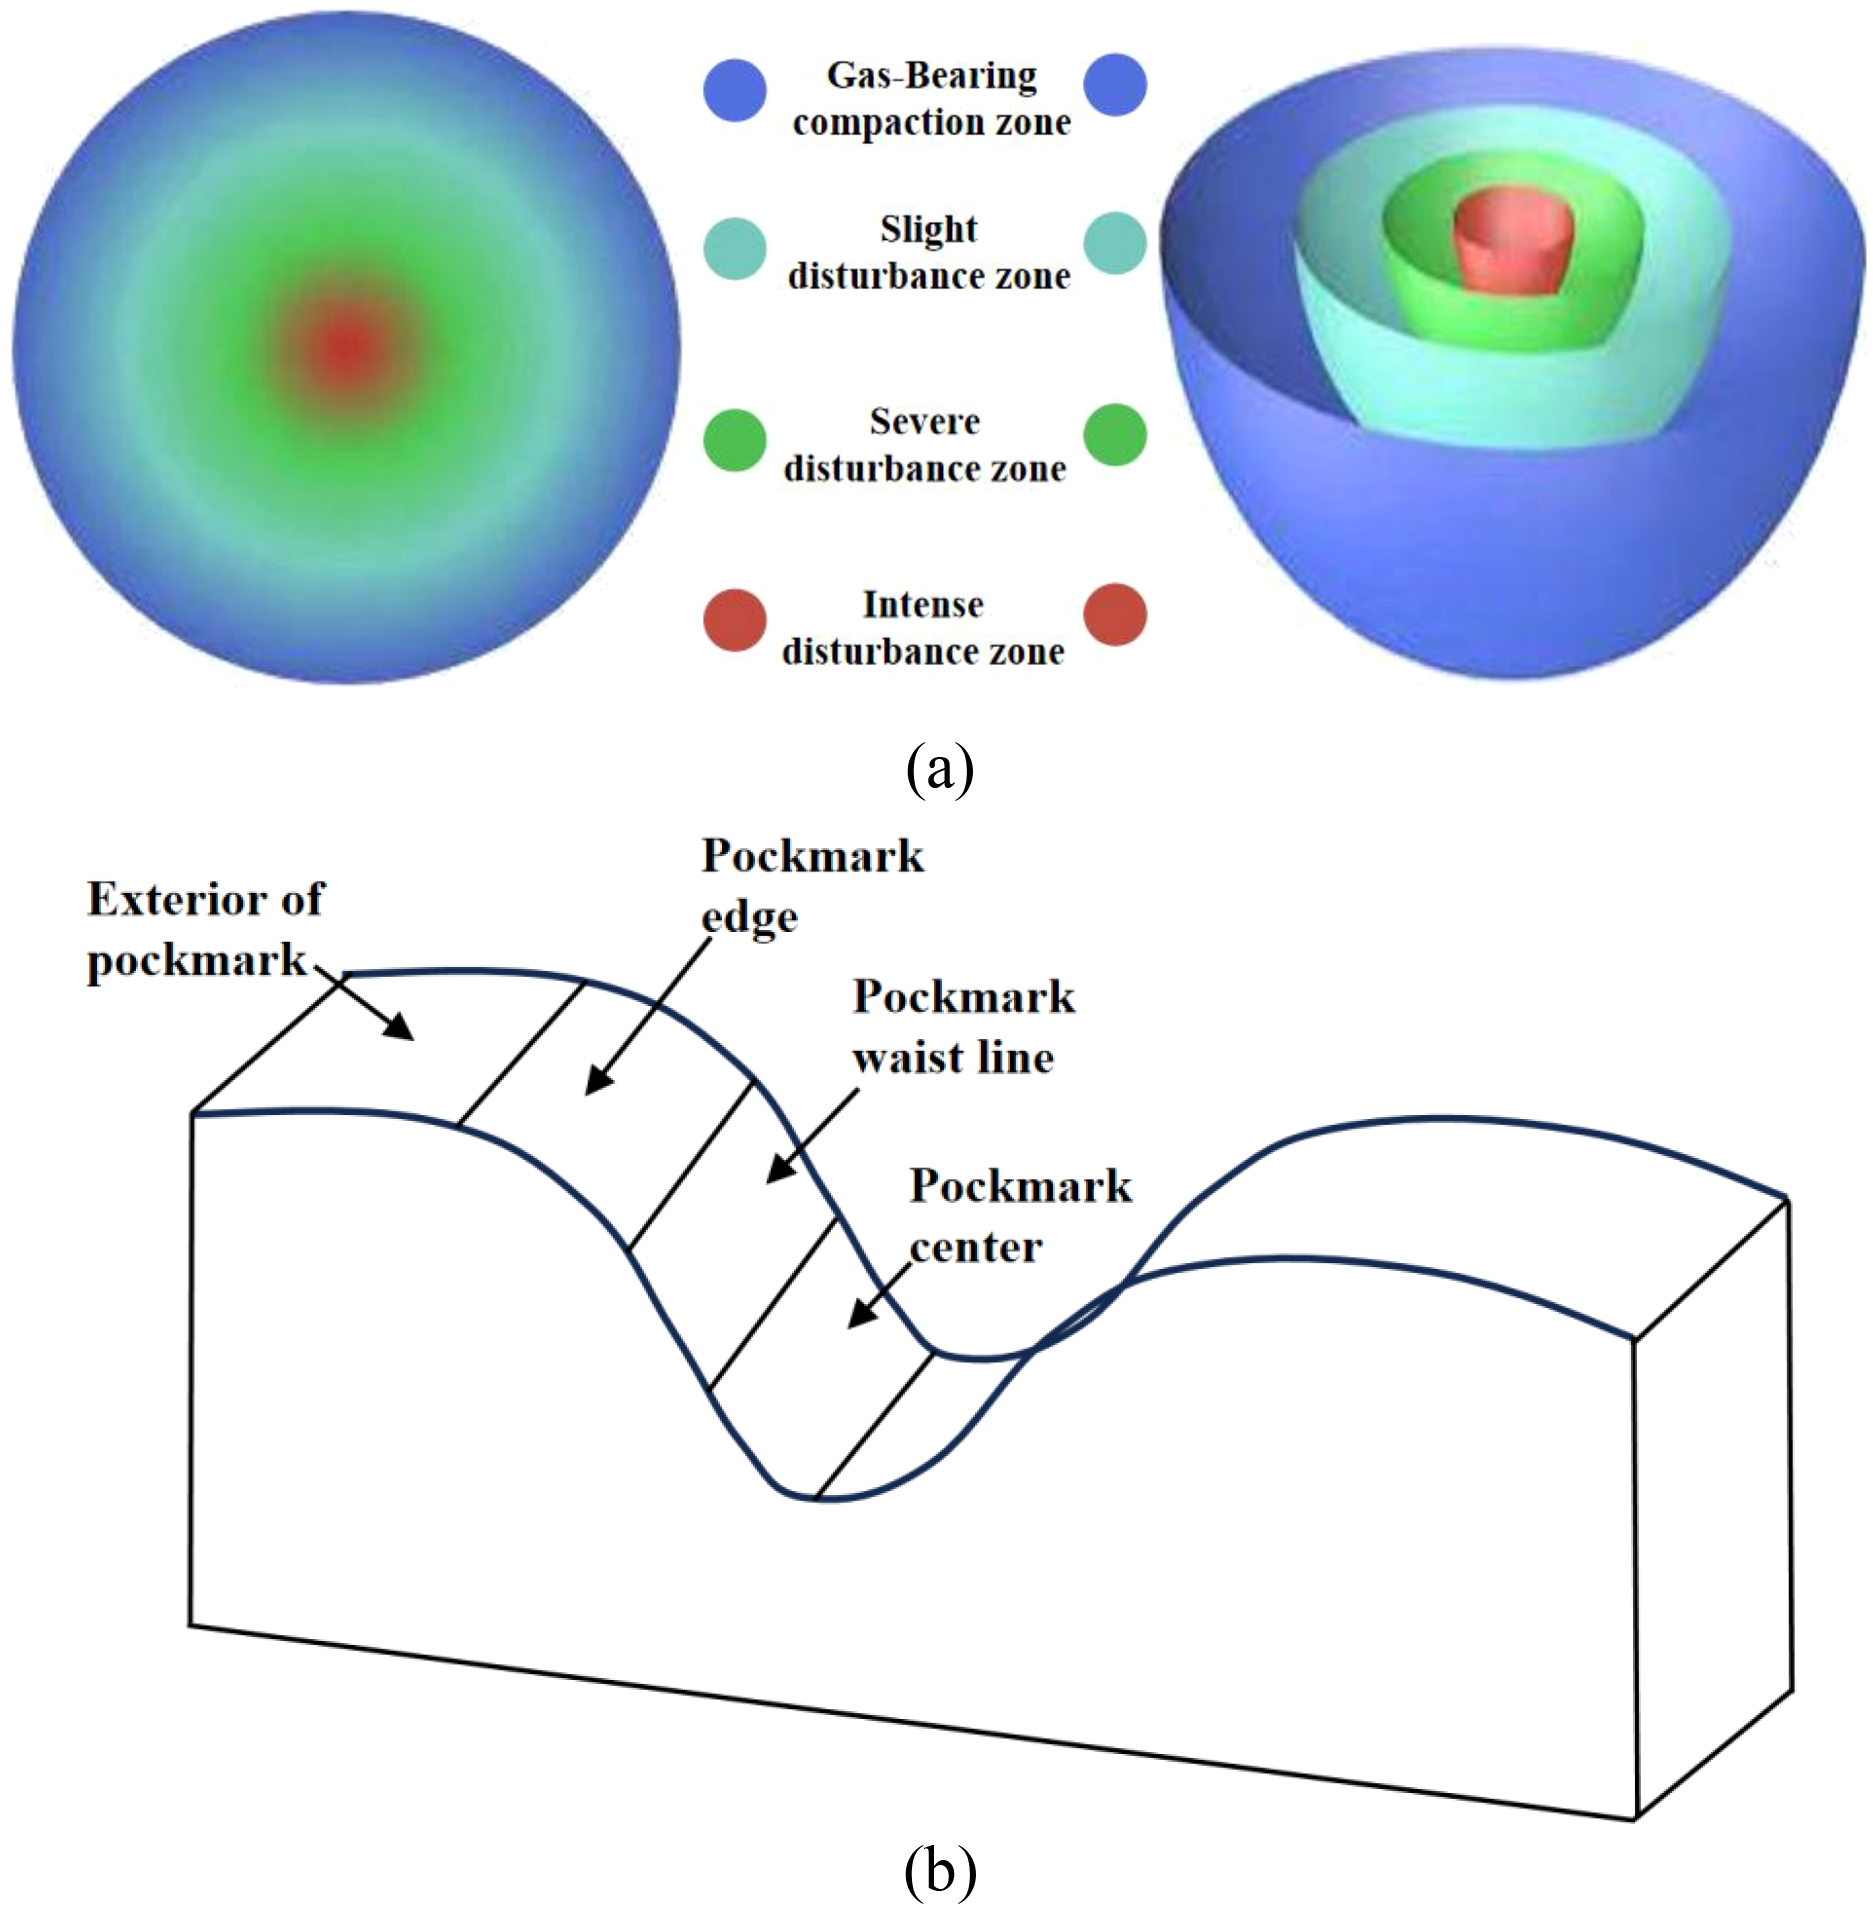
(a) Schematic of disturbed soil zones; (b) Schematic of pockmark zoning.
To investigate vibration compaction and variations in soil strength across different pockmark regions, soil strength was measured at distances of R/2, 5R/6, and R+2 from the pockmark center at a burial depth of 10 cm. The influence of pressure on soil strength at measurement points is shown in Figure 10. For both single and two orifices, soil strength in the pockmark center and external areas increased relative to the initial strength, whereas strength in the pockmark waistline and edge regions decreased. The pockmark center was compacted due to increased fluid pressure and sediment settlement. The waistline, located in the maximum shear stress zone, exhibited pressure gradient reversal according to the Darcy-Forchheimer equation. Meanwhile, the external region showed enhanced soil strength due to the formation of a dense “edge skirt”.
Figure 10
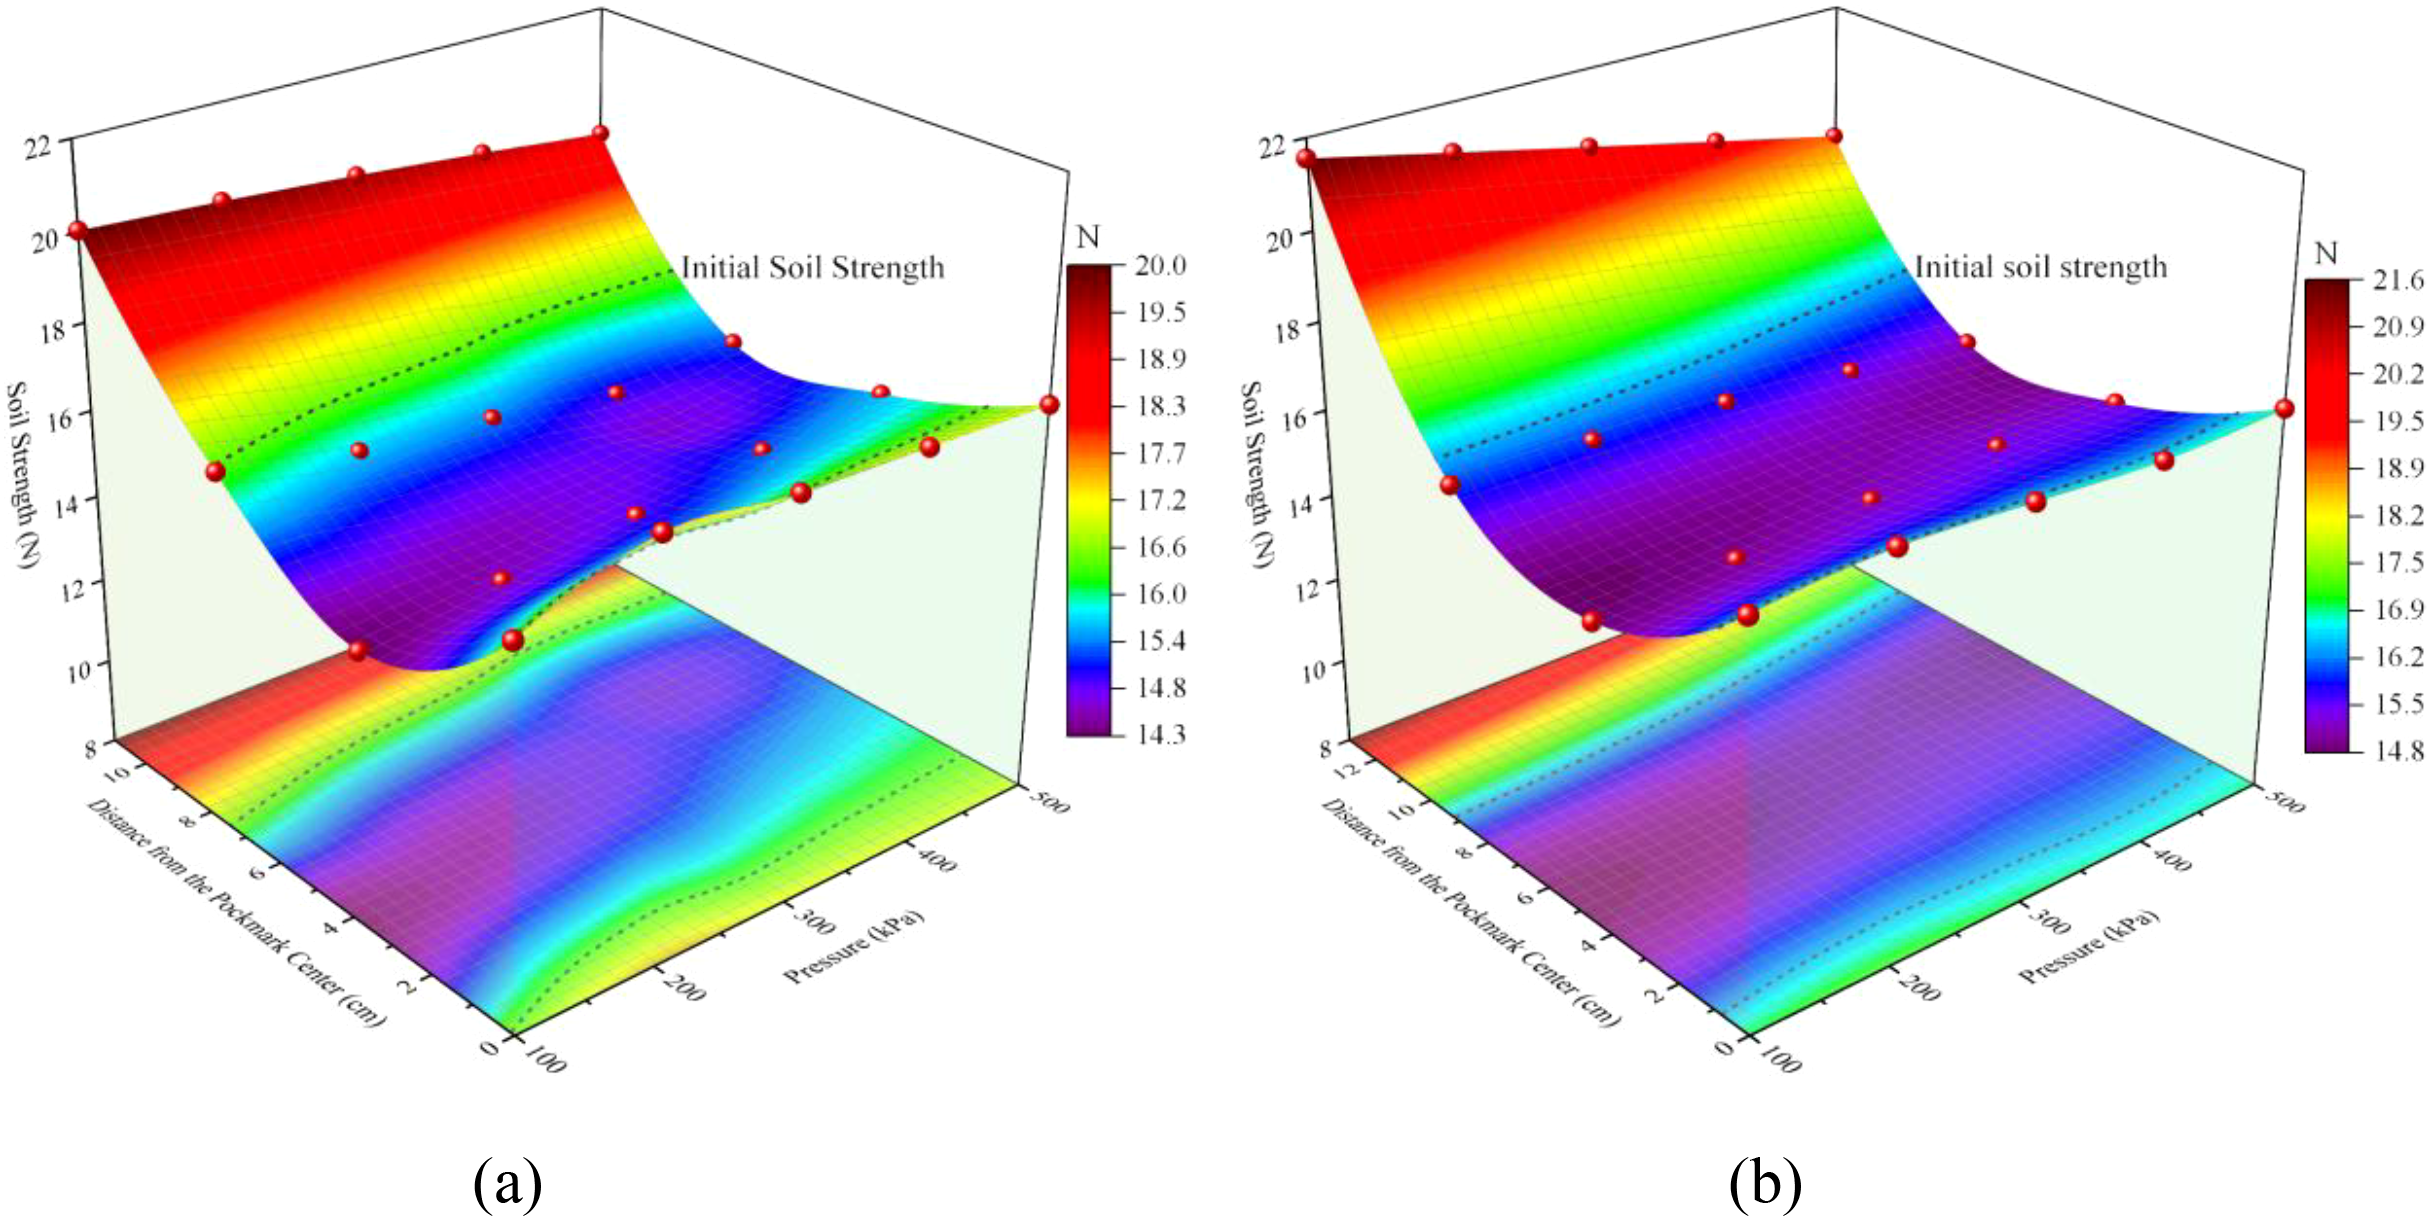
Fitting relationships among distance from pockmark center, pressure, and soil strength: (a) single orifice; (b) two orifices.
Where, ▽P denotes the pressure gradient; β is the inertial resistance coefficient;k represents the permeability
As shown in (Figure 10a), at the same pressure, soil strength first decreased then increased with distance from the pockmark center, consistent with previous regional classifications by disturbance intensity. Increasing pressure homogenized the disturbed area, shifting the position of uniform soil strength backward. Unlike the high concentration of gas in single-orifice release, the strong pressure and plume merging entrainment in double-orifice release distributed sediment displacement more widely. Significantly affected by pressure, the rapid development of plumes and pockmarks in double-orifice release increased soil strength compared to single-orifice release (Figure 10b), reducing sediment settlement heterogeneity and enhancing the symmetry of soil strength distributions under different pressures.
Shallow gas leakage poses significant risks to burrowing organisms, aquatic life, and atmospheric biota. Pockmark formation and changes in soil strength disrupt habitats of soil-dwelling organisms and affect soil oxygen content. Plumes influence aquatic migration behaviors, while fountains and escaped gases directly threaten avian species under specific conditions. Among the chain reactions of shallow gas leakage, pockmark impacts are most readily assessable. Exploiting the soil strength modification by gas leakage, some offshore platforms have enhanced surrounding sediment strength. However, practical applications must balance these benefits against potential ecological impacts.
5 Conclusions
An experimental platform for gas leakage was independently developed to investigate the effects of gas source pressure, burial depth, and number of release orifices on plume morphology and pockmark development. Correlations between sediment strength, pressure, and distance from pockmark centers were discussed, leading to the following conclusions:
-
Gas source pressure and orifice number are dominant factors governing plume parameters and pockmark development, while burial depth exhibits inhibitory effects. Increasing pressure and orifice number no-linearly enhance plume height and diameter, whereas deeper burial reduces these parameters. The plume cone angle is positively correlated with pressure and negatively correlated with burial depth, independent of orifice number. Pockmark depth, diameter, and volume show similar variation trends, with pressure being the primary influencing factor.
-
Spatial heterogeneity exists in sediment strength around pockmarks, with compaction in the center and weakening in the waistline. Strength increases in the pockmark center and external areas due to compaction, while shear failure decreases strength in the waistline and edge regions. Two-orifice release promotes more uniform sediment strength distribution, expanding the disturbance range while reducing heterogeneous settlement.
-
Gas leakage induces plume entrainment, fountain formation, and pockmark development, severely disrupting ecosystems. Pockmarks and sediment compaction directly destroy habitats, while plumes affect biological migration, making them priority indicators for evaluating impacts of gas leakage.
Traditional single-orifice leakage studies provide preliminary local hazard assessments, but real-world marine conditions often involve chain reactions of gas leakage. Notable differences exist between single and two orifice leakages in terms of plume characteristics, pockmark development, and sediment strength. Although this study compared single- and two-orifice scenarios, using CO2 to simulate CH4;-dominated shallow gas may introduce discrepancies in plume dynamics and sediment interactions due to differences in physical properties (e.g., density, solubility). Additionally, the influence of orifice spacing and water flow on plume merging characteristics remains to be investigated, which will be a focus of future research.
Statements
Data availability statement
The original contributions presented in the study are included in the article/supplementary material. Further inquiries can be directed to the corresponding author.
Author contributions
HW: Conceptualization, Funding acquisition, Methodology, Writing – original draft. JJ: Data curation, Formal analysis, Visualization, Writing – review & editing. MA: Data curation, Resources, Writing – review & editing. XL: Supervision, Validation, Writing – review & editing. KW: Methodology, Validation, Writing – review & editing. JL: Conceptualization, Supervision, Writing – review & editing.
Funding
The author(s) declare financial support was received for the research and/or publication of this article. This research is financially supported by the National Natural Science Foundation of China (No. 52404230). The authors deeply appreciate the support.
Conflict of interest
The authors declare that the research was conducted in the absence of any commercial or financial relationships that could be construed as a potential conflict of interest.
Generative AI statement
The author(s) declare that no Generative AI was used in the creation of this manuscript.
Any alternative text (alt text) provided alongside figures in this article has been generated by Frontiers with the support of artificial intelligence and reasonable efforts have been made to ensure accuracy, including review by the authors wherever possible. If you identify any issues, please contact us.
Publisher’s note
All claims expressed in this article are solely those of the authors and do not necessarily represent those of their affiliated organizations, or those of the publisher, the editors and the reviewers. Any product that may be evaluated in this article, or claim that may be made by its manufacturer, is not guaranteed or endorsed by the publisher.
References
1
Ashford O. Guan S. Capone D. Rigney K. Rowley K. Cordes E. et al . (2021). Relationships between biodiversity and ecosystem functioning proxies strengthen when approaching chemosynthetic deep-sea methane seeps. P. R. Soc B-biol. Sci.288. doi: 10.1098/rspb.2021.0950
2
Bejar M. Gibbins C. Vericat D. Batalla R. (2020). Influence of habitat heterogeneity and bed surface complexity on benthic invertebrate diversity in a gravel-bed river. River. Res. Appl.36, 465–479. doi: 10.1002/rra.3554
3
Cai Z. Sui X. Yao Y. Yin Z. Yang X. Ju D. et al . (2024). Preliminary analysis of the indicators and accumulation models of gas hydrates in the central Zhongjiannan Basin, western South China sea. Mar. Petrol. Geol167, 106942. doi: 10.1016/j.marpetgeo.2024.106942
4
Cathles L. Su Z. Chen D. (2010). The physics of gas chimney and pockmark formation, with implications for assessment of seafloor hazards and gas sequestration. Mar. Petrol. Geol27, 82–91. doi: 10.1016/j.marpetgeo.2009.09.010
5
Dando P. Hovland M. (1992). Environmental effects of submarine seeping natural gas. Cont. Shelf. Res.12, 1197–1207. doi: 10.1016/0278-4343(92)90079-Y
6
Dissanayake A. Gros J. Drews H. Nielsen J. Drews A. (2023). Fate of methane from the nord stream pipeline leaks. Environ. Sci. Technol. Lett.10, 903–908. doi: 10.1021/acs.estlett.3c00493
7
Duan P. Luan X. Yu Y. Gu B. Ren Z. Li Q. et al . (2020). Numerical simulation of seismic waves of bubble plumes in submarine cold seepages. Chinese. J. Geophys-ch653, 753–765. doi: 10.6038/cjg2020M0533
8
Geng Z. Li X. Chen G. (2021). Experimental and numerical study on gas release and dispersion from underwater soil. Process. Saf. Environ.149, 211–221. doi: 10.1016/j.psep.2020.09.065
9
Hovland M. Judd A. (1988). “Seabed pockmarks and seepages,” in Impact on geology, biology and the marine environment (Graham & Trotman, London).
10
Jordan S. O’Reilly S. Praeg D. Dove D. Facchin L. Romeo R. et al . (2019). Geophysical and geochemical analysis of shallow gas and an associated pockmark field in Bantry Bay, Co. Cork, Ireland. Estuar. Coast. Shelf. S225, 106232. doi: 10.1016/j.ecss.2019.05.014
11
Khan I. Zakari A. Zhang J. Dagar V. Singh S. (2022). A study of trilemma energy balance, clean energy transitions, and economic expansion in the midst of environmental sustainability: New insights from three trilemma leadership. Energy.248, 123619. doi: 10.1016/j.energy.2022.123619
12
Kunath P. Crutchley G. Chi W. Berndt C. Liu C. Elger J. et al . (2022). Episodic venting of a submarine gas seep on geological time scales: formosa ridge, Northern South China sea. J. Geophys. Res-sol. Ea127, e2022JB024668. doi: 10.1029/2022JB024668
13
Leifer I. Judd A. (2015). The UK22/4b blowout 20 years on: Investigations of continuing methane emissions from sub-seabed to the atmosphere in a North Sea context. Mar. Petrol. Geol68, 706–717. doi: 10.1016/j.marpetgeo.2015.11.012
14
Li X. Han Z. Yang S. Chen G. (2020). Underwater gas release modeling and verification analysis. Process. Saf. Environ.137, 8–14. doi: 10.1016/j.psep.2020.02.011
15
Li X. Wang J. Geng Z. (2023). Modelling underwater dispersion of gas released from seabed soil considering current and wave. Process. Saf. Environ.171, 260–271. doi: 10.1016/j.psep.2023.01.030
16
Mazzini A. Svensen H. Forsberg C. Linge H. Lauritzen S. E. Haflidason H. et al . (2017). A climatic trigger for the giant Troll pockmark field in the northern North Sea. Earth. Planet. Sc. Lett.464, 24–34. doi: 10.1016/j.epsl.2017.02.014
17
Pape T. Ruffine L. Hong W. Sultan N. Riboulot V. Peters C. et al . (2020). Gas Hydrate Accumulations at a Nigerian Deepwater Pockmark-Quantities and Dynamics. J. Geophys. Res-sol. Ea125, e2019JB018283. doi: 10.1029/2019JB018283
18
Pu L. Shao X. Zhang S. Lei G. Li Y. (2019). Plume dispersion behaviour and hazard identification for large quantities of liquid hydrogen leakage. Asia-Pac. J. Chem. Eng.14, e2324. doi: 10.1002/apj.2299
19
Ren X. Ding D. Qin H. Ma L. Li G. (2022). Extraction of submarine gas plume based on multibeam water column point cloud model. Remote Sens.14, 4387. doi: 10.3390/rs14174387
20
Ruppel C. Kessler J. (2017). The interaction of climate change and methane hydrates. Rev. Geophys55, 126–168. doi: 10.1002/2016rg000534
21
Singhroha S. Schramm B. Plaza-Faverola A. Domel P. Dannowski A. Cooke F. et al . (2023). Stress constraints from shear-wave analysis in shallow sediments at an actively seeping pockmark on the W-svalbard margin. Earth. Space. Sci.10, e2023EA003068. doi: 10.1029/2023EA003068
22
Su P. Lin L. Lv Y. Liang J. Sun Y. Zhang W. et al . (2022). Potential and distribution of natural gas hydrate resources in the South China sea. J. Mar. Sci. Eng.10, 1364. doi: 10.3390/jmse10101364
23
Sun Y. Cao X. Liang F. Bian J. (2020). Investigation on underwater gas leakage and dispersion behaviors based on coupled Eulerian-Lagrangian CFD model. Process. Saf. Environ.136, 268–279. doi: 10.1016/j.psep.2020.01.034
24
Sun H. Chen Z. Lai X. (2019). Influence of shallow gas on the geotechnical properties of pockmark soil: A case study in the East China Sea. Appl. Ocean Res.93, 6–21. doi: 10.1016/j.apor.2019.101966
25
Vaknin I. Aharonov E. Holtzman R. Katz O. (2024). Gas seepage and pockmark formation from subsurface reservoirs: insights from table-top experiments. J. Geophys. Res-Sol. Ea129, e2023JB028255. doi: 10.1029/2023JB028255
26
Vielstaedte L. Haeckel M. Karstens J. Linke P. Schmidt M. Steinle L. et al . (2017). Shallow gas migration along hydrocarbon wells-an unconsidered, anthropogenic source of biogenic methane in the North sea. Environ. Sci. Technol.51, 10262–10268. doi: 10.1021/acs.est.7b02732
27
Wallace B. Brosnan T. Mclamb D. (2017). Effects of the Deepwater Horizon oil spill on protected marine species. Endanger. Species. Res.33, 1–7. doi: 10.3354/esr00789
28
Wang H. Jia Y. Liu X. Liu J. Wang K. Jiang J. et al . (2024). Study on the fountain effect of the bubble plume formed by submarine gas pipeline leakage. Front. Mar. Sci.11. doi: 10.3389/fmars.2024.1402784
29
Wang H. Jiang J. Liu X. Wang K. Jia H. (2025). Research on the flow field structural characteristics of OFPV floating body. Ocean Eng.319, 120274. doi: 10.1016/j.oceaneng.2024.120274
30
Wang Q. Lü Y. Li Q. (2022). A review on submarine oil and gas leakage in near field: droplets and plume. Environ. Sci. pollut. Res. Int.29, 17231–17246. doi: 10.1007/S11356-021-17586-0
31
Wu Z. Zhao D. Zhou J. Liu Z. Wang M. Shang J. H. (2023). Formation mechanism of deep-sea giant pockmarks: A case study of the Reed Basin in the South China Sea. Geomorphology433, 108726. doi: 10.1016/j.geomorph.2023.108726
32
Yu K. Lefebvre A. Li W. Zhan W. Miramontes E. (2023). Channel inception through bottom-current erosion of pockmarks revealed by numerical simulation. Earth. Surf. Proc. Land48, 2246–2259. doi: 10.1002/esp.5610
33
Zhang S. Hu X. Wang J. Zhou P. Ren X. (2024). Optimal design of adaptive EWMA monitoring schemes for the coefficient of variation and performance evaluation with measurement errors. Comput. Ind. Eng.191, 110107. doi: 10.1016/j.cie.2024.110107
34
Zhang G. Wang X. Li L. Sun L. Guo Y. Lu Y. et al . (2022). Gas hydrate accumulation related to pockmarks and faults in the Zhongjiannan Basin, South China sea. Front. Earth. Sc-Switz10. doi: 10.3389/feart.2022.902469
35
Zhang Y. Zhai W. (2015). Shallow-ocean methane leakage and degassing to the atmosphere: triggered by offshore oil-gas and methane hydrate explorations. Front. Mar. Sci.2. doi: 10.3389/fmars.2015.00034
Summary
Keywords
shallow gas, plume morphology, pockmark, soil strength, plume entrainment
Citation
Wang H, Jiang J, Ali M, Liu X, Wang K and Liu J (2025) Multi-parameter coupling effects on plume morphology and pockmark development induced by submarine shallow gas leakage. Front. Mar. Sci. 12:1645893. doi: 10.3389/fmars.2025.1645893
Received
13 June 2025
Accepted
13 August 2025
Published
28 August 2025
Volume
12 - 2025
Edited by
Davide Gamboa, University of Aveiro, Portugal
Reviewed by
Hugh Daigle, The University of Texas at Austin, United States
Guo Xingjie, Shanghai Institute of Geological Survey, China
Updates
Copyright
© 2025 Wang, Jiang, Ali, Liu, Wang and Liu.
This is an open-access article distributed under the terms of the Creative Commons Attribution License (CC BY). The use, distribution or reproduction in other forums is permitted, provided the original author(s) and the copyright owner(s) are credited and that the original publication in this journal is cited, in accordance with accepted academic practice. No use, distribution or reproduction is permitted which does not comply with these terms.
*Correspondence: Xiaolei Liu, 202330410066@stu.shmtu.edu.cn
Disclaimer
All claims expressed in this article are solely those of the authors and do not necessarily represent those of their affiliated organizations, or those of the publisher, the editors and the reviewers. Any product that may be evaluated in this article or claim that may be made by its manufacturer is not guaranteed or endorsed by the publisher.