Abstract
Introduction:
Human activities and their effects on ecosystems are threatening biodiversity and causing a decline in species, population, and genetic diversity. Environmental DNA (eDNA) metabarcoding represents a powerful instrument to assess marine biodiversity, enabling an efficient, cost-effective, and non-invasive approach. eDNA metabarcoding technology has significantly progressed in recent years and has been widely employed to assess marine fish populations.
Methods:
This study assessed its potential, detection sensitivity, and effectiveness for an initial evaluation of fish biodiversity in the Black Sea. The efficacy of eDNA was evaluated by contrasting metabarcoding results with trawling data obtained from two sampling campaigns (summer and autumn 2022) across 16 selected locations along the Bulgarian Black Sea coast. Mitochondrial genes 12S and 16S were utilized as standard markers for metabarcoding given their high specificity and sensitivity in amplifying fish DNA, and the availability of large reference databases. A multi-model analytical approach utilizing Bayesian regression and Generalized Additive Models (GAMs) was implemented to assess the relationships between environmental DNA (eDNA) 12S metabarcoding data and abundance indices obtained from catch-per-unit-effort (CPUE). The method addresses significant challenges in predicting abundance from eDNA, including scarce, noisy datasets, excessive zeros, and nonlinear predictor-response relationships. Both frameworks reliably detected biologically meaningful associations between eDNA signal strength, environmental gradients, and trawl-derived abundance.
Results:
Metabarcoding, employing the 12S mitochondrial gene with MiFish-U primers, exhibited superior sensitivity in identifying a broader array of fish species, highlighting its efficacy in detecting eDNA traces of rare and migratory species. During the autumn survey, environmental DNA (eDNA) analysis identified 23 fish species, compared to 15 species recorded through trawl sampling. In the summer expedition, 12 species were detected using molecular methods, while trawl surveys recorded 9 species. The Bayesian framework provided robust uncertainty quantification and reliable inference with few samples, whereas the GAM framework effectively captured nonlinear environmental and spatial effects. The results indicate that eDNA data can replicate patterns observed in conventional trawl surveys. This supports the assumption that eDNA data may serve as a low-impact, scalable method for monitoring fish populations. Model uncertainty informs the need for more sampling or a redesign of covariates to improve the accuracy of eDNA-based abundance predictions.
Discussion:
Our findings demonstrate that the eDNA 12S primer combination exhibited superior taxonomic diversity compared to trawling, while necessitating reduced sampling effort. Furthermore, the eDNA-based approach can identify species across diverse life stages and sizes, unlike traditional trawling, which predominantly captures adult specimens within particular size categories. Although eDNA metabarcoding has limits in providing estimates for absolute biomass and size distributions, it provides significant insights on the presence of numerous fish species within the studied ecosystem. The consistency of results from multiple statistical frameworks supports the validity of eDNA counts as an abundance measure, provided that analytical models effectively account for dispersion and environmental variability. The Bayesian regression approach enabled thorough uncertainty quantification and dependable parameter inference with constrained sample sizes, whereas Generalized Additive Models (GAMs) provided an advanced representation of potentially nonlinear relationships among environmental DNA, environmental variables, and abundance.
Introduction
Marine biodiversity is rapidly declining as a result of human activities, including climate change, overfishing, the introduction of invasive species, and pollution. These factors expose a significant portion of marine life at risk of extinction (Brito-Morales et al., 2020; Yang et al., 2024). The Black Sea, a unique and highly vulnerable marine environment, is strongly affected by these challenges (Erdogan et al., 2009; Oguz, 2017). In recent years, selective commercial overfishing, amplified by illegal fishing practices and the use of non-selective fishing gears, has led to a rapid decline in the populations of economically important fish species, surpassing their regenerative capacity and resulting in a dramatic reduction in their overall abundance (Dai et al., 2022; Radulescu, 2023). This tendency represents significant threats to regional biodiversity economic stability, and human well-being. Hence, assessments of the marine living resources are essential for sustainable fisheries and ecosystem-based management (Trenkel et al., 2019).
The assessment of marine fish populations has traditionally depended on landings and catches, or on utilizing highly selective and invasive techniques that target commercially important species in specific geographic areas with favorable conditions. Consequently, it is essential to reevaluate current fisheries research methodologies and integrate complementary, minimally invasive techniques alongside traditional trawl surveys. This integrative strategy would reduce ecological consequences from sampling while improving spatial resolution for monitoring fish migration patterns and developmental stages and broaden community-level observation (Hammerl et al., 2024; Westgaard et al., 2024). Furthermore, the risk of species misidentification is significantly magnifying these challenges (Thomsen et al., 2012). Traditional species identification techniques are becoming increasingly limited due to dependence on the shrinking pool of skilled taxonomists having specialized phenotaxonomic knowledge (Hopkins and Freckleton, 2002). This highlights the pressing necessity for more precise, efficient, and cost-effective fish survey methodologies such as environmental DNA (eDNA) that will address current gaps in biodiversity assessment and improve fisheries management effectiveness.
Environmental DNA (eDNA) metabarcoding has emerged as a powerful tool for assessing marine biodiversity, allowing for the identification of many taxa within a single sample (Rourke et al., 2022; Tsuji et al., 2023; Haderlé et al., 2024). The data collected through eDNA metabarcoding contain complex and comprehensive biodiversity information. This method has the potential to become a cutting-edge instrument for biodiversity study and aquatic ecosystem conservation (Sahu et al., 2023). Recent advancements in eDNA technology have led to its increasing application for monitoring marine fish populations (Miya et al., 2015; Zhang et al., 2020; Afzali et al., 2021; Stoeckle et al., 2021; Valsecchi et al., 2021; Dai et al., 2022; Maiello et al., 2022; Zhang et al., 2022; Capurso et al., 2023; Cote et al., 2023; He et al., 2023; Osathanunkul and Suwannapoom, 2023; Veron et al., 2023; Westgaard et al., 2024), Despite its growing application globally, eDNA metabarcoding remains underutilized for assessing fish diversity and community structure in the Black Sea.
The application of eDNA to assess abundance in aquatic ecosystems is presently most advanced in freshwater and controlled environments (Rourke et al., 2022). Nonetheless, the complex interplay of external biological, physical, and environmental factors makes direct quantitative assessments in marine ecosystems highly challenging (Iversen et al., 2015; Hansen et al., 2018; Gilbey et al., 2021).
Using environmental DNA (eDNA) to quantitatively assess fish abundance in marine environments presents several dificulties. Key issues include establishing a robust relationship between eDNA concentrations and actual fish abundance, mitigating false positives and false negatives, elucidating the processes of eDNA degradation and dispersal in marine systems, and quantifying uncertainty in abundance estimates. Furthermore, the development of comprehensive DNA reference databases and the adoption of standardized protocols remain essential (Baetscher et al., 2025; Nneji et al., 2025). Despite this, significant evidence supports the use of eDNA as a supplementary tool for assessing fish population abundance and/or biomass across various spatio-temporal scales, dependent on preliminary studies to identify species- and context-specific factors influencing the eDNA abundance/biomass relationship (Salter et al., 2019; Rourke et al., 2022; Baetscher et al., 2025).
Clarifying the efficacy of a quantitative eDNA methodology and understanding its potential as a complementary instrument in traditional stock assessments would signify substantial progress in developing a cost-effective strategy for monitoring regional fisheries of both local and migratory species (Gilbey et al., 2021; Rourke et al., 2022). Further investigation is necessary to improve this prospective method as a viable tool for monitoring catch composition, assessing stock spatial distribution, and systematically recording changes in fish ecosystems across marine ecosystems (Rourke et al., 2022; Maiello et al., 2024).
The present study aims to advance the ongoing discourse on the application of eDNA methodologies in the Black Sea, with a particular focus on evaluating their effectiveness in:
-
improving fish biodiversity monitoring;
-
detecting and quantifying species presence;
-
providing robust scientific data to inform the conservation and sustainable management of marine fishery resources;
-
evaluating the feasibility of integrating eDNA monitoring into existing fisheries management frameworks in the Black Sea;
-
assessing the potential of eDNA metabarcoding counts to serve as a viable alternative to conventional trawl surveys;
-
support decision-making by engaging relevant stakeholders (e.g., policymakers, conservationists, and fisheries managers) in the adoption of eDNA as a complementary or alternative monitoring tool.
Materials and methods
Study area
The study was conducted in the western Black Sea, within Bulgarian coastal and shelf waters between Cape Shabla (north) and Tsarevo (south). This region is ecologically and socio-economically important, influenced by seasonal hydrographic variability (summer stratification, autumn mixing) that shapes fish community composition. It supports diverse pelagic and demersal assemblages, and several locally rare or threatened species. The area also overlaps with national fisheries management zones and monitoring frameworks (Figure 1).
Figure 1
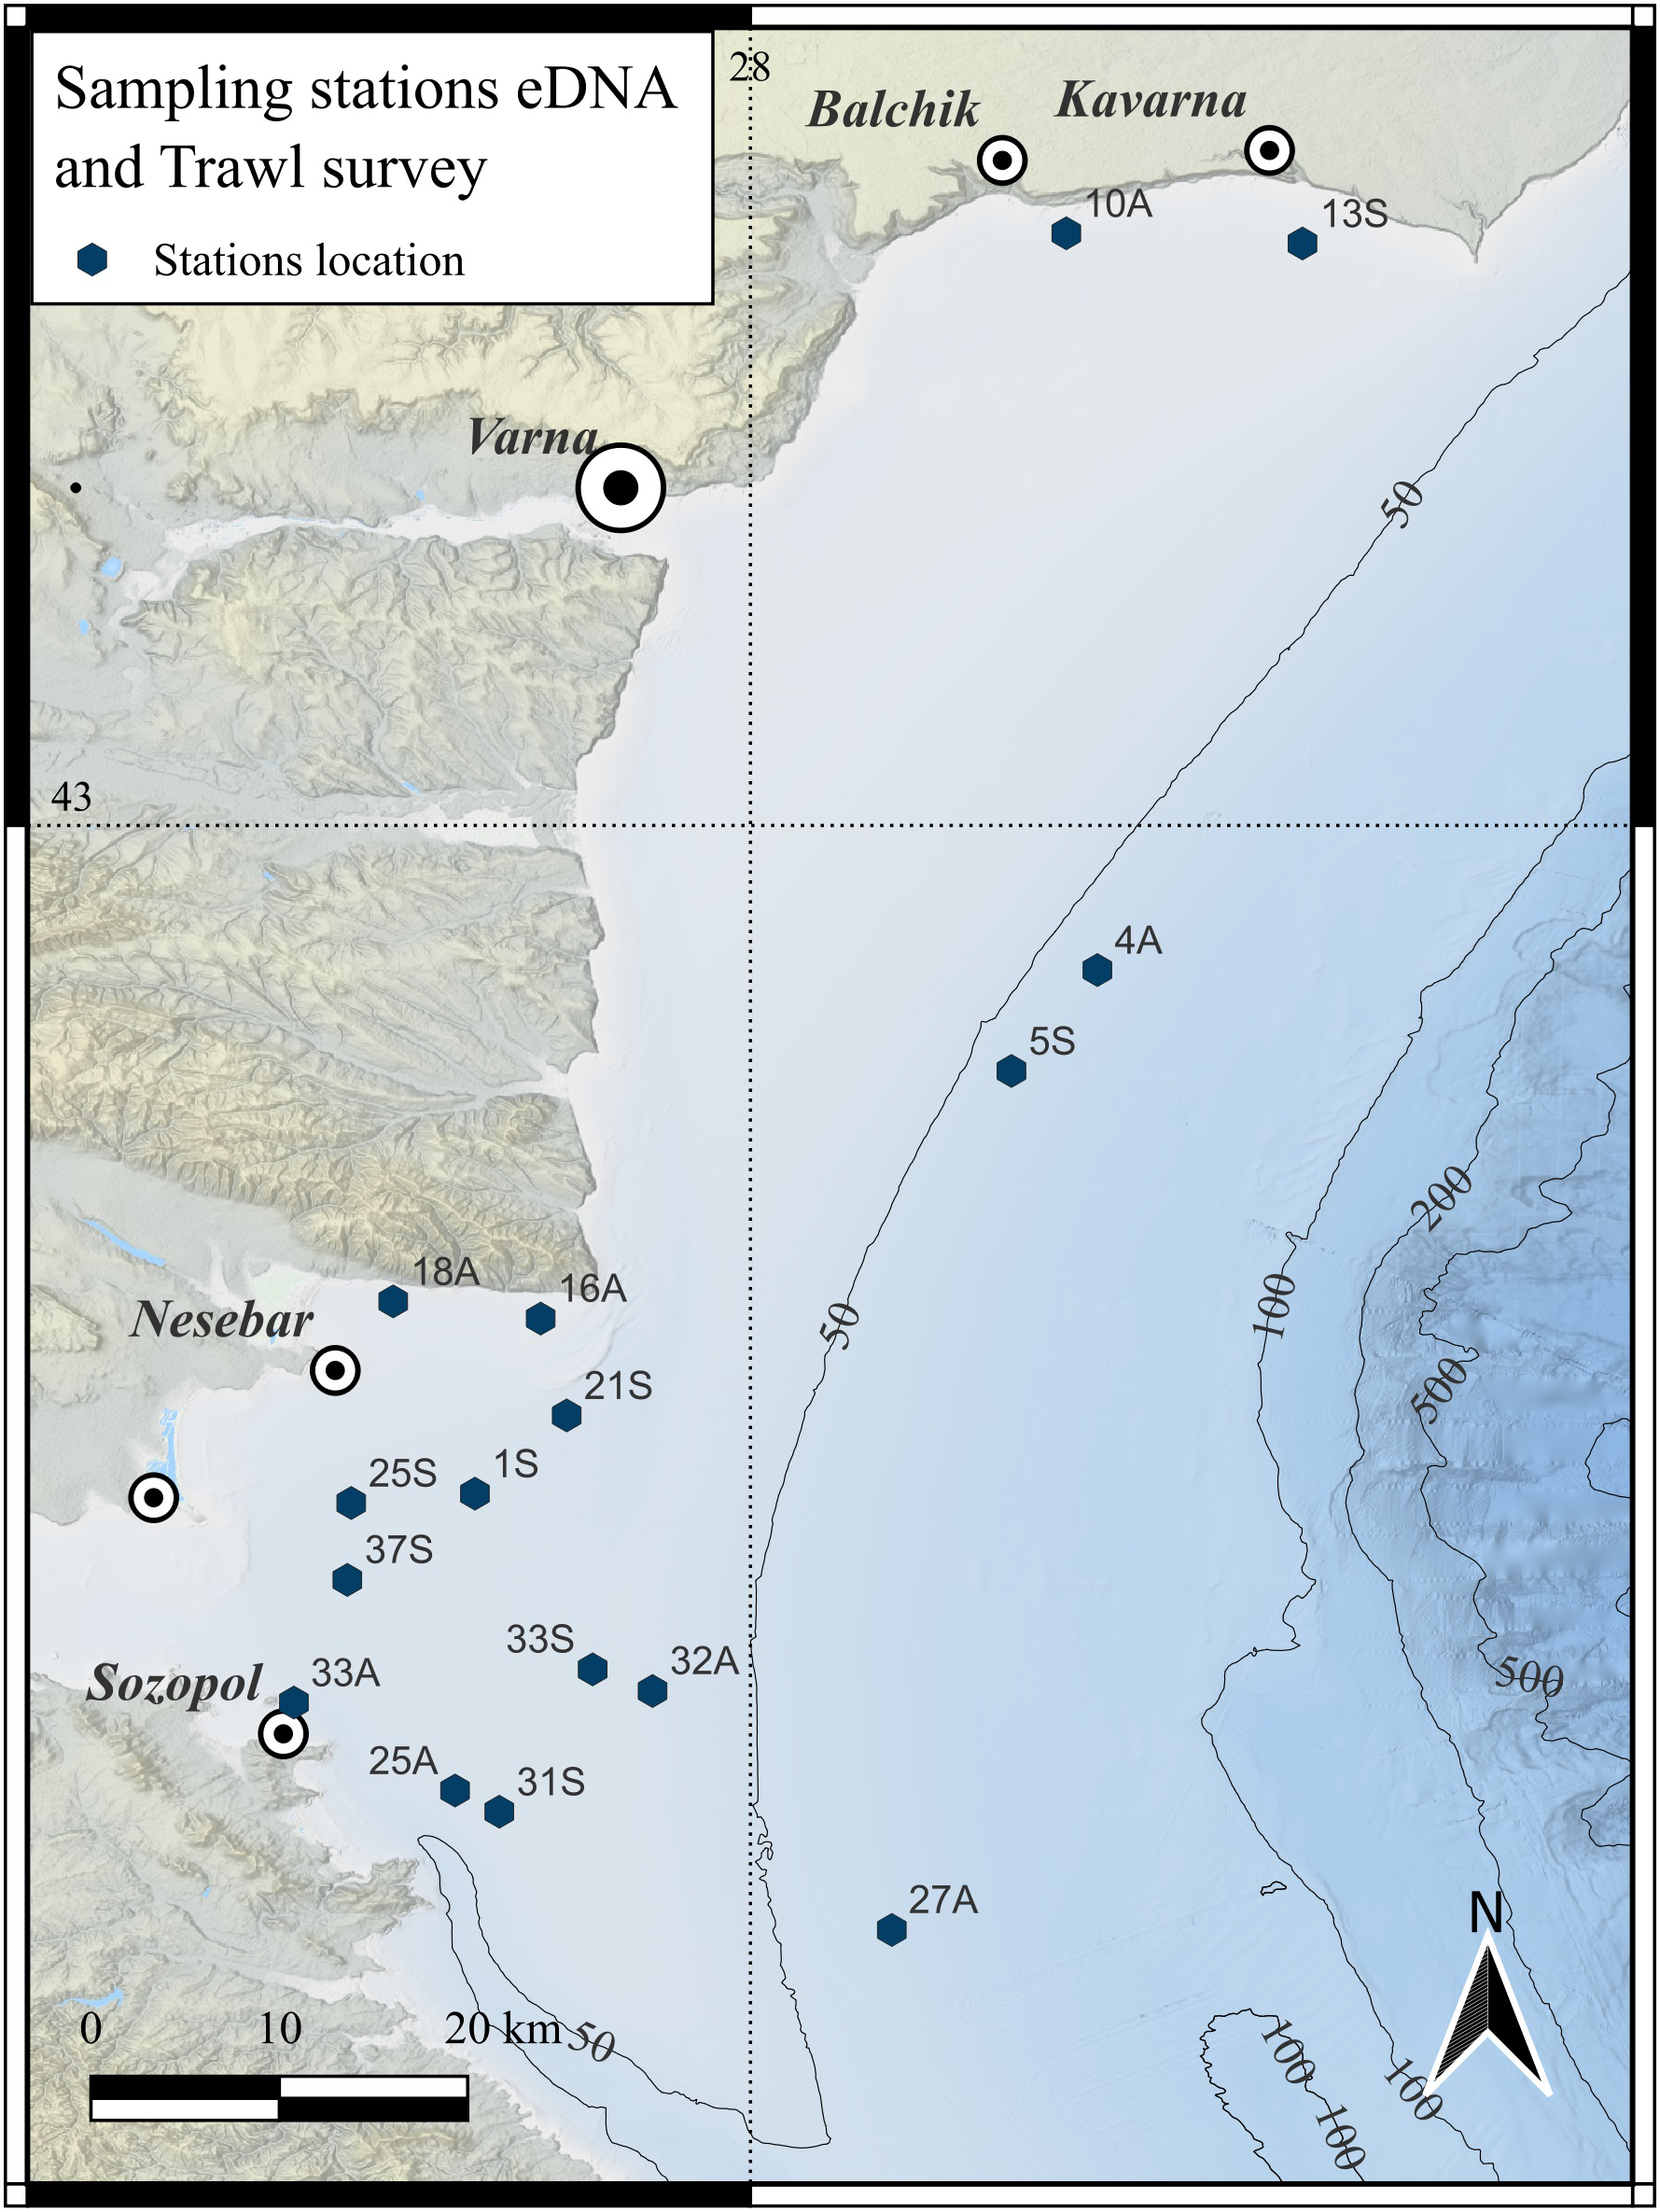
Map of sampling stations along the Bulgarian Black Sea coastline. The stations indicate the sites for eDNA sample that align with the endpoints of the corresponding trawling.
Trawl surveys
The trawl surveys were conducted under the National Fisheries Data Collection Program, which aims towards assessing the biomass of various species, including sprat, whiting, red mullet, and horse mackerel, with some species obtained as bycatch (Raykov et al., 2020). Sixteen randomly selected sites were surveyed to collect fisheries data, biological samples, and eDNA, with sampling carried out in July 2022 (summer) and November 2022 (autumn) as part of the National Data Collection Program (project № BG14MFOP001-3.003-0002-C02) (Figure 1; Supplementary Table S1).
A small-mesh bottom otter trawl designed for coastal and shelf surveys featured a four-panel body and a single codend of diamond mesh (63 mm stretched – bar ≈ 31.3 mm), and selection factor (SF) of approximately 3, targeting a was used during the surveys. This configuration ensured high retention for multi-species assemblages, while maintaining consistent selectivity baseline across species. Each tow lasted 30 to 40 minutes, with an average trawling speed of 2.7 knots, conducted solely during daylight hours according to the standard protocol, when target species were abundant in the deeper strata reaching the thermocline zone.
Each tow was treated as independent haul. The total catch was categorized to species through morphological identification, catch weight (kg)/numbers were recorded, length frequencies were processed to the nearest 0.5 cm (total length), and biological data (sex, maturity) were collected in laboratory conditions following standard protocols. The length-frequency data (LFD) obtained during the surveys were used to compute the implied retention thresholds for the four key commercial species (Table 1). Given the higher retention rate of the fishing gear the immature fractions as a percentage were computed based on the species-specifc logistic maturity ogives, parameterized by the species-specific (the length at wich 50% of the population has reached sexual maturity). For each length class, the immature proportion ( represents the proportion of mature individuals) was applied to adjust the expected catch-at-length resulting in a catch-weighted immature fraction. To produce mature-only indices, we calculated the catch-per-unit-effort CPUE based on the standardized biomass (kg) and abundance (the latter derived from biomass using mean weight-at-length values for Black Sea fish species where available; Supplementary Table S2), and subsequently multiplied each by the maturity proportion . The present study utilized abundance derived from maturity-adjusted CPUE.
Table 1
| Species | (cm) | (cm) | (cm) | Size classes range presented in the LFD (cm) |
|---|---|---|---|---|
| T. mediterraneus | 8.1 | 9.4 | 10.8 | 7.0 -17.5 |
| M. merlangus | 8.0 | 9.4 | 10.8 | 10.0-17.5 |
| M. barbatus | 8.2 | 9.4 | 10.6 | 7.5 - 16 |
| S. sprattus | 8.7 | 9.4 | 10.1 | 6.5 - 11.5 |
Estimation of retention lengths for key commercial species using single trawl codend diamond mesh, size 63mm stretched, targeting and .
Environmental covariates (temperature, salinity and pH) were logged at haul start and end.
Ethical approval was not required for this study, as no experimental animals were used.
eDNA sampling
Seawater was collected at each sampling station from three distinct depths within the water column: surface/near-surface (0–5 m), mid-depth (10–20 m), and deeper layers (30–50 m), using 5 L Limnos water samplers (KC Denmark A/S), with the exception of station 13S, where only two depth layers were sampled due shallow water depth. Environmental parameters (temperature, salinity and pH) were logged at each depth for all stations using internal thermometer of the water sampler, a digital refractometer (MA886, Milwaukee Electronics Kft), and a pH meter (HI83141, Hanna Instruments Ltd). To avoid contamination, the sampling device was thoroughly washed before each use. Two liters of seawater from each sampling depth were filtered using a 0.22 μm Millipore Sterivex filter with a peristaltic pump, labeled, and initially stored at −20°C onboard the research vessel, then transferred to −80°C in the laboratory until DNA extraction.
eDNA metabarcoding analyses
Genomic DNA was extracted from a total of 47 seawater samples (Sterivex Filter Units) using MO BIO PowerSoil® DNA Isolation Kit (QIAGEN). DNA concentration was quantified with a Qubit 2.0 Fluorometer (Thermo Fisher Scientific). A set of 12S (MiFish-U) and 16S primers targeting fish eDNA was used for PCR amplification (Berry et al., 2019; Stoeckle et al., 2021). The preparation of paired-end libraries and high-throughput sequencing on the Illumina Miseq 300 PE platform (Illumina, San Diego, CA, USA) were performed by Macrogen Inc. (Seoul, South Korea).
Raw demultiplexed sequencing reads were quality-checked using FASTQC v0.12.1 (Andrews, 2010), and primers were removed with Cutadapt v4.0 (Martin, 2011). Sequence processing was carried out with DADA2 pipeline v1.32.0 (Callahan et al., 2016), including quality trimming, error rate modeling, merging of paired-end reads, chimera removal, and generation of Amplicon Sequence Variants (ASVs). In the filterAndTrim step, reads were truncated at 160 nucleotides (12S), and 200 nucleotides (16S). Sequences with exepected error rate (EE) higher than 2, or containing ambiguous bases were removed. For error rate modeling the default parameters were used with standard pooled processing for sample inference. Paired-end reads with fewer than 12 nucleotide overlaps were removed, with no mismatches allowed in the overlap region. Taxonomic assignment was performed with the BLAST + tool blastn: v2.16.0, using a Top Hit approach against custom-made 12S and 16S reference databases. These custom databases consist of complete or partial sequences obtained from the NCBI nucleotide database (https://www.ncbi.nlm.nih.gov), comprising 637 sequences (12S) and 769 sequences (16S), representing 117 and 121 fish species, respectively, known to occur in the Black Sea (Yankova et al., 2014).
Statistical analyses
Biodiversity indices, including species richness, Pielou evenness, Shannon index, Simpsons’ and its inverse and unbiased forms (Margalef, 1958; Moreno and Halffter, 2000; Spellerberg and Fedor, 2003; Colwell, 2009; Bowman and Hacker, 2020), were calculated to quanitify diversity patterns. Species accumulation curves were generated to illustrate the relationship between sampling effort and cumulative species detection (Moreno and Halffter, 2000; Bowman and Hacker, 2020).
To ascertain statistically significant correlations between eDNA sequence counts and trawl data, Spearman rank correlation (Simpson, 1949; Lehman, 2005) was applied. Additionally, Moran’s I was calculated to assess spatial autocorrelation prior to data modeling; nevertheless, no significant values were identified, hence incorporation of spatial lag was not considered feasible.
Community-environment relationships were analyzed using Redundancy Analysis (RDA) (Legendre and Gallagher, 2001; Borcard et al., 2011). A representative model for examining community dynamics in relation to seasonal trends was:
where: is the Hellinger-transformed scaled abundance or sequence counts of species at site ; represents the Season as categorical predictor throughout the sampling period and indicates the residual error. Equivalent model formulations were employed for the examination of all continuous (including salinity, temperature, and pH) and categorical (sampling depth and season) environmental variables.
A Hierarchical Bayesian Logistic regression model was implemented using Stan, incorporating site and species-level random effects to account for uncertainty in species and site variation, along with environmental covariates, to evaluate the detection sensitivity of the sampling methods (eDNA and trawl survey) and the species-specific detection sensitivity for each method. The model can be expressed as follows:
where: is the probability of detection of species by sampling method (eDNA12S, eDNA 16s or Trawl survey), assuming that the probability of observing species detection by is a binary outcome with Bernoulli distribution: ; is the intercept; are fixed effects which capture the differences in the probability of detection of species across different methods and covariates; and represents random effect which accounts for species- and site-specific variability in detection.
Model performance was evaluated by partitioning the dataset into training (80%) and testing (20%) subsets. Prediction accuracy was assessed using Brier score (Brier, 1950; Stone, 1974; Yeung et al., 2005), overall model accuracy, the area under the ROC curve (AUC) (Fielding and Bell, 1997; Junge and Dettori, 2018), and true skill statistics (TSS) (Allouche et al., 2006), which are the most commonly used metrics for assessing classification model performance. The Brier score is a metric that evaluates the precision of probabilistic forecasts, ranging from 0 to 1, where 0 signifies perfect predictive accuracy and 1 denotes complete inaccuracy (Brier, 1950). AUC is a threshold-independent statistic that indicates a model’s ability to differentiate between positive and negative occurrences, whereas TSS is a threshold-dependent and prevalence-independent metric, providing it particularly useful for evaluating classifier performance in imbalanced datasets. The latter were computed with the subsequent formulas:
where: denotes the total number of observations, represents the predicted probability for observation and is the actual classification outcome (1 – detected; 0 – not detected);
where: is the true positive rate (sensitivity), which represents the proportion of positive instances that were correctly classified by the model and is the false positive rate, which is the proportion of positive instances that were incorrectly classified by the model. The ROC curve plots against across various probability thresholds ;
where: and are respectively the true positive and the true negative predictions/classifications, whereas and represent the false positive and false negative predictions/classifications;
where: is the true positive rate (sensitivity) and is the false positive rate.
Four commonly detected species in both eDNA and trawl survey expeditions (M. merlangus, M. barbatus, S. sprattus and S. maximus) were chosen as a test case to model the relationship between the maturity-adjusted CPUE-derived abundance and the eDNA 12s counts along with environmental covariates.
Given the limited size of the empirical data (only 16 observations per species (Supplementary Table S3), which is incufficient for robust modeling using hierarchical or multivariate approaches, intended for methodological testing, sensitivity analyses and comparability across various model families, a synthetic dataset () was generated. The synthetic data was construced using the actual raw eDNA 12s sequence counts and CPUE-derived species abundance within a simulation framework, specifficaly designed to maintain the marginal distributions of each variable trough empirical or parametric models, while preserving the dependence structure among the variables and between species. The framework addressed the overdispersion and zero-inflation of eDNA data resulting from known causes, including stochasticity, insufficient sampling, and detection thresholds (Deiner et al., 2017; Peixoto et al., 2023). Consequently, eDNA observations were analyzed using a Zero-Inflated Negative Binomial (ZINB) distribution (Warton, 2005; Hilbe, 2011), which accounts for both detection failure and variability in biological counts. Species abundances were modeled conditionally on simulated eDNA sequence counts and environmental covariates using Generalized Additive Models (GAMs) (Wood, 2017), to capture nonlinear ecological responses. This hybrid ZINB-GAM model was intended to resemble the hierarchical relationship among eDNA generation, persistence, and organismal abundance as outlined in empirical case studies (Deiner et al., 2017; Yates et al., 2019; Harrison et al., 2019).
Environmental variables which have been reported to influence eDNA persistence and fish dispersal, such as temperature, pH, salinity, and site locations, were included in the analysis (Barnes and Turner, 2016; Goldberg et al., 2016; Harrison et al., 2019). Each covariate was treated as a continuous random variable, with empirical marginal distributions derived from observed data and subsequently resampled using quantile functions. The latter maintains the natural variability and environmental covariate ranges commonly observed in aquatic ecosystems. A Gaussian copula was employed to model the combined dependency between species’ eDNA and environmental variables, providing an adaptive multivariate framework that separates marginal distributions from their dependence structure (Nelsen, 2006). This is especially significant in ecology, where interactions among species as well as between species and their environment are nonlinear and non-Gaussian (Clark et al., 2017; Krupskii and Joe, 2013).
The result was a synthetic dataset including 100 observations, ensuring that all simulated variables maintain realistic interrelationships and conform to the actual covariance structure of the original sample data (Supplementary Figures S1-S3).
Various modeling methodologies were employed to determine their effectiveness in modeling CPUE-derived fish species abundance through eDNA 12S counts, alongside environmental covariates. These included Generalized Additive Models (GAM), Bayesian Generalized Linear/Aditive models (GLM/GAM), Bayesian hierarchical regression models, and ensemble machine learning (ML) models, the latter of which notably failed to achieve cross-validation due to insufficient data. The model selection inference focused on two robust multi-model approaches: a Generalized Additive Models (GAMs) Multi-model framework utilizing bootstrap blocks as a reliable alternative to cross-validation methods like Leave-One-Out Cross-Validation (LOOCV) due to the limited sample size, and Bayesian Regression Multi-model framework employing species-specific configurations.
Generalized additive models multi-model framework for best model selection
A sampling size adaptive modeling approach, adequate for small and moderate datasets ( and ) was adopted, featuring 11 Generalized Additive Models (GAMs) with penalized regression splines, recognized for their ecological validity in analyzing overdispersed and continuous zero-rich data, such as abundance counts (Table 2). The latter was utilized to predict maturity-adjusted CPUE abundance for the test case species, integrating predictors including eDNA 12S sequence counts, environmental covariates (temperature, salinity, and pH), and spatial structure (geographic coordinates of the sampling sites), while applying a variety of response distributions. The framework was intended to facilitate the comparison of results and the selection of the most suitable model - “Best model”, given the expectation that the species may display diverse statistical distributions, including skewness, zero-inflation, over- and aunderdispersion, and nonlinear relationships with the response variable.
Table 2
| Model | Distribution family | Link function | References |
|---|---|---|---|
| Negative Binomial Generalized Additive Model | Negative Binomial | Log | Hilbe (2011); Wood (2017) |
| Negative Binomial GAM with Tensor Interaction Term | Negative Binomial | Log | Wood (2017) |
| Reduced Negative Binomial GAM (reduced predictors set) | Negative Binomial | Log | Wood (2017) |
| Tweedie Generalized Additive Model | Tweedie (Compound Poisson–Gamma) | Log | Dunn and Smyth (2005); Shono (2008) |
| Gaussian GAM | Normal (Gaussian) | Log | McCullagh (1989) |
| Gaussian GAM | Normal (Gaussian) | Identity | McCullagh (1989) |
| Gaussian GAM | Normal (Gaussian) | Inverse | McCullagh (1989) |
| Two-Part Hurdle Model: Binomial GAM + Negative Binomial GAM | Binomial + Negative Binomial | Logit + Log | Mullahy (1986); Zuur et al. (2009) |
| Two-Part Hurdle Model: Binomial GAM + Tweedie GAM | Binomial + Tweedie | Logit + Log | Mullahy (1986); Dunn and Smyth (2005) |
| Zero-Inflated Poisson Location–Scale–Shape GAM | Zero-Inflated Poisson | Log (μ), Logit (π) | Lambert (1992); Rigby and Stasinopoulos (2005) |
| Tweedie Location–Scale–Shape GAM | Tweedie | Log (μ), Log (σ) | Rigby and Stasinopoulos (2005); Stasinopoulos et al. (2017) |
| Gaussian Location–Scale–Shape GAM | Gaussian (Normal) | Log (μ), Log (σ) | Rigby and Stasinopoulos (2005); Wood (2017) |
| Assumptions and data pre-processing – valid for all models | All predictors z-scored for comparability. | ||
Generalized additive models (GAMs) multi-model framework - summary.
Bayesian regression multi-model framework for best model selection
Furthermore, a Bayesian regression multi-model framework was employed, beginning with a simple hierarchical pipeline that included only eDNA sequence counts as predictors, focusing on a small dataset, and then expanding to include temperature in an attempt to conform with ecological plausibility. The latter evolved to the final version which is well suited to working with both small and moderate datasets, and provides distinct per-species models, allowing for species-specific flexibility and model comparison. A similar model selection approach to the GAM framework was adopted, featuring four possible models (Table 3).
Table 3
| Best model | Distribution family | Link function | Priors (distribution) can be further improved | Model terms |
|---|---|---|---|---|
| Bayesian Negative Binomial model | Negative Binomial | Log | Priors on intercept, slopes, dispersion | eDNA, Temp, pH, Salinity, Latitude, Longitude, Interaction () |
| Bayesian Zero-Inflated Negative Binomial (ZINB) | Zero-Inflated Negative Binomial | Log (count); Logit (zero prob) | Priors on both count and zero submodels | eDNA, Temp, pH, Salinity, Latitude, Longitude, Interaction () + zero process covariates |
| Bayesian Hurdle Negative Binomial | Hurdle Negative Binomial | Log (count>0); Logit (hurdle prob) | Priors on presence and abundance components | eDNA, Temp, pH, Salinity, Latitude, Longitude, Interaction () + hurdle covariates |
| Bayesian Negative Binomial | Negative Binomial with spline | Log | Priors on spline standard deviations and all coefficients | eDNA (smooth), Temp, pH, Salinity, Latitude, Longitude |
| Assumptions and data pre-processing – valid for all models | All predictors z-scored for comparability. Scale-dependent priors, assuming incomparable predictors’ scales. | |||
Bayesian regression multi-model framework - summary.
A set of metrics was used to evaluate the resulting models, including Out-of-fold (OOF) Pearson correlation to assess the relationship between observed and predicted values (in the context of models’ ability to capture overall variability and accurately reproduce the linear trend in abundance), and OOF Spearman rank correlation, which provided an insight into how the model preserves sample ordering. Furthermore, the Root Mean Squared (RMSE) and Root Mean Squared Logarithmic Errors (RMSLE), as well as the Mean Absolute Error, were calculated to allow for effective comparison of predictive error magnitudes among models and to provide a metric for model predictive accuracy. The best model was chosen based on LOOIC (Leave-one-out Information Criterion), WAIC (Watanabe-Akaike Information Criterion) for the multi-model Bayesian framework, and RMSE or RMSLE values for best model selection in the multi-model GAM framework. ANOVA (analysis of deviance) was used to examine the significance of models’ terms and quantitative evaluation of deviance explained by the “Best model”, as well as the (GAMs) and Bayesian value for measuring Bayesian regression models’ overall signifficance.
All analyses and the accompanying graphical outputs were carried out in the R programming environment (R Core Team, 2021) utilizing R packages ‘brms’ (Bürkner, 2017a, 2017) with Stan (Carpenter et al., 2017), ‘rstan’ (Guo et al., 2020); ‘ggplot2’ (Wickham, 2016); ‘vegan’ (Oksanen et al., 2013), ‘mgcv’ (Wood and Wood, 2015; Wood, 2001), ‘copula’ (Hofert et al., 2014) and all related dependencies.
Results
Fish diversity via eDNA metabarcoding and trawling
The eDNA analysis using the 12S marker demonstrated seasonal fluctuations in the number of detected fish species (demersal and pelagic), totaling 23 species. A higher number of species was detected in eDNA samples during autumn (23 species) compared to summer (12 species). Correspondingly, trawl catches revealed a greater diversity of fish species in autumn (15 species) than in summer (9 species), reflecting expected seasonal variations in species assemblages (Figure 2; Table 4).
Figure 2
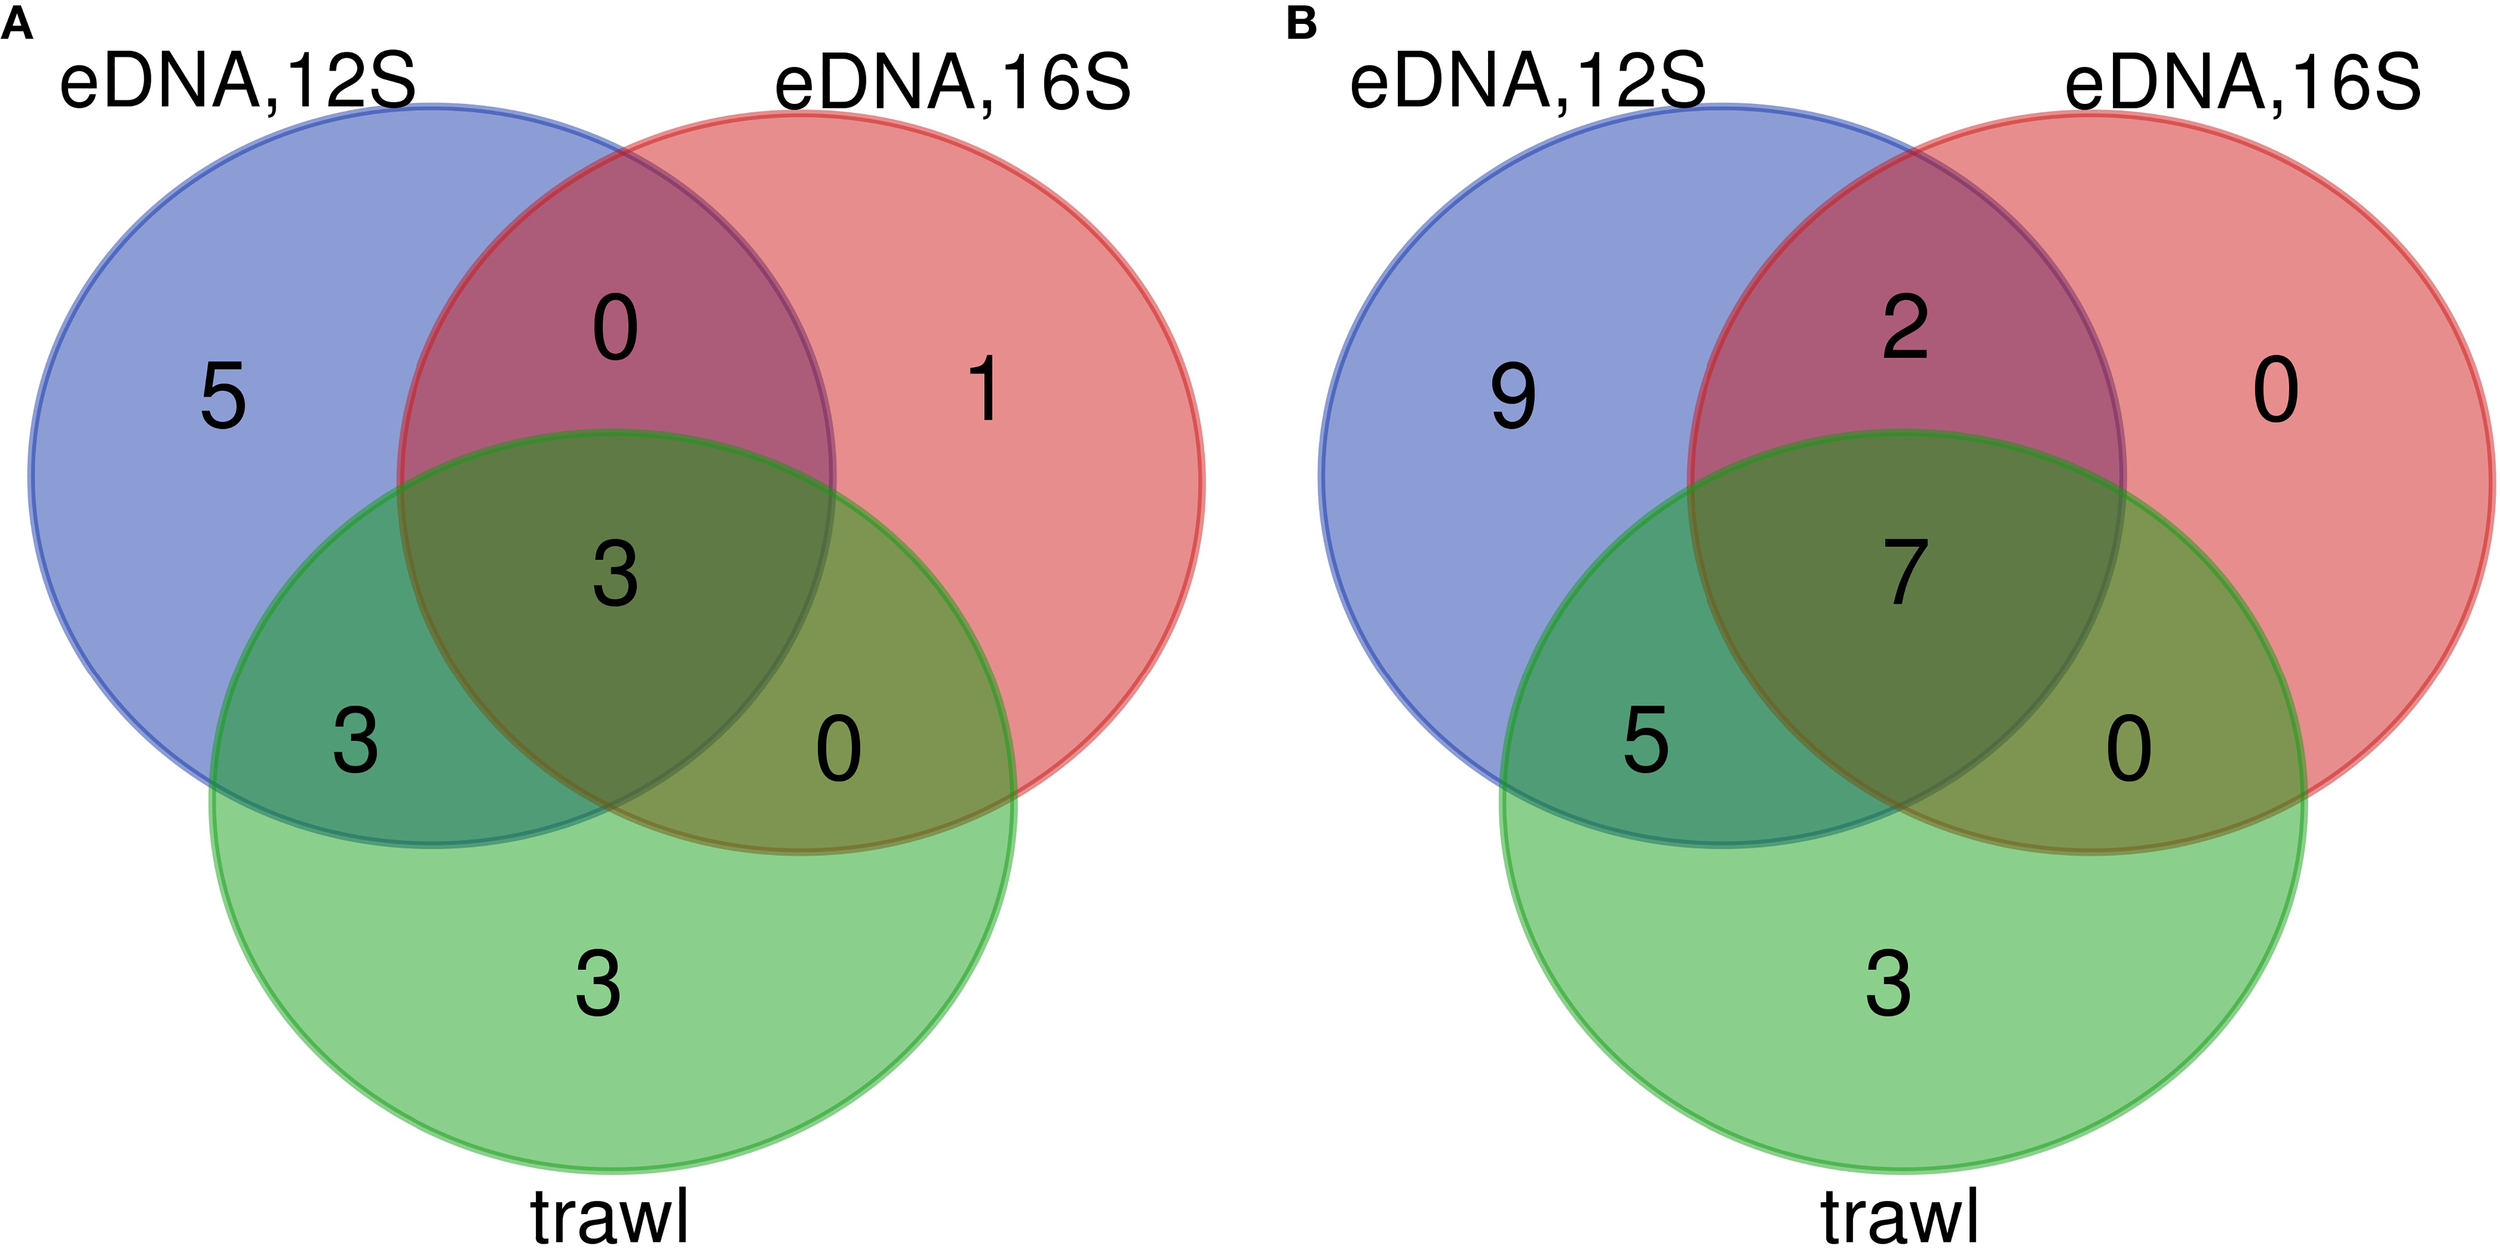
Venn diagram illustrating comparative analysis of species identified using eDNA and trawling in July (A) and November (B).
Table 4
| Species | Trawl | eDNA, 12S | eDNA, 16S | |||
|---|---|---|---|---|---|---|
| Summer | Autumn | Summer | Autumn | Summer | Autumn | |
| Acipenser stellatus (P, A, E) | + | – | – | – | – | – |
| Alosa sp. (P, A) | + | + | + | + | – | + |
| Alosa immaculata (P, A) | – | + | – | – | – | – |
| Aphia minuta (P) | – | – | + | + | – | – |
| Belone belone (D, M) | – | – | – | + | – | – |
| Chelidonichthys lucerna (D) | – | + | – | – | – | – |
| Chelon saliens (P) | – | – | – | + | – | – |
| Engraulis encrasicolus (P, M) | + | – | + | + | – | – |
| Euthynnus alletteratus (P, M, R) | – | – | – | + | – | – |
| Gobius niger (D) | – | – | + | + | – | – |
| Merlangius merlangus (P) | + | + | + | + | + | + |
| Mullus barbatus (D, M) | + | + | + | + | + | + |
| Neogobius melanostomus (D) | + | + | – | + | – | – |
| Platichthys flesus (D) | + | + | – | + | – | – |
| Pomatomus saltatrix (P, M) | – | + | – | + | – | + |
| Pomatoschistus minutus (D) | – | – | + | + | – | – |
| Raja clavata (D) | – | – | – | + | – | + |
| Scophthalmus maximus (D) | + | + | + | + | – | + |
| Scomber japonicus (P, M, R) | – | – | – | + | – | – |
| Sprattus sprattus (P) | + | + | + | + | + | + |
| Sparus aurata (P, R) | – | + | – | + | – | – |
| Squalus acanthias (D) | – | + | + | + | – | – |
| Thunnus thynnus (P, M, R) | – | – | – | + | – | – |
| Trachinus draco (D) | – | + | – | + | – | – |
| Trachurus mediterraneus (P, M) | – | + | + | + | – | + |
| Trachurus trachurus (P, M) | – | – | – | + | + | + |
| Uranoscopus scaber (D) | – | + | – | – | – | – |
Species identified via eDNA (12S and 16S markers) and parallel trawl surveys throughout seasonal samplings in 2022.
Species are classified by habitat type (D – demersal and P – pelagic) and behavior (A – anadromous and M – migratory), with additional designations for conservation status (E – endangered, I – invasive and R – rare). Species marked in bold are commercially important for the Black Sea.
Species diversity was more than twofold lower in both seasons when using the 16S primers, yielding only 9 species. The species identified using the 16S marker coincided with those detected using the 12S marker (Figure 2; Table 4). Furthermore, six species were identified in summer and twelve in autumn using both methods (eDNA with 12S and trawling) (Table 4). Species such as turbot (Scophthalmus maximus Linnaeus, 1758), whiting (Merlangius merlangus, Linnaeus, 1758), S. sprattus, M. barbatus, flounder (Platichthys flesus, Linnaeus, 1758), round goby (Neogobius melanostomus Pallas, 1814), and Alosa sp. were documented in trawl surveys during both summer and autumn, while migratory species like T. mediterraneus, anchovy (Engraulis encrasicolus Linnaeus, 1758), and bluefish (Pomatomus saltatrix Linnaeus, 1766) were found only in the specific seasons corresponding to their migratory patterns. The disparity in the autumn sampling survey was mainly attributable to eleven species (Alosa sp., transparent goby (Aphia minuta Risso, 1810), garfish Belone belone Linnaeus, 1761), leaping mullet (Chelon saliens Risso, 1810), little tunny (Euthynnus alletteratus Rafinesque, 1810), black goby (Gobius niger Linnaeus, 1758), sand goby (Pomatoschistus minutus Pallas, 1770), thornback ray (Raja clavata Linnaeus, 1758), chub mackerel (Scomber japonicus Houttuyn, 1782), Atlantic bluefin tuna (Thunnus thynnus Linnaeus, 1758) and Atlantic horse mackerel (Trachurus trachurus Linnaeus, 1758) that were not caught by trawling but were detected through eDNA. The last four species were likely missed by the trawl due to gear selectivity and mesh size. Conversely, four species: stellate sturgeon (Acipenser stellatus Pallas, 1771), pontic shad (Alosa immaculata Bennett, 1835), tub gurnard (Chelidonichthys lucerna Linnaeus, 1758) and Atlantic stargazer (Uranoscopus scaber Linnaeus, 1758) were captured by trawling but not detected via eDNA (Table 2). Additionally, the number of species detected in eDNA samples during summer differed by two species compared to the trawl data (Table 2). Rare species were detected exclusively in eDNA samples during the autumn survey at stations located in the southern region of the Bulgarian Black Sea coast: E. alletteratus (33A), S. japonicus (27A), T. thynnus (27A), and T. trachurus (16A, 18A, 25A, 27A, 32A).
Biodiversity Indices
The highest species richness values (Table 5) were predominantly recorded at most stations sampled by eDNA12S during the autumn expedition, with the exception of station 16A, which nonetheless exhibited a species count exceeding the average determined through trawling. The greatest number of species (12), obtained through trawling, was observed at station 18A during the autumn sampling season.
Table 5
| Sampling method | Station name | Species richness | Pielou evenness | Shannon | Simpson | Inversed Simpson | Unbiased Simpson |
|---|---|---|---|---|---|---|---|
| eDNA 12S | 1S | 6 | 0.309 | 0.554 | 0.259 | 1.350 | 0.259 |
| eDNA 12S | 5S | 6 | 0.236 | 0.423 | 0.229 | 1.297 | 0.229 |
| eDNA 12S | 13S | 6 | 0.214 | 0.383 | 0.163 | 1.195 | 0.163 |
| eDNA 12S | 21S | 5 | 0.134 | 0.216 | 0.088 | 1.096 | 0.088 |
| eDNA 12S | 25S | 7 | 0.632 | 1.229 | 0.655 | 2.900 | 0.655 |
| eDNA 12S | 31S | 6 | 0.627 | 1.124 | 0.598 | 2.486 | 0.598 |
| eDNA 12S | 33S | 4 | 0.792 | 1.098 | 0.653 | 2.884 | 0.653 |
| eDNA 12S | 37S | 6 | 0.540 | 0.968 | 0.531 | 2.131 | 0.531 |
| eDNA 12S | 4A | 9 | 0.162 | 0.357 | 0.150 | 1.177 | 0.150 |
| eDNA 12S | 10A | 10 | 0.246 | 0.566 | 0.292 | 1.413 | 0.292 |
| eDNA 12S | 16A | 7 | 0.564 | 1.098 | 0.552 | 2.234 | 0.552 |
| eDNA 12S | 18A | 13 | 0.228 | 0.585 | 0.216 | 1.275 | 0.216 |
| eDNA 12S | 25A | 12 | 0.150 | 0.374 | 0.128 | 1.146 | 0.128 |
| eDNA 12S | 27A | 12 | 0.119 | 0.295 | 0.117 | 1.133 | 0.117 |
| eDNA 12S | 32A | 10 | 0.171 | 0.393 | 0.145 | 1.170 | 0.145 |
| eDNA 12S | 33A | 14 | 0.473 | 1.248 | 0.635 | 2.737 | 0.635 |
| Trawl | 1S | 3 | 0.337 | 0.371 | 0.196 | 1.243 | 0.196 |
| Trawl | 5S | 4 | 0.234 | 0.325 | 0.151 | 1.178 | 0.151 |
| Trawl | 13S | 5 | 0.046 | 0.073 | 0.023 | 1.024 | 0.233 |
| Trawl | 21S | 3 | 0.351 | 0.386 | 0.223 | 1.287 | 0.223 |
| Trawl | 25S | 5 | 0.107 | 0.173 | 0.066 | 1.071 | 0.066 |
| Trawl | 31S | 5 | 0.153 | 0.246 | 0.120 | 1.136 | 0.120 |
| Trawl | 33S | 4 | 0.371 | 0.514 | 0.251 | 1.334 | 0.254 |
| Trawl | 37S | 3 | 0.339 | 0.372 | 0.172 | 1.208 | 0.173 |
| Trawl | 4A | 2 | 0.323 | 0.224 | 0.111 | 1.125 | 0.118 |
| Trawl | 10A | 6 | 0.492 | 0.882 | 0.449 | 1.815 | 0.450 |
| Trawl | 16A | 2 | 0.006 | 0.004 | 0.001 | 1.001 | 0.001 |
| Trawl | 18A | 12 | 0.746 | 1.853 | 0.790 | 4.751 | 0.792 |
| Trawl | 25A | 7 | 0.262 | 0.510 | 0.207 | 1.261 | 0.208 |
| Trawl | 27A | 4 | 0.121 | 0.168 | 0.067 | 1.072 | 0.067 |
| Trawl | 32A | 7 | 0.051 | 0.099 | 0.035 | 1.036 | 0.035 |
| Trawl | 33A | 3 | 0.732 | 0.804 | 0.528 | 2.118 | 0.533 |
Biodiversity indices for each sampling station computed using both the trawl surveys and eDNA (12S marker) data.
Sampling stations exhibiting highest diversity indices values are marked in bold.
Pielou’s evenness ranging from 0 to 1, with values nearing 0 was noted at three stations: trawl survey hauls gathered at stations 13S, 16A, 32A attributed to the significantly large captures of S. sprattus (13S) and T. mediterraneus (16A and 32A), which predominated the catch composition.
The Shannon index reached its maximum values during the trawl survey at station 18A and in the eDNA (12S marker) assessment at stations 25S, 31S, 33S, 16A, and 33A. The first three eDNA samples were obtained during the summer expedition, whereas stations 16A and 33A were sampled in the autumn expedition, revealing heightened biodiversity indices in both seasons, likely due to particular developmental stages (in summer) and/or migratory species (in autumn) whose pathways include the coastal and shelf waters of the Bulgarian Black Sea.
Species accumulation curves
Species accumulation curves were used to illustrate the increase in species count relative to sampling effort. The eDNA species accumulation curve (Figure 3A) indicated that roughly 10 more species could be detected using eDNA (12S marker) compared to those identified through trawl surveys considering the sampling effort (Figure 3B). Thus, the extensive reach and non-invasive characteristics of eDNA analysis enable the identification of a greater variety of species within the environment.
Figure 3
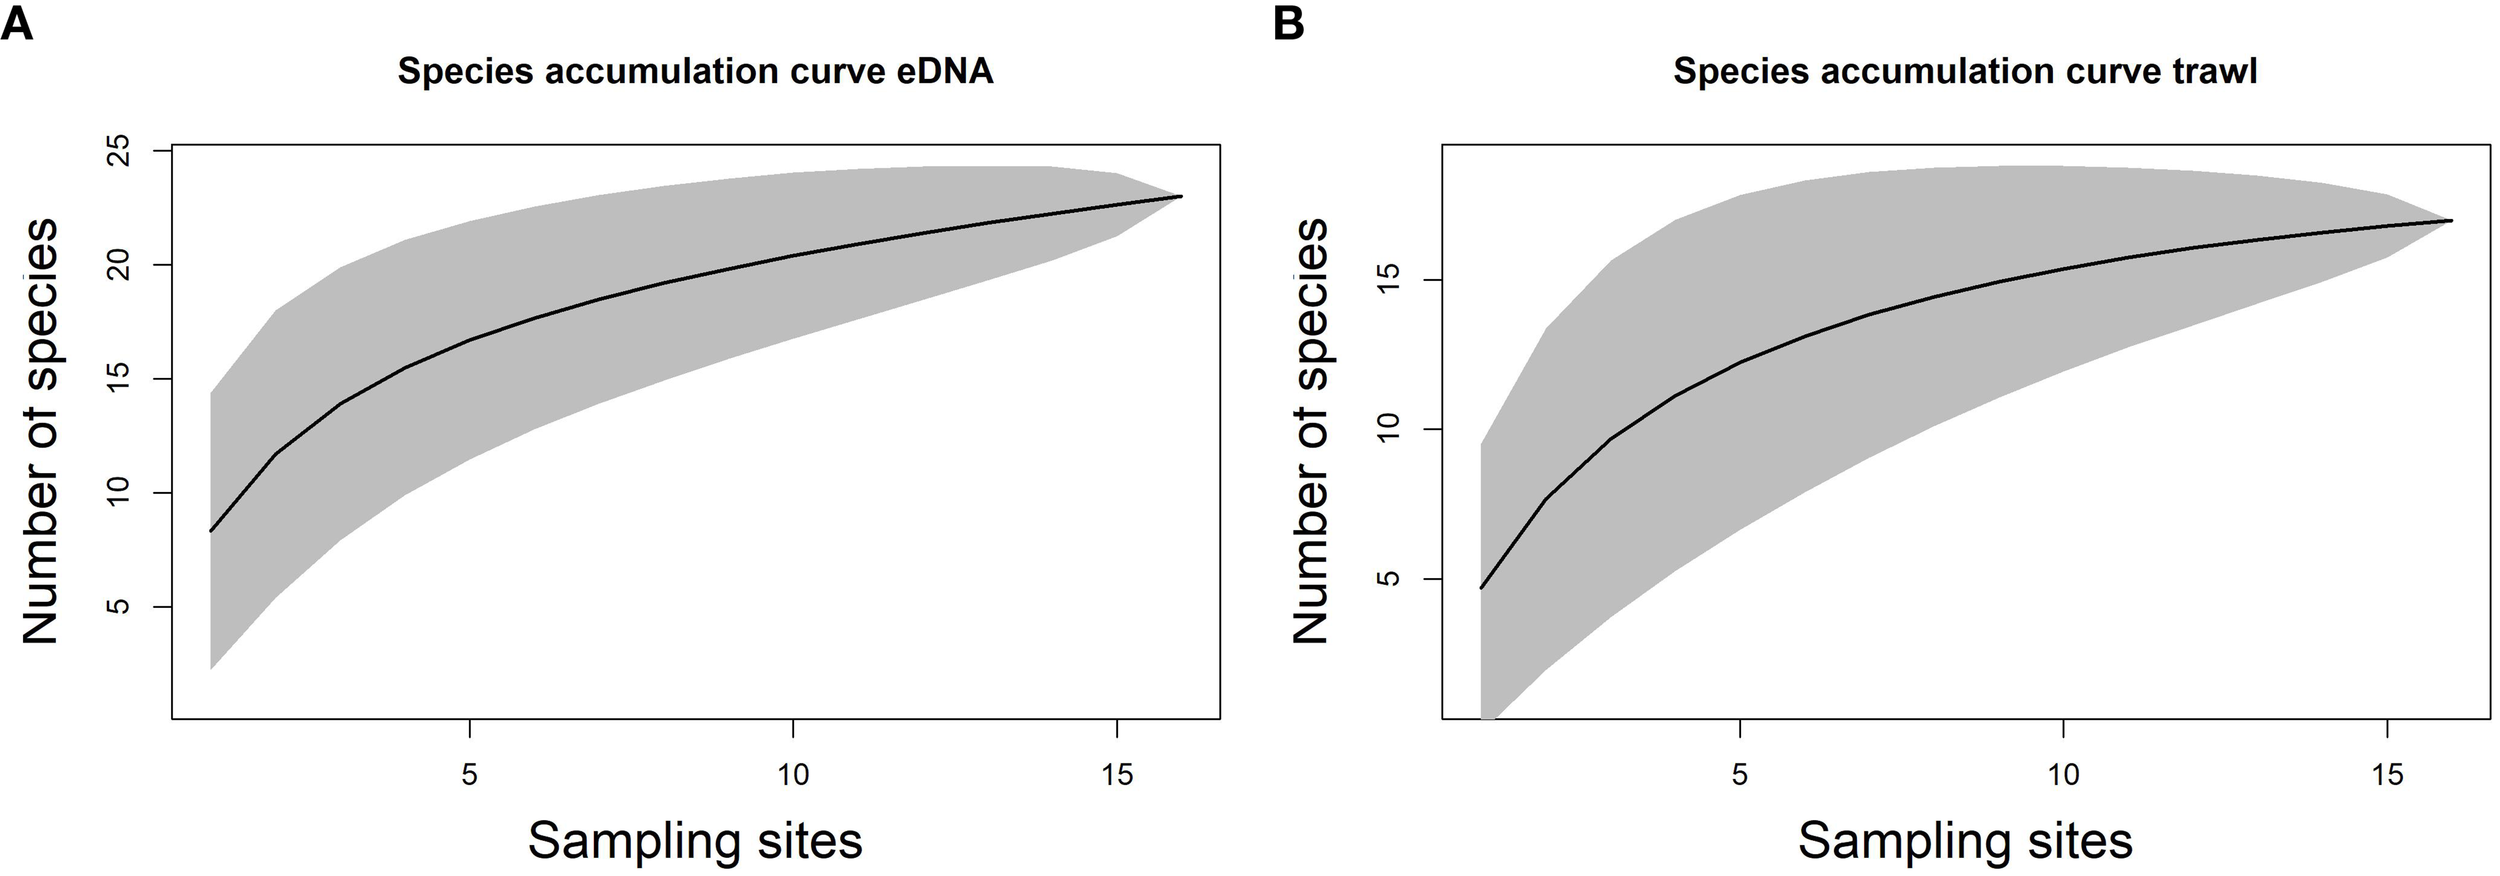
Species accumulation curves. (A) computed for eDNA 12S marker and (B) for trawl survey as sampling effort increases.
Seasonality and species preferences
Seasonal patterns in species communities, detected by both sampling techniques, were analyzed using constrained ordination (Redundancy Analysis - RDA). Seasonal clustering, as indicated by confidence ellipses, was distinctly observable for both seasons (Figure 4), presumably attributable to species habitat suitability and/or particular biotic interactions relevant to each season. Only a limited number of species within the detected community structure during the autumn season showed preferences for an abiotic environment comparable to that of the summer season, possibly due to species interactions or early recruitment developmental stages.
Figure 4
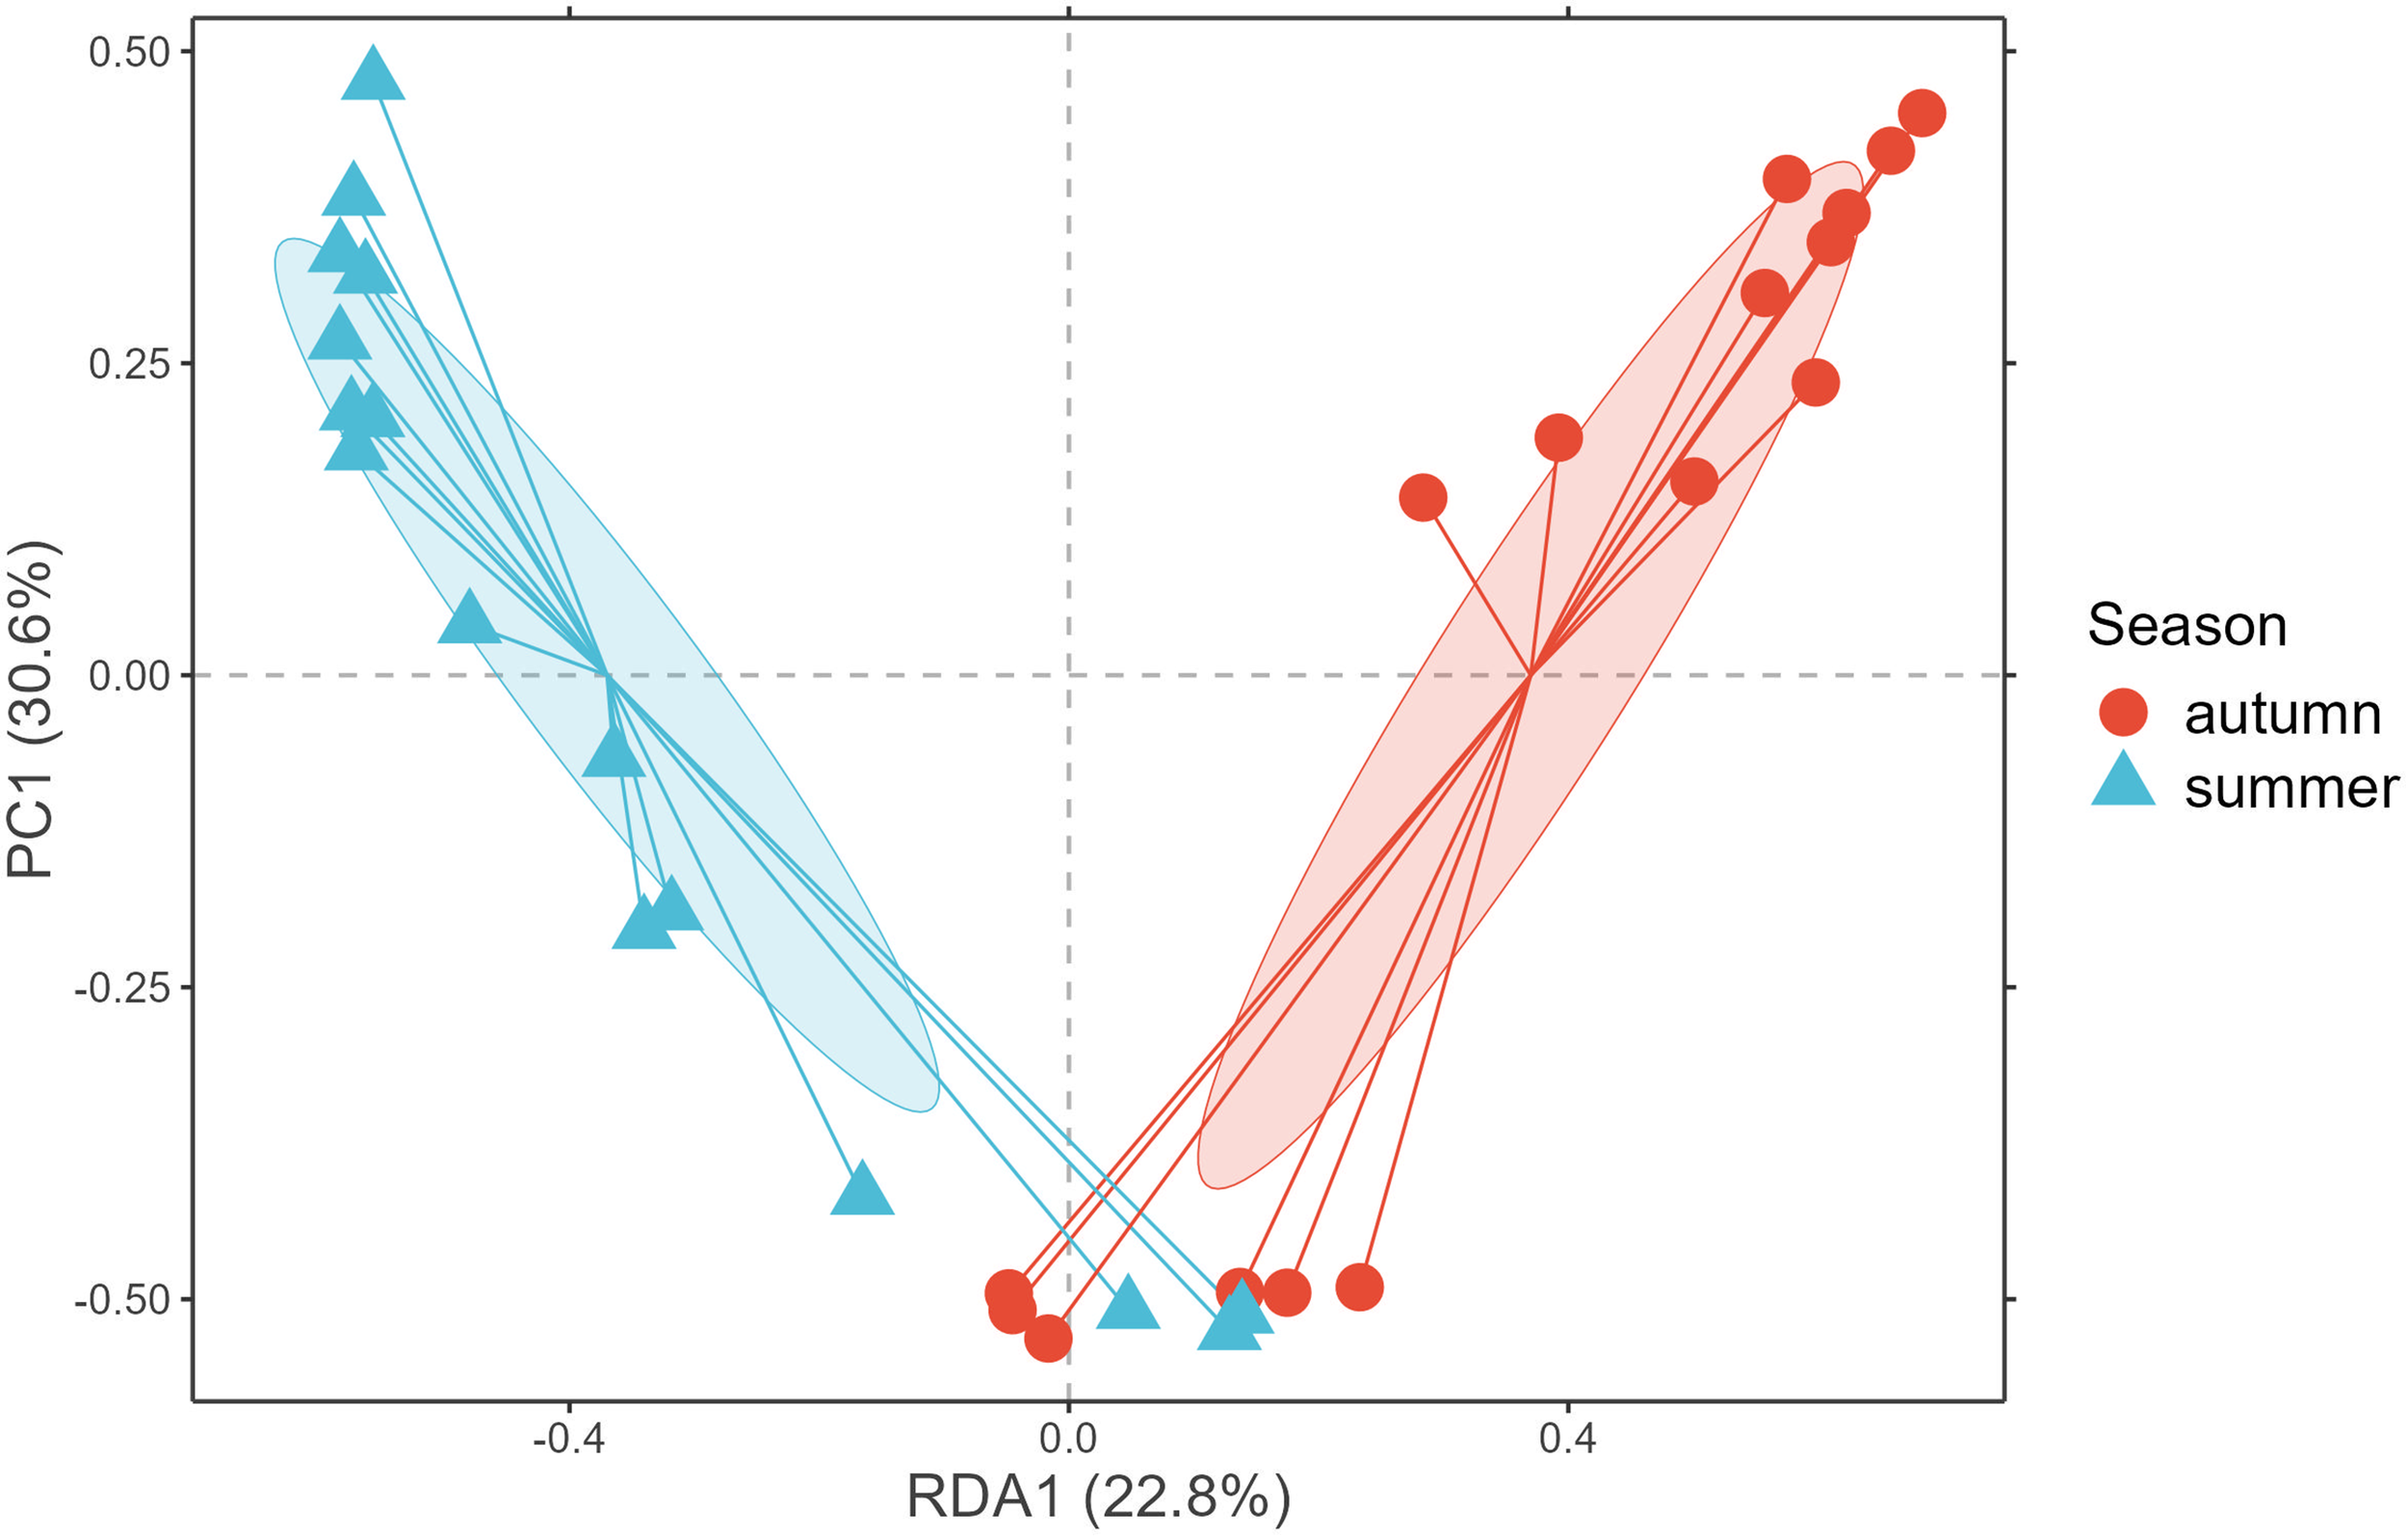
Redundancy analysis (RDA) ordination plot showing the variation in species composition constrained by season.
The seasonal pattern explained over 50% of the variance in community structure (based on abundance/eDNA 12S sequence count data). Identical clustering patterns were identified for species associations constrained to environmental covariates (temperature, salinity, and pH), which also show seasonal cycles. The RDA, that includes all continuous and categorical variables, accounted for 65% of the variance in species CPUE (kg)/sequence counts (), demonstrating that the model effectively captured general relationships while accounting for the significant contribution of temperature and pH.
Sampling method detection sensitivity and species-specific detection sensitivity
The posterior predictive check for the Bayesian Hierarchical model, utilized to evaluate method detection sensitivity and species-specific detection sensitivity per method (Figure 5), demonstrated a strong agreement between the actual data and the simulated posterior predictive distribution. The posterior predictive check was conducted utilizing new observations unknown to the model (train-test split 80–20%), indicating that the model sufficiently captured the data variability.
Figure 5
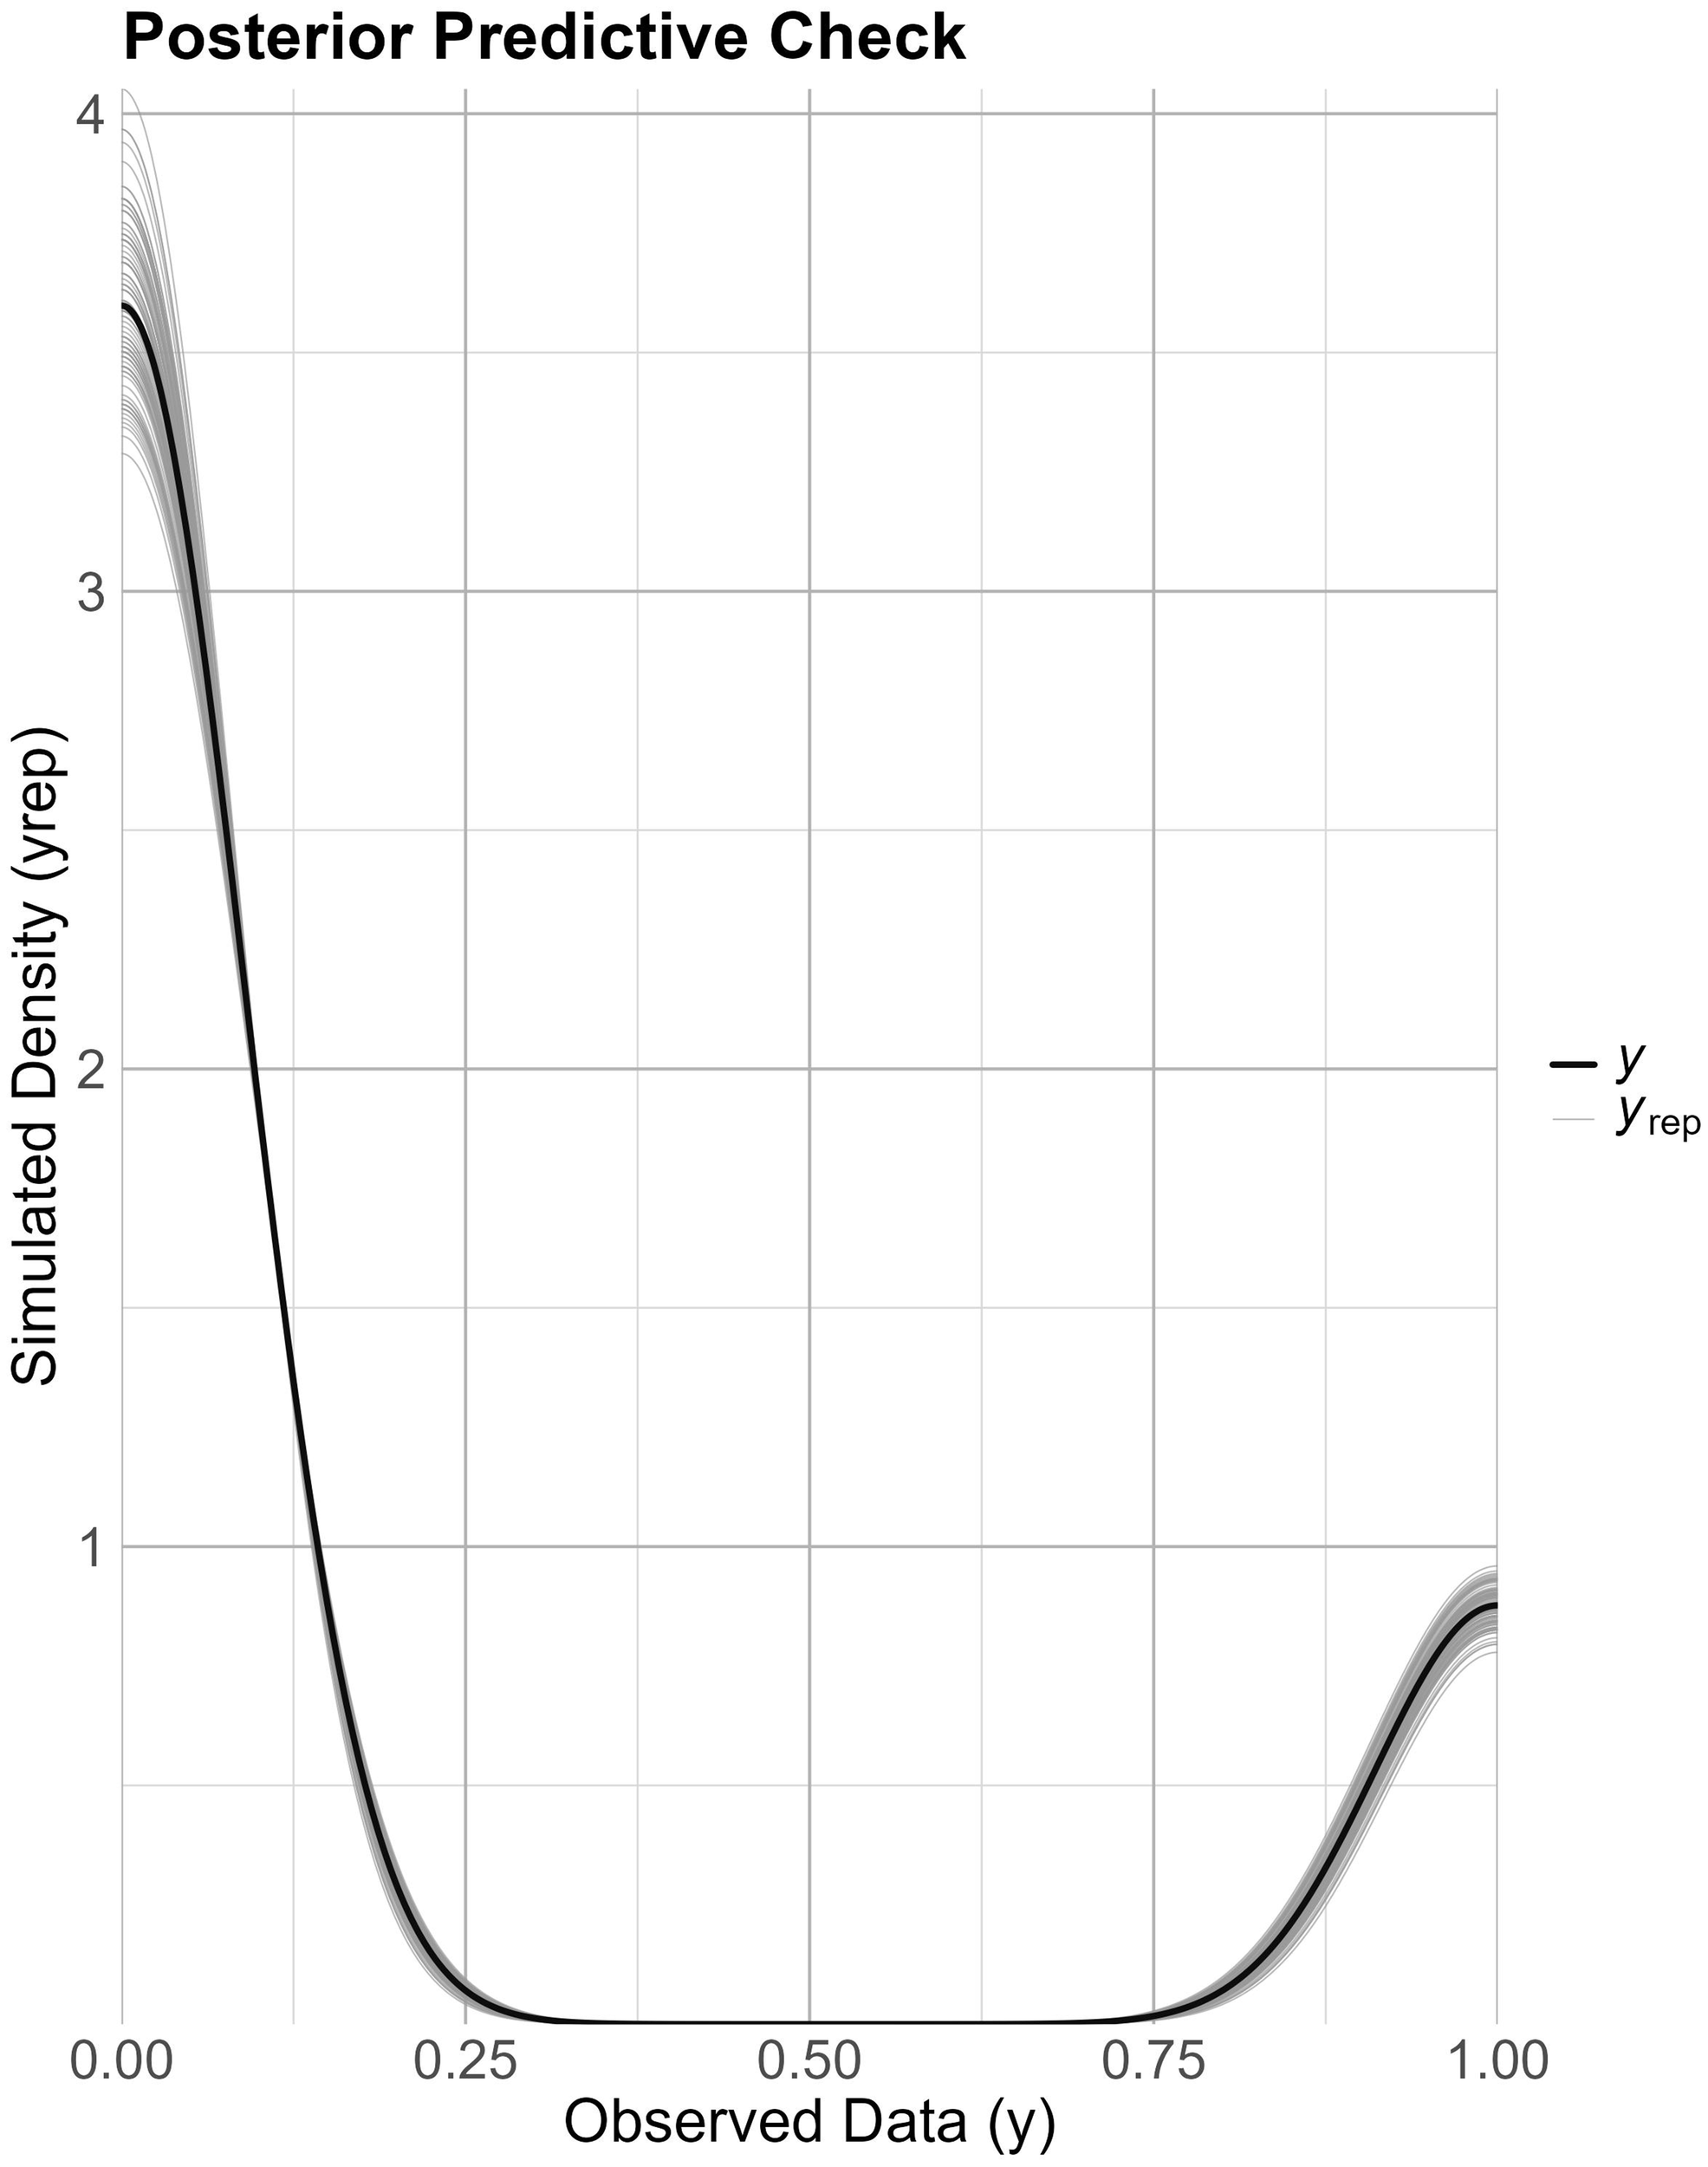
Posterior predictive check for the detection model. Comparison of observed data (bold black line) with simulated posterior predictive distributions (grey density curves) to assess model fit.
The model results highlight the influence of sampling methods and environmental covariates on method detection sensitivity (Figure 6) and determine the probability of detection for each species, utilizing the sampling method as a predictor while considering the effects of environmental covariates (Figure 7).
Figure 6
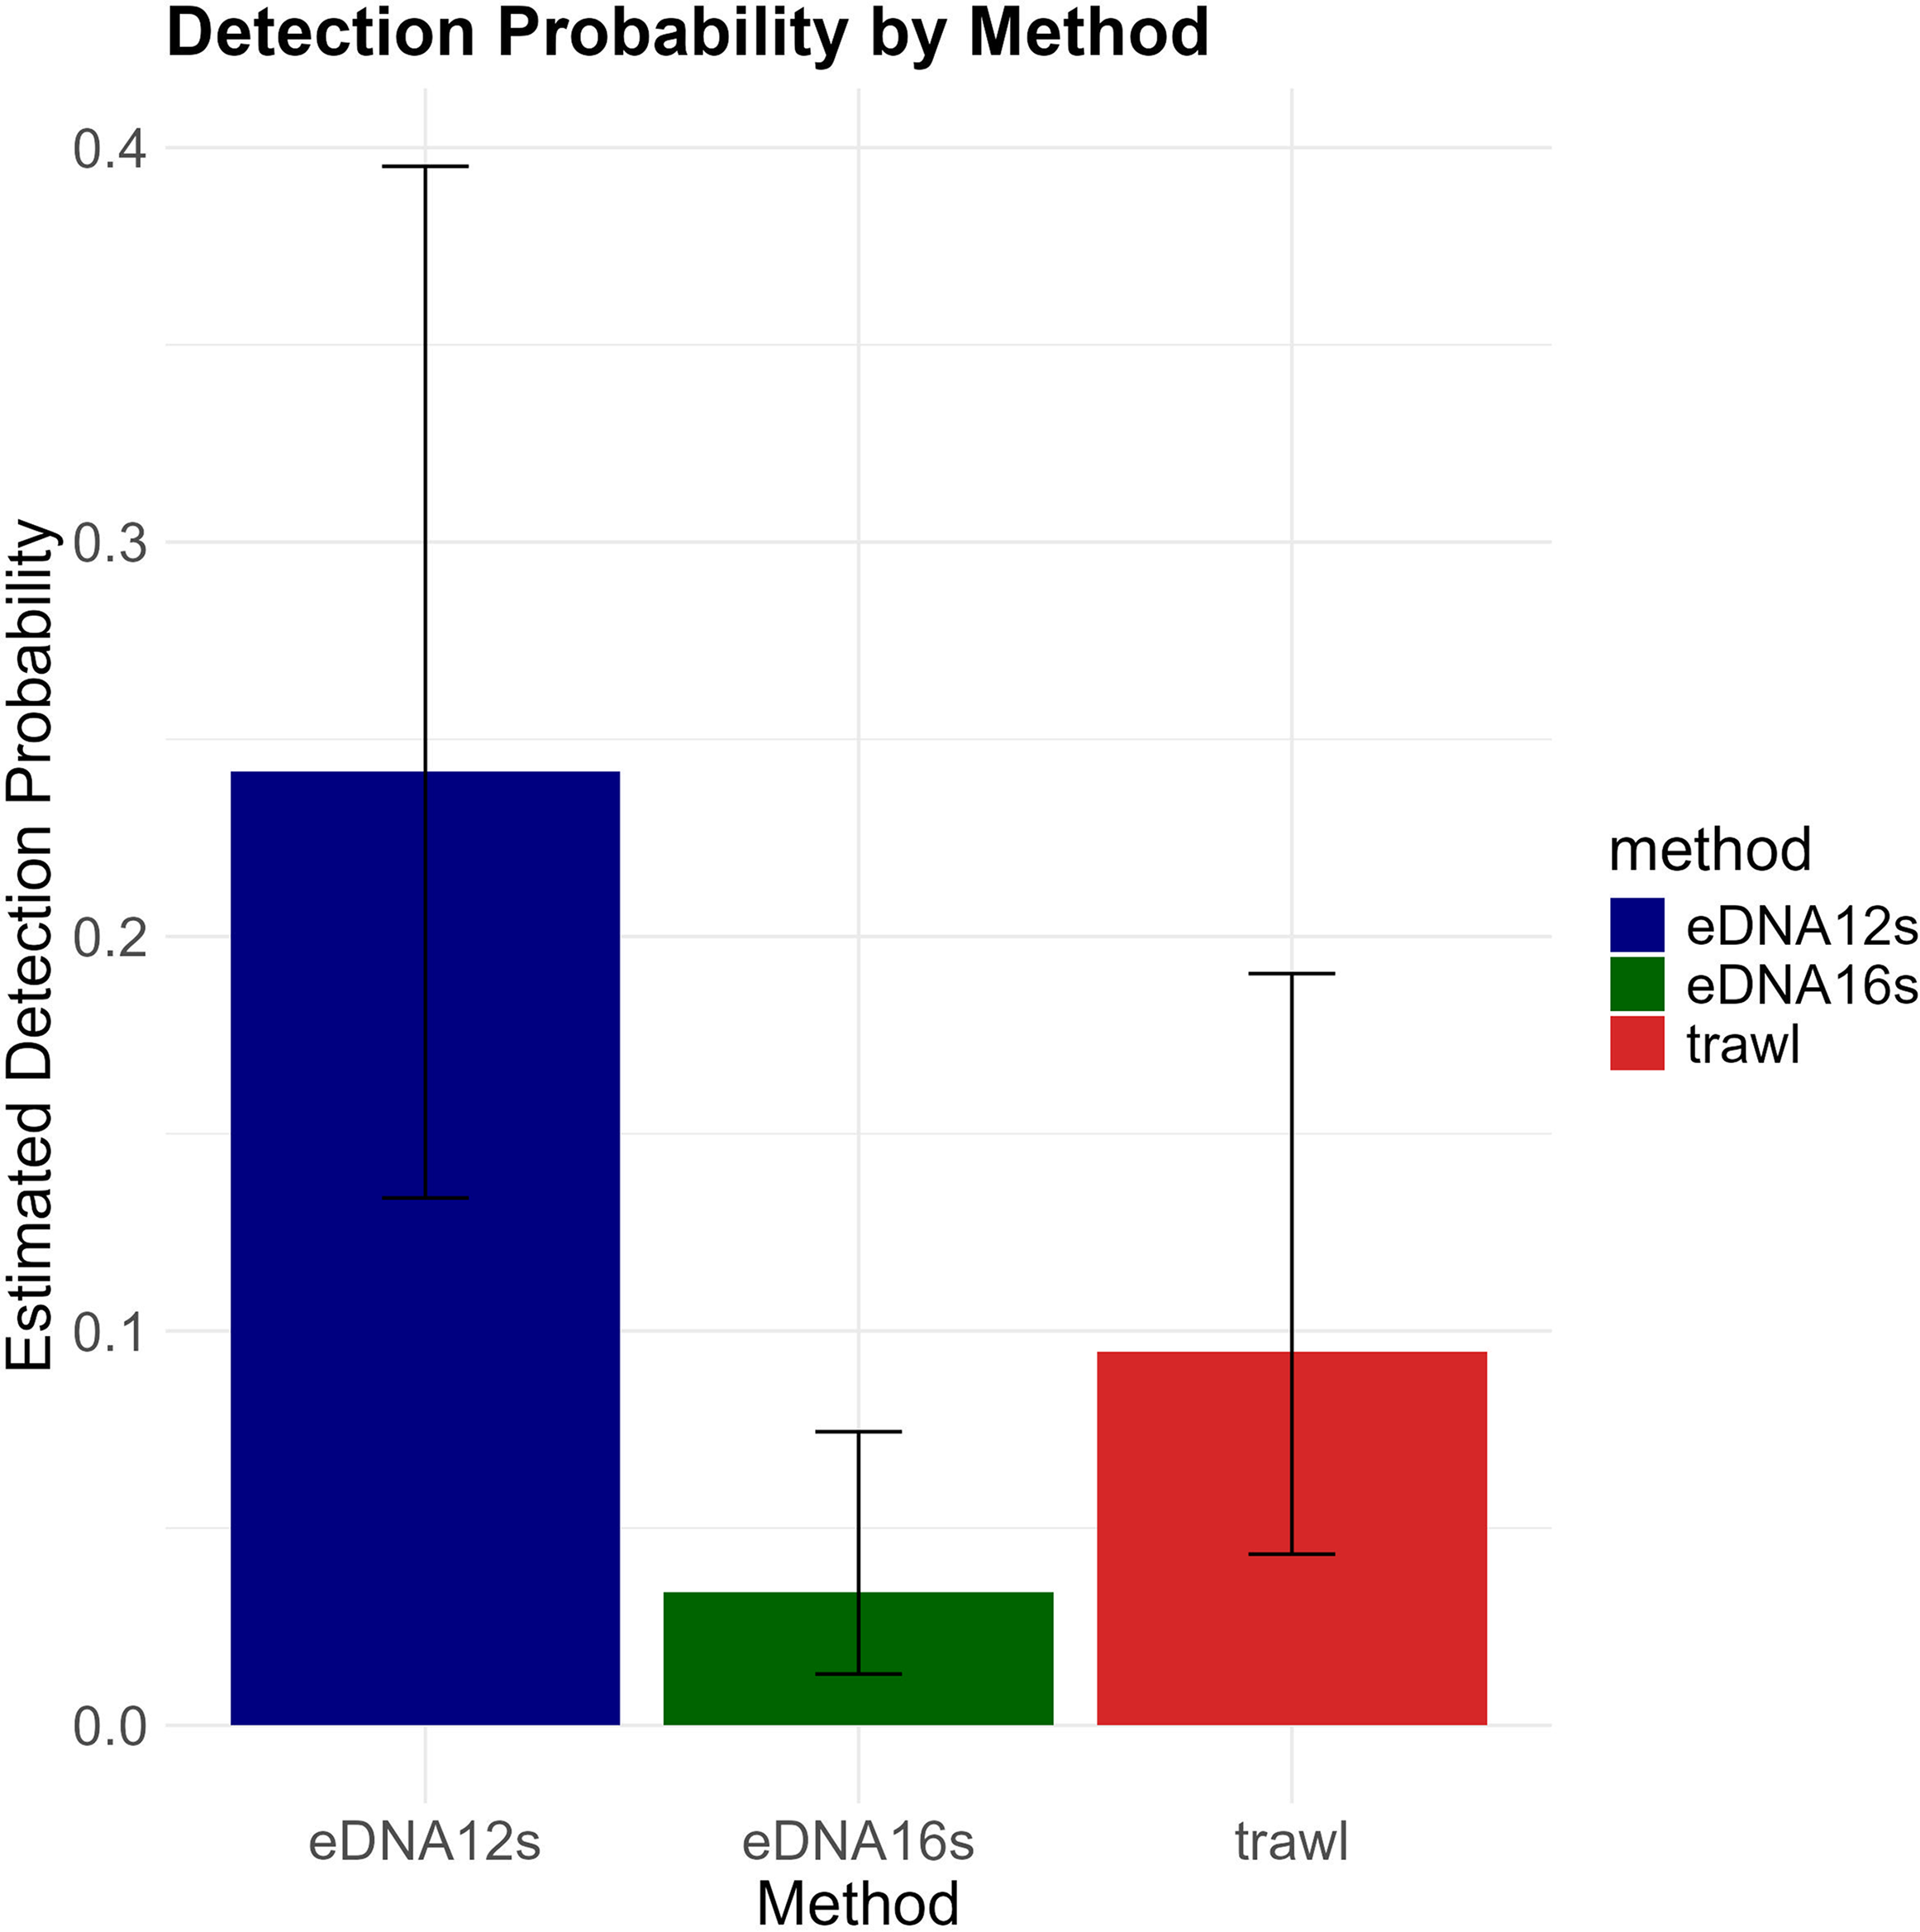
Estimated probability of detection by method, comparing eDNA and trawl surveys. Bars represent the mean estimated detection probability, with error bars indicating the 95% credible intervals.
Figure 7
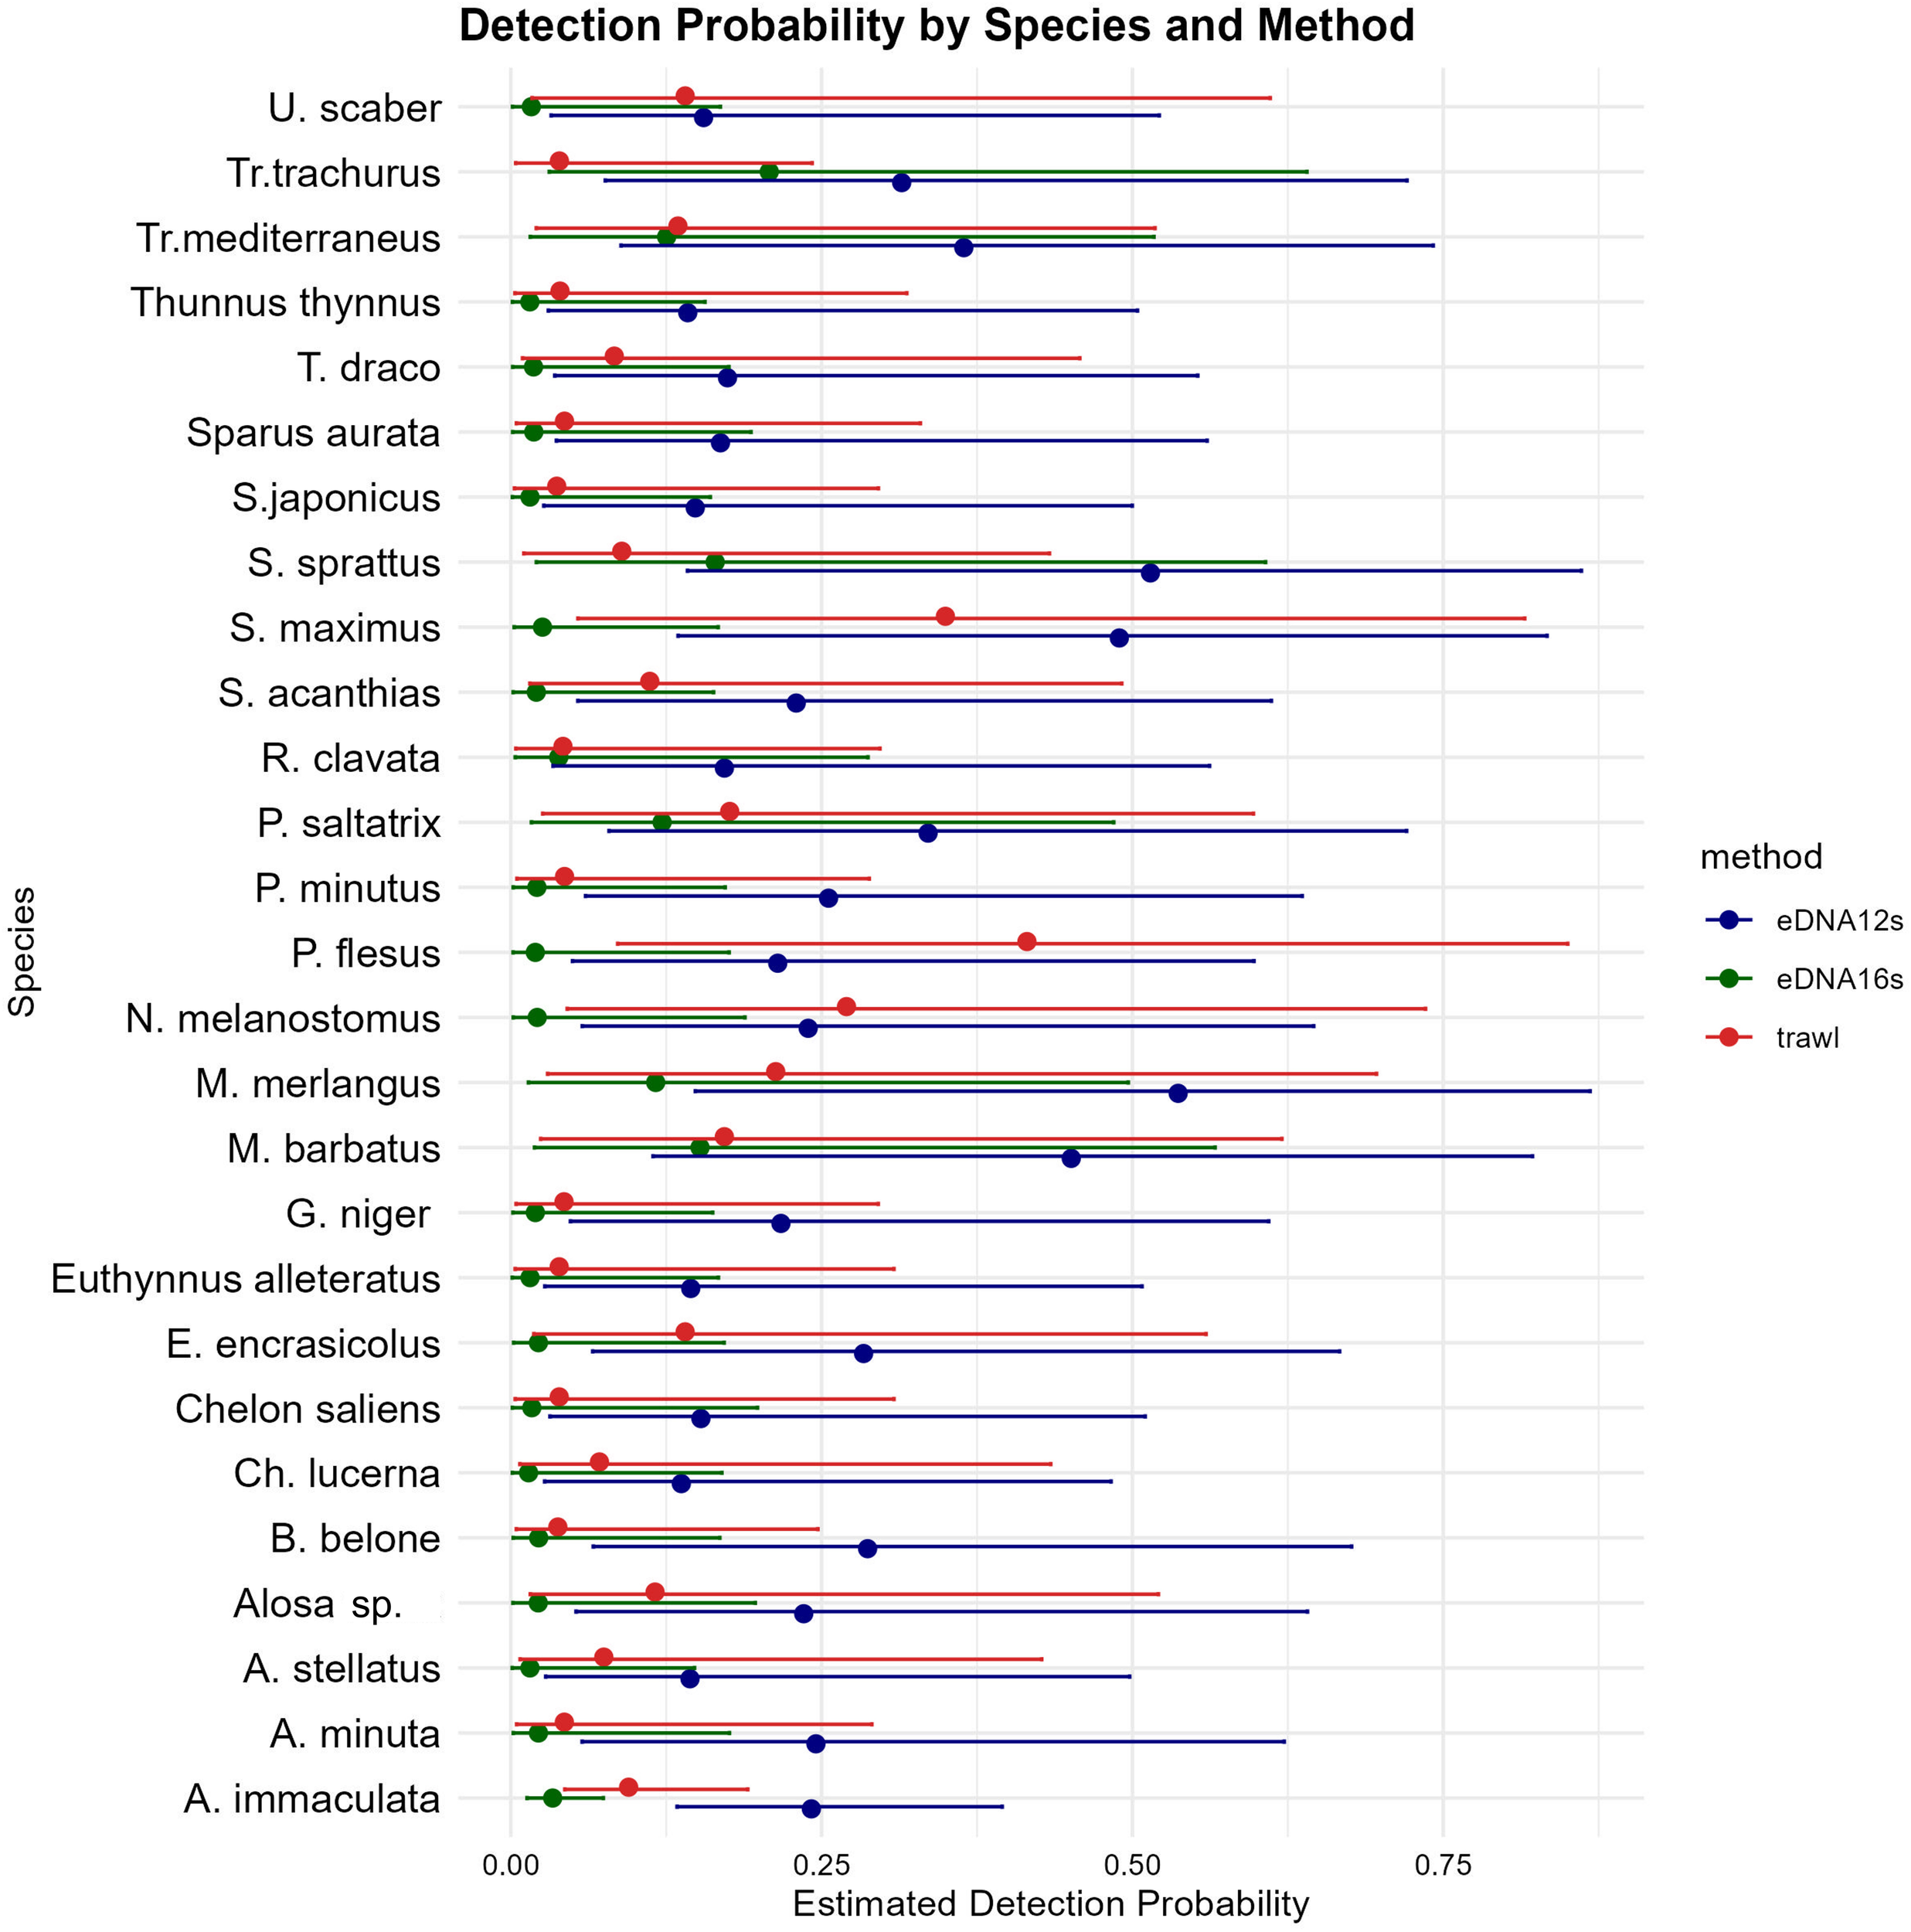
Estimated detection probability for each species, comparing eDNA 12S and 16S markers and trawl sampling methods. The points represent mean estimated detection probabilities, with error bars indicating 95% confidence intervals.
The detection probability for each method was obtained from the posterior distribution, based on the null hypothesis that trawling will identify more species than eDNA. The results indicated the chance of equals 0, signifying that in all posterior samples the detection probability of eDNA 12S was greater than detection probability of trawl, and equals 0, signifying that in all posterior samples the detection probability of eDNA 12S was greater than detection probability of eDNA 16S, hence validating the advantages of 12S primers over the eDNA 16S primers and trawl sampling for species detection.
The estimated species-specific detection probability evidently differs among various species; those that are naturally more abundant and prevalent in the environment (such as M. merlangus, S. maximus, and S. sprattus) and those with seasonal occurrences (E. encrasicolus, P. saltatrix, and T. mediterraneus) have a greater probability of detection. Furthermore, these species exhibit elevated detection probability across all sampling methodologies, despite the natural selectivity of trawling, which targets particular species based on trawl design and fishery type.
Rare species exhibit low detection probabilities, evident at the detection threshold, and are likely to be identified solely through eDNA (12S), given the constraints of trawling as a sampling technique and the lower sensitivity of 16S primers, which captures only the most abundant species and exhibited inability of detection of rare species and such present in low abundance.
The model findings revealed a statistically significant negative effect of temperature (Table 6) on method sensitivity, suggesting that high temperatures may adversely affect eDNA detection sensitivity, with no discernible influence from salinity and negligible impact from the pH.
Table 6
| Variable | Estimate | 95% CI | Interpretation |
|---|---|---|---|
| Temp | -0.15 | [-0.24; -0.05] | Significant negative effect/higher temperatures reduce detection of species |
| pH | -0.08 | [-1.88, 2.01] | No significant effect |
| Sal | 0.04 | [-0.34, 0.42] | No significant effect |
Effects of environmental covariates on sampling method detection sensitivity.
The reliability and accuracy of the model were assessed using the Brier score, AUC, TSS, and accuracy metrics, providing the following results: ; ; and . A of 0.105 signifies that the model’s probability estimates are well-calibrated, indicating accurate reflection of species detection likelihood (Brier, 1950; Trick et al., 2023) of 0.8912 suggests that the model has very good discriminatory capacity, meaning that it correctly ranks both detected and undetected instances; An accuracy of 86% is strong, indicating that 86% of the model’s predictions are correct.
Modelling species abundance based on eDNA 12S sequence counts
Best models identified for the test case species through the application of the GAMs multi-model framework
Increasing the sample size enabled the GAM smoothers to identify functional relationships instead of being susceptible to noise overfitting (Tables 7, 8). A higher number of samples led to improved model stability, an increased proportion of deviance explained by the models, and demonstrated distinct, biologically credible relationships between eDNA 12S sequence counts and CPUE-derived abundance for multiple species. The results, indicated that selecting optimal distribution families is essential for accurately capturing the underlying data dispersion and zero prevalence among species. Cross-validation metrics further verify that predictive generalization, particularly rank-based consistency, may be achieved with moderate sample size, while small-n models were predominantly influenced by noise and sampling variance.
Table 7
| Species | Best model | Deviance explained (%) | Pearson correlation (OOF) | Spearman correlation (OOF) | Comment | |
|---|---|---|---|---|---|---|
| M. merlangus | Tweedie (Compound Poisson–Gamma) | 76.7 | 0.938 | 0.053 | 0.203 | The model accurately fits the observed data but fails to generalize to novel data. The only credible predictor is spatial structure, provided this is not a functional model that accounts for abundance via eDNA. Overfitting to spatial structure (low Pearson correlation coefficient) and a small sample size may be contributing factors |
| M. barbatus | Reduced Negative Binomial GAM (simplified predictor set) | 0 | 0 | -0.218 | -0.042 | Potential reasons for model failure include insufficient data and low signal indicative for actual rarity in the sample coupled with a small sample size, as well as zero-rich data indicating underdispersion. |
| S. sprattus | Reduced Negative Binomial GAM (simplified predictor set) | 63.4 | -0.667 | -0.136 | 0.489 | The model’s underperformance may be attributed to a low sample size, overparameterized smooth terms, and data with a substantial number of zeros. The Pearson correlation coefficient suggests a likelihood of overfitting. A non-linear relationship between eDNA count data and trawl abundance was discovered. |
| S. maximus | Gaussian GAM (Identity-link) | 28.5 | 0.253 | 0.106 | 0.074 | A potential cause of model underperformance is a small sample size and an abundance of zero-rich data. The Pearson correlation coefficient suggests a likelihood of overfitting. The significant within-sample correlations fail to generalize effectively to validation subsets. |
Best model, diagnostics (diagnostic plots – Supplementary Figures S4, S6, S8, S10; Observed vs. predicted - Supplementary Figures S5, S7, S9, S11) and model metrics for small sample size – .
Table 8
| Species | Best model | Deviance explained (%) | Pearson correlation (OOF) | Spearman correlation (OOF) | |
|---|---|---|---|---|---|
| M. merlangus | Tweedie (Compound Poisson–Gamma) | 82.2 | 0.812 | 0.931 | 0.795 |
| M. barbatus | Gaussian GAM (Log-link) | 39.2 | 0.43 | -0.038 | 0.01 |
| S. sprattus | Reduced Negative Binomial GAM (simplified predictor set) | 63.1 | -0.047 | 0.078 | 0.675 |
| S. maximus | Gaussian GAM (Identity-link) | 52.4 | 0.362 | 0.557 | 0.697 |
Best model, diagnostics (diagnostic plots – Supplementary Figures S12, S14, S16, S18; Observed vs. predicted - Supplementary Figures S13, S15, S17, S19) and model metrics for moderate sample size – n=100 (synthetic dataset).
Best models identified for the test case species through the application of the Bayesian regression multi-model framework
The results clearly indicated that the Bayesian regression multi-model framework effectively identified the relationships between eDNA 12S and CPUE-derived abundance for both small () and intermediate () sample sizes (Table 9). The Negative Binomial family with spline extensions demonstrated higher performance across all tested species, effectively capturing nonlinear eDNA-abundance trends while addressing overdispersion and zero inflation. M. merlangus exhibited robust correlations (r > 0.9) and moderate (≈ 0.5), so confirming a reliable eDNA - CPUE-derived abundance relationship. The remaining species demonstrated greater variability in fits, perhaps due to biological and sampling limitations in the detectability of the eDNA 12S marker and/or trawl survey experiment design. The Bayesian regression approach demonstrated effectiveness with small, noisy datasets, yielding consistent parameter estimation and robust uncertainty quantification.
Table 9
| Species | Best model | Pearson correlation | Spearman correlation | Sample size | ||
|---|---|---|---|---|---|---|
| M. merlangus | Negative Binomial with spline | 0.973 | 0.902 | 0.489 | 0.306 | 16 |
| M. barbatus | Bayesian Negative Binomial model | 0.585 | 0.621 | 0.296 | 0.240 | 16 |
| S. maximus | Bayesian Negative Binomial model | 0.715 | 0.662 | 0.348 | 0.272 | 16 |
| S. sprattus | Bayesian Negative Binomial model | 0.790 | 0.483 | 0.320 | 0.280 | 16 |
| M. merlangus | Negative Binomial with spline | 0.955 | 0.792 | 0.488 | 0.376 | 100 |
| M. barbatus | Bayesian Negative Binomial model | 0.195 | 0.222 | 0.231 | 0.201 | 100 |
| S. maximus | Negative Binomial with spline | 0.521 | 0.617 | 0.277 | 0.186 | 100 |
| S. sprattus | Negative Binomial with spline | 0.094 | 0.698 | 0.261 | 0.193 | 100 |
Best model, diagnostics (posterior predictive check plots – Supplementary Figures S20–S27) and model metrics for moderate sample size – (synthetic dataset).
Discussion
DNA metabarcoding is a powerful tool for assessing biodiversity in environments that are challenging to explore with conventional approaches. This research employed simultaneous trawling and eDNA metabarcoding to compare trawl catches with eDNA data from corresponding water samples along the Bulgarian Black Sea coast. Consistent with other studies (Díaz-Ferguson and Moyer, 2014; Gilbey et al., 2021; Rishan et al., 2023; Suren et al., 2024; Çevik and Çevik, 2025; Sahu et al., 2025) our findings demonstrate that eDNA represents and excellent complementary technique, especially for improving detections capacities and providing a more comprehensive understanding of marine fish diversity. Our results demonstrated that eDNA reliably identifies a greater number of species across multiple habitat types. Collectively, our findings underline the value of eDNA as an additional approach that improves detection capabilities, strengthens biodiversity monitoring, and presents promising prospects for its incorporation into routine stock assessment frameworks.
Biodiversity
Our findings indicate that the eDNA 12S primer pair revealed greater taxonomic diversity than trawling, while requiring less sampling effort. Moreover, the eDNA-based method may detect organisms at various life stages and sizes, in contrast to conventional trawling, which selectively capture mature individuals within specific size ranges (Afzali et al., 2021). Although eDNA metabarcoding cannot provide estimates of absolute biomass, developmental stage, and size distribution, it offers substantial insights into the presence of numerous fish species within the studied ecosystem.
Another advantage of eDNA metabarcoding is its efficiency in a broader functional spectrum compared to bottom trawling and is capable of detecting both demersal and pelagic species present in the water column (Veron et al., 2023). Along the Bulgarian Black Sea coast, eDNA metabarcoding (12S) detected 13 pelagic species, including four rare species (T. trachurus, S. japonicas, E.s alleterattus, and T. thynnus), eight migratory species, and twelve demersal species (Table 4). Nevertheless, some case studies indicate that pelagic species are captured during demersal surveys in the Black Sea, as summer stratification influences pelagic species such as S. sprattus and T. mediterraneus which remain beneath the seasonal thermocline, and only ascend during the summer-autumn mixing (Tserkova, 2013; Panayotova and Todorova, 2015; European Commission, Joint Research Centre (JRC), 2025). The latter is not relevant for juvenile fish wich tipically inhabits shallower waters. Accordingly, it is reasonable for the region to expect co-occurrence of both pelagic and demersal species in the deeper layers (25-100m). The rare species, although not captured by trawling, are known to occur in the Black Sea (Yankova et al., 2014). Overall, eDNA metabarcoding significantly enhanced detection rates of rare and migratory species across diverse habitats without requiring physical capture or direct observation. This capability is especially beneficial for monitoring species that are difficult to detect using traditional methods.
Biodiversity indices revealed substantial seasonal fluctuations in species communities throughout the Bulgarian Black Sea coastline. Both methods revealed seasonal clustering patterns in fish communities (Table 4), with autumn exhibiting greater biodiversity and species richness compared to summer. eDNA detected higher number of species compared to trawling, including rare and those that are less prevalent during specific seasons, such as E. encrasicolus and M. barbatus in July, and S. sprattus in November. Accordingly, eDNA metabarcoding may represent a viable instrument in monitoring of shifts in species distribution and behavior associated with climate change, and assist conservation efforts by identifying locations of the core-density areas for key-species, such as S. maximus, S. sprattus, and M. barbatus for targeted conservation management. These new discoveries improve our understanding of migration timing and mechanisms, aiding the formulation of successful conservation measures.
Only six species were identified to overlap when employing both sampling approaches (trawl and eDNA 12S and 16S). Eleven species were detected only with eDNA, while four species (Table 4) were exclusively identified through trawling. Additionaly one species was identified on the genus level (Alosa sp.). The efficacy of eDNA-based biodiversity assessments depends on the thoroughness and precision of reference databases relevant to local biological populations, as emphasized in the study of Zhang et al. (2020). The lack of reference data might hinder taxonomic assignment, resulting in ambiguous species identification or, in severe instances, misidentification due to dependence on ‘best match’ algorithms (Gold et al., 2022). To address this, our study used custom reference databases, that included species known to inhabit the Black Sea, however, sequences for many Black Sea species are absent from NCBI and other public repositories, underscoring the need for greater efforts to incorporate additional species-specific mitochondrial DNA sequences into open access databases (Kasmi et al., 2023; Kumar et al., 2022; Xiong et al., 2022). Another potential explanation for the non-detection of some species via eDNA could be their rare occurrence or low abundance in the survey area, resulting in insufficient detectable eDNA. Species detected exclusively through trawling (Alosa immaculata, Chelidonichthys lucerna, Uranoscopus scaber, and Acipencer stellatus), exhibited minimal biomass in the catches (individual catch ≤ 4 kg). Furthermore, low-abundance taxa are often under-dected by traditional survey gear because encounter rates and capture probability decline with density (Williams et al., 2019; Adamo et al., 2020).
Scientific trawling remains the conventional method for assessing marine ecosystems and fish populations along the Bulgarian Black Sea coast, while eDNA-based species identification signifies an emerging scientific field and one of the most rapidly evolving tools in fisheries science and management (Lacoursière-Roussel et al., 2016; Casas Castaño and Saborido-Rey, 2022). The efficacy of fisheries management and conservation strategies depends heavily on the accurate identification of exploited species. This issue is especially challenging when dealing with cryptic species, larval stages, or morphologically similar bycatch (Casas Castaño and Saborido-Rey, 2022; Hansen, 2019). Accurate species-level identification is crucial for ensuring accurate catch records while supporting sustainable fisheries management. An illustrative instance of a challenging scenario involves the Ponto-Caspian species of the genus Alosa, which are assigned as vulnerable on the IUCN Red List. Morphological and genetic variations illustrate the taxonomic complexity of Alosa species in the Black Sea (Dobrovolov et al., 2012). The inconsistencies may result from misidentification in catches, as shads exhibit significant morphological plasticity, with overlapping morphological traits among species (Orlova et al., 2024). Genetic markers are essential for acquiring accurate information regarding species status and enhancing conservation efforts. Given these identification issues, some Alosa specimens gathered during our concurrent trawl research were identified as Alosa immaculata, while others could not be identified to the species level and were reported as Alosa sp. Similarly, environmental DNA (eDNA) metabarcoding at the same sampling locations (33S, 18A, and 25A), as well as an additional site (27A), using solely molecular approaches, also failed to resolve determination to species level. The absence of genetic differentiation within the genus Alosa, based on various mitochondrial markes (Antognazza et al., 2019; Orlova et al., 2024; Bhendarkar et al., 2025), including those used in the present study, hampered species-level identification. Thus, regardless of the fact the ASVs were affiliated with A. falax (the only Alosa species represented in the reference library used) in the present study, the results could only be interpreted at the genus level, and intragenus differentiation remains highly challenging.
Species-specific detection sensitivity and methods detection sensitivity
Our findings indicated that species that are naturally more common and prevalent in the ecosystem have a higher likelihood of detection. Moreover, these species demonstrate increased detection probability across all sampling methods, including the trawling, which is selective and targets specific species according to trawl design and fisheries type. Moreover, species with high abundance are anticipated to exhibit a greater probability of correlating eDNA sequence counts with biomass or abundance, as their eDNA signal is expected to be more pronounced due to their naturally higher densities in the environment, thus increasing the likelihood of detection by both conventional and eDNA methodologies. Higher abundance implies higher DNA shedding rates (Tillotson et al., 2018), and effective eDNA sampling with species-specific mitochondrial markers (12S rRNA, COI) can provide quality data to infer actual abundance and spatial distribution.
In contrast, rare species demonstrated low detection rates, apparent at the detection threshold, and are likely to be discovered only via the 12S eDNA marker, due to the limitations of trawling as a sampling method and the reduced sensitivity of the 16S primers.
The concentration of eDNA in marine ecosystems may vary due to numerous abiotic factors influencing its dispersal and degradation rates, including currents, temperature, and pH (Collins et al., 2018; Andruszkiewicz et al., 2019; Fukaya et al., 2021; McCartin et al., 2022). Our data revealed statistically significant adverse impacts of temperature on method sensitivity. Elevated temperatures, particularly in shallow coastal waters, may induce behavioral avoidance in fish, compelling them to seek cooler environments (Pörtner and Peck, 2010; Perry et al., 2005), and may also lead to reduced eDNA persistence due to accelerated degradation (Strickler et al., 2015; Barnes and Turner, 2016). The latter emphasizes the importance of considering environmental fluctuations when evaluating methods sensitivity, and particularly when inferring abundance from eDNA sequence counts (Parsley et al., 2024; Jo, 2025).
Estimation of CPUE-derived abundance from the sequence read counts
There is increasing interest in employing eDNA sequence counts to assess actual fish abundance and biomass (Dukan et al., 2024). Many studies have indicated substantial correlations between eDNA data and fish abundance/biomass in marine ecosystems (Thomsen et al., 2016; Salter et al., 2019; Afzali et al., 2021; Stoeckle et al., 2021; Rourke et al., 2022; Russo et al., 2021). Several research studies have found that using specific statistical methodologies, including Generalized Linear Models (GLM), Generalized Additive Models (GAM), non-linear models, or machine learning, can enhance the precise modeling of species abundance based on sequence counts (Collins et al., 2022; Fowler et al., 2024; Kasmi et al., 2025; Ip et al., 2025). However, some studies have demonstrated a lack of quantitative association between biomass/abundance and metabarcoding sequences, coupled with significant uncertainty (Lamb et al., 2019; Knudsen et al., 2019; Fraija-Fernández et al., 2020).
This research presents a robust multi-model analytical approach providing two multi-model frameworks implementing Bayesian hierarchical regression and frequentist Generalized Additive Models (GAMs) to establish relationship between eDNA 12S metabarcoding data and CPUE-derived abundance indices. The method addresses the primary challenges of eDNA–abundance modeling including constrained and noisy datasets, excessive zeros, and the potential for nonlinear environmental effects. In all frameworks, the models consistently identified biologically significant correlations between the abundance counts environment, spatial structure and/or eDNA signal strength. For Merlangius merlangus, both the Tweedie GAM and Bayesian Negative Binomial-spline models exhibited significant explanatory power. However, the GAM-derived model failed to account for any explanatory power of eDNA counts in relation to the predicted abundance, and the fit was significantly affected by the spatial structure.
Nonetheless, the uniformity of results from diverse statistical frameworks enhances the credibility of eDNA counts as a measure of abundance, assuming that analytical models adequately address dispersion and environmental variability. The Bayesian regression method facilitated comprehensive uncertainty quantification and reliable parameter inference in limited sample sizes, while Generalized Additive Models (GAMs) offered a sophisticated depiction of possibly nonlinear relationships among environmental DNA, environmental variables, and abundance. The latter illustrates that this complex approach enables eDNA data to replicate the spatial and environmental trends identified in trawl surveys, so facilitating the monitoring of fish populations with less environmental impact and increased frequency.
Our findings revealed that, depending on the strength of species-specific abundance and eDNA signals, many taxa (such as M. barbatus) had limited or absent relationships between observed and predicted abundance. This underscores the need for integrating additional molecular, ecological, and physical variables in abundance estimation to improve model explanatory power. A significant problem is the necessity for a carefully designed targeted sampling approach in both eDNA and trawl surveys to accurately capture actual species-specific signals, particularly when species coexist, leading to mixed catches. Concerning the latter, it is essential to highlight that the outcomes provided by the Bayesian regression framework can enable the direct translation of model uncertainty into recommendations for future eDNA survey design. The posterior variance and cross-model agreement identify species for which specific variables strongly affect predictive uncertainty, emphasizing areas where more sampling would improve model accuracy. Species displaying broad credible intervals or unstable correlations may require further spatial replication or more accurate temporal coverage, particularly for species that are seasonally present in the sampling area and have distinct migratory patterns. In contrast, strong relationships (such as those evident in M. merlangus model) suggest that eDNA signal strength reliably reflects abundance based on the present effort.
Another observation concerns the integration of environmental variables, including temperature and salinity, which consistently improved fit stability. This highlights the need of jointly predicting eDNA concentration and habitat context. The latter demonstrate that a probabilistic, multi-model Bayesian framework can improve adaptive sampling and concentrate sampling efforts, hence strengthening confidence in eDNA-based monitoring especially through application of quantitative markers as an alternative or supplement to traditional trawl surveys.
However, as with many emerging technologies, eDNA faces several limitations. The accuracy of reference databases, environmental heterogeneity, and DNA degradation rates are critical factors that can compromise the reliability of eDNA-based analyses. Establishing standardized protocols for data acquisition, sampling, and interpretation remains essential (Çevik and Çevik, 2025).
Improvements remain feasible through the application of internal DNA standards in 12S metabarcoding (Stoeckle et al., 2021) and qMiSeq approach (Tsuji et al., 2022), combined with an understanding of species-specific DNA shedding rates, eDNA transport dynamics, and signal degradation. The latter may undoubtedly provide a more robust basis for the precise assessment of biomass in less abundant species, particularly uncommon, newly introduced, and invasive ones. Moreover, several challenges persist, including the need for reliable data on DNA shedding and degradation rates, species mobility in the water column, hydrodynamic conditions influencing DNA transport and decay, and the necessity for precise ecological and abundance data to validate the model outcomes. Furthermore, the integration of eDNA data with ecological models and traditional approaches is essential to improve precision and deepen the understanding of ecological dynamics. By overcoming these constraints, eDNA could emerge as an essential instrument for biodiversity evaluation and conservation efforts (Çevik and Çevik, 2025). In conclusion, current advancements in molecular biomonitoring have expanded opportunities for aquatic ecosystem assessment (Blancher et al., 2022), and its application is becoming increasingly widespread (Ruppert et al., 2019). eDNA metabarcoding is an evolving method that is likely to continue developing as technology advances and standardization progresses. We conclude that it is a promising instrument that can complement and substitute the scientific trawling for biodiversity monitoring and that it can be successfully adapted for abundance estimation, in agreement with Veron et al. (2023). Further advancements are needed before this method can be widely used for fisheries assessments in the Black Sea basin, with a reasonable initial emphasis on the most abundant species. Future biomonitoring programs in the region should integrate eDNA metabarcoding with conventional surveys to yield a more comprehensive and precise evaluation of ichthyological diversity and fish stock, hence facilitating evidence-based policy formulation.
Statements
Data availability statement
The original contributions presented in the study are included in the article/Supplementary Material, further inquiries can be directed to the corresponding author/s.
Ethics statement
Ethical approval was not required for the study involving animals in accordance with the local legislation and institutional requirements because Sampling studies were carried out within the scope of the permission given by the Executive Agency for Fisheries and Aquaculture, Ministry of Agriculture and Food, Bulgaria, according to Contract No D-156 of 13.03.2023. This study does not require Local Ethics Committee Approval as experimental animals were not used in this study.
Author contributions
PI: Writing – review & editing, Writing – original draft. IZ: Writing – review & editing, Writing – original draft. ND: Writing – review & editing, Writing – original draft. IP: Writing – review & editing, Visualization. VR: Writing – review & editing, Resources. DD: Writing – review & editing, Resources. SM: Resources, Writing – review & editing. YR: Writing – review & editing, Resources. KS: Writing – review & editing, Project administration.
Funding
The author(s) declare financial support was received for the research and/or publication of this article. This research was supported by the grants: European Union’s Horizon 2020 BRIDGE-BS project (Grant A. No. 101000240) and MASRI (project of the National roadmap for scientific Infrastructure (2020–2027) of Republic of Bulgaria).
Conflict of interest
The authors declare that the research was conducted in the absence of any commercial or financial relationships that could be construed as a potential conflict of interest.
Generative AI statement
The author(s) declare that no Generative AI was used in the creation of this manuscript.
Any alternative text (alt text) provided alongside figures in this article has been generated by Frontiers with the support of artificial intelligence and reasonable efforts have been made to ensure accuracy, including review by the authors wherever possible. If you identify any issues, please contact us.
Publisher’s note
All claims expressed in this article are solely those of the authors and do not necessarily represent those of their affiliated organizations, or those of the publisher, the editors and the reviewers. Any product that may be evaluated in this article, or claim that may be made by its manufacturer, is not guaranteed or endorsed by the publisher.
Supplementary material
The Supplementary Material for this article can be found online at: https://www.frontiersin.org/articles/10.3389/fmars.2025.1648741/full#supplementary-material
References
1
Adamo M. Voyron S. Chialva M. Marmeisse R. Girlanda M. (2020). Metabarcoding on both environmental DNA and RNA highlights differences betweenfungal communities sampled in different habitats. PloS One15, e0244682. doi: 10.1371/journal.pone.0244682
2
Afzali S. F. Bourdages H. Laporte M. Mérot C. Normandeau E. Audet C. et al . (2021). Comparing environmental metabarcoding and trawling survey of demersal fish communities in the Gulf of St. Lawrence, Canada. Environ. DNA3, 22–42. doi: 10.1002/edn3.111
3
Allouche O. Tsoar A. Kadmon R. (2006). Assessing the accuracy of species distribution models: prevalence, kappa and the true skill statistic (TSS). J. Appl. Ecol.43, 1223–1232. doi: 10.1111/j.1365-2664.2006.01214.x
4
Andrews S. (2010). FastQC: A quality control tool for high throughput sequence data. Available online at: http://www.bioinformatics.babraham.ac.uk/projects/fastqc/ (Accessed March 1, 2025).
5
Andruszkiewicz E. A. Koseff J. R. Fringer O. B. Ouellette N. T. Lowe A. B. Edwards C. A. et al . (2019). Modeling environmental DNA transport in the coastal ocean using Lagrangian particle tracking. Front. Mar. Sci.6. doi: 10.3389/fmars.2019.00477
6
Antognazza C. M. Britton J. R. Potter C. Franklin E. Hardouin E. A. Gutmann Roberts C. et al . (2019). Environmental DNA as a non-invasive sampling tool to detect the spawning distribution of European anadromous shads (Alosa spp.). Aquat. Conservation: Mar. Freshw. Ecosyst.29, 148–152. doi: 10.1002/aqc.3010
7
Baetscher D. S. Omori K. L. Goethel D. R. Shelton A. O. Berger A. M. Ledger K. J. et al . (2025). The pragmatic sceptic: A practical approach for integrating environmental DNA into marine stock assessment and fisheries management. Fish Fish26, 809–824. doi: 10.1111/faf.70001
8
Barnes M. A. Turner C. R. (2016). The ecology of environmental DNA and implications for conservation genetics. Conserv. Genet.17, 1–17. doi: 10.1007/s10592-015-0775-4
9
Berry T. E. Saunders B. J. Coghlan M. L. Stat M. Jarman S. Richardson A. J. et al . (2019). Marine environmental DNA biomonitoring reveals seasonal patterns in biodiversity and identifies ecosystem responses to anomalous climatic events. PloS Genet.15, e1007943. doi: 10.1371/journal.pgen.1007943
10
Bhendarkar M. Claver C. Mendibil I. Fraija-Fernández N. Nachón D. J. Davison P. I. et al . (2025). Lessons learned from applying eDNA surveying to diadromous fish detection across the north-east Atlantic region. bioRxiv, 2025–2001. doi: 10.1101/2025.01.31.635873
11
Blancher P. Lefrançois E. Rimet F. Vasselon V. Argillier C. Arle J. et al . (2022). A strategy for successful integration of DNA-based methods in aquatic monitoring. Metabarcoding Metagenomics6, 215–226. doi: 10.3897/mbmg.6.85652
12
Borcard D. Gillet F. Legendre P. (2011). Numerical ecology with R Vol. 2 (New York: Springer), 688.
13
Bowman W. D. Hacker S. D. (2020). Community structure. Ecology 5th ed. Sinauer Associates is an imprint of Oxford University Press,
14
Brier G. W. (1950). Verification of forecasts expressed in terms of probability. Monthly Weather Rev.78, 1–3. doi: 10.1175/1520-0493(1950)078<0001:VOFEIT>2.0.CO;2
15
Brito-Morales I. Schoeman D. S. Molinos J. G. Burrows M. T. Klein C. J. Arafeh-Dalmau N. et al . (2020). Climate velocity reveals increasing exposure of deep-ocean biodiversity to future warming. Nat. Climate Change10, 576–581. doi: 10.1038/s41558-020-0773-5
16
Bürkner P. C. (2017a). brms: An R package for Bayesian multilevel models using Stan. J. Stat. Software80, 1–28. doi: 10.18637/jss.v080.i01
17
Bürkner P. C. (2017b). Advanced Bayesian multilevel modeling with the R package brms. arXiv. 10, 1. doi: 10.48550/arXiv.1705.11123
18
Callahan B. J. McMurdie P. J. Rosen M. J. Han A. W. Johnson A. J. A. Holmes S. P. (2016). DADA2: High-resolution sample inference from Illumina amplicon data. Nat. Methods13, 581–583. doi: 10.1038/nmeth.3869
19
Capurso G. Carroll B. Stewart K. A. (2023). Transforming marine monitoring: Using eDNA metabarcoding to improve the monitoring of the Mediterranean Marine Protected Areas network. Mar. Policy156, 105807. doi: 10.1016/j.marpol.2023.105807
20
Carpenter B. Gelman A. Hoffman M. D. Lee D. Goodrich B. Betancourt M. et al . (2017). Stan: A probabilistic programming language. J. Stat. Software76, 1–32. doi: 10.18637/jss.v076.i01
21
Casas Castaño L. Saborido-Rey F. (2022). State of the Art Review of Bioinformatics analysis of Environmental DNA. FishGenome - Deliverable.
22
Çevik T. Çevik N. (2025). Environmental DNA (eDNA): A review of ecosystem biodiversity detection and applications. Biodivers Conserv.34, 2999–3035. doi: 10.1007/s10531-025-03112-y
23
Clark J. S. Nemergut D. Seyednasrollah B. Turner P. J. Zhang S. (2017). Generalized joint attribute modeling for biodiversity analysis: Median-zero, multivariate, multifarious data. Ecol. Monogr.87, 34–56. doi: 10.1002/ecm.1241
24
Collins R. A. Baillie C. Halliday N. C. Rainbird S. Sims D. W. Mariani S. et al . (2022). Reproduction influences seasonal eDNA variation in a temperate marine fish community. Limnology Oceanography Lett.7, 443–449. doi: 10.1002/lol2.10271
25
Collins R. A. Wangensteen O. S. O’Gorman E. J. Mariani S. Sims D. W. Genner M. J. (2018). Persistence of environmental DNA in marine systems. Commun. Biol.1, 185. doi: 10.1038/s42003-018-0192-6
26
Colwell R. K. (2009). Biodiversity: concepts, patterns, and measurement. Princeton Guide to Ecol.663, 257–263. doi: 10.1515/9781400833023.2573
27
Cote D. McClenaghan B. Desforges J. Fahner N. A. Hajibabaei M. Chawarski J. et al . (2023). Comparing eDNA metabarcoding and conventional pelagic netting to inform biodiversity monitoring in deep ocean environments. ICES J. Mar. Sci.80, 2545–2562. doi: 10.1093/icesjms/fsad169
28
Dai S. Bai M. Jia H. Xian W. Zhang H. (2022). An assessment of seasonal differences in fish populations in Laizhou Bay using environmental DNA and conventional resource survey techniques. Fishes7, 250. doi: 10.3390/fishes7050250
29
Deiner K. Bik H. M. Mächler E. Seymour M. Lacoursière-Roussel A. Altermatt F. et al . (2017). Environmental DNA metabarcoding: Transforming how we survey animal and plant communities. Mol. Ecol.26, 5872–5895. doi: 10.1111/mec.14350
30
Díaz-Ferguson E. E. Moyer G. R. (2014). History, applications, methodological issues and perspectives for the use environmental DNA (eDNA) in marine and freshwater environments. Rev. Biol. Trop.62, 1273–1284. doi: 10.15517/rbt.v62i4.13231
31
Dobrovolov I. Ivanova P. Georgiev Z. Panayotova M. Raykov V. Nikolov V. (2012). Allozyme variation and genetic identification of shad species (Pisces: Clupeidae, genus Alosa) along Bulgarian Black Sea coast. Acta Zool. Bulg64, 175–183.
32
Dukan N. Cornelis I. Maes S. Hostens K. De Backer A. Derycke S. (2024). Vertical and horizontal environmental DNA (eDNA) patterns of fish in a shallow and well-mixed North Sea area. Sci. Rep.14, 16748. doi: 10.1038/s41598-024-66912-2
33
Dunn P. K. Smyth G. K. (2005). Series evaluation of Tweedie exponential dispersion model densities. Stat Computing15, 267–280. doi: 10.1007/s11222-005-4070-y
34
Erdogan N. Duzgunes E. Ogut H. (2009). “ Commission Internationale pour l'Exploration Scientifique de la Mer Mediterranee- CIESM, Monaco 2009, June. Black Sea fisheries and climate change,” in CIESM Workshop Monographs ( CIESM, Monaco).
35
European Commission, Joint Research Centre (JRC) (2025). EU Mediterranean and Black Sea Fisheries Independent Survey Data up to 2023 ( European Commission, Joint Research Centre (JRC). Available online at: http://data.europa.eu/89h/f25092c4-3f0f-449f-ba60-5fbfe385defc.
36
Fielding A. H. Bell J. F. (1997). A review of methods for the assessment of prediction errors in conservation presence/absence models. Environ. Conserv.24, 38–49. doi: 10.1017/S0376892997000088
37
Fowler C. M. Ogburn M. B. Aguilar R. Heggie K. Legett H. D. Richie K. D. et al . (2024). Viability of high-frequency environmental DNA (eDNA) sampling as a fish enumeration tool. Ecol. Indic.166, 112384. doi: 10.1016/j.ecolind.2024.112384
38
Fraija-Fernández N. Bouquieaux M. C. Rey A. Mendibil I. Cotano U. Irigoien X. et al . (2020). Marine water environmental DNA metabarcoding provides a comprehensive fish diversity assessment and reveals spatial patterns in a large oceanic area. Ecol. Evol.10, 7560–7584. doi: 10.1002/ece3.6482
39
Fukaya K. Murakami H. Yoon S. Minami K. Osada Y. Yamamoto S. et al . (2021). Estimating fish population abundance by integrating quantitative data on environmental DNA and hydrodynamic modelling. Mol. Ecol.30, 3057–3067. doi: 10.1111/mec.15530
40
Gilbey J. Carvalho G. Castilho R. Coscia I. Coulson M. W. Dahle G. et al . (2021). Life in a drop: Sampling environmental DNA for marine fishery management and ecosystem monitoring. Mar. Policy124, 104331. doi: 10.1016/j.marpol.2020.104331
41
Gold Z. Wall A. R. Schweizer T. M. Pentcheff N. D. Curd E. E. Barber P. H. et al . (2022). A manager’s guide to using eDNA metabarcoding in marine ecosystems. PeerJ10, e14071. doi: 10.7717/peerj.14071
42
Goldberg C. S. Turner C. R. Deiner K. Klymus K. E. Thomsen P. F. Murphy M. A. et al . (2016). Critical considerations for the application of environmental DNA methods to detect aquatic species. Methods Ecol. Evol.7, 1299–1307. doi: 10.1111/2041-210X.12595
43
Guo J. Gabry J. Goodrich B. Weber S. (2020). Package ‘rstan’. Available online at: https://cranr-projectorg/web/packages/rstan2020 (Accessed June 1, 2024).
44
Haderlé R. Bouveret L. Chazal J. Girardet J. Iglésias S. Lopez P. J. et al . (2024). eDNA-based survey of the marine vertebrate biodiversity off the west coast of Guadeloupe (French West Indies). Biodiversity Data J.12, e125348. doi: 10.3897/BDJ.12.e125348
45
Hammerl C. Möllmann C. Oesterwind D. (2024). Identifying fit-for purpose methods for monitoring fish communities. Front. Mar. Sci.10. doi: 10.3389/fmars.2023.1322367
46
Hansen B. K. (2019). Novel DNA methods and instrumentation for species monitoring in fisheries. Technical University of Denmark. Available online at: https://findit.dtu.dk/en/catalog/6738eb12d4516027a8e36ea1 (Accessed October 5, 2025).
47
Hansen B. K. Bekkevold D. Clausen L. W. Nielsen E. E. (2018). ). The sceptical optimist: challenges and perspectives for the application of environmental DNA in marine fisheries. Fish Fisheries19, 751–768. doi: 10.1111/faf.12286
48
Harrison J. B. Sunday J. M. Rogers S. M. (2019). Predicting the fate of eDNA in the environment and implications for studying biodiversity. Proc. R. Soc. B286, 20191409. doi: 10.1098/rspb.2019.1409
49
He X. Jeffery N. W. Stanley R. R. E. Hamilton L. C. Rubidge E. M. Abbott C. L. (2023). eDNA metabarcoding enriches traditional trawl survey data for monitoring biodiversity in the marine environment. ICES J. Mar. Sci.80, 1529–1538. doi: 10.1093/icesjms/fsad083
50
Hilbe J. M. (2011). Negative binomial regression (New York: Cambridge University Press), ISBN: 978-0521-19815-8.
51
Hofert M. Kojadinovic I. Maechler M. Yan J. (2014). copula: Multivariate dependence with copulas. R package version 0.999-9. Available online at: http://CRAN.R-project.org/package=copula,C225 (Accessed September 1, 2025).
52
Hopkins G. Freckleton R. (2002). Declines in the numbers of amateur and professional taxonomists: Implications for conservation. Anim. Conserv.5, 245–249. doi: 10.1017/S1367943002002299
53
Ip Y. C. A. Allan E. A. Hirsch S. L. Kelly R. P. (2025). Fast, flexible, feasible: a transparent framework for evaluating eDNA workflow trade-offs in resource-limited settings. bioRxiv, 2025–2004. doi: 10.1101/2025.04.16.649249
54
Iversen L. L. Kielgast J. Sand-Jensen K. (2015). Monitoring of animal abundance by environmental DNA-An increasingly obscure perspective: A reply to Klymus et al., 2015. Biol. Conserv.192, 479–480. doi: 10.1016/j.biocon.2015.09.024
55
Jo T. S. (2025). Integrating temperature-dependent production of environmental DNA into its relationship with organism abundance. J. Thermal Biol.129, 104120. doi: 10.1016/j.jtherbio.2025.104120
56
Junge M. R. Dettori J. R. (2018). ROC solid: Receiver operator characteristic (ROC) curves as a foundation for better diagnostic tests. Global Spine J.8, 424–429. doi: 10.1177/2192568218778294
57
Kasmi Y. Eschbach E. Hanel R. (2023). Mare-MAGE curated reference database of fish mitochondrial genes. BMC Genomic Data24, 18. doi: 10.1186/s12863-023-01119-4
58
Kasmi Y. Nunez-Riboni I. Blancke T. Möckel B. Bernreuther M. Stransky C. et al . (2025). Fish diversity assessment and semi-quantitative biomass estimation through metabarcoding of environmental DNA. Ecol. Indic.173, 113406. doi: 10.1016/j.ecolind.2025.113406
59
Knudsen S. W. Ebert R. B. Hesselsøe M. Kuntke F. Hassingboe J. Mortensen P. B. et al . (2019). Species-specific detection and quantification of environmental DNA from marine fishes in the Baltic Sea. J. Exp. Mar. Biol. Ecol.510, 31–45. doi: 10.1016/j.jembe.2018.09.004
60
Krupskii P. Joe H. (2013). Factor copula models for multivariate data. J. Multivariate Anal.120, 85–101. doi: 10.1016/j.jmva.2013.05.001
61
Kumar G. Reaume A. M. Farrell E. Gaither M. R. (2022). Comparing eDNA metabarcoding primers for assessing fish communities in a biodiverse estuary. PloS One17, e0266720. doi: 10.1371/journal.pone.0266720
62
Lacoursière-Roussel A. Côté G. Leclerc V. Bernatchez L. (2016). Quantifying relative fish abundance with eDNA: a promising tool for fisheries management. J. Appl. Ecol.53, 1148–1157. doi: 10.1111/1365-2664.12598
63
Lamb P. D. Hunter E. Pinnegar J. K. Creer S. Davies R. G. Taylor M. I. (2019). How quantitative is metabarcoding: A meta-analytical approach. Mol. Ecol.28, 420–430. doi: 10.1111/mec.14920
64
Lambert D. (1992). Zero-inflated Poisson regression, with an application to defects in manufacturing. Technometrics34, 1–14. doi: 10.1080/00401706.1992.10485228
65
Legendre P. Gallagher E. D. (2001). Ecologically meaningful transformations for ordination of species data. Oecologia129, 271–280. doi: 10.1007/s004420100716
66
Lehman A. (2005). JMP for basic univariate and multivariate statistics: a step-by-step guide (Cary, NC: SAS Press), 123, ISBN: 978-1-59047-576-8.
67
Maiello G. Talarico L. Brodie C. Carpentieri P. Sbrana A. Shum P. et al . (2024). Net gain: Low-cost, trawl-associated eDNA samplers upscale ecological assessment of marine demersal communities. Environ. DNA6, e389. doi: 10.1002/edn3.389
68
Maiello G. Talarico L. Carpentieri P. De Angelis F. Franceschini S. Harper L. R. et al . (2022). Little samplers, big fleet: eDNA metabarcoding from commercial trawlers enhances ocean monitoring. Fisheries Res.249, 106259. doi: 10.1016/j.fishres.2022.106259
69
Margalef R. (1958). Information theory in ecology. Gen. Syst.3, 36–71.
70
Martin M. (2011). Cutadapt removes adapter sequences from high-throughput sequencing reads. EMBnet. J.17, 10–12. doi: 10.14806/ej.17.1.200
71
McCartin L. J. Vohsen S. A. Ambrose S. W. Layden M. McFadden C. S. Cordes E. E. et al . (2022). Temperature controls eDNA persistence across physicochemical conditions in seawater. Environ. Sci. Technol.56, 8629–8639. doi: 10.1021/acs.est.2c01672
72
McCullagh P. (1989). Generalized Linear Models. 2nd ed (Routledge, New York: Routledge). 532. doi: 10.1201/9780203753736
73
Miya M. Sato Y. Fukunaga T. Sado T. Poulsen J. Y. Sato K. et al . (2015). MiFish, a set of universal PCR primers for metabarcoding environmental DNA from fishes: detection of more than 230 subtropical marine species. R. Soc. Open Sci.2, 150088. doi: 10.1098/rsos.150088
74
Moreno C. E. Halffter G. (2000). Assessing the completeness of bat biodiversity inventories using species accumulation curves. J. Appl. Ecol.37, 149–158. doi: 10.1046/j.1365-2664.2000.00483.x
75
Mullahy J. (1986). Specification and testing of some modified count data models. J. Econometrics33, 341–365. doi: 10.1016/0304-4076(86)90002-3
76
Nelsen R. B. (2006). “ Dependence,” in An Introduction to Copulas. Springer Series in Statistics ( Springer, New York, NY). doi: 10.1007/0-387-28678-0_5
77
Nneji L. M. Oladipo S. O. Nneji I. C. Atofarati O. T. Asiamah M. K. Adelakun K. M. (2025). Evaluating eDNA metabarcoding for fish biodiversity assessment in Nigerian aquatic ecosystems: potential, limitations, and comparisons with traditional methods. J. Freshw. Ecol.40, 2541689. doi: 10.1080/02705060.2025.2541689
78
Oguz T. (2017). Controls of multiple stressors on the Black Sea fishery. Front. Mar. Sci.4. doi: 10.3389/fmars.2017.00110
79
Oksanen J. Blanchet F. G. Kindt R. Legendre P. Minchin P. R. O’hara R. B. et al . (2013). “ Package ‘vegan’,” in Community ecology package, vol. 2, 1–295. Available online at: http://cc.oulu.fi/~jarioksa/ (Accessed January 1, 2024).
80
Orlova S. Y. Emelyanova O. R. Nebesikhina N. A. Rabazanov N. I. Orlov A. M. (2024). The problems of DNA-barcoding the shads of genus alosa (Alosidae) of the ponto-caspian basin. J. Ichthyology64, 510–520. doi: 10.1134/S0032945224700188
81
Osathanunkul M. Suwannapoom C. (2023). Sustainable fisheries management through reliable restocking and stock enhancement evaluation with environmental DNA. Sci. Rep.13, 11297. doi: 10.1038/s41598-023-38218-2
82
Panayotova M. Todorova V. (2015). Diversity and community structure of fish in the Bulgarian Black Sea shelf area. J. Res. Agri Anim. Sci.3, 7–14.
83
Parsley M. B. Crespi E. J. Rittenhouse T. A. Brunner J. L. Goldberg C. S. (2024). Environmental DNA concentrations vary greatly across productive and degradative conditions, with implications for the precision of population estimates. Sci. Rep.14, 17392. doi: 10.1038/s41598-024-66732-4
84
Peixoto S. Mota-Ferreira M. Chaves C. Velo-Antón G. Beja P. Egeter B. (2023). Multi-species occupancy modeling reveals methodological and environmental effects on eDNA detection of amphibians in temporary ponds. Environ. DNA5, 796–811. doi: 10.1002/edn3.443
85
Perry A. L. Low P. J. Ellis J. R. Reynolds J. D. (2005). Climate change and distribution shifts in marine fishes. Science308, 1912–1915. doi: 10.1126/science.1111322
86
Pörtner H. O. Peck M. A. (2010). Climate change effects on fishes and fisheries: towards a cause-and-effect understanding. J. Fish Biol.77, 1745–1779. doi: 10.1111/j.1095-8649.2010.02783.x
87
Radulescu V. (2023). RETRACTED: environmental conditions and the fish stocks situation in the black sea, between climate change, war, and pollution. Water15, 1012. doi: 10.3390/w15061012
88
Raykov V. Yankova M. Ivanova P. Mihneva V. Dimitrov D. Stefanova K. et al . (2020). Pelagic Trawl Surveys in the BULGARIAn Marine Area 2017–2019 (Sofia, Bulgaria: Marin Drinov Publishing House of BAS), 278, ISBN: 978-619-245-070-0.
89
R Core Team (2021). R: A language and environment for statistical computing (Vienna, Austria: R Foundation for Statistical Computing). Available online at: https://www.R-project.org/.
90
Rigby R. A. Stasinopoulos D. M. (2005). Generalized additive models for location, scale and shape. J. R. Stat. Soc. Ser. C: Appl. Stat54, 507–554. doi: 10.1111/j.1467-9876.2005.00510.x
91
Rishan S. T. Kline R. J. Rahman M. S. (2023). Applications of environmental DNA (eDNA) to detect subterranean and aquatic invasive species: A critical review on the challenges and limitations of eDNA metabarcoding. Environ. Adv.12, 100370. doi: 10.1016/j.envadv.2023.100370
92
Rourke M. L. Fowler A. M. Hughes J. M. Broadhurst M. K. DiBattista J. D. Fielder S. et al . (2022). Environmental DNA (eDNA) as a tool for assessing fish biomass: A review of approaches and future considerations for resource surveys. Environ. DNA4, 9–33. doi: 10.1002/edn3.185
93
Ruppert K. M. Kline R. J. Rahman M. S. (2019). Past, present, and future perspectives of environmental DNA (eDNA) metabarcoding: A systematic review in methods, monitoring, and applications of global eDNA. Global Ecol. Conserv.17, e00547. doi: 10.1016/j.gecco.2019.e00547
94
Russo T. Maiello G. Talarico L. Baillie C. Colosimo G. D'Andrea L. et al . (2021). All is fish that comes to the net: metabarcoding for rapid fisheries catch assessment. Ecol. Appl.31, e02273. doi: 10.1002/eap.2273
95
Sahu A. Kumar N. Singh C. P. Singh M. (2023). Environmental DNA (eDNA): Powerful technique for biodiversity conservation. J. Nat. Conserv.71, 126325. doi: 10.1016/j.jnc.2022.126325
96
Sahu A. Singh M. Amin A. Malik M. M. Qadri S. N. Abubakr A. et al . (2025). A systematic review on environmental DNA (eDNA) Science: An eco-friendly survey method for conservation and restoration of fragile ecosystems. Ecol. Indic.173, 113441. doi: 10.1016/j.ecolind.2025.113441
97
Salter I. Joensen M. Kristiansen R. Steingrund P. Vestergaard P. (2019). Environmental DNA concentrations are correlated with regional biomass of Atlantic cod in oceanic waters. Commun. Biol.2, 461. doi: 10.1038/s42003-019-0696-8
98
Shono H. (2008). Application of the Tweedie distribution to zero-catch data in CPUE analysis. Fisheries Res.93, 154–162. doi: 10.1016/j.fishres.2008.03.006
99
Simpson E. H. (1949). Measurement of diversity. Nature163, 688–688. doi: 10.1038/163688a0
100
Spellerberg I. F. Fedor P. J. (2003). A tribute to Claude Shannon (1916–2001) and a plea for more rigorous use of species richness, species diversity and the ‘Shannon–Wiener’Index. Global Ecol. Biogeography12, 177–179. doi: 10.1046/j.1466-822X.2003.00015.x
101
Stasinopoulos M. D. Rigby R. A. Heller G. Z. Voudouris V. De Bastiani F. (2017). Flexible regression and smoothing: using GAMLSS in R (p. 549). CRC Press, Taylor & Francis Group.
102
Stoeckle M. Y. Adolf J. Charlop-Powers Z. Dunton K. J. Hinks G. VanMorter S. M. (2021). Trawl and eDNA assessment of marine fish diversity, seasonality, and relative abundance in coastal New Jersey, USA. ICES J. Mar. Sci.78, 293–304. doi: 10.1093/icesjms/fsaa225
103
Stone M. (1974). Cross-validation and multinomial prediction. Biometrika61, 509–515. doi: 10.2307/2334733
104
Strickler K. M. Fremier A. K. Goldberg C. S. (2015). Quantifying effects of UV-B, temperature, and pH on eDNA degradation in aquatic microcosms. Biol. Conserv.183, 85–92. doi: 10.1016/j.biocon.2014.11.038
105
Suren A. M. Burdon F. J. Wilkinson S. P. (2024). eDNA is a useful environmental monitoring tool for assessing stream ecological health. Environ. DNA6, e596. doi: 10.1002/edn3.596
106
Thomsen P. F. Kielgast J. Iversen L. L. Møller P. R. Rasmussen M. Willerslev E. (2012). Detection of a diverse marine fish fauna using environmental DNA from seawater samples. PloS One7, e41732. doi: 10.1371/journal.pone.0041732
107
Thomsen P. F. Møller P. R. Sigsgaard E. E. Knudsen S. W. Jørgensen O. A. Willerslev E. (2016). Environmental DNA from seawater samples correlate with trawl catches of subarctic, deepwater fishes. PloS One11, e0165252. doi: 10.1371/journal.pone.0165252
108
Tillotson M. D. Kelly R. P. Duda J. J. Hoy M. Kralj J. Quinn T. P. (2018). Concentrations of environmental DNA (eDNA) reflect spawning salmon abundance at fine spatial and temporal scales. Biol. Conserv.220, 1–11. doi: 10.1016/j.biocon.2018.01.030
109
Trenkel V. M. Vaz S. Albouy C. Amour A. B. Duhamel E. Laffargue P. et al . (2019). We can reduce the impact of scientific trawling on marine ecosystems. Mar. Ecol. Prog. Ser.609, 277–282. doi: 10.3354/meps12834
110
Trick S. Rothkopf C. A. Jäkel F. (2023). A normative model for Bayesian combination of subjective probability estimates. Judgment Decision Making18, e40. doi: 10.1017/jdm.2023.39
111
Tserkova F. (2013). Growth parameters of the Black Sea sprat (Sprattus sprattus L.) during the period November 2010–March 2012 along the Bulgarian Black Sea coast. Bulgarian J. Agric. Sci.19, 109–113.
112
Tsuji S. Inui R. Nakao R. Miyazono S. Saito M. Kono T. et al . (2022). Quantitative environmental DNA metabarcoding shows high potential as a novel approach to quantitatively assess fish community. Sci. Rep.12, 21524. doi: 10.1038/s41598-022-25274-3
113
Tsuji S. Shibata N. Inui R. Nakao R. Akamatsu Y. Watanabe K. (2023). Environmental DNA phylogeography: Successful reconstruction of phylogeographic patterns of multiple fish species from cups of water. Mol. Ecol. Resour.23, 1050–1065. doi: 10.1111/1755-0998.13772
114
Valsecchi E. Arcangeli A. Lombardi R. Boyse E. Carr I. M. Galli P. et al . (2021). Ferries and environmental DNA: Underway sampling from commercial vessels provides new opportunities for systematic genetic surveys of marine biodiversity. Front. Mar. Sci.8. doi: 10.3389/fmars.2021.704786
115
Veron P. Rozanski R. Marques V. Joost S. Deschez M. E. Trenkel V. M. et al . (2023). Environmental DNA complements scientific trawling in surveys of marine fish biodiversity. ICES J. Mar. Sci.80, 2150–2165. doi: 10.1093/icesjms/fsad139
116
Warton D. I. (2005). Many zeros does not mean zero inflation: comparing the goodness-of-fit of parametric models to multivariate abundance data. Environmetrics16, 275–289. doi: 10.1002/env.702
117
Westgaard J. I. Præbel K. Arneberg P. Ulaski B. P. Ingvaldsen R. Wangensteen O. S. et al . (2024). Towards eDNA informed biodiversity studies–Comparing water derived molecular taxa with traditional survey methods. Prog. Oceanography222, 103230. doi: 10.1016/j.pocean.2024.103230
118
Wickham H. (2016). “ ggplot2: Elegant Graphics for Data Analysis (New York: Springer-Verlag). Available online at: https://ggplot2.tidyverse.org.
119
Williams M. A. O’Grady J. Ball B. Carlsson J. De Eyto E. McGinnity P. et al . (2019). The application of CRISPR-Cas for single species identification from environmental DNA. Mol. Ecol. Resour.19, 1106–1114. doi: 10.1111/1755-0998.13045
120
Wood S. N. (2001). mgcv: GAMs and generalized ridge regression for R. R news1, 20–25.
121
Wood S. N. (2017). Generalized Additive Models: An Introduction with R. 2nd ed (New York: Chapman and Hall/CRC). doi: 10.1201/9781315370279
122
Wood S. Wood M. S. (2015). Package ‘mgcv’. R package version1, 729. Available online at https://cran.r-project.org/web/packages/mgcv/index.html.
123
Xiong F. Shu L. Zeng H. Gan X. He S. Peng Z. (2022). Methodology for fish biodiversity monitoring with environmental DNA metabarcoding: The primers, databases and bioinformatic pipelines. Water Biol. Secur.1, 100007. doi: 10.1016/j.watbs.2022.100007
124
Yang N. Jin D. Govindarajan A. F. (2024). Applying environmental DNA approaches to inform marine biodiversity conservation: the case of the ocean twilight zone. Mar. Policy165, 106151. doi: 10.1016/j.marpol.2024.106151
125
Yankova M. Pavlov D. Ivanova P. Karpova E. Boltachev A. Öztürk B. et al . (2014). Marine fishes in the Black Sea: recent conservation status. Mediterr. Mar. Sci.15, 366–379. doi: 10.12681/mms.700
126
Yates M. C. Glaser D. M. Post J. R. Cristescu M. E. Fraser D. J. Derry A. M. (2019). Meta‐analysis supports further refinement of eDNA for monitoring aquatic species‐specific abundance in nature. Environmental DNA, 1(1), 5–13. doi: 10.1002/edn3.7
127
Yeung K. Y. Bumgarner R. E. Raftery A. E. (2005). Bayesian model averaging: development of an improved multi-class, gene selection and classification tool for microarray data. Bioinformatics21, 2394–2402. doi: 10.1093/bioinformatics/bti319
128
Zhang S. Zhao J. Yao M. (2020). A comprehensive and comparative evaluation of primers for metabarcoding eDNA from fish. Methods Ecol. Evol.11, 1609–1625. doi: 10.1111/2041-210X.13485
129
Zhang H. Zhou Y. Zhang H. Gao T. Wang X. (2022). Fishery resource monitoring of the East China Sea via environmental DNA approach: a case study using black sea bream (Acanthopagrus schlegelii). Front. Mar. Sci.9. doi: 10.3389/fmars.2022.848950
130
Zuur A. F. Ieno E. N. Walker N. J. Saveliev A. A. Smith G. M. (2009). Mixed effects models and extensions in ecology with R Vol. 574 (New York: Springer), 574. doi: 10.1007/978-0-387-87458-6
Summary
Keywords
metabarcoding, fish diversity, biodiversity, hierarchical Bayesian model, marker sensitivity
Citation
Ivanova P, Zlateva I, Dzhembekova N, Popov I, Raykov V, Dimitrov D, Mihova S, Raev Y and Stefanova K (2025) A study of feasibility and detection sensitivity of environmental DNA for fish biodiversity monitoring and stock assessment in the Black Sea. Front. Mar. Sci. 12:1648741. doi: 10.3389/fmars.2025.1648741
Received
17 June 2025
Revised
24 October 2025
Accepted
10 November 2025
Published
26 November 2025
Volume
12 - 2025
Edited by
Satya Panigrahi, Indira Gandhi Centre for Atomic Research (IGCAR), India
Reviewed by
David José Nachón, Spanish Institute of Oceanography (IEO), Spain
Clara F. Rodrigues, University of Aveiro, Portugal
Updates
Copyright
© 2025 Ivanova, Zlateva, Dzhembekova, Popov, Raykov, Dimitrov, Mihova, Raev and Stefanova.
This is an open-access article distributed under the terms of the Creative Commons Attribution License (CC BY). The use, distribution or reproduction in other forums is permitted, provided the original author(s) and the copyright owner(s) are credited and that the original publication in this journal is cited, in accordance with accepted academic practice. No use, distribution or reproduction is permitted which does not comply with these terms.
*Correspondence: Ivelina Zlateva, ibikarska@yahoo.com; Petya Ivanova, pavl_petya@yahoo.com
Disclaimer
All claims expressed in this article are solely those of the authors and do not necessarily represent those of their affiliated organizations, or those of the publisher, the editors and the reviewers. Any product that may be evaluated in this article or claim that may be made by its manufacturer is not guaranteed or endorsed by the publisher.