 Aryan Safaie
 Kathleen A. Donohue
 Clark D. Rowley
 Prasad G. Thoppil
 D. Randolph Watts
- 1Graduate School of Oceanography, University of Rhode Island, Narragansett, RI, United States
- 2Ocean Sciences Division, Naval Research Laboratory, Stennis Space Center, MS, United States
In the Gulf of Mexico (GoM), as the warm Loop Current (LC) extends into the southeastern Gulf, strong deep eddies are energized through LC interaction with topography and baroclinic instability. A 6-year free-running numerical simulation using a regional configuration of the Navy Coastal Ocean Model (NCOM) shows the importance of deep cyclones to Loop Current Eddy (LCE) formation, particularly in the deep region south of 25°N, circumscribed by the Yucatán Strait to the south and the steep lateral sidewalls of the Campeche Bank and the Florida Shelf to the west and east, respectively. Four eddy shedding events from this simulation illustrate ways that deep cyclones develop and strengthen jointly from baroclinic development as well as from lower-layer stretching when the LC moves away from the channel sidewalls. In all cases, the deep cyclone plays a key role: one event depicts the classic baroclinic joint-development process; two events demonstrate the influence of the steep bathymetry along the Campeche Bank and Florida Shelf in restricting lateral propagation; the fourth event emphasizes the role of a deep cyclone in preventing reattachment of a detached eddy. As deep cyclones are important in determining LCE separation, we advocate for more observation and modeling attention on the dynamics of the deep southeast channel.
1 Introduction
Throughout the Gulf of Mexico (GoM), the Loop Current (LC) drives essentially all mesoscale oceanographic variability (Lugo-Fernández et al., 2016; Hamilton et al., 2016). The LC enters the GoM through the Yucatán Strait from the Caribbean Sea as a warm and salty jet (Sturges and Leben, 2000), and on irregular intervals of approximately 3–18 months, it pinches off an anticyclonic Loop Current Eddy (LCE) that moves separately to the north and west (Leben, 2005). The LC and LCEs carry strong currents that can be particularly disruptive to offshore marine operations along the northern Gulf (Kantha, 2014), and additionally, if a hurricane passes over the LC or an LCE, the excess heat in their near-surface waters causes intensification (Le Hénaff et al., 2021). These several effects prioritize an understanding of the dynamics of the LC system to promote public safety.
A sequence of historical efforts have observationally, theoretically, and numerically investigated mechanisms that extend the LC farther into the GoM together with the processes by which LCEs are shed (Pichevin and Nof, 1997; Hurlburt and Thompson, 1982; Schmitz, 2005; Oey et al., 2005). Much recent focus has been on near-surface observations and dynamics, seeking to develop improved forecasting ability for LCE separation (Dukhovskoy et al., 2023; Ernst et al., 2023). In contrast, knowledge of the processes governing the deep circulation remains elusive, though it is clear that observed deep near-bottom eddy variability can be strong (∼ 0.1 − 0.4 m s−1) in much of the GoM and almost never quiescent (Donohue et al., 2016b; Johnson et al., 2022; Furey et al., 2018; Pérez-Brunius et al., 2018). Numerical models have typically underestimated the deep eddy kinetic energy by a factor of three or more (Rosburg et al., 2016; Morey et al., 2020).
Observations have illustrated ways that the upper and deep GoM interact. To leading order, the circulation in the GoM is characterized by two vertical modes (Hamilton, 2009; Hamilton et al., 2016; Pérez-Brunius et al., 2018), with one describing the strong upper baroclinic currents associated with the LC and LCEs, and the second mode being nearly depth-independent from sea surface to the bottom (Inoue et al., 2008; Welsh et al., 2009; Hamilton et al., 2011). Together these two modes were found to account for ∼ 98% of the variance of subinertial currents in the central GoM (Donohue et al., 2016b). Mutual upper-deep coupling mechanisms are the focus of this paper.
Observing the characteristic signatures of upper-deep coupling requires measurements of currents at multiple levels spanning the upper and deep water column, and is facilitated by mapping arrays of the pressure stream function fields in the near surface and at depth. Such datasets have generally been confined to latitudes north of 25.5°N (Hamilton et al., 2015). Additionally, numerical modeling efforts have not focused south of this latitude; however Hurlburt (1986) and Oey (2008) suggested that the region immediately north of Campeche Bank, where the LC enters deeper water (Figure 1), is an important area for generation of deep eddies. Large mean-to-eddy energy conversion rates appear there along the western edge of the Loop Current as the current moves off the Campeche Bank into the deep topography of the Gulf.
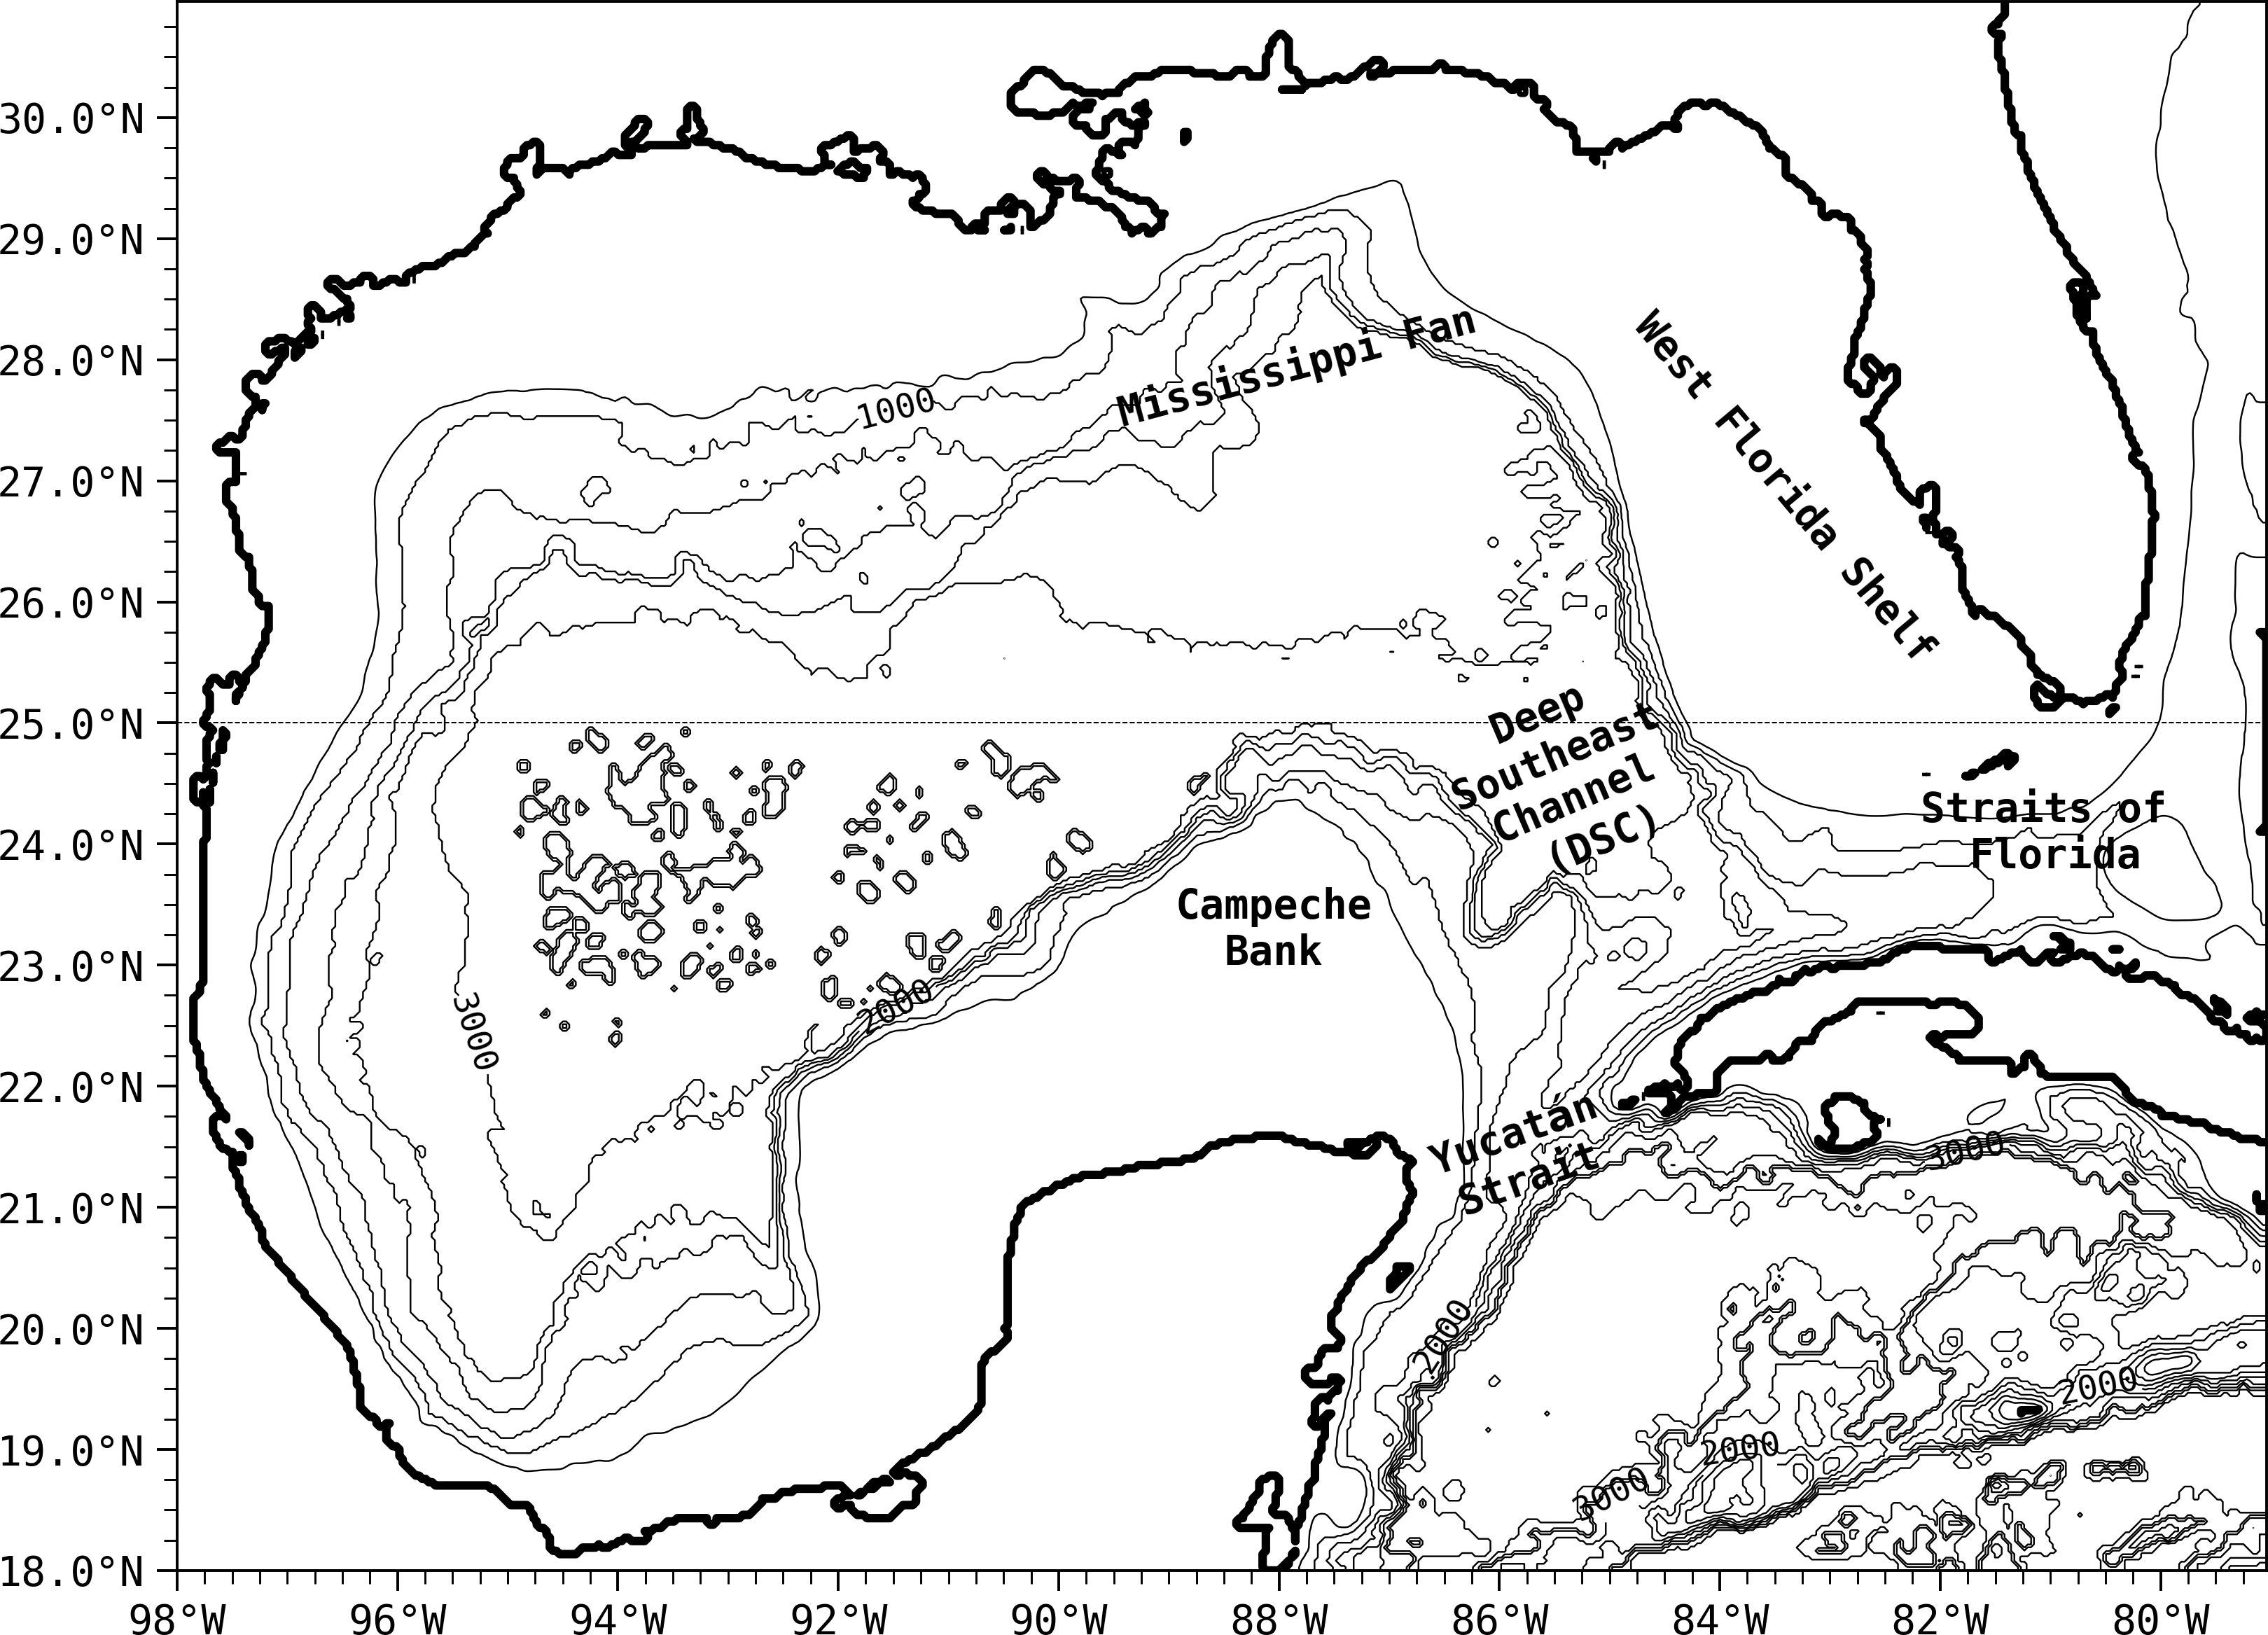
Figure 1. Map of the model domain and bathymetry (contoured every 500 m), with common physiographic features labeled accordingly. For the purpose of this study, the region south of approximately 25°N between the Campeche Bank and West Florida Shelf is referred to as the Deep Southeast Channel (DSC).
Complementing that earlier work, this paper highlights upper-deep interactions further south, in a region that has not been examined before. A 6-year free-running numerical simulation using a regional configuration of the Navy Coastal Ocean Model (NCOM), to be described in Section 2, shows the importance of deep cyclones to LCE formation, particularly in the narrowly confined deep region south of 25°N, circumscribed by the Yucatán Strait to the south and the steep lateral sidewalls of the Campeche Bank and the Florida Shelf to the west and east, respectively. Section 3 discusses deep eddies and vertical stretching. The model run highlights four southern separation events, as presented in Section 4. They illustrate ways that deep cyclones develop and strengthen from baroclinic joint development as well as from lower-layer stretching when the LC moves away from the steep channel sidewalls. Section 5 summarizes results.
2 Numerical model
We use the Navy Coastal Ocean Model (NCOM) Version 4.3 (Martin et al., 2009), a primitive equation, hydrostatic model with the Boussinesq approximation. This model and configuration underpin an ensemble forecast system for the Gulf of Mexico Thoppil et al. (2025). Therefore, the model architecture, basic state, and performance have been tested and verified. We have selected case studies that are representative of LCE separations in the Deep Southeast Channel. The model uses a staggered Arakawa-C grid that extends from 18°N to 31°N and 98°W to 79°W with a 3 km horizontal resolution on a spherical projection. In the vertical, there is a 35 layer terrain-following (free-σ) grid in the upper 500 m with bottom cells “shaved” as needed to match bathymetry, and below that are 15 z-levels. Within the Loop Current region, the surface and bottom cells are approximately 0.5 and 500 m thick, respectively.
Vertical mixing is parameterized using the Mellor-Yamada Level 2 closure model (Mellor and Yamada, 1974, 1982). A logarithmic bottom boundary layer is assumed, and bottom drag is computed with a spatially constant roughness length of 1 cm. All advection schemes are 2nd order and no tidal forcing is prescribed. Open boundary conditions are specified by the global 1/12° 41-layer Hybrid Coordinate Ocean Model (HYCOM) with the Naval Research Lab Coupled Ocean Data Assimilation (NCODA) System, together known as the Global Ocean Forecasting System (GOFS) version 3.1 (Metzger et al., 2014). The model was initiated from the year 2018 after a deep salinity offset had been corrected in GOFS 3.1. Deep temperature and salinity fields were relaxed to the U.S. Navy Generalized Digital Environment Model (GDEM) version 3.0 (Carnes et al., 2010). Meteorological forcing is from the Navy Global Environmental Model (Hogan et al., 2014). Model output (currents and sea surface height) were 4-day low-pass filtered for analysis. The model integration is run without data assimilation to forecast Loop Current eddies for comparison with observations. Instead our purpose is to illustrate the free-running dynamics that occur within the whole water column around the LC during its naturally occurring extension, detachment/reattachment, and separation cycle.
To represent the deep eddies, we extract the deep reference pressure (scaled hydrostatically to its equivalent sea surface height) after decomposing the total model sea surface height anomaly (ηtot) as the sum of deep reference (ηref) and steric (ηsteric) components:
where ηsteric is equal to the geopotential height anomaly, ϕ, divided by the acceleration of gravity, g. To compute ϕ, we integrate the specific volume anomaly, from the sea surface (P1 = 0 dbar) to a constant reference pressure of P2 = 2023 dbar (a convenient reference pressure in the model):
Here P is pressure, ρ is density, S is salinity, T is temperature, and S0 and T0 are reference values of 35 psu and 0°C, respectively. Hence, ηref is the perturbation height of the reference pressure surface, calculated as the difference between ηtot and integrated in the following case-studies from the sea surface down to 2023 dbar.
Three sources of observations were obtained with which to compare model output. In situ observations consist of ∼ 4000 CTD and Argo float profiles, from approximately 82.9°W and 23.3°N to 87.5°W and 28.6°N in the eastern GoM, and from 87.5°W and 23.9°N to 96.1°W and 28.6°N in the western GoM. Besides the majority of profiles shallower than 2000 m that were provided by the Argo float program between 2010 and 2021, the bulk of the deep data came from shipboard CTDs in the Exploratory Study of Deepwater Currents in the Gulf of Mexico (Donohue et al., 2006). These were supplemented by hydrocasts, National Oceanic and Atmospheric Administration (NOAA) casts during the Deepwater Horizon oil spill, and observations from the Center for Scientific Research and Higher Education at Ensenada (CICESE; Donohue et al., 2016a). For comparison, both model output and hydrographic profiles were averaged in two separate and narrow ranges of geostrophic stream function (ϕ in Equation 2), to distinguish between inside and outside the warm core of the LC. Profiles of salinity are shown in Figure 2. Outside of the LC, the modeled salinity demonstrates a small fresh bias, while inside the LC, the model is notably fresh by approximately 0.3 psu near the ∼200 m depth Subtropical Underwater (SUW) salinity maximum.
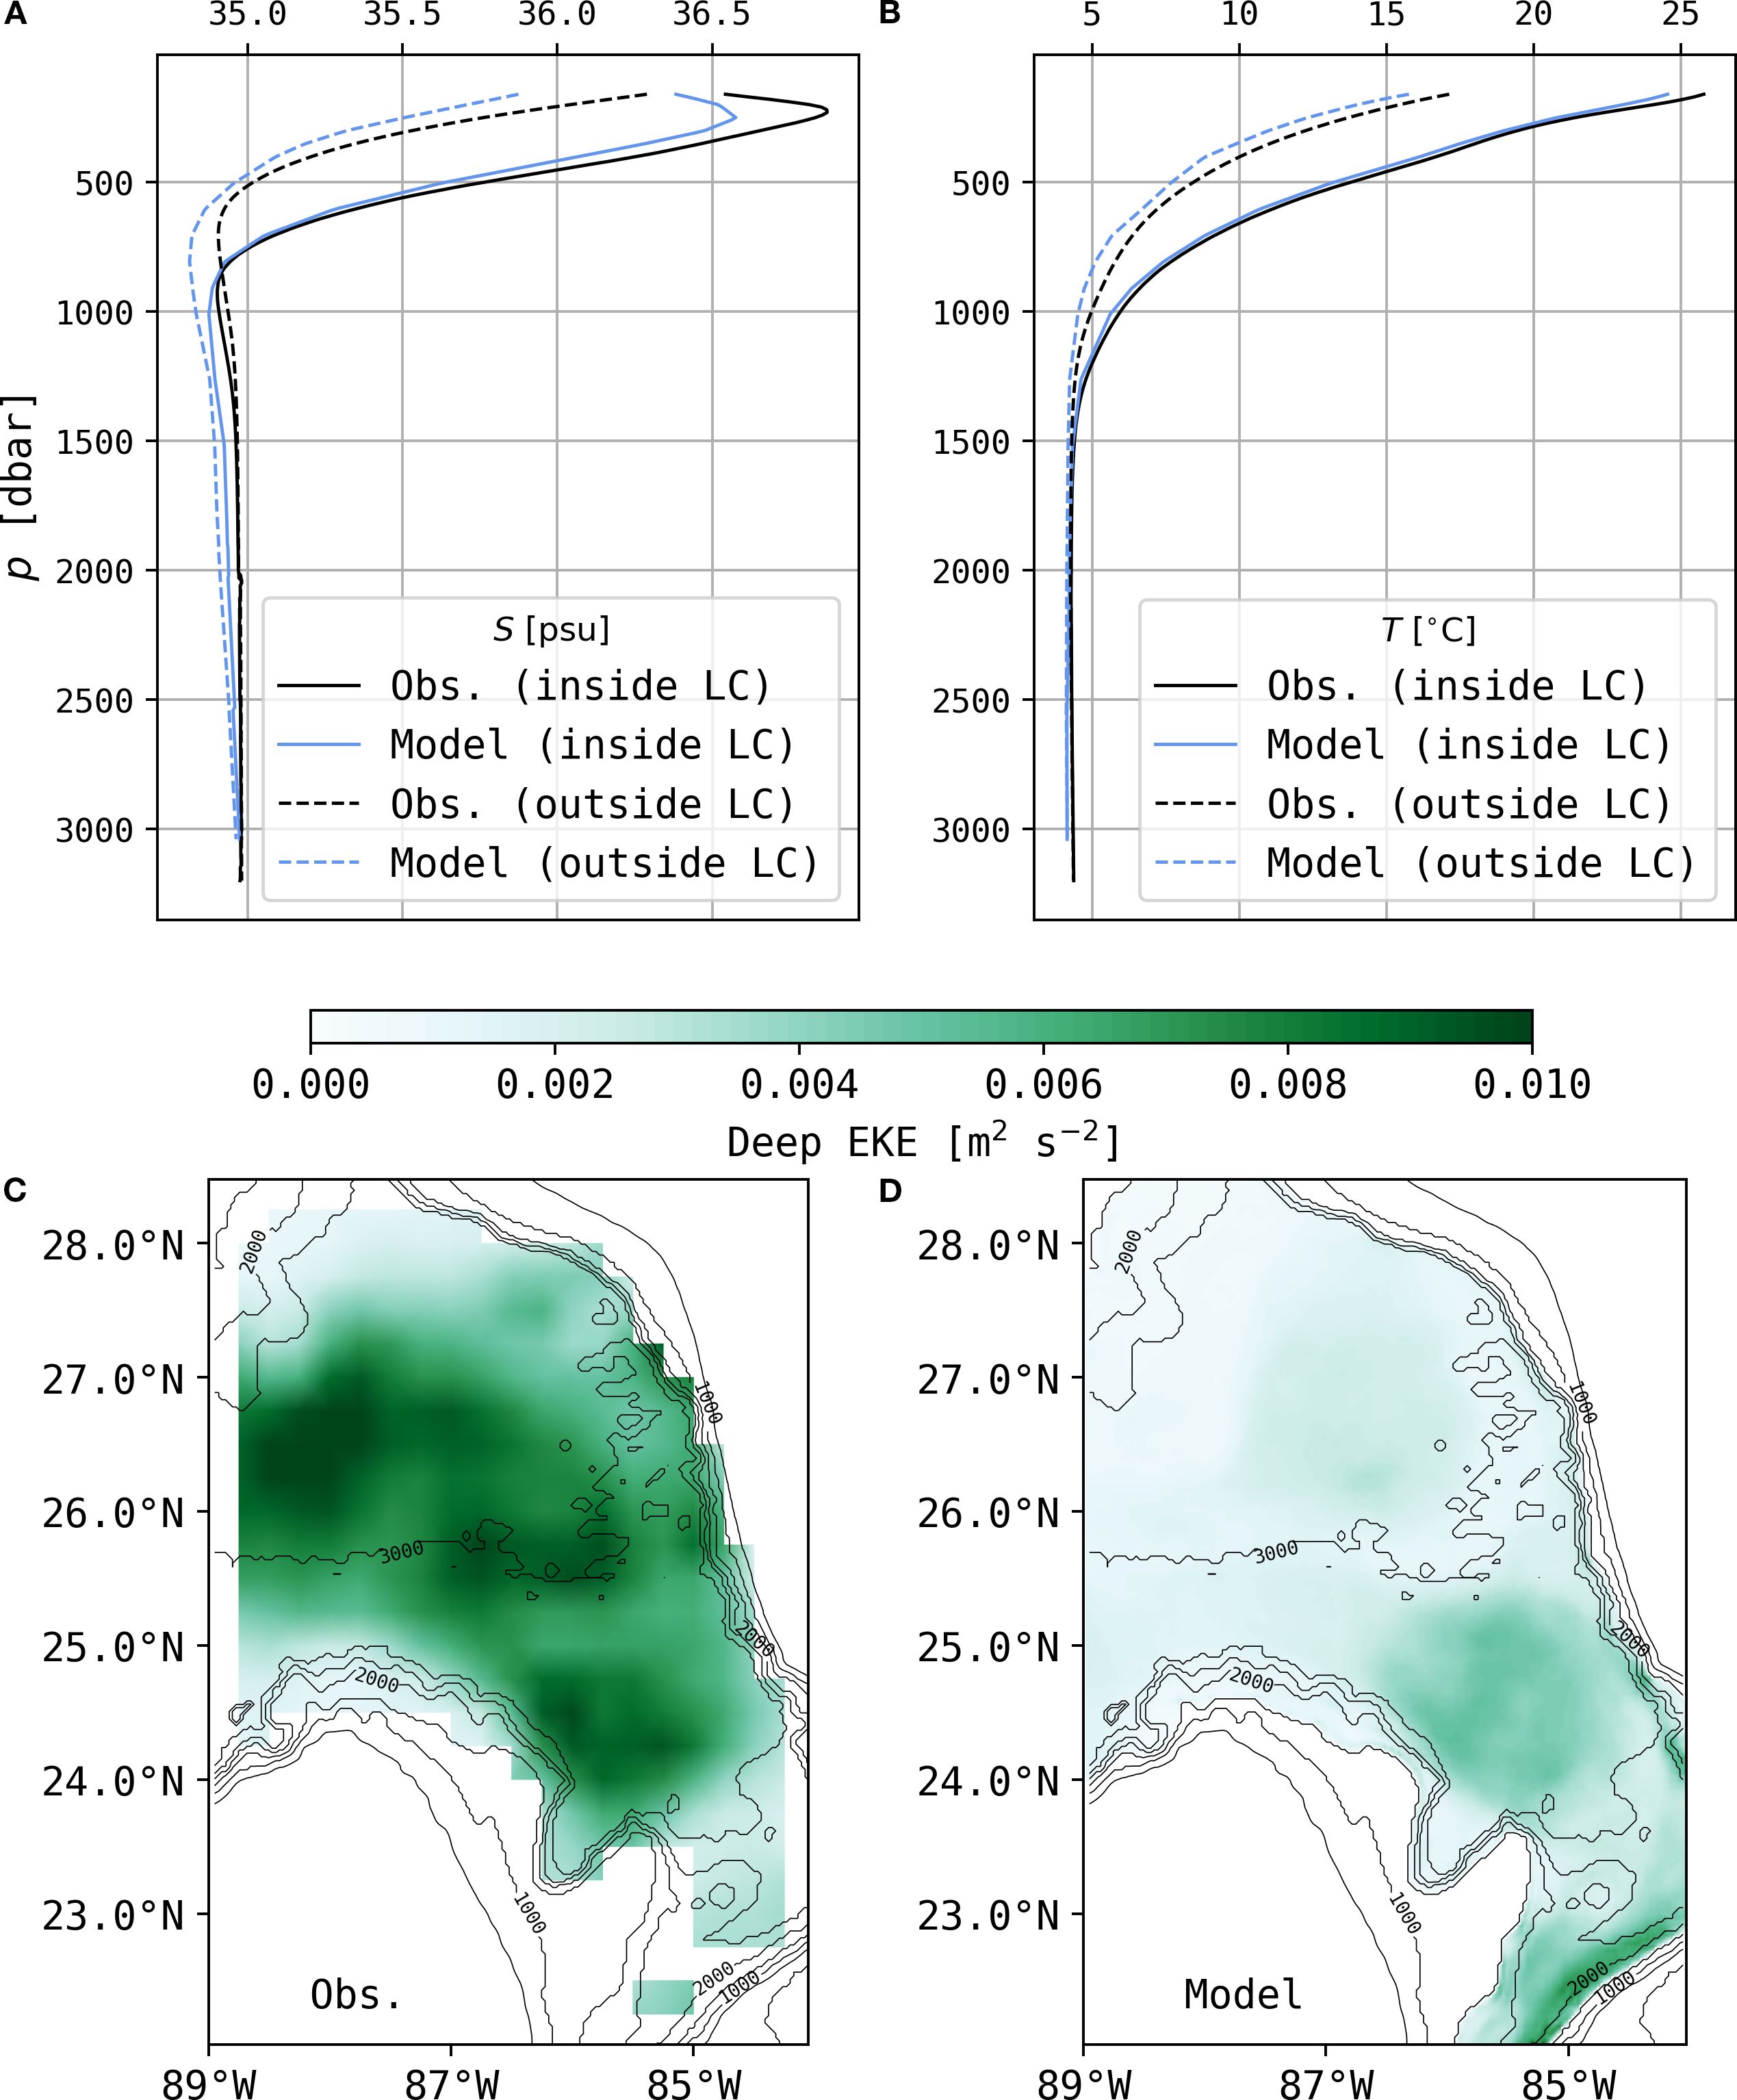
Figure 2. Comparison of model results to in situ observations: (A) Profiles of salinity averaged along geostrophic stream functions representative of waters inside (ϕ = 18 m2 s−2) and outside (ϕ = 13 m2 s−2) the LC; (B) Temperature profiles averaged along the same two sets of geostrophic streamlines; (C) Time-averaged eddy kinetic energy (EKE) from 1500–2500 m gridded float data (Pérez-Brunius et al., 2018, available at https://opendata.boem.gov/GriddedFields_1500m_floats_CF.nc); (D) 6 year time-averaged EKE at 1500 m from model output.
We have evaluated altimeter-derived SSH standard deviation (not shown) for the years 2018-2023. The magnitudes are comparable, and maximum standard deviations are near 0.28 m and are associated with the LC retreating and extending into the Gulf. The model has smaller SSH standard deviation northwest of 25°N compared to the altimeter data, which simply corresponds to the present set of cases considered here where southern separations are favored.
Leben (2005) showed that the separation period was influenced by LC retreat, with a bimodal distribution: when the LC retreats south of 25°N, the average separation period for subsequent separations was 16.2 months – longer than the case when the LC retreats north of 25°N. The present model runs for 6 years and has 6 separations, four of which are detailed in this work. From simulated years 2019 to 2022, four sequential separations occurred where the LC retreated south of 25°N. These separation intervals are on par with the Leben (2005) altimeter-based observations that ranged from 1 to 18 months.
To compare the eddy kinetic energy (EKE) of deep currents, gridded float data from 1500–2500 m were obtained from the Bureau of Ocean Energy Management (BOEM). For the gridded data, EKE was estimated as half of the sum of the variance along the major and minor current variance ellipse axes (Pérez-Brunius et al., 2018). Time-averaged EKE for the gridded and model data is shown in Figures 2C, D. The observed deep EKE in the southeastern GoM is approximately 2–3 times larger than that computed from the model. This low bias is similar to underestimates of deep EKE observed in other models (Rosburg et al., 2016; Morey et al., 2020). Nevertheless, we will demonstrate that characteristics of baroclinic instability processes are realistically depicted in the present model.
3 Deep eddies and vertical stretching
The time-averaged deep pressure field (ηref) from the numerical simulation shows that the prominent feature in the southeastern GoM is a deep cyclone that spans the width of the local sub-basin (Figure 3A). We refer to this deep basin south of 25°N, circumscribed by the Yucatán Strait to the south and the steep lateral sidewalls of the Campeche Bank and the Florida Shelf to the west and east, respectively, as the Deep Southeast Channel, or DSC (Figure 1). From six years of model output, the average deep reference height within the deep cyclone shown in Figure 3A is -0.0076 m, and its amplitude ranges from ∼ +0.06 m to ∼ −0.10 m during eddy shedding events (Figure 3B).
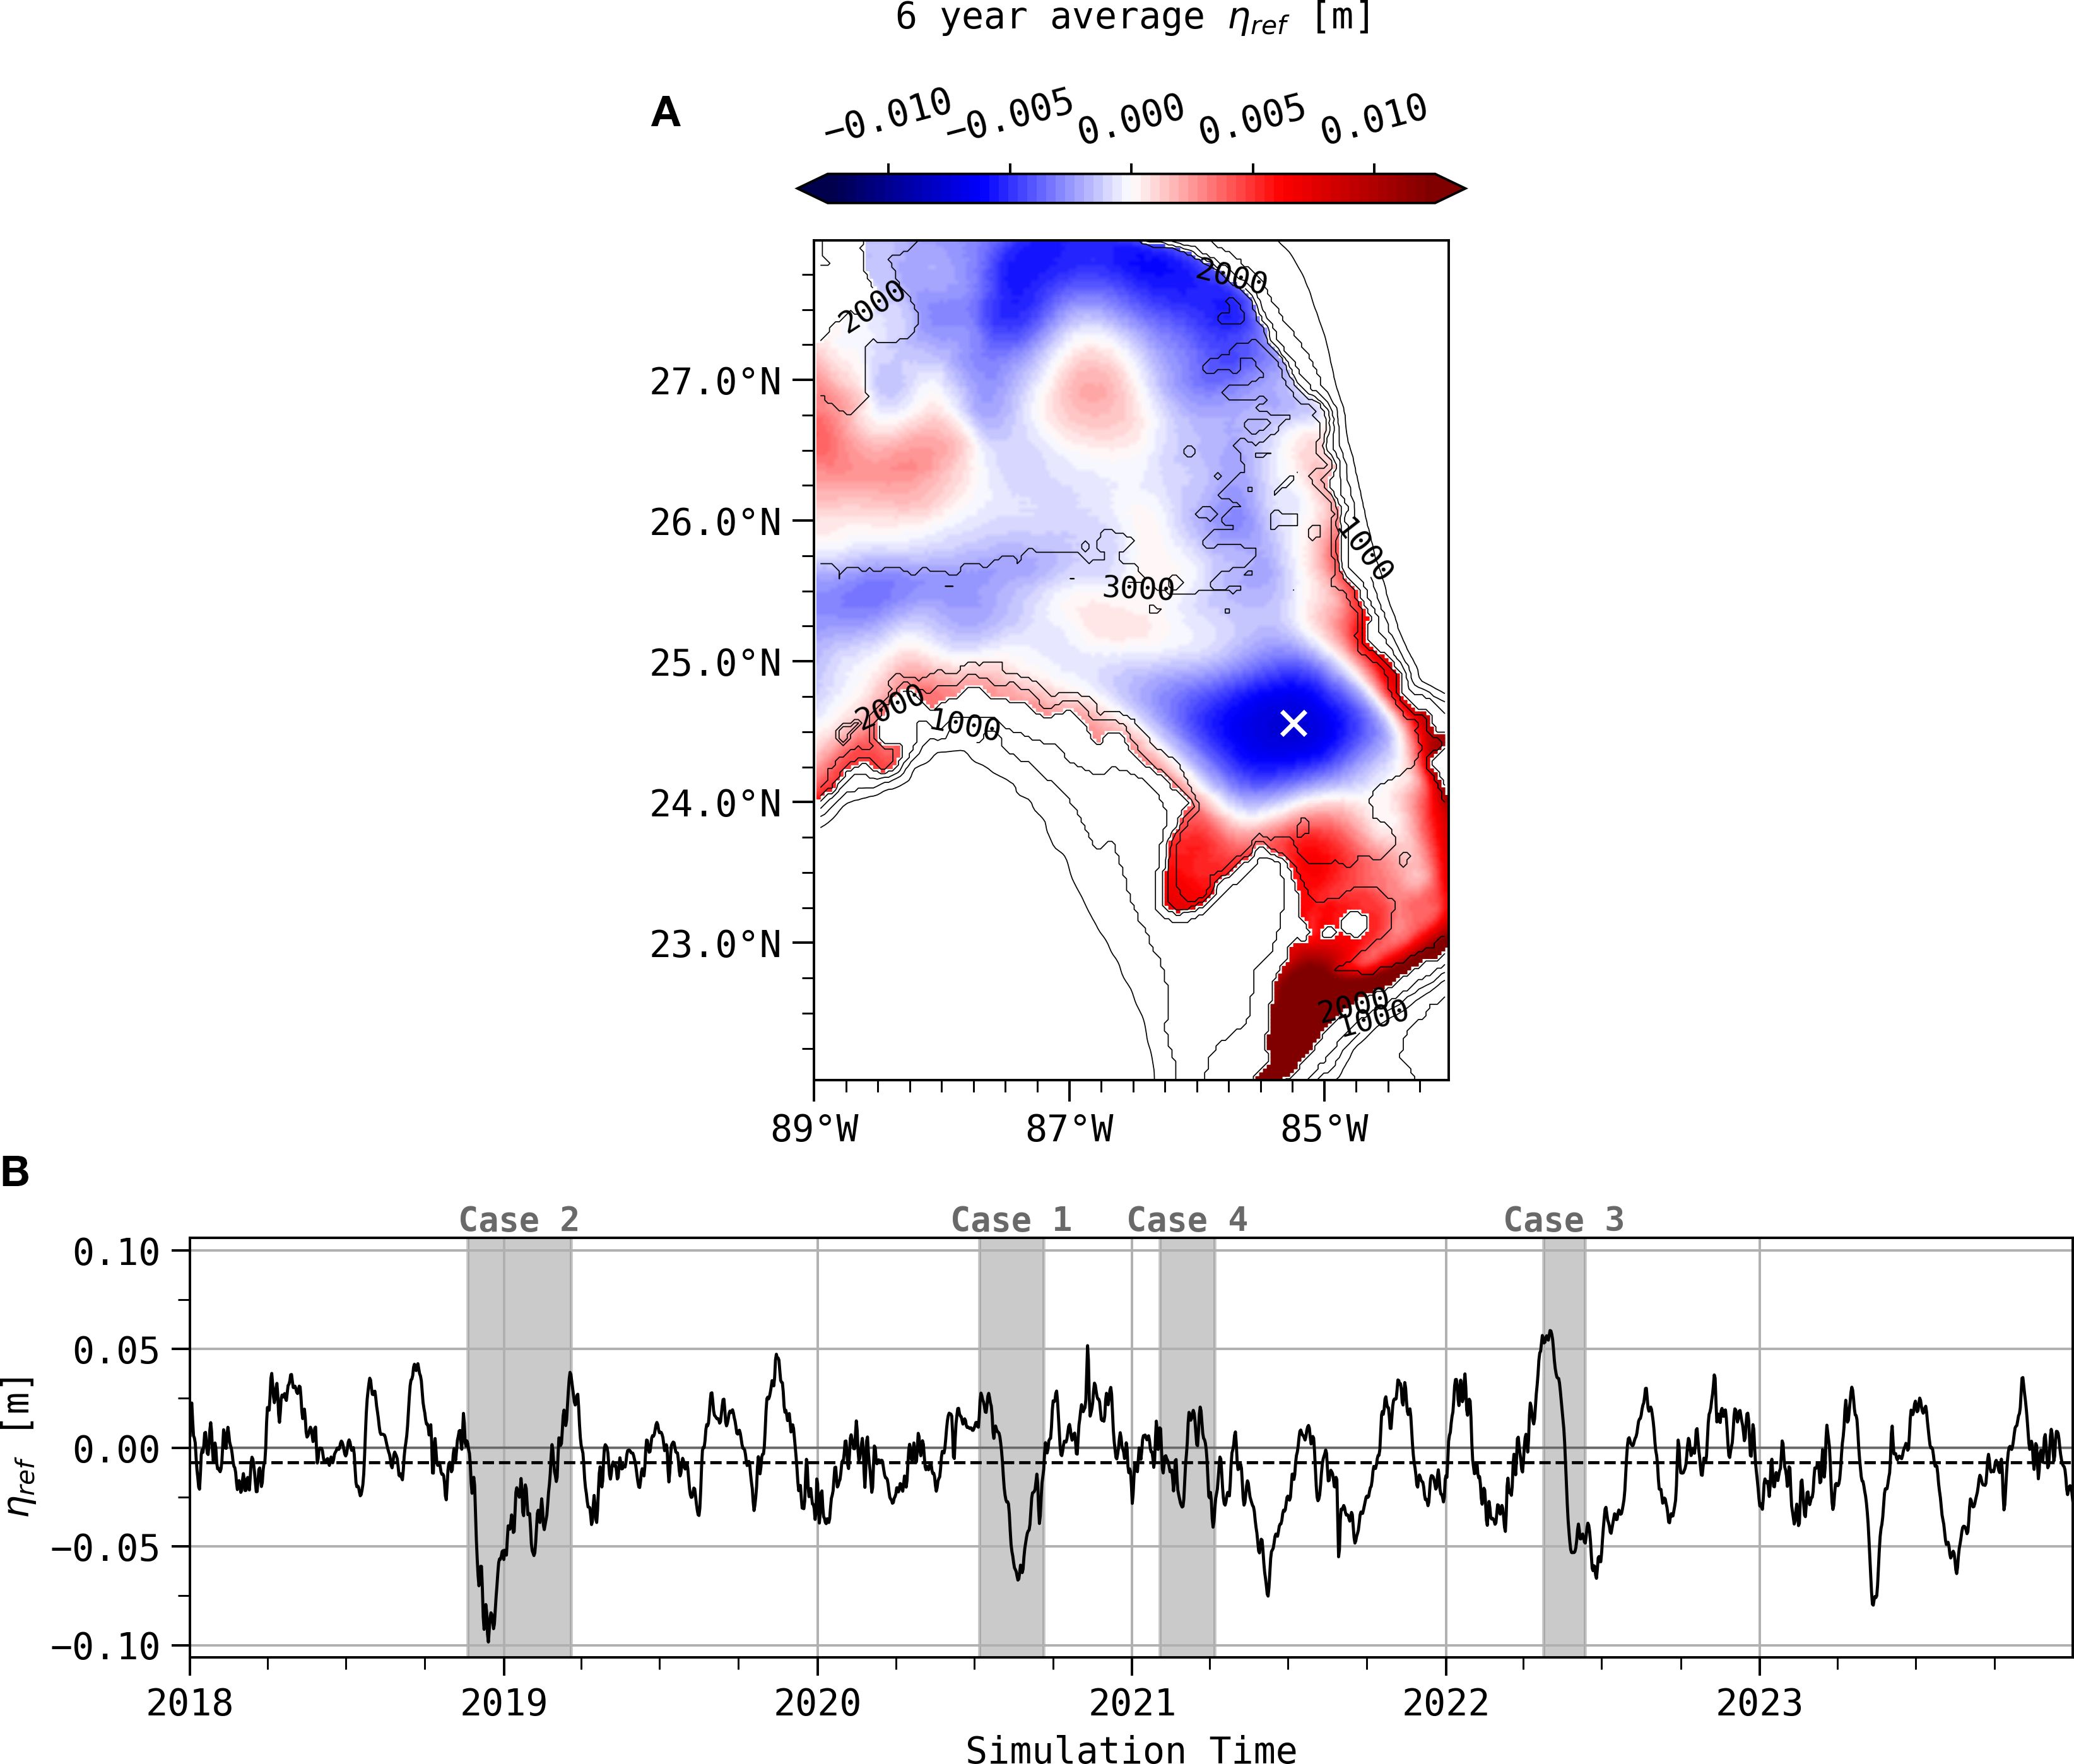
Figure 3. (A) Map of the deep field, ηref, time-averaged over the six-year simulation period, where ηref from Equation 1 represents the depth perturbation of the chosen reference pressure, 2023 dbar. (B) Time series of the deep field at the location marked by a white “x” in the map. The shaded periods indicate the four cases to be detailed. The dashed line is the mean of the time series (-0.0076 m).
All four eddy shedding events that occurred during the model run are presented as Case Studies in Section 4. LC interactions with deep cyclones and anticyclones are important during these events. Examination of Figure 3B prompts two remarks. First, several additional deep pressure lows in the DSC occurred without separation of an LCE. Some deep lows (more examples than illustrated here) occurred during intervals of a retracted LC, suggesting a deep cyclone may tend to block LC extension, such as illustrated in Case 3. Also, the deep cyclone does not initially have to be strong, but can develop to nonetheless influence the necking down or shedding process, as will be shown in Case 4.
Prior numerical studies have noted cyclonic features in the southeast GoM (Oey, 2008; Morey et al., 2020), yet the mechanisms of formation for these deep cyclones has not been explored and deserves further observational and numerical investigation. Based on the numerical model results presented here, we argue below that deep cyclones in the DSC region are important in regards to LCEs because of their contributions to advection and vorticity, facilitating necking down or pinching off of an LCE. In addition, they may prevent previously detached eddies from reattaching (Schmitz Jr, 2005; Chérubin et al., 2006; Shay et al., 2011).
Importantly, though the ηref contribution to sea surface height is relatively weaker than the range of ηtot, the signatures, gradients, and currents dominate the sub-pycnocline layers below ∼ 1200 m. While we will refer to them as deep eddies and deep cyclones, one should bear in mind that they contribute a uniform vertical structure throughout the water column. In particular, their reference velocities add components that may cross normal to the upper layer baroclinic currents (Donohue et al., 2016b), and hence in the upper water column the reference currents are predominantly responsible for mesoscale cross-frontal motions.
The mechanism by which the upper and lower layers influence each other is through vertical stretching exerted by one layer upon the other layer, as in the following two manners: (i) when the upper baroclinic front shifts laterally, the sloped isopycnals enable vertical stretching of the weakly stratified lower water column; (ii) additionally, when the deep reference current has a component of flow crossing the upper baroclinic jet structure, its depth-independent component flows along sloped isopycnal levels zρ. This produces vertical velocity in the upper layer (Lindstrom et al., 1997), and consequently, the upper layer waters are vertically stretched or squashed, as shown in Howden (2000). Both aspects of upper-deep coupling work jointly in the well-known process of baroclinic instability, which develops when there is a favorable vertical offset between perturbations in the upper and deep eddy variability. The characteristic signature is a phase tilt with deep cyclones/anticyclones leading the upper jet troughs/crests along the direction of upper jet flow by roughly a quarter wavelength (Watts et al., 1995; Sutyrin et al., 2001). If deep flow components cross sloped bottom topography, this contributes strong additional vertical stretching. A textbook illustration can be seen in Cushman-Roisin and Beckers (2011), and observational studies include Savidge and Bane (1999); Chereskin et al. (2009); Donohue et al. (2016b), and Furey et al. (2018).
To illustrate the dynamical relationship between relative vorticity in the lower layer and the LC pycnocline depth, we begin with conservation of potential vorticity (Q), and follow procedures from Vallis (2017), allowing us to write (Equations 3–5):
and
where is relative vorticity in layer , is the Coriolis frequency, and is the thickness of layer . For convenience, we proceed by omitting the subscript , and focus on the deep layer. The Coriolis frequency varies with latitude, approximately linearly as , where , and is the latitudinal dimension. Decomposing into mean layer thickness and perturbation , we write . Assuming both and , as well as , and making use of the binomial expansion gives:
is constant, and in our examples the small meridional excursions make (respectively, these two quantities are of order 1E-2 and 1E-1). Hence following a water parcel the quantity is materially conserved, implying that changes in relative vorticity correspond to changes in layer thickness as:
In the upper layer, h′ changes with pycnocline depth when a parcel has a cross-frontal component of flow. In the lower layer, h′ changes with both pycnocline depth and with bottom topography, whereby either influence can produce squashing or stretching of the deep layer.
Importantly, within the DSC, bracketed by nearly vertical side walls (Figure 4), the deep stretching is locally constrained, and the deep eddies so produced cannot translate away. An idealized schematic of this latter process is illustrated in Figure 5, showing the development of a deep cyclone in the stretching lower layer beneath the departing LC pycnocline. The effectiveness of this laterally-constrained stretching mechanism is supported by the numerical model, as will be shown in Section 4.4. The deep cyclones in turn remain to contribute to necking down the upper LC, and this can lead directly to LCE separation.
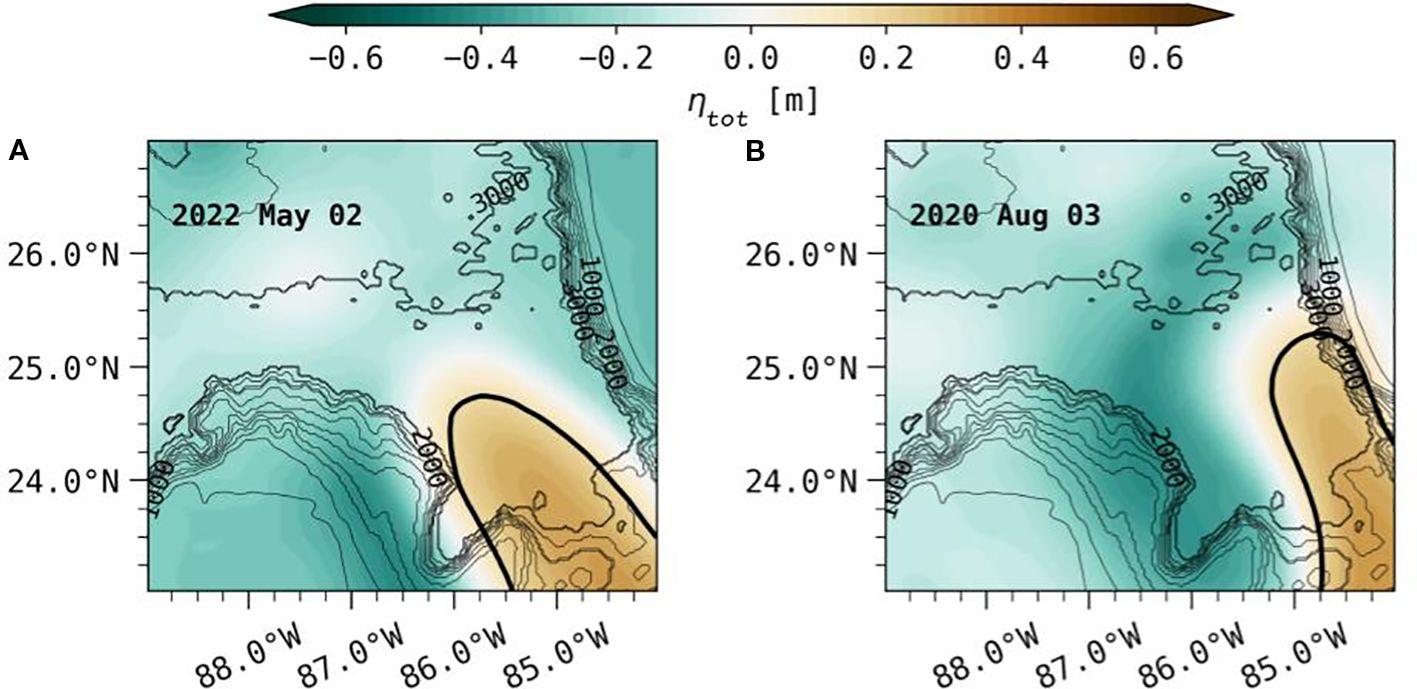
Figure 4. Examples of the LC leaning to the (A) left (i.e. west) toward the Campeche Bank sidewall, and (B) right (i.e. east) toward the West Florida Shelf sidewall. In each panel, the model sea surface height field (ηtot) is shown in color, and the 17 cm contour highlighted with the bold black line represents the position of the LC.
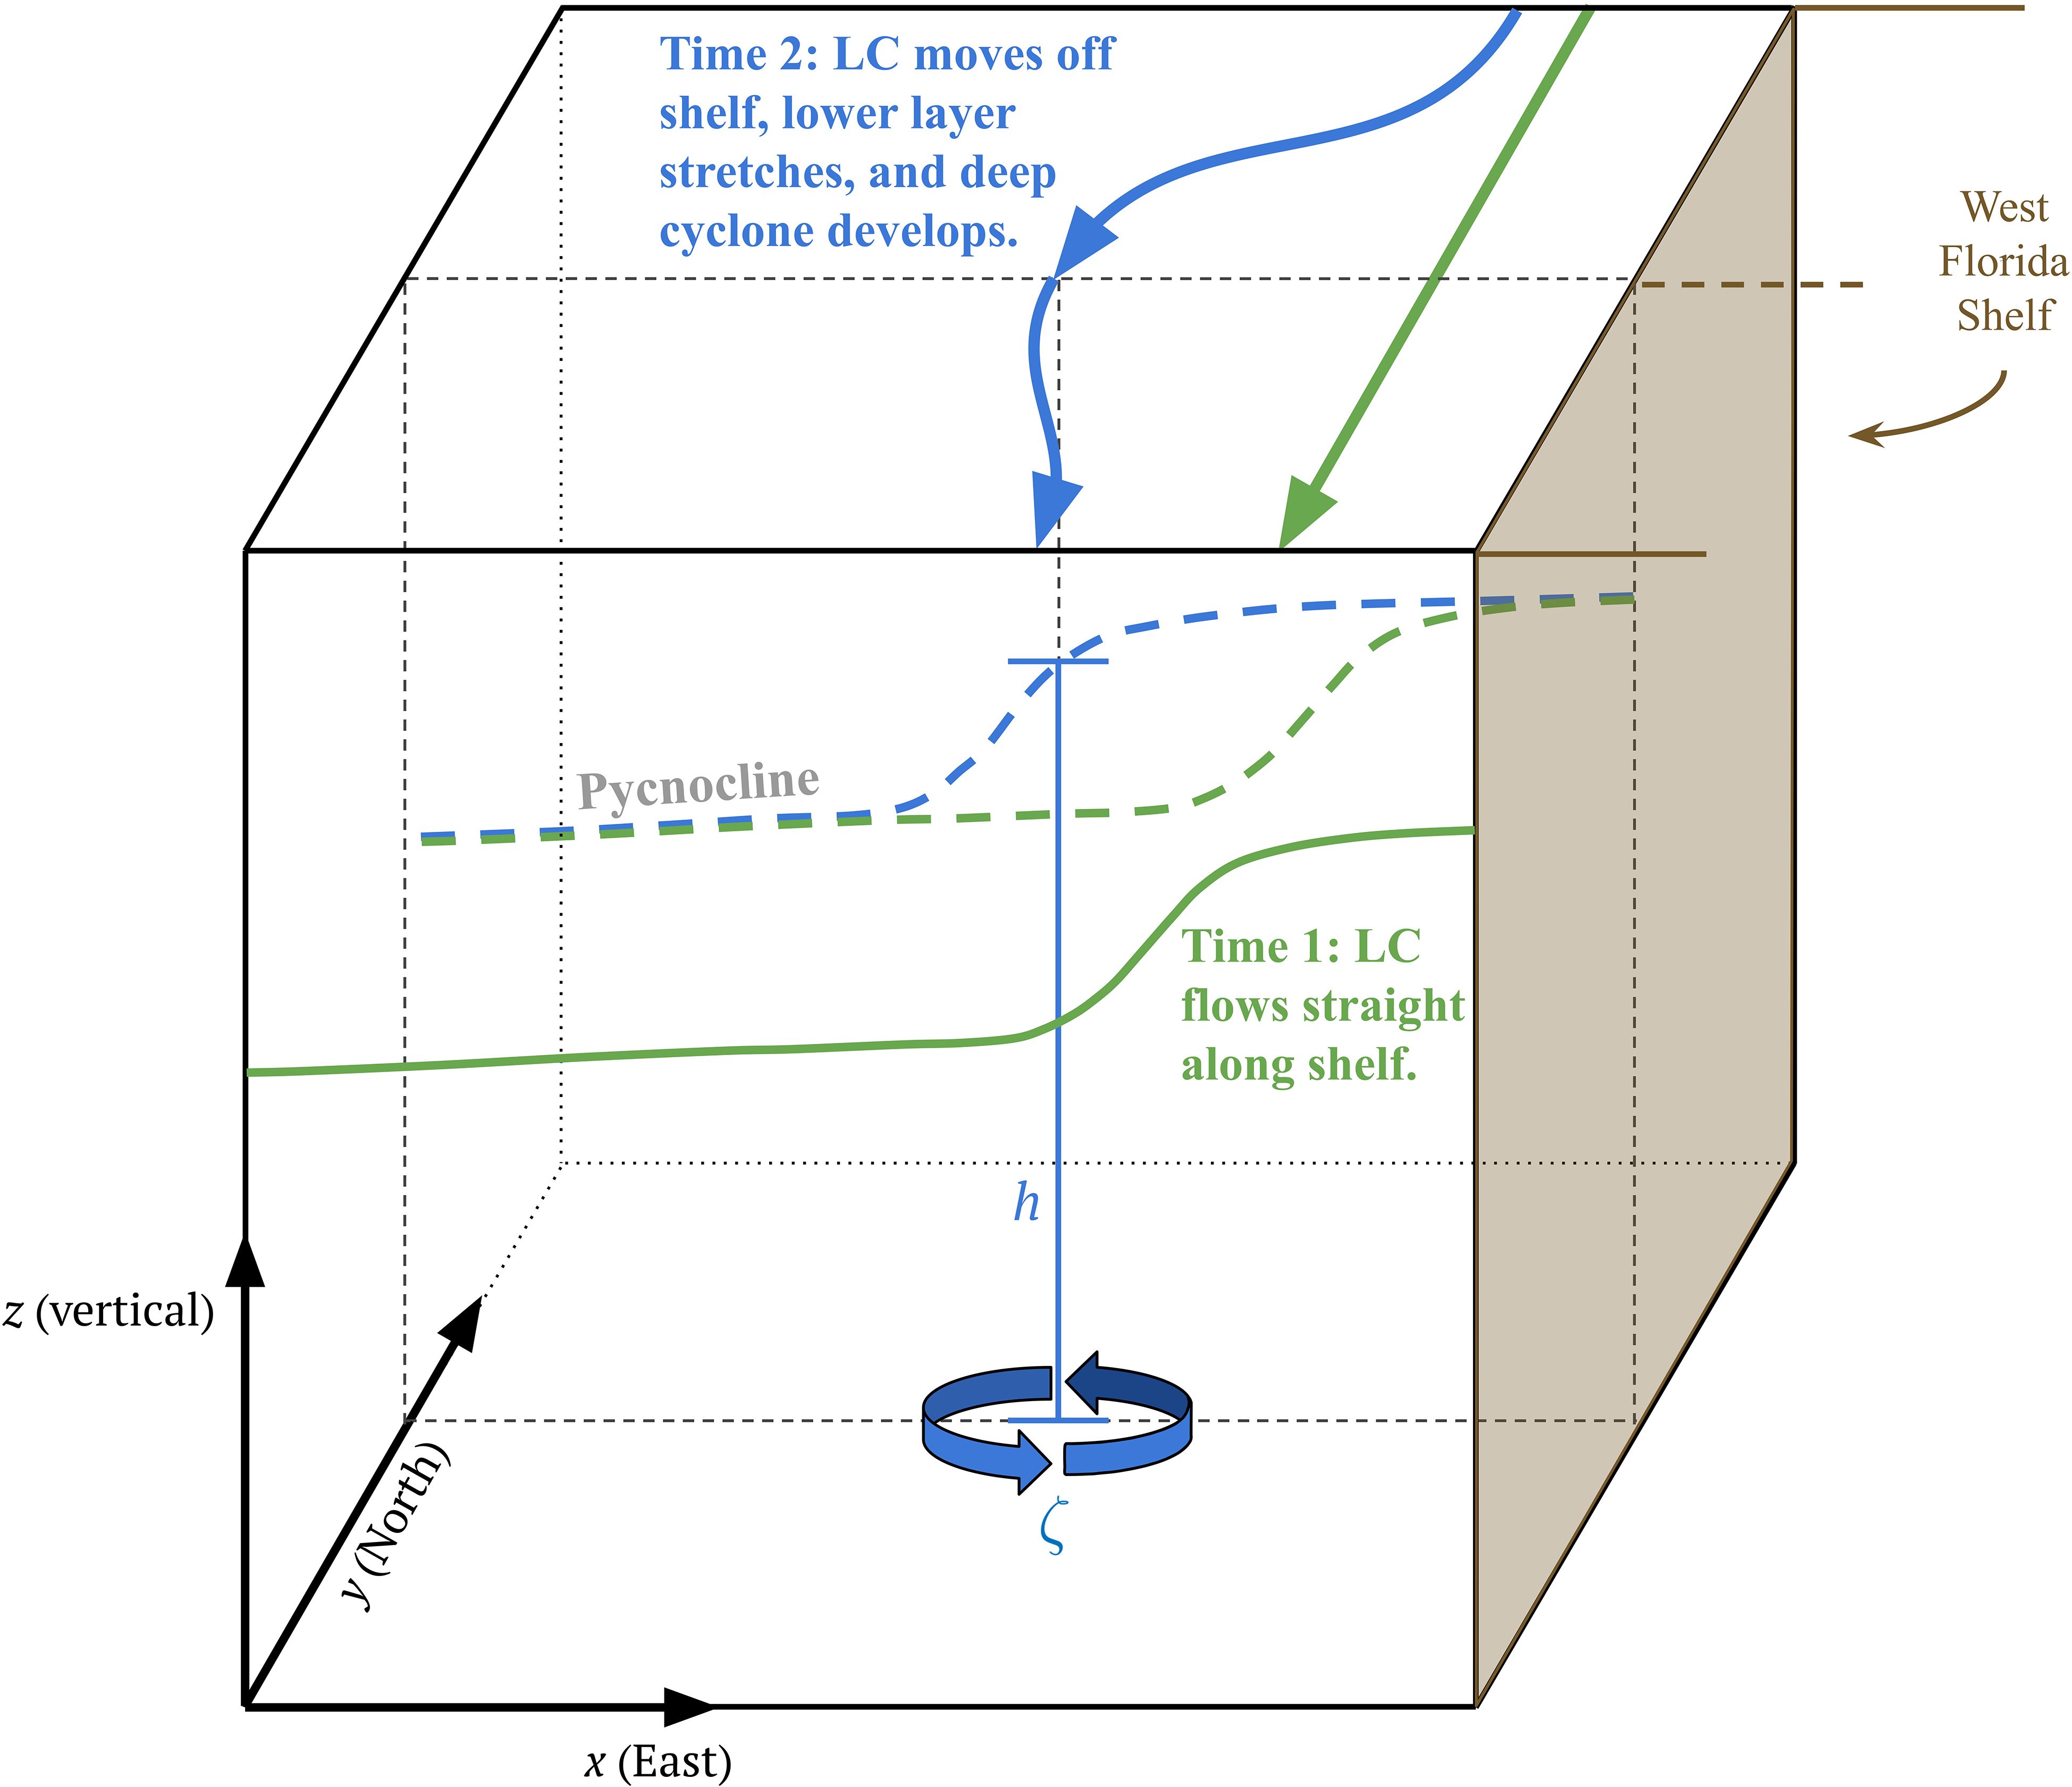
Figure 5. Idealized schematic of deep cyclone formation driven by lower layer stretching. At Time 1 (green lines), the LC flows along shelf with no meanders, and the associated pycnocline is bounded on the east by topographical features (i.e. the West Florida Shelf). At Time 2 (blue lines) the pycnocline draws away from the topography as a result of an upper layer meander trough, such that the lower layer thickness (h) at that location stretches vertically, driving deep cyclonic flow with positive relative vorticity (ζ).
In contrast, north of 25°N and away from the steep Campeche and Florida slopes, meanders can develop all around the unconstrained periphery of the LC or of a large detached LC ring (Donohue et al., 2016b; Hamilton et al., 2016, 2019). Comprehensive studies on the eddy shedding events Ekman, Franklin, Hadal (Donohue et al., 2016b), and Thor (Johnson et al., 2022) have demonstrated the primary role of baroclinic instability. From our present study of the less-documented DSC region, we provide evidence that both baroclinic joint development and the constraints of side-walls can facilitate LCE separation in the DSC.
Within the DSC, the LC may shift slightly to the Campeche or Florida side as it advances, which restricts meandering along that respective flank. While the deep topography (1500 − 3000 m) is nearly vertical on both sides, the upper topographic slope (100 − 1400 m) is gentle on the Campeche Bank side (Figure 1). The bottom slope there () nevertheless exerts a strong constraint, and the flow closely follows the topography in three case studies presented wherein the LC leans left (west, e.g. Figure 4A). In such instances, LC meandering and deep eddy formation then occurs along the opposite side (toward the Florida Shelf). Case studies presented below indicate that a deep cyclone may be spun up as the LC front meanders away from either of the DSC walls. In the next Section, of the four cases during which eddies were shed, two are strongly influenced by this paradigm. In the other two cases the LC protrudes far enough northward beyond the constraining side walls of the DSC to behave in a manner indicative of baroclinic joint development.
4 Case studies
Here we highlight four time periods from the model output showing the evolution of the LC as it extends into the GoM and an LCE separates. Each of the following cases is illustrated by a pair of figures:
i. A mapped sequence of the deep reference pressure fields along with the LC and deep eddy circulation.
ii. A corresponding sequence of vertical sections on an along-stream transect to show the vertical structure of the developing fields.
Our focus is on deep cyclones that develop within the DSC, as they directly contribute to the necking down and eddy shedding process, and the deep cyclones can oppose the reattachment of detached upper eddies. While baroclinic instability is one process known to drive deep cyclones and anticyclones in the open GoM (Donohue et al., 2016b; Oey, 2008), the results here also emphasize LC interaction with the DSC walls.
4.1 Case 1: LC meander shifts away from Campeche Bank
From July 7 to 16, 2020, a weak deep anticyclone centered at approximately 85.75°W and 25°N has formed ahead of the LC extending into the DSC (Figures 6A, B), and nine days later, the deep anticyclone is beneath the head of the LC as it drives zonal currents of ∼10 cm s−1 (Figure 6C). Note the deepened thermocline and near-surface increased salinity layer along transect XO over a distance of roughly 225 km accompanying the LC (Figures 7A, B). During July 25-August 4 a nascent deep cyclone develops near the northeastern slope of the Campeche Bank at approximately 85.25°W, 24.5°N (Figure 6D). This cyclone will jointly develop under a meander trough on the western side of the LC and become the dominant feature of the DSC during Case 1. On August 4, an anticyclone-cyclone pair, termed a “modon” by Hurlburt and Thompson (1982), has formed beneath the western LC edge (Figure 6D). Along the northeastern Campeche Bank, the shallow thermocline and upward tilt of the isopycnals are indicative of the overlying meander trough between approximately 85.0°W, 23°N, and 85.5°W, 24.6°N (Figures 7C, D). By August 13, the strengthening deep cyclone leads a jointly developing upper trough in the LC south of 24°N (Figure 6E). The deep cyclone has expanded to occupy the width of the DSC (∼ 250 km), driving zonal flows of >20 cm s−1 that dominate the flow from 1000 dbar to the bottom, with a notable vertical tilt through the upper 1000 dbar (Figure 7D). By August 22, an LC eddy has pinched off near the steep slope of the West Florida Shelf and subsequently shifts westward around the northern edge of the DSC cyclone, while the LC retracts to a port-to-port mode (Figure 6F). Zonal currents across the DSC are largely cyclonic, with speeds approaching 25 cm s−1, a shallow thermocline, and lifted isopycnals, particularly near 85.1°W, 23.25°N (Figure 7E). During the remaining 27 days of Case 1, the LC remains retracted as the shed LCE moves westward along the northern edge of the Campeche Bank, and the DSC cyclone gradually diminishes (Figures 6G–I).
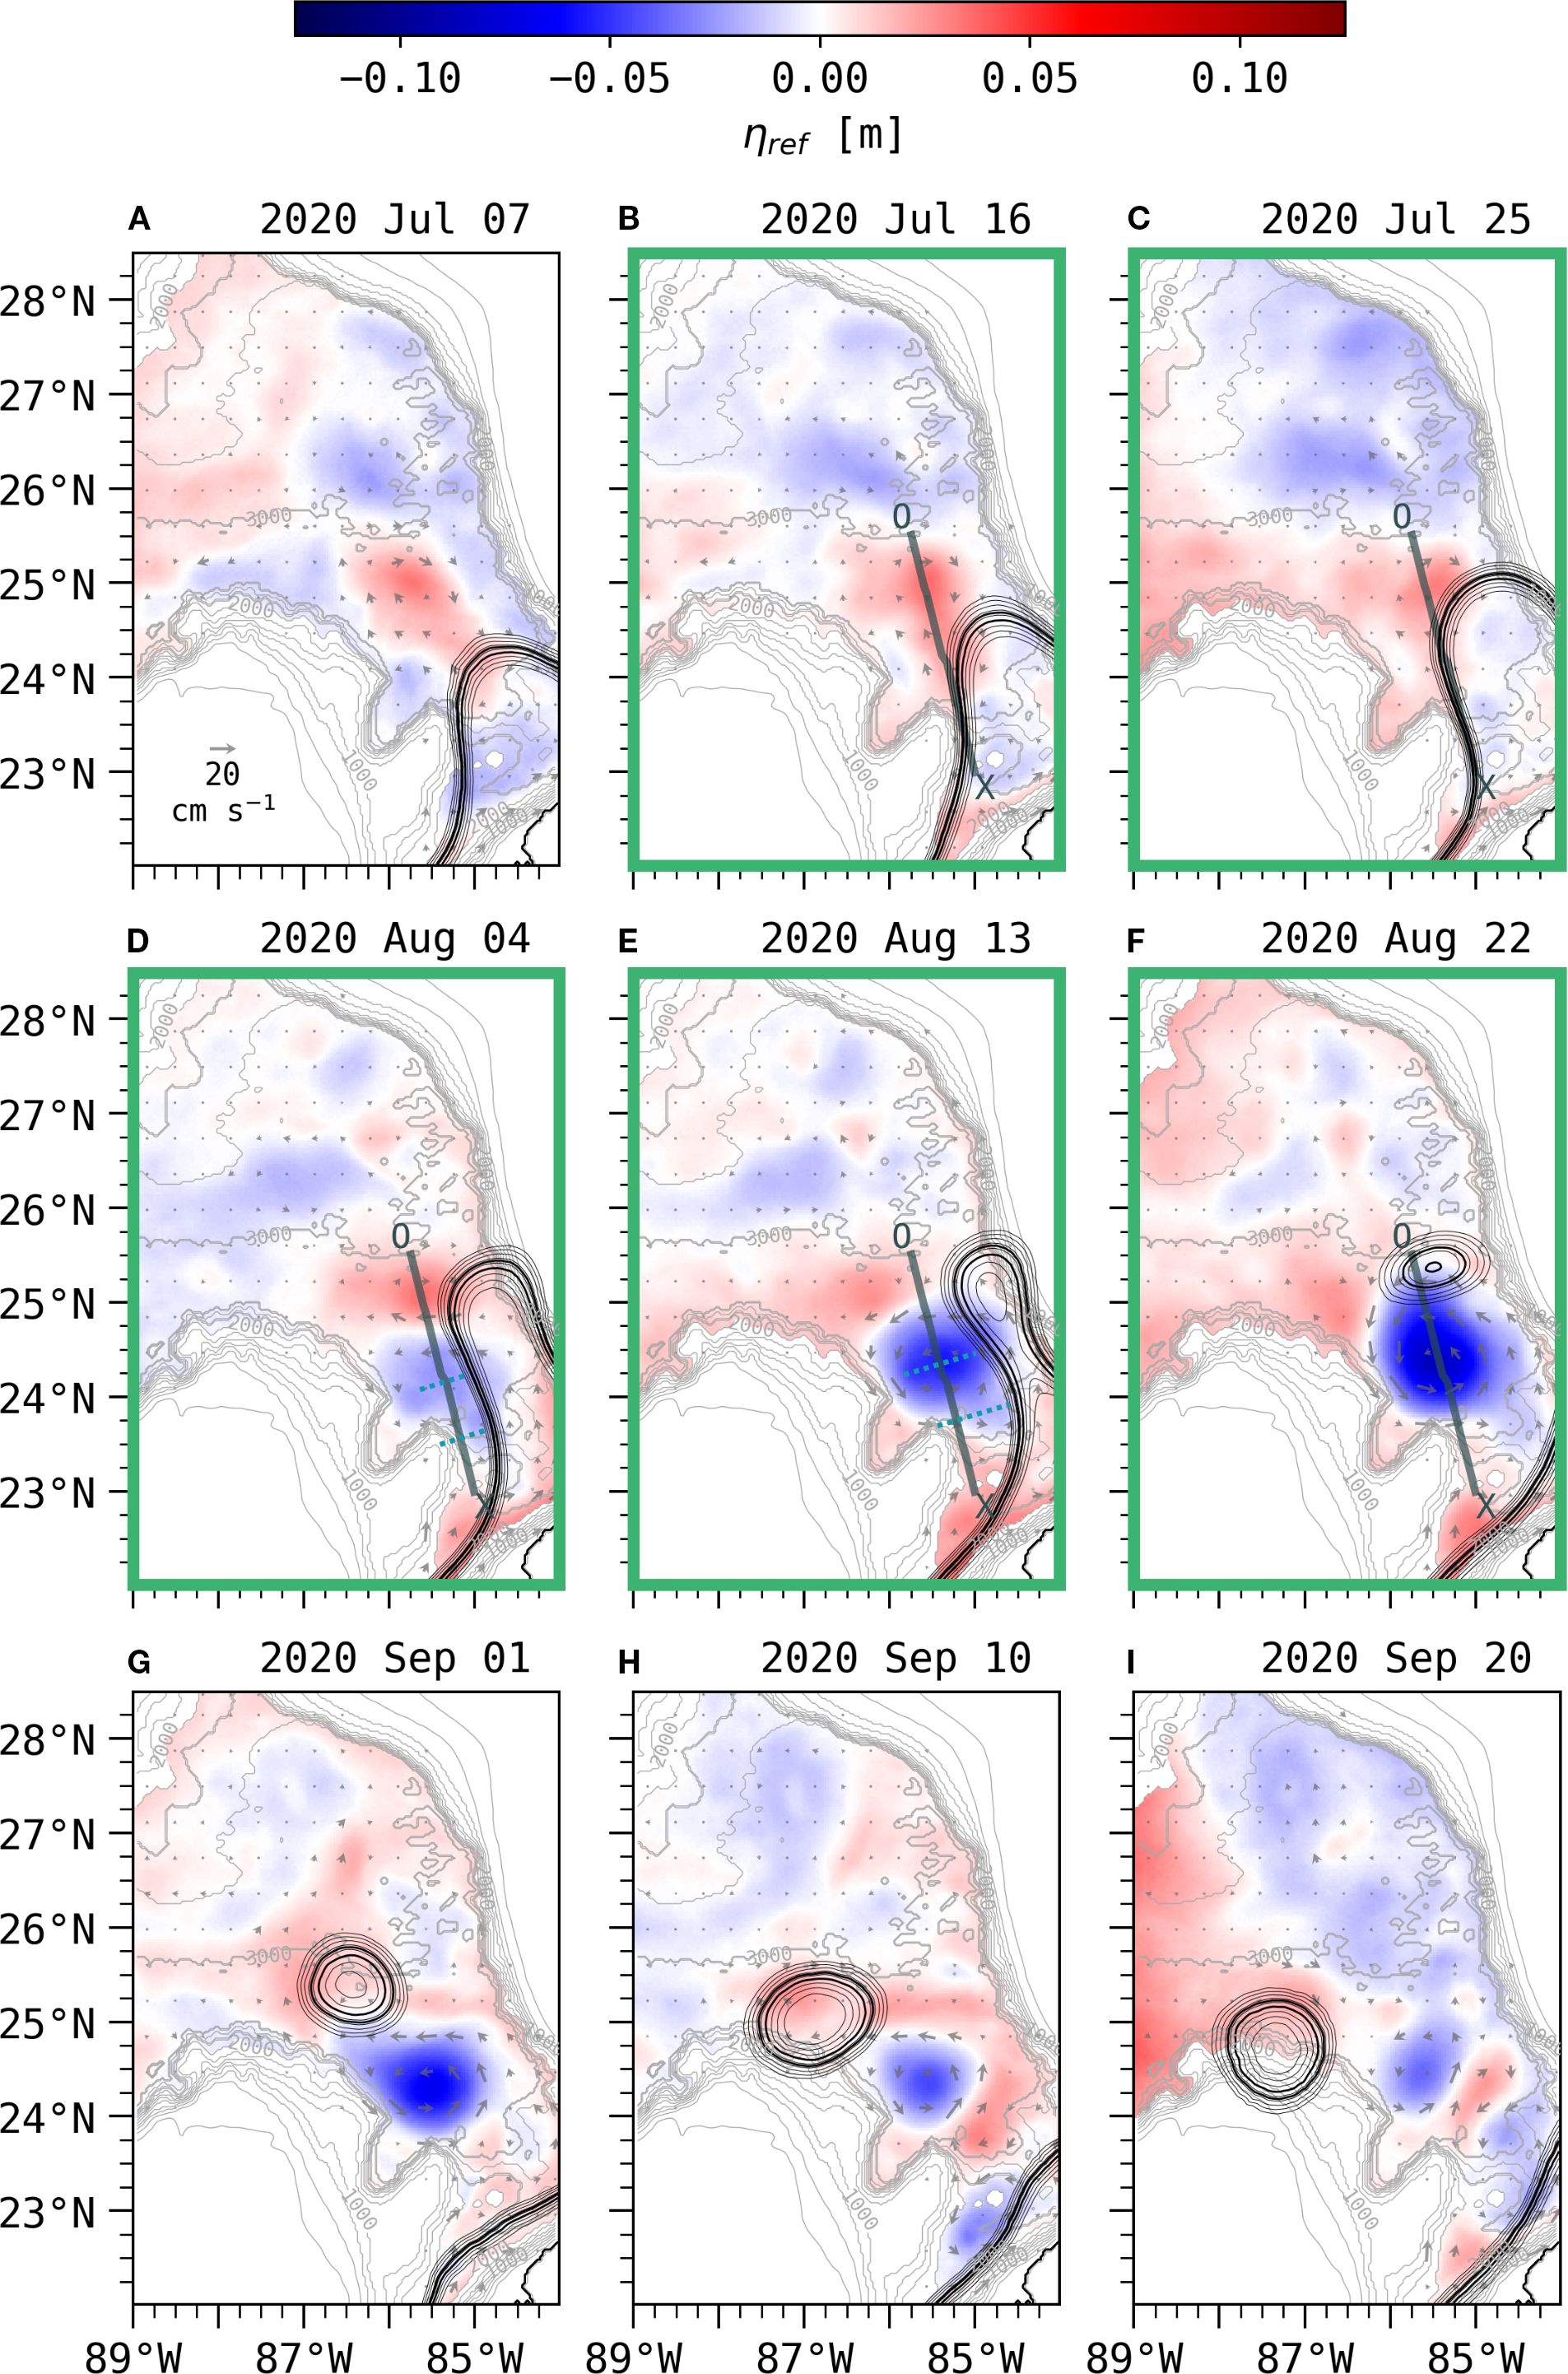
Figure 6. Time evolution of LC and deep field during Case 1 from (A) July 7, 2020 through (I) September 20, 2020. In each panel, black contours indicate the model sea surface height, ηtot, contoured from 8 to 14 cm and 17 to 23 cm with 2 cm increments. The pair of thick black contours indicate 14 and 17 cm, which typify the strongest currents in the LC. The deep reference field (ηref) is shown in color. Arrows indicate model currents at 2000 dbar, averaged approximately every 42 km latitudinally and 33 km longitudinally. Bathymetry is contoured every 250 m. In the green-bounded panels (B–F), the path of the depth transect depicted in subsequent Figure 7 is indicated by the bold line, beginning at the X and ending at the O, approximately along the downstream direction of the LC geostrophic flow. In (D, E) green dotted lines indicate the vertical offset, along the direction of propagation, between the upper and deep fields.
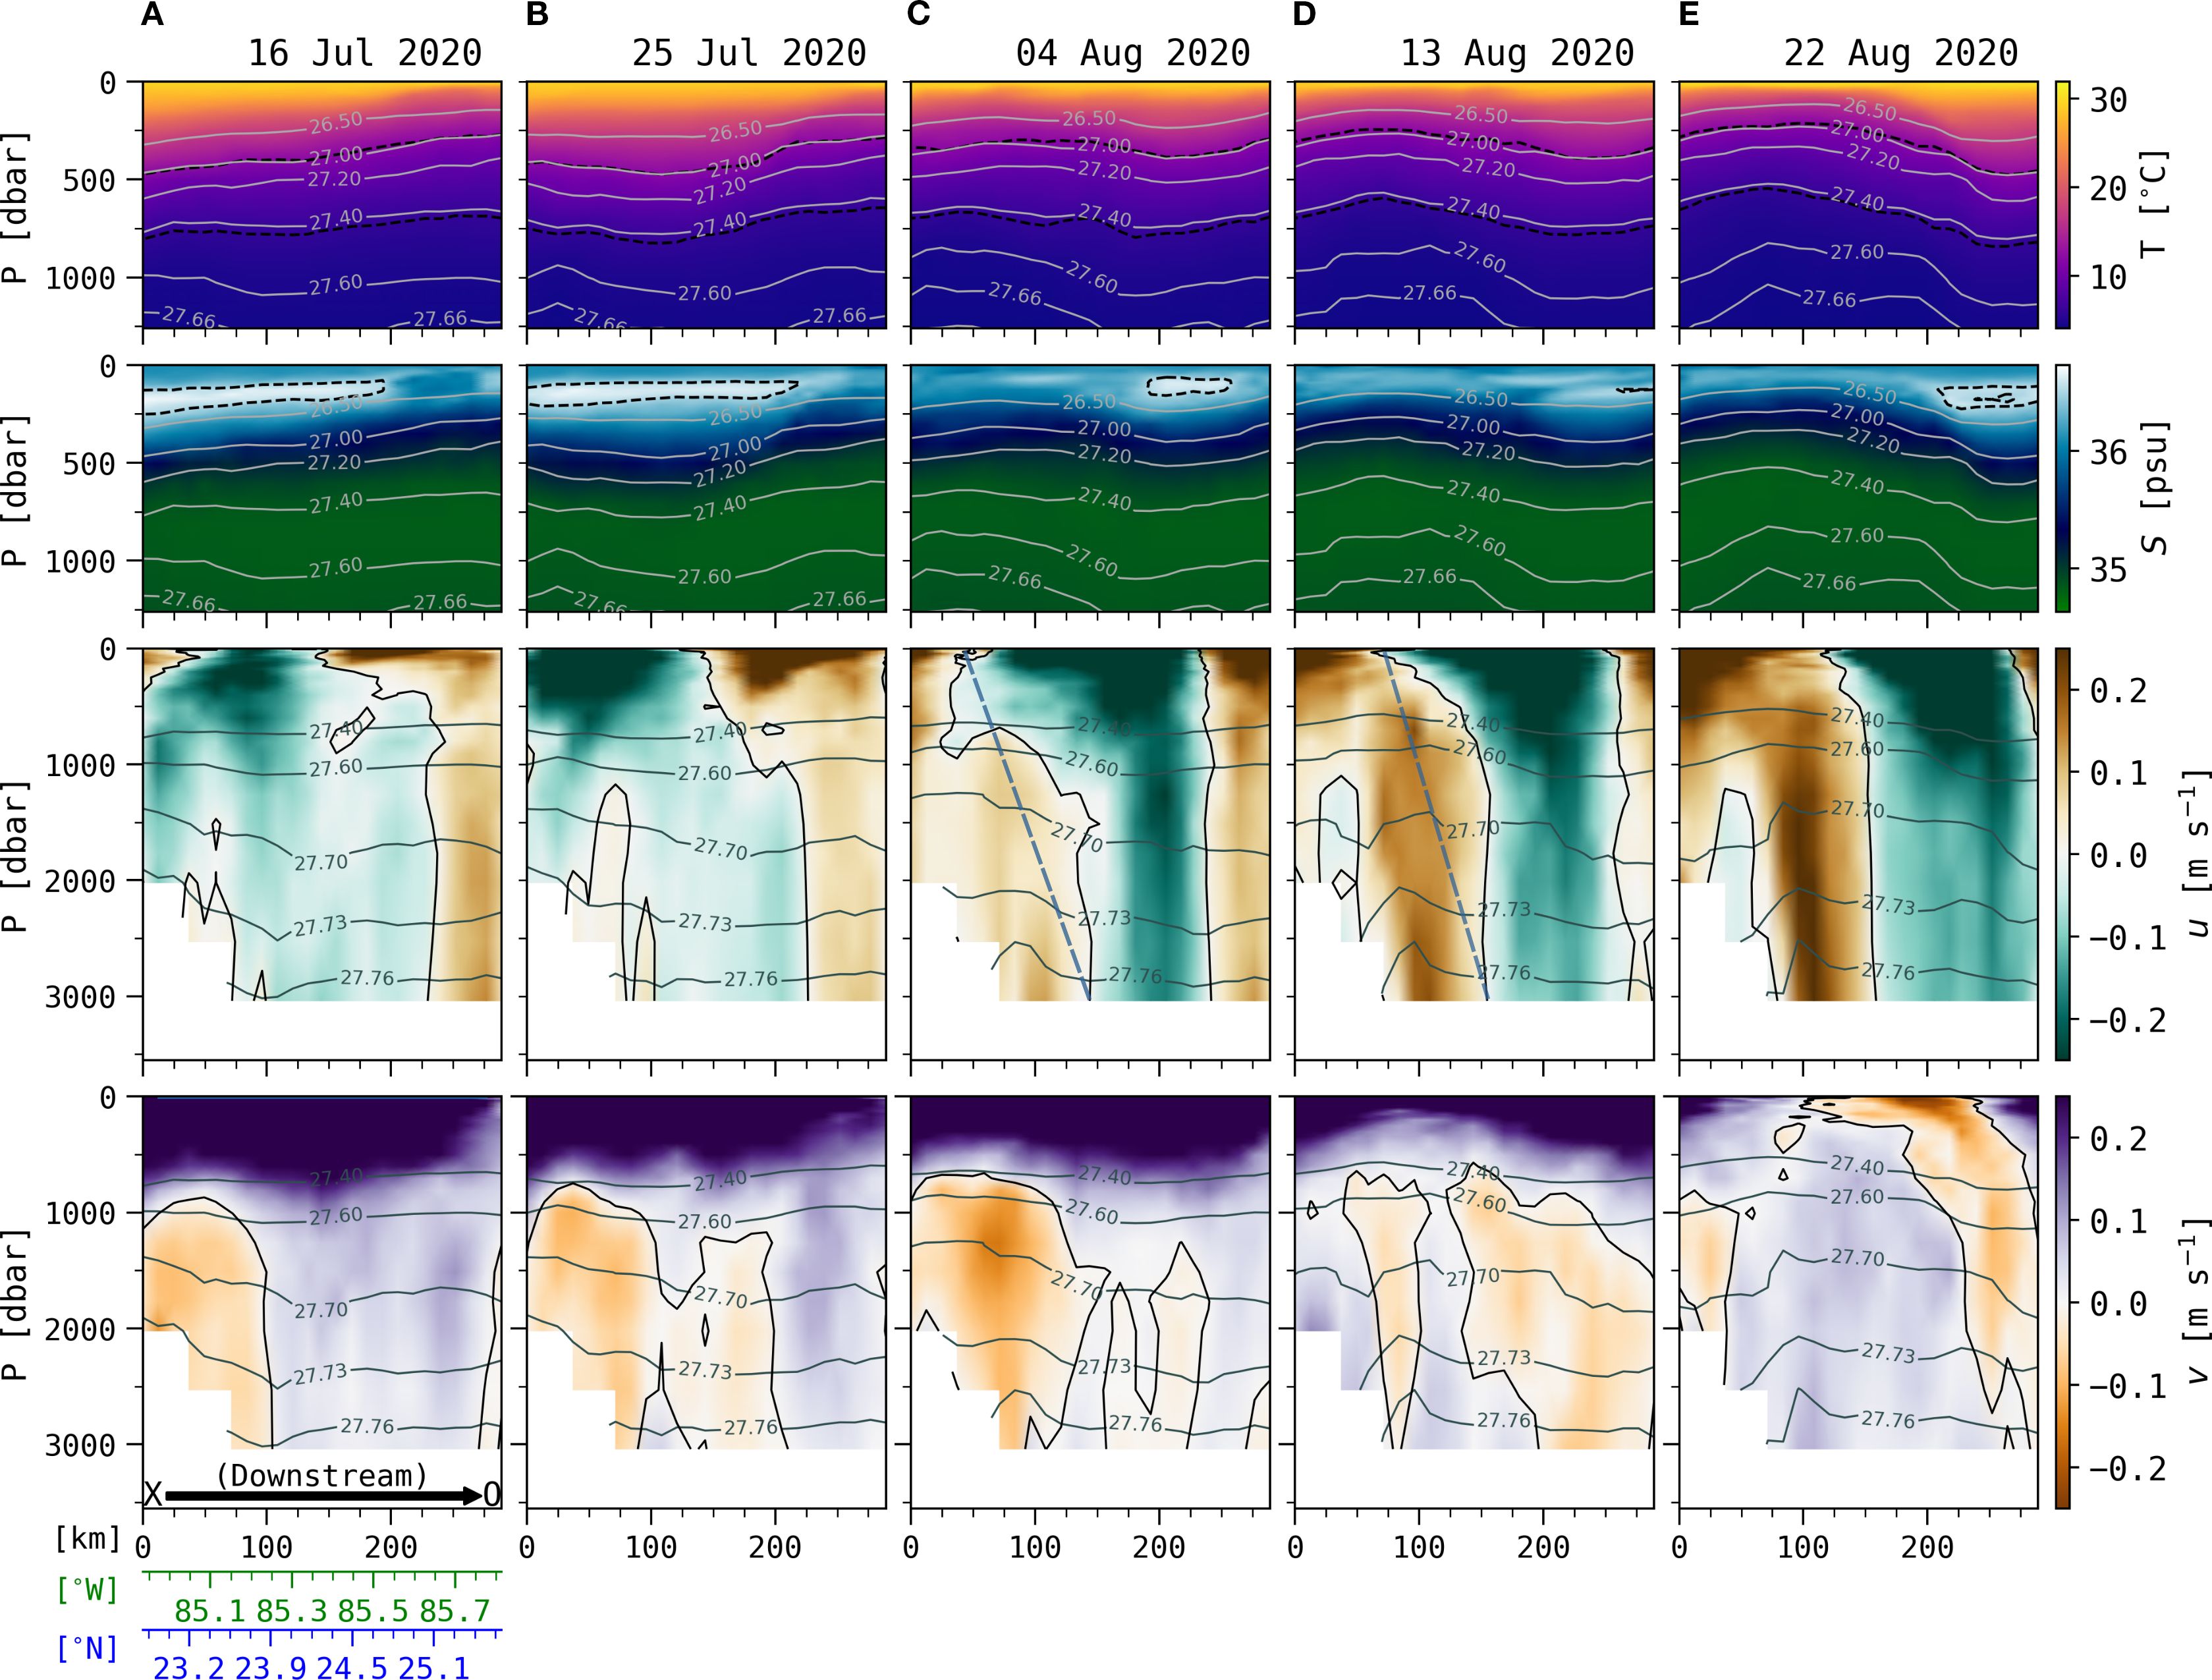
Figure 7. For Case 1, vertical transects of (top row) temperature, (2nd row) salinity, (3rd row) zonal velocity, and (bottom row) meridional velocity, with each column (A-E) corresponding to an associated highlighted panel in Figure 6. Note that only the upper 1250 dbar of the water column are shown in the temperature and salinity profiles. The horizontal axis on each panel is the downstream distance along the bold transect indicated in Figure 6. The corresponding latitude and longitude coordinates are indicated under the bottom leftmost panel. In the temperature panels, the 12 and 6°C isotherms are indicated with black dashed lines, and in the salinity panels, the 36.5 psu contour, indicative of the SUW core, is shown with a black dashed line. Isopycnal contours of potential density are indicated in each panel. Positive currents are to the east (brown hues) and north (violet hues). In panels (C, D) for u, dashed lines emphasize the vertical offset in the direction of propagation, between the upper and deep fields.
Case 1 is an example of the LC leaning toward the eastern DSC boundary (the slope along the West Florida Shelf), and as a meander trough in the extending LC recedes from the western DSC boundary (the Campeche Bank slope), the locally-induced cyclonic deep eddy grows rapidly while the boundary prevents westward propagation of that deep eddy circulation. Indications of baroclinic instability, where the deep field leads the upper by roughly a quarter wavelength, are seen in Case 1 (Figures 6D, E, 7C), with the meander trough along the western side of the LC.
4.1.1 Potential vorticity analysis for Case 1
From the deep cyclone spun up in the model, we can motivate the agreement between changes in ζ/f0 and h′/H (Equation 6). Cautionary remarks are that nonlinear terms have been neglected, and it is uncertain whether the spun-up eddy core is trapped, so the analysis only qualitatively follows a water parcel. Additionally, we note that the model has dissipative terms that are already known to weaken the deep eddy velocities. The LC begins to draw away from the Campeche Bank on July 25 (Figure 6C), and the deep cyclone is thoroughly established by August 22 (Figure 6F), 28 d later. For this time interval, we approximate , or the deep layer change in curvature vorticity divided by f0, estimating representative values for velocity V and curvature radius R from Figure 7E, as: . Using the potential density contours in Figure 7 as an indication of changes in the thermocline depth gives . Thus we find agreement in sign and magnitude as qualitative support of the asserted dynamical balance between vertical stretching and changes in deep vorticity.
4.2 Case 2: Classic baroclinic instability
On November 20, 2018, the LC has extended northward to approximately 27°N, with a deep anticyclone under the leading edge, while along the eastern side a meander crest at 25°N approaches the West Florida Shelf slope (Figure 8A). Eight days later that crest has translated south, and a meander trough and deep cyclone have developed on the eastern side of the LC (translating downstream along the transect indicated in Figure 8B), and the deep currents along the West Florida Shelf slope grow to 30 cm s−1 to the NW (Figure 8B). Additional results of the southward shift of the meander crest are evident from the shift of downward-sloped upper isopycnals between November 20 and 28 in the transect parallel to the West Florida Shelf slope and the shift in the near surface high salinity layer (Figures 9A, B). From December 6 to 14, the jointly developing meander trough and deep cyclone adjacent to the West Florida Shelf slope continue southeastward and intensify, and the LC is necking down toward detaching an eddy (Figures 8C–F). The high salinity layer, deep thermocline, and sloping isopycnals of the LC have moved to the southeast, as the deep cyclonic currents extend through the water column (Figures 9C, D); also note the vertical offset between the surface and deep zonal velocity in Figure 9C showing the deep leading the upper features in the along-stream direction. The DSC cyclone approaches its strongest (negative) state of approximately -0.10 m on December 14, and occupies nearly the entire width of the DSC (∼ 250 km), with currents of roughly 30 cm s−1 (Figure 8D). At this time, the pycnocline has shoaled along the transect XO, and the cyclonic currents exhibit a nearly barotropic structure (Figure 9D). Within the next 8–16 days, the trough steepens and pinches off a large upper eddy. From an assessment of Figure 8, the deep cyclone remains the dominant feature of the DSC until approximately March 12, for a duration of ∼ 3 months.
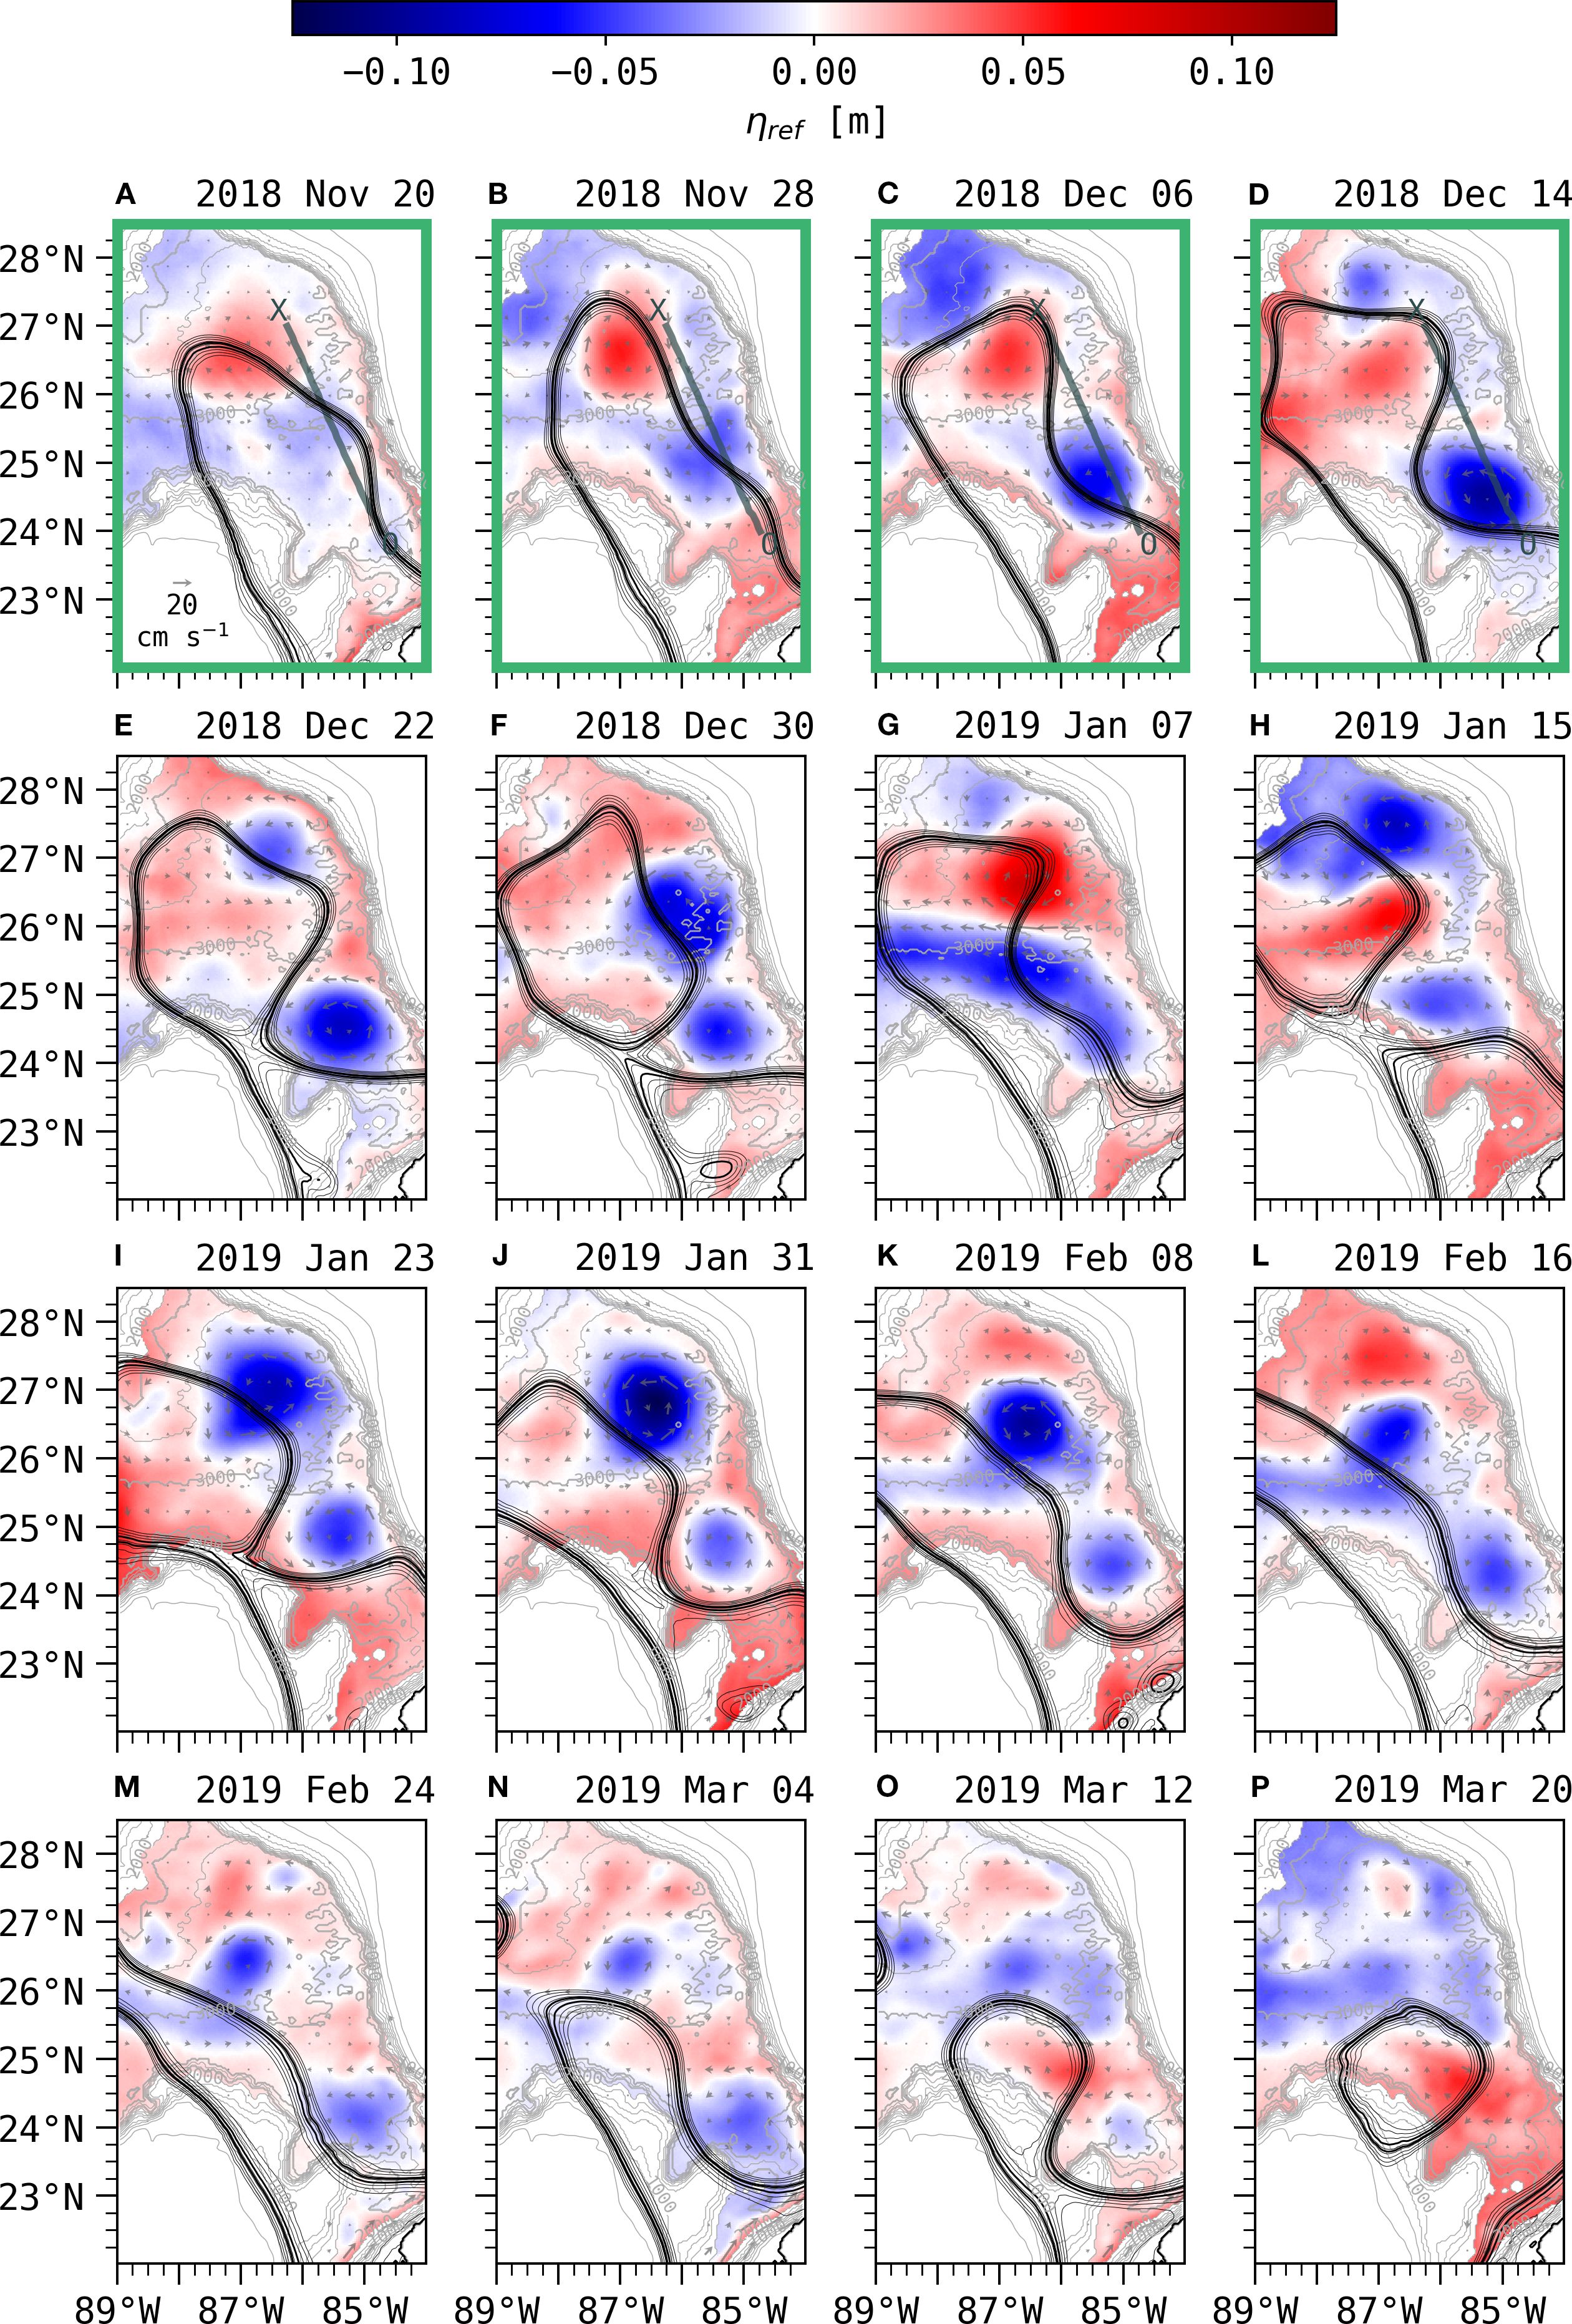
Figure 8. Same as Figure 6, but for Case 2 from (A) November 20, 2018 to (P) March 20, 2019.
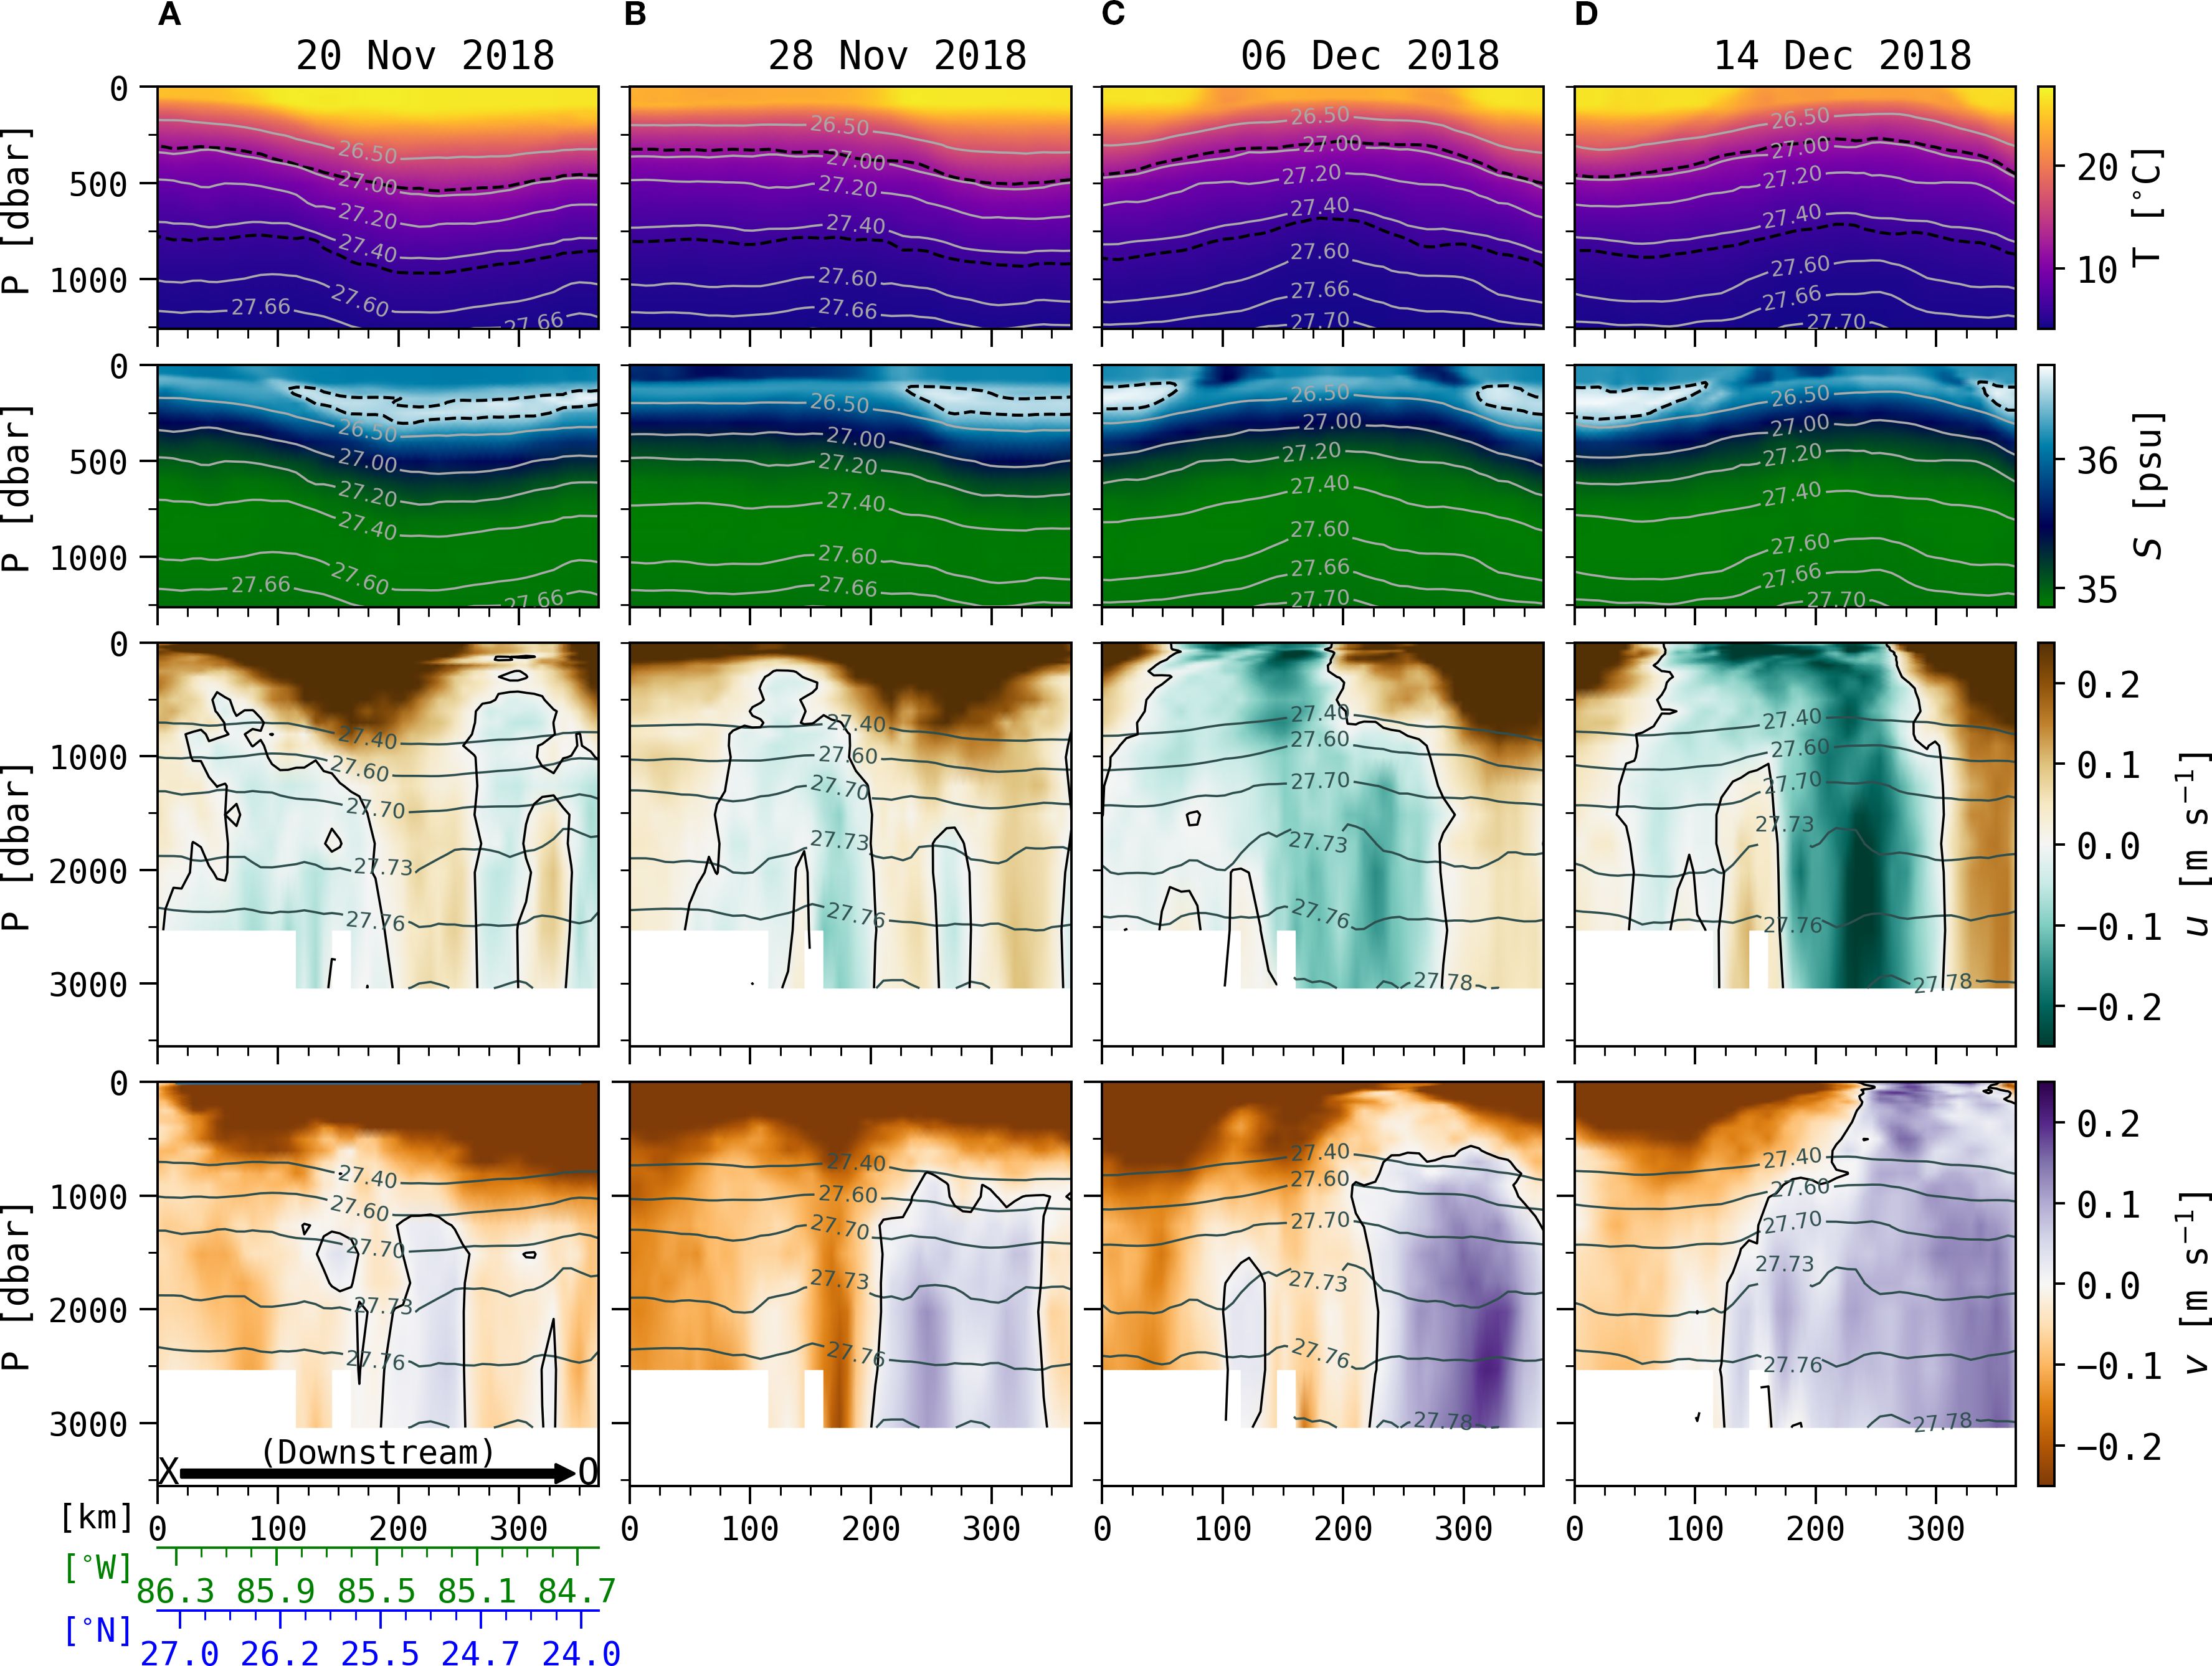
Figure 9. Same as Figure 7, but for Case 2 from (A) November 20, 2018 to (D) December 14, 2018.
After this first detachment on December 30, a sequence of reattachments and detachments occurs before the final separation events on March 04 and March 12. Case 2 illustrates a sequence of baroclinic instability events. The LC has advanced far enough northward beyond the DSC that the deep eddies are not entirely constrained to the narrow channel and can propagate west (e.g. January 07 in Figure 8G). Moreover, meanders continue to develop with the signature of baroclinic instability, and development is enhanced by the LC encountering the sloping bottom topography of the Mississippi Fan (references will be cited in the Conclusions). In Case 2, the instability can be inferred from the DSC cyclone being vertically offset from the LC meander trough in the direction of propagation (Figures 8B–D). This is additionally evident in Figure 9B, where the LC meander trough, represented by the raised σθ contour near 85.5°W, 25.5°N, is behind the core of the deep cyclone (the 2000 dbar transition from negative to positive zonal u velocity at approximately 85.1°W, 24.63°N); this corresponds to a distance of roughly 100 km, and from Figure 8C, we conclude this to be approximately a quarter of the LC propagation wavelength.
Case 2 illustrates a sequence of baroclinic instability events that are triggered by LC interaction with the Mississippi Fan. As the LC meanders move off the Fan, deep eddies develop and in particular deep cyclones intensify. This is evident in Figure 8I on January 23 near 87°W, 27°N. From January 23 to 31, both the northern cyclone and the DSC cyclone move southward, as the former intensifies and the LCE extends westward (Figures 8I, J). The northernmost cyclone remains distinct from the weakening DSC cyclone, and travels clockwise following the LC (Figures 8K–M). By February 24, the LC has extended west of 90°W, and pinches off a small eddy on March 4 (Figure 8N). Over the next 16 days, the main body of the LC retracts considerably and another eddy is shed, with the separation point adjacent to the vestiges of the DSC cyclone just north of 23°N (Figures 8N–P).
4.3 Case 3: Deep blocking cyclone
On April 24 2022, the LC is extending northwest into the GoM, led at its advancing tip by a deep anticyclone centered near 85.1°W, 24.5°N (Figure 10A). Currents in the deep anticyclone intensify through April 30, particularly along both the northeast Campeche Bank slope and West Florida Shelf slope (Figure 10B), and by May 6, the LC has extended beyond 25°N, with the deep and upper currents aligned vertically rather than tilted alongstream (Figures 11A, B). Further southeast along the transect XO, currents within the deep anticyclone contribute to necking down the LC on May 6 - 18 (Figures 10C–E). The presence of the slight LC meander crest is evident adjacent to the West Florida Shelf slope, with deep isotherms and a band of the near-surface high salinity extending for over 150 km, while deep currents are generally directed to the southeast (Figure 11A). The LC continues necking down over the next 12 days, with the deep anticyclone centered on approximately 85.75°W, 24.5°N. As the upper LC trough recedes from the West Florida Shelf (May 18-24), an adjacent eastern deep cyclone develops between the LC and the West Florida Shelf (Figures 10E, F). The thermocline and isopycnals are shallow and flat (Figures 11B–D), and on May 24, the deep cyclone extends to 25°N, evidently widening the distance between the separated LCE and the retracting LC. On May 30, the shed eddy moves westward while the retracted LC protrudes northwest along the southern limit of the West Florida Shelf slope (Figure 10G), deepening the thermocline near 84.3°W, 23.5°N (Figure 11E). The shed LCE continues westward as the LC retracts to a port-to-port mode, and subsequently, the DSC cyclone gradually deforms and dissipates, though the features exhibited in Figure 10H endure for multiple weeks; in fact, the DSC cyclone lasts until early August (not shown).
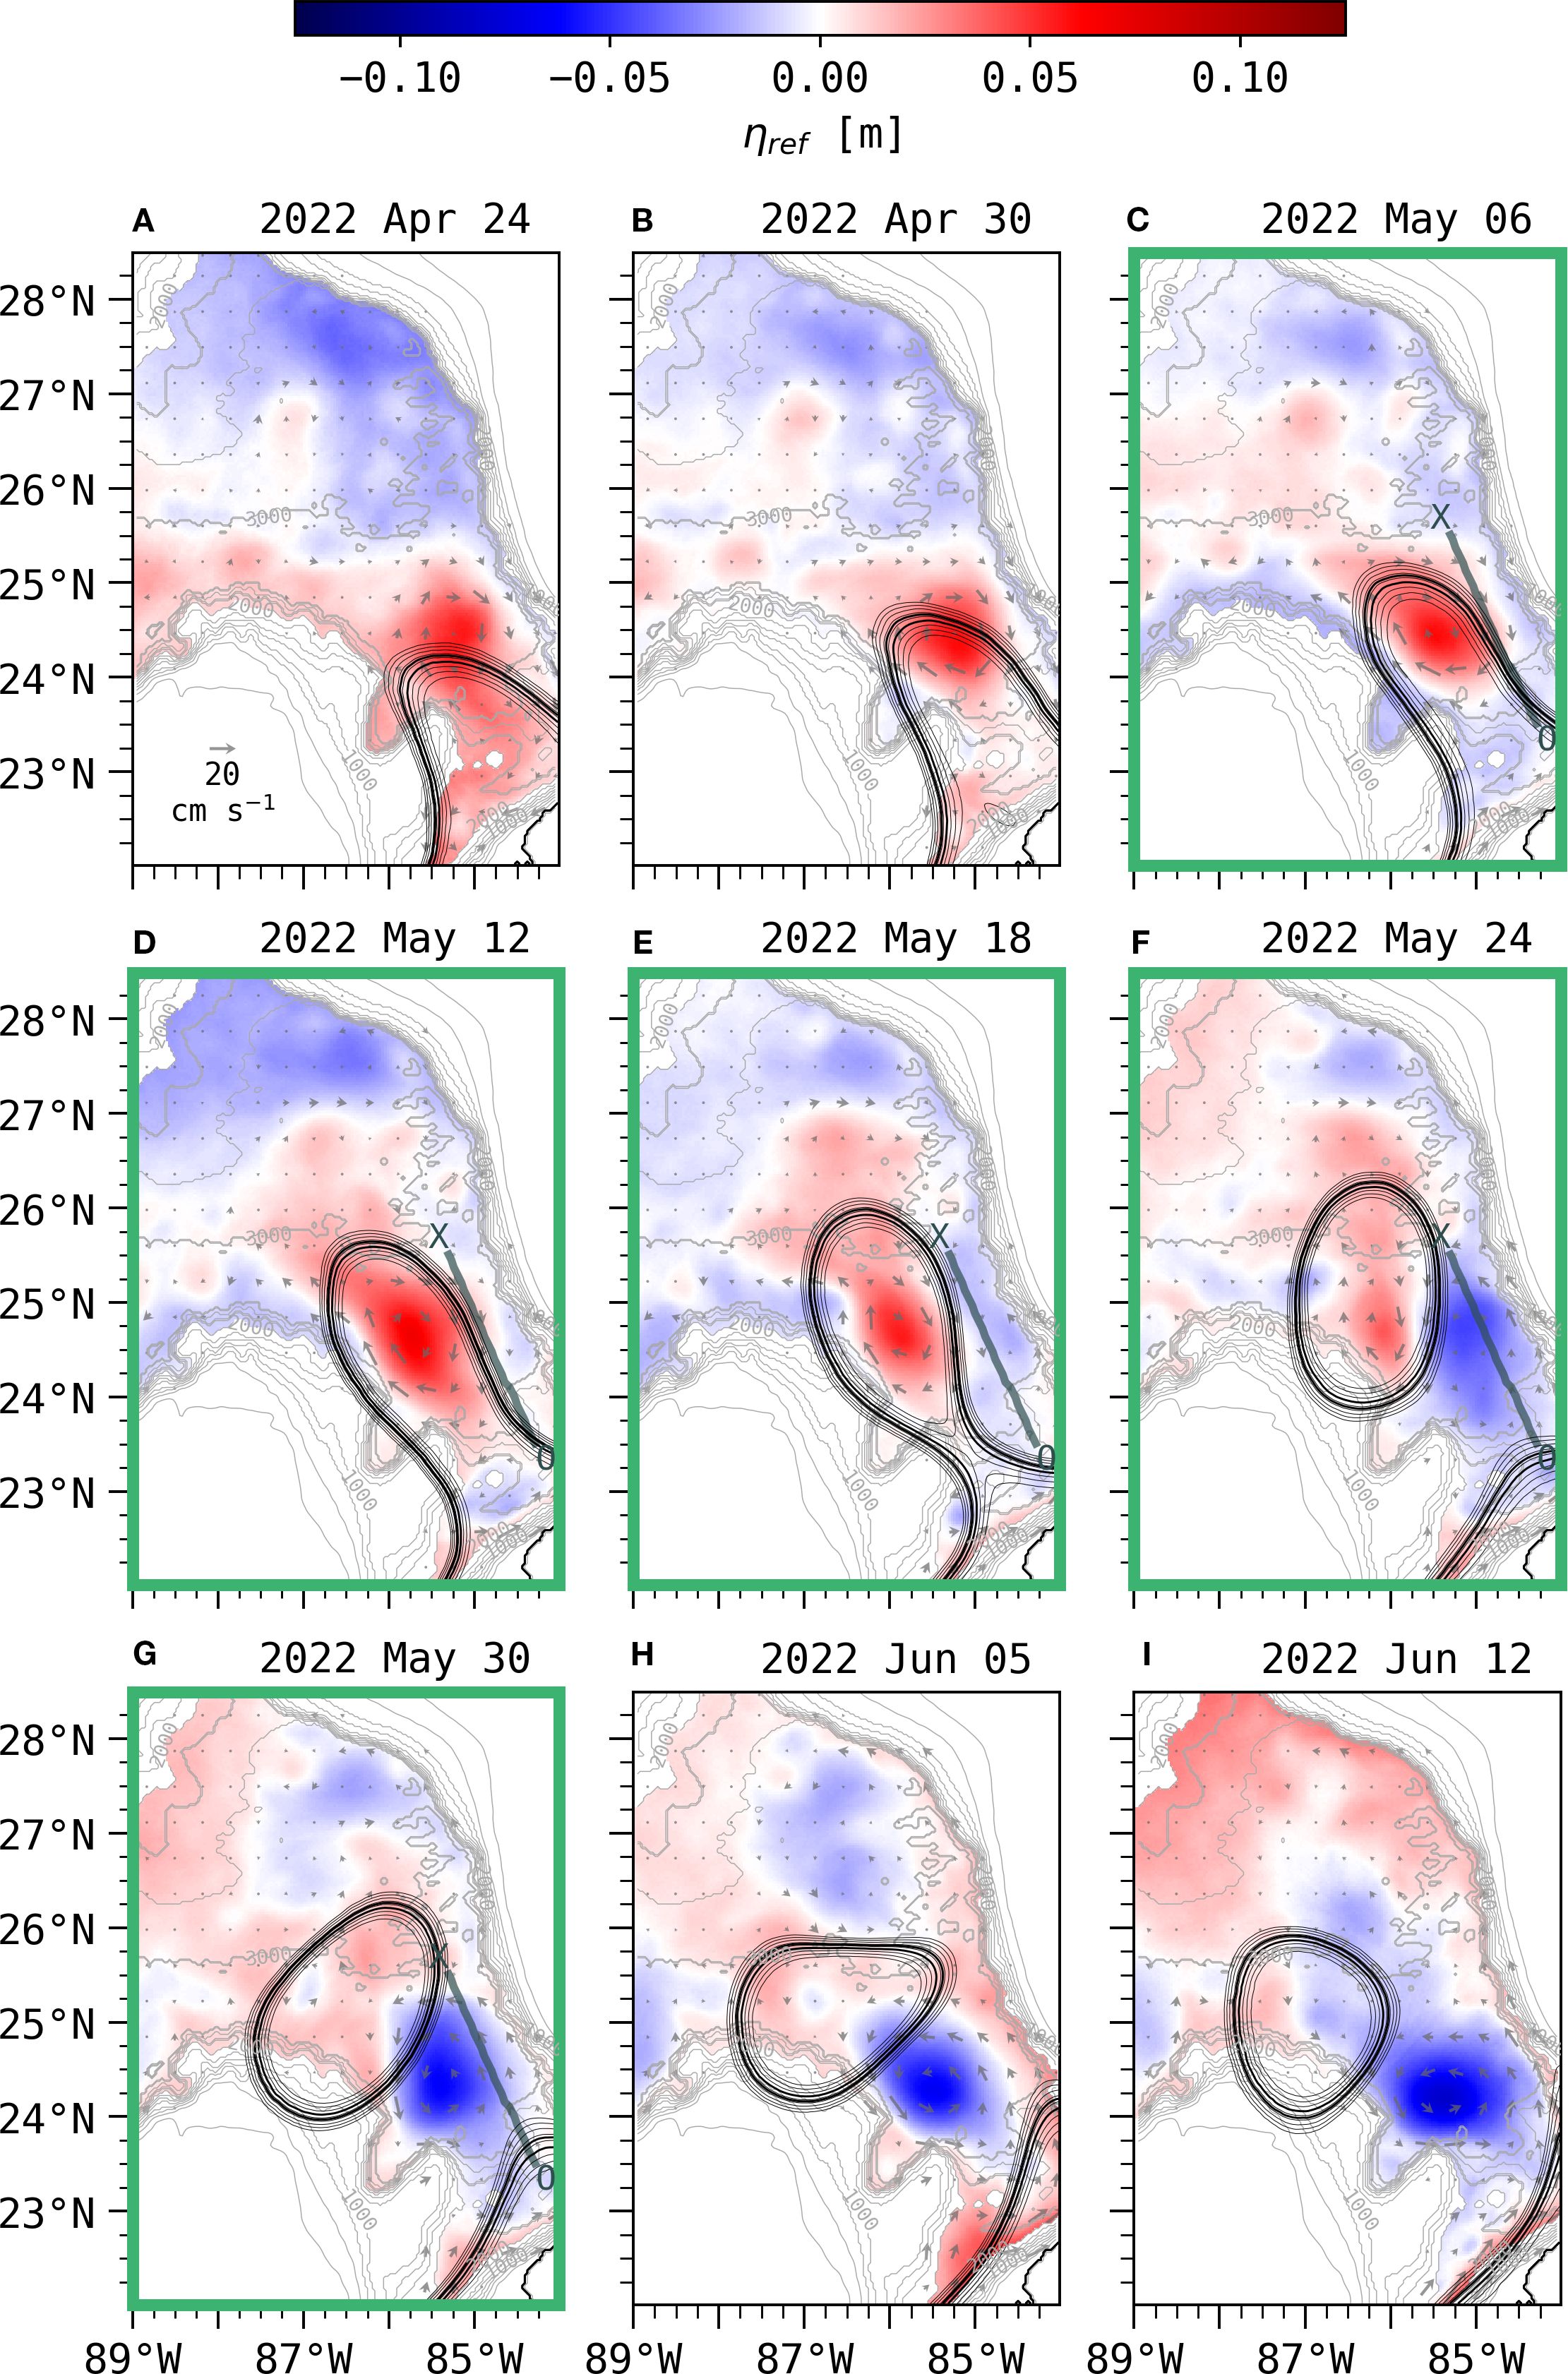
Figure 10. Same as Figure 6, but for Case 3 from (A) April 24, 2022 to (I) June 12, 2022.
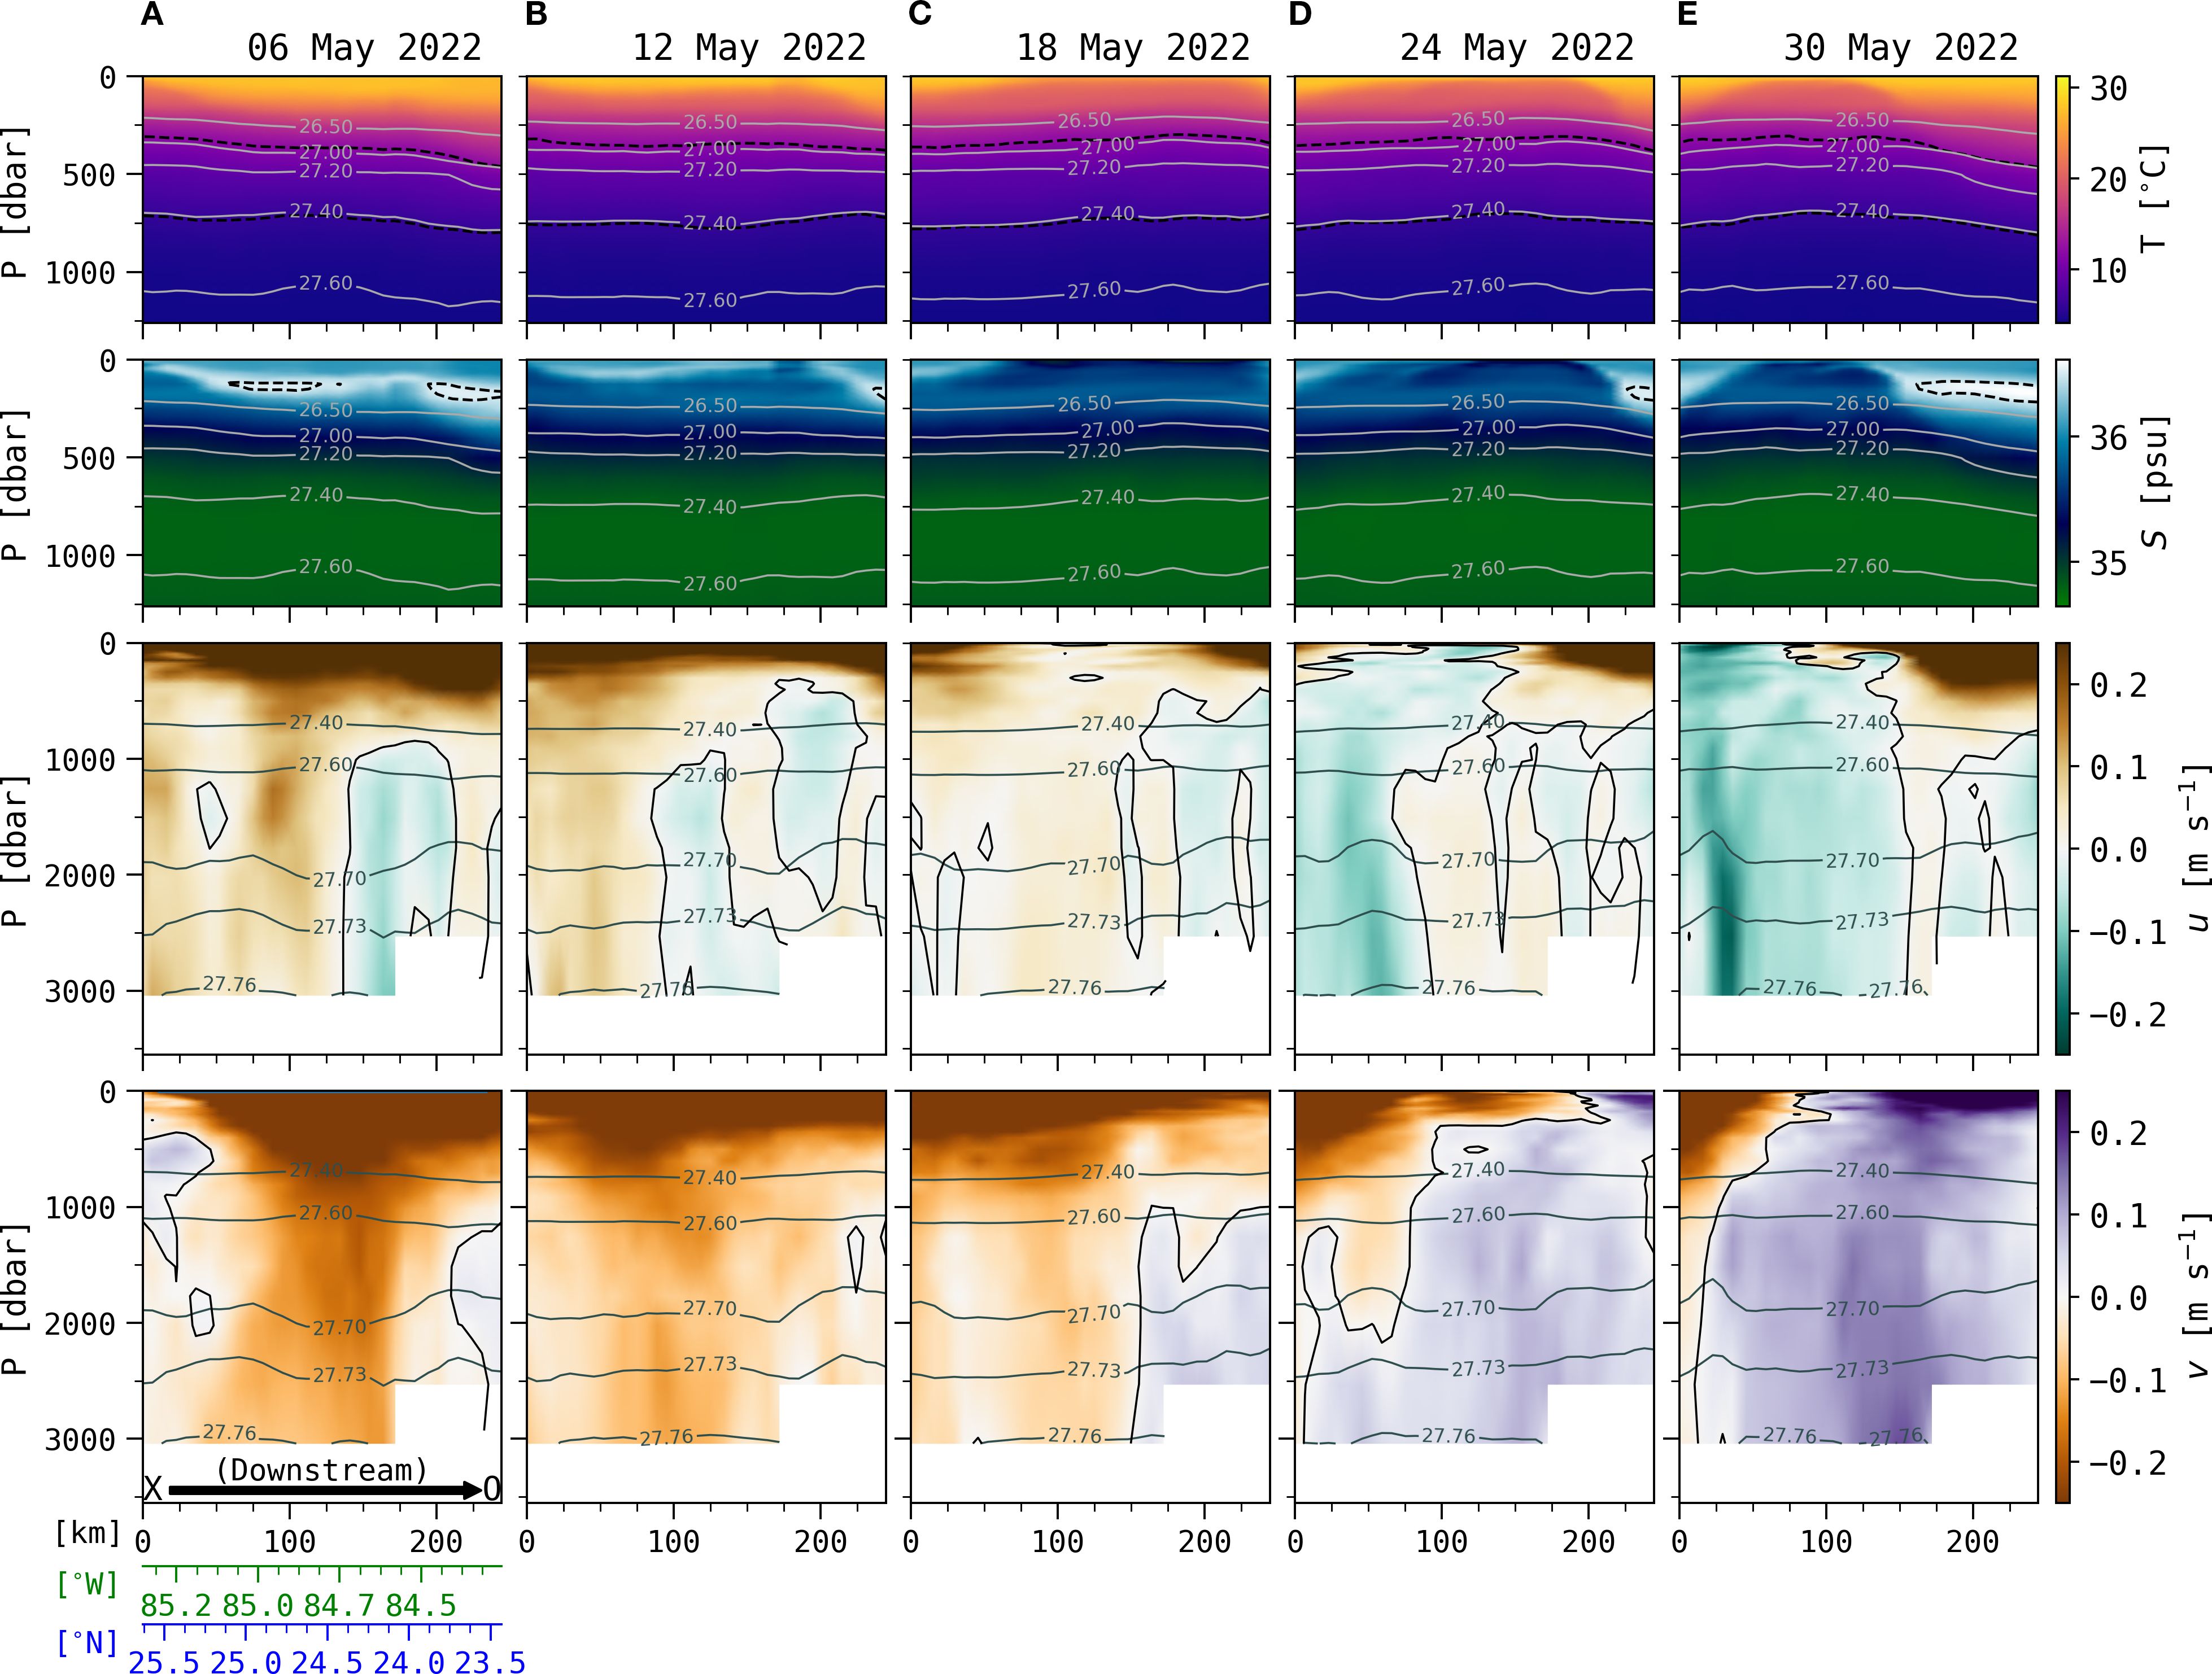
Figure 11. Same as Figure 7, but for Case 3 from (A) May 6, 2022 to (E) May 30, 2022.
In Case 3, the LC leans toward the western (Campeche Bank) wall, similar to Case 1, but here because the LC does not extend northwestward beyond the Campeche Bank, the induced deep eddies are laterally constrained by the DSC boundaries. As the leading edge of the LC extends northward, an anticyclone develops in place, blocked by the (Campeche) wall to its west. During May 12-18, 2022, at the southern section of that anticyclone, the deep flow crossing toward the deeper pycnocline side of the LC jet produces cyclonic vorticity entering and intensifying the upper trough. A deep cyclone grows from May 18–30 in accordance with the stretching lower layer as the LC recedes from the Florida Slope. A LCE has separated far enough north, overcoming the narrow DSC constraints, and is able to propagate around the northern Campeche Bank and move to the west. The nearly flat abyssal plain within the DSC south of 25°N appears to be a favorable location for deep cyclones, which evidently persist for 1 month or more. As demonstrated by Case 3, we suggest this is because as the lower layer stretches in the wake of a departing LCE, the potential vorticity anomaly increases, favoring cyclonic circulation (Furey et al., 2018), as is evident in the wake-like cyclone of this case (Figures 10F, G).
4.4 Case 4: LC meander shifts away from the West Florida Shelf
On February 2, 2021, the LC is extended to approximately 25°N, 86.5°W, with a deep anticyclone beneath its leading edge (Figure 12A). The western inflowing edge of the LC follows along the upper weakly sloped section of the Campeche Bank, while the features of interest occur along the eastern LC edge that flows southeastward. From February 13–25 the deep anticyclone currents are nearly 20 cm s−1 (Figure 12B), and are located to help extend the LC crest farther while drawing its eastern edge narrower, which develops a weak low pressure band all along the West Florida Shelf slope (Figures 12B, C). By March 08, the LC crest and the deep anticyclone centered near 25°N grow more dominant. A meander crest develops from March 14–20 on the northeast toward the West Florida Shelf slope near 25.5°N, 85°W (Figures 12E, F) together with a leading deep anticyclone in the pattern characteristic of baroclinic instability. On March 20, the LC meander crest extends eastward to the steep West Florida Shelf slope, and along 24°N the deep currents produce westward (cross-frontal) and upward stretching cyclonic vorticity in the upper currents as the LC trough intensifies and necks down (Figures 12F, G). Correspondingly along the XO transect during this March 14, 20, and 26 time interval, the thermocline along the West Florida Shelf slope deepens, with deeper isopycnals through 85.08°W, 25°N (Figure 13). The near-surface salinity maximum extends laterally along the West Florida Shelf slope for over 100 km (Figure 13B), and the panels of eastward flow indicate the characteristic tilted pattern of baroclinic instability with the deep field leading the upper flow. On March 26, the LC crest propagates southward in the DSC, along with the SUW salinity maximum and dipping isopycnals (Figure 13C), while a deep cyclone lagged by an upper trough jointly develop behind the steep crest (Figure 12G). By April 1, the LC has shed an eddy, which is large enough that around its periphery a meander crest and trough propagate while developing a deep cyclone near 24°N, 85.3°W during April 1-7. The strong deep currents of ∼20 cm s−1 tend to push the LCE away northwestward and the retreating LC southeastward toward a port-to-port mode.
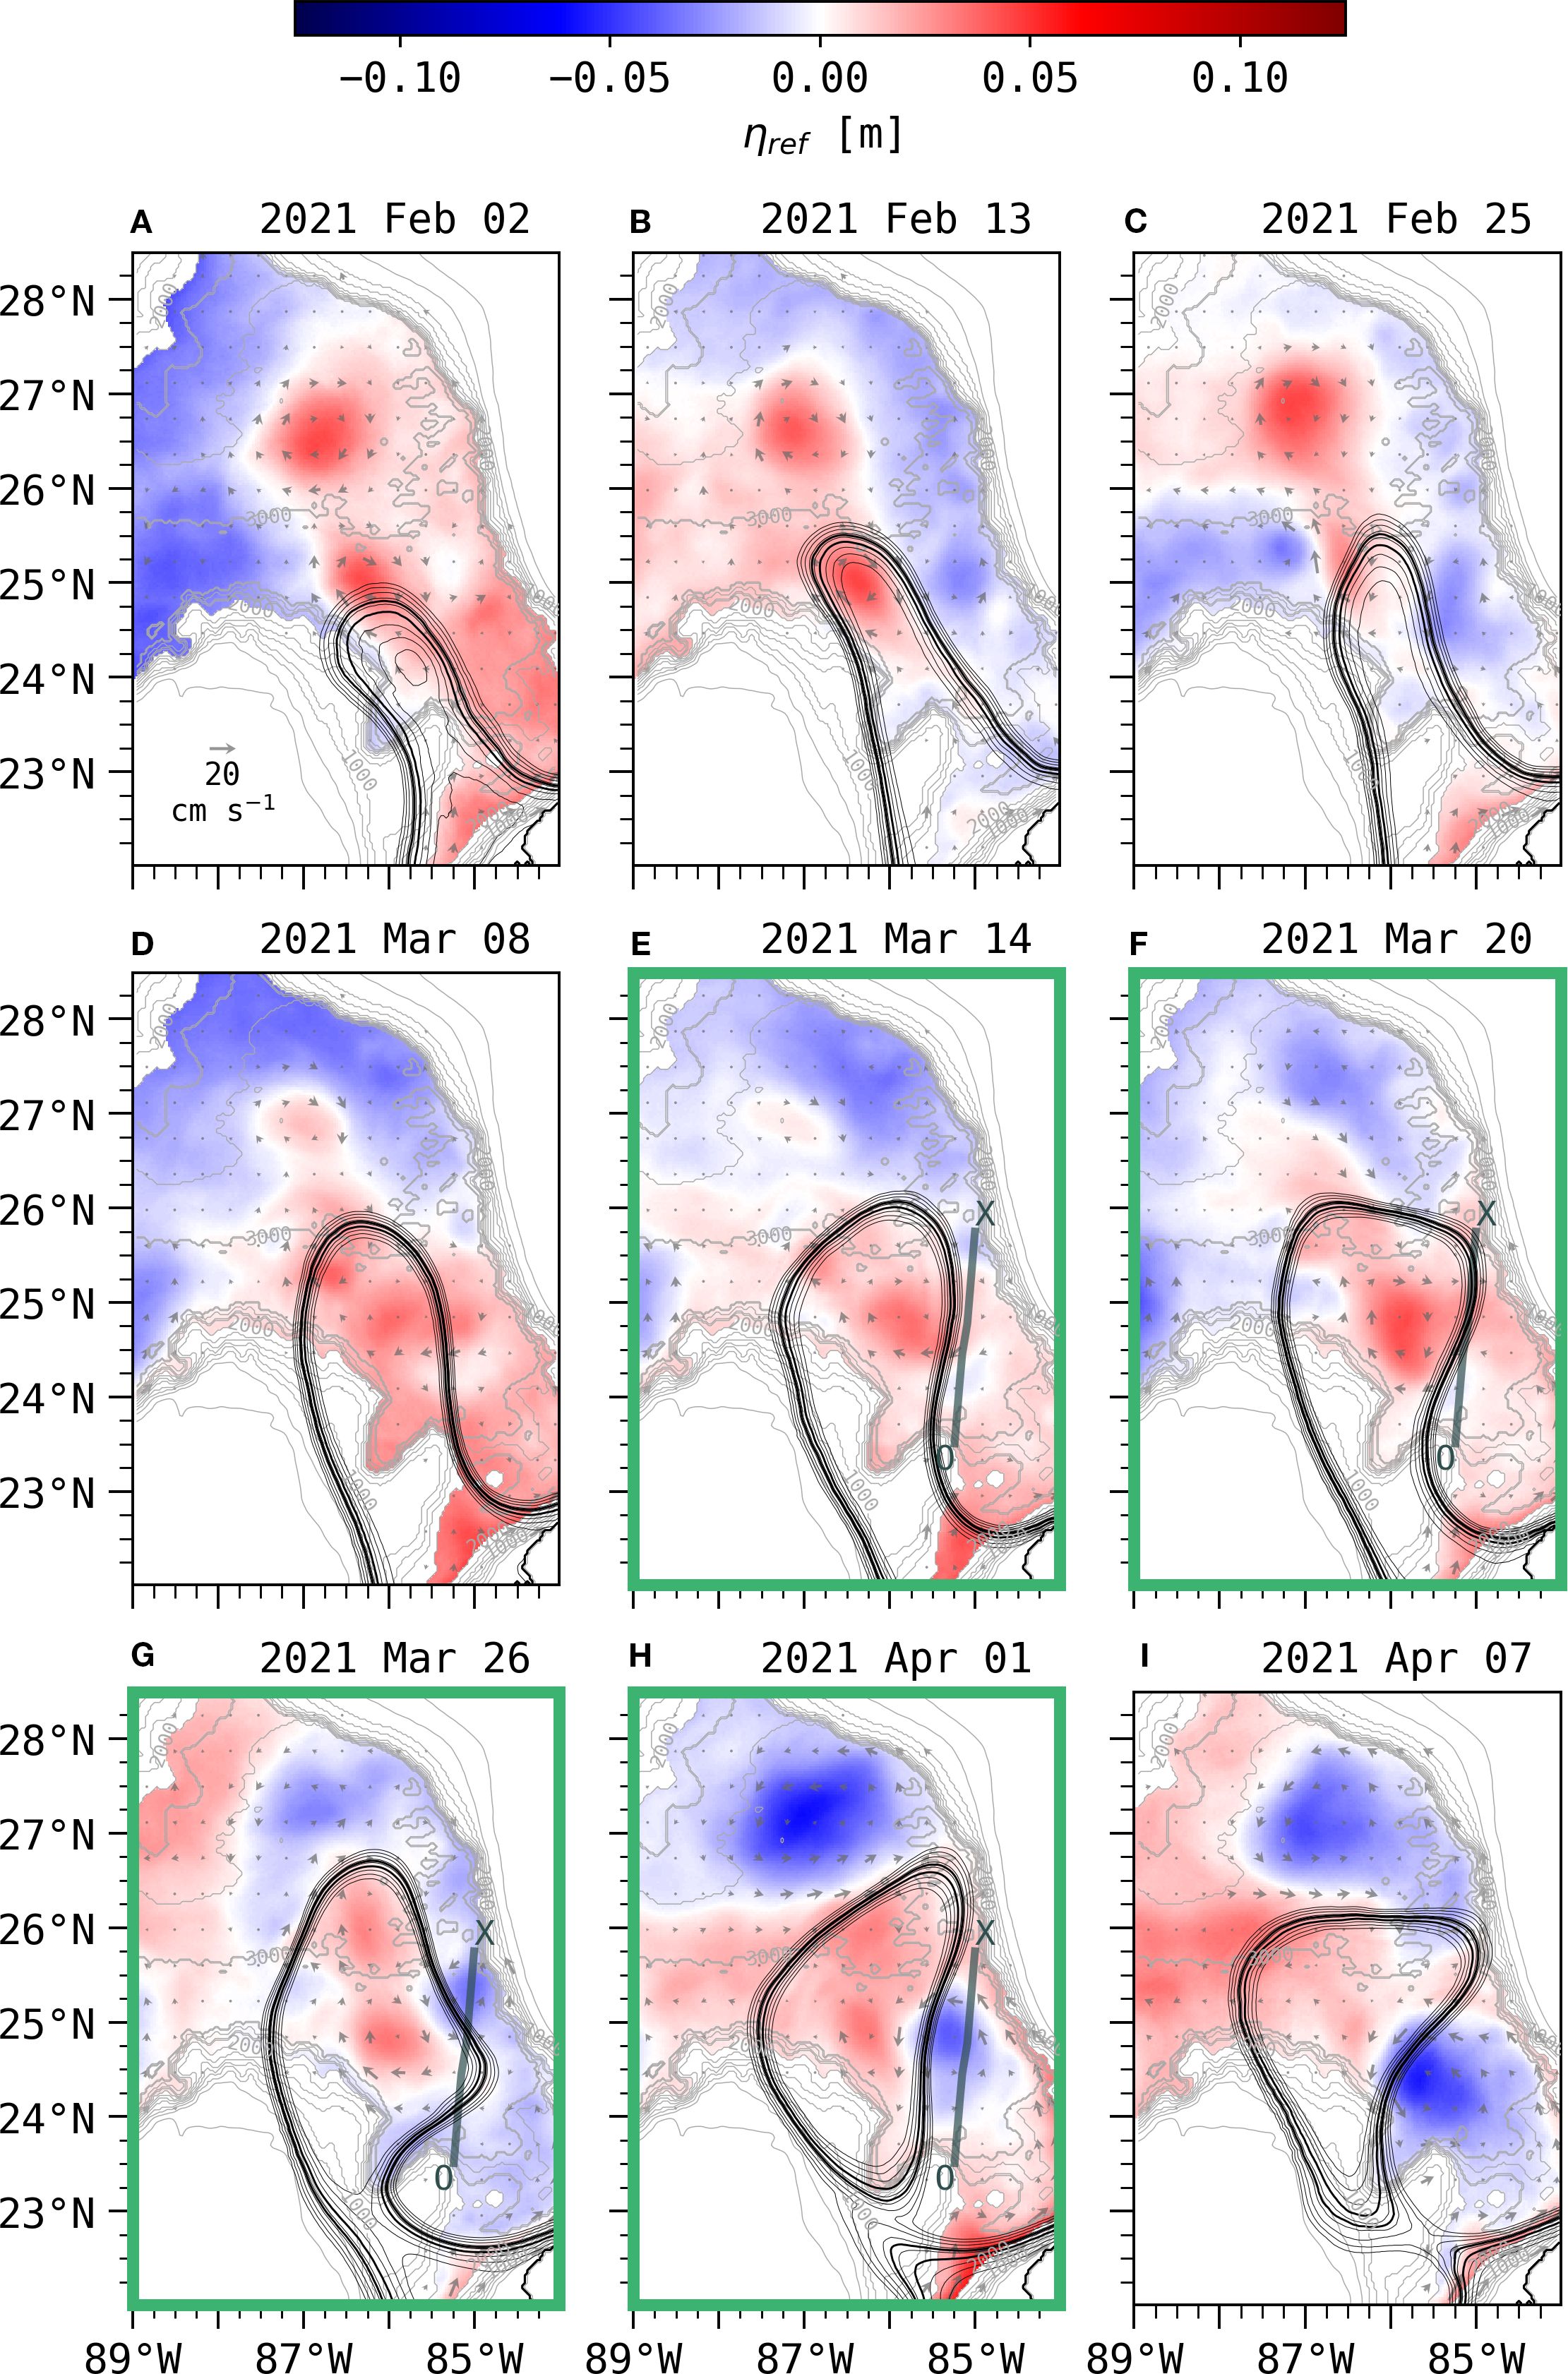
Figure 12. Same as Figure 6, but for Case 4. Note the variable time increments between (A–D) compared with (E–I).
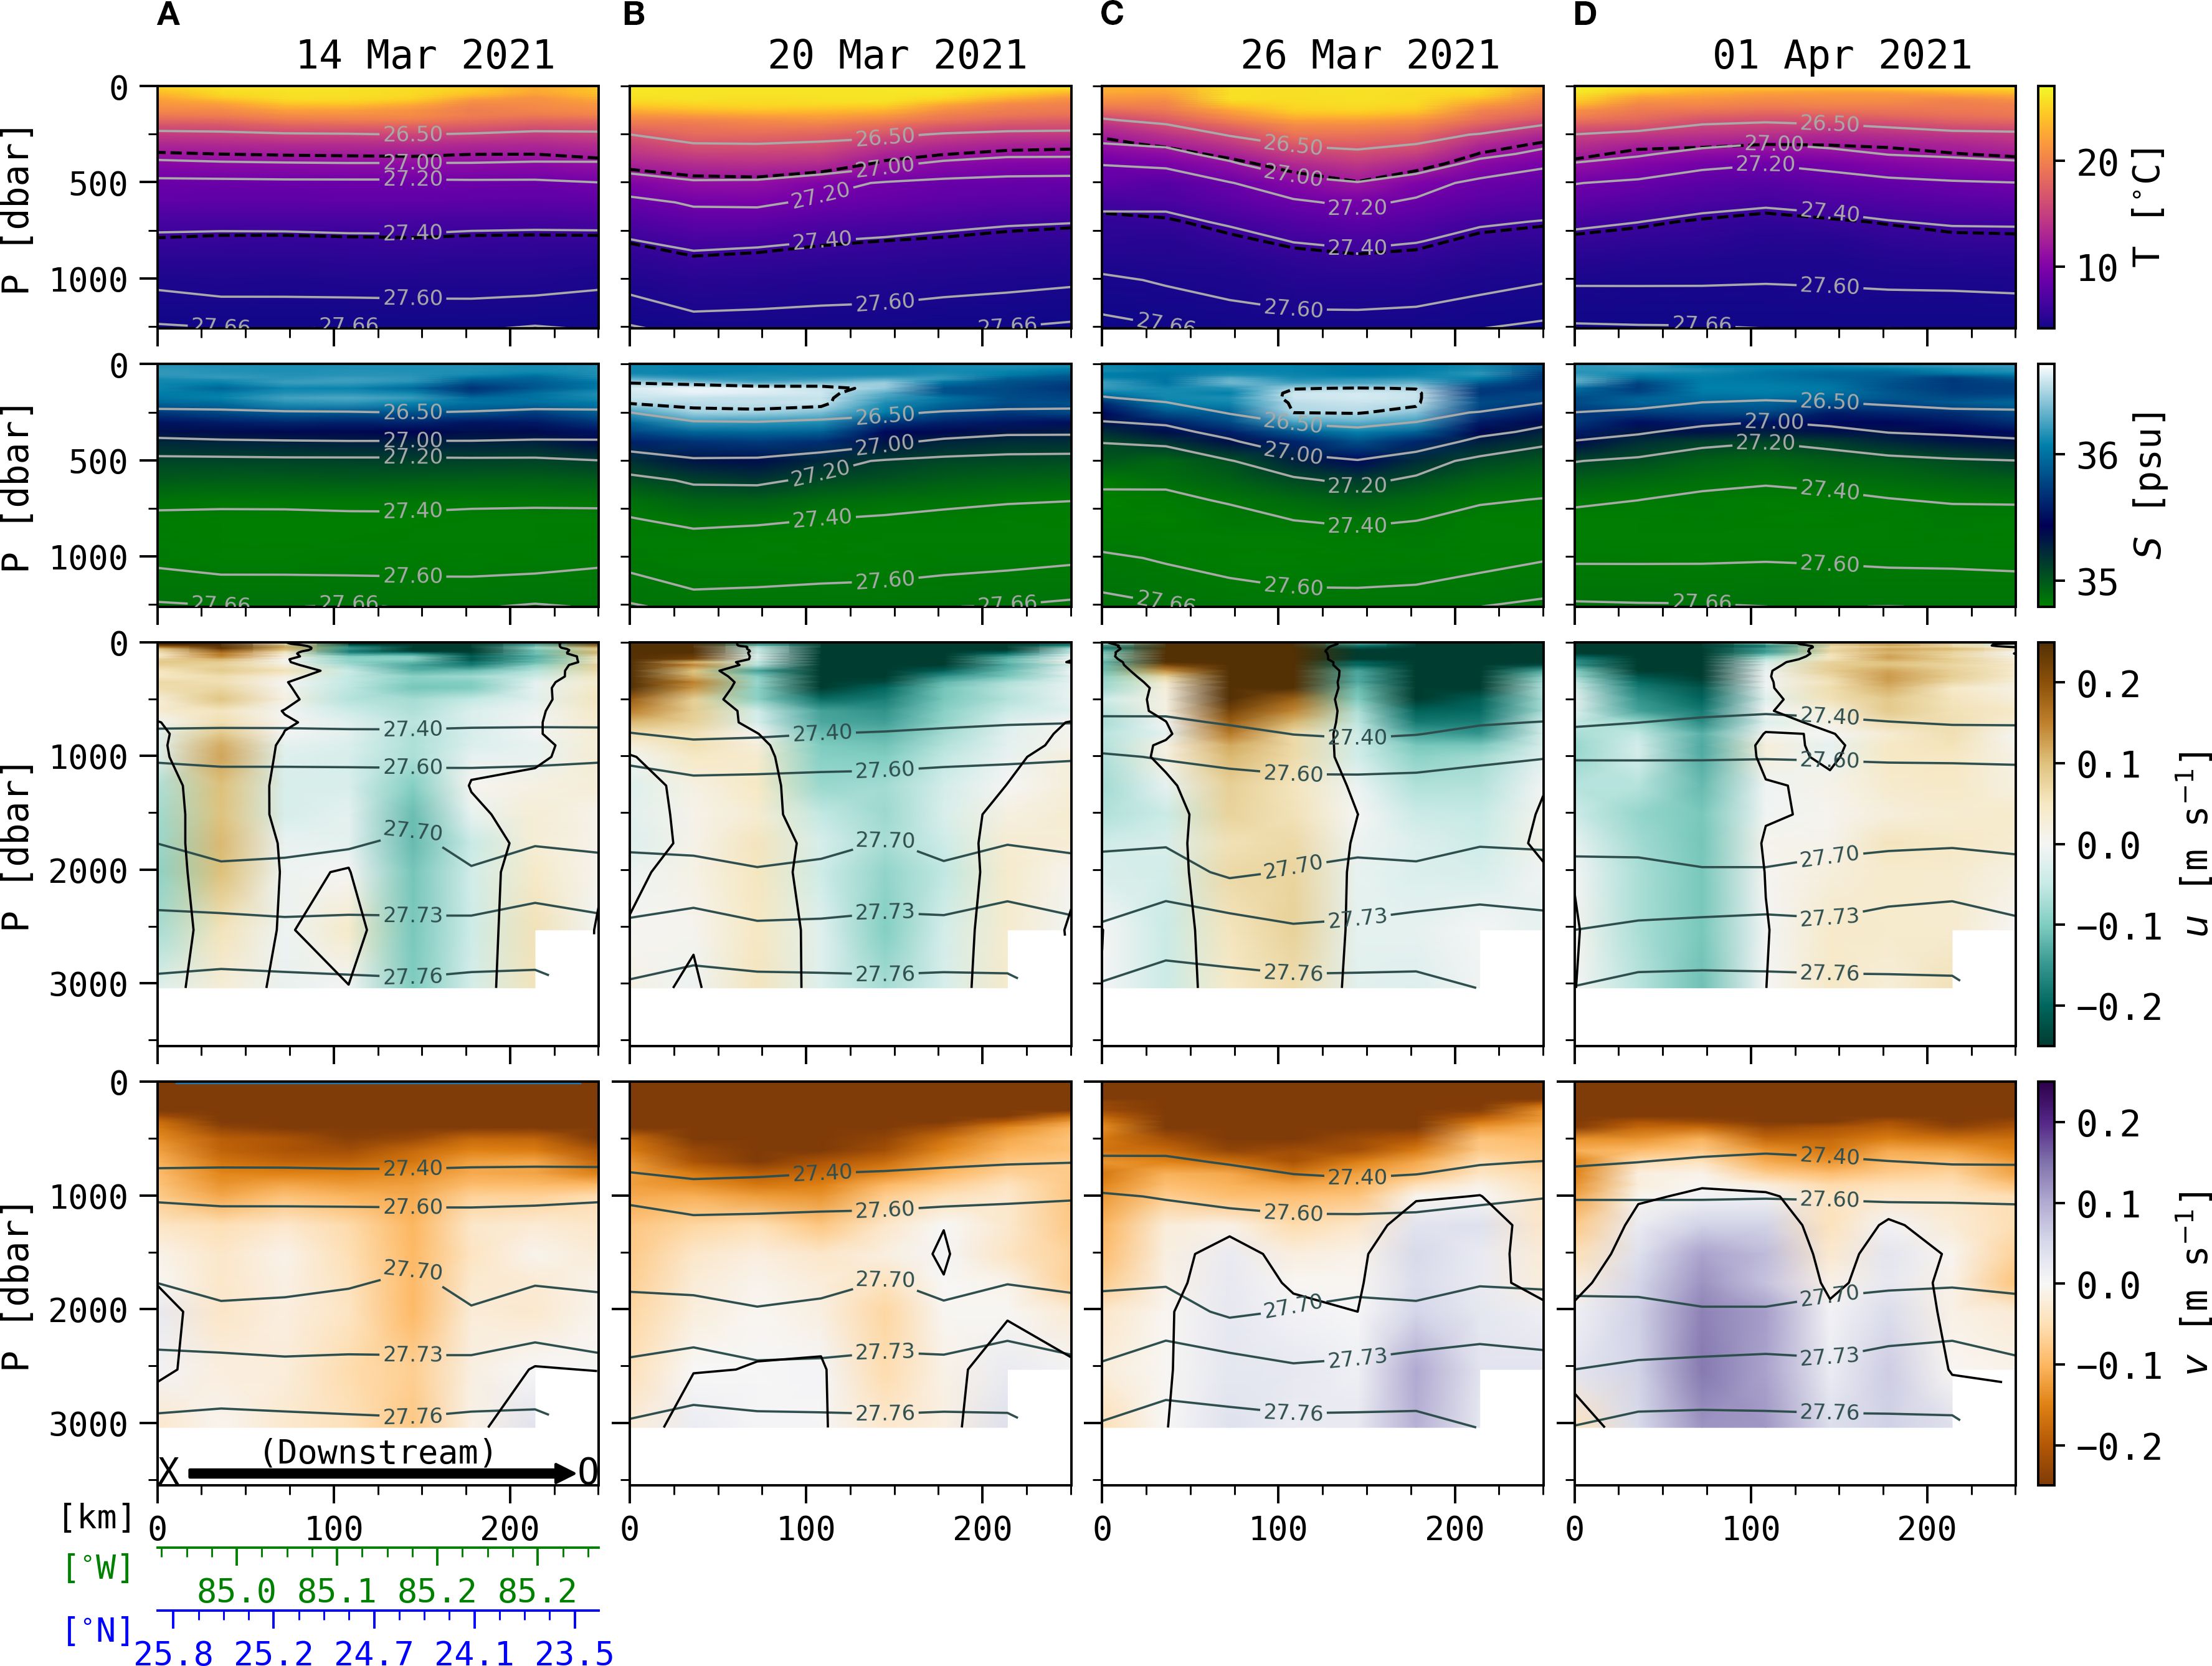
Figure 13. Same as Figure 7, but for Case 4 from (A) March 14, 2021 to (D) April 1, 2021.
Similar to Cases 2 and 3, in Case 4 the LC leans to the western DSC wall, but the LC extends to an intermediate latitude. The short extension in Case 3 constrained the size of the upper and deep eddies between the lateral walls and resulted in separating a small LCE. The longer extension in Case 2 was far enough to interact with the Mississippi Fan, and the LCE that separated was large enough that meanders propagated around its edge. Case 3 had a small diameter LCE, as did Case 1, which also separated within the narrow channel. For the constrained Cases 1 and 3, their small LCEs translated cleanly away from the north end of the LC. Their LCE diameters were too small to allow peripheral meanders to attach to the LC. Alternatively, in Cases 2 and 4, the upper LCE that formed was less constrained by the narrow DSC boundaries. These LCEs were large enough to develop meanders such that crests on the LC and LCE could interact. For Case 4 the deep cyclone in the DSC facilitated final separation between the LCE and LC.
5 Conclusions
In this study, four cases are chosen from a relatively high-resolution NCOM 6-year free run to illustrate strong interactions between the advancing and meandering upper LC and deep eddies. These six model years highlight four southern separation events. The deep cyclones are a persistent feature northwest of the Yucatán Strait inflow in the deep southeastern basin between the Campeche Slope and Florida Slope, which we refer to as the Deep Southeast Channel (DSC). Four cases where LC eddy shedding occurs illustrate important interactions between variability in the upper baroclinic jet and deep eddies whose reference currents are nearly depth-independent throughout the water column. When a LC meander trough recedes from the steep DSC walls, the water column is stretched by the sloped LC pycnocline. The DSC side-walls (the Campeche Slope to the west and the Florida Slope to the east) constrain the deep eddies from translating laterally, allowing these deep features to exhibit a persisting influence upon the upper LC. Indeed, RAFOS and APEX profiling float observations have reported deep mean cyclonic circulation in the DSC (Pérez-Brunius et al., 2018), and the model results demonstrate that a deep mesoscale eddy with nearly depth-independent structure below ∼1200 m spans most of the channel width. The relatively few observations available from the DSC show it is a favorable location for deep cyclones.
The importance of LC interaction with topography has long been recognized, with particular attention to the northern Campeche Bank, the Mississippi Fan, and the West Florida Shelf (e.g. Hurlburt and Thompson, 1982; Chérubin et al., 2006; Le Hénaff et al., 2014; Nickerson et al., 2022; Ge et al., 2025). As the LC flows northward off the Campeche Bank, small meanders form and deepen, coupled with deep perturbations that intensify through vortex stretching (Hurlburt and Thompson, 1982; Chérubin et al., 2006). At the Mississippi Fan, squashing and re-stretching processes occur, again coupling deep eddies with upper-ocean meanders (Le Hénaff et al., 2014). Liu et al. (2016) identified a “pressure point” along the West Florida Shelf near the Dry Tortugas, where contact between the LC and the shallow shelf acts to anchor the current. As long as the LC remains in contact with the shelf at this location, it cannot progress further into the Gulf. Olvera-Prado et al. (2023) also focus on the importance of upper-deep coupling in the steep regions of eastern GOM, particularly the West Florida Slope. Yang et al. (2020) use a multi-scale eddy-mean energetics analysis to demonstrate upper-deep joint development in the deep eastern Gulf where they show a baroclinic energy transfer from mean to eddy fields. This current paper presents another instance of LC–topography interaction in a region that has been largely overlooked, yet it appears to play a significant role in the eddy shedding cycle.
In this free-running realistic model the deep cyclones develop frequently, dominate the local circulation, persist for several weeks, and can facilitate the separation of LCEs. Therefore, we suggest the DSC as a suitable location for near real time observations of the deep flow, using Lagrangian and moored methods, to be assimilated into forecasting models. The central pressure low of the deep cyclone is difficult to detect via satellite and upper-ocean observations, but APEX floats tend to recirculate within this region, and some remain for months. The water velocity at the ∼1500 m float parking depth can be estimated from lateral offsets between successive vertical profiles, and the time-varying deep field could be mapped from a suitable set of floats. Additionally, because the location of cyclone development appears to be so consistent, deep current moorings, bottom pressure sensors, or CPIES, could be placed at a small number of sites to help map the deep flow, and their data could be harvested and relayed ashore by satellite.
Data availability statement
The datasets presented in this study can be found in online repositories. The entire 6-year NCOM model output is being hosted by the Gulf of Mexico Research Initiative Information and Data Cooperative (GRIIDC) repository, and is available at https://doi.org/10.7266/75hv8v6s.
Author contributions
AS: Validation, Methodology, Writing – review & editing, Visualization, Investigation, Data curation, Software, Writing – original draft, Formal analysis, Conceptualization. KD: Writing – original draft, Resources, Methodology, Formal analysis, Investigation, Conceptualization, Project administration, Funding acquisition, Writing – review & editing, Supervision. CR: Writing – review & editing, Resources, Project administration, Supervision, Methodology, Data curation, Software. PT: Software, Supervision, Resources, Writing – review & editing, Data curation, Methodology. DW: Funding acquisition, Project administration, Writing – review & editing, Supervision, Formal analysis, Resources, Writing – original draft, Methodology, Conceptualization, Investigation.
Funding
The author(s) declare financial support was received for the research and/or publication of this article. We gratefully acknowledge funding from the US National Academy of Science, Engineering, and Medicine (NASEM) under their Gulf Research Program, UGOS grants, 2000009943, and 200013145. We also gratefully acknowledge funding from the US Naval Research Laboratory – Stennis Space Center via Office of Naval Research Cooperative Agreement N00173-22-2-C005.
Acknowledgments
We thank Karen Tracey, Maureen Kennelly and Alexis Johnson Exley for technical assistance and Steve Morey for discussions regarding numerical modeling. Justin Cooke and Andrew Wyatt Smith provided helpful comments which improved the manuscript. The Authors are grateful to the two Reviewers for their insightful comments, which helped improve the quality of this manuscript.
Conflict of interest
The authors declare that the research was conducted in the absence of any commercial or financial relationships that could be construed as a potential conflict of interest.
Generative AI statement
The author(s) declare that no Generative AI was used in the creation of this manuscript.
Any alternative text (alt text) provided alongside figures in this article has been generated by Frontiers with the support of artificial intelligence and reasonable efforts have been made to ensure accuracy, including review by the authors wherever possible. If you identify any issues, please contact us.
Publisher’s note
All claims expressed in this article are solely those of the authors and do not necessarily represent those of their affiliated organizations, or those of the publisher, the editors and the reviewers. Any product that may be evaluated in this article, or claim that may be made by its manufacturer, is not guaranteed or endorsed by the publisher.
References
Carnes M. R., Helber R. W., Barron C. N., and Dastugue J. (2010). Validation Test Report for GDEM4.NRL Tech Report NRL/MR/7330--10-9271 (Naval Research Laboratory, 2010). doi: 10.21236/ADA530343
Chereskin T., Donohue K., Watts D., Tracey K., Firing Y., and Cutting A. (2009). Strong bottom currents and cyclogenesis in Drake Passage. Geophysical Res. Lett. 36. doi: 10.1029/2009GL040940
Chérubin L. M., Morel Y., and Chassignet E. P. (2006). Loop Current ring shedding: The formation of cyclones and the effect of topography. J. Phys. Oceanography 36, 569–591. doi: 10.1175/JPO2871.1
Cushman-Roisin B. and Beckers J.-M. (2011). Introduction to geophysical fluid dynamics: physical and numerical aspects (Academic press).
Donohue K. A., Hamilton P., Leaman K., Leben R., Prater M., Watts D., et al. (2006). Exploratory study of deepwater currents in the Gulf of Mexico (Gulf of Mexico: US Department of the Interior, Minerals Management Service).
Donohue K. A., Watts D., Hamilton P., Leben R., and Kennelly M. (2016b). Loop Current Eddy formation and baroclinic instability. Dynamics Atmospheres Oceans 76, 195–216. doi: 10.1016/j.dynatmoce.2016.01.004
Donohue K. A., Watts D., Hamilton P., Leben R., Kennelly M., and Lugo-Fernández A. (2016a). Gulf of Mexico Loop Current path variability. Dynamics Atmospheres Oceans 76, 174–194. doi: 10.1016/j.dynatmoce.2015.12.003
Dukhovskoy D. S., Chassignet E. P., Bozec A., and Morey S. L. (2023). Assessment of predictability of the Loop Current in the Gulf of Mexico from observing system experiments and observing system simulation experiments. Front. Mar. Sci. 10, 1153824. doi: 10.3389/fmars.2023.1153824
Ernst P. A., Subrahmanyam B., Trott C. B., and Chaigneau A. (2023). Characteristics of submesoscale eddy structures within mesoscale eddies in the Gulf of Mexico from 1/48° ECCO estimates. Front. Mar. Sci. 10, 1181676. doi: 10.3389/fmars.2023.1181676
Furey H., Bower A., Perez-Brunius P., Hamilton P., and Leben R. (2018). Deep eddies in the Gulf of Mexico observed with floats. J. Phys. Oceanography 48, 2703–2719. doi: 10.1175/JPO-D-17-0245.1
Ge X., DiMarco S. F., Liu Y., Chang P., Fu D., Kurian J., et al. (2025). Role of midwater mixed waves in the Loop Current separation events from a coupled ocean-atmosphere regional model and in situ observations. J. Geophysical Research: Oceans 130, e2024JC021330. doi: 10.1029/2024JC021330
Hamilton P. (2009). Topographic rossby waves in the Gulf of Mexico. Prog. Oceanography 82, 1–31. doi: 10.1016/j.pocean.2009.04.019
Hamilton P., Bower A., Furey H., Leben R., and Pérez-Brunius P. (2019). The Loop Current: Observations of deep eddies and topographic waves. J. Phys. Oceanography 49, 1463–1483. doi: 10.1175/JPO-D-18-0213.1
Hamilton P., Donohue K., Hall C., Leben R., Quian H., Sheinbaum J., et al. (2015). Observations and dynamics of the loop current. US Dept. of the Interior, Bureau of Ocean Energy Management, Gulf of Mexico OCS Region.
Hamilton P., Donohue K. A., Leben R., Lugo-Fernández A., and Green R. (2011). Loop Current observations during spring and summer of 2010: Description and historical perspective. Monit. Modeling Deepwater Horizon Oil Spill: A Record-Breaking Enterprise Geophys. Monogr. Ser. 195, 117–130. doi: 10.1029/2011GM001116
Hamilton P., Lugo-Fernández A., and Sheinbaum J. (2016). A Loop Current experiment: Field and remote measurements. Dynamics Atmospheres Oceans 76, 156–173. doi: 10.1016/j.dynatmoce.2016.01.005
Hogan T. F., Liu M., Ridout J. A., Peng M. S., Whitcomb T. R., Ruston B. C., et al. (2014). The navy global environmental model. Oceanography 27, 116–125. doi: 10.5670/oceanog.2014.73
Howden S. (2000). The three dimensional secondary circulation in developing Gulf Stream meanders. J. Phys. Oceanography 30, 888–915. doi: 10.1175/1520-0485(2000)030<0888:TTDSCI>2.0.CO;2
Hurlburt H. E. (1986). Dynamic transfer of simulated altimeter data into subsurface information by a numerical ocean model. J. Geophysical Research: Oceans 91, 2372–2400. doi: 10.1029/JC091iC02p02372
Hurlburt H. E. and Thompson J. D. (1982). “The dynamics of the Loop Current and shed eddies in a numerical model of the Gulf of Mexico,” in Elsevier Oceanography Series, vol. 34. (Elsevier), 243–297.
Inoue M., Welsh S. E., Rouse L. J. Jr., and Weeks E. (2008). Deepwater currents in the eastern Gulf of Mexico: Observations at 25.5 N and 87 W. (United States: Department of the Interior).
Johnson A., Donohue K. A., Watts D. R., Tracey K. L., and Kennelly M. A. (2022). Generation of high-frequency topographic Rossby waves in the Gulf of Mexico. Front. Mar. Sci. 9, 2683. doi: 10.3389/fmars.2022.1049645
Kantha L. (2014). Empirical models of the Loop Current eddy detachment/separation time in the Gulf of Mexico. J. waterway port coastal ocean Eng. 140, 04014001. doi: 10.1061/(ASCE)WW.1943-5460.0000220
Leben R. R. (2005). Altimeter-derived loop current metrics. Geophysical Monograph-American Geophysical Union 161, 181. doi: 10.1029/161GM15
Le Hénaff M., Domingues R., Halliwell G., Zhang J. A., Kim H.-S., Aristizabal M., et al. (2021). The role of the Gulf of Mexico ocean conditions in the intensification of Hurricane Michael (2018). J. Geophysical Research: Oceans 126, e2020JC016969. doi: 10.1029/2020JC016969
Le Hénaff M., Kourafalou V. H., Dussurget R., and Lumpkin R. (2014). Cyclonic activity in the eastern Gulf of Mexico: Characterization from along-track altimetry and in situ drifter trajectories. Prog. Oceanography 120, 120–138. doi: 10.1016/j.pocean.2013.08.002
Lindstrom S., Qian X., and Watts D. (1997). Vertical motion in the Gulf Stream and its relation to meanders. J. Geophysical Research: Oceans 102, 8485–8503. doi: 10.1029/96JC03498
Liu Y., Weisberg R. H., Lenes J. M., Zheng L., Hubbard K., and Walsh J. J. (2016). Offshore forcing on the “pressure point” of the West Florida Shelf: Anomalous upwelling and its influence on harmful algal blooms. J. Geophysical Research: Oceans 121, 5501–5515. doi: 10.1002/2016JC011938
Lugo-Fernández A., Leben R. R., and Hall C. A. (2016). Kinematic metrics of the Loop Current in the Gulf of Mexico from satellite altimetry. Dynamics Atmospheres Oceans 76, 268–282. doi: 10.1016/j.dynatmoce.2016.01.002
Martin P. J., Barron C. N., Smedstad L. F., Campbell T. J., Wallcraft A. J., Rhodes R. C., et al. (2009). User’s manual for the Navy Coastal Ocean Model (NCOM) version 4.0. Tech. Rep. doi: 10.21236/ADA508063
Mellor G. L. and Yamada T. (1974). A hierarchy of turbulence closure models for planetary boundary layers. J. atmospheric Sci. 31, 1791–1806. doi: 10.1175/1520-0469(1974)031<1791:AHOTCM>2.0.CO;2
Mellor G. L. and Yamada T. (1982). Development of a turbulence closure model for geophysical fluid problems. Rev. Geophysics 20, 851–875. doi: 10.1029/RG020i004p00851
Metzger E. J., Smedstad O. M., Thoppil P. G., Hurlburt H. E., Cummings J. A., Wallcraft A. J., et al. (2014). US Navy operational global ocean and Arctic ice prediction systems. Oceanography 27, 32–43. doi: 10.5670/oceanog.2014.66
Morey S. L., Gopalakrishnan G., Sanz E. P., De Souza J. M. A. C., Donohue K. A., Pérez-Brunius P., et al. (2020). Assessment of numerical simulations of deep circulation and variability in the Gulf of Mexico using recent observations. J. Phys. Oceanography 50, 1045–1064. doi: 10.1175/JPO-D-19-0137.1
Nickerson A. K., Weisberg R. H., and Liu Y. (2022). On the evolution of the Gulf of Mexico Loop Current through its penetrative, ring shedding and retracted states. Adv. Space Res. 69, 4058–4077. doi: 10.1016/j.asr.2022.03.039
Oey L. (2008). Loop Current and deep eddies. J. Phys. Oceanography 38, 1426–1449. doi: 10.1175/2007JPO3818.1
Oey L., Ezer T., and Lee H. (2005). Loop Current, rings and related circulation in the Gulf of Mexico: A review of numerical models and future challenges. Geophysical Monograph-American Geophysical Union 161, 31. doi: 10.1029/161GM04
Olvera-Prado E. R., Moreles E., Zavala-Hidalgo J., and Romero-Centeno R. (2023). Upper–lower layer coupling of recurrent circulation patterns in the Gulf of Mexico. J. Phys. Oceanography 53, 533–550. doi: 10.1175/JPO-D-21-0281.1
Pérez-Brunius P., Furey H., Bower A., Hamilton P., Candela J., García-Carrillo P., et al. (2018). Dominant circulation patterns of the deep Gulf of Mexico. J. Phys. Oceanography 48, 511–529. doi: 10.1175/JPO-D-17-0140.1
Pichevin T. and Nof D. (1997). The momentum imbalance paradox. Tellus A 49, 298–319. doi: 10.3402/tellusa.v49i2.14484
Rosburg K. C., Donohue K. A., and Chassignet E. P. (2016). Three-dimensional model-observation comparison in the Loop Current region. Dynamics Atmospheres Oceans 76, 283–305. doi: 10.1016/j.dynatmoce.2016.05.001
Savidge D. K. and Bane J. M. (1999). Cyclogenesis in the deep ocean beneath the Gulf Stream: 1. Description. J. Geophysical Research: Oceans 104, 18111–18126. doi: 10.1029/1999JC900132
Schmitz W. J. Jr (2005). Cyclones and westward propagation in the shedding of anticyclonic rings from the Loop Current. Geophysical Monograph Ser. 161, 241–261. doi: 10.1029/161GM18
Shay L. K., Jaimes B., Brewster J. K., Meyers P., McCaskill E. C., Uhlhorn E., et al. (2011). Airborne ocean surveys of the Loop Current complex from NOAA WP-3D in support of the Deepwater Horizon oil spill. Monitoring and Modeling the Deepwater Horizon Oil Spill: A Record-Breaking Enterprise. Geophys. Monogr. Ser. 195, 131–151. doi: 10.1029/2011GM001101
Sturges W. and Leben R. (2000). Frequency of ring separations from the Loop Current in the Gulf of Mexico: A revised estimate. J. Phys. Oceanography 30, 1814–1819. doi: 10.1175/1520-0485(2000)030<1814:FORSFT>2.0.CO;2
Sutyrin G. G., Ginis I., and Frolov S. A. (2001). Equilibration of baroclinic meanders and deep eddies in a Gulf Stream–type jet over a sloping bottom. J. Phys. Oceanography 31, 2049–2065. doi: 10.1175/1520-0485(2001)031<2049:EOBMAD>2.0.CO;2
Thoppil P. G., Rowley C. D., Hogan P. J., and Stear J. (2025). Evaluating the performance of an ensemble forecast system in predicting Loop Current Eddy separation in the Gulf of Mexico. Prog. Oceanography 237, 103529. doi: 10.1016/j.pocean.2025.103529
Watts D. R., Tracey K. L., Bane J. M., and Shay T. J. (1995). Gulf Stream path and thermocline structure near 74 W and 68 W. J. Geophysical Research: Oceans 100, 18291–18312. doi: 10.1029/95JC01850
Welsh S. E., Inoue M., Rouse L. J. Jr., and Weeks E. (2009). Observation of the deepwater manifestation of the Loop Current and Loop Current rings in the eastern Gulf of Mexico. OCS Study MMS 2009-050. 50, 110.
Keywords: Gulf of Mexico, Loop Current, cyclones, NCOM, UGOS, vertical stretching, Loop Current eddies
Citation: Safaie A, Donohue KA, Rowley CD, Thoppil PG and Watts DR (2025) Deep cyclones in the southeast Gulf of Mexico. Front. Mar. Sci. 12:1648949. doi: 10.3389/fmars.2025.1648949
Received: 17 June 2025; Accepted: 29 August 2025;
Published: 29 September 2025.
Edited by:
Laurent Marcel Cherubin, Florida Atlantic University, United StatesReviewed by:
Erick Raul Olvera-Prado, National Autonomous University of Mexico, MexicoGe Xiao, Texas A and M University, United States
Copyright © 2025 Safaie, Donohue, Rowley, Thoppil and Watts. This is an open-access article distributed under the terms of the Creative Commons Attribution License (CC BY). The use, distribution or reproduction in other forums is permitted, provided the original author(s) and the copyright owner(s) are credited and that the original publication in this journal is cited, in accordance with accepted academic practice. No use, distribution or reproduction is permitted which does not comply with these terms.
*Correspondence: D. Randolph Watts, cmFuZHl3YXR0c0B1cmkuZWR1; Kathleen A. Donohue, a2Rvbm9odWVAdXJpLmVkdQ==; Aryan Safaie, YXJ5YW5zYWZhaWVAdXJpLmVkdQ==
†These authors have contributed equally to this work